Article

Comprehensive Evaluation of Quality Traits of Hovenia acerba Germplasm Resources in Fujian Province

1
College of Forestry, Fujian Agriculture and Forestry University, Fuzhou 350002, China
2
Forestry Science and Technology Popularization Center of Zhenghe County, Nanping 353600, China
3
Department of Forest and Conservation Sciences, Faculty of Forestry, University of British Columbia, 2424 Main Mall, Vancouver, BC V6T 1Z4, Canada
*
Authors to whom correspondence should be addressed.
Forests 2023, 14(2), 204; https://doi.org/10.3390/f14020204
Submission received: 17 December 2022 / Revised: 11 January 2023 / Accepted: 19 January 2023 / Published: 20 January 2023
(This article belongs to the Special Issue Advances in Tree Germplasm Innovation and High-Efficiency Propagation)

Abstract

:
Hovenia acerba is a precious medicinal and edible tree. We assessed the genetic variation of H. acerba quality traits and conducted a comprehensive germplasm resource evaluation to provide a theoretical basis for breeding edible, medicinal, and edible/medicine combination varieties. We evaluated 31 H. acerba germplasm resources, including 12 infructescence and 8 fruit quality traits using correlation, principal component, and cluster analyses. The results showed that there were significant differences in all quality traits, with an average coefficient of variation greater than 0.20, an average genetic diversity greater than 1.80, and an average repeatability greater than 0.90. The average genetic variation and repeatability of quality traits in infructescence were higher than fruit. Infructescence K, Ca, Mn, Mg, and reducing sugar contents are important indicators in evaluating infructescence and fruit quality traits, and infructescence K, Mg, and reducing sugar contents are also quality innovation indices of H. acerba germplasms. Tannin, protein, and soluble sugar were the most suitable quality components for screening, followed by reducing sugar, starch, fat, total saponins, and total flavones. According to principal component factor scores and cluster analysis results, specific genotypes were selected as breeding materials for infructescence protein, tannin, flavone, reductive sugar, fruit tannin, fat, flavonoid, saponin, protein, and starch. The correlation analysis with environmental factors showed that the total amount of applied water could influence H. acerba infructescence and fruit quality. In conclusion, the variability of H. acerba germplasm resources was rich, and selection potential is large, which is beneficial to germplasm quality innovation and breeding.

1. Introduction

Hovenia acerba Lindl belongs to the Rhamnaceae family, and it is a precious economic tree in China [1]. The species is distributed south of the Yangtze River Basin and is concentrated in several Chinese provinces including Sichuan, Chongqing, Hubei, Hunan, Jiangxi, and Fujian [2]. H. acerba infructescence can be used for medicinal and human consumption purposes. It is thick, twisted, shaped like chicken feet, and fleshy (Figure 1) [3]. Infructescence nutritional value is far higher than common fruits, because it contains not only fat, protein, and various types of sugar, but also a variety of mineral elements needed by the human body [1,4]. H. acerba fruit medicinal value is vast and is effective for numerous diseases: it inhibits cancer cell growth [5,6]; it has sedative, analgesic and anticonvulsant [3], anti-inflammation, anti-oxidation, anti-aging, and other effects [7]; it contains active components for liver protection [8,9]; it reduces coronary heart disease and improves immunity incidences [10,11]. The chemical components of H. acerba fruit were studied, and a variety of compounds, such as triterpenoid saponins, tannins, flavones, and fatty acids were isolated [7,12]. Therefore, studying H. acerba quality diversity is of great significance for its functional product development and the innovative use of germplasm resources.
Quality traits are an important part of germplasm resources phenotypic traits [13], which can be used to understand the characteristics and genetic differences of germplasm resources [14]. Germplasm resources are the carriers of genetic information, which are directly or indirectly used in breeding, cultivation, and other biological functions [15,16]. Objective evaluation of these resources is the premise of rational utilization. Recently, genetic identification has been conducted using several molecular markers [17,18,19,20]; however, these markers cannot objectively reflect the germplasm resources’ characteristics in terms of production and adaptability [21]. Phenotypic traits can reflect the interaction between genes and environment, and have the advantages of being intuitive, convenient, and low cost [22].
Genetic diversity is the basic component of biological diversity, which is evolved by adapting to the environment [14,23]. Evaluation of quality traits is an important part of exploring the genetic diversity of plant resources [13] as abundant variation represents the genetic basis of plant improvement [24]. Repeatability estimates can be used to evaluate the maximum heritability of germplasm resource traits and the greater the repeatability value, the stronger the genetic control, and obviously the lesser influence of the external environment [25]. Therefore, a full understanding of genetic diversity and its genetic control can effectively formulate breeding strategies, reduce aimless work, and assist in improvement effects. Currently, with the combination of variance analysis and genetic parameter estimation methods, traits with significant differences and strong genetic stability can be identified, and principal component, correlation, and cluster analyses can be effectively used to evaluate the germplasm resources for quality traits [14,19,22,26]. These methods have been widely used in evaluating medicinal materials [27], industrial crops [22], grain [20], oil crops [19], fruits [14], and vegetables [26] for the production of excellent varieties through breeding efforts.
H. acerba studies have been mainly focused on ecological [28] and biological characteristics [6,8,29], pharmacology [4,12] for active ingredient extraction [1], and cultivation [30]. A few H. acerba germplasm resource studies have been conducted to assess its genetic diversity using ISSR and RAPD molecular markers [17,18]; however, evaluation of quality traits has not received much attention. In this study, 31 H. acerba trees from 11 provenances in Fujian Province were used to evaluate 12 infructescence quality and 8 fruit quality traits. Genetic variation and parameter estimation were carried out to reveal the extent of genetics on quality traits. Additionally, correlation, cluster, and principal component analyses were used to comprehensively evaluate H. acerba quality traits and to explore their interaction with environment. The present study is expected to provide the theoretical basis for breeding excellent edible, medicinal, and medicinal and edible varieties of H. acerba.

2. Materials and Methods

2.1. Materials

A total of 31 scattered H. acerba trees from 11 Provenances in Fujian Province were selected for germplasm resource evaluation (Table 1). Environmental factors such as longitude (Long.), latitude (Lat.), altitude (Alt.), annual mean temperature (AMT), annual mean precipitation (AMP), annual mean sunshine hours (AMSH), annual mean rainfall days (AMRD), and frost-free period (FFP) were obtained throughout the study period (Table 2).

2.2. Sample Collection

Mature H. acerba infructescence and fruit was collected in the first ten days of November 2007, 2017, and 2020 (Figure 1). At this time, the infructescence was fleshy and swollen, showing yellowish brown or brown color. A standard fruit-bearing branch was cut from the outside of the crown’s four cardinal directions with high branch shears and collected. The branch was gently packed into a carton and brought back to the laboratory. The sequence infructescence and fruit were separated with scissors and collected by each sampling tree. They were placed in Ziplock® bags and stored in a −20 °C refrigerator for quality index determination.

2.3. Quality Trait Determination

2.3.1. Fatty Acid Content

Fatty acid content of infructescence and fruit was determined by Soxhlet extraction (ZF-06A Fat detector, Saiyasi, China) [31]. The extraction bottles were washed, cleaned with a small amount of ether, dried at 105 °C, taken out, cooled, weighed, and recorded as M1. Two and one gram samples of infructescence and fruit from a ground powder, respectively, were used as Ma and wrapped in filter paper. The sample packages were placed into the extractor after adding 20 mL of anhydrous ether for complete soaking for 30 min. The soaked anhydrous ether was placed into extraction bottles, then another 20 mL anhydrous ether were added into the extractor and heated in a water bath at 75 °C for about 1 h. After oil extraction was completed, the ether was recovered in the condensing tubes. Then, the extraction bottles were placed in a drying box at 105 °C for 1 h, removed, and cooled to room temperature (28 °C). The weigh the extraction bottles was considered as M2. The fatty acid content was calculated by Equation (1):
The   fatty   acid   content   ( % ) = ( M 2 M 1 ) / Ma × 100 .

2.3.2. Protein Content

The determination of protein content of infructescence and fruit was based on drawing a standard curve with bovine serum protein [32]. A 0.5 g sample (W1) and 5 mL of distilled water were placed into a 10 mL centrifuge tube, shaken well, and centrifuged for 10 min at 10,000 r·min−1 (Allegra 64r, Beckman, Pasadena, CA, USA); the supernatant was removed and recorded as V1 mL. V2 supernatant (infructescence 0.2 mL, fruit 1 mL) was added into a 10 mL test tube. Then, 5 mL of Coomas bright blue G-250 solution was added, thoroughly mixed, and placed for 2 min. After that, the absorbance was recorded at 595 nm in Enzyme labeling equipment (Infinite M200 PRO, Tecan, Switzerland). The protein content (μg) was obtained by checking the standard curve (W2). The protein content was calculated by Equation (2):
The   protein   content   ( % ) = ( W 2 × V 1 ) / ( W 1 × 10 6 × V 2 ) .

2.3.3. Determination of Sugars and Content

A 0.1 g sample (W1) of infructescence, fruit, and 4 mL of water were added into a 10 mL centrifuge tube and extracted in a water bath at 80 °C for 30 min. The samples were cooled and centrifuged at 3000 r·min−1 for 10 min (Allegra 64r, Beckman, Brea, CA, USA). After, the supernatant was transferred into a 10 mL test tube, and 3 mL of distilled water were added into the precipitate; this was repeated twice. After centrifugation, the supernatant was collected and filled to 10 mL with distilled water for the determination of reducing sugar and soluble sugar (V1). The residue was used for starch determination.
Soluble sugar content of infructescence and fruit was determined [33] and a standard curve with glucose was developed. One milliliter (V2) of the above infructescence extract was filled with distilled water to ten milliliters as infructescence diluent. A quantity of 0.1 mL of infructescence diluent and fruit extract (V2) were placed in a 10 mL test tube, then 0.9 mL of distilled water was added, placed in an ice bath, and then 3 mL of 0.2% anthrone solution was added. Afterwards, it was shaken and bathed in boiling water for 10 min, then chilled in ice water. The absorption value was determined at 625 nm in Enzyme labeling equipment (Infinite M200 PRO, Tecan, Switzerland). The soluble sugar content (μg) can be found on the standard curve (W2). The soluble sugar content was calculated by Equation (3):
Soluble   sugar   content ( % ) = ( W 2 × V 1 ) / ( W 1 × 10 6 × V 2 ) .
Reducing sugar of infructescence and fruit was determined and a standard curve with glucose was developed [33]. A quantity of 0.2 mL (V3) of infructescence extract was added to 0.8 mL of distilled water, and 0.4 mL (V3) of fruit extract and 0.6 mL of distilled water were added into a 10 mL test tube and shaken. One milliliter of DNS solution was added, bathed in boiling water for 5 min, cooled in ice water, and then filled with distilled water to 10 mL. The absorption value was measured at 540 nm in Enzyme labeling equipment (Infinite M200 PRO, Tecan, Switzerland). The soluble sugar content (μg) can be found on the standard curve (W3). The reducing sugar content was calculated by Equation (4).
Reducing   sugar   content   ( % ) = ( W 3 × V 1 × 200 ) / ( W 1 × 10 6 × V 3 ) .  
The starch content of the infructescence and fruit was determined [34]. The precipitated residue was dried at 80 °C. After cooling, 2.5 mL of distilled water were added into the 5 mL centrifuge tube and heated in a boiling water bath for gelatinization for 10 min. After cooling, 1 mL of cold 9.2 mol·L−1 perchloric acid was added and placed on an oscillator for 10 min. After centrifugation (3000 r·min−1) for 10 min (Allegra 64r, Beckman, USA), the supernatant was recovered. Two milliliters of cold 4.6 mol·L−1 perchloric acid were added to the residue again, oscillated for 10 min, centrifuged at the same speed for 10 min, and then the supernatant was recovered. Then, the residue was washed with 2 mL distilled water, centrifuged at the same speed for 10 min, and the supernatant was recovered. The supernatant of the three parts described above was combined with distilled water to 10 mL (V4), which was the sample solution for starch content determination. Using the reducing sugar method mentioned above, 0.1 mL (V5) of sample solution was determined, and hydrolyzed sugar content was obtained by the curve (W4). The starch content was calculated by Equation (5):
Starch   content   ( % ) = ( W 4 × V 4 × 0.9 ) / ( W 1 × 10 6 × V 5 ) .

2.3.4. Tannin Content

A standard curve with tannins was developed [35]. A 0.1 g (W1) sample of infructescence or fruit was weighed and placed in a 10 mL centrifuge tube. Five milliliters of 1:5 ethanol solution (the mixture of 1 volume of ethanol solution and 5 volumes of distilled water) were added, shaken on the oscillator for 60 min, and centrifuged at 3000 r·min−1 for 10 min (Allegra 64r, Beckman, USA) to obtain the supernatant (V1). Extract (V2) (0.5 mL infructescence, 0.1 mL fruit) was placed in a 25 mL volumetric bottle containing 15 mL of water; 1 mL of F-D reagent solution was added and then shaken. Then, 1 mL of sodium carbonate saturated solution was added, diluted to the scale with distilled water, shaken, and left for 30 min. Absorption value was measured at 748 nm in Enzyme labeling equipment (Infinite M200 PRO, Tecan, Switzerland), and the tannin content (mg) was obtained on the standard curve (W2). The tannin content was calculated by Equation (6):
Tannin   content   ( % ) = ( W 2 × V 1 ) / ( W 1 × 10 3 × V 2 ) .  

2.3.5. Total Flavone Content

A standard curve with rutin was developed [36]. A 0.1 g (W1) sample of infructescence or fruit was weighed and placed into a 10 mL centrifuge tube, and 5 mL of 75% ethanol were added. Ultrasonic extraction (OuHor, H150, China) was carried out in 70 °C water for 15 min. After centrifugation (3000 r·min−1) for 10 min (Allegra 64r, Beckman, USA), the supernatant was carefully removed into a 10 mL test tube. The residue was extracted by ultrasound for one time, centrifuged, combined with the supernatant, and volume fixed with 75% ethanol to 10 mL (V1). A quantity of 0.2 mL of sample solution (V2) was added to 0.8 mL of 1% aluminum chloride ethanol solution in a test tube, then 75% ethanol volume was added to 10 mL, shaken, and left at room temperature for 30 min. Absorption value was measured at 413 nm in Enzyme labeling equipment (Infinite M200 PRO, Tecan, Switzerland). The total flavone content (mg) was obtained in the standard curve (W2). The total flavonoid content was calculated by Equation (7):
Total   flavonoid   content   ( % ) = ( W 2 × V 1 ) / ( W 1 × 10 3 × V 2 ) .

2.3.6. Total Saponin Content

The standard curve was made with ginsenoside [37]. A 0.2 g (W1) sample of infructescence or fruit was placed into a 10 mL centrifuge tube and 5 mL of water-saturated n-butanol were added, then placed in a bath of 50 °C water with ultrasonic wave for 30 min (OuHor, H150, China), and centrifuged at 3000 r·min−1 for 10 min (Allegra 64r, Beckman, USA). The supernatant was removed into a 10 mL test tube. The residue was extracted again, combined with the supernatant, and water-saturated n-butanol to 10 mL (V1) was added. A quantity of 0.1 mL (V2) of the above solution was added to 0.2 mL of a newly prepared 5% van aldehyde-glacial acetic acid solution and 0.8 mL of perchloric acid. After 15 min of color development in a water bath at 60 °C, it was cooled in an ice bath, and then 5 mL of ethyl acetate were added. The absorption value was measured at 540 nm in Enzyme labeling equipment (Infinite M200 PRO, Tecan, Switzerland). Total saponin content (mg) was obtained in standard curve (W2). The total saponin content was calculated by Equation (8):
Total   saponin   content   ( % ) = ( W 2 × V 1 ) / ( W 1 × 10 3 × V 2 ) .

2.3.7. Mineral Element Content

A 0.2 g sample of infructescence was weighed and Microwave digestion equipment (Ethos, Milestone Company, Italy) was used for microwave digestion. After digestion, the acid was driven at 160 °C for 3~4 h, and then the digestion solution was fixed to 50 mL. The above solution was filtered by filter paper to make the test solution. The contents of K, Ca, Mg, and Mn (μg·g−1) were determined by the ICP-OES inductively coupled Plasma Emission Spectrometer (Optima 8000, PerkinElmer, Waltham, MA, USA) [38].

2.4. Data Processing and Analysis

Quantitative traits were calculated using SPSS 22.0 software, including maximum, minimum, mean values, standard deviation (SD), genetic diversity index (H’), coefficient of variation (CV), and repeatability (R). According to the mean ( x ¯ ) and standard deviation (S), the material was divided into ten levels starting from level one which was Xi < ( x ¯ 2s), to level ten which was Xi ≥ ( x ¯ + 2s). Every 0.5 s constituted one level, the relative frequency of each trait was used to calculate the diversity index, and i was the level number. The Shannon-Weaver diversity index (H’) was used to measure the size of genetic diversity and was calculated by Equation (9):
H =   p i L n p i ,
where H’ stands for the genetic diversity index, Pi for the percentage of the total number of materials in the i level of a trait, and Ln for the natural logarithm [39].
The coefficient of variation was calculated by Equation (10). When statistical analysis of trait variation was carried out, a coefficient of variation of less than 0.1 meant a small degree of variation, 0.1~0.2 a medium degree of variation, and greater than 0.2 a high degree of variation [40]:
Coefficient   of   variation   ( C V ) = s / x ¯ .  
SPSS 22.0 software was also used for variance analysis for each trait and to obtain an F value. The repeatability was calculated by Equation (11). Repeatability greater than 50% was considered as high heritability, 50~20% medium heritability, and less than 20% low heritability [41,42]:
Repeatability   ( R ) = 1 1 / F .  
The same statistical software was also used for principal component and correlation analyses of the 20 quality traits, and the eigenvalue of each principal component was used as the coefficient to construct the functional formula for comprehensive evaluation [43]. Chi-squared distance was used as the distance and the Ward deviation square sum method was used for cluster analysis [44]. Graphs were made with Graphpad prism 9.0 software.

3. Results

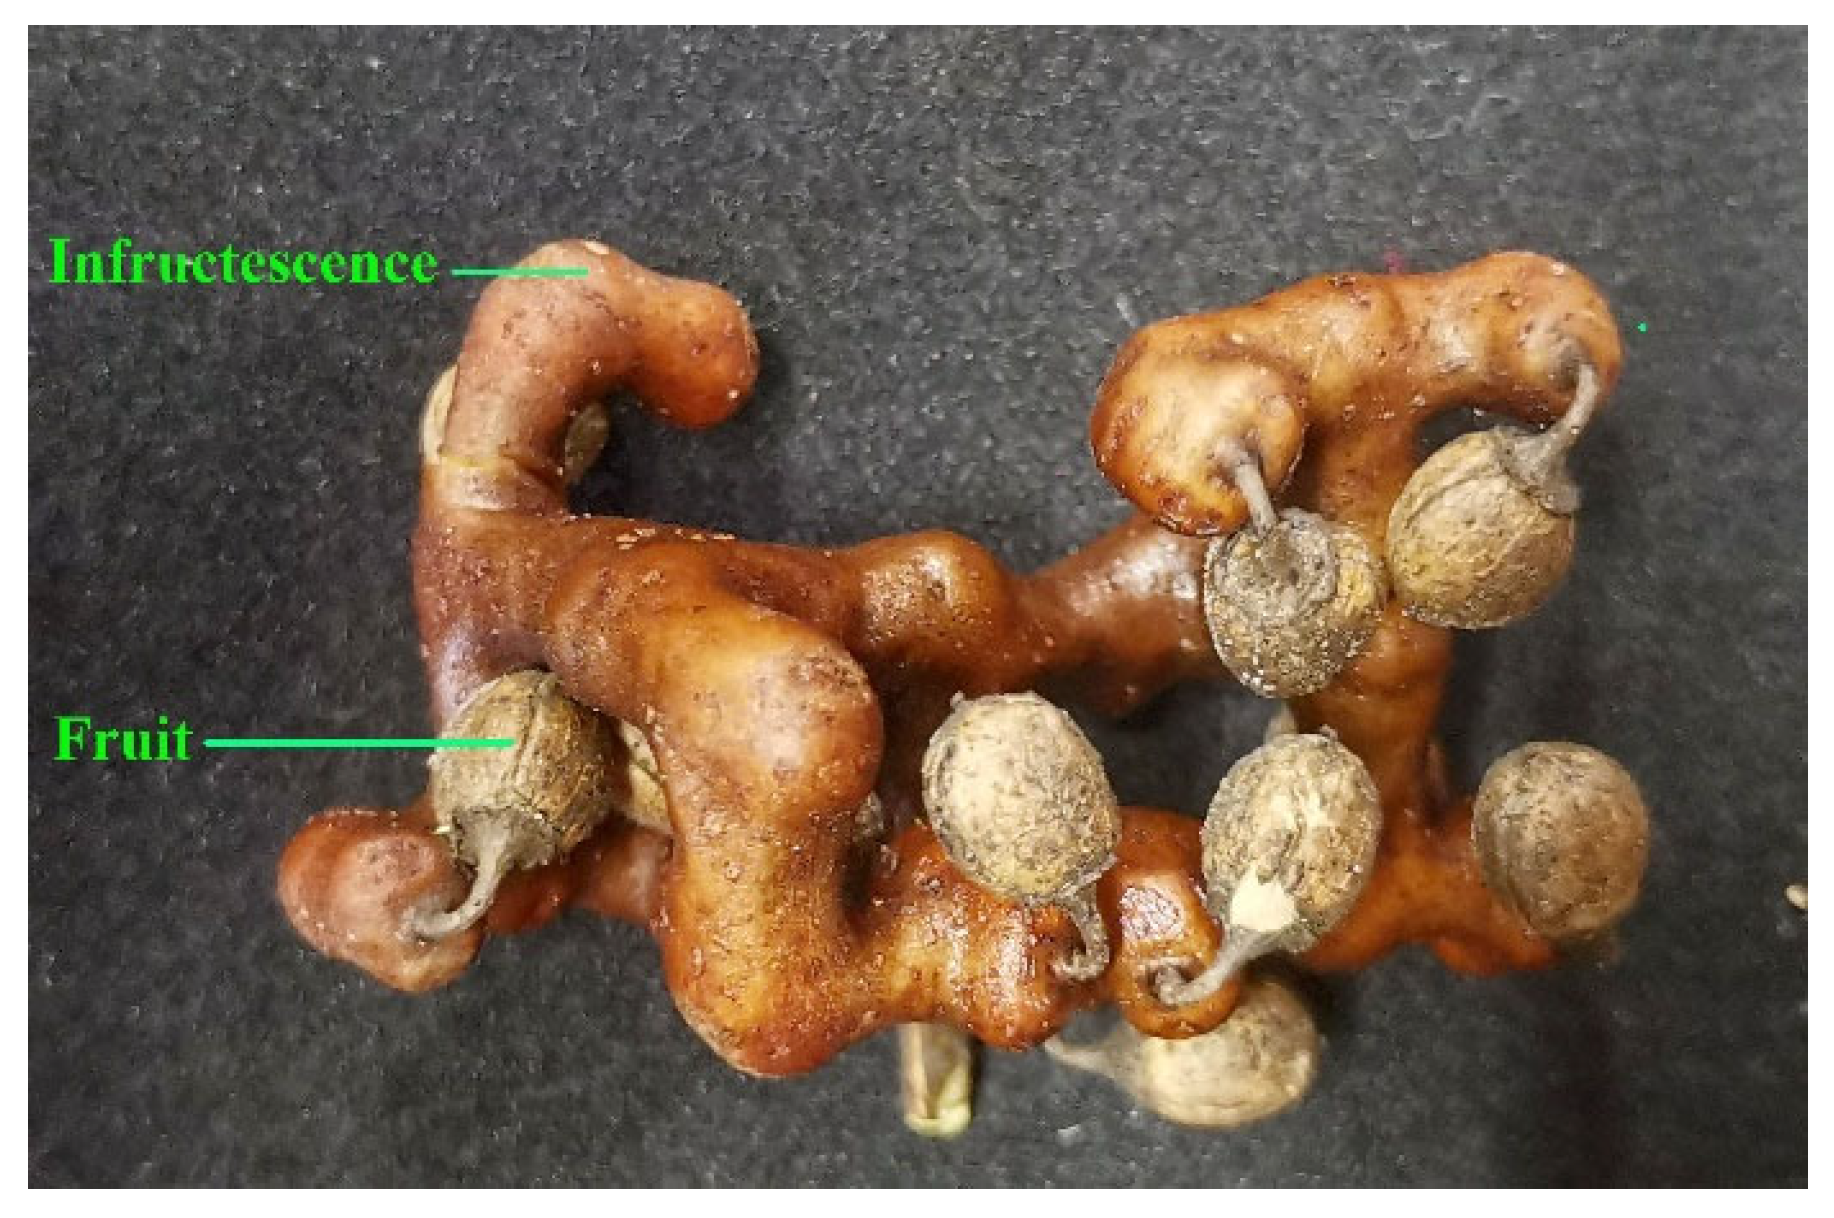
3.1. Analysis of Infructescence Quality Trait Genetic Variation

Different germplasm had a significant effect on infructescence quality traits (Table 3). CV ranged from 0.12 to 0.73, with an average of 0.35. The traits with coefficient of variation greater than 0.2 were fatty acids, protein, tannin, total flavonoid, reducing sugar, starch, Mn, K, Ca, and Mg contents. R fluctuated from 0.956 to 0.997 with an average value of 0.988, and all traits were greater than 0.5. H’ of infructescence quality traits fluctuated from 1.40 to 2.02 with an average of 1.88. The seven infructescence quality traits were higher than 1.90, including fat, tannin, total saponin, soluble sugar, reducing sugar, K, and Mg contents.

3.2. Analysis of Fruit Quality Trait Genetic Variation

Different germplasm had a significant effect on fruit quality traits (Table 4) and a CV from 0.09 to 0.38, with an average of 0.23. There were four traits with coefficient of variation greater than 0.2, which were fat, tannin, reducing sugar, and starch contents. The R fluctuated from 0.610 to 0.992 with an average value of 0.930, and all characters were greater than 0.5. The H’ of fruit sequence traits fluctuated from 1.56 to 2.00 with an average of 1.89; five traits were higher than 1.90, i.e., fat, protein, total flavonoid, total saponin, and soluble sugar contents

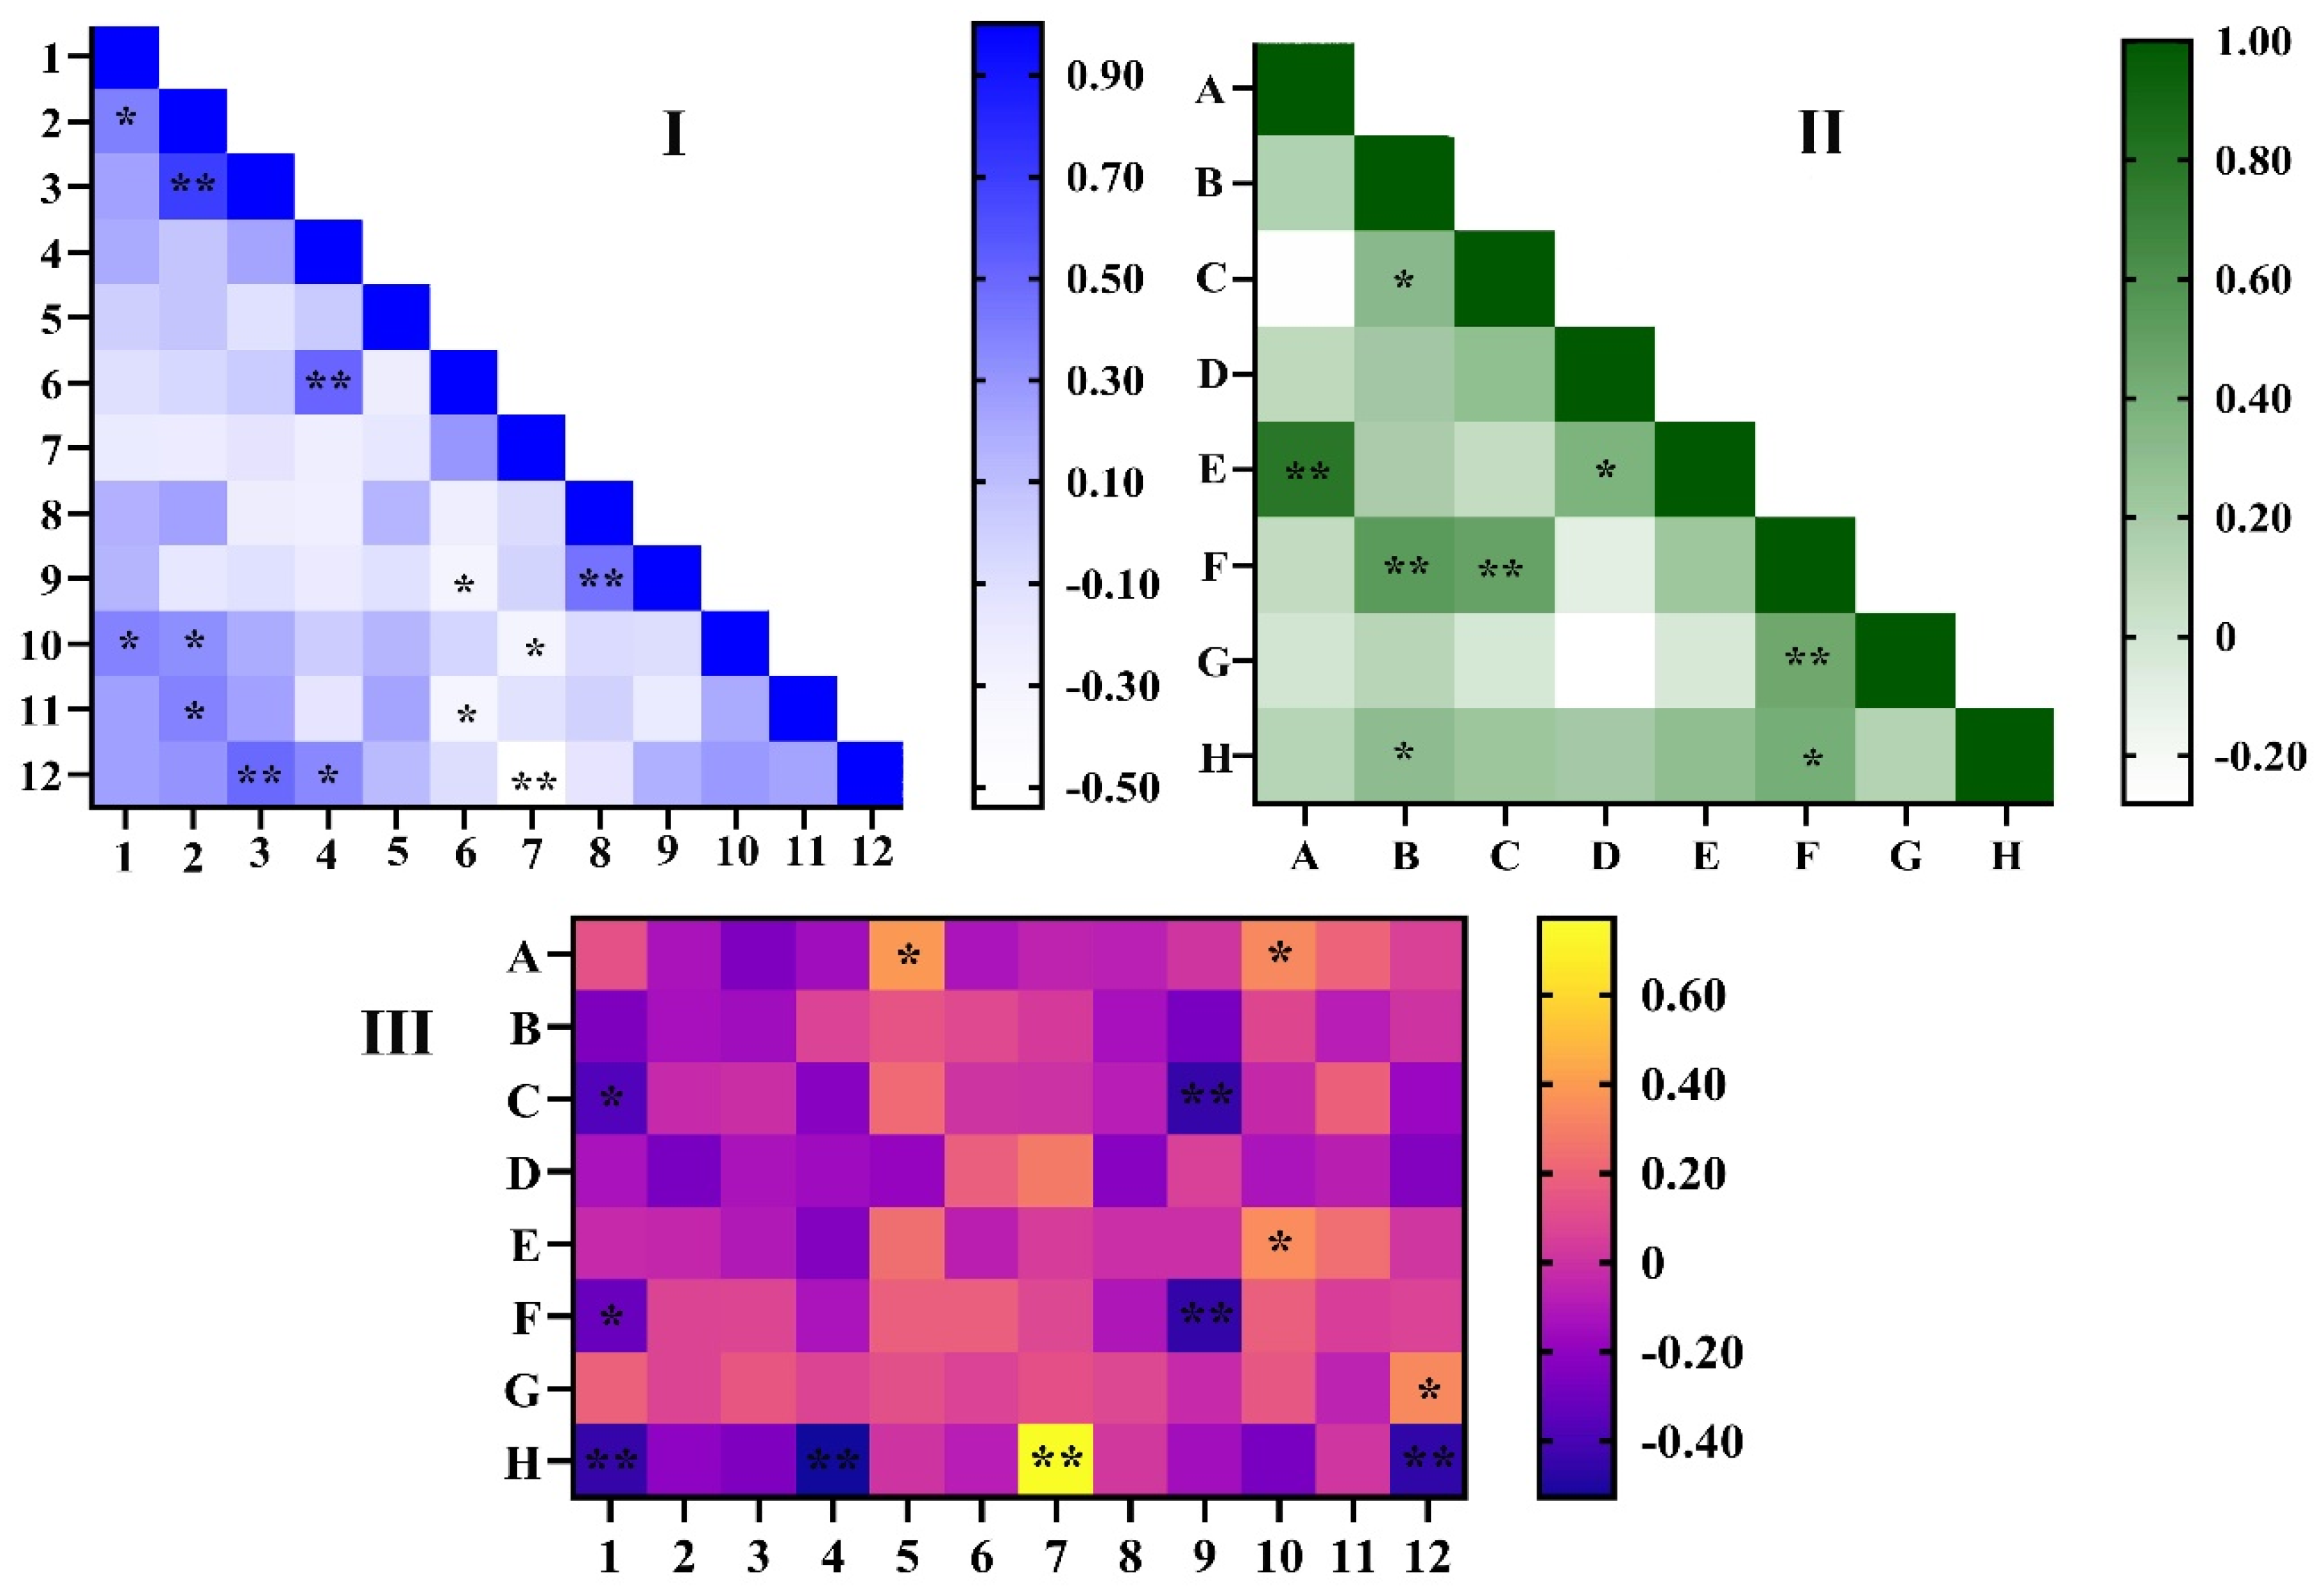
3.3. Correlation Analysis among Quality Traits

For infructescence quality traits of H. acerba germplasms, there were highly significant relations (Figure 2Ⅰ and Table A1). There were correlations which were positively significant with a coefficient greater than 0.4; these were fat content with protein content, tannin content with protein and Mg content, total flavonoid with soluble sugar, and starch content with Mn content. Reducing sugar and Mg content had a negatively significant relation, with a coefficient greater than 0.4.
For fruit quality traits, there were highly significant relations (Figure 2Ⅱ and Table A2). There were correlations which were positively significant with a coefficient greater than 0.4; these were fat content with total saponin, soluble sugar content with protein, tannin, reducing sugar, and starch content.
For infructescence and fruit quality traits, there were highly significant relations (Figure 2Ⅲ and Table A3). There were correlations which were positively significant with a coefficient greater than 0.4; these were fruit fat content with infructescence total saponin content, and fruit starch content with infructescence reducing sugar content. The correlations that were negatively significant with a coefficient greater than 0.4 were fruit tannin content with infructescence fat and Mn content, fruit soluble sugar content with infructescence Mn content, fruit starch content with infructescence fat, total flavonoid, and Mg content.

3.4. Principal Component Analysis and Comprehensive Evaluation

According to the analysis, the first 6 principal components were selected for comprehensive evaluation as their eigenvalues were greater than or equal to 1, with cumulative contribution reaching 70.51% (Table 5). The eigenvalue of the first principal component (Factor 1) was 2.681, and its contribution rate was 18.77%. The eigenvector of loading ≥ 0.5 had three traits, namely fruit protein, fruit tannin, and fruit soluble sugar contents, with fruit tannin content being the largest. Therefore, Factor 1 was called fruit tannin, protein, and soluble sugar factor. The eigenvalue of the second principal component (Factor 2) was 2.663 and its contribution rate was 14.50%. When the eigenvector of loading was ≥0.5, i.e., infructescence reducing sugar and fruit starch contents with infructescence reducing sugar content being the largest, Factor 2 was called infructescence reducing sugar and fruit starch factor. The characteristic value of the third principal component (Factor 3) was 2.437, and its contribution rate was 12.54%. The characteristic vector of loading ≥ 0.5 had three traits, namely fruit fat, fruit total saponin, and infructescence K contents, with fruit fat content being the largest. Therefore, Factor 3 was called fruit fat and total saponin factor. The characteristic value of the fourth principal component (Factor 4) was 2.425, and its contribution rate was 9.34%. The characteristic vector of loading ≥0.5 had three traits, namely infructescence protein, tannin, and Ca contents, with the infructescence protein content being the largest. Therefore, Factor 4 was called infructescence protein and tannin factor. The characteristic value of the fifth principal component (Factor 5) was 2.121, and its contribution rate was 7.90%. The characteristic vector 0.5 of the load had infructescence total flavonoid and soluble sugar content, with infructescence total flavonoid content being the largest. Therefore, Factor 5 was called infructescence flavonoid and soluble sugar factor. The characteristic value of the sixth principal component (Factor 6) was 1.775, and its contribution rate was 7.45%. The characteristic vector of loading ≥0.5 had the fruit total flavonoid content. Therefore, Factor 6 was called fruit flavonoid factor. In conclusion, there were six key quality traits, which were fruit tannin, infructescence reducing sugar, fruit fat, infructescence protein, infructescence total flavone, and fruit total flavone contents.
According to the principal component analysis, the variance contribution rate of each principal component was different. The H. acerba germplasm comprehensive score (F value) is shown (Table 6). The higher the F value, the better the comprehensive quality traits. The results were that 18 H. acerba germplasms had average comprehensive score values greater than 0, including S2, S3, Y1, J7, D1, Q1, J8, P1, P2, J6, L3, S1, Z5, C1, D3, Z2, J1, and D2, indicating that these germplasms had quality utilization value.

3.5. Cluster Analysis of H. acerba Germplasm

In order to study the genetic relationship of the 31 H. acerba germplasms, they were divided into 6 groups according to the variable cluster average method, where the distance between the chi-square sum was 2.2 (Figure 3). Group Ⅰ had four germplasms, including J3, J2, F1, and L1. Group Ⅱ had six, including S2, S3, S1, J7, C1, L3. Group Ⅲ had Q1 and Y2. Group Ⅳ had seven, including J5, J8, J4, Z1, X2, Z5, and L2. Group Ⅴ had J6, J1, P2, P1, and X1. Group Ⅵ had seven, including Z4, Z3, D1, D3, D2, Z2, and Y1.
The quality traits (average value) of the six H. acerba germplasm groups were compared and analyzed (Table 7). The results showed that each Group (I to VI) had unique attributes, and each could be considered as breeding material for their respective unique attributes. In Group Ⅰ, infructescence fat, starch, Mn, and Mg content were the highest compared to the other 5 groups, indicating that the Group Ⅰ can be used as be used as breeding material for fat and starch. In Group Ⅱ, infructescence protein, tannin, total saponin, and Ca content were the highest, indicating that Group Ⅱ can be used as breeding material for infructescence protein, tannin, total saponin, and Ca. In Group Ⅲ, infructescence soluble sugar content, fruit tannin, soluble sugar, and reducing sugar content were the highest, indicating that Group Ⅲ can be used as breeding material for infructescence sugar and fruit tannins. In Group Ⅳ, infructescence total flavonoid and fruit fat content were the highest, indicating that Group Ⅳ could be used as breeding material for infructescence flavonoid and fruit fat. In Group Ⅴ, fruit protein, total flavonoid, total saponin, and starch content were the highest, indicating that the Group Ⅴ could be used as breeding material for fruit protein, flavonoid, saponin and starch. In Group Ⅵ, infructescence reducing sugar content was the highest, suggesting that Group Ⅵ could be used as breeding material for infructescence reducing sugar.

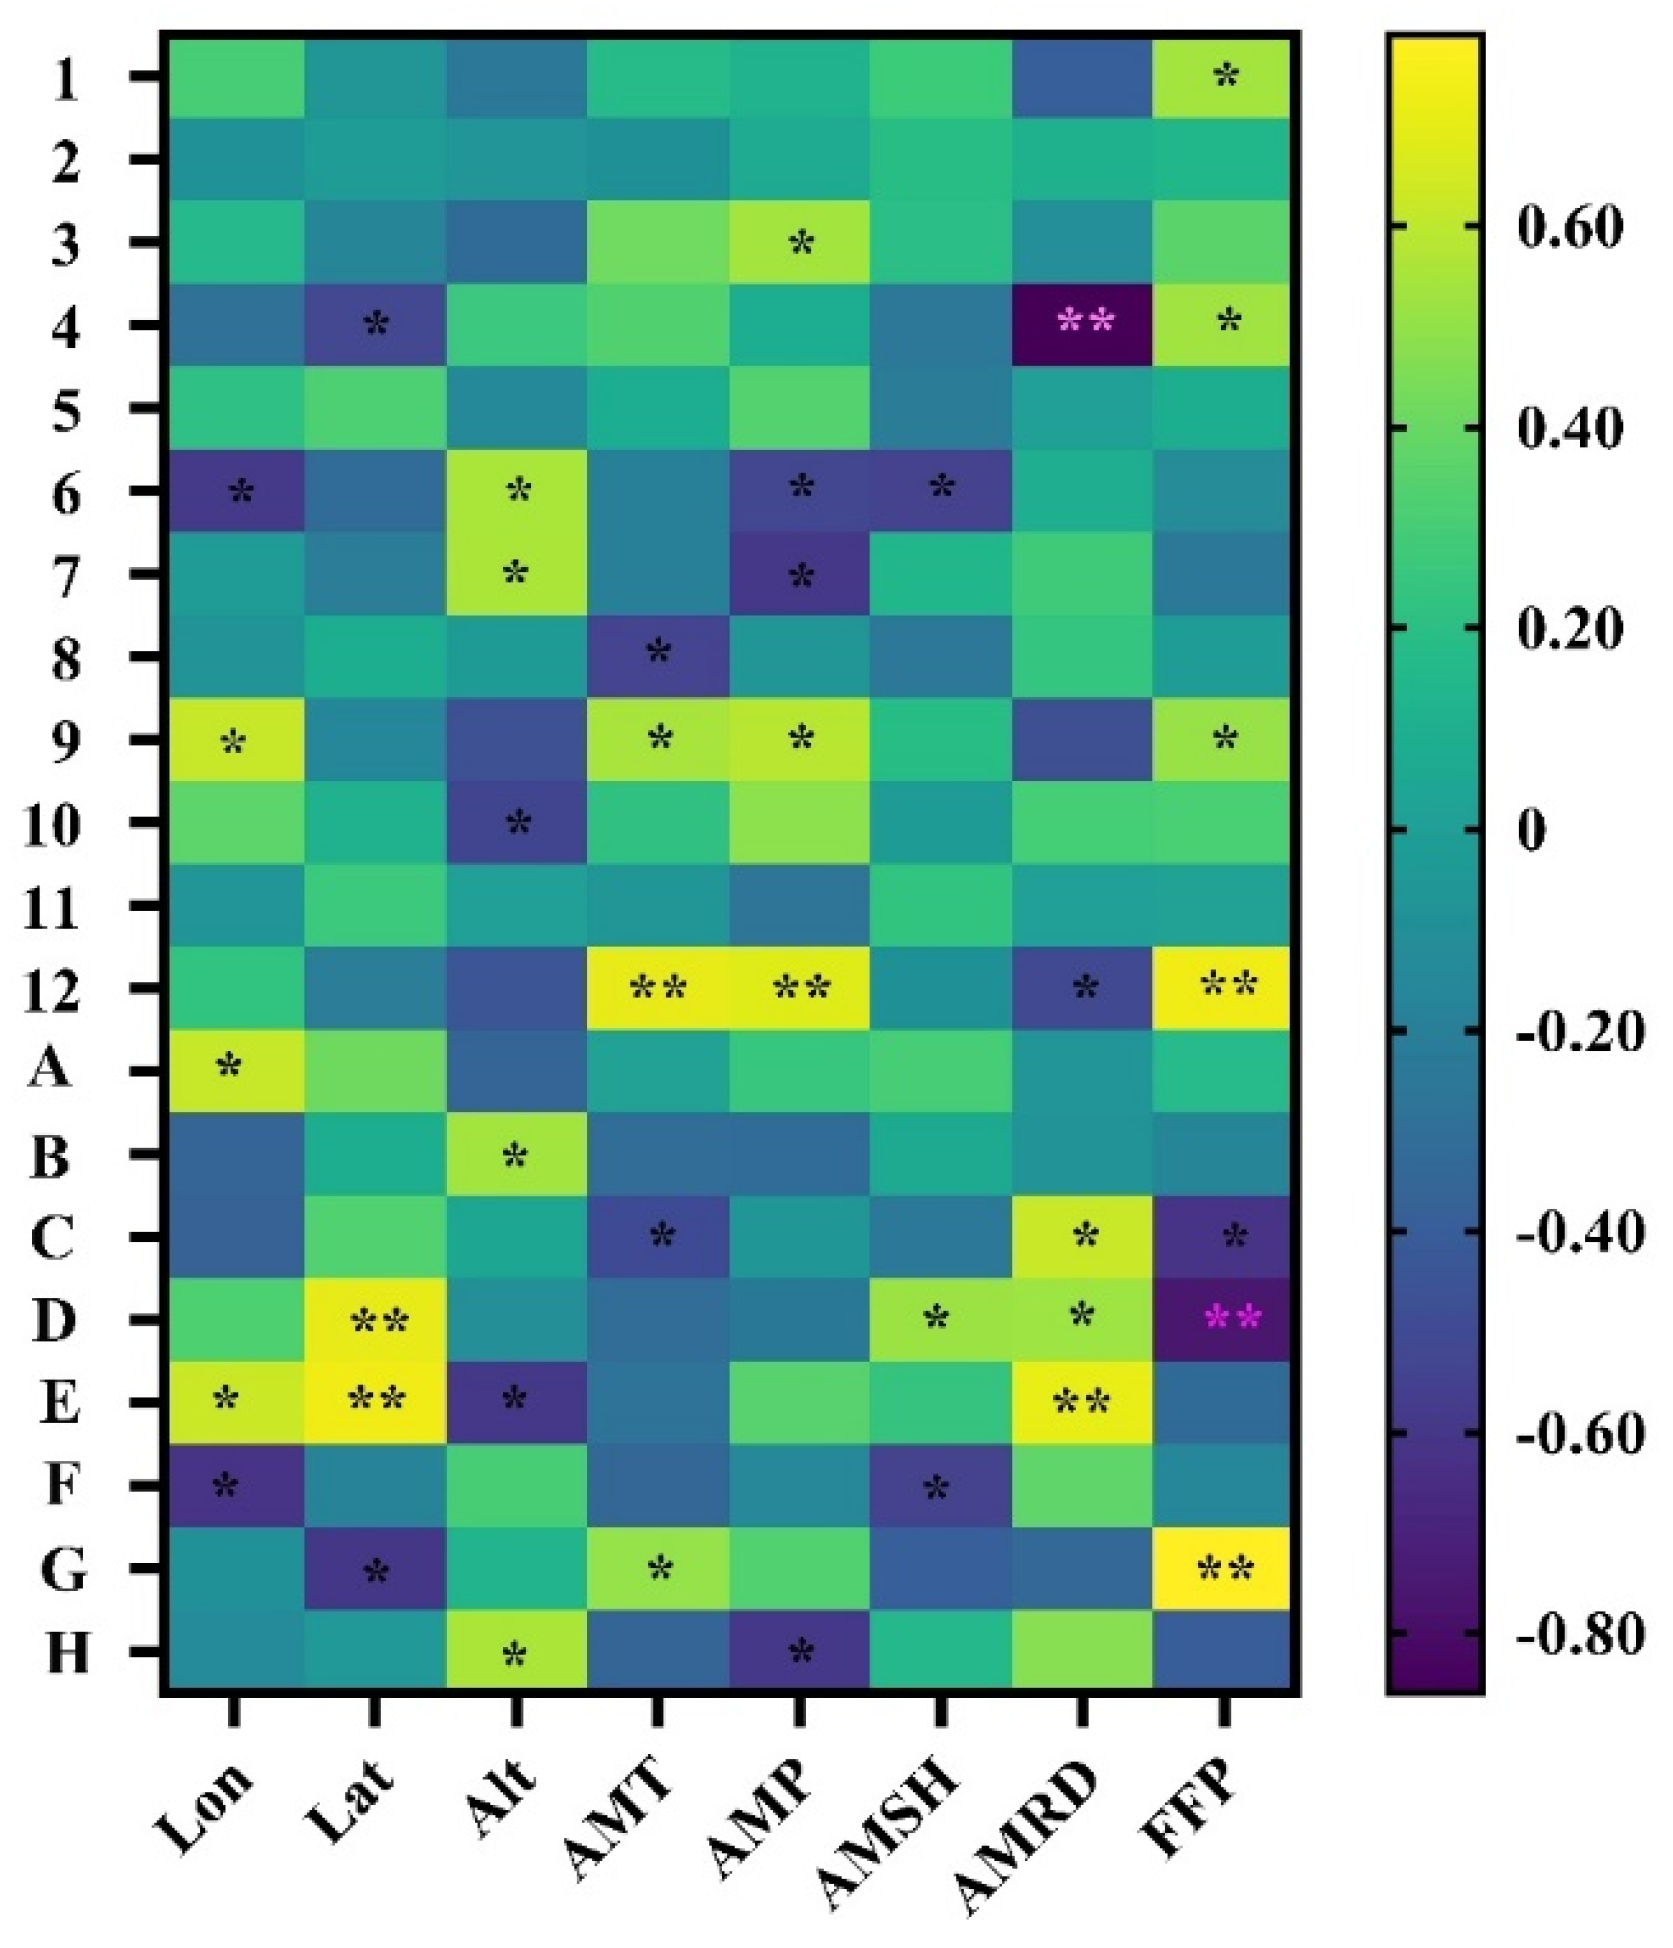
3.6. Environmental Factors Affecting Quality Traits

The correlation analysis analyzed quality traits and environmental factors (Figure 4 and Table A4). There were correlations which were negatively significant with a coefficient greater than 0.6; these were infructescence total flavone content with AMRD, infructescence soluble sugar content with Lon, infructescence reducing sugar content with AMP, fruit tannin and total flavonoid content with FFP, fruit total saponin content with Alt, fruit soluble sugar content with Lon, fruit reducing sugar content with Lat, and fruit starch content with AMP. There were correlations which were positively significant with a coefficient greater than 0.6; these were infructescence Mn content with Lon and AMP, infructescence Mg content with AMT, AMP, and FFP, fruit fat content with Lon, fruit tannin content with AMRD, fruit total flavonoid content with Lat, fruit total saponin content with Lon, Lat, and AMRD, and fruit reducing sugar content with FFP.

4. Discussion

Germplasm resources are an important basis for plant germplasm innovation and new variety breeding [14,16]. Analysis of genetic background is the key to the breeding bottleneck breakthrough [13,14,23]. The coefficient of variation refers to the degree of dispersion of a trait variable [45]. In this study, the average coefficient of variation on infructescence quality traits was higher than fruit, and all traits were higher than 0.20. These indicated that infructescence variation is richer than fruit quality traits, suggesting that it provides rich and excellent parent material for H. acerba genetic improvement, and that infructescence quality selection is more possible to achieve [40]. Plant genetic diversity analysis is the main mean of classification, evaluation, and use of plant germplasm resources [14,23]. Comparing the genetic diversity index of 20 H. acerba quality traits indicated that the variation range of infructescence quality traits went from 1.40 to 2.02, and from 1.56 to 2.00 for fruit, suggesting that the germplasm resources have rich phenotypic genetic diversity on infructescence and fruit quality traits. With a coefficient of variation greater than 0.20 and genetic diversity greater than 1.90, the infructescence quality traits were fat, tannin, reducing sugar, K, and Mg contents while the fruit quality trait was fat content. These indicated that infructescence fat, tannin, reducing sugar, K, Mg contents, and fruit fat content had great variation, rich genetic diversity, and a high potential for improvement. These six indicators can effectively widen the genetic background of the breeding parents and create conditions for H. acerba quality innovation and breeding.
The expression of traits is the result of interaction between heritability and environment [46]. Repeatability of traits is affected by environmental effects [42]. As the upper limit estimate of generalized heritability, the higher the repeatability, the higher the heritability and the easier the selection [25,41]. The results of this study showed that the repeatability of 12 infructescence quality and 8 fruit quality traits of H. acerba were all higher than 0.90, which is the same high repeatability of Populus simonii × P. nigra [47], indicating that H. acerba quality traits are mainly controlled by heredity. The infructescence quality traits were higher than the fruit quality traits, suggesting that the fruit quality traits may be influenced by pollen from species adjacent to H. acerba germplasm tree [48] and indicating that the selection of infructescence quality traits is more convenient. Infructescence protein, total saponin, and Ca contents were not correlated with environmental factors, indicating that these three indices are mainly controlled by genetic factors and are less affected by environment, and could be used as indices for germplasm resource selection.
There are complex correlations among quality traits, and the information overlapped with each other [49]. Therefore, through correlation analysis of quality traits, key indices of quality control were determined [50]. The six indices of fruit tannin, fat, total flavonoid contents, infructescence reducing sugar, protein, and total flavonoid contents were the main factors responsible for the quality differences in thirty-one H. acerba germplasms. Sugars not only provide the energy for plant growth and development as a respiratory substrate, but also serve as metabolic intermediates to synthesize other substances through metabolic pathways [51]. In the H. acerba infructescence, the soluble sugar content was the highest among the components, up to 61%, and soluble sugar content was highly significant and positively correlated with total flavonoid content. These indicated that the metabolism of infructescence sugar was mainly the accumulation of soluble sugar, and was conducive to flavonoid synthesis, which was similar to that reported for Ginkgo biloba [52]. In H. acerba fruit, soluble sugar content was highly significant and positively correlated with fruit reducing sugar, protein, tannin, and starch content, showing that fruit metabolism was mainly based on reducing sugars [53], which controlled the metabolism of protein, tannin, and starch [54]. K element acts as the activator of many enzymes, regulating the metabolism of protein, fat, and secondary substances [55,56]. Infructescence K content significantly and positively correlated with fat content and protein content and infructescence protein content was significant and positively correlated with fat and tannin content, indicating that increasing K content could facilitate the metabolism of fat, protein, and tannin in the infructescence. Fruit fat content was the highest among the components, with the average value of 10.1%, and fruit saponin content was the fourth, with the average value of 4.5%. It may be that infructescence K increased the transport of reducing sugars to the fruit [57], and some of sugars decomposed into acetyl-CoA, some of which entered the fatty acid synthesis pathway to synthesize fat, and some of which entered the mevalonate pathway to synthesize saponins [58]. Therefore, infructescence K and reducing sugar content were the keys to regulating infructescence and fruit quality. Reducing infructescence K content can improve the infructescence edibility property, while increasing it can improve the medicinal property of the infructescence and fruit. Calcium can improve fruit hardness, increase the content of protein and sugar, and improve the nutritional quality of the fruit [59]. In this study, a positive correlation between Ca and protein contents showed that infructescence Ca content is the key to regulating infructescence protein content. Mn element is the activator of some enzymes in carboxylic acid metabolism [60]. Infructescence Mn content had significantly positively correlated with infructescence starch content and negatively with fruit tannin and soluble sugar content. It may be that infructescence Mn was beneficial to infructescence starch anabolism [61], reduced the transport of soluble sugars to fruit, and inhibited fruit tannin synthesis [62]. These results indicated that infructescence Mn was the key factor regulating infructescence starch and fruit tannin. High Mg content can improve the activity of polyphenol oxidase [63]. Infructescence Mg content was very significantly negatively correlated with infructescence reductive sugar content and fruit starch content and positively with infructescence tannin content, which was similar to that reported for Hibiscus Sabdariffa [64]. These results indicated that infructescence Mg was conducive to tannin synthesis, reduced the transport of reducing sugar to fruit, and inhibited the synthesis of fruit starch. In conclusion, infructescence K, Ca, Mn, Mg, and reducing sugar content are the core indices controlling infructescence and fruit quality traits.
In a stable environment, natural selection pressure can be reduced, and the genotype can be preserved to the maximum extent [65]. In unstable environments affected by environmental stress, plants adapt by changing their genetic base [66]. There were key indices controlling infructescence and fruit quality traits; these were infructescence K, Mn, Ca and Mg, and reducing sugar content. Annual mean precipitation was significant and positively correlated with infructescence reduced sugar, K, Mn, and Mg content, which was similar to the results of sugarcane [67]. There was no significant correlation between infructescence Ca content and climate factors, which was different from previous studies [68]. These indicated that regulating the total amount of applied water (irrigation or drainage) could influence infructescence and fruit quality traits, which was conducive to the variability and selection of H. acerba germplasm resources.
Principal component analysis can transform multiple plant indicators into a few principal components on the basis of retaining the original information, thus achieving the purpose of dimensionality reduction, elimination of redundant information, and simplifying the evaluation and screening procedures of germplasm resources [14,19,22,26]. In this study, the sum of the six components explained 70%, which may be caused by the low correlation between some infructescence and fruit quality traits, but each principal component factor met the conditions of eigenvalue value >1 and contribution rate of each factor >5% [43,69]. The load values of the principal component factor could objectively reflect the selection potential of germplasms under different breeding targets [43]. The load values of the six main components of the thirty-one H. acerba germplasm ranked from high to low indicated that the most valuable choice of nutrient components of H. acerba germplasm were tannin, protein, and soluble sugar, followed by reducing sugar and starch, fat, and total saponins. Flavone was the least valuable, which may be related to the low latitude and humid environment in Fujian Province, and can be verified by the low content of total flavonoid in the H. acerba fruit in Fujian province [70].
Through clustering analysis, the traits of germplasm resources were comprehensively classified according to their affinity and similarity in order to achieve the division and classification of different germplasms [44]. The unique characteristics of all groups make them useful for different breeding purposes, corresponding to their respective unique attributes. An analysis of the groups showed that 31 H. acerba germplasms did not cluster together according to their geographical distribution. The clustering results were similar to other economic species such as Lagenaria siceraria [71] and Ipomoea batatas [26,72]. This may be due to H. acerba germplasm’s integration with birds, animals, and humans [17,18,72], and, on the other hand, it may be because the H. acerba traits are regulated by internal heritability and the external environment [73]. Therefore, it is necessary to consider not only the geographical source but also the group affiliation when carrying out H. acerba breeding.

5. Conclusions

In this study, 20 quality traits of 31 H. acerba germplasms were evaluated. There were significant differences in genetic variation, genetic diversity, and repeatability among different H. acerba germplasm resources and traits. Infructescence quality traits had higher genetic variation, repeatability, and control than fruit quality traits. Infructescence fat, tannin, reduced sugar, K and Mg contents, and fruit fat content were quality innovation indices of H. acerba germplasms. Infructescence protein, total saponin, and Ca content were the selection indices of H. acerba germplasms. Infructescence K, Ca, Mn, Mg, and reducing sugar contents were the key indices controlling infructescence and fruit quality traits of H. acerba. The most suitable quality components of H. acerba for screening were tannin, protein, and soluble sugar, followed by reducing sugar and starch, and fat and total saponins; flavone was the least suitable. According to principal component factor scores and cluster analysis results, S2, S3, S1, J7, Z5, D1, D2, Z2, Y1, Q1, J8, J6, J1, P2, and P1 were selected as breeding materials for infructescence protein, tannin, flavone, reductive sugar, fruit tannin, fat, flavonoid, saponin, protein, and starch, respectively. The correlation analysis with environmental factors showed that the total amount of applied water could influence H. acerba infructescence and fruit quality, which was beneficial to the differentiation and selection.

Author Contributions

Conceptualization, Y.A.E.-K., J.F. and H.C.; Data curation, W.W. and Z.Y.; Data analysis, Z.Y. and J.S.; Investigation, Z.Y., C.L. and X.Z.; Methodology, C.L., W.W. and J.S.; Project administration, J.F.; Resources, Z.Y. and X.Z.; Supervision, J.F. and H.C.; Writing—original draft, Z.Y. and J.F.; Writing—review and editing, Y.A.E.-K. All authors have read and agreed to the published version of the manuscript.

Funding

This research was funded by Forestry Peak Discipline Construction Project of Fujian Agriculture and Forestry University (72202200205) and Fujian Forestry Science and Technology Project (K1520033A).

Data Availability Statement

The datasets used and analyzed during the current study could be available from the corresponding author on reasonable request.

Conflicts of Interest

The authors declare no conflict of interest. The funders had no role in the design of the study; in the collection, analyses, or interpretation of the data; in the writing of the manuscript; or in the decision to publish the results.

Appendix A

Table A1. Correlation analysis between infructescence quality traits of H. acerba germplasms.
TraitsFatProteinTanninTotal FlavonoidTotal SaponinSoluble SugarReducing SugarStarchMnKCaMg
Fat1.000
Protein0.406 *1.000
Tannin0.2390.689 **1.000
Total flavonoid0.2010.0680.2331.000
Total saponin0.0000.061−0.1150.0361.000
Soluble sugar−0.105−0.0540.0330.507 **−0.2201.000
Reducing sugar−0.206−0.217−0.139−0.237−0.1620.2921.000
Starch0.1570.238−0.229−0.2490.154−0.237−0.0731.000
Mn0.147−0.163−0.117−0.193−0.120−0.305 *−0.0250.445 **1.000
K0.378 *0.327 *0.1880.0140.149−0.033−0.312 *−0.080−0.0941.000
Ca0.2470.374 *0.236−0.1520.227−0.317 *−0.123−0.008−0.2060.2031.000
Mg0.2490.3020.481 **0.354 *0.119−0.095−0.539 **−0.1500.1790.2780.2281.000
** indicated very significant correlation (p < 0.01), * indicated significant correlation (p < 0.05).
Table A2. Correlation analysis between fruit quality traits of H. acerba germplasms.
Fruit Traits ContentFatProteinTanninTotal FlavonoidTotal SaponinsSoluble SugarReducing SugarStarch
Fat1.000
Protein0.1491.000
Tannin−0.2660.319 *1.000
Total flavonoid0.0880.2090.2851.000
Total saponin0.779 **0.1850.0620.375 *1.000
Soluble sugar0.0740.531 **0.486 **−0.0900.2231.000
Reducing sugar−0.0080.115−0.026−0.281−0.0390.447 **1.000
Starch0.1160.301 *0.2310.1930.2860.404 *0.1351.000
** indicated very significant correlation (p < 0.01), * indicated significant correlation (p < 0.05).
Table A3. Correlation analysis between infructescence and fruit quality traits of H. acerba germplasms.
Traits ContentFruit FatFruit ProteinFruit TanninFruit Total FlavonoidFruit Total SaponinFruit Soluble SugarFruit Reducing SugarFruit Starch
Infructescence fat0.126−0.253−0.373 *−0.126−0.025−0.322 *0.191−0.457 **
Infructescence protein−0.120−0.137−0.026−0.274−0.0420.0720.074−0.203
Infructescence tannin−0.247−0.154−0.017−0.122−0.0980.0830.154−0.248
Infructescence total flavonoid−0.1500.065−0.220−0.157−0.243−0.1160.073−0.526 **
Infructescence total saponin0.401 *0.1390.226−0.1900.2390.1760.1160.005
Infructescence soluble sugar−0.1150.0930.0070.176−0.0750.1790.066−0.081
Infructescence reducing sugar−0.0590.038−0.0050.2820.0460.0890.1200.771 **
Infructescence starch−0.070−0.138−0.082−0.220−0.010−0.1060.0880.027
Infructescence Mn0.018−0.268−0.452 **0.057−0.011−0.459 **−0.025−0.145
Infructescence K0.330 *0.086−0.037-0.1190.345 *0.1790.148−0.267
Infructescence Ca0.197-0.0830.186-0.0790.2360.052−0.0630.020
Infructescence Mg0.0640.005−0.175−0.2450.0220.0670.338 *−0.463 **
** indicated very significant correlation (p < 0.01), * indicated significant correlation (p < 0.05).
Table A4. Correlative analysis between quality traits and environmental factors of H. acerba provenances.
IndicatorsLonLatAltAMTAMPAMSHAMRDFFP
Infructescence fat content0.296−0.069−0.2410.1690.1110.271−0.3980.538 *
Infructescence protein content−0.088−0.023−0.072−0.0920.0540.1820.1010.142
Infructescence tannin content0.154−0.172−0.3360.4190.540 *0.188−0.1060.357
Infructescence total flavonoid content−0.290−0.518 *0.2560.3290.069−0.254−0.860 **0.530 *
Infructescence total saponin content0.2020.320−0.1470.0680.337−0.224−0.0030.079
Infructescence soluble sugar content−0.588 *−0.3220.551 *−0.194−0.524 *−0.546 *0.085−0.121
Infructescence reducing sugar content−0.030−0.2050.553 *−0.196−0.595 *0.1410.273−0.252
Infructescence starch content−0.0780.074−0.033−0.539 *−0.069−0.2550.237−0.029
Infructescence Mn content0.614 *−0.167−0.4740.548 *0.588 *0.186−0.4840.510 *
Infructescence K content0.3680.104−0.534 *0.2080.486−0.0340.2930.31
Infructescence Ca content−0.0770.2590.006−0.065−0.2660.2230.0030.012
Infructescence Mg content0.220−0.211−0.4500.699 **0.683 **−0.092−0.515 *0.725 **
Fruit fat content0.614 *0.416−0.3660.0120.2430.297−0.0740.166
Fruit protein content−0.3650.0810.538 *−0.312−0.3210.049−0.079−0.172
Fruit tannin content−0.3780.3330.045−0.501 *−0.064−0.2490.621 *−0.619 *
Fruit total flavonoid content0.3240.700 **−0.100−0.307−0.2320.520 *0.523 *−0.762 **
Fruit total saponin content0.625 *0.727 **−0.596 *−0.2820.3480.230.713 **−0.334
Fruit soluble sugar content−0.618 *−0.1870.299−0.349−0.151−0.547 *0.369−0.162
Fruit reducing sugar content−0.087−0.605 *0.1170.501 *0.33−0.391−0.3370.789 **
Fruit starch content−0.132−0.0480.554 *−0.364−0.600 *0.1480.472−0.411
** indicated very significant correlation (p < 0.01), * indicated significant correlation (p < 0.05).

References

  1. Yu, A.N.; Yang, Y.N.; Yang, Y.; Liang, M.; Zheng, F.P.; Sun, B.G. Free and bound aroma compounds of turnjujube (Hovenia acerba lindl.) during low temperature storage. Foods 2020, 9, 488. [Google Scholar] [CrossRef] [Green Version]
  2. Liu, C.; Wu, J.L.; Zhao, N.; Sun, J.; Shen, X.X.; Wang, Z.A. Correlation analysis between quality and habitat phenotype of Hovenia acerba. China J. Chin. Mater. Med. 2017, 42, 4769–4774. [Google Scholar]
  3. Peng, H.; Deng, Z.; Chen, X.; Sun, Y.; Zhang, B.; Li, H. Major chemical constituents and antioxidant activities of different extracts from the peduncles of Hovenia acerba Lindl. Int. J. Food Prop. 2018, 21, 2135–2155. [Google Scholar] [CrossRef] [Green Version]
  4. Li, M.C.; Xie, C.J.; Meng, C.W.; Zhang, Y.Q.; Gao, J.G.; Wang, W.H.; Liu, J.Y.; Xu, Y.N. Chemical constituents from Hovenia dulcis Thunb. And their chemotaxonomic significance. Biochem. Syst. Ecol. 2021, 94, 104214. [Google Scholar] [CrossRef]
  5. Xu, B.J.; Deng, Y.Q.; Sung, C.K. Advances in studies on bioactivity of Hovenia dulcis. Agric. Chem. Biotechnol. 2004, 47, 1–5. [Google Scholar]
  6. Guidini, C.C.; Pinto-Maglio, C.A.F.; Lombello, R.A. Karyotype, rDNA localization and meiotic behavior of Hovenia dulcis Thunb. (Rhamnaceae). Caryologia 2017, 70, 385–389. [Google Scholar] [CrossRef]
  7. Ngo, Q.M.T.; Ha, M.T.; Vu, N.K.; Kim, J.A.; Woo, M.H.; Min, B.S. Constituents from the pseudofruits of Hovenia dulcis and their chemotaxonomic significance. Biochem. Syst. Ecol. 2021, 94, 104221. [Google Scholar]
  8. Zhang, L.; Mao, R.; Bi, H.; Shen, J.; Wang, Y.; Li, M. Characterization of the complete chloroplast genome of Hovenia acerba (Rhamnaceae). Mitochondrial DNA Part B 2020, 5, 934–935. [Google Scholar] [CrossRef] [Green Version]
  9. Xu, F.; Gao, M.; Li, H.; Han, X.; Zhang, X.; Li, Y.; Guo, D.; Liu, B. Three new bisflavonols from the seeds of Hovenia dulcis Thunb. and their anti-RSV activities. Fitoterapia 2020, 143, 104587. [Google Scholar] [CrossRef]
  10. Wang, L.; Li, Z.X.; Yu, X.Z.; Du, S.K. Physicochemical properties and fatty acids composition of Hovenia dulcis Thunb. seed oil. China Oils Fats 2010, 35, 73–75. [Google Scholar]
  11. Cao, L.Y.; Li, Q.J.; Xue, Y.; Ye, H.; Wang, D.P.; Yang, X.S. Constituents and antioxidant activity of fatty acids from Hovenia dulcis. Guizhou Agric. Sci. 2014, 42, 69–72. [Google Scholar]
  12. Xu, B.J.; Deng, Y.Q.; Lee, J.H.; Mo, E.K.; Sung, C.K. Chemical compositions of the genus Hovenia. Nat. Prod. Sci. 2003, 9, 143–153. [Google Scholar]
  13. Luo, Z.; Chen, Z.; Liu, M.; Yang, L.; Zhao, Z.; Yang, D.; Ding, P. Phenotypic, chemical component and molecular assessment of genetic diversity and population structure of Morinda officinalis germplasm. BMC Genom. 2022, 23, 605. [Google Scholar] [CrossRef]
  14. Mai, T.T.P.; Hardner, C.M.; Alam, M.M.; Henry, R.J.; Topp, B.L. Phenotypic characterisation for growth and nut characteristics revealed the extent of genetic diversity in wild macadamia germplasm. Agriculture 2021, 11, 680. [Google Scholar] [CrossRef]
  15. Yang, Y.; Sun, M.; Li, S.; Chen, Q.; Silva, J.A.T.; Wang, A.; Yu, X.; Wang, L. Germplasm resources and genetic breeding of Paeonia: A systematic review. Hortic. Res. 2020, 7, 107. [Google Scholar] [CrossRef] [PubMed]
  16. Esposito, S.; Cardi, T.; Campanelli, G.; Sestili, S.; Díez, M.J.; Soler, S.; Prohens, J.; Tripodi, P. ddRAD sequencing-based genotyping for population structure analysis in cultivated tomato provides new insights into the genomic diversity of Mediterranean ‘da serbo’ type long shelf-life germplasm. Hortic. Res. 2020, 7, 134. [Google Scholar] [CrossRef]
  17. Huang, W.; Hu, Y.P.; Li, A.C.; Yang, Z.J.; Ming, Y.L.; Chen, H. RAPD analysis on the genetic diversity of Hovenia acerba in Fujian Province. Subtrop. Plant Sci. 2016, 45, 242–247. [Google Scholar]
  18. Huang, W.; Li, A.C.; Hu, Y.P.; Yang, Z.J.; Ming, Y.L.; Chen, H. ISSR analysis of genetic diversity of Hovenia acerba from Fujian, Subtrop. Plant Sci. 2019, 48, 314–320. [Google Scholar]
  19. Guo, X.; Cheng, F.; Zhong, Y. Genetic diversity of Paeonia rockii (flare tree peony) germplasm accessions revealed by phenotypic traits, EST-SSR markers and chloroplast DNA sequences. Forests 2020, 11, 672. [Google Scholar] [CrossRef]
  20. Ullah, A.; Akram, Z.; Malik, S.I.; Khan, K.S.U. Assessment of phenotypic and molecular diversity in soybean [Glycine max (L.) Merr.] germplasm using morpho-biochemical attributes and SSR markers. Genet. Resour. Crop Evol. 2021, 68, 2827–2847. [Google Scholar] [CrossRef]
  21. Lin, W.; Xiao, Q.; Yu, F.; Han, Z.; Liu, J.; Peng, W.; Huang, Z.; Lei, Y.; Li, W.; You, W.; et al. Development of a low-density SNP genotyping panel by a novel technology mGPS and its application in germplasm identification of abalone. Aquaculture 2022, 565, 739089. [Google Scholar] [CrossRef]
  22. Liu, Z.; Gao, C.; Li, J.; Miao, Y.; Cui, K. Phenotypic diversity analysis and superior family selection of industrial raw material forest species-Pinus yunnanensis Franch. Forests 2022, 13, 618. [Google Scholar] [CrossRef]
  23. Teixeira, J.C.; Huber, C.D. The inflated significance of neutral genetic diversity in conservation genetics. Proc. Natl. Acad. Sci. USA 2021, 118, e2015096118. [Google Scholar] [CrossRef] [PubMed]
  24. Lovell, J.T.; MacQueen, A.H.; Mamidi, S.; Bonnette, J.; Jenkins, J.; Napier, J.D.; Sreedasyam, A.; Healey, A.; Session, A.; Shu, S.; et al. Genomic mechanisms of climate adaptation in polyploid bioenergy switchgrass. Nature 2021, 590, 438–444. [Google Scholar] [CrossRef] [PubMed]
  25. Voelkl, B.; Altman, N.S.; Forsman, A.; Gurevitch, J.; Jaric, I.; Karp, N.A.; Kas, M.; Schielzeth, H.; Casteele, T.V.; Würbe, L.H. Reproducibility of animal research in light of biological variation. Nat. Rev. Neurosci. 2020, 21, 384–393. [Google Scholar] [CrossRef] [PubMed]
  26. Wadl, P.A.; Olukolu, B.A.; Branham, S.E.; Jarret, R.L.; Yencho, G.C.; Jackson, D.M. Genetic diversity and population structure of the USDA sweetpotato (Ipomoea batatas) germplasm collections using GBSpoly. Front. Plant Sci. 2018, 9, 1166. [Google Scholar] [CrossRef] [Green Version]
  27. Li, S.Y.; Wang, D.; Li, X.R.; Qin, X.M.; Du, Y.G.; Li, K. Identification and activity evaluation of Astragalus Radix from different germplasm resources based on specific oligosaccharide fragments. Chin. Herb. Med. 2021, 13, 33–42. [Google Scholar] [CrossRef]
  28. Feng, L.; Bai, Z.Y.; Lu, B.S.; Cai, S.W.; Feng, L.N. Effects of NaCl stress on Hovenia dulcis and Gleditsia sinensis seedlings growth, chlorophyll fluorescence, and active oxygen metabolism. Chin. J. Appl. Ecol. 2008, 19, 2503–2508. [Google Scholar]
  29. Zhang, S.D.; Ling, L.Z. De novo sequencing and comparative analysis of peduncle transcriptomes in Hovenia acerba. Agri Gene 2017, 3, 32–36. [Google Scholar] [CrossRef]
  30. Li, Y.; Shen, Y.B. A study on the seed dormancy mechanism and ways of dormancy breaking in Hovenia acerba Lindl. J. Nanjing For. Univ. (Nat. Sci. Ed.) 2014, 38, 57–62. [Google Scholar]
  31. Chang, P.; Ma, J.; Xin, H.; Wang, S.; Chen, Z.; Hong, X.; Zhang, B.; Li, L. Comparative study of the fatty acid composition of the Acer truncatum Bunge from different producing areas. Forests 2022, 13, 1409. [Google Scholar] [CrossRef]
  32. Goldring, J.P. Measuring protein concentration with absorbance, Lowry, Bradford Coomassie blue, or the Smith bicinchoninic acid assay before electrophoresis. Electrophor. Sep. Proteins 2019, 1855, 31–39. [Google Scholar]
  33. Saha, H.R.; Lutfunnahar, M.; Sana, M.; Sana, S.; Haque, M.S.; Dey, B.R.; Sarkar, B.C.; Sana, N.K. Nutritional value of sweet potato (Ipomoea batatas) cultivated in the northern part of Bangladesh. Int. J. Sci. Healthc. Res. 2022, 7, 258–272. [Google Scholar] [CrossRef]
  34. Shingala, A.M.; Dabhi, M.N.; Rathod, P.J.; Dharsenda, T.L. Effect of ozone gas exposure time and ozone cycle on starch content of wheat (Triticum aestivum) during bulk storage. Pharma Innov. J. 2022, 11, 1621–1626. [Google Scholar]
  35. Peng, D.; Zahid, H.F.; Ajlouni, S.; Dunshea, F.R.; Suleria, H.A. Lc-esi-qtof/ms profiling of Australian mango peel by-product polyphenols and their potential antioxidant activities. Processes 2019, 7, 764. [Google Scholar] [CrossRef] [Green Version]
  36. Shraim, A.M.; Ahmed, T.A.; Rahman, M.M.; Hijji, Y.M. Determination of total flavonoid content by aluminum chloride assay: A critical evaluation. LWT-Food Sci. Technol. 2021, 150, 111932. [Google Scholar] [CrossRef]
  37. Khoang, L.T.; Huyen, H.T.T.; Chung, H.V.; Duy, L.X.; Toan, T.Q.; Bich, H.T.; Minh, P.T.H.; Pham, D.T.N.; Hien, T.T. Optimization of total saponin extraction from Polyscias fruticosa roots using the ultrasonic-assisted method and response surface methodology. Processes 2022, 10, 2034. [Google Scholar] [CrossRef]
  38. D’Archivio, A.A.; Foschi, M.; Aloia, R.; Maggi, M.A.; Rossi, L.; Ruggieri, F. Geographical discrimination of red garlic (Allium sativum L.) produced in Italy by means of multivariate statistical analysis of ICP-OES data. Food Chem. 2019, 275, 333–338. [Google Scholar] [CrossRef]
  39. Luo, X.; Wu, Z.; Fu, L.; Dan, Z.; Yuan, Z.; Liang, T.; Zhu, R.; Hu, Z.; Wu, X. Evaluation of lodging resistance in rice based on an optimized parameter from lodging index. Crop Sci. 2022, 62, 1318–1332. [Google Scholar] [CrossRef]
  40. Awad-Allah, M.M.A.; Mohamed, A.H.; El-Bana, M.A.; El-Okkiah, S.A.; Abdelkader, M.F.; Mahmoud, M.H.; EI-Diasty, M.Z.; Said, M.M.; Shamseldin, S.A.M.; Abdein, M.A. Assessment of genetic variability and bran oil characters of new developed restorer lines of rice (Oryza sativa L.). Genes 2022, 13, 509. [Google Scholar] [CrossRef]
  41. Kruijer, W.; Boer, M.P.; Malosetti, M.; Flood, P.J.; Engel, B.; Kooke, R.; Keurentjes, J.J.B.; van Eeuwijk, F.A. Marker-based estimation of heritability in immortal populations. Genetics 2015, 199, 379–398. [Google Scholar] [CrossRef] [PubMed]
  42. Duan, H.; Cao, S.; Zheng, H.; Hu, D.; Lin, J.; Lin, H.; Hu, R.; Sun, Y.; Li, Y. Variation in the growth traits and wood properties of Chinese fir from six provinces of southern China. Forests 2016, 7, 192. [Google Scholar] [CrossRef]
  43. Tang, H.; Xu, C.; Jiang, Y.; Wang, J.; Wang, Z.; Tian, L. Evaluation of physical characteristics of typical maize seeds in a cold area of north China based on principal component analysis. Processes 2021, 9, 1167. [Google Scholar] [CrossRef]
  44. Pons, C.; Casals, J.; Palombieri, S.; Fontanet, L.; Riccini, A.; Rambla, J.L.; Ruggiero, A.; Figás, M.R.; Plazas, M.; Koukounaras, A.; et al. Atlas of phenotypic, genotypic and geographical diversity present in the European traditional tomato. Hortic. Res. 2022, 9, uhac112. [Google Scholar] [CrossRef]
  45. Rosas, T.; Mencuccini, M.; Barba, J.; Cochard, H.; Saura-Mas, S.; Martínez-Vilalta, J. Adjustments and coordination of hydraulic, leaf and stem traits along a water availability gradient. New Phytol. 2019, 223, 632–646. [Google Scholar] [CrossRef]
  46. Costa, C.; Schurr, U.; Loreto, F.; Menesatti, P.; Carpentier, S. Plant phenotyping research trends, a science mapping approach. Front. Plant Sci. 2019, 9, 1933. [Google Scholar] [CrossRef] [Green Version]
  47. Ahmed, A.K.M.; Fu, Z.; Ding, C.; Jiang, L.; Han, X.; Yang, A.; Ma, Y.; Zhao, X. Growth and wood properties of a 38-year-old Populus simonii× P. nigra plantation established with different densities in semi-arid areas of northeastern China. J. For. Res. 2020, 31, 497–506. [Google Scholar] [CrossRef]
  48. Akoa, S.P.; Onomo, P.E.; Ndjaga, J.M.; Ondobo, M.L.; Djocgoue, P.F. Impact of pollen genetic origin on compatibility, agronomic traits, and physicochemical quality of cocoa (Theobroma cacao L.) beans. Sci. Hortic. 2021, 287, 110278. [Google Scholar] [CrossRef]
  49. Wang, X.; Gao, L.; Jiao, C.; Stravoravdis, S.; Hosmani, P.S.; Saha, S.; Zhang, J.; Mainiero, S.; Strickler, S.R.; Catala, C.; et al. Genome of Solanum pimpinellifolium provides insights into structural variants during tomato breeding. Nat. Commun. 2020, 11, 5817. [Google Scholar] [CrossRef]
  50. Cortés, V.; Blasco, J.; Aleixos, N.; Cubero, S.; Talens, P. Monitoring strategies for quality control of agricultural products using visible and near-infrared spectroscopy: A review. Trends Food Sci. Technol. 2019, 85, 138–148. [Google Scholar] [CrossRef]
  51. Sheikh, F.R.; Jose-Santhi, J.; Kalia, D.; Singh, K.; Singh, R.K. Sugars as the regulators of dormancy and sprouting in geophytes. Ind. Crops Prod. 2022, 189, 115817. [Google Scholar] [CrossRef]
  52. Wang, G.; Cao, F.; Chang, L.; Guo, X.; Wang, J. Temperature has more effects than soil moisture on biosynthesis of flavonoids in Ginkgo (Ginkgo biloba L.) leaves. New For. 2014, 45, 797–812. [Google Scholar] [CrossRef]
  53. Lebaka, V.R.; Wee, Y.J.; Ye, W.; Korivi, M. Nutritional composition and bioactive compounds in three different parts of mango fruit. Int. J. Environ. Res. Public Health 2021, 18, 741. [Google Scholar] [CrossRef] [PubMed]
  54. Brizzolara, S.; Manganaris, G.A.; Fotopoulos, V.; Watkins, C.B.; Tonutti, P. Primary metabolism in fresh fruits during storage. Front. Plant Sci. 2020, 11, 80. [Google Scholar] [CrossRef] [PubMed] [Green Version]
  55. Kumar, P.; Kumar, T.; Singh, S.; Tuteja, N.; Prasad, R.; Singh, J. Potassium: A key modulator for cell homeostasis. J. Biotechnol. 2020, 324, 198–210. [Google Scholar] [CrossRef]
  56. Hu, W.; Di, Q.; Wang, Z.; Zhang, Y.; Zhang, J.; Liu, J.; Shi, X. Grafting alleviates potassium stress and improves growth in tobacco. BMC Plant Biol. 2019, 19, 1–13. [Google Scholar] [CrossRef]
  57. Hernández-Pérez, O.I.; Valdez-Aguilar, L.A.; Alia-Tejacal, I.; Cartmill, A.D.; Cartmill, D.L. Tomato fruit yield, quality, and nutrient status in response to potassium: Calcium balance and electrical conductivity in the nutrient solution. J. Soil Sci. Plant Nutr. 2020, 20, 484–492. [Google Scholar] [CrossRef]
  58. Zhu, L.; Zhang, J.; Yang, J.; Jiang, Y.; Yang, S. Strategies for optimizing acetyl-CoA formation from glucose in bacteria. Trends Biotechnol. 2021, 4, 4. [Google Scholar] [CrossRef]
  59. Hasanuzzaman, M.; Bhuyan, M.B.; Nahar, K.; Hossain, M.S.; Mahmud, J.A.; Hossen, M.S.; Masud, A.A.C.; Fujita, M. Potassium: A vital regulator of plant responses and tolerance to abiotic stresses. Agronomy 2018, 8, 31. [Google Scholar] [CrossRef] [Green Version]
  60. Vignault, A.; González-Centeno, M.R.; Pascual, O.; Gombau, J.; Jourdes, M.; Moine, V.; Iturmendi, N.; Canals, J.M.; Zamora, F.; Teissedre, P.L. Chemical characterization, antioxidant properties and oxygen consumption rate of 36 commercial oenological tannins in a model wine solution. Food Chem. 2018, 268, 210–219. [Google Scholar] [CrossRef]
  61. Chandra, P.; Ghosh, T.; Choudhary, N.; Mohammad, A.; Mobin, S.M. Recent advancement in oxidation or acceptorless dehydrogenation of alcohols to valorised products using manganese based catalysts. Coord. Chem. Rev. 2020, 411, 213241. [Google Scholar] [CrossRef]
  62. Tekaya, M.; Mechri, B.; Cheheb, H.; Attia, F.; Chraief, I.; Ayachi, M.; Boujneh, D.; Hammami, M. Changes in the profiles of mineral elements, phenols, tocopherols and soluble carbohydrates of olive fruit following foliar nutrient fertilization. LWT-Food Sci. Technol. 2014, 59, 1047–1053. [Google Scholar] [CrossRef]
  63. Novaes, M.I.C.; Debona, D.; Fagundes-Nacarath, I.R.F.; Brás, V.V.; Rodrigues, F.A. Physiological and biochemical responses of soybean to white mold affected by manganese phosphite and fluazinam. Acta Physiol. Plant. 2019, 41, 1–16. [Google Scholar] [CrossRef]
  64. Mahgoub, H.A.; Fouda, A.; Eid, A.M.; Ewais, E.E.D.; Hassan, S.E.D. Biotechnological application of plant growth-promoting endophytic bacteria isolated from halophytic plants to ameliorate salinity tolerance of Vicia faba L. Plant Biotechnol. Rep. 2021, 15, 819–843. [Google Scholar] [CrossRef]
  65. Moaveni, P.; Kiapour, H.; Sani, B.; Rajabzadeh, F.; Mozafari, H. Changes in some physiological traits and mucilage yield of sour tea (Hibiscus Sabdariffa L.) under foliar application of magnesium and iron oxide nanoparticles. Iran. J. Plant Physiol. 2020, 10, 3333–3341. [Google Scholar]
  66. Cuervo-Alarcon, L.; Arend, M.; Müller, M.; Sperisen, C.; Finkeldey, R.; Krutovsky, K.V. Genetic variation and signatures of natural selection in populations of European beech (Fagus sylvatica L.) along precipitation gradients. Tree Genet. Genomes 2018, 14, 1–21. [Google Scholar] [CrossRef] [Green Version]
  67. Moles, T.M.; de Brito Francisco, R.; Mariotti, L.; Pompeiano, A.; Lupini, A.; Incrocci, L.; Carmassi, G.; Scartazza, A.; Pistelli, L.; Guglielminetti, L.; et al. Salinity in autumn-winter season and fruit quality of tomato landraces. Front. Plant Sci. 2019, 10, 1078. [Google Scholar] [CrossRef] [Green Version]
  68. Francisco, C.S.; Ma, X.; Zwyssig, M.M.; McDonald, B.A.; Palma-Guerrero, J. Morphological changes in response to environmental stresses in the fungal plant pathogen Zymoseptoria tritici. Sci. Rep. 2019, 9, 9624. [Google Scholar] [CrossRef] [Green Version]
  69. Jolliffe, I.T.; Cadima, J. Principal component analysis: A review and recent developments. Philos. Trans. R. Soc. A 2016, 374, 20150202. [Google Scholar] [CrossRef] [Green Version]
  70. Peng, L.; Li, W.M.; Gao, Y. A comparison of the content of total flavonoids in Semen Hoveniae from different producing areas. In Proceedings of the Symposium on Medicinal Plant Chemistry and Sustainable Development of Traditional Chinese Medicine Resources, Xining, China, 17–19 July 2009; pp. 108–110. [Google Scholar]
  71. Gürcan, K.; Say, A.; Yetişir, H.; Denli, N. A study of genetic diversity in bottle gourd [Lagenaria siceraria (Molina) Standl.] population, and implication for the historical origins on bottle gourds in Turkey. Genet. Resour. Crop Evol. 2015, 62, 321–333. [Google Scholar] [CrossRef]
  72. Zhao, L.; Qi, Z.; Xiao, S.; Tang, F.; Liu, Y.; Deng, Y.; Dai, X.; Zhou, Z.; Ou, W.; Cao, Q. Genetic diversity assessment of sweetpotato germplasm in China using InDel markers. Agronomy 2022, 12, 3074. [Google Scholar] [CrossRef]
  73. Zhou, T.; Huang, X.J.; Zhang, S.Z.; Wang, Y.; Wang, Y.J.; Liu, W.Z.; Wang, Y.L.; Zou, J.B.; Li, Z.H. Population demographic history of a rare and endangered tree Magnolia sprengeri Pamp. in east Asia revealed by molecular data and ecological niche analysis. Forests 2021, 12, 931. [Google Scholar] [CrossRef]
Figure 1. H. acerba infructescence and fruit.
Forests 14 00204 g001
Figure 2. Correlation analysis between quality traits of H. acerba germplasms. ** indicated very significant correlation (p < 0.01), * indicated significant correlation (p < 0.05). Ⅰ: Correlation analysis between infructescence quality traits of H. acerba germplasms; Ⅱ: Correlation analysis between fruit quality traits of H. acerba germplasms; Ⅲ: Correlation analysis between infructescence and fruit quality traits of H. acerba germplasms. 1: Infructescence fat content; 2: Infructescence protein; 3: Infructescence tannin; 4: Infructescence total flavonoid; 5: Infructescence total saponin; 6: Infructescence soluble sugar; 7: Infructescence reducing sugar; 8: Infructescence starch; 9: Infructescence Mn; 10: Infructescence K; 11: Infructescence Ca; 12: Infructescence Mg; A: Fruit fat; B: Fruit protein; C: Fruit tannin; D: Fruit total flavonoid; E: Fruit total saponin; F: Fruit soluble sugar; G: Fruit reducing sugar; H: Fruit starch.
Forests 14 00204 g002
Figure 3. Clustering analysis of H. acerba germplasm resources.
Forests 14 00204 g003
Figure 4. Correlative analysis between quality traits and environmental factors of H. acerba provenances. ** indicated very significant correlation (p < 0.01), * indicated significant correlation (p < 0.05). 1: Infructescence fat content; 2: Infructescence protein; 3: Infructescence tannin; 4: Infructescence total flavonoid; 5: Infructescence total saponin; 6: Infructescence soluble sugar; 7: Infructescence reducing sugar; 8: Infructescence starch; 9: Infructescence Mn; 10: Infructescence K; 11: Infructescence Ca; 12: Infructescence Mg; A: Fruit fat; B: Fruit protein; C: Fruit tannin; D: Fruit total flavonoid; E: Fruit total saponin; F: Fruit soluble sugar; G: Fruit reducing sugar; H: Fruit starch.
Forests 14 00204 g004
Table 1. Origin of H. acerba test germplasm resources.
CodeLocationCodeLocationCodeLocation
Y1Yongding countyZ3Zhenghe countyP2Pucheng county
Y2Yongding countyZ4Zhenghe countyJ1Jianou county
L1LianchengZ5Zhenghe countyJ2Jianou county
L2LianchengX1Songxi countyJ3Jianou county
L3LianchengX2Songxi countyJ4Jianou county
D1Datian countyS1Sha countyJ5Jianou county
D2Datian countyS2Sha countyJ6Jianou county
D3Datian countyS3Sha countyJ7Jianou county
Q1Qingliu countyF1Fuzhou cityJ8Jianou county
Z1Zhenghe countyC1Shunchang county
Z2Zhenghe countyP1Pucheng county
Table 2. Environmental factors of each location of H. acerba trees.
LocationLongLatAlt
(m)
AMT
(°C)
AMP
(mm)
AMSH
(h)
AMRD
(d)
FFP
(d)
Yongding countyE116°49′N24°45′62420.116071743130305
Liancheng countyE116°48′N25°49′33416.717341761132291
Datian countyE117°52′N25°41′35317.516511724141297
Qingliu countyE116°53′N26°09′27417.917861583143276
Sha countyE117°48′N26°36′32417.616751878140290
Fuzhou cityE119°14′N26°05′4321.519921840132326
Shunchang countyE117°52′N26°54′37518.517561740135305
Zhenghe countyE118°56′N27°24′28016.517001907139250
Songxi countyE117°52′N27°35′27118.116501866138269
Pucheng countyE118°28′N27°49′25917.417801900145254
Jianou countyE118°20′N27°03′12219.318001612137286
Table 3. Genetic diversity of infructescence quality traits in H. acerba germplasm.
Quality TraitVariation RangeMeanSDF ValueCVRH
Fat content (%)0.32~2.341.230.4583.33 **0.360.9881.93
Protein content (%)3.94~29.8910.226.15333.33 **0.600.9971.40
Tannin content (%)0.54~1.440.920.22111.11 **0.240.9912.01
Total flavonoid content (%)0.10~0.400.190.06100.00 **0.320.9901.81
Total saponin content (%)1.32~2.341.810.2222.73 **0.120.9562.02
Soluble sugar content (%)37.26~61.6849.175.9552.63 **0.130.9811.96
Reducing sugar content (%)15.02~44.2529.438.04142.86 **0.270.9931.94
Starch content (%)1.08~7.843.051.65250.00 **0.540.9961.87
Mn content (μg·g−1)5.37~75.0724.4317.77500.00 **0.730.9981.86
K content (μg·g−1)12,266.34~30,346.8621,604.294685.1558.82 **0.220.9831.96
Ca content (μg·g−1)985.28~4697.432509.851033.29166.67 **0.410.9941.82
Mg content (μg·g−1)395.23~1841.70947.39267.90125.00 **0.280.9921.92
Average----0.350.9881.88
** highly significant correlation (p < 0.01).
Table 4. Genetic diversity of fruit quality traits in H. acerba germplasm.
Quality TraitVariation RangeMeanSDF ValueCVRH
Fat content (%)3.64~14.8710.082.2424.39 **0.220.9591.98
Protein content (%)2.70~6.744.740.7413.89 **0.160.9281.97
Tannin content (%)1.74~9.574.701.80125.00 **0.380.9921.56
Total flavonoid content (%)0.31~0.750.470.0983.33 **0.190.9882.00
Total saponin content (%)3.20~5.384.530.4112.20 **0.090.9181.94
Soluble sugar content (%)2.42~5.964.320.76200.00 **0.180.9951.99
Reducing sugar content (%)0.93~2.731.700.51142.857 **0.300.9931.88
Starch content (%)1.10~4.142.330.7790.909 **0.330.9891.80
Average----0.230.9701.89
** indicated very significant correlation (p < 0.01).
Table 5. Principal component analysis in quality traits of H. acerba germplasms.
TraitsFactor 1Factor 2Factor 3Factor 4Factor 5Factor 6
Infructescence fat content−0.523−0.2490.1940.4590.010−0.128
Infructescence protein content−0.019−0.123−0.0660.840−0.114−0.158
Infructescence tannin content−0.004−0.118−0.1500.8120.237−0.100
Infructescence total flavonoid content−0.071−0.538−0.141−0.0060.742−0.154
Infructescence total saponin content0.331−0.3210.355−0.096−0.383−0.192
Infructescence soluble sugar content0.0720.098−0.095−0.0960.697−0.107
Infructescence reducing sugar content−0.0370.895−0.042−0.0990.189−0.086
Infructescence starch content−0.2720.051−0.122−0.077−0.643−0.269
Infructescence Mn content−0.696−0.0030.006−0.236−0.332−0.051
Infructescence K content0.012−0.2880.5330.3720.051−0.154
Infructescence Ca content0.189−0.0590.2680.605−0.3370.196
Infructescence Mg content−0.079−0.5910.1510.3420.097−0.322
Fruit fat content−0.082−0.0280.918−0.134−0.074−0.011
Fruit protein content0.5800.0230.257−0.2510.168−0.194
Fruit tannin content0.8310.080−0.1280.056−0.1440.201
Fruit total flavonoid content0.0760.3610.261−0.1300.2780.855
Fruit total saponin content0.0970.1860.8830.022−0.0570.115
Fruit soluble sugar content0.7300.1720.1670.0680.074−0.491
Fruit reducing sugar content0.0470.0820.0550.1070.064−0.562
Fruit starch content0.3190.8500.128−0.147−0.168−0.137
Eigenvalue2.6812.6632.4372.4252.1211.775
Contribution rate%18.7714.5012.549.347.907.45
Cumulative contribution%18.7733.2745.8155.1563.0570.51
Table 6. Comprehensive score of H. acerba germplasms.
Germplasm Code 1Factor 1Factor 2Factor 3Factor 4Factor 5Factor 6F Value
S20.2110.8610.3142.7830.323−0.0880.773
S30.3190.0000.5422.0160.0130.9690.625
Y1−0.0391.4680.464−0.4931.4770.3560.532
J70.365−0.5810.5591.3220.9380.5590.495
D1−1.3362.2550.832−0.173−0.3741.5340.424
Q12.007−0.318−1.3350.1280.6820.6540.297
J81.118−0.5141.536−0.1540.185−0.7440.288
P11.0361.634−0.0760.654−0.503−1.9870.279
P21.5180.2810.400−0.085−0.829−0.5130.207
J61.6750.5950.166−1.187−1.6121.1960.164
L30.908−1.2320.1110.1300.4440.7750.146
S10.1680.176−0.7341.804−0.742−0.0220.134
Z5−0.041−0.5240.299−0.6722.333−0.3580.134
C10.667−1.0291.070−0.942−0.1111.5120.129
D3−0.9850.5970.600−0.1420.2210.5850.112
Z2−0.2721.3160.087−1.1420.4880.0720.098
J10.4950.2580.770−0.375−0.960−0.4120.016
D2−1.2841.245−0.426−0.4270.6920.5180.013
Z1−0.301−0.3331.481−1.3420.340−0.227−0.072
X2−0.194−1.0290.371−0.0791.812−1.624−0.114
L10.254−0.9320.2480.469−1.6520.965−0.131
F1−1.972−1.1950.4030.6830.2611.181−0.225
J5−0.090−1.0380.567−0.4340.295−0.837−0.251
Y20.203−0.184−3.0720.0330.7251.268−0.253
X10.2050.566−0.4210.494−0.952−2.228−0.266
Z4−0.7430.6730.048−0.7480.132−1.380−0.288
Z3−0.4331.263−1.589−0.902−0.5020.291−0.312
J40.705−1.118−0.647−1.168−0.3300.060−0.432
J2−2.047−1.0820.2431.143−1.017−0.539−0.575
L2−0.617−0.821−2.322−0.1820.535−0.977−0.748
J3−1.503−1.258−0.487−1.013−2.313−0.558−1.199
1 see Table 1 for explanation of germplasm code.
Table 7. Analysis of quality traits of H. acerba germplasm resources in different clusters.
TraitsGroup
Infructescence fat content3.663.491.382.502.052.58
Infructescence protein content2.603.282.011.531.531.32
Infructescence tannin content2.943.643.252.232.252.15
Infructescence total flavonoid content2.312.702.983.091.271.87
Infructescence total saponin content3.173.402.432.693.392.10
Infructescence soluble sugar content1.742.993.963.331.643.26
Infructescence reducing sugar content1.512.462.642.013.223.98
Infructescence starch content3.462.121.701.481.922.41
Infructescence Mn content3.801.281.191.531.642.78
Infructescence K content3.693.372.363.052.382.56
Infructescence Ca content2.673.281.681.963.151.70
Infructescence Mg content4.023.613.402.792.402.25
Fruit fat content3.974.151.524.294.003.88
Fruit protein content3.044.313.313.904.353.85
Fruit tannin content1.882.643.832.433.802.01
Fruit total flavonoid content1.902.181.872.753.193.12
Fruit total saponin content4.324.462.634.454.824.46
Fruit soluble sugar content2.314.164.283.193.523.37
Fruit reducing sugar content2.492.923.781.642.002.62
Fruit starch content1.332.302.201.813.663.39
Disclaimer/Publisher’s Note: The statements, opinions and data contained in all publications are solely those of the individual author(s) and contributor(s) and not of MDPI and/or the editor(s). MDPI and/or the editor(s) disclaim responsibility for any injury to people or property resulting from any ideas, methods, instructions or products referred to in the content.

