Article

Economic and Environmental Analysis of Woody Biomass Power Generation Using Forest Residues and Demolition Debris in Japan without Assuming Carbon Neutrality

1
Faculty of Food and Agricultural Sciences, Fukushima University, Fukushima 9601248, Japan
2
Mizuho Financial Group, Inc., Tokyo 1008176, Japan
*
Author to whom correspondence should be addressed.
Forests 2023, 14(1), 148; https://doi.org/10.3390/f14010148
Submission received: 24 December 2022 / Accepted: 11 January 2023 / Published: 12 January 2023

Abstract

:
Despite the increasing importance of renewable energy worldwide, the argument that forest biomass power generation is not carbon neutral has been rising. This research used Gifu Biomass Power Co., Ltd. (GBP) in Japan as a case study to investigate this matter. An evaluation was conducted through an input–output analysis on the economic and environmental benefits (i.e., CO2 reduction) of forest biomass power generation without assuming carbon neutrality. GBP’s economic benefits were estimated to be 3452.18 million JPY during the construction period and 114.38 million JPY per year from operations. It was also estimated to generate 21.77 jobs per year in the forestry sector. CO2 emissions were estimated to increase by 423.02 tons during the construction period and 137,747 tons per year from operations. Although forests may offset CO2 by absorbing it, woody biomass power generation does not necessarily reduce CO2 emissions in Gifu Prefecture. The results indicate that woody biomass power generation is effective for the local economy but not necessarily for the global environment. The analysis should include more industrial sectors to clarify the environmental significance of wood biomass power generation without assuming carbon neutrality.

1. Introduction

1.1. Background

Carbon neutrality, the goal of achieving virtually zero greenhouse gas emissions in the wake of the Paris Agreement adopted in 2015, is now a global trend. A total of 128 countries and self-governing territories have declared their intention to pursue this goal [1]. Climate-related actions are currently being implemented to achieve this. Expectations for renewable energy are growing, and the use of woody biomass is expected to increase.
Meanwhile, the Joint Research Center, designated by the European Commission, published a research report titled “Use of Forest Biomass in EU Energy Production” [2]. The report stated that “The reconstructed Renewable Energy Directive (REDII Directive 2018/2001) envisages zero emissions at the point of biomass combustion. Bioenergy is not accounted for in the energy sector because these emissions are already counted as a change in carbon storage in the land use, land-use change, and forestry (LULUCF) sector (Regulation 2018/841). Therefore, the assumption that bioenergy is ‘carbon neutral’ within the broader EU climate and energy framework is incorrect” [2] (p. 9).
The above view is quite different from the theory that trees have CO₂ fixed in their trunks until they are cut down; therefore, even if trees are cut down and burned, and CO₂ is generated, they are carbon neutral if they are repeatedly managed and planted. Furthermore, the report points out that forests are being cut down for fuel procurement, which threatens ecosystems and biodiversity. There is a need to balance woody biomass power generation with ecosystems and biodiversity. Thus, the situation surrounding forest biomass is changing drastically.
The Japanese Government has been working to promote renewable energy since the Fukushima Daiichi Nuclear Power Plant accident on 11 March 2011. For example, a feed-in tariff (FIT) system was introduced in July 2012. Renewable energies include solar, wind, hydro, geothermal, and woody biomass, which is a unique energy source. Solar and wind energy are public goods, but woody biomass is a private good. Therefore, when electric power companies purchase this resource, they contribute to the local economy, especially the forestry industry. As such, many forest owners, conduits, and administrators in Japan expect significant economic benefits from woody biomass use. However, power generation using this resource increases CO2 emissions. Hence, assuming that forest biomass is not carbon neutral, this study determined where and how much economic benefit and where and how much CO2 emission or reduction can be achieved through forest biomass power generation in Japan. Specifically, this study evaluated the economic and environmental effects of woody biomass power generation during construction and operation through an inter-industry analysis using workplace data from the Gifu Biomass Power Co., Ltd. (GBP), a woody biomass power generation company in Gifu Prefecture. The data used in this study were from the first year of operation (2016). Data for subsequent years were unavailable when this study was conducted, and the projections may differ from actual measurements.

1.2. Current Status of Woody Biomass Power Generation in Japan

Japan is one of the most forested countries in the world. Forests cover approximately 25 million hectares, or 2/3, of the country’s land area. Plantation forests account for 40% of this total, or 10 million hectares. The forest stock, mainly planted forests, has increased by approximately 70 million m3 annually and currently stands at approximately 5.2 billion m3. Planted forests are coniferous, with cedar and cypress species. Most of these trees were planted after 1945 for building materials, and when the trees reach 30 years of age or more, they are thinned once every ten years or so, with clear cutting occurring after 50 to 60 years. However, steep slopes, intricate contour lines, and heavy precipitation make it difficult to create a road network. Even if overhead wires are used, the small working area causes inefficiencies. Hence, the cost of collecting timber is high, leaving a large amount of timber in the forest.
With the shift to renewable energy being a global trend and Japan having the motive to get rid of nuclear power, thinned wood and forest residues are being used as woody biomass. Woody biomass is burned to generate electricity, with little or no use for the heat produced. To promote the use of woody biomass for power generation, a FIT system was introduced based on the German model (see [3]). The price for electricity generated by woody biomass power plants was determined in 2012 and varied depending on the type of fuel. The price for unused wood was set at 33.6 JPY (including tax); general wood, such as sawmill scraps and palm coconut shells, was at 25.2 JPY; and wood derived from construction materials at 13.65 JPY [4]. Since then, the price has been revised several times. In contrast to government policy that aims to promote the use of unused wood, many woody biomass power plants import and use palm coconut shells from Southeast Asia as raw materials [5].

1.3. Previous Research

The input–output (IO) analysis method is commonly used for analyzing economic spillovers. This method has recently been used to assess greenhouse gas emissions [6,7,8,9]. In addition, some studies have used computable general equilibrium (CGE) models, including IO tables [10,11].
Several studies employ IO analysis to evaluate the economic benefits to the forestry sector (see [12]). Others have evaluated the economic impact of woody biomass power generation on the forestry sector [13,14] and the environmental benefits of such power generation [15,16]. Madlener et al. [17] evaluated the economic and environmental benefits of woody biomass power generation. They did not consider the CO2 emissions attributed to the economic benefits and only evaluated the environmental benefits of alternative energy sources. Given that major electric utilities will reduce energy production if the electricity demand remains constant, we believe that the negative effects of renewable energy production through FIT cannot be ignored. This is because an amount of electricity that matches the demand of electricity must be generated, and it is difficult to store even larger amounts of electricity. Haddad et al.’s study [18] on the bioeconomy in Europe focused primarily on agriculture as a provider of food, feed, fuel, and fiber to bio-based industries. They performed a sensitivity analysis of a 1% increase in forest product input use in the European economies in a CGE framework that considers land use and greenhouse gas emissions by agro-ecological zones.
In Japan, the National Institute for Environmental Studies publishes data on the country’s “Embodied Energy and Emission Intensity Data for Japan using input–output tables” (3EID), which can be used for environmental analysis through an IO analysis [19]. Washizu et al. [20] published a Japanese IO table for renewable energy power plants using the investment composition vector. Moriizumi et al. [21] also developed a Japanese IO table for renewable energy. They found that different renewable energy generation technologies likely have large indirect spillover effects on various industries.
Nishiguchi and Tabata [22] examined the social, economic, and CO2 emission reduction benefits in Japan, including job creation, when generating energy from unused woody biomass (8.58 million tons per year). Hayashi et al. [23] replaced fossil fuels with wood energy and investigated, through an inter-industry analysis, whether this would bring economic benefits to users and local economies. Nakano et al. [24] calculated the production, employment, energy consumption, and CO2 emissions induced by constructing and operating a power plant fueled by unused woody biomass and curbing energy production using thermal power plants. They also estimated the amount of public benefit gained by conserving the area. Tabata and Okuda [25] analyzed the effectiveness of a woody biomass utilization system in Gifu Prefecture using a life cycle assessment. Japanese forestry processes from the planting stage to woody biomass production were evaluated using process-based ecosystem and forestry cost models and ecological footprint-like indicators. Matsuoka et al. [26] focused on five prefectures: Aomori, Iwate, Miyagi, Akita, and Yamagata, and considered trade among these prefectures. They estimated the annual supply potential of timber and forest biomass resources in Japan, such as small-diameter trees and missing trunk logs, rather than logging residues, from profitable forests that are expected to generate more income than the total cost from planting to final harvest.
Most of these previous studies considered the effects of woody biomass power generation from a social or national perspective. However, a distinct characteristic of woody biomass power generation is its relationship to the local economy. Therefore, it is necessary to analyze the impact of woody biomass power generation on the local economy. This study evaluates the economic and environmental impact of GBP, a woody biomass power generation plant, on the local economy including the impact on Chubu Electric Power Co. Inc. (CEP), which purchases electricity generated from renewable energy sources. Furthermore, instead of assuming carbon neutrality during power generation, we assumed that this process is an emission source and thereby simulated whether woody biomass power generation in Japan absorbs carbon dioxide emissions.

2. Methods

2.1. Input–Output Analysis

The IO analysis method was first introduced by Leontief [27], and the economic effects analyzed comprised direct and indirect effects. The flow of the economic effects from a woody biomass power generation plant is as follows. First, such a plant purchases wood for fuel, creating demand for forest residues from the forestry sector and for demolition debris from the pulp, paper, and wood products sector (direct effect). Moreover, the demand in the forestry sector induces the production of items such as forestry equipment, which are required by this sector (indirect effect).
The IO table shows the relationship between the productive sectors of a given economy in a linear, inter-sectoral model. The relationship between the productive sectors and demand can be expressed as follows:
X i = j = 1 N X i j + F i = j = 1 N a i j X j + F i ,
a i j = X i j / X j ,
where Xi is the total gross outputs in sector i = 1, …, N; aij are the direct input coefficients that divide Xij, the intermediate demand for sector i from supply sector j by Xj, and Fi is the final demand for products in sector i.
Equation (1) can be rewritten in an abbreviated matrix form as follows:
X = I A 1 F
I is an N × N identity matrix; A is a matrix of input coefficients; and F is a matrix of the final demand for production. (IA)−1 is known as Leontief’s inverse matrix (see [28], p. 21 for details). We used this methodology to examine the economic effects of not only woody biomass power generation but also CEP.
An IO analysis generally requires national IO tables (e.g., [20,21].) However, our analysis focuses on GBP and covers the regional economy. Because the industrial structure of Japan as a whole differs from that of Gifu Prefecture, we use this prefecture’s regional IO table. The regional IO table is the same as the national IO table except that the figures are based on the prefecture for which the table was created. Exports and imports are those based on the prefectural level. Therefore, the regional IO table can capture out-of-prefecture demand but not the ripple effects of out-of-prefecture demand.
In the 2005 Gifu Prefecture IO table, three types of tables were created: an integrated major classification table (34 sectors), an integrated medium classification table (108 sectors), and an integrated minor classification table (190 sectors). In the 34-sector table, “Forestry” is grouped with “Arable Agriculture,” “Livestock,” “Agricultural Services,” and “Fisheries” as “Agriculture, Forestry, and Fisheries.” Meanwhile, in the table of 108 sectors, the forestry sector is listed with the four sectors mentioned above. Therefore, the 34-sector table for “Agriculture, Forestry, and Fisheries” is subdivided into “Forestry,” “Arable Agriculture,” “Livestock Production,” “Agricultural Services,” and “Fisheries” and combined with the 33 sectors other than those in the “Agriculture, Forestry, and Fisheries” sector to create an original 38-sector table. From this table, we derived open inverse matrix coefficients that were then used in the analysis.

2.2. Environmental Effects

CO2 emissions can be estimated using two approaches: a bottom-up approach based on process analysis (PA) and a top-down approach based on environmental input–output (EIO) analysis. PA accumulates CO2 emissions from the processes from production to disposal, whereas EIO calculates CO2 emissions from the entire economic system. Even so, EIO is less accurate than PA. However, the major advantage of an IO analysis approach is that once the model is built, it saves time and labor. Therefore, we adopted EIO to calculate CO2 emissions.
Sectoral CO2 emissions were calculated by multiplying the net economic benefit directly by the unit CO2 emissions. We used the 3EID data from the Japanese IO tables [19]. We assumed that the amount of electricity generated by CEP will decrease as the GBP goes into operation. The economic activity of CEP will be reduced and CO2 emissions will decrease. Consequently, economic activity by the GBP increases CO2 emissions.
Direct unit CO2 emissions vary by sector. The sectoral CO2 emissions for sector i were calculated as follows:
Y i = P E i × u i N E i × u i = E i × u i ,
where Y is sectoral CO2 emissions; PE is the positive effect; NE is the negative effect; E is the net effect, and u is direct unit CO2 emissions. Direct unit CO2 emissions are recorded in the 3EID data. However, given that the Japanese industry is subdivided into 400 sectors, the production value (JPY) and direct CO2 emissions (t-CO2) of the 400 sectors were used to calculate a weighted average (JPY/t-CO2) for each of the 38 sectors, which captured the unit CO2 emissions.
When fuel wood is burned, CO2 previously absorbed by the forest is released. Carbon footprint guidance and many published carbon footprint and life cycle assessments (LCA) assume that biomass fuels are carbon neutral (e.g., [29,30,31]). By contrast, some studies have rejected carbon neutrality for several reasons. For example, Rabl et al. [31], based on the polluter pays principle and the Kyoto protocol that greenhouse gas (positive or negative) contributions should be allocated to those responsible, explicitly stated that emissions and removals occur at each stage of the life cycle of CO2 counting; Johnson [32] proposed a “change in carbon stocks” to capture the state of CO2 more accurately; Bright and Strømman [33] investigated biofuels production from Scandinavian forest resources and their road transport. Mäkipää et al. [34] compared the differences in carbon emissions from various harvesting methods. They suggested that using forest residues for energy production leads to a net increase in carbon emissions. CO2 emissions that occur when electricity is generated from forest residues depend on the residue type, boiler, and power generation efficiency. For additional discussion, see Helin et al. [35].
Considering these factors, the CO2 emissions generated during wood chip combustion were not deemed to be carbon neutral. In this study, the CO2 emissions from wood chip incineration used the weight of O2 stocked in the chips. The O2 weight in the chips varies depending on the tree species. However, we do not know the blending ratio of each tree species. Following Hashimoto and Moriguchi [36], moisture was assumed to account for 10% of the chip weight and was converted to dry weight. The weight of carbon in the chips was calculated by the weight of carbon multiplied by 0.5. Then, to convert the carbon weight to carbon dioxide weight, the weight was multiplied by 44/12 using the following formula:
CO2 weight in chips = chip weight × 0.9 × 0.5 × 44/12
Thereafter, to consider the net CO2 emissions of GBP, CO2 emissions and removals were explicitly counted at each stage of the life cycle. CO2 emissions are also emitted when harvesting wood and transporting wood to chip makers and GBPs. Because CO2 emissions from these sources are unknown, the IO table and 3EID were used to estimate CO2 emissions (timber harvesting is included in the forestry sector, and transport is included in the transportation sector).

3. Materials

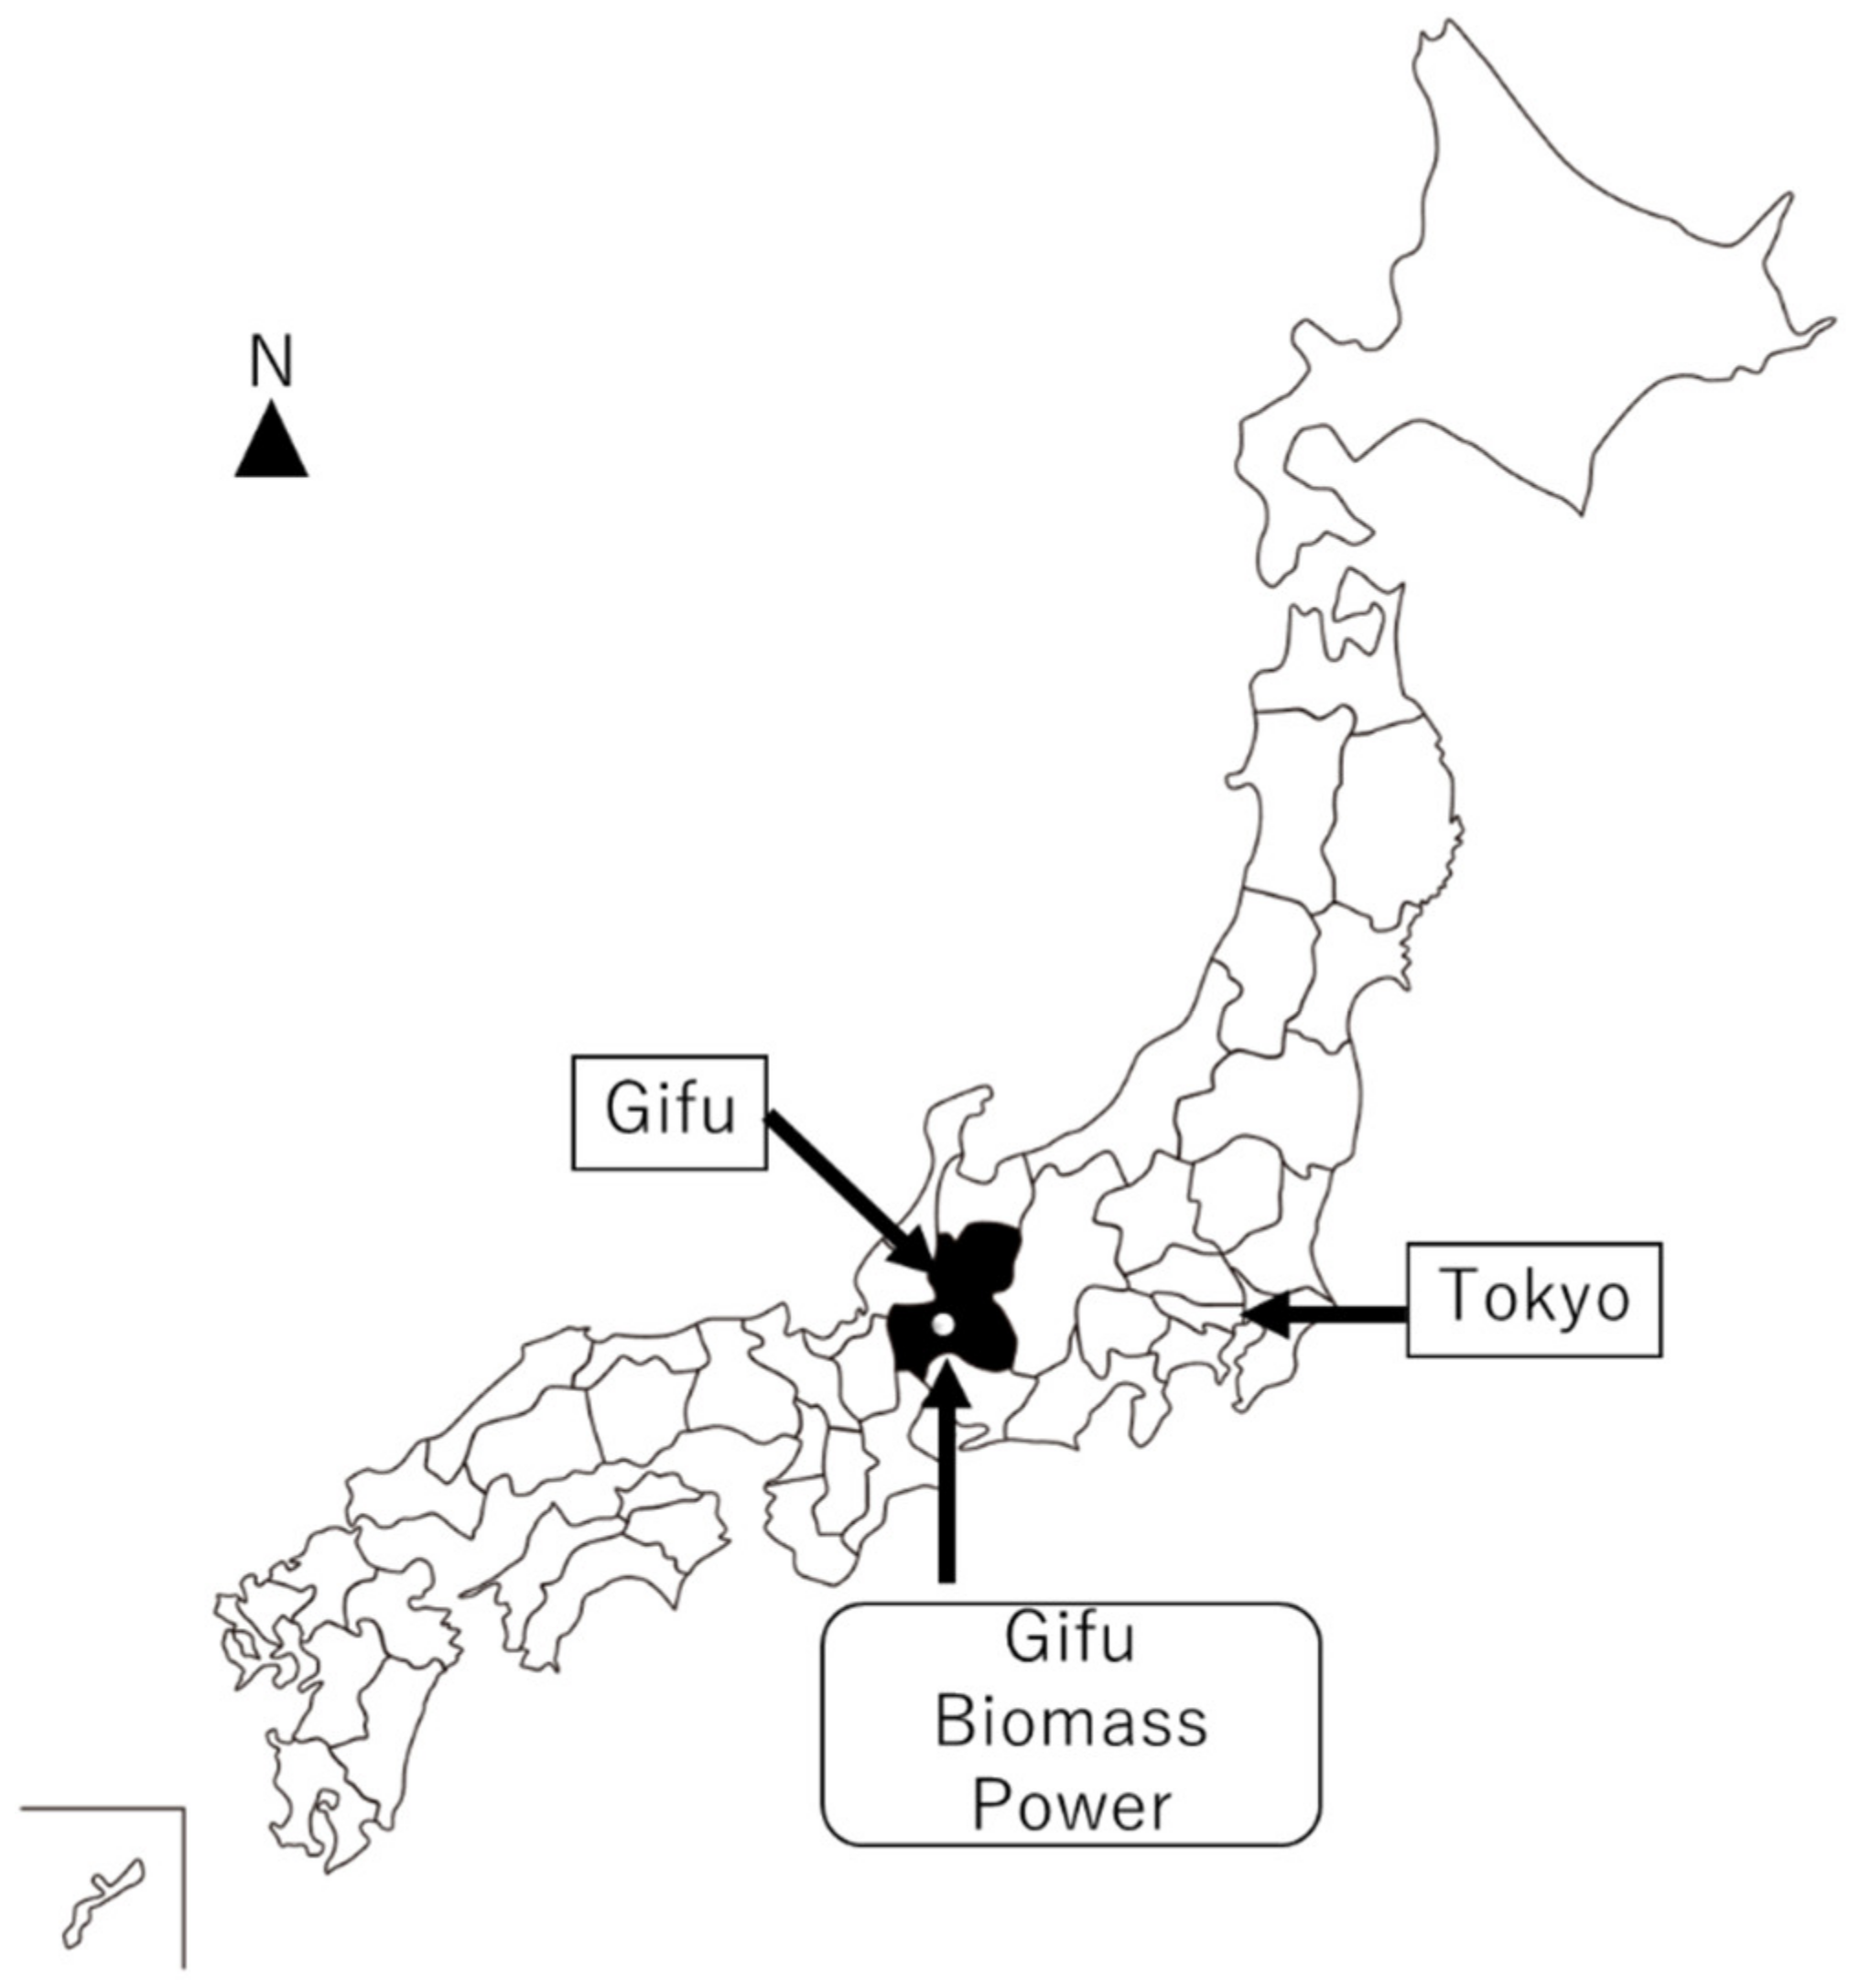
3.1. Gifu Prefecture

Gifu Prefecture is in central Japan (Figure 1) and had a population of 2 million in 2016. The prefecture covers an area of approximately 1 million hectares, of which around 0.86 million hectares are forested. The main tree species are cedar and cypress, and with lumber production reaching 370,000 m3 per year, forestry is one of the most important industries in this prefecture.
There are three woody biomass power generation facilities in the prefecture: One is fueled by wood left over from demolition, another by wood left over from sawmilling, and the third, GBP, uses both woods from forest land and those left over from demolition. Each company consumes a portion of the electricity it generates.

3.2. Gifu Biomass Power Co., Ltd.

Woody biomass power plants are generally located in rural and coastal areas. When forest residues are used, they are expected to be in rural areas, and when imported palm kernel shells are used, they are expected to be in coastal areas.
Mizuho City is in the southern part of Gifu Prefecture and is part of an urban area. The Nagara River and Ibigawa River flow into the surrounding areas, and National Route 21, a major road in Gifu Prefecture, passes through Mizuho City. These conditions are suitable for woody biomass power generation.
The GBP Group consists of two companies: a power generation company (GBP) and a chip company, Biomass Energy Tokai Co., Ltd. (BET); GBP and BET are located at the same site. BET purchases wood residues, demolition residues, and wood chips from the forest, whereas GBP generates 6.25 MWh of electricity, of which 5.40 MWh is sent to CEP. BET and GBP both purchase wood chips from CEP. The plant began commercial operations in December 2014.
The equipment for the power plant was ordered from an out-of-prefecture plant manufacturer for 2.144 billion JPY, while the land preparation and other construction work was ordered from a company within the prefecture for 600 million JPY. The main operating costs are fuel purchases and ash disposal. GBP purchases 86,000 tons of wood chips annually from wood chip companies, including BET (Figure 2). A total of 51,600 tons of thinned wood chips are purchased annually at an average purchase price of 11,300 JPY/ton, and 34,400 tons of demolition wood chips are purchased annually at an average purchase price of 6000 JPY/ton. Demolition debris includes roots and branches of trees cut down for construction work and does not include mill residues. Wood chips derived from forestry are purchased at a ratio of 80% from within the prefecture and 20% from outside the prefecture for construction-derived wood chips. The forestry company belongs to the forestry sector, while the wood chip company belongs to the pulp, paper, and wood products sectors. Fuel purchases amount to 748.2 million JPY from within Gifu Prefecture and 41.28 million JPY outside Gifu Prefecture (Table 1). The amount of ash processed is 5000 tons, and the cost of requesting an out-of-prefecture industrial waste disposal company to process the ash is 75 million JPY (including transportation costs).
The negative economic impact of the GBP is the economic benefit resulting from the reduction in energy production by CEP. Since electricity demand cannot be saved if it remains constant, CEP purchases electricity from renewable energy sources and reduces the amount of electricity it generates. Therefore, using CEP’s 2014 financial report, we assumed that CEP’s expenditures would decrease by 0.032%, which is the ratio of electricity purchased from GBP (43 million kWh) to CEP’s electricity production (134,515 million kWh).

4. Results

4.1. Economic Impact of GBP

We estimated the economic benefits of the construction and operations of the biomass power plant in Gifu. Construction is a one-time event, whereas the operations are continuous. The ripple effect during the construction process was quantified at 1553.34 million JPY within the prefecture (Table S1) and 1898.84 million JPY outside the prefecture (Table S2), for a total of 3452.18 million JPY. The out-of-prefecture spillover effect was larger than the within-prefecture spillover effect.
In analyzing the ripple effects of operational processes, the input coefficients for the pulp, paper, and wood products sectors were modified because this study identified industries that produce wood chips as raw materials. In addition, the distribution of input coefficients was modified so that the total input coefficients remained unchanged. The original input factors were 0.020256 for forestry; 1.100155 for pulp, paper, and wood products; and 0.008573 for construction (Table 2). These numbers were derived assuming a sector that produces raw materials for wood chips. The analysis results for the spillover from BET were 0.128984 for forestry; 1 for pulp, paper, and wood products; and 0 for construction. Similarly, the analysis of spillovers from other chipping firms that produce wood chips from unutilized wood showed 0.128984 for forestry; 1 for pulp, paper, and wood products; and 0 for construction. From other chipping firms that produce wood chips from general wood, the results were 0 for forestry; 1 for pulp, paper, and wood products; and 0.128984 for construction. These changes were applied when calculating the first-order ripple effect, and the usual coefficients were used when calculating the second-order ripple effect. This modification involved several assumptions that need to be verified.
The positive within- (out-of-) prefecture ripple effects from the operations amounted to 1266.35 (146.23) million JPY/year. The negative ripple effects were −1222.97 (−75.23) million within (outside) the prefecture. The net ripple effect of the operations was 43.37 (71) million JPY/year within (outside) the prefecture, for a total of 11,438 million JPY/year, indicating that even if CEP’s power generation decreases, there will be positive economic effects within and outside Gifu Prefecture. Furthermore, the economic effect outside the prefecture was larger than that within the prefecture.

4.2. Environmental Effects

CO2 emissions were calculated by multiplying the economic benefits by the CO2 emissions intensity. CO2 emissions from the construction of the biomass power plant were quantified at 1230.37 t-CO2 within the prefecture and 320.69 t-CO2 outside the prefecture, for a total of 1551.06 t-CO2 (Table 3). Assuming that woody biomass power generation is carbon neutral, the CO2 emissions during operation would be −14,740.61 t-CO2/year within the prefecture and −487.29 t-CO2/year outside the prefecture. However, assuming the project is not carbon neutral, CO2 emissions from wood chip combustion would increase by 141,900 t-CO2/year. Subtracting the emissions, the increase within the prefecture would be 127,159.39 t-CO2/year, and the combined emissions within and outside the prefecture would be 126,672.1 t-CO2/year. Thus, it can be assumed that the GBP will increase CO2 emissions. Given that this situation will continue for 20 years, the total CO2 emissions from the construction and operational processes will amount to 2,534,993.06 t-CO2. The dismantling process of the power plant was not calculated because of the lack of information.

5. Discussion

5.1. Verification of Economic and Environmental Impacts of GBP

Since this study did not assume carbon neutrality, CO2 emissions were calculated as positive for both the construction and operational processes. CO2 emissions increased within the prefecture and decreased outside the prefecture. CO2 is considered to impact climate change no matter where it is generated. However, it can be said that the source of CO2 has shifted from outside the prefecture to inside the prefecture because of the woody biomass power generation. No direct data were available for CO2 absorption by afforestation or forest growth in the forestry sector attributable to GBP; therefore, this was not calculated. However, forests can offset CO2 absorption. Gifu Prefecture’s CO2 emissions were calculated at 15.91 million tons (2018), excluding CO2 derived from wood pellet combustion at woody biomass power plants. Meanwhile, forests absorb 1.32 million tons of CO2 per year (2018) [37]. Although it is possible to consider 140,000 tons/year of CO2 emissions from GBP to be absorbed by forests, it is important to note that woody biomass power generation did not necessarily reduce CO2 emissions in Gifu Prefecture.
Previous studies on woody biomass power generation have estimated the amount of CO2 emissions reduced through such power generation. Japanese woody biomass power producers generally use woody biomass only for power generation, not heat utilization. Thus, there is room for improvement in energy efficiency and economic efficiency. In this regard, GBP considered the possibility of cogeneration (combined heat and power) before the project started, and the decision was made to use only electricity because there was little demand for heat use around GBP, and the costs were expected to be high compared to the income from heat sales. Further studies are needed to determine other costs and the impact of the heat project on the rural economy and the global environment.
Numerous forestry stakeholders in Japan expect significant economic benefits. Notably, as of 2016, Gifu Prefecture had harvested 389,000 m3 of timber, had a gross forestry output of 874 million JPY, and employed 899 people [38]. Conversely, GBP plans to use 51,600 tons of forest residues from within the prefecture. Thus, the net economic impact of forestry is 51.48 million JPY per year. From the IO table, it can be seen that the employment inducement coefficient attributed to the net economic impact of forestry is 0.03 persons per million JPY, so the net economic impact of the forestry industry would have increased employment by 1.56 persons per year. However, the 51,600 tons of forest residues to be processed into chips is equivalent to 103,200 m3 of logs, or 28% of the total timber harvested in Gifu Prefecture. This requires a large amount of labor. Therefore, the input factor from the pulp, paper, and wood products sector to the forestry sector is not fully adjusted, and the input factor may be larger. As such, the economic benefits could be even greater; in addition, the CO2 emissions within Gifu Prefecture could be larger than what has been calculated here.

5.2. Implications for the Promotion of Woody Biomass Generation

Fuel combustion results in CO2 emissions from woody biomass power plants. The raw materials for the fuel in this case study are forest residues and demolition debris. Initially, forest residues were left over after forest harvesting or thinning, rotted over several years, and emitted CO2. This residue was collected and used to generate electricity, resulting in CO2 emissions at the woody biomass power plant. In other words, CO2 emitted by the forestry sector was transferred to the biomass power plant, and CO2 emissions remained the same without the GBP. Demolition debris can be considered in the same way. Demolition debris should have been disposed of and emitted CO2. However, CO2 emissions were assumed to have been emitted when the debris was transferred to a wood biomass power plant. Therefore, it is shortsighted to assume that woody biomass power plants have become a source of CO2 emissions by not assuming carbon neutrality, which states that CO2 emissions from woody biomass power generation are absorbed by the forestry sector. More consideration should be given to including more industrial sectors as well. If wood is harvested for use as fuel for woody biomass power generation, woody biomass power plants can appropriately be viewed as a source of CO2 emissions. These findings suggest that whether forestry is environmentally friendly should be examined. In addition, carbon neutrality and ecosystem, biodiversity, and soil degradation issues must be considered.
Trees grow at different rates depending on species, climate, and land conditions. Therefore, the amount of CO2 absorbed by forests per hectare also varies. Comparing CO2 emissions from woody biomass power generation with CO2 absorption by forests, it should not be assumed that there is only one universal answer to whether a country is carbon neutral. Consideration should be given to each country or region smaller than a country.

6. Conclusions

Using GBP as a case study, this study evaluated, through an inter-industry analysis, the economic and environmental effects of woody biomass power generation without assuming carbon neutrality. From the analysis, the economic impact of GBP was estimated at 1115.39 million JPY per year, and it was thought to generate 1.56 jobs per year in the forestry sector. In addition, CO2 emissions were estimated to increase by 1551.06 t-CO2 during the construction period and 126,672.10 t-CO2 per year during operations. Notably, even though forests may be able to offset CO2 emissions by absorbing CO2, woody biomass power generation does not necessarily reduce CO2 emissions in Gifu Prefecture. It was found that woody biomass power generation is effective for the local economy but not necessarily for the global environment. However, the input coefficients from the pulp, paper, and wood products sector to the forestry sector were not fully adjusted, and the input coefficients may be larger. Therefore, the economic benefits could be even greater, and the CO2 emissions within Gifu Prefecture could also be greater than the results of the calculations here. However, the GBP used forest residues and demolition debris as fuel; even without the GBP, CO2 emissions would have remained the same. This suggests that only the location of the CO2 emissions changed. To clarify the environmental significance of wood biomass power generation without assuming carbon neutrality, more industrial sectors should be included in the analysis.
This study has two limitations. First, the data collection period was short. A longer period of operation would have resulted in changes in prices and power generation, which could have affected the calculations in this study. Second, no analysis has been done on the decommissioning of power plants due to the lack of data. Future studies should address these issues to complete the analysis of the economic and environmental benefits of woody biomass power plants.

Supplementary Materials

The following supporting information can be downloaded at: https://www.mdpi.com/article/10.3390/f14010148/s1, Table S1: Ripple effects in Gifu prefecture (unit: million JPY). Table S2: Ripple effects for areas outside Gifu prefecture (unit: million JPY).

Author Contributions

M.F. analyzed the data and wrote the manuscript. M.H. collected the data. All authors have read and agreed to the published version of the manuscript.

Funding

This research was financially supported by the Japan Society for the Promotion of Science KAKENHI Grant Number JP 20H00435.

Data Availability Statement

Not applicable.

Acknowledgments

Data used in this paper were provided by Gifu Biomass Power Co., Ltd.

Conflicts of Interest

The authors declare no conflict of interest.

References

  1. NewClimate Institute; Oxford Net Zero; Energy & Climate Intelligence Unit; Data-Driven EnviroLab. Net Zero Stocktake 2022: Assessing the Status and Trends of Net Zero Target Setting. Available online: https://zerotracker.net/analysis/net-zero-stocktake-2022 (accessed on 4 November 2022).
  2. Camia, A.; Giuntoli, J.; Jonsson, K.; Robert, N.; Cazzaniga, N.; Jasinevičius, G.; Valerio, A.; Grassi, G.; Barredo Cano, J.I.; Mubareka, S. The Use of Woody Biomass for Energy Production in the EU; EUR 30548 EN; Publications Office of the European Union: Luxembourg, 2020; p. 182. [Google Scholar] [CrossRef]
  3. García-Alvarez, M.T.; Mariz-Pérez, R.M. Analysis of the success of feed-in tariff for renewable energy promotion mechanism in the EU: Lessons from Germany and Spain. Procedia-Soc. Behav. Sci. 2012, 65, 52–57. [Google Scholar] [CrossRef] [Green Version]
  4. ERIA Study team. Biomass power generation and wood pellets in Japan. In Forecast of Biomass Demand Potential in Indonesia: Seeking a Business Model for Wood Pellets; ERIA Research Project Report FY2022; ERIA, Ed.; Economic Research Institute for ASEAN and East Asia: Jakarta, Indonesia, 2022; pp. 29–45. [Google Scholar]
  5. Levinson, R. The Growing Importance of PKS in the Japanese Biomass Market. Available online: https://biomassmagazine.com/articles/16690/the-growing-importance-of-pks-in-the-japanese-biomass-market (accessed on 4 November 2022).
  6. Crawford, R.H. Life cycle energy and greenhouse emissions analysis of wind turbines and the effect of size on energy yield. Renew. Sust. Energ. Rev. 2009, 13, 2653–2660. [Google Scholar] [CrossRef]
  7. Guo, J.; Zou, L.-L.; Wei, Y.-M. Impact of inter-sectoral trade on national and global CO2 emissions: An empirical analysis of China and US. Energy Policy 2010, 38, 1389–1397. [Google Scholar] [CrossRef]
  8. Lindner, S.; Legault, J.; Guan, D. Disaggregating the electricity sector of China’s input–output table for improved environmental life-cycle assessment. Econ. Syst Res. 2013, 25, 300–320. [Google Scholar] [CrossRef]
  9. Nakano, S.; Arai, S.; Washizu, A. Economic impacts of Japan’s renewable energy sector and the feed-in tariff system: Using an input–output table to analyze a next-generation energy system. Environ. Econ. Policy. Stud. 2017, 19, 555–580. [Google Scholar] [CrossRef] [Green Version]
  10. Coffman, M.; Bernstein, P.; Wee, S.; Schafer, C. Economic and GHG impacts of natural gas for Hawaii. Environ. Econ. Policy Stud. 2017, 19, 519–536. [Google Scholar] [CrossRef]
  11. Yamazaki, M.; Takeda, S. A computable general equilibrium assessment of Japan’s nuclear energy policy and implications for renewable energy. Environ. Econ. Policy. Stud. 2017, 19, 537–554. [Google Scholar] [CrossRef]
  12. Cristóbal, S.; Ramón, J. Effects on the economy of a decrease in forest resources: An international comparison. For. Policy Econ. 2007, 9, 647–652. [Google Scholar] [CrossRef]
  13. Nakamura, R.; Ishikawa, Y.; Matsumoto, A. Endogenous correction of regional economic disparities by making use of regional environmental resources (wooden biomass) extension of inter-regional input-output model. Input-Output Anal. 2012, 20, 228–242. [Google Scholar] [CrossRef]
  14. Hendricks, A.M.; Wagner, J.E.; Volk, T.A.; Newman, D.H. Regional economic impacts of biomass district heating in rural New York. Biomass Bioenergy 2016, 88, 1–9. [Google Scholar] [CrossRef]
  15. De, S.; Assadi, M. Impact of cofiring biomass with coal in power plants–A techno-economic assessment. Biomass Bioenergy 2009, 33, 283–293. [Google Scholar] [CrossRef]
  16. Banerjee, S.; Bit, J. Economic growth versus climate balancing: Some reflections on the sustainable management of forest resource in India. Decision 2015, 42, 127–145. [Google Scholar] [CrossRef]
  17. Madlener, R.; Koller, M. Economic and CO2 mitigation impacts of promoting biomass heating systems: An input–output study for Vorarlberg, Austria. Energy Policy 2007, 35, 6021–6035. [Google Scholar] [CrossRef]
  18. Haddad, S.; Britz, W.; Börner, J. Economic impacts and land use change from increasing demand for forest products in the European bioeconomy: A general equilibrium based sensitivity analysis. Forests 2019, 10, 52. [Google Scholar] [CrossRef] [Green Version]
  19. National Institute for Environmental Studies. Embodied Energy and Emission Intensity Data for Japan Using Input-Output Tables. Available online: https://www.cger.nies.go.jp/publications/report/d031/eng/index_e.htm (accessed on 4 November 2022).
  20. Washizu, A.; Nakano, S.; Asakura, K.; Takase, K.; Furukawa, T.; Arai, S.; Hayashi, K.; Okuwada, K. Economic and Environmental Impact Analysis for Construction of Renewable Energy Power Plants by Extended Input-Output Table; National Institute of Science and Technology Policy: Tokyo, Japan, 2013; p. 56.
  21. Moriizumi, Y.; Hondo, H.; Nakano, S. Development and application of renewable energy-focused input-output table. J. Jpn. Inst. Energy 2015, 94, 1397–1413. [Google Scholar] [CrossRef] [Green Version]
  22. Nishiguchi, S.; Tabata, T. Assessment of social, economic, and environmental aspects of woody biomass energy utilization: Direct burning and wood pellets. Renew. Sust. Energ. Rev. 2016, 57, 1279–1286. [Google Scholar] [CrossRef]
  23. Hayashi, T.; Sawauchi, D.; Kunii, D. Forest maintenance practices and wood energy alternatives to increase uses of forest resources in a local initiative in Nishiwaga, Iwate, Japan. Sustainability 2017, 9, 1949. [Google Scholar] [CrossRef] [Green Version]
  24. Nakano, S.; Murano, A.; Washizu, A. Economic and environmental effects of utilizing unused woody biomass. J. Jpn. Inst. Energy 2015, 94, 522–531. [Google Scholar] [CrossRef] [Green Version]
  25. Tabata, T.; Okuda, T. Life cycle assessment of woody biomass energy utilization: Case study in Gifu Prefecture, Japan. Energy 2012, 45, 944–951. [Google Scholar] [CrossRef]
  26. Matsuoka, Y.; Shirasawa, H.; Hayashi, U.; Aruga, K. Annual availability of forest biomass resources for woody biomass power generation plants from subcompartments and aggregated forests in Tohoku Region of Japan. Forests 2021, 12, 71. [Google Scholar] [CrossRef]
  27. Leontief, W.W. Quantitative input and output relations in the economic systems of the United States. Rev. Econ. Stat. 1936, 18, 105–125. [Google Scholar] [CrossRef] [Green Version]
  28. Miller, R.E.; Blair, P.D. Input-Output Analysis: Foundations and Extensions, 2nd ed.; Cambridge University Press: Cambridge, UK, 2009. [Google Scholar]
  29. Penman, J.; Gytarsky, M.; Hiraishi, T.; Krug, T.; Kruger, D.; Pipatti, R.; Buendia, L.; Miwa, K.; Ngara, T.; Tanabe, K. Good Practice Guidance for Land Use, Land-use Change and Forestry; Institute for Global Environmental Strategies (IGES) for IPCC: Kanagawa, Japan, 2003. [Google Scholar]
  30. Intergovernmental Panel on Climate Change. 2006 IPCC Guidelines for National Greenhouse Gas Inventories. Vol. 4. Agriculture, Forestry and Other Land Use. Available online: https://www.ipcc-nggip.iges.or.jp/public/2006gl/index.html (accessed on 4 November 2022).
  31. Rabl, A.; Benoist, A.; Dron, D.; Peuportier, B.; Spadaro, J.V.; Zoughaib, A. How to account for CO2 emissions from biomass in an LCA. Int. J. Life Cycle Assess 2007, 12, 281. [Google Scholar] [CrossRef]
  32. Johnson, E. Goodbye to carbon neutral: Getting biomass footprints right. Environ. Impact Assess. Rev. 2009, 29, 165–168. [Google Scholar] [CrossRef]
  33. Bright, R.M.; Strømman, A.H. Fuel-mix, fuel efficiency, and transport demand affect prospects for biofuels in Northern Europe. Environ. Sci. Technol. 2010, 44, 2261–2269. [Google Scholar] [CrossRef]
  34. Mäkipää, R.; Linkosalo, T.; Komarov, A.; Mäkelä, A. Mitigation of climate change with biomass harvesting in Norway spruce stands: Are harvesting practices carbon neutral? Can. J. For. Res. 2015, 45, 217–225. [Google Scholar] [CrossRef]
  35. Helin, T.; Sokka, L.; Soimakallio, S.; Pingoud, K.; Pajula, T. Approaches for inclusion of forest carbon cycle in life cycle assessment—A review. GCB Bioenergy 2013, 5, 475–486. [Google Scholar] [CrossRef]
  36. Hashimoto, S.; Moriguchi, Y. Data Book: Material and Carbon Flow of Harvested Wood in Japan; CGER-D034-2004; Center for Global Environmental Research: Tsukuba, Japan, 2004; p. 119.
  37. Gifu Prefecture. Total Greenhouse Gas Emissions in Gifu Prefecture. Available online: https://www.pref.gifu.lg.jp/page/3643.html (accessed on 4 November 2022).
  38. Gifu Prefecture. Gifu Prefecture Forest and Forestry Statistics 2017. Available online: https://www.pref.gifu.lg.jp/uploaded/attachment/4934.pdf (accessed on 4 November 2022).
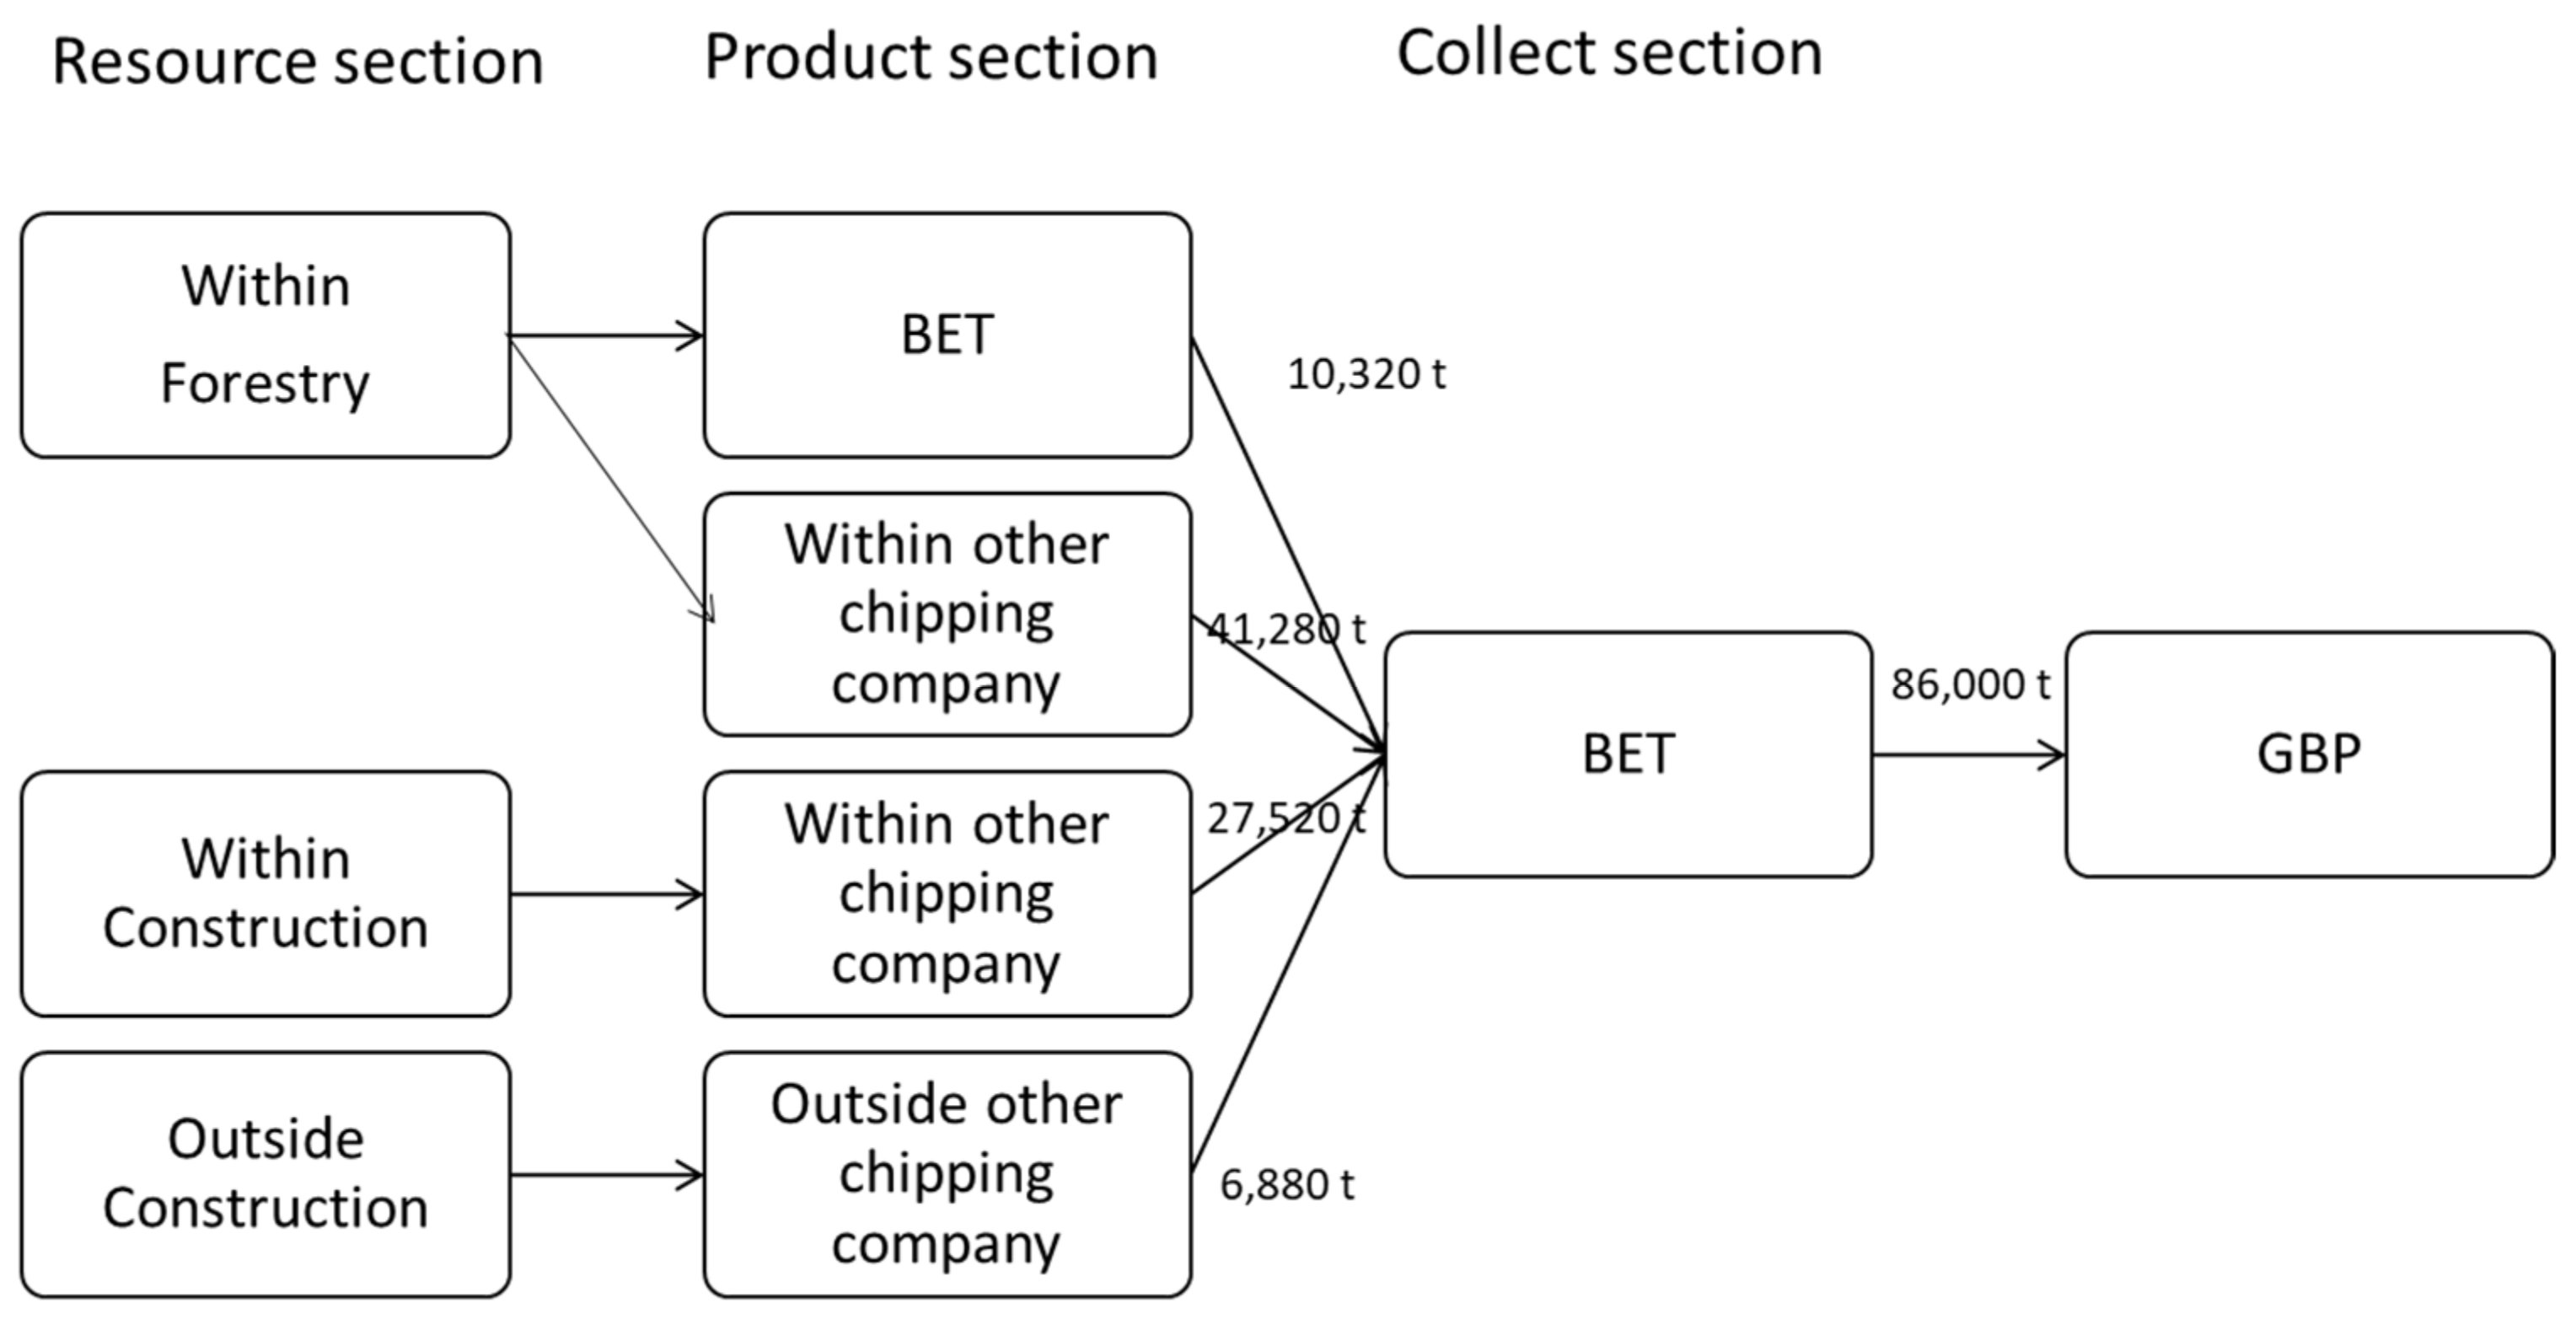
Figure 1. Map of Gifu Biomass Power Co., Ltd.; Gifu Prefecture, where Gifu Biomass Power Co., Ltd. Is located, is in the center of Japan.
Forests 14 00148 g001
Figure 2. The flow of materials. Gifu Biomass Power Co., Ltd. (GBP) purchases 86,000 tons of wood chips annually from wood chip companies, including Biomass Energy Tokai Co., Ltd. (BET).
Forests 14 00148 g002
Table 1. Fuel purchase amounts (purchase price).
Wood ChipsPurchases
(t)
Average Purchase Price Excluding
Transfer Fee
(JPY/t)
Fuel Purchase Amounts from Gifu
(Million JPY)
Fuel Purchase Amounts from
Outside of Gifu
(Million JPY)
Materials from forestry51,60011,300583.080.00
to BET10,320-116.620.00
to other chipping companies within Gifu41,280-466.460.00
Materials from construction34,4006000165.1241.28
to other chipping companies within Gifu27,520-165.120
to other chipping companies outside Gifu6880-041.28
Amount86,000-748.2041.28
Note: Source: Gifu Biomass Power Co., Ltd.
Table 2. Input coefficients.
SectorOriginalBETOther Chipping Company
Unused WoodUnused WoodGeneral Wood
Forestry0.0202560.1289840.1289840
Pulp, paper, and wood products1.100155111
Construction0.008573000.128984
Table 3. CO2 emission caused by economic effects with carbon neutrality (unit: t-CO2).
PlacePhaseCO2 Emissions
WithinConstruction1230.37
Operations−14,740.61
 —from GBP 11874.39
 —from CEP 2−16,614.99
OutsideConstruction320.69
Operations−487.29
 —from GBP 1315.15
 —from CEP 2−802.44
1 Gifu Biomass Power Corporation; 2 Chubu Electric Power Co., Inc.
Disclaimer/Publisher’s Note: The statements, opinions and data contained in all publications are solely those of the individual author(s) and contributor(s) and not of MDPI and/or the editor(s). MDPI and/or the editor(s) disclaim responsibility for any injury to people or property resulting from any ideas, methods, instructions or products referred to in the content.

