
Investigation on Cutting Power of Wood–Plastic Composite Using Response Surface Methodology
by
 , and
, and
Wangyu Xu
1,2,†,
Zhanwen Wu
3,†,
Wei Lu
1,2,
Yingyue Yu
1,2,
Jinxin Wang
3,
Zhaolong Zhu
1,2,* and
Xiaodong Wang
4 1
Co-Innovation Center of Efficient Processing and Utilization of Forest Resources, Nanjing Forestry University, Nanjing 210037, China
2
College of Furnishings and Industrial Design, Nanjing Forestry University, Nanjing 210037, China
3
College of Materials Science and Technology, Nanjing Forestry University, Nanjing 210037, China
4
Department of Wood and Forest Sciences, Laval University, Quebec City, QC G1V 0A6, Canada
*
Author to whom correspondence should be addressed.
†
These authors contributed equally to this work.
Forests 2022, 13(9), 1397; https://doi.org/10.3390/f13091397
Submission received: 7 August 2022
/
Revised: 27 August 2022
/
Accepted: 29 August 2022
/
Published: 31 August 2022
(This article belongs to the Section Wood Science and Forest Products)
Abstract
:For the sake of improving the benefit of enterprise by reducing energy waste. RSM (response surface methodology) was used to investigated the cutting power of wood–plastic composite at different cutting conditions (rake angle, cutting speed, depth of cut, and flank wear). Based on the experimental results, a cutting power model with a high degree of fitting was developed, which can be used to predict cutting power and optimal cutting conditions. Meanwhile, the effects of rake angle, cutting speed, depth of cut, and flank wear and their interaction on the cutting power were probed by analysis of variance, and the significant terms were determined. Finally, the optimal cutting condition was obtained as follows: rake angle of 10°, cutting speed of 300 m/min, depth of cut of 1.5 mm, and flank wear of 0.1 mm. This parameter combination is suggested to be used for industrial manufacturing of wood–plastic composite in terms of the incredible machining efficiency and the lowest energy consumption.
1. Introduction
Wood–plastic composite (WPC) is a recyclable and environmentally friendly material, which is made of wood powder and thermoplastic [1,2]. Due to the high corrosion resistance and low manufacturing costs, WPC has wide application in the furniture items, such as outdoor floor, guard bar, table board, window and door frames, etc. [3,4].
Taking WPC floorings as an example, in China, the sales volume of WPC flooring reached 79 million m2 in 2021 [5]. Facing such huge product demand, the point of increasing the enterprise benefits hinges on improving the efficiency of machine tools and reducing energy consumption [6,7]. However, in actual production, due to the lack of theoretical guidance, WPC manufacturers still follow the traditional wood processing technology. Due to the different material structures of WPC and wood, the choice of their optimal cutting parameters is also different, which leads to the high energy consumption of products [8]. Therefore, how to select cutting parameters suitable for WPC processing is an important way to improve enterprises [9].
Machining is an essential process for WPC products [10]. Improving the machine tool’s energy utilization rate and machining efficiency is critical for economizing the production cost [11,12]. To increase cutting efficiency, there must be greater improvement of the all-aspect processes affected. Changes in cutting powers of Pine and Beech wood were predicted by Chuchala et al., using four different methods [13], and their work indicated that the uncut chip thickness has positive impact on the cutting power. The cutting power of the motor during the processing of WPC was developed by Shi et al. [14], who found that the cutting power positively increases with the feed rate and cutting speed. Cutting power for prismatic machining features was studied by Wang et al. [15], and a cutting power model was established; they found that a zigzag is the most energy-efficient tool path. In a related experiment, Guedes et al. [16] studied the variation of energy consumption during harvesting wood machining at different harvest densities and moisture content, and the results showed that the cutting power of machine tool increase with the wood density. Furthermore, the sawing condition including feed speed, spindle speed, depth of cut, and average chip thickness effect on cutting power during processing of wood were investigated, and a related report showed that cutting power shows an increasing trend with the feed rate. In general, the cutting power was affected by many factors, including cutting parameters, material property, and tool geometry [17].
Response surface methodology (RSM) [18], which is a multiple regression model statistical experiment design method, usually used to evaluate the factors affecting response results and their interactions by the analysis of the established continuously variable surface model [19]. Therefore, traces of it can often be found in data analysis papers of various disciplines [20]. Melo et al. [21] studied the cutting power of the boards of Pinus taeda by using RSM, and the optimal conditions for low power consumption were determined by mean squared error. In a related search, the change in cutting power was studied by Li et al., using RSM during helical milling of medium density fiberboard [22] and particle board [23]; a mathematical model of cutting power was developed, which can used to for the prediction of cutting power and optimal milling parameters.
To this end, an up-milling experiment was conducted by cemented carbide cutters, and RSM was adopted to investigate the cutting power of WPC affected by different cutting conditions, including rake angle, cutting speed, depth of cut, and flank wear; predominantly, the present paper aims to provide scientific guidance for WPC industrial machining.
2. Materials and Methods
2.1. Materials
WPC pieces, mainly made of polyvinyl chloride and wood fiber at a ratio of 6:4, were used in this experiment, they were manufactured by Anhui Kojo New Materials Co., Ltd. (Anhui, China), and their dimensions were 400 mm (L) × 150 mm (W) × 8 mm (T). The material properties are given in Table 1. Furthermore, cemented carbide cutters with a constant diameter of 12 mm were used, which were manufactured by Bosun Prewi Tool System Co., Ltd. (Shanghai, China), and their tool geometry and properties are listed in Table 2.
2.2. Experiment Equipment
As given in Figure 1a, a high-speed machining center with maximum spindle motor power of 8.1 kW (MGK01, Nanxing furniture equipment manufacturing Co., Ltd., Dongguan, China) was adopted in this work. A high precision three-phase power measuring instrument made by Ainuo Intelligent Instrument Co., Ltd. (AN87300, Qingdao, China) was applied to acquire the cutting power at different conditions (Figure 1b).
2.3. Experiment Design
Table 3 shows the RSM experimental design with Box–Behnken model, and it was conducted by the Design-Expert (Figure 1c, Version 12, Stat-Ease, Inc., Minneapolis, MN, USA) to establish the relationship between cutting parameters and cutting power [24]. Compared to the standard experimental design set, as the axial point testing scheme does not exist, fewer experiments can be carried out. There are 25 groups in this experiment, and the cutting variables included rake angle γ (2°, 6° and 10°), cutting speed vc (300 m/min, 350 m/min and 400 m/min), depth of cut ap (0.5 mm, 1.0 mm and 1.5 mm), and flank wear VB (0.1 mm, 0.2 mm and 0.3 mm); the response result is the cutting power P in W.
As shown in Figure 2, the values of the tool angle and flank wear were measured by a high-definition microscope (ZW-H1600) with a coordinate system in the instrument software. The cutting speed and depth of cut were determined by the numerical control program of the machining center; the former was set by the spindle speed and the latter was set by the distance between each cut.
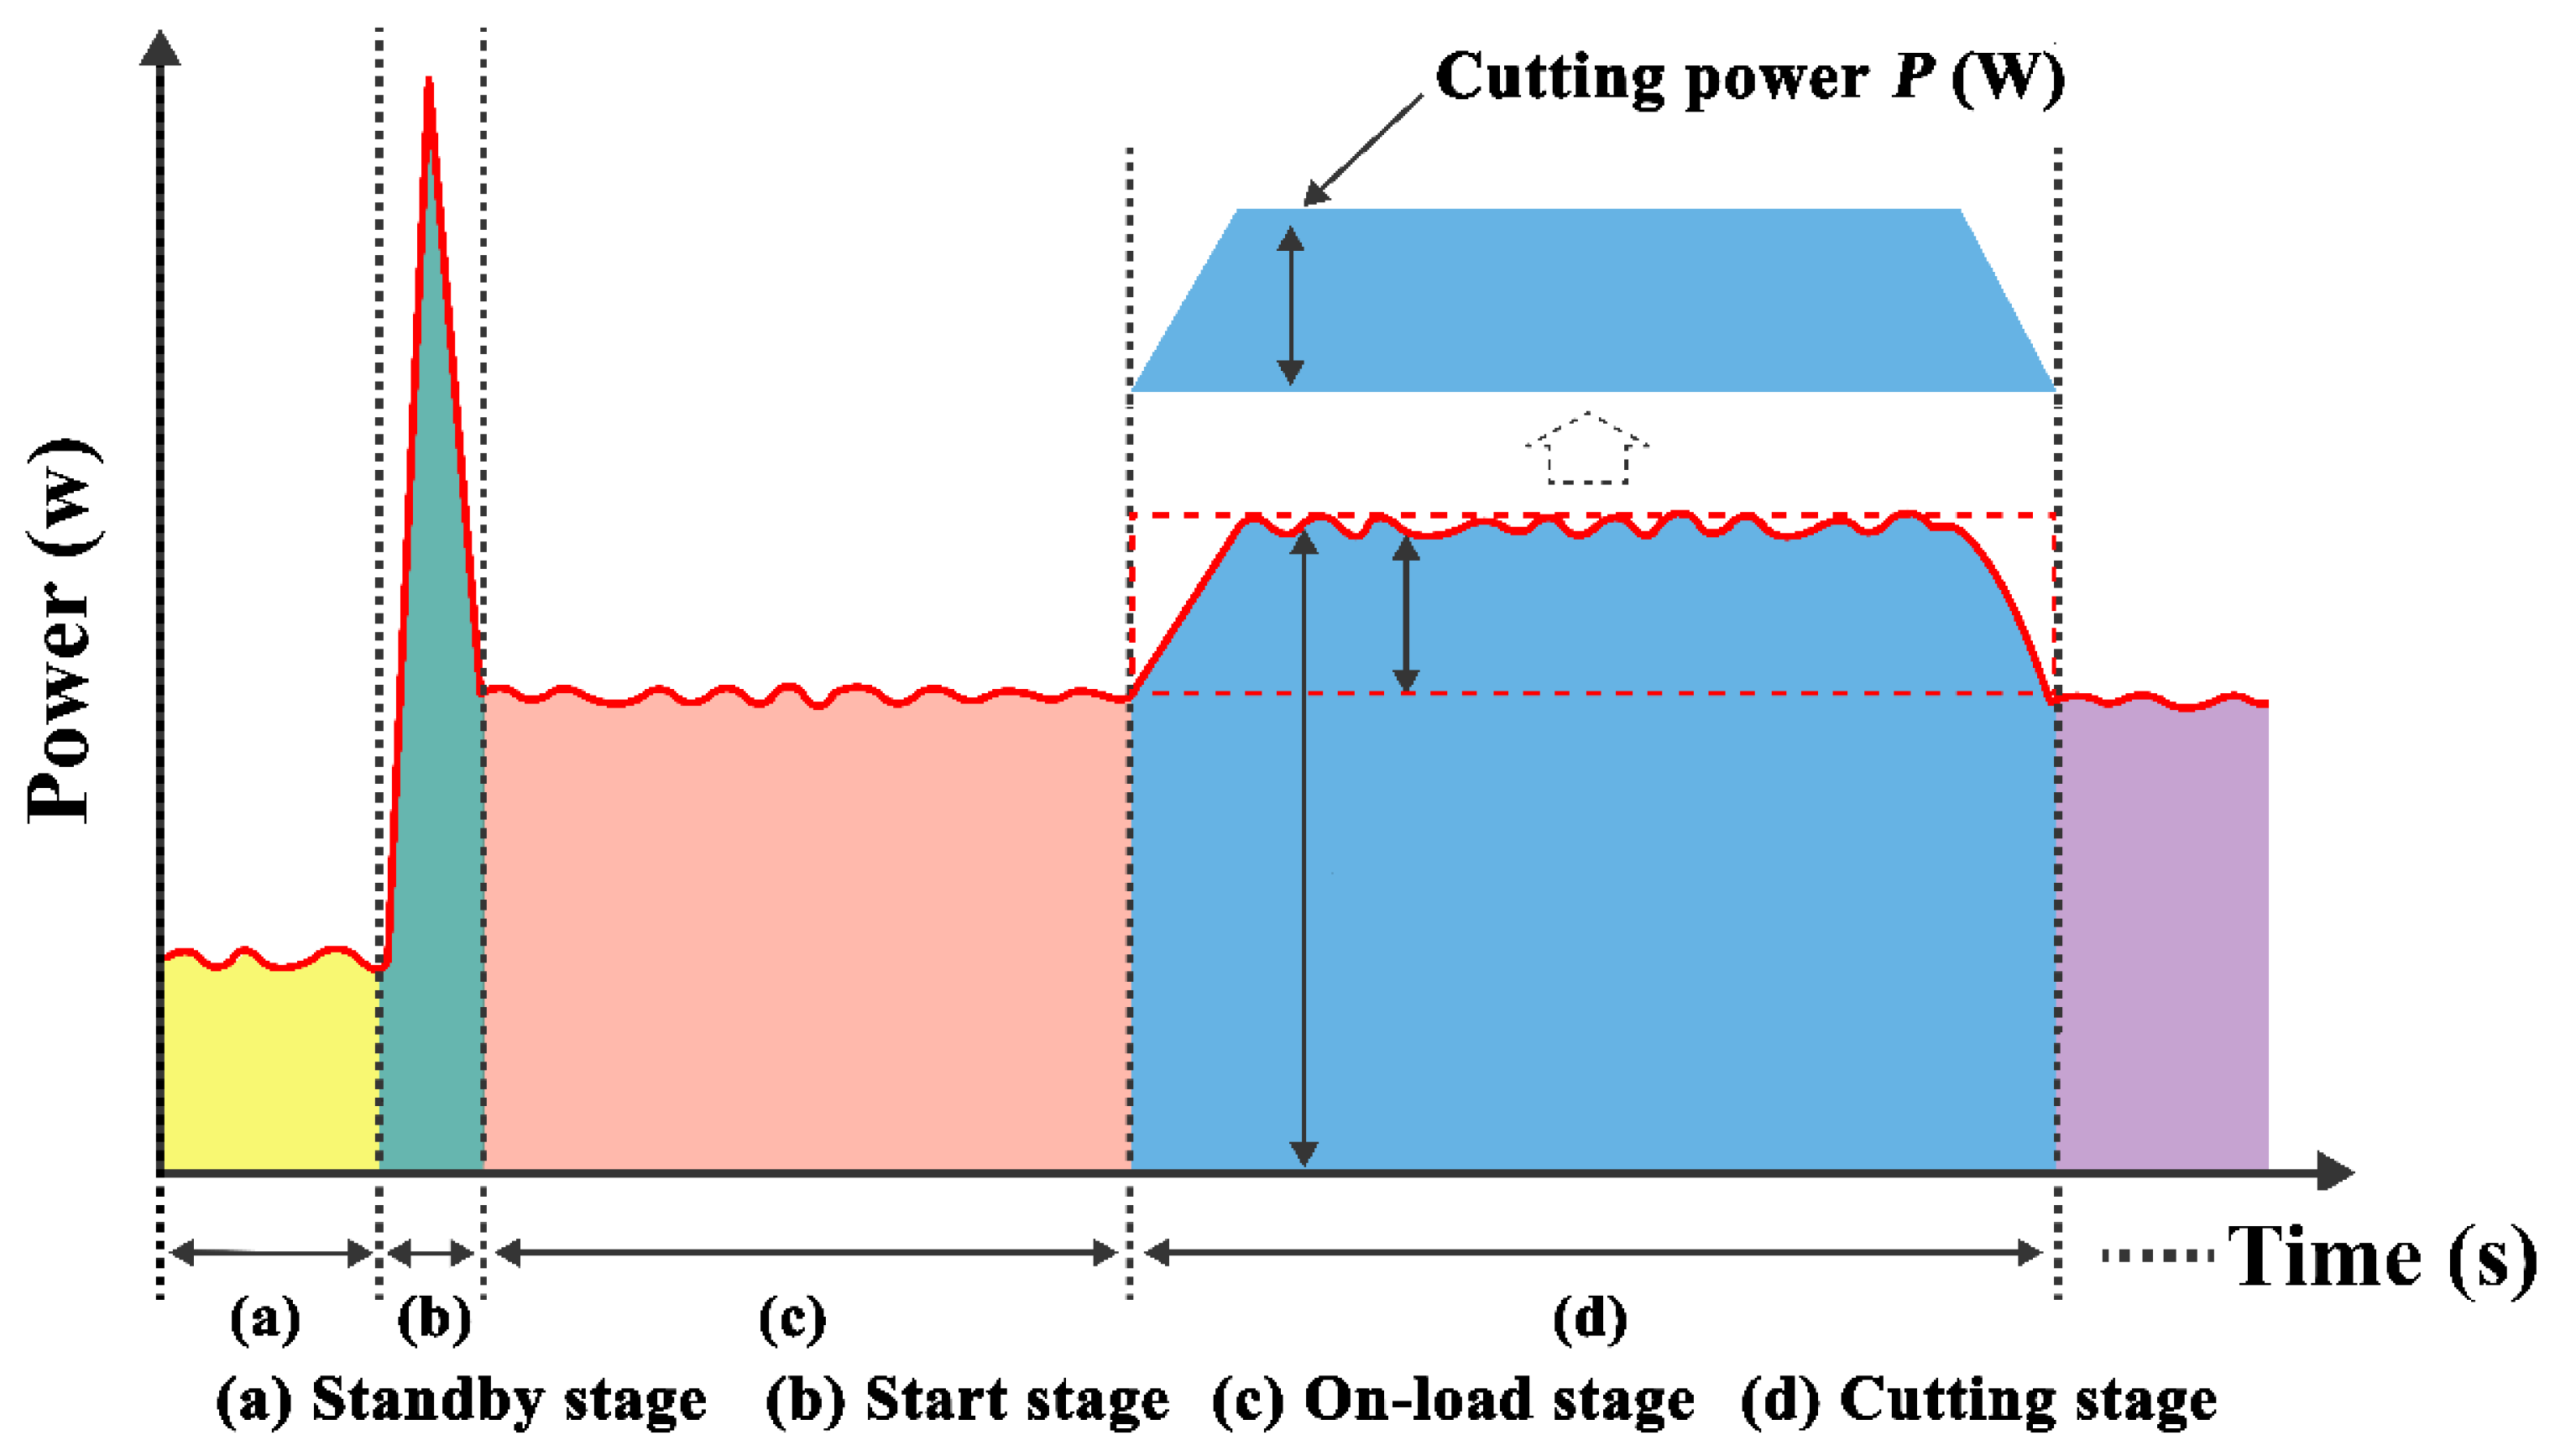
As given in Figure 3, the whole cutting process can be divided into the following stages: standby stage, start stage, no-load stage, cutting stage [25]. In this work, the dynamic power during cutting was in focus, which was acquired by a high precision three-phase power measuring instrument with frequency of 50 Hz; the result was obtained based on the average value from five repeated tests.
3. Results and Discussion
3.1. Cutting Power Regression Model
According the experimental data in Table 3, an RSM model of the cutting power was developed, as shown in Equation (1):
where P is the cutting power in W, γ is the rake angle of cutting tool (2~10°), vc is the cutting speed (300~400 m/min), ap is the depth of cut (0.5~1.5 mm), and VB is the wear degree of flank face of tool (0.1~0.3 mm).
Table 4 is the fit statistics for the cutting power model; the values of R2, Adjusted R2, and Predicted R2 are equal to 0.98, 0.96, and 0.91, respectively, which were all closed to 1. Meanwhile, the deviation is less than 0.2 between the predicted R² of 0.91 and the adjusted R² of 0.96, which is in reasonable agreement. Those results indicated that the cutting power model had reasonable agreement. Furthermore, the values of Std. Dev. And C.V.% were 3.93 and 5.79, respectively, and are, thus, both at a low level, thereby proving that the model had fit well. Finally, Figure 4 displays the actual and predicted point values; no abnormal point was observed. Thus, above all, the devolved model is suitable for the analysis of the cutting power in the processing of WPC [26], and for the prediction of cutting power and the optimize selection for cutting conditions.
3.2. Influence of Cutting Conditions on Cutting Power
The effect of the cutting parameters on the cutting power is displayed in Figure 5, the reference point of −1 was a rake angle of 2°, cutting speed of 300 m/min, depth of cut of 0.5 mm, and flank wear of 0.1 mm; the reference point of 0 was a rake angle of 6°, cutting speed of 350 m/min, depth of cut of 1.0 mm, and flank wear of 0.2 mm; and the reference point of 1 was a rake angle of 10°, cutting speed of 400 m/min, depth of cut of 1.5 mm, and flank wear of 0.3 mm. It can be found that the cutting power is negatively correlated with the rake angle, but positively correlated with other three factors, including cutting speed, depth of cut, and flank wear. In related work, with the aim of exploring the wood-based panel’s mechanical properties during shredding, the cutting and elasticity coefficients with particle board, oriented strand boards, and medium-density fiberboard were explored by Kukla and Wargula [27] at different cutting conditions of blade geometries and cutting depth. In the selected cutting parameters, cutting depth plays a crucial positive role in affecting the cutting force. As given in Equation (2) [22], it can be inferred that the cutting power positive correction with the cutting depth:
where P is the cutting power, Fxo is the cutting force, vc is the cutting speed, p′ is the unit cutting force, b is the width of cut, ap is the depth of cut, and f is the speed of feed. The effect of the cutting speed on the cutting power was proportional to the cutting force. Thus, the increase of the rake angle resulted in a reduction of the cutting power.
Wargula and Kukla [28] and Orlowski et al. [29] explored the relationship between the rotation speed and cutting power in their work; similarly, they found that the cutting power, not only theoretical but also practical, will increase with the increased rotation speed if other cutting parameters are fixed. Additionally, in the present paper, this trend still holds. In the case of a certain diameter of the tool, a larger cutting speed requires a higher spindle speed, i.e., the machine provides higher power, so the cutting power was positively related to the cutting speed.
Finally, it can be also obtained from Figure 5 that the cutting power increased with the increase of the wear of the flank face. The greater the degree of flank wear, the larger the blunt arc radius of the tool, and consequently, the cutting edge becomes blunt. At this stage, there is a higher resistance coefficient between the workpieces and the cutting edge when the unneeded material removed by the cutting edge, Thus, the cutting power showed an increased trend.
3.3. Analysis of Variance for Cutting Power
An essential step before analysis of variance (ANOVA) for a model is to check the normal distribution of the data, especially when the amount of data is small. When the data are normally distributed, a Student’s t-test is justified, i.e., the ANOVA is convincing. Figure 6a is the normal distribution of result data, the effective data points are concentrated within the setting range, i.e., the data have the characteristics of normal distribution. Meanwhile, it can be obtained from Figure 6b that the predicted data correspond to the residuals in a scattered and irregular way. Thus, the ANOVA and prediction of results are meaningful.
Results of the ANOVA for cutting power are given in Table 5; a significance level of 5% was adopted [30], i.e., if the p-value of a terms was less than 0.05, this term can be donated as significant, and otherwise, insignificant [31]. In this model, the F-value is equal to 57.93, along with a p-value lower than 0.05, which implies the model is significant. The F-value reflects that there is a 0.01% chance affected by noise. Furthermore, the p-values of terms, including γ, vc, ap, VB, γ × VB, vc × ap and ap × VB, are lower than that 0.05; hence, it can be obtained that those terms had significant contribution to the cutting power. However, the values of terms including γ × vc, γ × ap, vc × VB, γ2, vc2, ap2, and VB2 are higher than 0.05; thus, those terms had an minsignificant effect on the results of the cutting power. Besides, the F-value and p-value for the lack of fit were equal to 1.92 and 0.28, respectively, which suggested that the lack of fit is not significantly relative to the pure error. There is a 0.05% chance that a lack of fit F-value is affected by noise. A non-significant lack of fit proves that there was goodness of fit.
Figure 7 shows the 3D response surface maps and contour maps displaying the interaction of the cutting conditions on the cutting power. Based on the rank of linear terms and ANOVA results in Table 5, it can be found that the depth of cut had the greatest impact on the cutting power, followed by flank wear, cutting speed, and rake angle of the cutting tool, i.e., the rank of quadratic terms influence on cutting power is as follow: ap > VB > vc > γ. Furthermore, according to the density of contour and ANOVA results in Table 5, the interaction of rake angle and cutting speed had insignificant impact on the cutting power, and the cutting speed mainly affected cutting power in the interaction of the rake angle and cutting speed (Figure 7a). The interaction of the rake angle and depth had insignificant influence on the cutting power, and the depth of cut mainly affected the cutting power in the interaction of rake angle and depth of cut (Figure 7b). The interaction of the rake angle and flank wear had a significant impact on the cutting power, and the flank wear mainly affected the cutting power in the interaction of rake angle and flank wear (Figure 7c). The interaction of the cutting speed and depth of cut also had a significant effect on the cutting power, and the depth of cut mainly affected the cutting power in the interaction of the cutting speed and depth of cut (Figure 7d). The interaction of the cutting speed and flank wear had an insignificant influence on the cutting power, and the cutting power was mainly affected by the flank wear in the interaction of the cutting speed and flank wear (Figure 7e). The interaction of the depth of cut and flank wear have a significant influence on the cutting power, and the cutting power was mainly influenced by the depth of cut in the interaction of the depth of cut and flank wear (Figure 7f).
3.4. Optimization and Verification of High Efficiency and Low Consumption Machining
In the industrial production, the cutting efficiency is one of the key factors that affect the enterprise benefit. Hence, for the sake of higher cutting efficiency of WPC, the material removal rate was focused on, and it can be obtained with Equation (3) [23]:
where MRR is the material removal rate in mm3/s, V represents the bulk volume of the removed material in mm3, t is the time of cut in s, l is the cutting length in mm, ap is the depth of cut in mm, δ is the cutting depth in mm, and f is the feed rate in mm/s. In this experiment, the feed speed is fixed at 5 m/s and the cutting thickness is 5 mm, while the material removal rate is proportional to the cutting depth.
In order to determine the cutting condition with high efficiency and low consumption [32]. Based on the cutting power model of Equation (1), Design-Expert was applied to analyze the selection of rake angle, cutting speed, cutting depth, and flank wear. The range of the rake angle is set between 2–10°, the range of the cutting speed is set between 300–400 m/min, and the range of tool wear is set between 0.1–0.3 mm, while the depth of cut was set to a maximum of 1.5 mm for the highest cutting efficiency. Figure 8 shows the prediction results of optimal machining parameters, and the red dots indicate the locations of the predicted points of each parameter. The optimal cutting condition determined by RSM are as follows: 10° rake angle, 300 m/min cutting speed, 1.5 mm cutting depth, and 0.1 mm flank wear.
The results of the prediction and validation for the cutting power at the optimal cutting condition are given in Table 6. The measured value of the cutting power was equal to 50.82 W, which was very closed to the predicted value of 48.51 W at a rake angle of 10°, cutting speed of 300 m/min, depth of cut of 1.5 mm, and flank wear of 0.1 mm, and the error rate is 4.76%, which is within the acceptable range. Thus, the optimal cutting condition for WPC milling was determined, where the rake angle is 10°, cutting speed is 300 m/min, cutting depth is 1.5 mm, and tool wear is 0.1 mm. Furthermore, considering the service life of the tool, this parameter combination is suggested to be used for WPC milling with minor cutting dimensions for high cutting efficiency and low consumption.
4. Conclusions
In this paper, attention was given to the influence of rake angle, cutting speed, depth of cut, and flank wear on machine power during WPC milling experiments. The main conclusion are as follows. The cutting power model was developed with a high degree of fitting, which can be used for the prediction of cutting power and optimal milling conditions. In this model, terms including γ, vc, ap, VB, γ × VB, vc × ap, and ap × VB significantly contributed to the cutting power, while the terms γ × ap, vc × VB, γ2, vc2, ap2, and VB2 had an insignificant effect on the cutting power. In order to achieve high machining efficiency, low energy consumption, and longer service life, the optimal cutting conditions determined are as follows: rake angle of 10°, cutting speed of 300 m/min, cutting depth of 0.90 mm, and flank wear of 0.1 mm. For a higher service life, this parameter combination can be used for WPC industrial machining with minor cutting dimensions in terms of material removal rate and lower power.
Author Contributions
Conceptualization, W.X. and W.L.; methodology, Z.W.; software, Z.W.; validation, W.X., W.L. and Z.Z.; formal analysis, Z.W.; investigation, Y.Y.; resources, J.W.; data curation, Z.Z.; writing—original draft preparation, X.W.; writing—review and editing, W.X.; visualization, Z.W.; supervision, W.L.; project administration, Y.Y.; funding acquisition, Z.Z. All authors have read and agreed to the published version of the manuscript.
Funding
This work was supported by the National Natural Science Foundation of China [31971594], the Natural Science Foundation of the Jiangsu Higher Education Institutions of China [21KJB220009], the Technology Innovation Alliance of Wood/Bamboo Industry [TIAWBI2021-08], the Self-Made Experimental and Teaching Instruments of Nanjing Forestry University in 2021 [nlzzyq202101], the Nanjing Forestry University Undergraduate Innovation Project [202110298158h], the Qin Lan Project, and the International Cooperation Joint Laboratory for Production, Education, Research and Application of Ecological Health Care on Home Furnishing.
Institutional Review Board Statement
Not applicable.
Informed Consent Statement
Not applicable.
Data Availability Statement
Not applicable.
Conflicts of Interest
The authors declare no conflict of interest.
References
- Rothlin, O. Processing Wood-Plastic Composites Places New Demands on Feeders. Plast. Addit. Compd. 2007, 9, 36–39. [Google Scholar] [CrossRef]
- Radovanovic, I.; Kretschmer, K.; Bastian, M.J.G.G.F.K. Wood Plastic Pomposites. GAK Gummi Fasern Kunstst. 2010, 63, 150–156. [Google Scholar]
- Zhou, Z.; Xu, M.; Yang, Z.; Li, X.; Shao, D. Effect of Maleic Anhydride Grafted Polyethylene on the Properties of Chopped Carbon Fiber/Wood Plastic Composites. J. Reinf. Plast. Comp. 2014, 33, 1216–1225. [Google Scholar] [CrossRef]
- de Lima, D.; Melo, R.D.; Santana, R.; Botan; Nativa, E.J. Wood Plastic Composites Manufactured with Sawmill Waste and Discarded Polypropylene Packaging. Nativa 2018, 6, 79–84. [Google Scholar]
- Wang, R. Overview of the Sales Volume of China’s Flooring Industry in 2021. China Wood-Based Panels 2022, 29, 455. [Google Scholar]
- Kim, Y.-M.; Shin, S.-J.; Cho, H.-W. Predictive Modeling for Machining Power Based on Multi-Source Transfer Learning in Metal Cutting. Int. J. Precis. Eng. Manuf.-Green Technol. 2022, 9, 107–125. [Google Scholar] [CrossRef]
- Xiong, X.; Ma, Q.; Yuan, Y.; Wu, Z.; Zhang, M. Current Situation and Key Manufacturing Considerations of Green Furniture in China: A Review. J. Clean. Prod. 2020, 267, 121957. [Google Scholar] [CrossRef]
- Dong, W.; Xiong, X.; Ma, Y.; Yue, X. Woodworking Tool Wear Condition Monitoring during Milling Based on Power Signals and a Particle Swarm Optimization-Back Propagation Neural Network. J. Clean. Prod. 2021, 11, 9026. [Google Scholar] [CrossRef]
- Dong, W.; Hu, Y.; Tian, G.; Qiu, X.; Guo, X. Machine Energy Utilization Rate during Milling of PVC/Calcium Powder/Wood Fiber Composites. J. For. Eng. 2021, 6, 107–112. [Google Scholar]
- Somsakova, Z.; Zajac, J.; Michalik, P.; Kasina, M. Machining of Wood Plastic Composite (Pilot Experiment). Mater. Plast. 2012, 49, 55–57. [Google Scholar]
- Wu, X.; Liu, Y.; Zhang, X.; Dong, H.; Zheng, C.; Zhang, F.; Sun, Q.; Jin, H.; Ji, R. Sustainable and High-Efficiency Green Electrical Discharge Machining Milling Method. J. Clean. Prod. 2020, 274, 123040. [Google Scholar] [CrossRef]
- Shimizu, T.; Matsuzaki, K.; Sano, T.; Metallurgy, P. Rapid Prototyping of Metallic Parts by Green Machining. J. Jpn. Soc. Powder Powder Metall. 2006, 53, 791–796. [Google Scholar] [CrossRef]
- Chuchala, D.; Ochrymiuk, T.; Orlowski, K.A.; Lackowski, M.; Taube, P. Predicting Cutting Power for Band Sawing Process of Pine and Beech Wood Dried with the Use of Four Different Methods. Bioresources 2020, 15, 1844–1860. [Google Scholar]
- Shi, W.; Fang, W.; Jiang, B.; Li, Z. Analysis of Cutting Technology and Energy Consumption Model of Polyethylene WPC. Ferroelectrics 2022, 593, 112–123. [Google Scholar] [CrossRef]
- Wang, L.; Meng, Y.; Ji, W.; Liu, X. Cutting Energy Consumption Modelling for Prismatic Machining Features. Int. J. Adv. Manuf. Technol. 2019, 103, 1657–1667. [Google Scholar] [CrossRef]
- Guedes, T.O.; da Silva, J.R.M.; Gherardi Hein, P.R.; Ferreira, S.C. Cutting Energy Required during the Mechanical Processing of Wood Species at Different Drying Stages. Maderas-Cienc. Technol. 2020, 22, 477–482. [Google Scholar] [CrossRef]
- Shi, K.-N.; Liu, N.; Liu, C.-L.; Ren, J.-X.; Yang, S.-S.; Tan, W.C. Indirect approach for predicting cutting force coefficients and power consumption in milling process. Adv. Manuf. 2022, 10, 101–113. [Google Scholar] [CrossRef]
- Shao, P.; Jiang, S.; Ying, Y. Optimization of Molecular Distillation for Recovery of Tocopherol from Rapeseed Oil Deodorizer Distillate Using Response Surface and Artificial Neural Network Models. Food Bioprod. Process. 2007, 85, 85–92. [Google Scholar] [CrossRef]
- Wang, J.; Wan, W. Optimization of Fermentative Hydrogen Production Process Using Genetic Algorithm Based on Neural Network and Response Surface Methodology. Int. J. Hydrog. Energy 2009, 34, 255–261. [Google Scholar] [CrossRef]
- Fang, L.; Zeng, J.; Zhang, X.; Wang, D. Effect of Veneer Initial Moisture Content on the Performance of Polyethylene Film Reinforced Decorative Veneer. Forests 2021, 12, 102. [Google Scholar] [CrossRef]
- de Melo, D.J.; Guedes, T.O.; da Silva, J.R.M.; de Paiva, A.P. Robust Optimization of Energy Consumption during Mechanical Processing of Wood. Eur. J. Wood Wood Prod. 2019, 77, 1211–1220. [Google Scholar] [CrossRef]
- Li, R.; He, C.; Xu, W.; Wang, X. Modeling and Optimizing the Specific Cutting Energy of Medium Density Fiberboard during the Helical Up-Milling Process. Wood Mater. Sci. Eng. 2022. [Google Scholar] [CrossRef]
- Li, R.; Yao, Q.; Xu, W.; Li, J.; Wang, X. Study of Cutting Power and Power Efficiency during Straight-Tooth Cylindrical Milling Process of Particle Boards. Materials 2022, 15, 879. [Google Scholar] [CrossRef] [PubMed]
- Ahmad, S.; Mehfuz, S.; Mebarek-Oudina, F.; Beg, J. RSM analysis based cloud access security broker: A systematic literature review. Clust. Comput. 2022, 1, 1–31. [Google Scholar] [CrossRef]
- Cai, W. Methodology for Establishing Energy Consumption Allowance of the Workpiece in Machining System. Ph.D. Thesis, Chongqing University, Chongqing, China, 2018. [Google Scholar]
- Yang, Y.; Xu, W.; Liu, X.; Wang, X. Study on Permeability of Cunninghamia Lanoeolata Based on Steam Treatment and Freeze Treatment. Wood Res. 2021, 66, 721–731. [Google Scholar] [CrossRef]
- Kukla, M.; Wargula, L. Wood-Based Boards Mechanical Properties and Their Effects on the Cutting Process during Shredding. Bioresources 2021, 16, 8006–8021. [Google Scholar] [CrossRef]
- Wargula, L.; Kukla, M. Determination of Maximum Torque during Carpentry Waste Comminution. Wood Res. 2020, 65, 771–783. [Google Scholar] [CrossRef]
- Orlowski, K.A.; Ochrymiuk, T.; Hlaskova, L.; Chuchala, D.; Kopecky, Z. Revisiting the Estimation of Cutting Power with Different Energetic Methods While Sawing Soft and Hard Woods on the Circular Sawing Machine: A Central European case. Wood Sci. Technol. 2020, 54, 457–477. [Google Scholar] [CrossRef]
- Xu, W.; Chen, P.; Yang, Y.; Wang, X.; Liu, X. Effects of Freezing and Steam Treatments on the Permeability of Populus Tomentosa Einfluss Von Vereisungs- Und Dampfbehandlung Auf Die Permeabilitat Von Populus tomentosa. Materialwiss. Werkst. 2021, 52, 907–915. [Google Scholar] [CrossRef]
- Li, R.; He, C.; Chen, Y.; Wang, X. Effects of Laser Parameters on the Width of Color Change Area of Poplar Wood Surface during a Single Irradiation. Eur. J. Wood Wood Prod. 2021, 79, 1109–1116. [Google Scholar] [CrossRef]
- Zhang, H.; Deng, Z.; Fu, Y.; Lv, L.; Yan, C. A Process Parameters Optimization Method of Multi-Pass Dry Milling for High Efficiency, Low Energy and Low Carbon Emissions. J. Clean. Prod. 2017, 148, 174–184. [Google Scholar] [CrossRef]
Figure 1.
Cutting power measurement; (a) cutting experiment, (b) measurement equipment, (c) response surface methodology.
Figure 1.
Cutting power measurement; (a) cutting experiment, (b) measurement equipment, (c) response surface methodology.

Figure 2.
Measurement of the rake angle and flank wear; (a) equipment of high-definition microscope; (b) rake angle; and (c) flank wear.
Figure 2.
Measurement of the rake angle and flank wear; (a) equipment of high-definition microscope; (b) rake angle; and (c) flank wear.

Figure 3.
Schematic diagram of the dynamic power change at different cutting stages.

Figure 4.
Correlation graphs for cutting power.

Figure 5.
Effect of the cutting conditions on power.

Figure 6.
(a) Normal distribution of experimental data, (b) predicted value with residuals.

Figure 7.
Interaction of the cutting conditions on the cutting power: (a) rake angle and cutting speed, (b) rake angle and depth of cut, (c) rake angle and flank wear, (d) cutting speed and depth of cut, (e) cutting speed and flank wear, and (f) depth of cut and flank wear (percent values was obtained based on the average value of each parameter).

Figure 8.
Optimal selection of cutting parameters.


Table 1.
Material characteristics of the workpiece.
| Workpiece | Moisture Content | Density | Modulus of Rupture | Impact Toughness |
|---|---|---|---|---|
| WPC | 0.72% | 0.81 g/cm3 | 21.4 MPa | 9.2 kJ/m2 |
Table 2.
Geometry and properties of the cutting tools.
| No. | Tool Geometry | Tool Property | ||||
|---|---|---|---|---|---|---|
| Rake Angle | Wedge Angle | Clearance Angle | Hardness | Bending Strength | Thermal Conductivity | |
| 1 | 2° | 43° | 45° | 88 HRA | 1.49 GPa | 74.24 W/m·K |
| 2 | 6° | 39° | 45° | |||
| 3 | 10° | 35° | 45° | |||
Table 3.
Results of the experiment with different conditions.
| Runs | Rake Angle γ (°) | Cutting Speed vc (m/min) | Depth of Cut ap (mm) | Flank Wear VB (mm) | Cutting Power P (W) |
|---|---|---|---|---|---|
| 1 | 2 | 350 | 1.5 | 0.2 | 100.93 |
| 2 | 2 | 350 | 1 | 0.3 | 80.1 |
| 3 | 2 | 350 | 1 | 0.1 | 73.45 |
| 4 | 2 | 400 | 1 | 0.2 | 76.55 |
| 5 | 2 | 350 | 0.5 | 0.2 | 38.2 |
| 6 | 2 | 300 | 1 | 0.2 | 62.4 |
| 7 | 6 | 300 | 1 | 0.1 | 53.83 |
| 8 | 6 | 300 | 1 | 0.3 | 67.67 |
| 9 | 6 | 300 | 1.5 | 0.2 | 80.19 |
| 10 | 6 | 400 | 1.5 | 0.2 | 108.1 |
| 11 | 6 | 350 | 0.5 | 0.3 | 46.37 |
| 12 | 6 | 400 | 0.5 | 0.2 | 44.51 |
| 13 | 6 | 350 | 1.5 | 0.3 | 119.66 |
| 14 | 6 | 350 | 1 | 0.2 | 67.23 |
| 15 | 6 | 400 | 1 | 0.3 | 84.55 |
| 16 | 6 | 350 | 1.5 | 0.1 | 74.59 |
| 17 | 6 | 300 | 0.5 | 0.2 | 34.98 |
| 18 | 6 | 350 | 0.5 | 0.1 | 34.38 |
| 19 | 6 | 400 | 1 | 0.1 | 57.18 |
| 20 | 10 | 350 | 1.5 | 0.2 | 85.72 |
| 21 | 10 | 300 | 1 | 0.2 | 59.42 |
| 22 | 10 | 400 | 1 | 0.2 | 73.18 |
| 23 | 10 | 350 | 1 | 0.1 | 42.94 |
| 24 | 10 | 350 | 0.5 | 0.2 | 37.69 |
| 25 | 10 | 350 | 1 | 0.3 | 80.72 |
Table 4.
Fit statistics for the RSM model.
| R2 | Adjusted R2 | Predicted R2 | Std. Dev | C.V.% | Adeq. Precision |
|---|---|---|---|---|---|
| 0.98 | 0.96 | 0.91 | 3.93 | 5.79 | 70.98 |
Table 5.
ANOVA results for cutting power.
| Source | Sum of Squares | df | Mean Square | F-Value | p-Value | Remark |
|---|---|---|---|---|---|---|
| γ | 225.05 | 1 | 225.05 | 14.58 | 0.0019 | Significant |
| vc | 610.37 | 1 | 610.37 | 39.55 | <0.0001 | Significant |
| ap | 9244.01 | 1 | 9244.01 | 599.05 | <0.0001 | Significant |
| VB | 1697.34 | 1 | 1697.34 | 109.99 | <0.0001 | Significant |
| γ × vc | 0.0359 | 1 | 0.0359 | 0.0023 | 0.9622 | Not significant |
| γ × ap | 54.09 | 1 | 54.09 | 3.51 | 0.0822 | Not significant |
| γ × VB | 242.21 | 1 | 242.21 | 15.70 | 0.0014 | Significant |
| vc × ap | 84.45 | 1 | 84.45 | 5.47 | 0.0347 | Significant |
| vc × VB | 45.74 | 1 | 45.74 | 2.96 | 0.1071 | Not significant |
| ap × VB | 273.70 | 1 | 273.70 | 17.74 | 0.0009 | Significant |
| γ2 | 5.30 | 1 | 5.30 | 0.3433 | 0.5673 | Not significant |
| vc2 | 25.85 | 1 | 25.85 | 1.67 | 0.2165 | Not significant |
| ap2 | 17.66 | 1 | 17.66 | 1.14 | 0.3028 | Not significant |
| VB2 | 0.9748 | 1 | 0.9748 | 0.0632 | 0.8052 | Not significant |
| Residual | 216.04 | 14 | 15.43 | / | / | / |
| Lack of fit | 178.81 | 10 | 17.88 | 1.92 | 0.2769 | Not significant |
| Pure error | 37.22 | 4 | 9.31 | / | / | / |
| Cor total | 12,730.90 | 28 | / | / | / | / |
Table 6.
Prediction and validation of the cutting power.
| Tests | Rake Angle (°) | Cutting Speed (m/min) | Depth of Cut (mm) | Flank Wear (mm) | Cutting Power (W) |
|---|---|---|---|---|---|
| Prediction | 10 | 300 | 1.5 | 0.1 | 48.51 |
| Verification | 10 | 300 | 1.5 | 0.1 | 50.82 |
| Error rate | \ | \ | \ | \ | 4.76% |
Publisher’s Note: MDPI stays neutral with regard to jurisdictional claims in published maps and institutional affiliations. |
© 2022 by the authors. Licensee MDPI, Basel, Switzerland. This article is an open access article distributed under the terms and conditions of the Creative Commons Attribution (CC BY) license (https://creativecommons.org/licenses/by/4.0/).
Share and Cite
MDPI and ACS Style
Xu, W.; Wu, Z.; Lu, W.; Yu, Y.; Wang, J.; Zhu, Z.; Wang, X. Investigation on Cutting Power of Wood–Plastic Composite Using Response Surface Methodology. Forests 2022, 13, 1397. https://doi.org/10.3390/f13091397
AMA Style
Xu W, Wu Z, Lu W, Yu Y, Wang J, Zhu Z, Wang X. Investigation on Cutting Power of Wood–Plastic Composite Using Response Surface Methodology. Forests. 2022; 13(9):1397. https://doi.org/10.3390/f13091397
Chicago/Turabian StyleXu, Wangyu, Zhanwen Wu, Wei Lu, Yingyue Yu, Jinxin Wang, Zhaolong Zhu, and Xiaodong Wang. 2022. "Investigation on Cutting Power of Wood–Plastic Composite Using Response Surface Methodology" Forests 13, no. 9: 1397. https://doi.org/10.3390/f13091397
Note that from the first issue of 2016, this journal uses article numbers instead of page numbers. See further details here.