Article

Litter Inputs Control the Pattern of Soil Aggregate-Associated Organic Carbon and Enzyme Activities in Three Typical Subtropical Forests

1
The State Key Laboratory of Subtropical Silviculture, Zhejiang A&F University, Lin’an, Hangzhou 311300, China
2
College of Environmental and Resource Sciences, Zhejiang A&F University, Hangzhou 311300, China
3
Zhejiang Provincial Collaborative Innovation Center for High-Efficiency Utilization of Bamboo Resources, Zhejiang A&F University, Lin’ an, Hangzhou 311300, China
*
Author to whom correspondence should be addressed.
Forests 2022, 13(8), 1210; https://doi.org/10.3390/f13081210
Submission received: 27 May 2022 / Revised: 21 July 2022 / Accepted: 25 July 2022 / Published: 1 August 2022

Abstract

:
Soil extracellular enzyme activities among aggregate fractions are critical to short-term microbial activity and long–term carbon dynamics in forest ecosystems, but little is known regarding the effects of forest types on the soil enzyme activities in different soil aggregate fractions. Three typical subtropical forest types (Broadleaved forest, Moso bamboo forest and Chinese fir forest) were selected, and undisturbed soil samples (0–15 cm) were collected. We investigated the effects of forest types on aggregate stability (mean weight diameter, geometric mean diameter and fractal dimension), aggregate–associated organic carbon (OC) and the functionality of five enzymes (cellobiohydrolase, β-glucosidase, β-xylosidase, N–acetylglucosaminidase, leucine aminopeptidase) of different aggregate fractions (>2 mm, 0.25–2 mm, 0.053–0.25 mm and <0.053 mm). The results showed that the proportion of macro-aggregates, aggregate stability and macro–aggregates associated–carbon content and storage were higher in broadleaved and Moso bamboo forests than in Chinese fir forests, indicating that forest types influence the distribution of total soil OC among aggregate fraction classes and would delay the loss of OC in broadleaved and Moso bamboo forests. We also found that the extracellular enzymes were higher in aggregates of broadleaved forests and Moso bamboo forests. SEM (structural equation model) analysis also supported significantly positive relationships between litter quantity and aggregate enzyme activity, and indirect impact of litter quantity and litter C/N ratio together with soil organic carbon (SOC) and soil aggregate organic C content (SAOCC) on aggregate enzyme activity. The results of this study indicate that forest types showed large impact on aggregate-associated OC and enzyme activities, and the litter input of different forest types is the main control on enzyme activity among different aggregate fractions, and thus may play an important role in adjusting the sink capacity and stability of SOC.

1. Introduction

Forest ecosystems are a substantial carbon (C) pool and play an important role in global biogeochemical cycles. Since the dynamics of soil organic carbon (SOC) are mainly evaluated based on the cycles of soil C and nitrogen (N) [1], soil C and N-cycling related extracellular enzymes have aroused widespread attention within different forest ecosystems [2]. Microbial enzymes, such as hydrolases, drive various soil biochemical processes in the soil environment, and are important to assess potential soil C and N decomposition [3]. Soil hydrolases can catalyze the decomposition of different organic substances, release plant nutrients, and influence the magnitude and direction of SOC storage. For instance, cellobiohydrolase (CB) and β–xylosidase (BG) break cellulose and hemicellulose down to cellobiose, fructose and glucose [4]; BG can further decompose labile cellulose and other carbohydrate polymers into low–molecular–weight sugars. Β-N-acetylaminoglucosidase (NAG) and leucine aminopeptidase (LAP) are involved in the hydrolysis of proteins and nucleic acids, degrading complex N-containing compounds into small molecular forms that can be absorbed and used by plants and play a role in the N cycle [5]. Different microorganisms secrete degradative enzymes to moderate the decomposition and accumulation of SOC [6]. Thus, determining soil C and N-cycling related enzyme activities is important to assess the potential of short-term microbial activity and long-term C stabilization in forest ecosystems.
Soil aggregate formation is considered to be an important physically protected mechanism of soil C sequestration [7]. Generally, aggregates are classified into macro–aggregates (>0.25 mm), micro-aggregates (0.053–0.25 mm) and silt and clay fractions (<0.053 mm) [8]. Macro-aggregates also classified into coarse macro-aggregates (>2 mm) and fine macro-aggregates (0.25–2 mm), and they are formed by temporary binding of micro-aggregates by organic substances, such as fungal hyphae, plant roots and the plant- and microbial-originated organic compounds [9]. Micro-aggregates (0.053–0.25 mm) and silt and clay fractions (<0.053 mm) are usually disrupted due to physical disturbance, such as rainfall [10]. In addition, macro-aggregates are more enriched in organic carbon (OC) than micro-aggregates [11], and the significant difference of soil properties [12], such as litter quantity and SOC contents, in different forest ecosystems may influences enzymatic activities of bulk soil and aggregates fractions of different fractions [13]. Therefore, soil enzyme activities should be described at various spatial scales for examining their trends within forest soils, and the pattern of enzymatic activities among different aggregates remains unclear.
The global subtropical forest area accounts for about 11% of the global forest area [14], and more than half of subtropical forest occupy in China. Broadleaved forest, Moso bamboo forest and Chinese fir forest are three important natural forests in subtropical areas in China. Broadleaved evergreen forests was the dominant natural in the subtropics forest area [15], occupying 27% of national territorial area. According to the national forest resources inventory data, the area of Chinese fir plantation forests occupies 29% of the total area of plantation forests in China [16]. Moso bamboo forest covers more than 72% of the total area of bamboo forest in China, which is the most dominant type of bamboo forest [17]. Nonetheless, it remains largely unknown whether forest type affects soil aggregate-related enzyme activities.
Therefore, we evaluated the soil aggregate-associated C and their hydrolase activities in the different aggregate fractions in three subtropical forests and sought to understand the impacts of forest types on the activities of soil extracellular enzymes within soil aggregates. We also explore the environmental drivers on soil aggregate-associated C and hydrolases activities. We hypothesized that soil aggregate-associated C and enzyme activities tended to be diverse in different subtropical forests and significantly positively correlated with litter inputs and SOC.

2. Materials and Methods

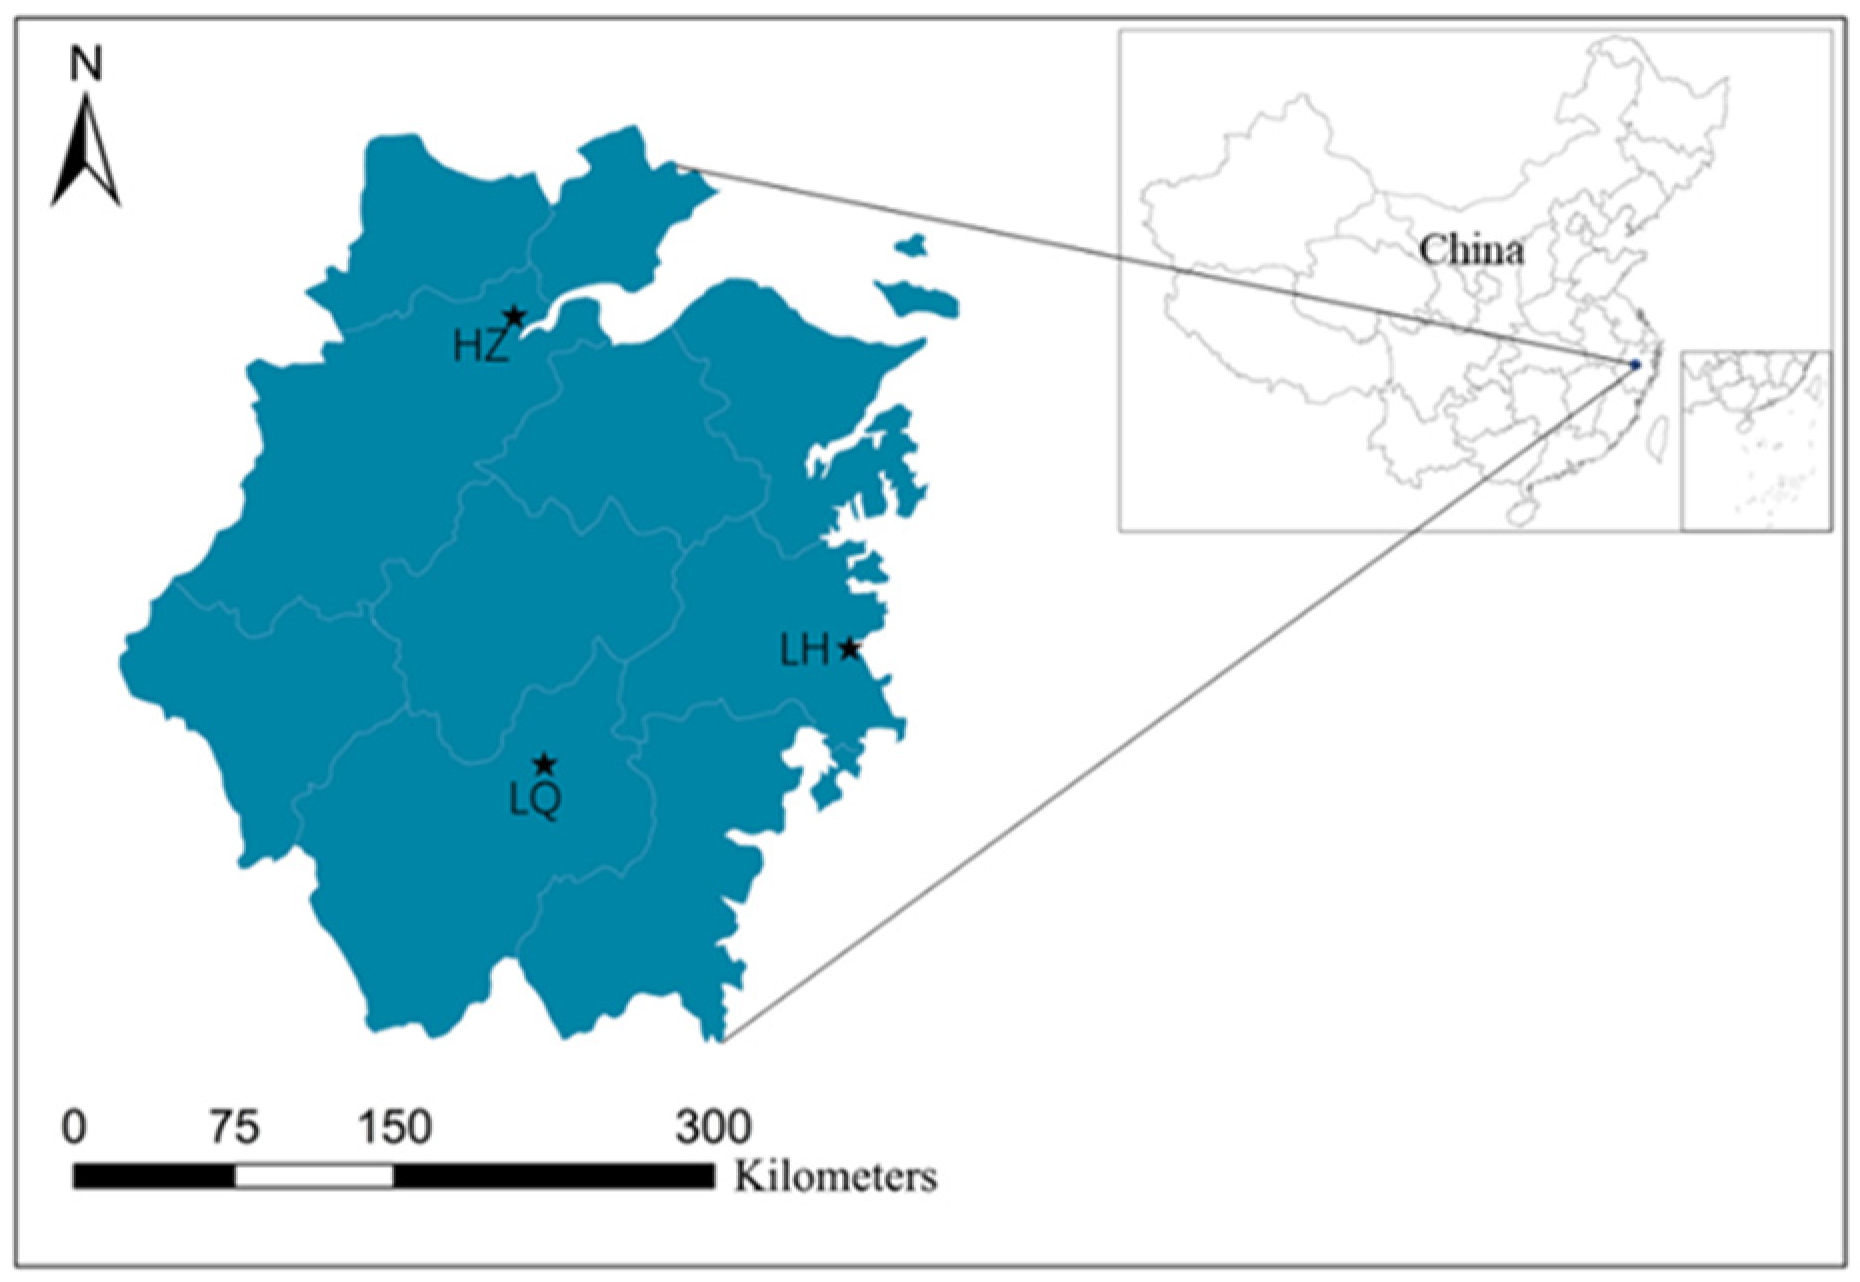
2.1. Site Description

This study was conducted at three typical forest sites (Longtan ao Village, Linhai City (LH); Baoxi Township, Longquan City (LQ); Linglong mountain, Hangzhou City (HZ) in Zhejiang Province) with a subtropical monsoon climate (Figure 1; Table 1). Evergreen broadleaved forest, Chinese fir forest and Moso bamboo forest were distributed in all three study areas. Among the sites, the broadleaved forests were generally dominated by evergreen broadleaved trees, such as Schima spuerba, Cyclobalanopsis glauca, Cinnamomum chekiangense, Tectona grandis, Liquidambar formosana and Cinnamomum camphora, and the main evergreen broadleaved vegetation species in the three regions are similar with understory vegetation mainly including shrubs and ferns. The Chinese fir forest was planted artificially and grew without significant management for twenty years, with less dense understory vegetation of mostly herbaceous species, such as Sambucus javanica, Callicarpa bodinier, Mallotus nepalensis, Rubus peltatus and Rubus parvifolius. The Moso bamboo forest was planted artificially, and the understory vegetation was less and mostly herbaceous, such as Woodwardia japonica, Hypolepis punctata, Cyclosorus acuminatus and Aster ageratoides. In this study, geographical coordinates, mean annual temperature (MAT), mean annual precipitation (MAP), soil taxonomic classification and the vegetation cover of each study site are shown in Table 1.

2.2. Experimental Design and Soil Sampling

In November 2020, we randomly selected three sample quadrants (10 × 10 m2) in a broadleaved forest, Chinese fir forest and Moso bamboo forest with similar site conditions, such as aspect, slope and elevation. A 50 cm × 50 cm sample square was set up in each sampling site, and all the litter in the sample square was collected and weighed, and the total C and N contents of litter were measured. After litter sampling, 10 × 10 cm2 undisturbed soil of 0–15 cm depth was collected and put into clean plastic containers to avoid disturbance before being brought back to the laboratory. Soil samples were briefly passed through a series of sieves using the wet-sieving method and further divided into four fractions (>2 mm, 0.25–2 mm, 0.053–0.25 mm, and <0.053 mm). The visible plant roots, gravel, earthworms and other small animals were removed prior to being subdivided into three subsamples. The first subsample was used to determine soil moisture content by baking at 105 °C for 48 h. The second subsample was used to determine physical and chemical properties and to separate soil aggregates. The third subsample was used for was used for measuring enzymatic activity in soil aggregates.

2.3. Soil Aggregate Separation

The soil aggregate fractions were separated as coarse macro-aggregates (>2 mm), fine macro-aggregates (0.25–2 mm), micro-aggregates (0.053–0.25 mm), and silt and clay fractions (<0.053 mm) through a wet sieving method. Briefly, 100 g of air-dried soil subsample was placed on the top of a nest of three sieves of 2 mm, 0.25 mm and 0.053 mm and submerged in deionized water for 10 min. The sieves were then manually moved up and down 3 cm with 50 repetitions per minute. After four minutes, the fraction remaining on each sieve and silt and clay fraction that passed through the 53-μm sieve was collected in beakers. The obtained wet aggregates were immediately freeze-dried and weighed to obtain the mass of aggregates with various particle fractions. Freeze-dried soil samples were used to determine enzyme activity, aggregate organic carbon content and aggregate organic carbon storage.
The aggregate stability was represented the mean weight diameter (MWD) [18]. geometric mean diameter (GMD) [19] as:
MWD = i = 1 n x ¯ i w i
GMD = Exp ( i = 1 n w i ln x ¯ i i = 1 n w i )
where x ¯ i is the mean diameter of each aggregate fraction, w i is the mass proportion of aggregate fraction remaining on each sieve and n is the number of fractions.
The fractal dimension (D) is computed as Equation [20]:
W ( δ < d ¯ i ) W 0 = ( d ¯ i d ¯ max ) 3 D
where d ¯ i is the average fraction of each fraction aggregate, W ( δ < d ¯ i ) is the mass of aggregates smaller than < d ¯ i , W 0 is the total mass of aggregates and d ¯ m a x is the maximum diameter of the soil aggregate fractions.

2.4. Soil Sample Analyses

The air-dried soil samples were passed through a 2–mm sieve before subdividing for analyses. A portion of each soil sample was air-dried for analyzing soil organic carbon (SOC), total nitrogen (TN), alkaline nitrogen, pH, and available kalium according to Lu [21]. Soil pH was measured at a 1:2.5 soil/water (w/w) ratio with a glass electrode. The alkaline nitrogen was measured by alkali diffusion method. The available potassium was measured by the flame photometric method. SOC and TN concentrations of bulk soil and aggregate fraction were measured using an elemental analyzer (Vario EL LII, Elementar, Germany). The six hydrolytic enzyme activities of bulk soil and aggregate fraction were determined according to the slightly modified fluorescence-based enzyme protocols of Saiya–Cork [22]. The Synergy H1 full-function microplate was used to determine the hydrolase indexes. Soil enzymes were extracted with sodium acetate at pH 5.0, and the soil enzyme solution and corresponding substrate were added to the black microplate. The readings are at the excitation wavelength 365 nm and emission wavelength 450 nm. A standard curve was produced and used to calculate soil hydrolase activities for each treatment. Our readings were compared with the standard curves to calculate the soil hydrolase activities for each treatment. Activities of five enzymes were determined experimentally, including cellobiohydrolase (CB), β-glucosidase (BG), β-xylosidasen (XYL), N-acetylglucosaminidase (NAG) and leucine aminopeptidase (LAP), respectively.

2.5. Statistical Analyses

To test differences in soil aggregates in different forest stands, we applied one-way ANOVA and least significant difference (LSD) for ANOVA and multiple comparisons of each group of data, and Pearson correlation analysis to correlate the organic matter content of each fraction aggregate with environmental factors. Two–way ANOVA was used to analyze the effect of forest type and aggregate fraction on enzyme activity. SPSS 25.0 software was used for all statistical analyses. The figures and tables in this study were produced using Excel 2014, Origin 2021. The structural equation modeling (SEM) was further constructed to examine direct and indirect effects of litter C/N, litter quantity, SOC and soil aggregate organic C content (SAOCC) affecting aggregate enzyme activity. The model was run by the AMOS 24.0 software.

3. Results

3.1. Basic Physical and Chemical Properties of Soils

From Table 2, we found that the SOC and TN content of broadleaved and Moso bamboo forests soils were significantly higher than that of Chinese fir forest (p < 0.05), while the soil C/N ratio of broadleaved and Chinese fir forests were significantly higher than that of Moso bamboo forests (p < 0.05). The annual litter production, alkaline nitrogen and available potassium contents were significantly higher in broadleaved forests than in Moso bamboo and Chinese fir forests (p < 0.05), but soil pH was significantly lower in broadleaved forests than in Moso bamboo and Chinese fir forests (p < 0.05). The parent material of all sites is granite, so the differences in soil sand, silt and clay content are not significant. The sand content of the three stands ranged from about 26.86 to 35.71%, silt content from about 35.29 to 40.63% and clay content from about 26.30 to 35.21%.

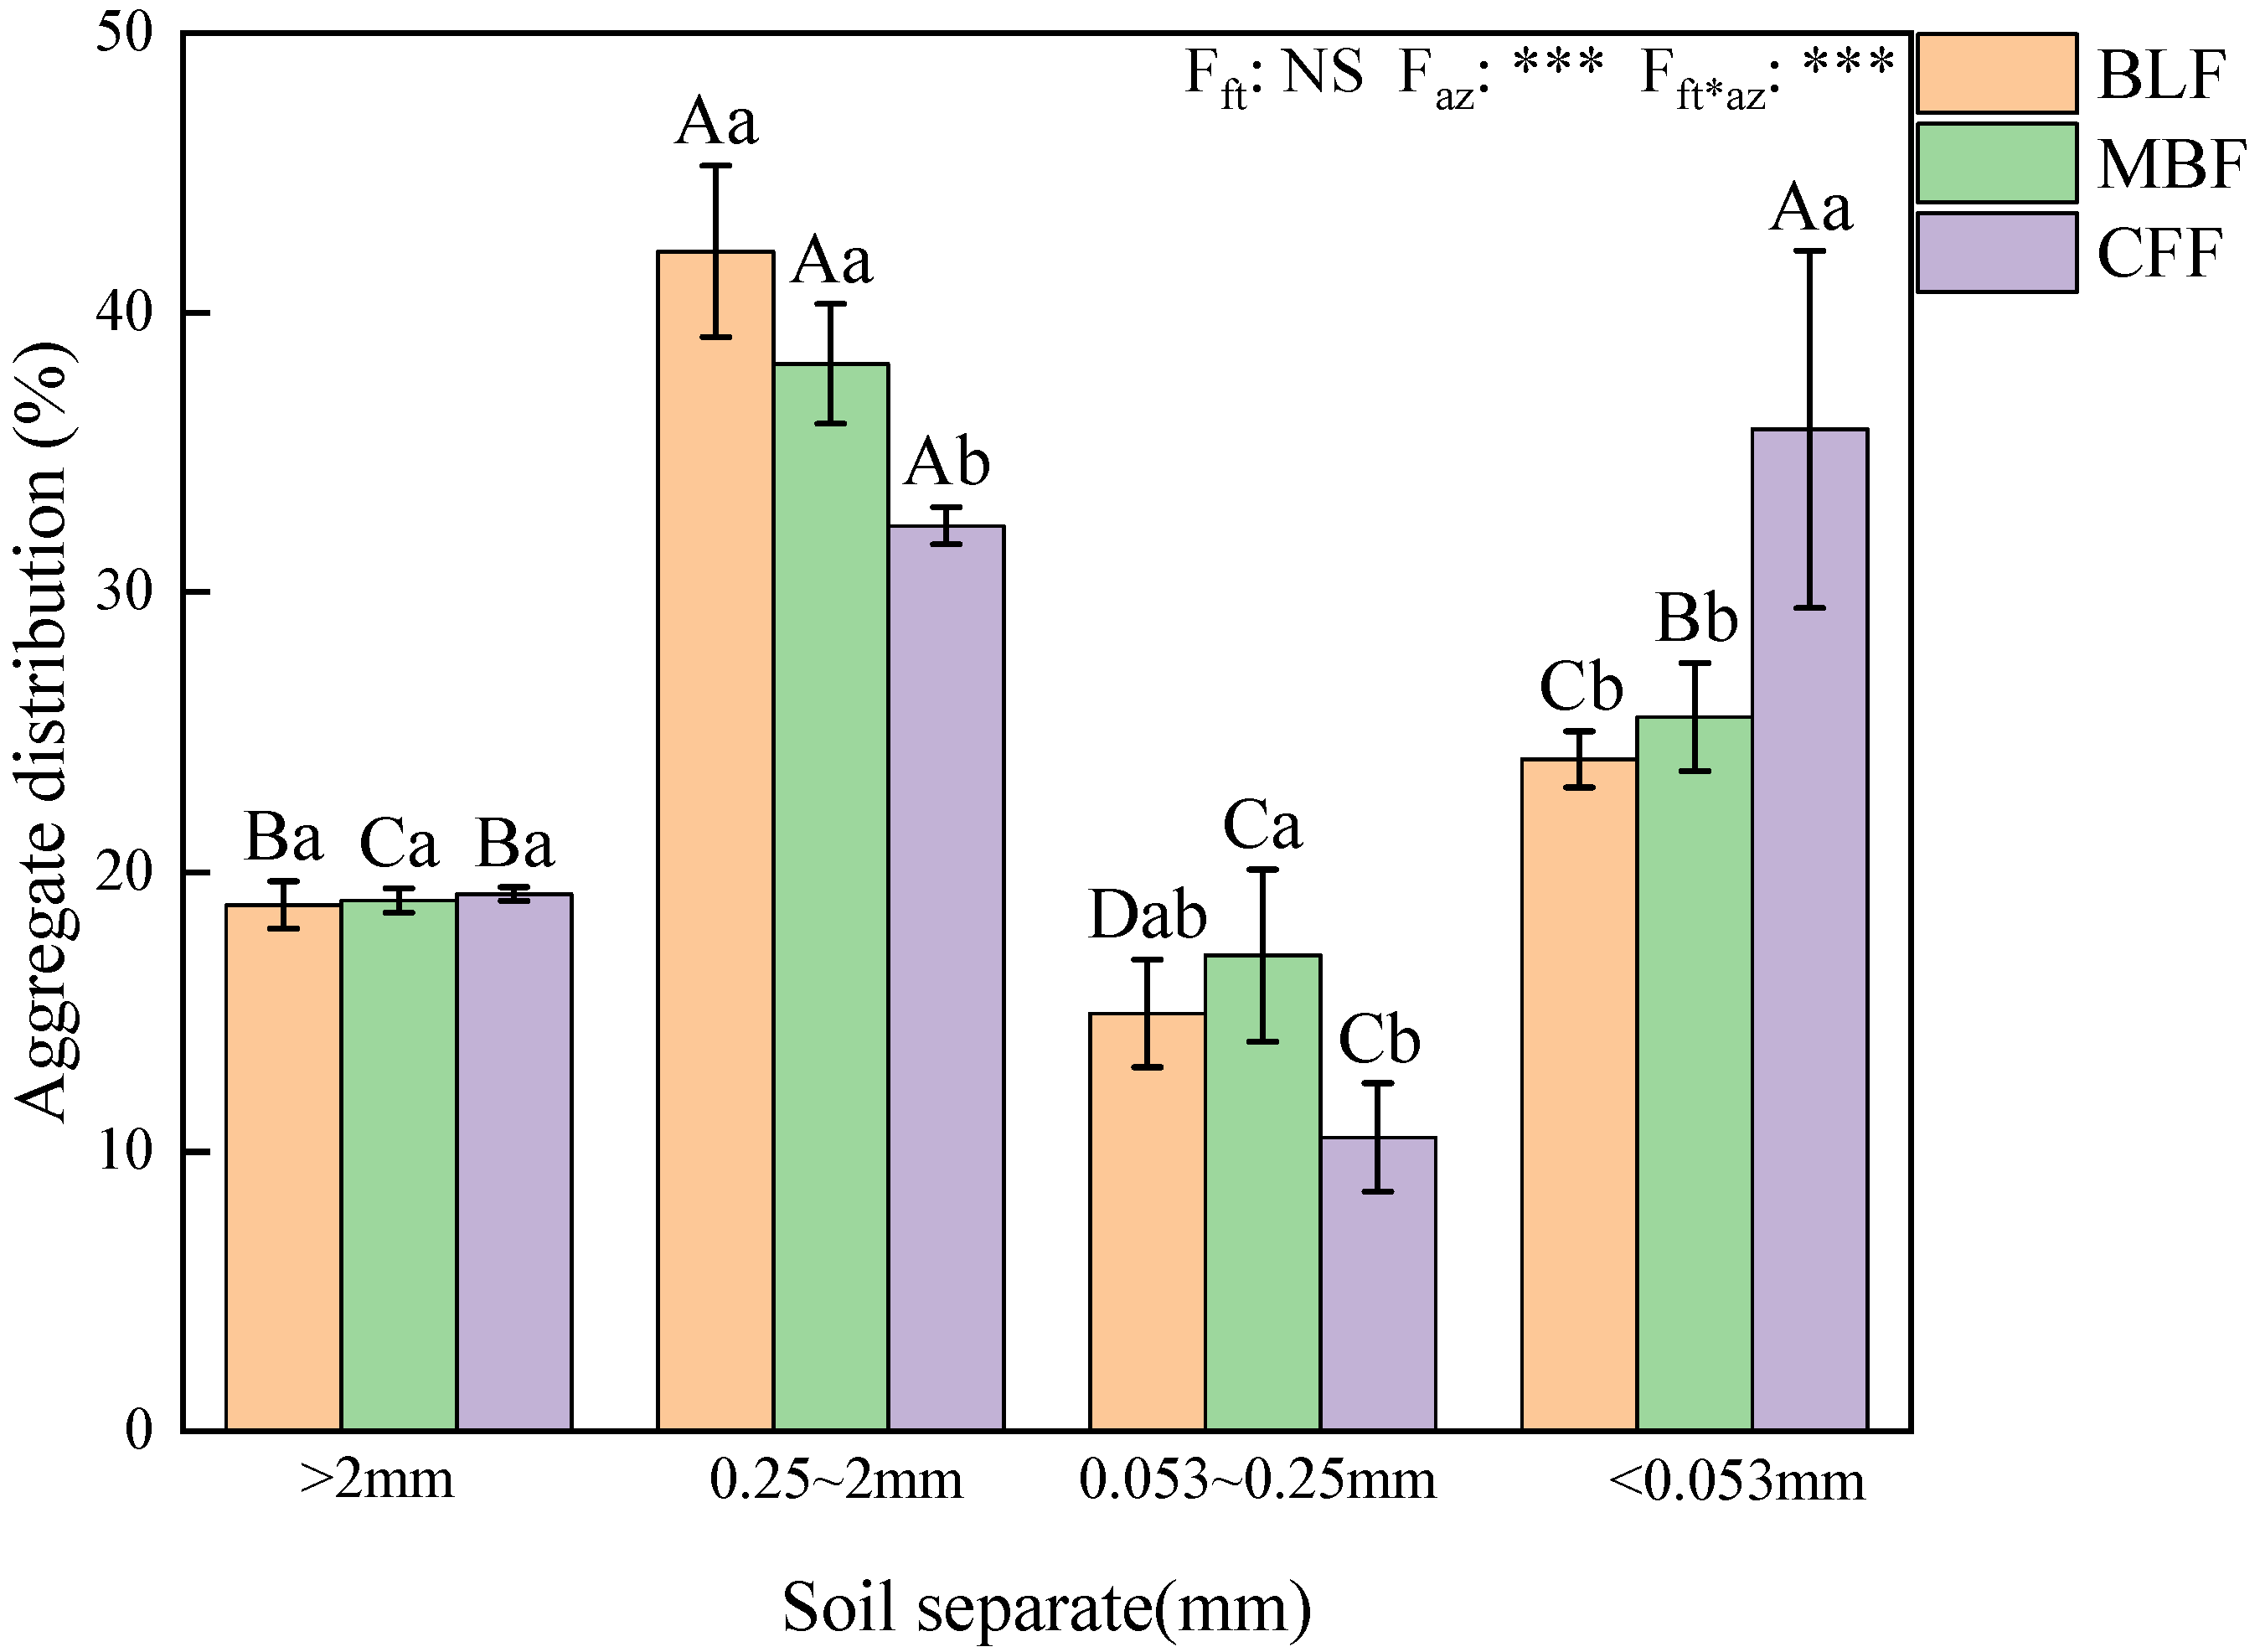
3.2. Distribution Characteristics of Soil Aggregates

The proportion of coarse macro-aggregates (>2 mm) was not significantly different among the three forest types, but that of fine macro-aggregates (0.25–2 mm) was significantly higher in broadleaved and Moso bamboo forests than in Chinese fir forests (p < 0.05; Figure 2). The proportion of micro-aggregates (0.053–0.25 mm) was significantly lower in Chinese fir forests than in Moso bamboo forests (p < 0.05), but that of silt and clay fractions (<0.053 mm) was also significantly higher (p < 0.05) in Chinese fir forests than in broadleaved and Moso bamboo forests. The proportion of fine macro-aggregates (0.25–2 mm) in broadleaved and Moso bamboo forests soil was significantly higher than that of the other three fractions (p < 0.05), while that of silt and clay fractions (<0.053 mm) in Chinese fir forests soil was significantly higher than that in coarse macro-aggregates (>2 mm) and micro-aggregates (0.053–0.25 mm) (p < 0.05). The results of two–way ANOVA showed that aggregate fraction had a significant effect on soil aggregate distribution, and forest type and soil aggregate fraction had a significant interaction effect on soil aggregate distribution.

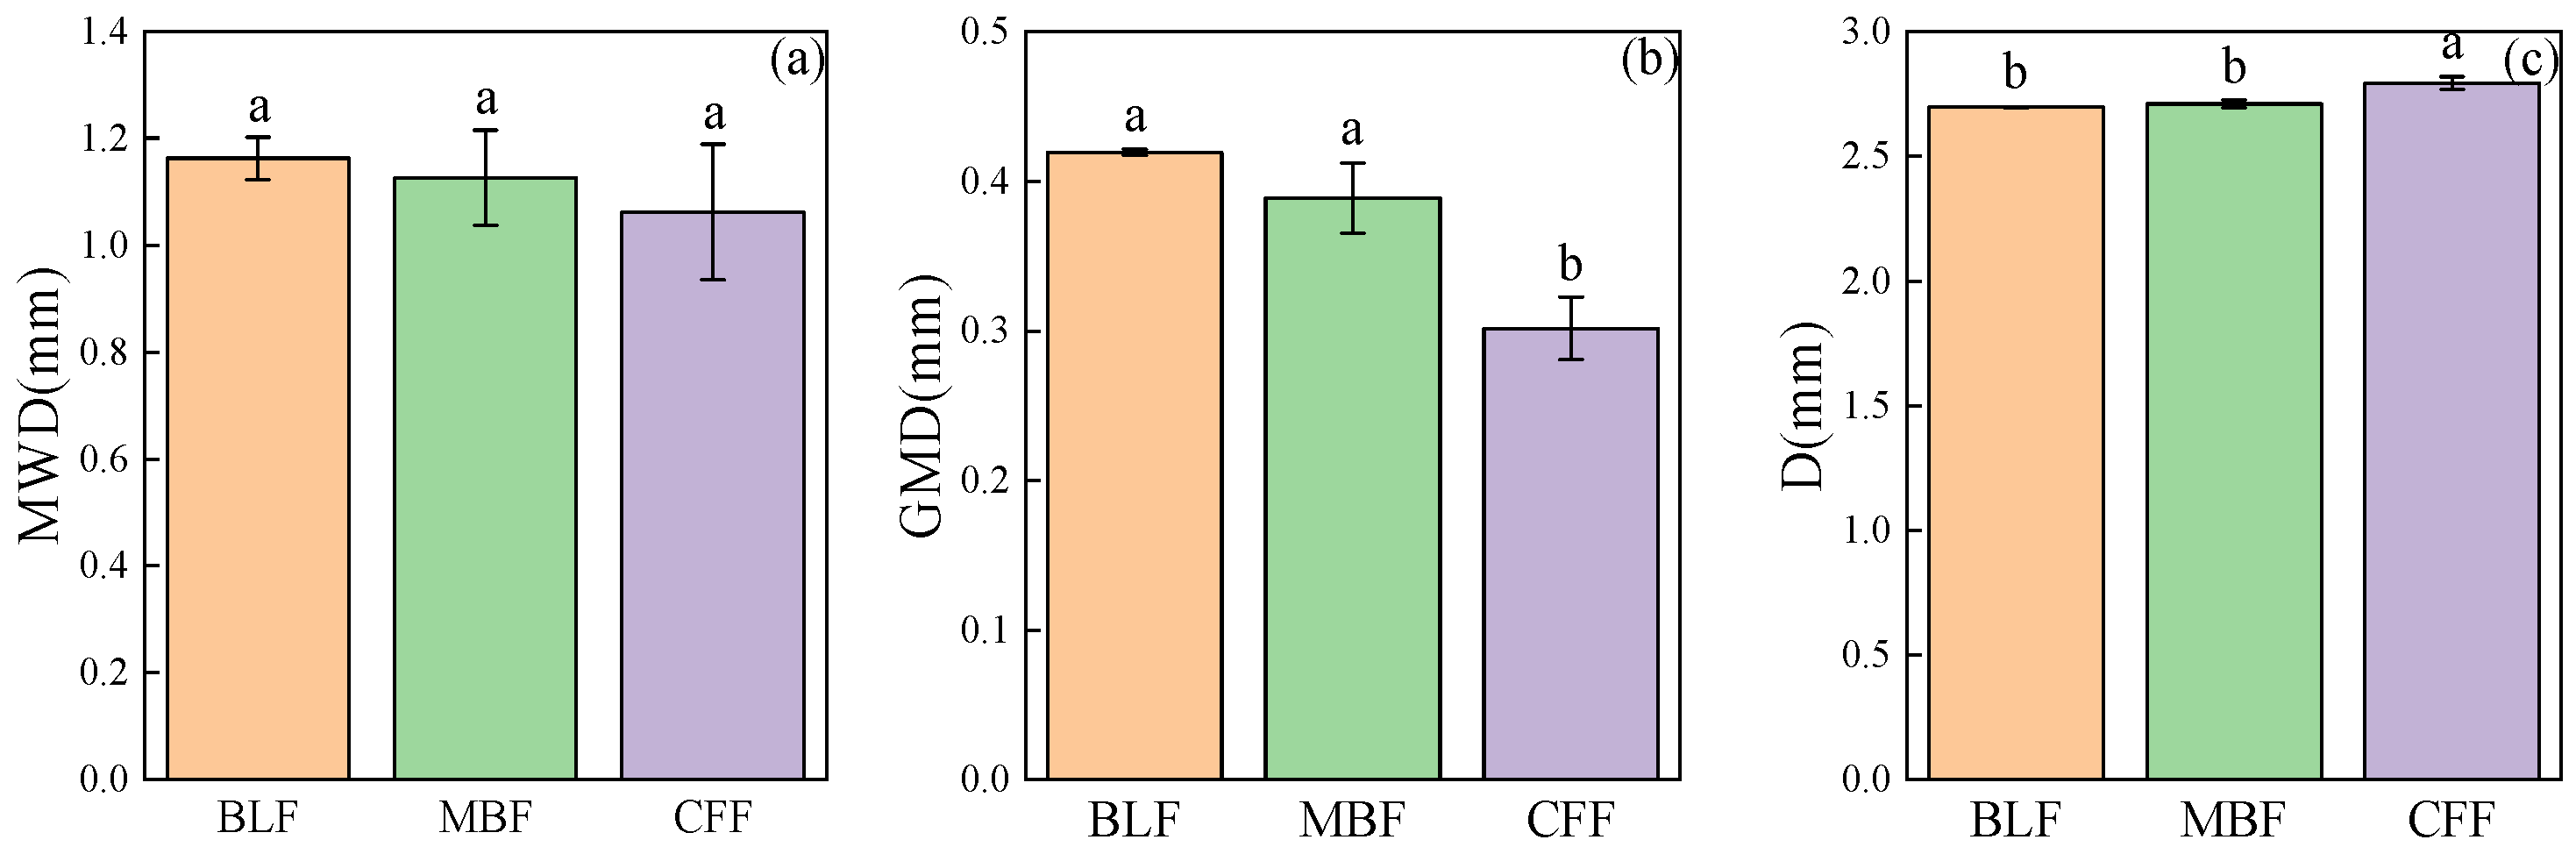
3.3. Stability Characteristics of Soil Aggregates

The MWD, GMD, and fractal dimension (D) are important indicators of the stability of soil aggregates (Figure 3a, b, c). Although the MWD of the three forest types did not show significant difference, the GWD of broadleaved forest and Moso bamboo forest were significantly higher than that of Chinese fir forests (p < 0.05), while the fractal dimension (D) of Chinese fir forests was significantly higher than that of broadleaved and Moso bamboo forests (p < 0.05).

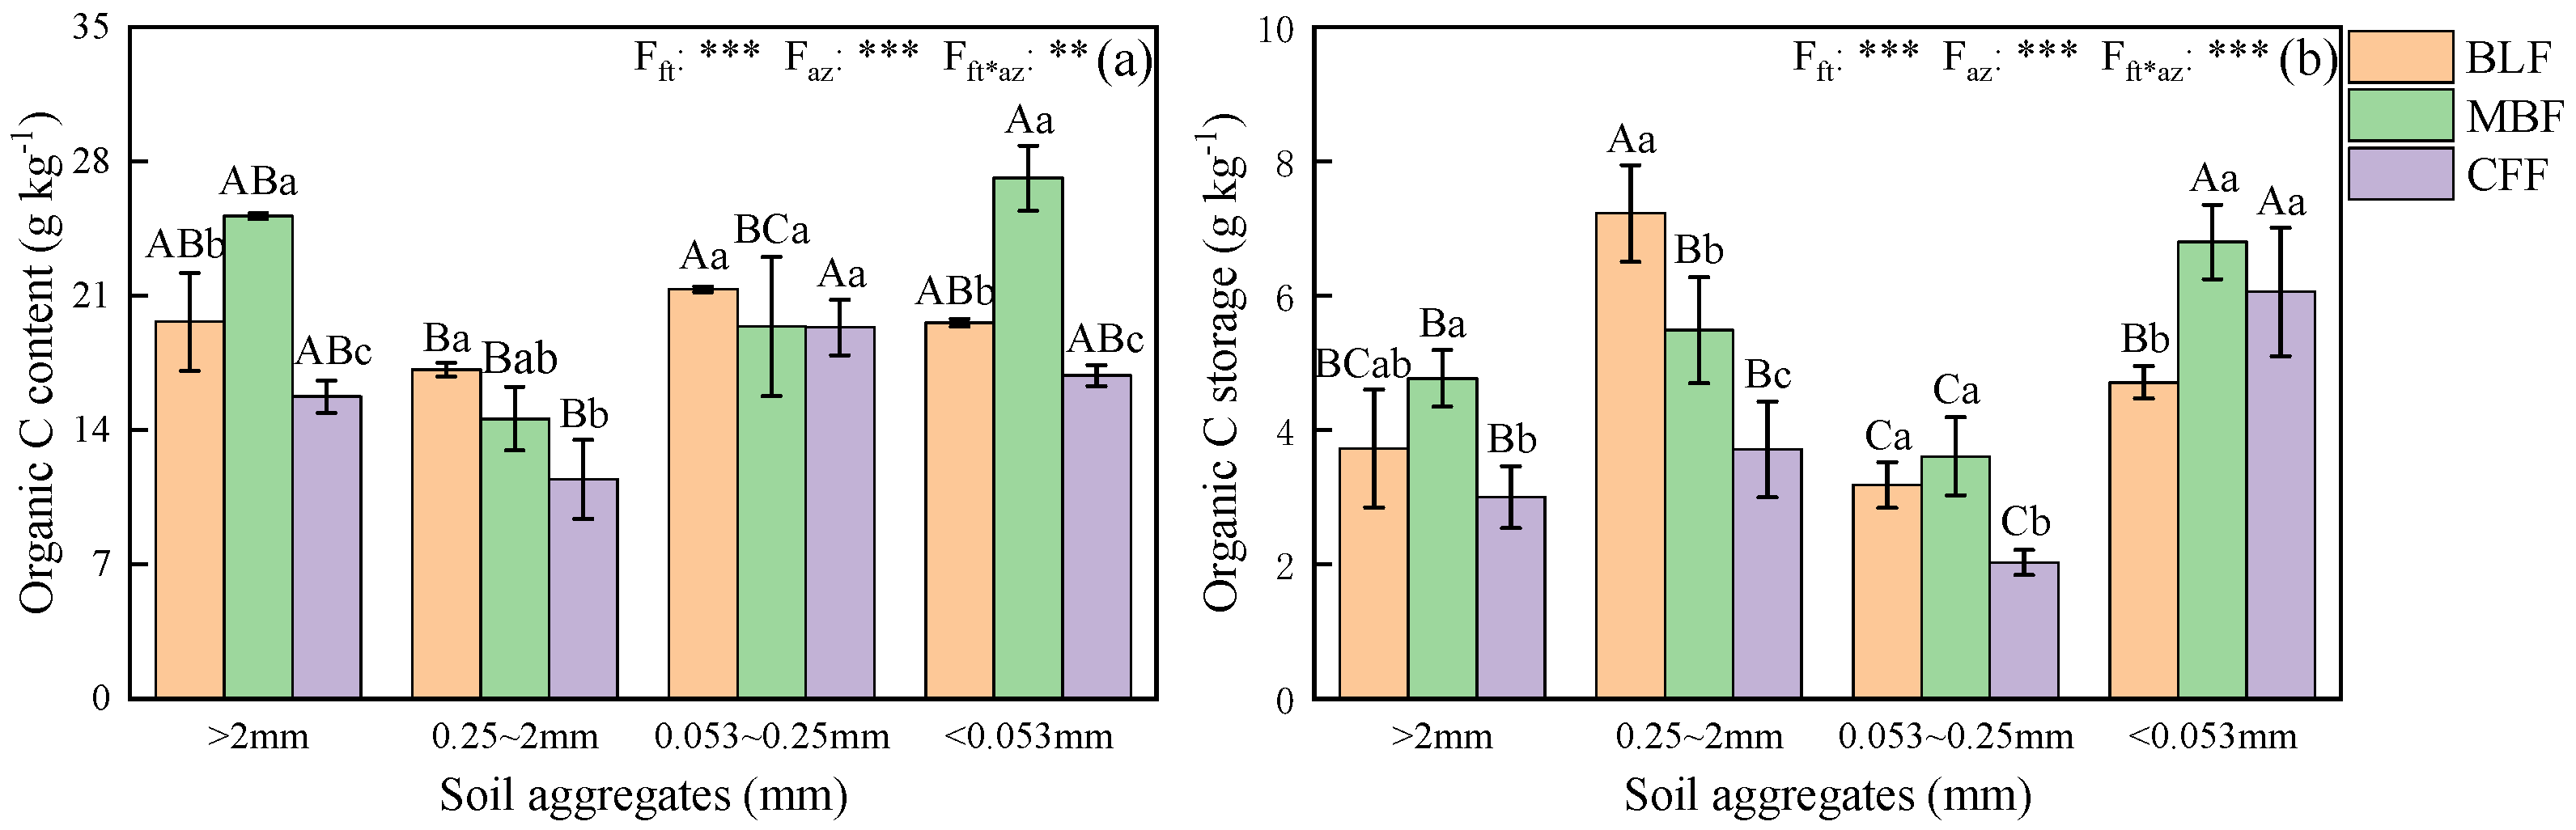
3.4. Aggregate-Associated SOC Concentrations and Storage

Aggregate-associated SOC concentration in coarse macro-aggregates (>2 mm) and silt and clay fractions (<0.053 mm) of Moso bamboo forests was significantly higher than that in broadleaved and Chinese fir forests (p < 0.05; Figure 4). However, there were no significant differences of aggregate-associated SOC concentration in micro-aggregates (0.053–0.25 mm) among the three forest types. The aggregate-associated SOC concentration in fine macro-aggregates (0.25–2 mm) of broadleaved forest was significantly higher than that of Chinese fir forests (p < 0.05).
The aggregate-associated SOC storage in coarse macro-aggregates (>2 mm) in Moso bamboo forests was significantly higher than that in Chinese fir forests (p < 0.05), and in fine macro-aggregates (0.25–2 mm) of broadleaved forests was significantly higher than that in Moso bamboo and Chinese fir forests (p < 0.05). While the aggregate-associated SOC storage in silt and clay fractions (<0.053 mm) showed the different trend, the aggregate-associated SOC storage in broadleaved forests was significantly lower than that in Moso bamboo and Chinese fir forests (p < 0.05). Aggregate-associated SOC storage in micro–aggregates (0.053–0.25 mm) in broadleaved and Moso bamboo forests were significantly higher than and Chinese fir forests (p < 0.05). The highest aggregate-associated SOC storage of broadleaved forests was in fine macro-aggregates (0.25–2 mm) (p < 0.05), while that of Moso bamboo and Chinese fir forests were in silt and clay fractions (<0.053 mm) (p < 0.05), while the lowest aggregate-associated SOC storage among three forests were in micro-aggregates (0.053–0.25 mm) (p < 0.05). The results of two–way ANOVA showed that aggregate fraction had a significant effect on aggregate-associated SOC concentration and storage, forest type and soil aggregate fraction had a significant interaction effect on aggregate-associated SOC concentration and storage.

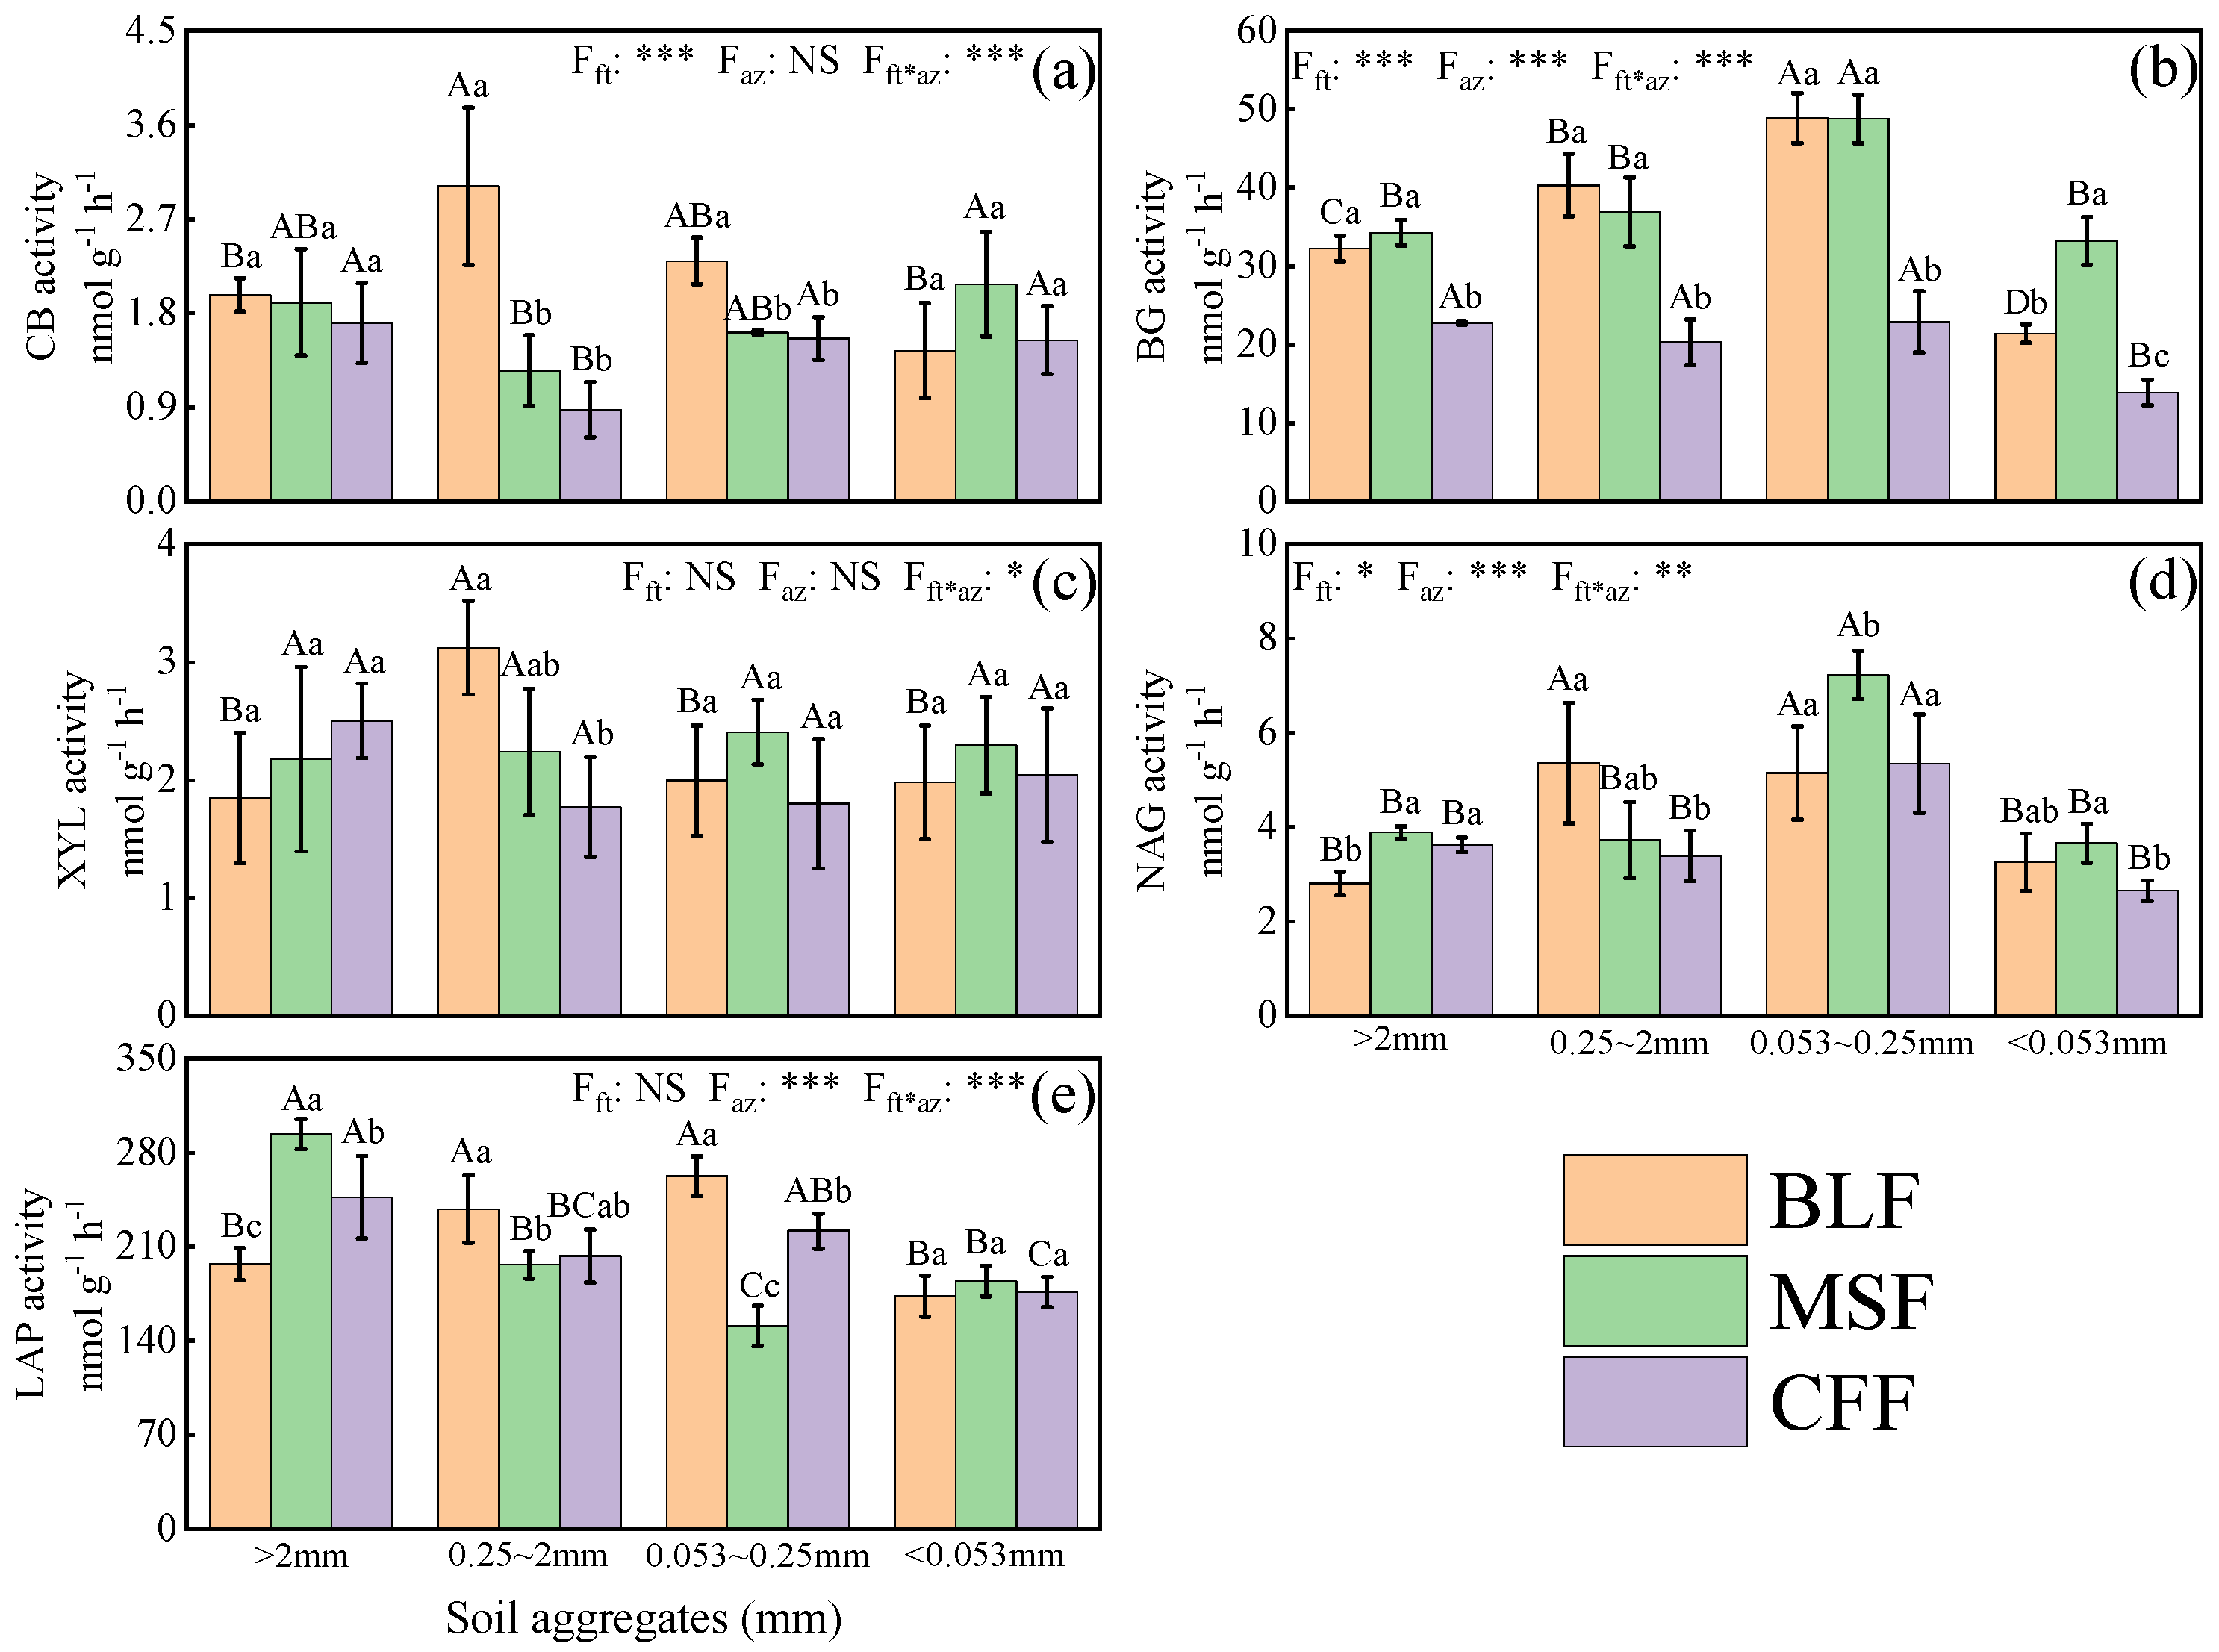
3.5. Soil Enzyme Activities

BG enzyme activity of macro-aggregates (>2 mm and 0.25–2 mm), micro-aggregates (0.053–0.25 mm) and silt and clay fractions (<0.053 mm) was significantly higher in broadleaved and Moso bamboo forests than in Chinese fir forests, and CB enzyme activity of fine macro-aggregates (0.25–2 mm) and micro-aggregates (0.053–0.25 mm) were significantly higher in broadleaved forests than in Moso bamboo and Chinese fir forests (Figure 5). NAG and LAP enzyme activities of coarse macro-aggregates (>2 mm) were significantly higher in Moso bamboo and Chinese fir forests than in broadleaved forests. XYL and NAG enzyme activities of fine macro-aggregates (0.25–2 mm) were significantly higher in broadleaved forests than in Chinese fir forests, and LAP enzyme activity was significantly higher in broadleaved forests than in Moso bamboo forests. NAG of micro-aggregates (0.053–0.25 mm) was significantly higher in Chinese fir forests than in broadleaved and Moso bamboo forests, while LAP enzyme activity showed the opposite trend. NAG enzyme activity of silt and clay fractions (<0.053 mm) was significantly higher in Moso bamboo forests than in Chinese fir forests. The results of two–way ANOVA showed that forest type had a significant effect on CB, BG and NAG enzyme activities, soil aggregates had a significant effect on BG, NAG and LAP enzyme activities, and there was a significant interaction between forest type and aggregates on CB, BG, XYL, NAG and LAP enzyme activities.

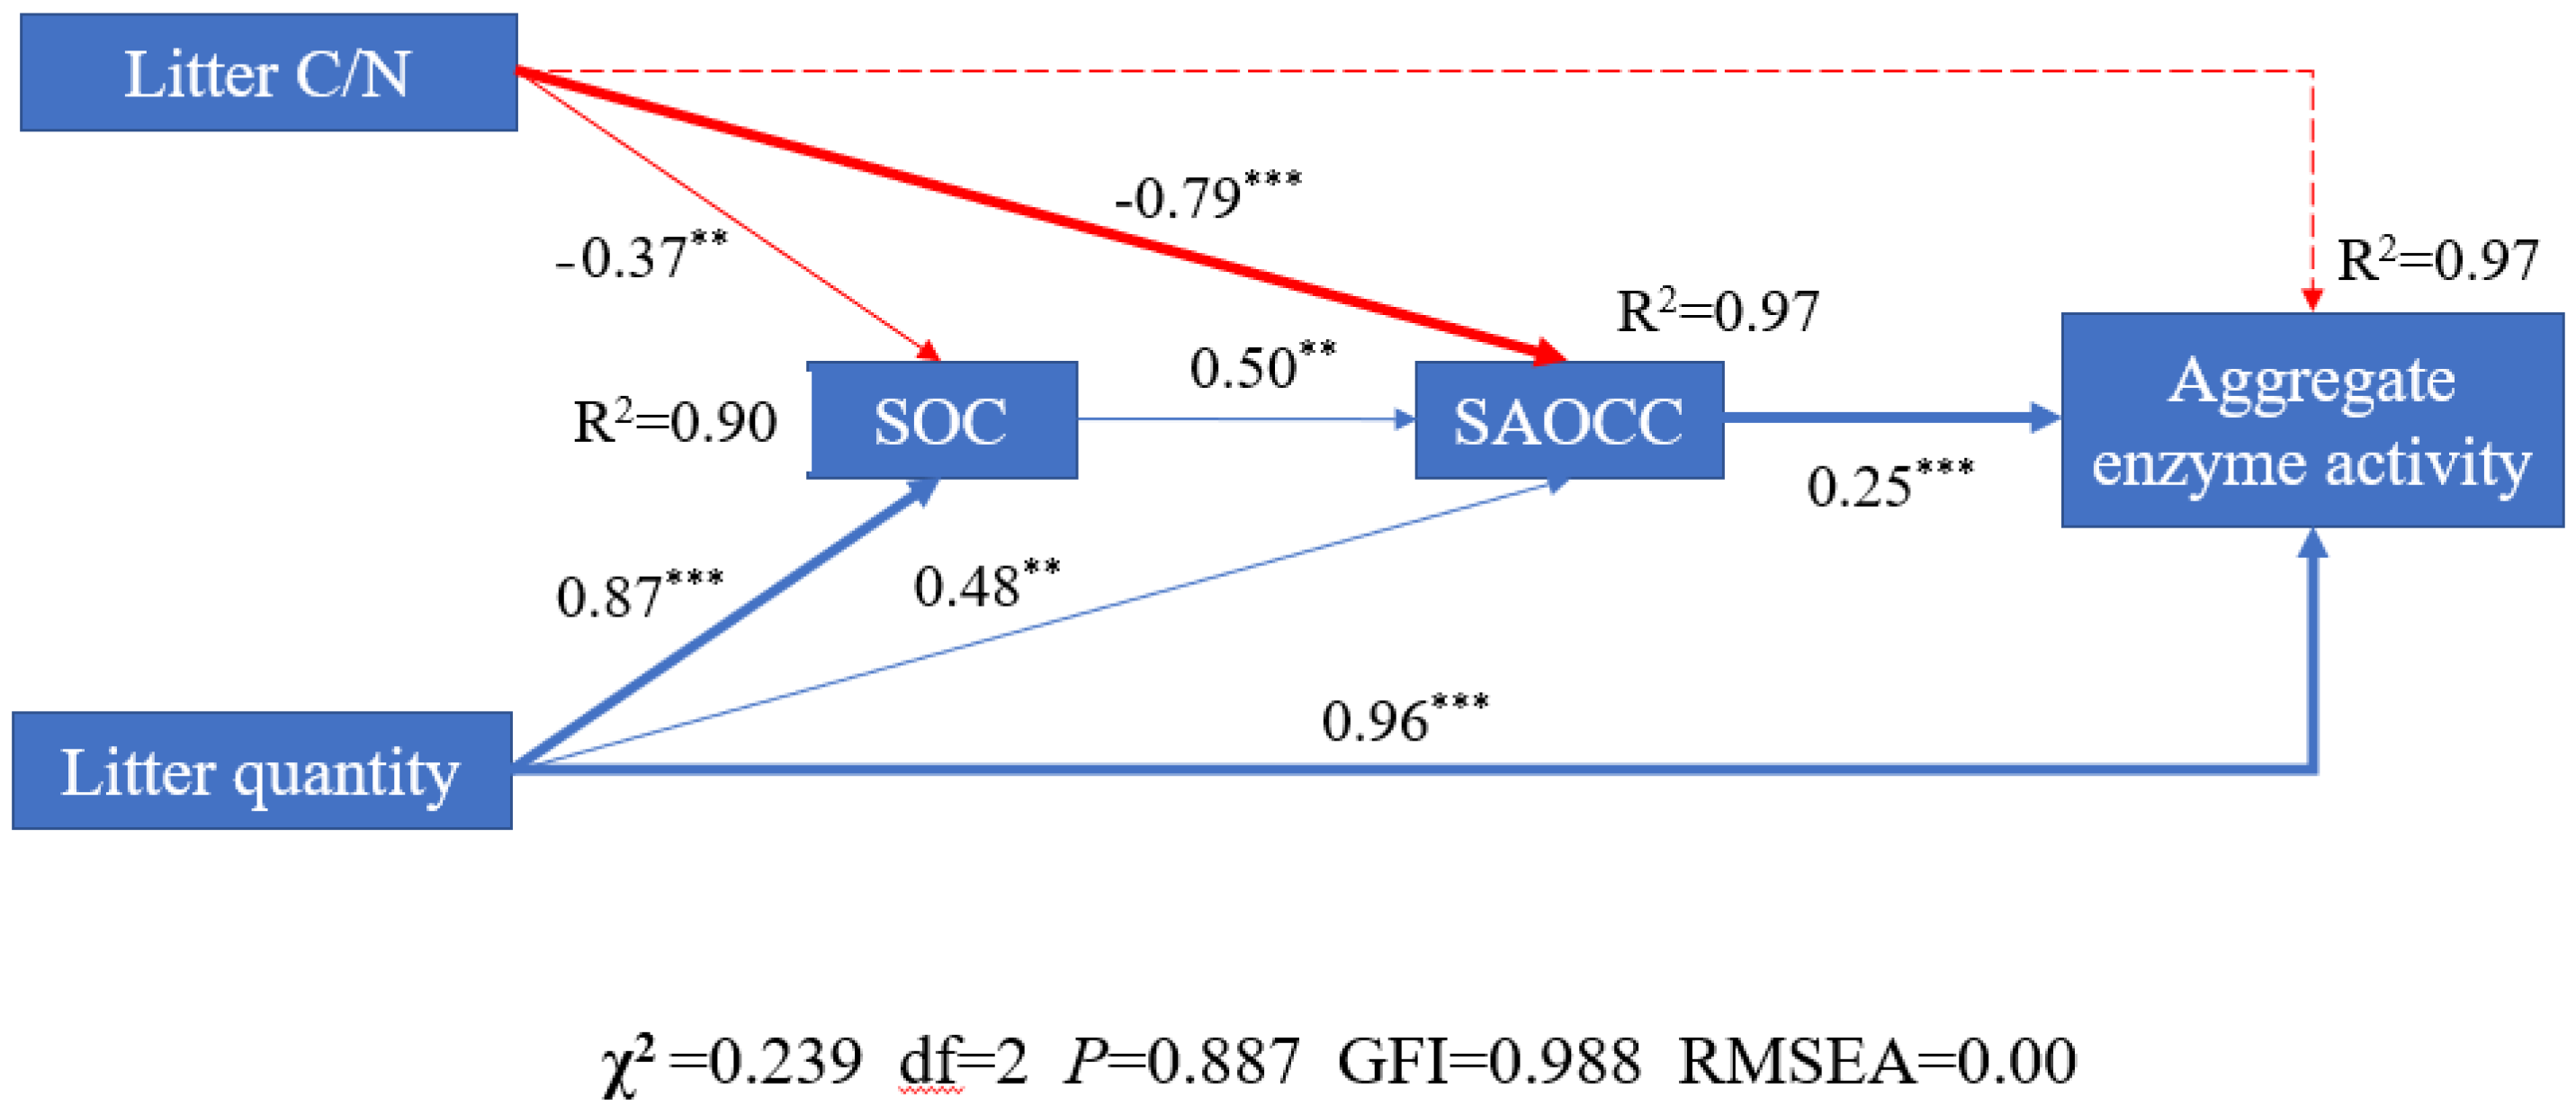
3.6. Relationship between Litter C/N, Litter Quantity, Soil Aggregate Organic C Contents and Aggregate Enzyme Activity

The SEM explained 97% of the variation in aggregate enzyme activity (Figure 6). Both litter quantity and litter C/N ratio directly impacted soil aggregate-associated carbon content (SAOCC) and indirectly affected the SAOCC by altering SOC, which explained 97% of the SAOCC, but litter quantity showed the positive relationships with SAOCC, and litter C/N ratio showed the negative relationships. The SEM analyses further suggested that litter quantity directly affected the aggregate enzyme activity and also indirectly affected aggregate enzyme activity by affecting SOC and SAOCC, and litter C/N ratio also indirectly affected aggregate enzyme activity by affecting SOC and SAOCC.

4. Discussion

4.1. Effect of Forest Types on the Distribution and Stability of Soil Aggregates

In the current study, we found that soil fine macro-aggregates were more easily formed in broadleaved and Moso bamboo forests with higher stability (Figure 3), while Chinese fir forest soil had more silt and clay fractions. Moreover, the correlation of macro-aggregates GMD and D with SOC highlights SOC as the main organic binding agent for soil aggregation in subtropical forest soils [23].
Litter is the main source of organic carbon in the forest soil. Input of broadleaved and Moso bamboo litter with high quality (low C/N ratio) and more labile compositions would increase SOC through the microbial in vivo pathway [24], and the increased SOC would act as a “glue” entrapping mineral particles, organic matter and debris, effectively stabilizing soil macro-aggregates and improving soil structure [7,25]. The low litter quantity of Chinese fir forests compared to broadleaved forests and Moso bamboo forests, along with relatively weak aggregate stability (lower GMD and higher D value) lead to easier dispersal of aggregates in Chinese fir forests. Therefore, the aggregates of Chinese fir forests are easy to disperse [23].

4.2. Effect of Forest Type on Soil Aggregate-Associated Carbon Content and Storage

Generally, soil aggregate-associated carbon content and storage was controlled by SOC, and correlation analyses also support this view (Supplementary, Figure S1). Chinese fir forests soil with lower SAOCC are not only unfavorable to aggregate formation, but also led to lower C storage in soil micro-aggregates than in broadleaved and Moso bamboo forests. SEM analysis suggested that litter quantity and quality play a critical role in soil aggregate-associated carbon content and storage through affecting SOC content. The lower quality of Chinese fir forest litter contains more recalcitrant components, such as tannins and waxes [26], which do not easily absorb onto the mineral surface, while more labile compounds in broadleaved forest litter are more easily bound to the clay minerals and maintained higher macro-aggregate-associated carbon content and storage. In addition, a large amount of litter covering the soil surface and higher canopy density in broadleaved forests could also protect macro-aggregate-associated carbon to avoid break up by rainfall. Thus, broadleaved forests have the highest macro-aggregate-associated carbon storage, whereas the combination of less litter and lower canopy density in Moso bamboo may disrupt macro-aggregates and release micro-aggregates, explaining the high C storage in micro-aggregates in Moso bamboo forests.
We also found that the soil aggregates-associated carbon storage of broadleaved forests were highest in fine macro-aggregates, while that of Chinese fir and Moso bamboo forests were highest in silt and clay fractions. (Figure 4). Because thick litter layer and dense canopy is suitable for carbon sequestration in fine macro–aggregates. Meanwhile, the thin litter layer and low canopy density of Moso bamboo forests and Chinese fir forest causes the destruction of macro-aggregates during rainfall. The macro–aggregates breakup exposes the organic carbon protected by the aggregates and accelerates the decomposition of OC by microorganisms, thus resulting in decrease of organic cement material in aggregates. Due to the silt and clay fraction being the most stable aggregate fraction, the OC in silt and clay fractions did not decrease, leading to highest aggregates associated carbon storage in silt and clay fractions of Chinese fir and Moso bamboo forests.

4.3. Activities of Soil Aggregate-Related C and N-Cycling Enzymes

The litter C/N ratio, litter quantity and aggregate-associated carbon content are important factors affecting enzyme activities (Figure 5, Supplementary Figure S2). The control of litter quantity and quality over microbial production of extracellular enzymes [27], and low litter C/N ratio of broadleaved and Moso bamboo forests litter increases the efficiency of microbial substrate utilization, leading to an increase in microbial biomass and promoting soil hydrolase activity [28,29]. Chinese fir forest litters with higher C/N ratio and more recalcitrant compounds (tannins and waxes) decomposed more slowly and released less nutrients than broadleaved and Moso bamboo forests litter [28]. Moreover, lower OC limited microbial growth in aggregate fractions, and they may decrease enzyme activities in aggregate fractions of Chinese fir forest soil. Higher enzyme activities in aggregate fractions indicate the higher C and N cycling in aggregate of broadleaved and Moso bamboo forests than Chinese fir forest, and litter input was one of the main reasons for control aggregate-related enzyme activity in typical subtropical forests.

5. Conclusions

The present research explicitly illustrated that enzyme activities in different soil aggregate fractions tended to vary significantly among different subtropical forest types. Different quantity and quality of litter inputs influence forest soil aggregation and SOC storage and moderate the pattern of aggregate-associated SOC concentration and C and N-cycling enzyme activities. We found that proportion of macro-aggregates, aggregate stability, macro-aggregate-associated carbon content and most aggregates-associated enzyme activities were higher in broadleaved and Moso bamboo forests than in Chinese fir forests, indicating that broadleaved and Moso bamboo forest showed great SOC sequestration capacity due to mineral protection and relatively high microbial activity. Thus, broadleaved and Moso bamboo forests play an important role in maintaining high storage and sink capacity of SOC in subtropical forest.

Supplementary Materials

The following supporting information can be downloaded at: https://www.mdpi.com/article/10.3390/f13081210/s1, Figure S1: Correlation between soil aggregates, aggregate–associated SOC concentration, aggregate–associated SOC stroage and physics–chemistry in three forest types; Figure S2: Correlation between enzyme activity, physics–chemistry and other proporties in three forest types and aggregate fractions.

Author Contributions

The initial idea for this research was conceived by Q.X., S.W., Z.W. and S.S. performed the experiments, collected and analyzed the data, and wrote the manuscript. S.W., B.F., X.M., H.L. and F.J. performed some of the lab work. S.W., C.L., J.C., H.Q., Q.X. and S.S. revised the manuscript. All authors have read and agreed to the published version of the manuscript.

Funding

This research was conducted by the support of “Pioneer” and “Leading Goose” R&D Program of Zhejiang: 2022C02036; Zhejiang Provincial Department of Education Foundation: Y202045039; Zhejiang Provincial Natural Science Foundation of China under Grant: LZ22C160001; National Natural Science Foundation of China: 41977083, 31971631; Scientific research and development fund of the Zhejiang A&F University: 2019FR067.

Conflicts of Interest

The authors declare no conflict of interest.

References

  1. Khan, K.S.; Mack, R.; Castillo, X.; Kaiser, M.; Joergensen, R.G. Microbial biomass, fungal and bacterial residues, and their rela tionships to the soil organic matter C/N/P/S ratios. Geoderma 2016, 271, 115–123. [Google Scholar] [CrossRef]
  2. Jing, X.; Chen, X.; Xiao, W.; Lin, L.; Wang, C.; He, J.S.; Zhu, B. Soil enzymatic responses to multiple environmental drivers in the Tibetan grasslands. Insights from two manipulative field experiments and a meta-analysis. Pedobiologia 2018, 71, 50–58. [Google Scholar] [CrossRef]
  3. Bach, E.M.; Hofmockel, K.S. Soil aggregate isolation method affects measures of intra-aggregate extracellular enzyme activity. Soil Biol. Biochem. 2014, 69, 54–62. [Google Scholar] [CrossRef]
  4. Qi, R.; Li, J.; Lin, Z.; Li, Z.; Li, Y.; Yang, X.; Zhang, J.; Zhao, B. Temperature effects on soil organic carbon, soil labile organic carbon fractions, and soil enzyme activities under long-term fertilization regimes. Appl. Soil Ecol. 2016, 102, 36–45. [Google Scholar] [CrossRef]
  5. Mori, T.; Imai, N.; Yokoyama, D.; Kitayama, K. Effects of nitrogen and phosphorus fertilization on the ratio of activities of carbon-acquiring to nitrogen-acquiring enzymes in a primary lowland tropical rainforest in Borneo, Malaysia. Soil Sci. Plant. Nutr. 2018, 64, 554–557. [Google Scholar] [CrossRef]
  6. Zheng, T.T.; Liang, C.; Xie, H.T.; Zhao, J.S.; Yan, E.S.; Zhou, X.H.; Bao, X.L. Rhizosphere effects on soil microbial community structure and enzyme activity in a successional subtropical forest. FEMS Microbiol Ecol. 2019, 95, 43. [Google Scholar] [CrossRef]
  7. Six, J.; Bossuyt, H.; Degryze, S.; Denef, K. A history of research on the link between (micro)aggregates, soil biota, and soil organic matter dynamics. Soil Tillage Res. 2004, 79, 7–31. [Google Scholar] [CrossRef]
  8. Tisdall, J.; Oades, J.M. Organic matter and water- stable aggregates in soils. Eur. J. Soil Sci. 1982, 33, 141–163. [Google Scholar] [CrossRef]
  9. Mummey, D.L.; Stahl, P.D. Analysis of soil whole- and inner-microaggregate bacterial communities. Microb. Ecol. 2004, 48, 41–50. [Google Scholar] [CrossRef]
  10. Tisdall, J.M.; Oades, J.M. Landmark Papers: No. 1. Organic matter and water-stable aggregates in soils. Eur. J. Soil Sci. 2012, 63, 8–21. [Google Scholar]
  11. Oades, J.M.; Waters, A.G. Aggregate hierarchy in soils. Soil Res. 1991, 29, 815–828. [Google Scholar] [CrossRef]
  12. Almajmaie, A.; Hardie, M.; Doyle, R.; Birch, C.; Acuna, T. Influence of soil properties on the aggregate stability of cultivated sandy clay loams. J. Soils Sediments 2017, 17, 800–809. [Google Scholar] [CrossRef]
  13. Allison, S.D.; Jastrow, J.D. Activities of extracellular enzymes in physically isolated fractions of restored grassland soils. Soil Biol. Biochem. 2006, 38, 3245–3256. [Google Scholar] [CrossRef]
  14. FAO. Global Forest Resources Assessment 2020; FAO: Rome, Italy, 2020. [Google Scholar] [CrossRef]
  15. Bai, K.D.; He, C.X.; Wan, X.C.; Jiang, D.B. Leaf economics of evergreen and deciduous tree species along an elevational gradient in a subtropical mountain. AoB Plants 2015, 7, 64. [Google Scholar] [CrossRef] [PubMed] [Green Version]
  16. Zhou, L.L.; Shalom, A.D.D.; Wu, P.F.; Li, S.B.; Jia, Y.Y.; Ma, X.Q. Litterfall production and nutrient return in different-aged Chinese fir(Cunninghamia lanceolata) plantations in South China. J. For. Res. 2015, 26, 79–89. [Google Scholar] [CrossRef]
  17. Xu, Q.F.; Liang, C.F.; Chen, J.H.; Li, Y.C.; Qin, H.; Fuhrmann, J.J. Rapid bamboo invasion (expansion) and its effects on biodiversity and soil processes +. Glob. Ecol. Conserv. 2020, 21, e00787. [Google Scholar] [CrossRef]
  18. Van Bavel, C.H.M. Mean Weight-Diameter of Soil Aggregates as a Statistical Index of Aggregation 1. Soil Sci. Soc. Am. J. 1950, 14, 20–23. [Google Scholar] [CrossRef] [Green Version]
  19. Duan, L.X.; Sheng, H.; Yuan, H.; Zhou, Q.; Li, Z.W. Land use conversion and lithology impacts soil aggregate stability in subtropical China. Geoderma 2021, 389, 114953. [Google Scholar] [CrossRef]
  20. Castrignanò, A.; Stelluti, M. Fractal Geometry and Geostatistics for describing the Field Variability of Soil Aggregation. J. Agric. Eng. Res. 1998, 73, 13–18. [Google Scholar] [CrossRef]
  21. Lu, R.K. Methods of Soil and Agro-Chemical Analysis; China Agricultural Science and Technology Press: Beijing, China, 2000. [Google Scholar]
  22. Saiya-Cork, K.R.; Sinsabaugh, R.L.; Zak, D.R. The effects of long term nitrogen deposition on extracellular enzyme activity in an Acer saccharum forest soil. Soil Biol. Biochem. 2002, 34, 1309–1315. [Google Scholar] [CrossRef]
  23. Aye, Y.Y.; Pampasit, S.; Umponstira, C.; Thanacharoenchanaphas, K.; Sasaki, N. Estimation of Carbon Emission Reductions by Managing Dry Mixed Deciduous Forest: Case Study in Popa Mountain Park. Low Carbon Econ. 2014, 5, 80–93. [Google Scholar] [CrossRef] [Green Version]
  24. Liang, C.; Schimel, J.P.; Jastrow, J.D. The importance of anabolism in microbial control over soil carbon storage. Nat. Microbiol. 2017, 2, 17105. [Google Scholar] [CrossRef] [PubMed]
  25. Cotrufo, M.F.; Wallenstein, M.D.; Boot, C.M.; Denef, K.; Paul, E. The Microbial Efficiency-Matrix Stabilization (MEMS) framework integrates plant litter decomposition with soil organic matter stabilization: Do labile plant inputs form stable soil organic matter? Glob. Chang. Biol. 2013, 19, 988–995. [Google Scholar] [CrossRef] [Green Version]
  26. Kögel-Knabner, I. The macromolecular organic composition of plant and microbial residues as inputs to soil organic matter. Soil Biol. Biochem. 2002, 34, 139–162. [Google Scholar] [CrossRef]
  27. Dornbush, M.E. Grasses, litter, and their interaction affect microbial biomass and soil enzyme activity. Soil Biol. Biochem. 2007, 39, 2241–2249. [Google Scholar] [CrossRef]
  28. Hu, Y.L.; Wang, S.L.; Zeng, D.H. Effects of Single Chinese Fir and Mixed Leaf Litters on Soil Chemical, Microbial Properties and Soil Enzyme Activities. Plant Soil 2006, 282, 379–386. [Google Scholar] [CrossRef]
  29. Sinsabaugh, R.L.; Lauber, C.L.; Weintraub, M.N.; Ahmed, B.; Allison, S.D.; Crenshaw, C.; Contosta, A.R.; Cusack, D.; Frey, S.; Gallo, M.E.; et al. Stoichiometry of soil enzyme activity at global scale. Ecol. Lett. 2008, 11, 1252–1264. [Google Scholar] [CrossRef]
Figure 1. The location of the sampling sites in ZheJiang Province, China. LH, LQ and HZ indicate the sampling sites, respectively. LH: Longtan ao Village, Linhai City; LQ: Baoxi Township, Longquan City; HZ: Linglong Mountain, Hangzhou City.
Forests 13 01210 g001
Figure 2. The comparison of the number of soil aggregates in different forest types of the same fraction and different fractions of the same forest type. Bars with different letters are significantly different (p < 0.05). Small letters indicate difference of soil aggregate proportion in three forest types with the same fraction. Large letters indicate difference of soil aggregate proportion in different fractions in the same forest types. Fft represents forest type, Faf represents aggregate fraction, NS indicates no significant difference, *: p < 0.05, ***: p < 0.001.
Forests 13 01210 g002
Figure 3. The comparison of the stability of aggregates in different forest types. MWD: mean weight diameter (a), GMD: geometric mean diameter (b), D: fractal dimension (c). Bars with different letters are significantly different (p < 0.05). Small letters indicate changes of soil aggregate stability in three forest types with the same fraction.
Forests 13 01210 g003
Figure 4. The comparison of soil aggregate carbon content (a) and storage (b) in different forest types of the same fraction and different fractions of the same forest type. Bars with different letters are significantly different (p < 0.05). Small letters indicate difference of soil aggregate organic C content in three forest types with the same fraction. Large letters indicate difference of soil aggregate organic C content in different fractions in same forest types. Fft represents forest type, Faf represents aggregate fraction, NS indicates no significant difference. *: p < 0.05, **: p < 0.01, ***: p < 0.001. The same below.
Forests 13 01210 g004
Figure 5. The comparison of soil aggregate enzymatic activities in different forest types of the same fraction and different fractions of the same forest type. CB: cellobiohydrolase (a), BG: β-glucosidase (b), XYL: β-xylosidase (c), NAG: N-acetylglucosaminidase (d),LAP (e): leucine aminopeptidase, respectively. Bars with different letters are significantly different (p < 0.05). Small letters indicate difference of soil enzyme activities in three forest types with the same fraction. Large letters indicate difference of soil enzyme activities in different fractions in the same forest types. Fft represents forest type, Faf represents aggregate fraction, NS indicates no significant difference, *: p < 0.05, **: p < 0.01, ***: p < 0.001.
Forests 13 01210 g005
Figure 6. Structural equation model revealing the direct and indirect effects of litter C/N, litter quantity, soil organic carbon and soil aggregate organic C content (SAOCC) on aggregate enzyme activity. **: p < 0.01, ***: p < 0.001. Arrows represent the directional influence of one variable upon another. The numbers adjacent to the arrows are standardized path coefficients. Blue and red arrows indicate positive and negative correlations, respectively. Continuous and dashed arrows indicate significant and insignificant relationships, respectively. SAOCC: soil aggregate organic C content, Litter C/N: carbon and nitrogen ratio of litter, SOC: soil organic carbon.
Forests 13 01210 g006
Table 1. Geographical coordinates, altitude, MAT, MAP and soil types of the study sites.
SitesLongitude (°E)Latitude
(°Nbr)
MAT (°C)MAP (mm)Altitude (m)Parent MaterialSoil TypeCanopy
Density
LH121°4′52″28°50′44″17.11550202GraniteFerralsol0.92
LQ118°45′55″28°00′10″17.61699193GraniteFerralsol0.75
HZ119°40′41″30°13′9″16.01613210GraniteFerralsol0.87
MAT: mean annual temperature; MAP: mean annual precipitation; LH: Longtan ao Village, Linhai City; LQ: Baoxi Township, Longquan City; HZ: Linglong Mountain, Hangzhou City.
Table 2. Annual litter production and soil physical and chemical properties of different forest types (mean ± SE).
Forest TypesBLFMBFCFF
Canopy density0.92 ± 0.02 a0.63 ± 0.02 b0.77 ± 0.03 c
Annual litter production (t hm−2)11.11 ± 1.63 a5.71 ± 0.37 b7.25 ± 0.31 b
Litter C/N 35.33 ± 2.28 b31.3 ± 1.96 b49.76 ± 4.62 a
Soil organic carbon (g kg−1)18.47 ± 1.11 a13.08 ± 0.61 b10.82 ± 1.44 c
Total N (g kg−1)1.61 ± 0.32 a1.66 ± 0.12 a0.9 ± 0.07 b
C/N11.83 ± 0.93 a7.91 ± 0.69 b12.19 ± 0.86 a
Alkaline N (mg kg−1)47.83 ± 7.29 a35.93 ± 2.38 b28.93 ± 2.25 b
pH4.37 ± 0.07 b4.83 ± 0.13 a4.65 ± 0.15 a
Available K (mg kg−1)89.33 ± 8.62 a64.67 ± 7.37 b73.67 ± 3.21 b
Sand (2~0.02 mm)%33.13 ± 5.23 a26.86 ± 8.54 a35.71 ± 7.09 a
Silt (0.02~0.002 mm)%40.57 ± 8.21 a40.63 ± 11.42 a35.29 ± 5.16 a
Clay (<0.002 mm)%26.30 ± 9.36 a32.51 ± 10.26 a29.00 ± 6.42 a
BLF: Broadleaved forest; MBF: Moso bamboo forest; CFF: Chinese fir forest; Alkaline N: alkaline nitrogen; Available K: available potassium. The same below. Lowercase letters indicate significant difference.
Publisher’s Note: MDPI stays neutral with regard to jurisdictional claims in published maps and institutional affiliations.

