Article

Comparative Transcriptome and Pigment Analyses Reveal Changes in Gene Expression Associated with Flavonol Metabolism in Yellow Camellia

1
State Key Laboratory of Tree Genetics and Breeding, Research Institute of Subtropical Forestry, Chinese Academy of Forestry, Hangzhou 311400, China
2
Zhejiang Construction Technician College, Hangzhou 311400, China
*
Author to whom correspondence should be addressed.
Forests 2022, 13(7), 1094; https://doi.org/10.3390/f13071094
Submission received: 23 May 2022 / Revised: 8 July 2022 / Accepted: 11 July 2022 / Published: 12 July 2022
(This article belongs to the Section Genetics and Molecular Biology)

Abstract

:
The accumulation of various pigments leads to the formation of different flower colors in plants. However, the regulation mechanism of yellow flower formation and flower color differences between Camellia nitidssima C.W.Chi (CN) and its hybrids C. ‘Zhenghuangqi’ (ZHQ), C. ‘Huangxuanlv’ (HXL), and C. ‘Xinshiji’ (XSJ), remains largely unknown. Here, we showed that the content of two flavonols, quercetin-7-O-glucoside (Qu7G) and quercetin-3-O-glucoside (Qu3G), was positively correlated with the yellow degree of petals in CN and its three hybrids. Additionally, we performed a comparative transcriptomic analysis of petals of the four yellow camellia plants, which revealed 322 common upregulated and 866 common downregulated DEGs (differentially expressed genes) in the CN vs. ZHQ, CN vs. HXL, and CN vs. XSJ comparison groups. Their regulatory pathway analysis showed that flavonol biosynthesis genes (FLSs and GTs) and transcriptional regulatory genes MYBs were all expressed higher in CN than its three hybrids, which corresponded to differences in the flavonol content among the four yellow camellias. Further, two ethylene synthesis genes (ACSs, ACO) and three ethylene signaling genes (EIN2s, EIN3, ERFs) were all upregulated in the yellow petals of CN. In conclusion, the expression of flavonol-related genes and flavonols (Qu7G and Qu3G) accumulation could play a key role in the formation of yellow flowers in camellia, and the ethylene pathway might be involved in the regulation of yellow flower formation of camellias. This work describes the possible regulatory pathway of yellow camellia, thereby laying a foundation for future verification of genes linked to flower coloring and the breeding of yellow camellia.

1. Introduction

Flower color is one of the main ornamental traits of ornamental plants and an important determinant of the quality and value of flowers [1]. Camellia is one of the top 10 traditional flowers sold in China and among the most precious woody flowers worldwide, possessing high ornamental worth and great economic value [2]. Globally, camellia is widely used as a garden plant, but its flower colors are almost exclusively limited to red, pink, and white [3]. Notably, camellia varieties with yellow flowers are scarce, accounting for less than 1% of camellia varieties [4,5]. In camellia, yellow flower is an excellent ornamental trait. Additionally, compared with other colors of petals, yellow camellia has higher market value [4]. Therefore, the breeding of yellow camellia plants is crucial.
Camellia nitidssima is a rare and prized species of camellia with yellow waxy petals, first discovered in Guangxi Province of China in 1933, since honored as ‘giant panda in the plant world’ and ‘the queen of camellia’ [5]. It became famous for its unique golden flower color and was listed as a national first-class protected plant in China [3]. Accordingly, C. nitidssima is now an extremely rare but important germplasm for studying the mechanism of yellow flower formation and for breeding yellow camellia [6].
To obtain new varieties of yellow camellia, researchers have used C. nitidssima as a hybrid parent for cross breeding. After decades of exploration, a number of hybrid varieties had been produced but their flowers’ degree of yellowing was not as golden as that of C. nitidssima, in that the petals of most hybrid varieties appeared very light yellow, such as those of C. ‘Zhenghuangqi’ (a hybrid of C. nitidssima and C. japonica ‘Yinbai Chalisi’), and C. ‘Huangxuanlv’ and C. ‘Xinshiji’ (two hybrids of C. nitidssima and C. japonica ‘Baifeng’) [5,6].
Plant flower color is determined by the type and content of pigments in petal cells, which is synergistically regulated by many factors, such as pH, metal ions, among other factors (Supplementary Figure S1) [7,8,9]. Plant pigments can be broadly divided into flavonoids, carotenoids, and betalains [10]. Flavonoids are the largest pigment group and exist widely in plants, being the decisive factor determining flower color in most species [11,12] and capable of giving rise to different colors, such as red, purple, blue, and yellow [7,13]. The basic structure of flavonoids consists of a C15 carbon skeleton (C6-C3-C6) that contains two benzene rings and a heterocyclic ring [14]. Based on the rings’ degrees of oxidation and hydroxylation, flavonoids are divided into anthocyanin, flavonol, dihydroflavonol, flavone, isoflavone, leucoanthocyanidin, pro-anthocyanidin, chalcone, aurone, flavanone, and phlobaphene classes [15]. Studies have shown that flavonoids are the main pigments of camellia flower [16,17], and the accumulation of flavonol might be key to the formation of yellow flowers in C. nitidssima [2,16,18]. In recent years, transcriptome and metabolic analyses have been used to reveal the mechanism of color formation. Combined analysis of transcriptome and metabolomics of flavonoid biosynthesis revealed the metabolism of different colors formation in Safflower [19]. In Lycoris sprengeri, integrated metabolomics and transcriptome analysis gave an insight of the potential mechanism of petal color formation [20].
Previously, we collected plants of C. nitidssima in addition to its hybrids C. ‘Zhenghuangqi’, C. ‘Huangxuanlv’, and C. ‘Xinshiji’. However, the mechanism of molecular regulation by which flower color differs between the C. nitidssima and its three hybrids is still unclear. Here, we explore the differences in flower color between C. nitidssima and its hybrids with a view to elucidate the underlying molecular mechanism responsible for C. nitidssim’s yellow flower formation. To do this, we used CN and its hybrids C. ‘Zhenghuangqi’, C. ‘Huangxuanlv’, and C. ‘Xinshiji’ as study materials, and pigment analysis of seven flavonols and RNA sequencing (RNA-seq) were carried out to identify the differences in pigment and potential pathways and the yellow color-related genes.

2. Materials and Methods

2.1. Plant Materials and Sample Preparation

The plants of C. nitidssima and its hybrids C. ‘Zhenghuangqi’, C. ‘Huangxuanlv’, and C. ‘Xinshiji’ came from the Camellia Germplasm Resources of Institute of Subtropical Forestry, Chinese Academy of Forestry (Daqiao road, Hangzhou city, Zhejiang province), grown in the field and were about 10 years old. Their petals at the complete opening stage were harvested (Figure 1), then immediately frozen in liquid nitrogen, and stored at −80 °C until needed for the analyses.

2.2. Flavonol Content Measurement

Seven flavonols, quercetin-7-O-glucoside (Qu7G), quercetin-3-O-glucoside (Qu3G), Quercetin-3-O-rutinoside (Qu3R), kaempferol-3-O-glucoside (Ka3G), dihydrokaempferol (DHK), quercetin (Qu), and kaempferol (Ka), were detected in the petals of four camellias using high performance liquid chromatography (HPLC) as described previously [21].

2.3. RNA Extraction and RNA-seq

Petal samples of four camellias were ground to a powder in liquid nitrogen for their RNA extractions. Total RNA was extracted using the DP441 plant kit (TIAGEN, Beijing, China) and determined using the NanoDrop 1000 (ThermoFisher, Waltham, MA, USA) and Agilent 2100 (Agilent Technologies, Palo Alto, CA, USA). A total amount of 1 µg RNA per sample was used as input material for the RNA sample preparations. Sequencing libraries were generated using NEBNext® UltraTM RNA Library Prep Kit for Illumina® (NEB, Ipswich, MA, US) following the manufacturer’s recommendations and index codes were added to attribute sequences to each sample. RNA-Seq was performed using the Illumina HiSeqTM 2000 platform (Illumina, San Diego, CA, USA).

2.4. Read Filtering and De Novo Assembly

Raw reads were obtained by sequencing using synthesis technology. Raw data was provided in fastq format, which mainly included the sequence information of sequencing fragments and the corresponding sequencing quality information. Fastp software [22] was used to strictly control the quality of raw reads, and clean reads were obtained by filtering. The filtering criteria were as follows: (1) removed reads with adaptors; (2) removed reads in which unknown bases (N) were more than 10%; and (3) removed low-quality reads (reads in which the base number of Qphred ≤ 20 accounted for more than 50% of the whole read length). At the same time, Q20, Q30, and GC content of the clean data were calculated for quality control. All the down-stream analyses were based on the clean data with high quality. After filtering the reads, Trinity [23] was used to perform de novo assembly of clean reads. Sequence alignment of this clean data with the assembled unigene library was performed, and the mapped reads used for subsequent analyses. To ensure the quality of the sequencing, the quality evaluation was carried out from the following three different angles: (1) the randomness of mRNA fragmentation and mRNA degradation were evaluated by examining the distribution of inserted fragments on unigenes (the results showed in the “randcheck” folder of the supplementary material); (2) the dispersion degree of the length of the inserted fragment was evaluated by drawing the length distribution map of the inserted fragment (the results are shown in the “insertsize” folder of the supplementary material); and (3) evaluating whether the library capacity and the mapped reads were sufficient by drawing the saturation map (the results are shown in the “saturation” folder of the supplementary material).

2.5. Functional Annotation and Differential Expression Analysis

After assembly, BLAST software [24] was used to compare sequences of unigenes with seven databases: NR (NCBI nonredundant protein), Swiss-Prot, GO (Gene Ontology), COG (Cluster of Orthologous Groups), KOG (euKaryotic Ortholog Groups), eggNOG4.5, and KEGG (Kyoto Encyclopedia of Genes and Genomes). The results for the KEGG orthology were obtained by KOBAS 2.0 [25]. HMMER [26] software was used to compare the corresponding amino acid sequences of unigenes to the Pfam database. Expression levels were estimated using Bowtie [27] and RSEM [28], and fragments per kilobase of per million mapped reads (FPKM) was used to convey the expression level of the corresponding unigene. FPKM can eliminate the influence of difference in gene length and sequencing amounts when quantifying gene expression. To obtain the differentially expressed genes (DEGs) between the two given groups, the DESeq [29] method was applied. Finally, the designated DEGs were subjected to GO functional and KEGG biological pathway analyses. All DEGs were annotated to the biological process, cellular component, and molecular function by the GO database with topGO R-packages-based Kolmogorov–Smirnov test (http://www.bioconductor.org/packages/release/bioc/html/topGO.html, accessed on 7 June 2021). All DEGs were annotated to KEGG biological pathways using the KEGG database. KEGG is a database resource for understanding high-level functions and utilities of the biological system, such as the cell, the organism, and the ecosystem, from molecular-level information, especially large-scale molecular datasets generated by genome sequencing and other high-throughput experimental technologies (http://www.genome.jp/kegg, accessed on 7 June 2021). Additionally, we used KOBAS [25] software to test the statistical enrichment of differential expression genes in KEGG pathways.

2.6. Quantitative Real-Time PCR (qRT-PCR) Analysis

To verify the transcriptome sequencing results, the candidate DEGs, flavonol-, and ethylene-related genes, were selected for qRT-PCR analysis. Primer Premier 5.0 [30] was used to design the gene-specific primers (Supplementary Table S1), and Glyceraldehyde 3-phosphate dehydrogenase (GAPDH) was used as the internal reference gene. The qRT-PCR were carried out as described previously [31]. Three separate experiments of qRT-PCR were performed.

2.7. Statistical Analysis

Statistical analyses were carried out using SPSS (v22.0) software (SPSS Inc., Chicago, IL, USA). The data shown are the mean ± SE of three separate experiments, and the significant differences between treatments were evaluated using Tukey’s Honest Significant Difference test at p ≤ 0.05 and p ≤ 0.01 after one-way ANOVA.

3. Results

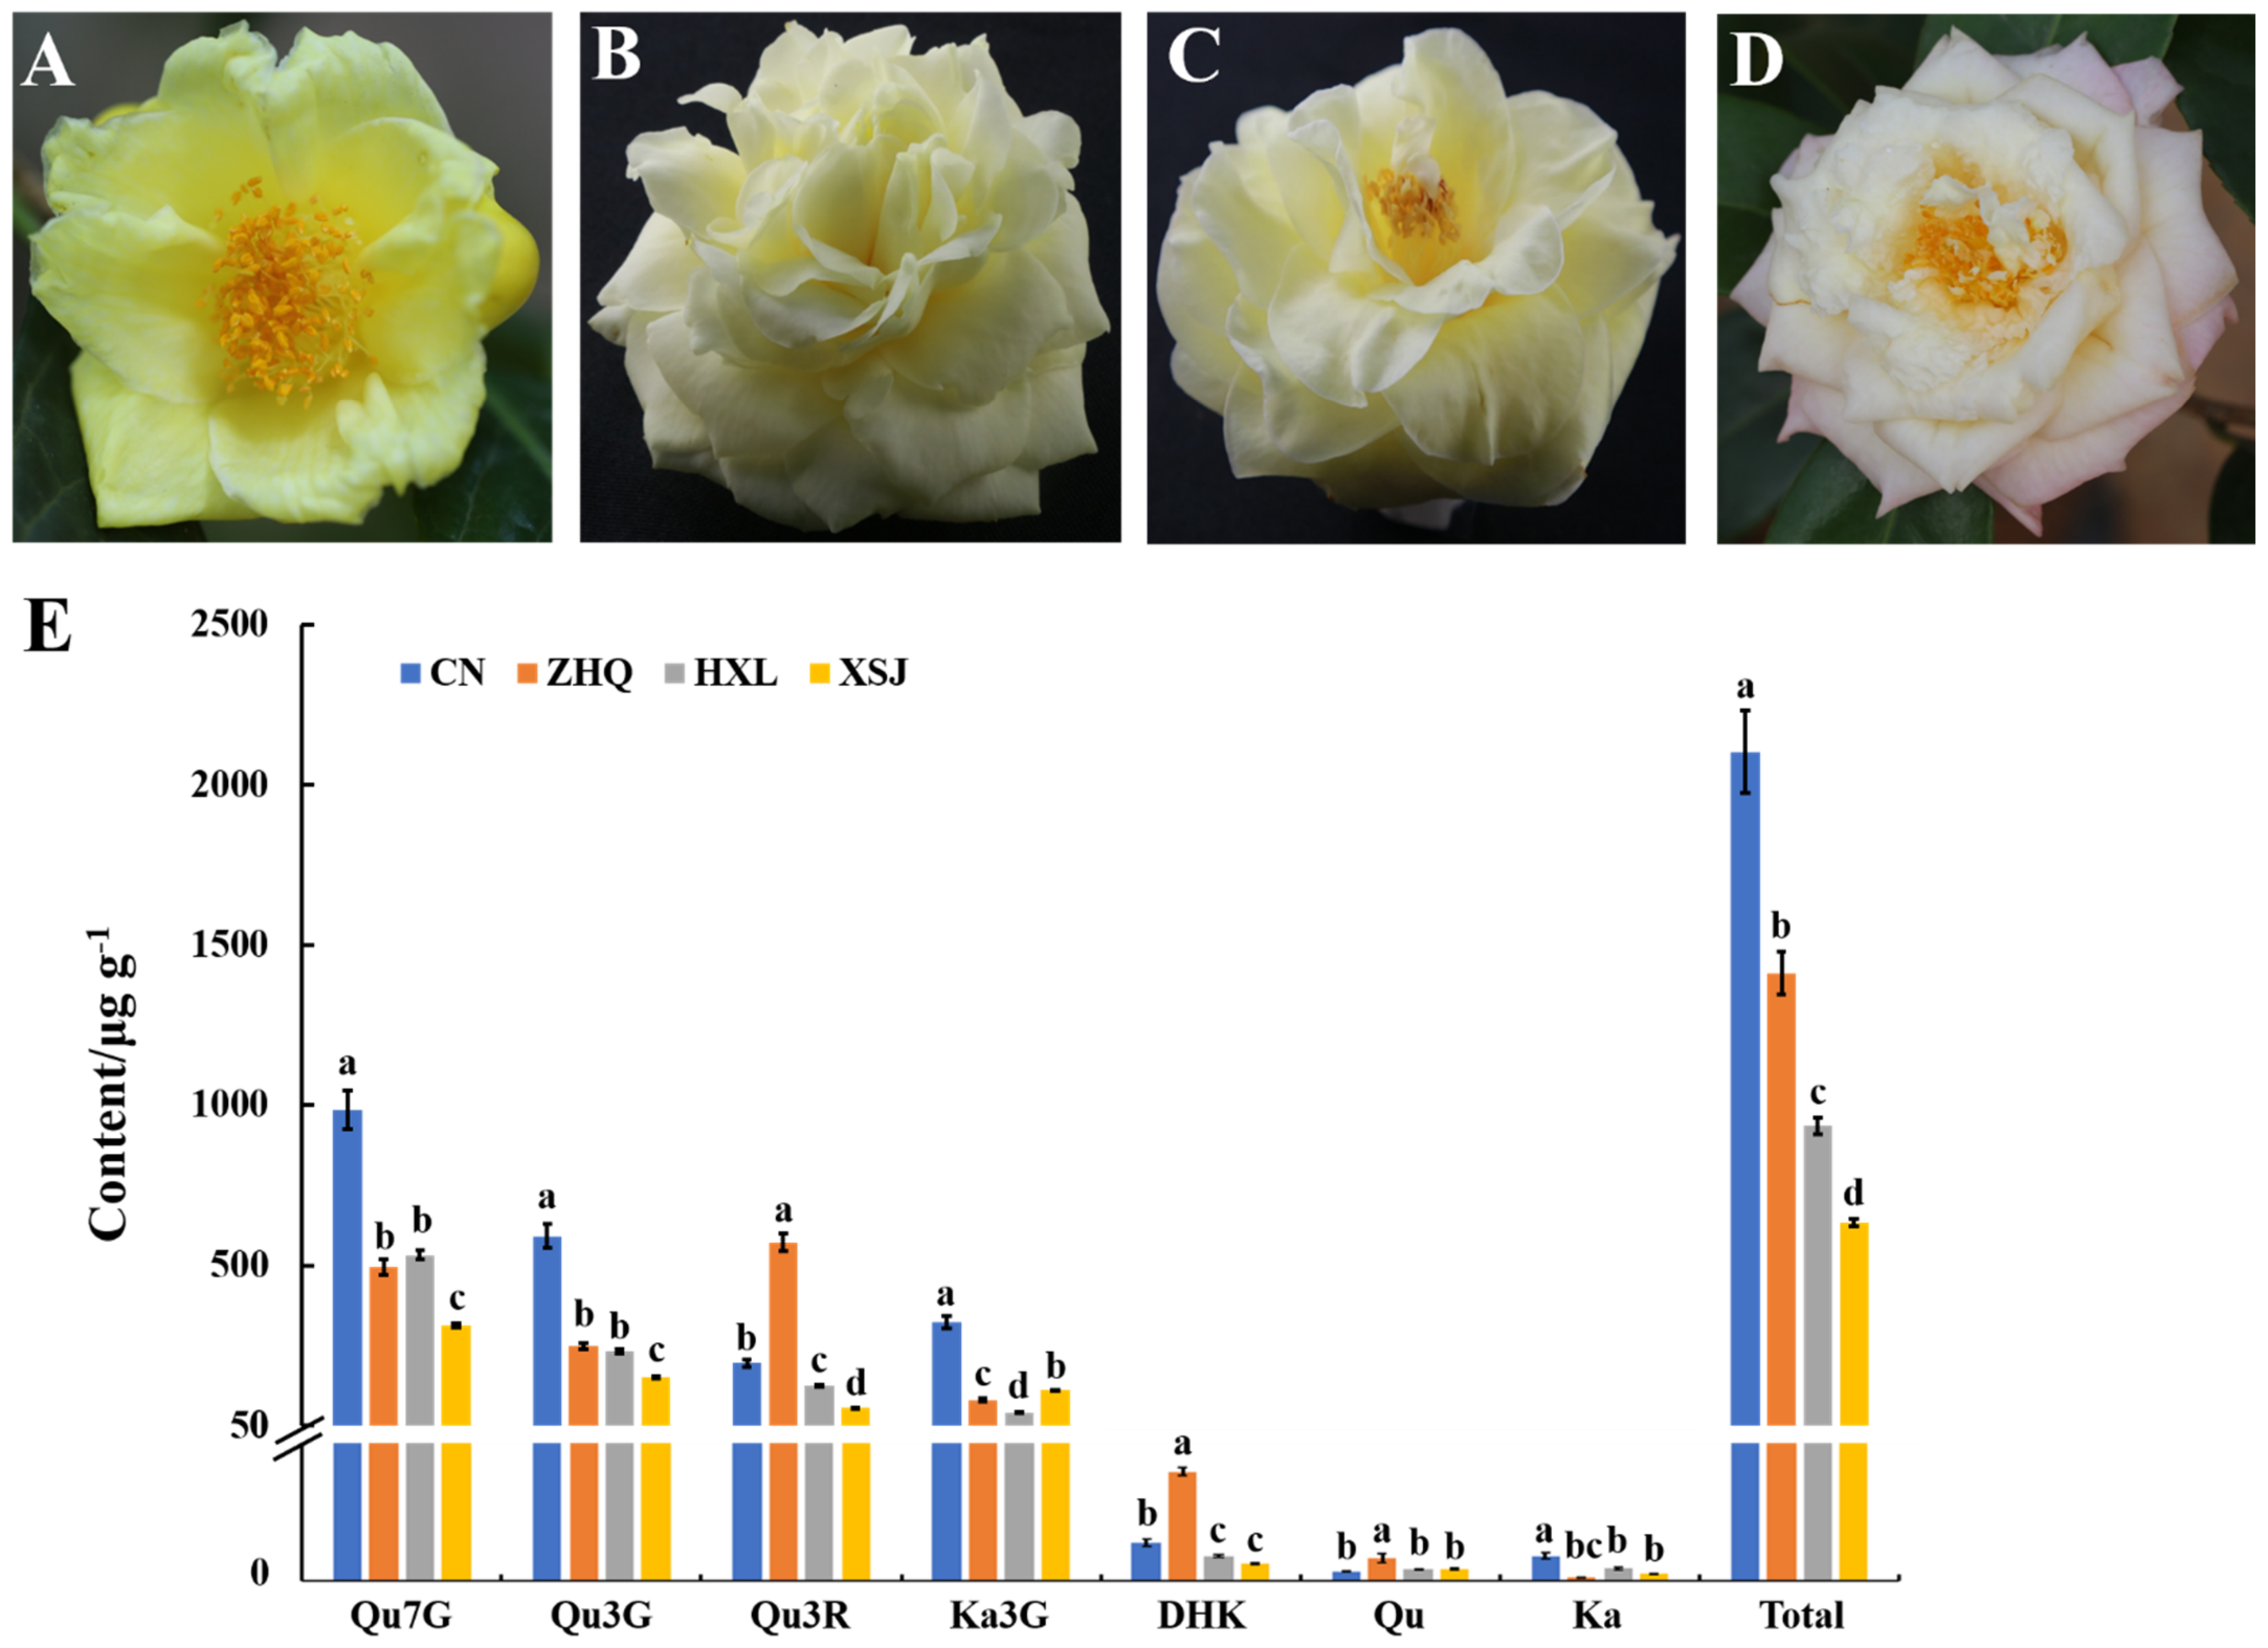
3.1. Morphology Analysis and Pigment Accumulation among Camellia with Different Colors

The petals of C. nitidssima (CN) were golden yellow, and those of C. ‘Zhenghuangqi’ (ZHQ), C. ‘Huangxuanlv’ (HXL), and C. ‘Xinshiji’ (XSJ) were light yellow and white with slightly pink, respectively, which were not as yellow as those of CN (Figure 1A–D). To detect the difference in pigment in the petals of CN and its hybrids ZHQ, HXL and XSJ, seven flavonols were measured using high performance liquid chromatography (HPLC). Quercetin-7-O-glucoside (Qu7G), quercetin-3-O-glucoside (Qu3G), quercetin-3-O-rutinoside (Qu3R), and kaempferol-3-O-glucoside (Ka3G) were the main pigment components, and the content of dihydrokaempferol (DHK), quercetin (Qu), and kaempferol (Ka) was low (Figure 1E). The content of Qu7G was the highest in CN, HXL, and XSJ, while the highest content in ZHQ was Qu3R (Figure 1E). In contrast, the total content of 7 flavonols in CN was higher than its hybrids ZHQ, HXL, and XSJ. In addition, the content of Qu7G and Qu3G was positively correlated with the yellow degree of petals in CN and its hybrids ZHQ, HXL, and XSJ.

3.2. Transcriptome Sequencing and Assembly

To better understand gene expression patterning in flowers of four yellow camellia plants, CN and its hybrids ZHQ, HXL, XSJ-12 libraries, consisting of four groups with three replicates each, were generated for transcriptome sequencing with Illumina HiSeq platform. After quality filtering, a total of 87.71 Gb clean data were generated by Illumina HiSeq sequencing (NCBI number: SRR17460017–SRR17460027). The clean data of all samples was not less than 6.79 GB, with an average of 7.31 GB, and the clean reads ratio was between 98.50% and 98.92% (Supplementary Table S2). The percentage of Q30 base was 91.14% or more, and GC content reached 44.45%–46.30%. After sequence assembly, we finally obtained 104,037 transcript sequences and 78,064 unigenes. The average length of a unigene was 980.2 bp, with an N50 value of 1501 bp (Supplementary Figure S2). Sequence alignment was performed between the clean data and the assembled transcript or unigene library, for which the mapped ratio reached 58.98%–61.83% (Supplementary Table S2). Using three different angles to evaluate the quality of the resulting assembly, the results showed that the assembly results were good (Supplementary Material).

3.3. Functional Annotation of Unigenes

To annotate the unigenes, their sequences were compared with seven functional databases (NR, KOG, GO, COG, KEGG, SwissProt, and eggNOG) by using BLAST software. Then, after predicting their amino acid sequences, HMMER software compared them with the Pfam database. Finally, 39,886 unigenes with annotation information were obtained, equivalent to an annotation percentage of 51.09% (Supplementary Table S2). As Supplementary Table S3 shows, the number of annotated unigenes in those eight databases ranged from 10,907 to 38,864, corresponding to annotated percentages spanning 17.67% to 49.78%.

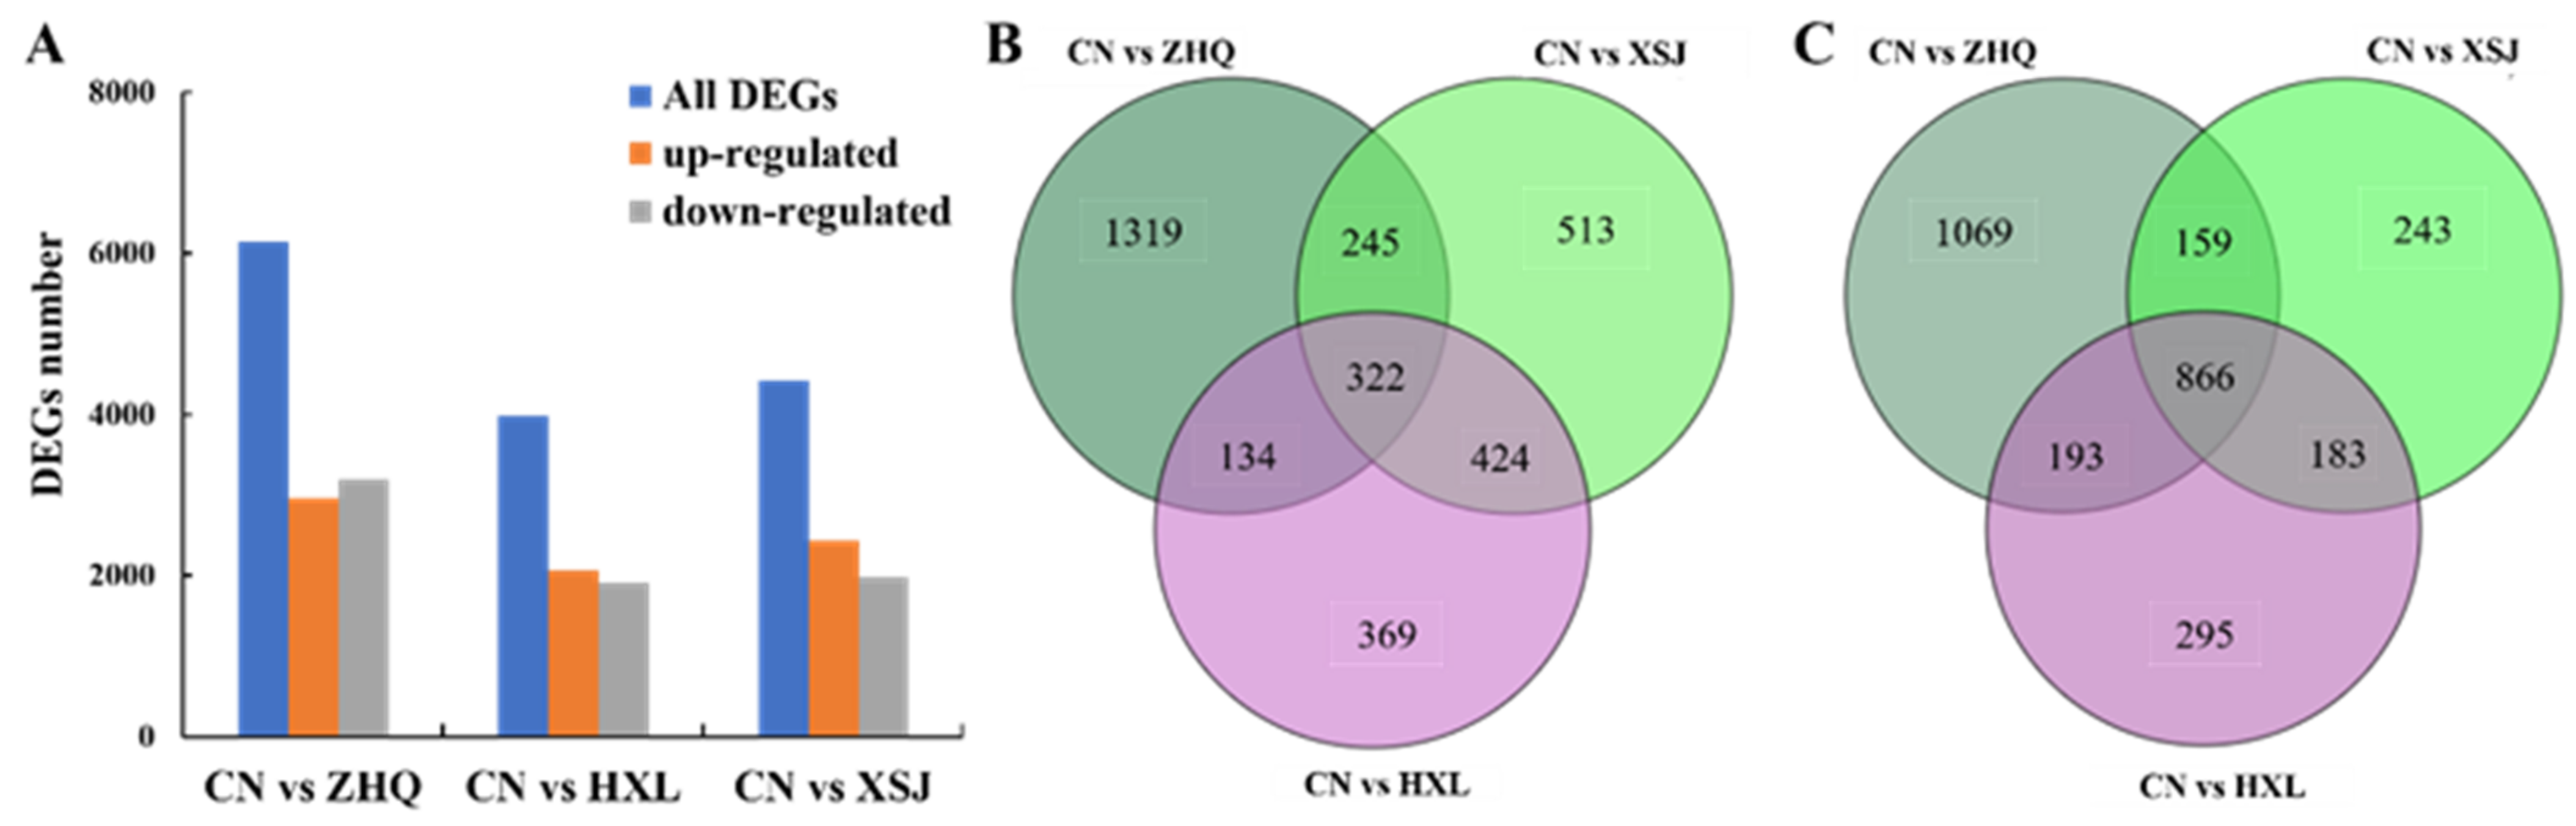
3.4. Differential Expression Analysis

To understand the differences in gene expression between CN and its hybrids ZHQ, HXL, and XSJ, we carried out a differential expression analysis. Using the log2 (FC) ≥ 4 and FDR ≤ 0.01 as criteria thresholds, differentially expressed genes (DEGs) were screened out. In the comparison sets of CN vs. ZHQ, CN vs. HXL, and CN vs. XSJ, there were 6141, 3975, and 4412 DEGs, which consisted of 2956, 2062, and 2433 upregulated DEGs and 3185, 1913, and 1979 downregulated DEGs, respectively (Figure 2A). In addition, their Venn diagram showed that 322 and 866 common DEGs were identified in the upregulated and downregulated DEGs (Figure 2B,C). These results indicated that the common upregulated and downregulated DEGs might be related to the discrepancy in petal coloring between the CN and its hybrids ZHQ, HXL, and XSJ.

3.5. Gene Ontology (GO) Classification and Functional Enrichment Analysis of DEGs

To reveal the functional categories of the DEGs found, their GO analysis was performed. The DEGs were clustered into biological process, cellular component, and molecular function. The enriched GO terms of the three sets, CN vs. ZHQ, CN vs. HXL, and CN vs. XSJ, were similar (Supplementary Figure S3). The proportions represented by the terms metabolic process, cellular process, and single-organism process were the highest under the biological process category. Cell, cell part, organelle, and membrane were the main terms classified under the cellular component category. Both catalytic activity and binding were the main terms classified under the molecular function category.
To gain insights into gene-related functions and their pathways, KEGG and functional enrichment were also performed. Among the highly expressed metabolic pathways, those of starch and sucrose metabolism, plant–pathogen interaction, phenylpropanoid and flavonoid biosynthesis, and plant hormone signal transduction were predominantly enriched (Supplementary Figure S4). In our previous work [4,17], we showed that flavonoids were the main pigment components of the camellia flower. Therefore, phenylpropanoid and flavonoid biosynthesis might be related to the differential petal coloring of CN vis-à-vis its hybrids ZHQ, HXL, and XSJ.

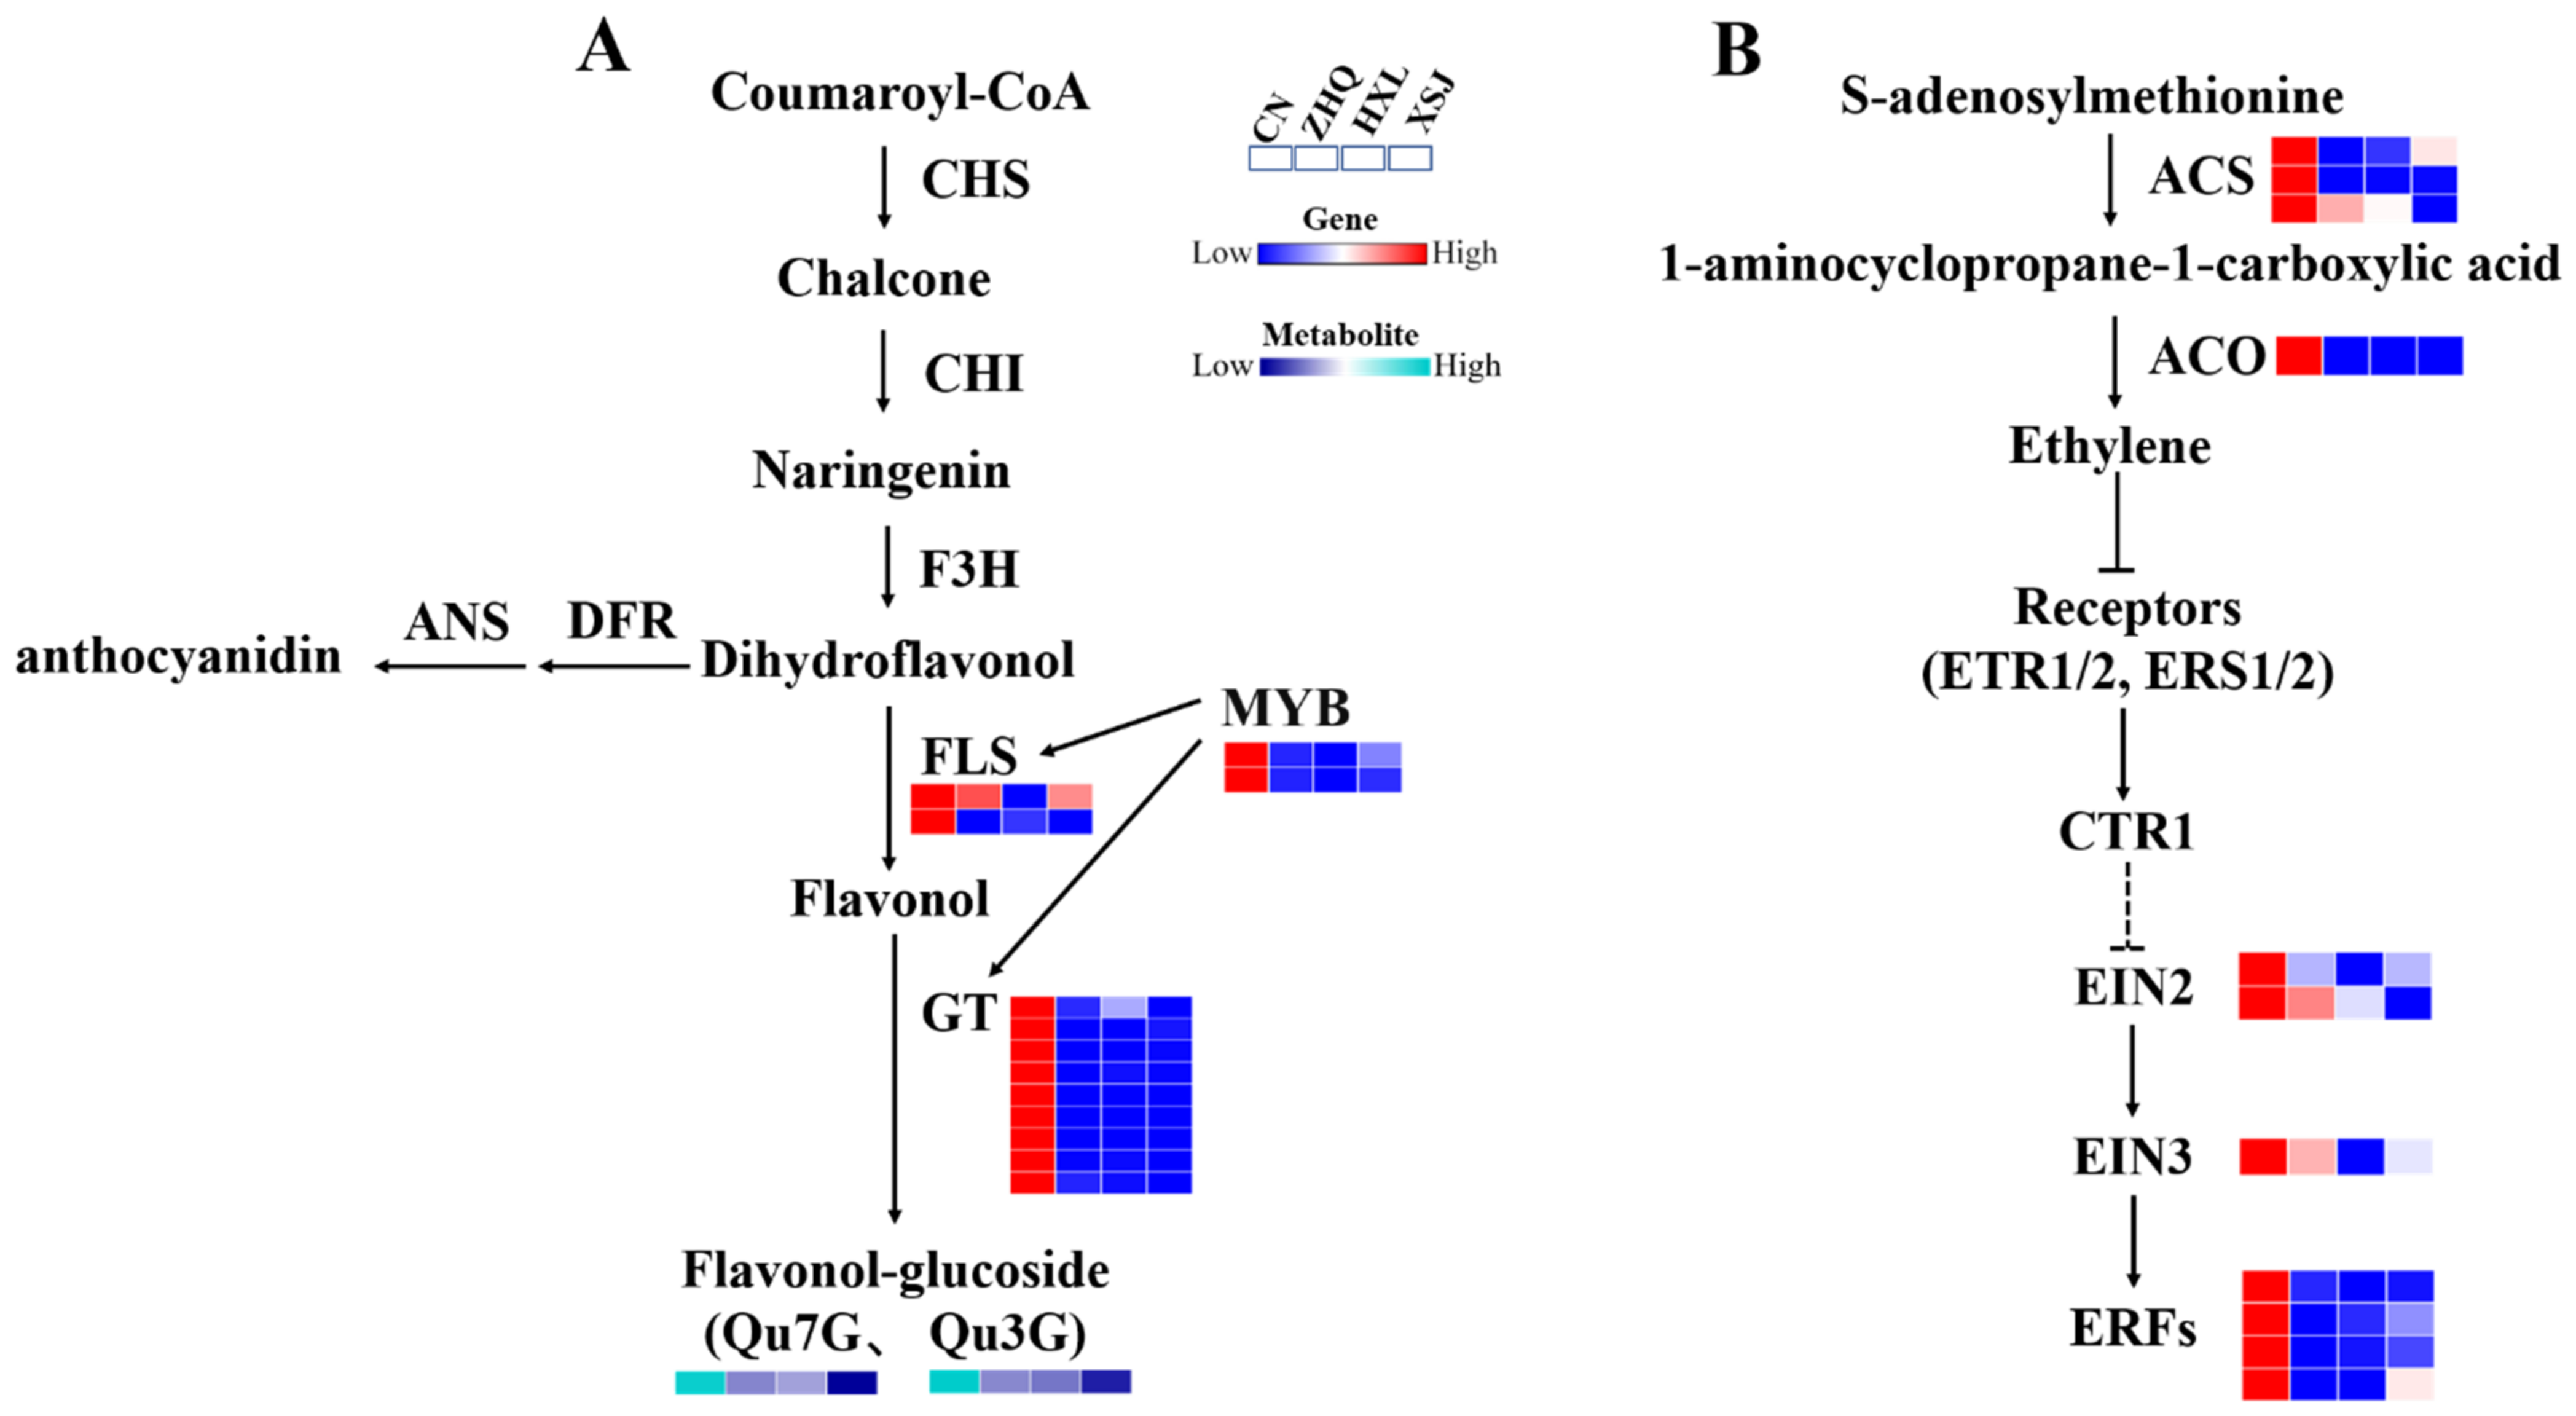
3.6. Flavonol Metabolism and Regulation

To investigate the molecular mechanism responsible for flower color differences between CN and its hybrids ZHQ, HXL, and XSJ, we further compared the DEGs of phenylpropanoid and flavonoid biosynthesis, and flavonol biosynthesis- and regulation-related genes were identified. First, two flavonol synthase (FLS) genes (c114511.graph_c1 and c132672.graph_c1), the key ones needed for flavonol biosynthesis, were upregulated in CN (Figure 3A). Second, the expression of many glycosyltransferase (GTs) genes, which promote the glycosylation and stabilization of flavonoids, were also decreased in the hybrids of CN (Figure 3A). Similarly, two MYB transcription factors (c134185.graph_c1 and c140967.graph_c2), the key transcriptional regulators of flavonol synthesis, also underwent reduced expression in the hybrids ZHQ, HXL, and XSJ (Figure 3A). Taken together, these results revealed that flavonol biosynthesis (FLSs and GTs) and regulation (MYBs) genes all displayed decreased expression in the hybrids of CN, which corresponded to the decrease in flavonols accumulation (Figure 1E).

3.7. Ethylene May Be Involved in Flower Color Formation in Yellow Camellia

In the functional enrichment analysis of DEGs (Supplementary Figure S3), many plant hormone-related genes were identified. To investigate their possible regulation pathways, we further compared the DEGs of hormone-related genes, finding that many ethylene-related genes exhibited changes in expression, including ethylene synthesis and ethylene signaling genes. Expression of the ethylene synthesis genes ACSs (c140113.graph_c1, c132432.graph_c1 and c147573.graph_c0) and ACO (c95148.graph_c0) was downregulated in the hybrids ZHQ, HXL, and XSJ (Figure 3B). Furthermore, the ethylene signaling genes EIN2 (c128783.graph_c0 and c128783.graph_c1), EIN3 (c140267.graph_c1), and ERFs (c108582.graph_c1, c127403.graph_c0, c138285.graph_c0, and c96422.graph_c1) all exhibited low expression levels in the hybrids ZHQ, HXL, and XSJ (Figure 3B). The results revealed that the ethylene pathway might be positively correlated with the formation of yellow flowers in camellia.

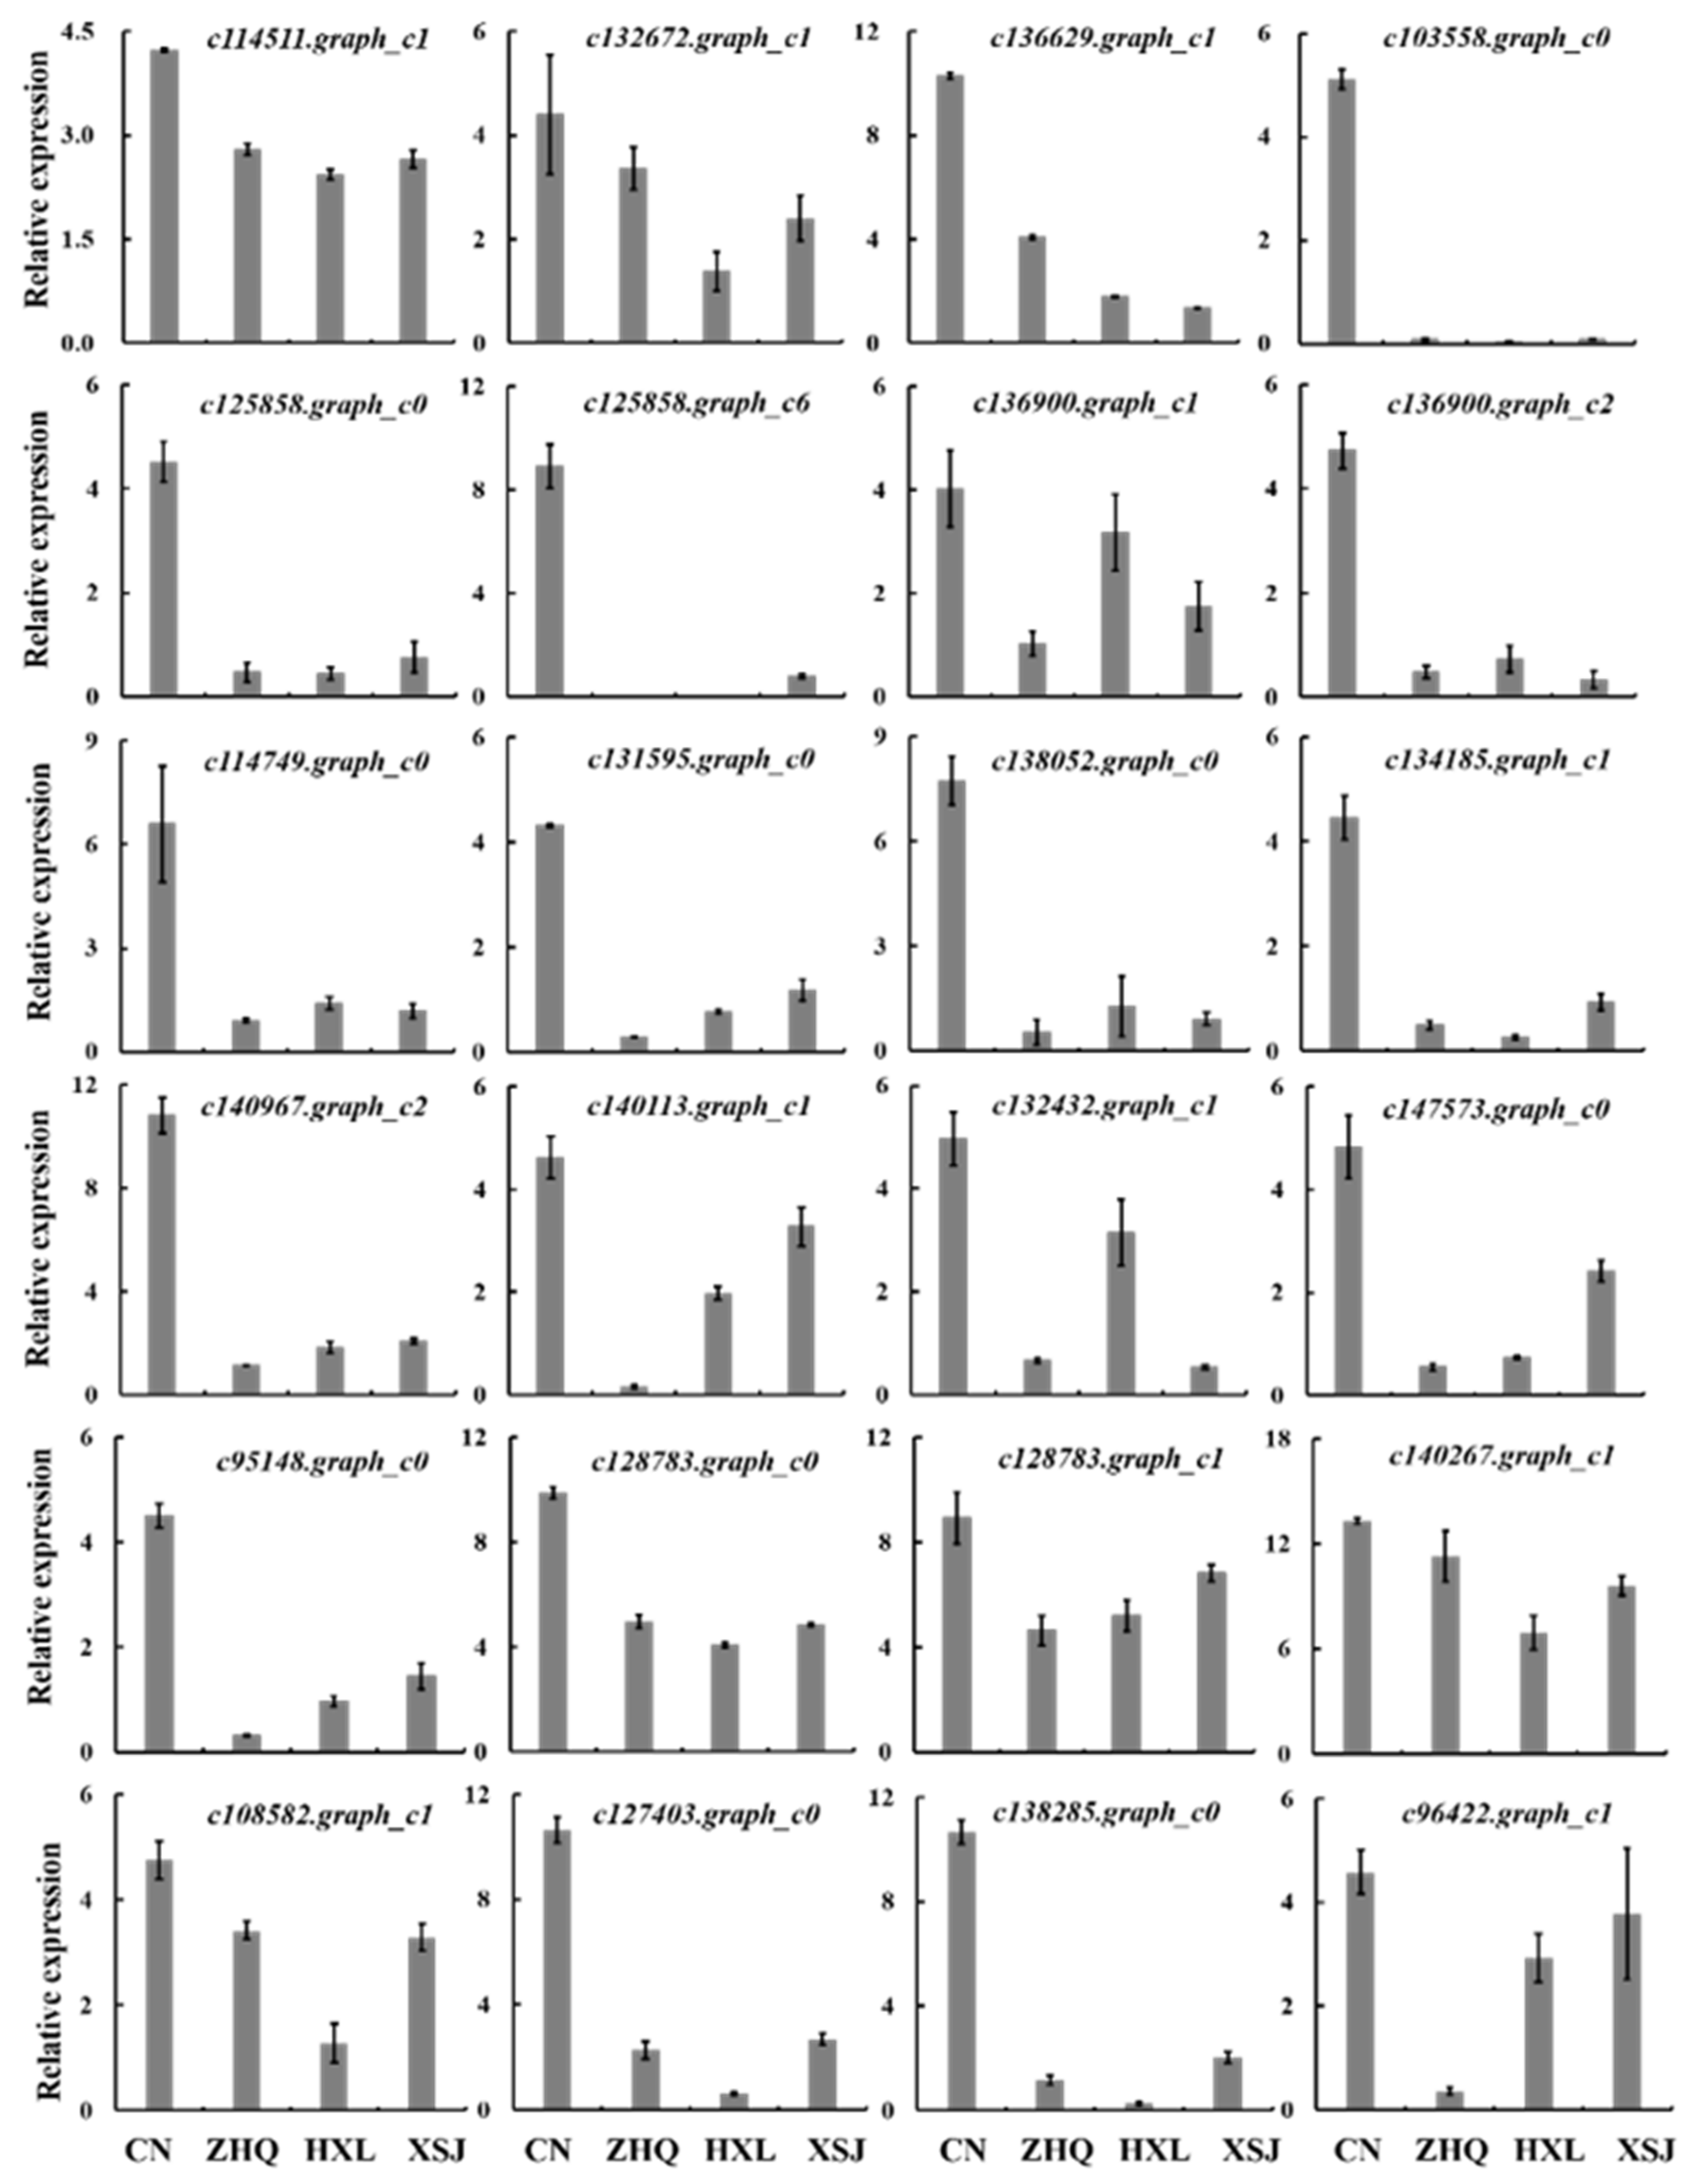
3.8. Validation of Candidate Genes of Flavonol and Ethylene with Quantitative Real-Time PCR

To validate the reproducibility and reliability of the RNA-seq data, 13 flavonol-related genes (Figure 3A) and 11 ethylene-related genes (Figure 3B) were selected for further investigations via qRT-PCR. This included two FLSs genes (c114511.graph_c1 and c132672.graph_c1), nine GTs genes (c136629.graph_c1 to c138052.graph_c0), two MYBs genes (c134185.graph_c1 and c140967.graph_c2), three ACSs genes (c140113.graph_c1, c132432.graph_c1 and c147573.graph_c0), one ACO gene (c95148.graph_c0), two EIN2 genes (c128783.graph_c0 and c128783.graph_c1), one EIN3 gene (c140267.graph_c1), and four ERFs genes (c108582.graph_c1, c127403.graph_c0, c138285.graph_c0, and c96422.graph_c1). The expression of these 24 genes in CN is higher than that in ZHQ, HXL, and XSJ. Their expression patterns according to qRT-PCR (Figure 4) were consistent with those of the RNA-seq data (Figure 3); thus, indicating that the RNA-seq were precise and trustworthy.

4. Discussion

4.1. Flavonol Metabolism in Flower Color Formation of Yellow Camellia

Flower color is an important ornamental trait and a commercial evaluation indicator of camellias. Varieties of yellow flower are scarce in camellia, so the breeding of yellow camellia has always been one focus of camellia research [6]. CN was the first reported and one of the few camellia species known to produce golden-colored flowers [3], suggesting that it would be an excellent parent for the breeding of yellow camellia varieties. However, the outcomes of yellow flower breeding of CN have been ineffective so far, and the petal color of the hybrid species is evidently not as golden as that of CN, as exemplified by the hybrids ZHQ, HXL, and XSJ [21]. Previous research showed that the accumulation of flavonols, such as Qu3G, Qu7G, and Qu3R, was the key in the flower color formation of CN [2,18]. In this study, HPLC analysis revealed that there was higher accumulation of flavonols in CN, and the content of Qu7G and Qu3G was consistent with the yellow degree of petals in CN and its hybrids ZHQ, HXL, and XSJ (Figure 1E). The results indicated that Qu7G and Qu3G might be the main flavonols affecting the yellowness of petals in camellia.
Here, we expanded on that work, using transcriptome analyses of the petals of CN and its hybrids to elucidate the molecular regulation mechanism generating the flower color difference. Firstly, differential expression analysis showed that two FLS genes (Figure 3) in CN had greater expression levels than its hybrids ZHQ, HXL, and XSJ. FLS is a pivotal, rate-limiting enzyme in flavonol biosynthesis [32]. The expression level of FLS was positively correlated with the flavonol content in Dendrobium officinale [33]. Overexpression of C. sinensis CsFLSa/b/c in tobacco increased the kaempferol (a flavonol) content [34]. Ectopic expression of CnFLS1 in tobacco promoted the accumulation of Qu3G and Qu7G [16]. These findings, when coupled with ours here, suggest that FLS promotes flavonols (Qu7G and Qu3G) accumulation and further induces the formation of yellow flowers in CN.
Second, nine GTs were also downregulated in hybrids ZHQ, HXL, and XSJ when compared with CN (Figure 3A). In plants, most flavonoids, such as flavonol, flavone, and so on, usually exist in a glycoside form [11]. Glycosylation changes the hydrophilicity of flavonoids, increasing their solubility and chemical stability, which contributes to their storage and transport in cells and organisms [35]. Glycosidation of flavonol is thus a crucial step in its metabolic pathway. In rice, a glycosyltransferase (OsUGT706C2) gene promotes the glycosylation of kaempferol, luteolin, and chrysoeriol (flavones) [36]. Fh3GT2 (flavonoid 3-O-glycosyltransferase) preferentially controlled glycosylation of kaemprerol while Fh3GT1 encodes an enzyme that glycosylated quercetin and anthocyanidins in Freesia hybrida [37]. In CN, the main pigment compound of its yellow flower was glycosylated flavonol, Qu7G, and Qu3G. These results implied that nine upregulated GTs in CN might participate in the accumulation of Qu7G and Qu3G, which promoted the formation of its golden yellow flower.
Simultaneously, we uncovered higher expression of two MYB genes in CN compared with its hybrids ZHQ, HXL, and XSJ (Figure 3A). MYBs are the main transcriptional regulator of flavonoid metabolism in plants. In Cucumis sativus, the MYB transcription factor CsMYB60 activated the expression of CsFLS by binding to its promoter, and thereby promoted the synthesis of flavonols [38]. FhMYB1 activated Fh3GT2 and promoted flavonol accumulation, and this then affected the formation of flower color [37]. In our study, the expression patterns of these two MYB genes matched those of the FLSs and GTs mentioned above (Figure 3A). The results suggested that these two MYB genes could be involved in regulation of flavonol (Qu7G and Qu3G) biosynthesis and color formation of petals in CN. However, whether these two MYBs regulate FLSs and GTs in CN to influence flavonol synthesis remains to be verified in future research.

4.2. Ethylene May Be Involved in the Regulation of Yellow Flower Formation in Camellia

Ethylene is a key plant hormone, one that participates in a variety of plant growth and development pathways, such as fruit ripening [39], leaf and petal senescence [40,41], and so on. Some studies have shown that ethylene is also involved in the regulation of flavonoid metabolism [42,43]. In apple, transcription factor MdbHLH3 induced anthocyanin accumulation, which positively regulated ethylene biosynthesis by directly binding to ethylene biosynthesis genes MdACO1, MdACS1, and MdACS5 and activating their expression [44]. In our study, the expression of ACSs and ACO was positively correlated with flavonol content in petals of four yellow camellias. In CN, ethylene synthesis genes were evidently upregulated (Figure 3B), which implied that ethylene accumulation increased to some extent. These results indicate that ethylene might be involved in the regulation of yellow flower formation in camellia. An ethylene precursor 1-aminocyclopropane-1-carboxylic acid treatment increased the content of quercetin and kaempferol [45]. Moreover, ethylene is able to induce fruit coloration during fruit ripening in apple by increasing the expression of MdMYB1, an activator of flavonoid biosynthesis [11].
Overexpression of the EIN2 activates ethylene signaling and then increases the expression of flavonoid-related genes and the accumulation of flavonol [46]. Two ethylene response factors ERFs, Pp4ERF24 and Pp12ERF96, interacted with PpMYB114 to activate the expression of PpMYB114-mediated PpUFGT and promote anthocyanin biosynthesis in ‘Red Zaosu’ pear [47]. Similarly, the ethylene signaling genes EIN2s, EIN3, and ERFs were also upregulated in CN, providing further evidence that ethylene could participate in flavonol metabolism. Comparing the four yellow camellia plants, several ethylene synthesis genes (ACSs, ACO) and ethylene signaling genes (EIN2s, EIN3, ERFs) were all upregulated in CN only. These results implied that ethylene might be involved in the regulation of yellow flower formation in camellia.

5. Conclusions

Transcriptome and pigment analyses of petals were used for the identification and functional classification of DEGs between CN and its hybrids ZHQ, HXL, and XSJ, in order to investigate the mechanism for flower color differentiation. The results showed that the content of two flavonols, Qu7G and Qu3G, was positively correlated with the yellow degree of petals. Additionally, flavonol-biosynthesis-related genes (FLSs, GTs, and MYBs) were expressed more in CN, which corresponded to this plant’s high content of flavonol (Qu7G and Qu3G), suggesting that flavonol accumulation plays a key role in yellow flower formation of camellia. Importantly, ethylene synthesis genes (ACSs, ACO) and ethylene signaling genes (EIN2s, EIN3, ERFs) were all upregulated in the yellow petals of CN, indicating that the ethylene pathway is perhaps related to flavonol metabolism and further involved in the formation of yellow petals in CN. Further analyzing the molecular regulation mechanism involved and screening of key genes will lay a foundation for the successful breeding of yellow flowers in camellia plants.

Supplementary Materials

The following supporting information can be downloaded at: https://www.mdpi.com/article/10.3390/f13071094/s1, Supplementary Table S1. Sequences of primers used for the qRT-PCR; Supplementary Table S2. Summary of sequencing reads; Supplementary Table S3. Summary of the functional annotation results of unigenes; Supplementary Figure S1. Regulation of flower color in plants. In red are those factors related to this article.; Supplementary Figure S2. Distribution diagram of unigenes. Supplementary Figure S3. Gene ontology (GO) analysis of CN vs. ZHQ (A), CN vs. HXL, (B) and CN vs. XSJ (C); Supplementary Figure S4. KEGG and functional enrichment analysis of CN vs. ZHQ (A), CN vs. HXL (B), and CN vs. XSJ (C).

Author Contributions

W.L. wrote the manuscript with contributions from W.L., Y.F., S.Y., R.M. and K.W. Both M.F. and Z.F. created the figures and tables. H.Y. and J.L. edited the manuscript and organized the references. X.L. critically reviewed and corrected the manuscript. All authors have read and agreed to the published version of the manuscript.

Funding

This work was funded by National Key R&D Program of China (2020YFD1000500), Zhejiang Science and Technology Major Program on Agricultural New Variety Breeding (2021C02071-2) and Fundamental Research Funds of CAF (CAFYBB2021QD001-1).

Institutional Review Board Statement

Not applicable.

Informed Consent Statement

Not applicable.

Data Availability Statement

NCBI number (SRR17460017–SRR17460027).

Conflicts of Interest

The authors declare no conflict of interest.

References

  1. Sasaki, N.; Nakayama, T. Achievements and Perspectives in Biochemistry Concerning Anthocyanin Modification for Blue Flower Coloration. Plant Cell Physiol. 2015, 56, 28–40. [Google Scholar] [CrossRef] [PubMed]
  2. Li, X.; Fan, Z.; Guo, H.; Ye, N.; Lyu, T.; Yang, W.; Wang, J.; Wang, J.T.; Wu, B.; Li, J.; et al. Comparative Genomics Analysis Reveals Gene Family Expansion and Changes of Expression Patterns Associated with Natural Adaptations of Flowering Time and Secondary Metabolism in Yellow Camellia. Funct. Integr. Genom. 2018, 18, 659–671. [Google Scholar] [CrossRef] [PubMed]
  3. He, D.; Li, X.; Sai, X.; Wang, L.; Li, S.; Xu, Y. Camellia nitidissima C.W. Chi: A Review of Botany, Chemistry, and Pharmacology. Phytochem. Rev. 2017, 17, 327–349. [Google Scholar] [CrossRef]
  4. Li, X.; Wang, J.; Sun, Z.; Wang, J.; Yin, H.; Fan, Z.; Li, J.; Jiang, C.; Huang, X. Flavonoid Components and Their Relationship with Flower Colors in Five Species of Camellia Section Chrysantha. Chin. J. Ecol. 2019, 38, 961–966. [Google Scholar]
  5. Guan, K.; Li, J.; Wang, Z. Camellias of China. Hangzhou Zhejiang Sci. Technol. Publ. House 2014, 444, 395–406. [Google Scholar]
  6. Gao, J.; Liu, X.; Zhao, Q. Illustrations of the New Camellia Hybirds that Bloom Year-Round; Zhejiang Science and Technology Press: Hangzhou, China, 2016. [Google Scholar]
  7. Grotewold, E. The Genetics and Biochemistry of Floral Pigments. Annu. Rev. Plant Biol. 2006, 57, 761–780. [Google Scholar] [CrossRef]
  8. Yang, Y.; Li, B.; Feng, C.; Wu, Q.; Wang, Q.; Li, S.; Yu, X.; Wang, L. Chemical Mechanism of Flower Color Microvariation in Paeonia with Yellow Flowers. Hortic. Plant J. 2020, 6, 179–190. [Google Scholar] [CrossRef]
  9. Zhang, T.; Zhang, H.; Wu, R. Recent Advances on Blue Flower Formation. Chin. Bull. Bot. 2020, 55, 216–227. [Google Scholar]
  10. Tanaka, Y.; Sasaki, N.; Ohmiya, A. Biosynthesis of Plant Pigments: Anthocyanins, Betalains and Carotenoids. Plant J. 2008, 54, 733–749. [Google Scholar] [CrossRef]
  11. Dong, N.Q.; Lin, H.X. Contribution of Phenylpropanoid Metabolism to Plant Development and Plant-environment Interactions. J. Integr. Plant Biol. 2020, 63, 180–209. [Google Scholar] [CrossRef]
  12. Winkel-Shirley, B. Flavonoid Biosynthesis. A Colorful Model for Genetics, Biochemistry, Cell Biology, and Biotechnology. Plant Physiol. 2001, 126, 485–493. [Google Scholar] [CrossRef] [Green Version]
  13. Noda, N. Recent Advances in the Research and Development of Blue Flowers. Breed. Sci. 2018, 68, 79–87. [Google Scholar] [CrossRef] [Green Version]
  14. Nabavi, S.M.; Šamec, D.; Tomczyk, M.; Milella, L.; Russo, D.; Habtemariam, S.; Suntar, I.; Rastrelli, L.; Daglia, M.; Xiao, J.; et al. Flavonoid Biosynthetic Pathways in Plants: Versatile Targets for Metabolic Engineering. Biotechnol. Adv. 2018, 38, 107316. [Google Scholar] [CrossRef]
  15. Liu, W.; Feng, Y.; Yu, S.; Fan, Z.; Li, X.; Li, J.; Yin, H. The Flavonoid Biosynthesis Network in Plants. Int. J. Mol. Sci. 2021, 22, 12824. [Google Scholar] [CrossRef]
  16. Zhou, X.W.; Fan, Z.Q.; Chen, Y.; Zhu, Y.L.; Li, J.Y.; Yin, H.F. Functional Analyses of a Flavonol Synthase-like Gene from Camellia nitidissima Reveal Its Roles in Flavonoid Metabolism during Floral Pigmentation. J. Biosci. 2013, 38, 593–604. [Google Scholar] [CrossRef]
  17. Li, X.; Yin, H.; Fan, Z.; Li, J. The Relationship Between Anthocyanins and Flower Colors of Bud Mutation in Camellia japonica. Sci. Agric. Sin. 2019, 52, 1961–1969. [Google Scholar]
  18. Tanikawa, N.; Kashiwabara, T.; Hokura, A.; Abe, T.; Shibata, M.; Nakayama, M. A Peculiar Yellow Flower Coloration of Camellia Using Aluminum-flavonoid Interaction. J. Jpn. Soc. Hortic. Sci. 2008, 77, 402–407. [Google Scholar] [CrossRef] [Green Version]
  19. Wang, R.; Ren, C.; Dong, S.; Chen, C.; Xian, B.; Wu, Q.; Wang, J.; Pei, J.; Chen, J. Integrated Metabolomics and Transcriptome Analysis of Flavonoid Biosynthesis in Safflower (Carthamus tinctorius L.) With Different Colors. Front. Plant Sci. 2021, 12, 712038. [Google Scholar] [CrossRef]
  20. Yang, F.; Li, C.H.; Das, D.; Zheng, Y.H.; Song, T.; Wang, L.X.; Chen, M.X.; Li, Q.Z.; Zhang, J. Comprehensive Transcriptome and Metabolic Profiling of Petal Color Development in Lycoris sprengeri. Front. Plant Sci. 2021, 12, 747131. [Google Scholar] [CrossRef]
  21. Li, X.; Wang, J.; Sun, Z.; Wang, J.; Yin, H.; Fan, Z.; Li, J. Flavonoid Components and Their Effects on Flower Colors in Camellia nitidissima, White C. japonica and Their Three Hybrid Cultivars. Acta Hortic. Sin. 2019, 46, 1145–1154. [Google Scholar]
  22. Chen, S.; Zhou, Y.; Chen, Y.; Gu, J. fastp: An ultra-fast all-in-one FASTQ preprocessor. Bioinformatics 2018, 34, i884–i890. [Google Scholar] [CrossRef]
  23. Grabherr, M.G.; Haas, B.J.; Yassour, M.; Levin, J.Z.; Thompson, D.A.; Amit, I.; Adiconis, X.; Fan, L.; Raychowdhury, R.; Zeng, Q.; et al. Full-length transcriptome assembly from RNA-Seq data without a reference genome. Nat. Biotechnol. 2011, 29, 644–652. [Google Scholar] [CrossRef] [Green Version]
  24. Altschul, S.F.; Madden, T.L.; Schäffer, A.A.; Zhang, J.; Zhang, Z.; Miller, W.; Lipman, D.J. Gapped BLAST and PSI-BLAST: A new generation of protein database search programs. Nucleic Acids Res. 1997, 25, 3389–3402. [Google Scholar] [CrossRef] [PubMed] [Green Version]
  25. Xie, C.; Mao, X.; Huang, J.; Ding, Y.; Wu, J.; Dong, S.; Kong, L.; Gao, G.; Li, C.Y.; Wei, L. KOBAS 2.0: A web server for annotation and identification of enriched pathways and diseases. Nucleic Acids Res. 2011, 39, W316–W322. [Google Scholar] [CrossRef] [Green Version]
  26. Eddy, S.R. Profile hidden Markov models. Bioinformatics 1998, 14, 755–763. [Google Scholar] [CrossRef] [PubMed]
  27. Langmead, B.; Trapnell, C.; Pop, M.; Salzberg, S.L. Ultrafast and memory-efficient alignment of short DNA sequences to the human genome. Genome Biol. 2009, 10, R25. [Google Scholar] [CrossRef] [Green Version]
  28. Li, B.; Dewey, C.N. RSEM: Accurate transcript quantification from RNA-Seq data with or without a reference genome. BMC Bioinform. 2011, 12, 323. [Google Scholar] [CrossRef] [Green Version]
  29. Leng, N.; Dawson, J.A.; Thomson, J.A.; Ruotti, V.; Rissman, A.I.; Smits, B.M.; Haag, J.D.; Gould, M.N.; Stewart, R.M.; Kendziorski, C. EBSeq: An empirical Bayes hierarchical model for inference in RNA-seq experiments. Bioinformatics 2013, 29, 1035–1043. [Google Scholar] [CrossRef] [Green Version]
  30. Liu, W.; Yin, H.; Feng, Y.; Yu, S.; Fan, Z.; Li, X.; Li, J. Comparative Transcriptome Analysis of Flower Senescence of Camellia lutchuensis. Curr. Genom. 2022, 23, 66–76. [Google Scholar] [CrossRef]
  31. Pan, L.; Li, J.; Yin, H.; Fan, Z.; Li, X. Integrated Physiological and Transcriptomic Analyses Reveal a Regulatory Network of Anthocyanin Metabolism Contributing to the Ornamental Value in a Novel Hybrid Cultivar of Camellia Japonica. Plants 2020, 9, 1724. [Google Scholar] [CrossRef]
  32. Fang, F.; Wang, F.Z. Research Progress on Key Genes of Flavonol Biosynthesis in Plants. Sci. Technol. Food Ind. 2018, 39, 335–340. [Google Scholar]
  33. Yu, Z.; Dong, W.; Teixeira da Silva, J.A.; He, C.; Si, C.; Duan, J. Ectopic Expression of DoFLS1 from Dendrobium officinale Enhances Flavonol Accumulation and Abiotic Stress Tolerance in Arabidopsis thaliana. Protoplasma 2021, 258, 803–815. [Google Scholar] [CrossRef] [PubMed]
  34. Jiang, X.; Shi, Y.; Fu, Z.; Li, W.W.; Lai, S.; Wu, Y.; Wang, Y.; Liu, Y.; Gao, L.; Xia, T. Functional Characterization of Three Flavonol Synthase Genes from Camellia sinensis: Roles in Flavonol Accumulation. Plant Sci. 2020, 300, 110632. [Google Scholar] [CrossRef] [PubMed]
  35. Xie, L.; Ren, C.; Zhang, B.; Xu, C.; Li, X. Plant UDP-glycosyltransferases in Flavonoids Biosynthesis. Acta Hortic. Sin. 2019, 46, 1655–1669. [Google Scholar]
  36. Zhang, F.; Guo, H.; Huang, J.; Yang, C.; Li, Y.; Wang, X.; Qu, L.; Liu, X.; Luo, J. A UV-B-responsive Glycosyltransferase, OsUGT706C2, Modulates Flavonoid Metabolism in Rice. Sci. China. Life Sci. 2020, 63, 1037–1052. [Google Scholar] [CrossRef]
  37. Meng, X.; Li, Y.; Zhou, T.; Sun, W.; Shan, X.; Gao, X.; Wang, L. Functional Differentiation of Duplicated Flavonoid 3-O-Glycosyltransferases in the Flavonol and Anthocyanin Biosynthesis of Freesia hybrida. Front. Plant Sci. 2019, 10, 1330. [Google Scholar] [CrossRef]
  38. Li, J.; Luan, Q.; Han, J.; Zhang, C.; Liu, M.; Ren, Z. CsMYB60 Directly and Indirectly Activates Structural Genes to Promote the Biosynthesis of Flavonols and Proanthocyanidins in Cucumber. Hortic. Res. 2020, 7, 103. [Google Scholar] [CrossRef]
  39. Binder, B.M. Ethylene Signaling in Plants. J. Biol. Chem. 2020, 295, 7710–7725. [Google Scholar] [CrossRef] [Green Version]
  40. Yu, X.; Xu, Y.; Yan, S. Salicylic Acid and Ethylene Coordinately Promote Leaf Senescence. J. Integr. Plant Biol. 2021, 63, 823–827. [Google Scholar] [CrossRef]
  41. Ma, N.; Ma, C.; Liu, Y.; Shahid, M.O.; Wang, C.; Gao, J. Petal senescence: A Hormone View. J. Exp. Bot. 2018, 69, 719–732. [Google Scholar] [CrossRef]
  42. Xu, Q.; Zhang, C.; Wu, J.; Ouyang, J. Research Progress in Biosynthesis of Anthocyanins. Chem. Ind. For. Prod. 2020, 40, 1–11. [Google Scholar]
  43. Wang, Z.L.; Wang, S.; Kuang, Y.; Hu, Z.M.; Qiao, X.; Ye, M. A comprehensive review on phytochemistry, pharmacology, and flavonoid biosynthesis of Scutellaria baicalensis. Pharm. Biol. 2018, 56, 465–484. [Google Scholar] [CrossRef] [Green Version]
  44. Hu, D.G.; Yu, J.Q.; Han, P.L.; Xie, X.B.; Sun, C.H.; Zhang, Q.Y.; Wang, J.H.; Hao, Y.J. The Regulatory Module MdPUB29-MdbHLH3 Connects Ethylene Biosynthesis with Fruit Quality in Apple. New Phytol. 2019, 221, 1966–1982. [Google Scholar] [CrossRef]
  45. Lewis, D.R.; Ramirez, M.V.; Miller, N.D.; Vallabhaneni, P.; Ray, W.K.; Helm, R.F.; Winkel, B.S.; Muday, G.K. Auxin and Ethylene Induce Flavonol Accumulation through Distinct Transcriptional Networks. Plant Physiol. 2011, 156, 144–164. [Google Scholar] [CrossRef] [Green Version]
  46. Wang, L.; Liu, N.; Wang, T.; Li, J.; Wen, T.; Yang, X.; Lindsey, K.; Zhang, X. The GhmiR157a-GhSPL10 Regulatory Module Controls Initial Cellular Dedifferentiation and Callus Proliferation in Cotton by Modulating Ethylene-mediated Flavonoid Biosynthesis. J. Exp. Bot. 2018, 69, 1081–1093. [Google Scholar] [CrossRef]
  47. Ni, J.; Bai, S.; Zhao, Y.; Qian, M.; Tao, R.; Yin, L.; Gao, L.; Teng, Y. Ethylene Response Factors Pp4ERF24 and Pp12ERF96 Regulate Blue Light-induced Anthocyanin Biosynthesis in ’Red Zaosu’ Pear Fruits by Interacting with MYB114. Plant Mol. Biol. 2019, 99, 67–78. [Google Scholar] [CrossRef]
Figure 1. Flower color of the four yellow camellia plants studied, in complete opening stage. (A) Camellia nitidssima (CN), (B) C. ‘Zhenghuangqi’ (ZHQ), (C) C. ‘Huangxuanlv’ (HXL), and (D) C. ‘Xinshiji’ (XSJ). (E) Contents of flavonols in petals of four yellow camellias. Qu7G, quercetin-7-O-glucoside; Qu3G, quercetin-3-O-glucoside; Qu3R, quercetin-3-O-rutinoside; Ka3G, kaempferol-3-O-glucoside; DHK, dihydrokaempferol; Qu, quercetin; Ka, kaempferol. a, b, c, d represent the different significant differences at p = 0.05 level.
Forests 13 01094 g001
Figure 2. Analysis of differentially expressed genes (DEGs). (A) Numbers of DEGs in the three sets of CN vs. ZHQ, CN vs. HXL, and CN vs. XSJ. Venn diagram of the upregulated DEGs (B) and downregulated DEGs (C), whose non-overlapping region represents the unique DEGs of each differential set, whereas the overlapping region represents the DEGs common to several sets.
Forests 13 01094 g002
Figure 3. Changes in flavonol-related (A) and ethylene-related (B) genes’ expression in the four yellow camellia plants. CN, Camellia nitidissima; ZHQ, C. ‘Zhenghuangqi’; HXL, C. ‘Huangxuanlv’; XSJ, C. ‘Xinshiji’. CHS, chalcone synthase; CHI, chalcone isomerase; F3H, flavanone 3-hydroxylase; FLS, flavonol synthase; GT, glycosyltransferase; DFR, dihydroflavonol 4-reductase; ANS, anthocyanidin synthase; MYB, v-myb avian myeloblastosis viral oncogene homolog; Qu7G, quercetin-7-O-glucoside; Qu3G, quercetin-3-O-glucoside; ACS, 1-aminocyclopropane-1-carboxylic acid synthase; ACO, 1-aminocyclopropane-1-carboxylic acid oxidase; ETR1/2, ethylene response 1/2; ERS1/2, ethylene response sensor 1/2; CTR1, constitutive triple response 1; EIN, ethylene insensitive; ERF, ethylene-responsive factor.
Forests 13 01094 g003
Figure 4. Validation of the expression of candidate genes by RT-PCR. CN, Camellia nitidissima; ZHQ, C. ‘Zhenghuangqi’; HXL, C. ‘Huangxuanlv’; XSJ, C. ‘Xinshiji’.
Forests 13 01094 g004
Publisher’s Note: MDPI stays neutral with regard to jurisdictional claims in published maps and institutional affiliations.

