
Machine Learning Methods to Estimate Productivity of Harvesters: Mechanized Timber Harvesting in Brazil

 , ,
, ,  ,
,
Abstract
:1. Introduction
2. Materials and Methods
2.1. Dataset
2.2. Different Learning Methods and Algorithm Approaches
3. Results
3.1. Dataset Quality
3.2. Different Learning Methods and Algorithm Approaches
4. Discussion
5. Conclusions
Supplementary Materials
Author Contributions
Funding
Institutional Review Board Statement
Informed Consent Statement
Data Availability Statement
Acknowledgments
Conflicts of Interest
References
- Pollard, S.J.T.; Brookes, A.; Earl, N.; Lowe, J.; Kearney, T.; Nathanail, C.P. Integrating decision tools for the sustainable management of land contamination. Sci. Total Environ. 2004, 325, 15–28. [Google Scholar] [CrossRef] [Green Version]
- Bai, C.; Sarkis, J. Integrating and extending data and decision tools for sustainable third-party reverse logistics provider selection. Comput. Oper. Res. 2019, 110, 188–207. [Google Scholar] [CrossRef]
- Welch, H.; Brodie, S.; Jacox, M.G.; Bograd, S.J.; Hazen, E.L. Decision-support tools for dynamic management. Conserv. Biol. 2020, 34, 589–599. [Google Scholar] [CrossRef]
- McRoberts, R.E.; Tomppo, E.O. Remote sensing support for national forest inventories. Remote Sens. Environ. 2007, 110, 412–419. [Google Scholar] [CrossRef]
- Liang, X.; Kankare, V.; Hyyppä, J.; Wang, Y.; Kukko, A.; Haggrén, H.; Yu, X.; Kaartinen, H.; Jaakkola, A.; Guan, F.; et al. Terrestrial laser scanning in forest inventories. ISPRS J. Photogramm. Remote Sens. 2016, 115, 63–77. [Google Scholar] [CrossRef]
- Eyvindson, K.; Saad, R.; Eriksson, L.O. Incorporating stand level risk management options into forest decision support systems. For. Syst. 2017, 26, e013. [Google Scholar] [CrossRef]
- Wagner, J.E. Misinterpreting the internal rate of return in sustainable forest management planning and economic analysis. J. Sustain. For. 2012, 31, 239–266. [Google Scholar] [CrossRef]
- Karttunen, K.; Laitila, J. Forest management regime options for integrated small-diameter wood harvesting and supply chain from young Scots pine (Pinus sylvestris L.) stands. Int. J. For. Eng. 2015, 26, 124–138. [Google Scholar] [CrossRef]
- Camargo, D.A.; Munis, R.A.; Simões, D. Investigation of exposure to occupational noise among forestry machine operators: A case study in Brazil. Forests 2021, 12, 299. [Google Scholar] [CrossRef]
- Fernandez-Lacruz, R.; Edlund, M.; Bergström, D.; Lindroos, O. Productivity and profitability of harvesting overgrown roadside verges—A Swedish case study. Int. J. For. Eng. 2021, 32, 19–28. [Google Scholar] [CrossRef]
- Visser, R.; Berkett, H. Effect of terrain steepness on machine slope when harvesting. Int. J. For. Eng. 2015, 26, 1–9. [Google Scholar] [CrossRef]
- Sherwin, L.M.; Owende, P.M.O.; Kanali, C.L.; Lyons, J.; Ward, S.M. Influence of tyre inflation pressure on whole-body vibrations transmitted to the operator in a cut-to-length timber harvester. Appl. Ergon. 2004, 35, 253–261. [Google Scholar] [CrossRef]
- Ovaskainen, H.; Heikkilä, M. Visuospatial cognitive abilities in cut-to-length single-grip timber harvester work. Int. J. Ind. Ergon. 2007, 37, 771–780. [Google Scholar] [CrossRef]
- Walsh, D.; Strandgard, M. ScienceDirect Productivity and cost of harvesting a stemwood biomass product from integrated cut-to-length harvest operations in Australian Pinus radiata plantations. Biomass Bioenergy 2014, 738, 93–102. [Google Scholar] [CrossRef]
- Hera, P.L.; Morales, D.O.; Mendoza-Trejo, O. A study case of Dynamic Motion Primitives as a motion planning method to automate the work of forestry cranes. Comput. Electron. Agric. 2021, 183, 106037. [Google Scholar] [CrossRef]
- Huang, X. Application analysis of AI reasoning engine in microblog culture industry. Pers. Ubiquitous Comput. 2020, 24, 393–403. [Google Scholar] [CrossRef]
- Cho, G.; Park, H.-M.; Jung, W.-M.; Cha, W.-S.; Lee, D.; Chae, Y. Identification of candidate medicinal herbs for skincare via data mining of the classic Donguibogam text on Korean medicine. Integr. Med. Res. 2020, 9, 100436. [Google Scholar] [CrossRef] [PubMed]
- Rodrigues de Holanda Maia, M.; Plastino, A.; Penna, P.H.V. MineReduce: An approach based on data mining for problem size reduction. Comput. Oper. Res. 2020, 122, 104995. [Google Scholar] [CrossRef]
- Xu, Z.; Cheng, X.; Wang, K.; Yang, S. Analysis of the environmental trend of network finance and its influence on traditional commercial banks. J. Comput. Appl. Math. 2020, 379, 112907. [Google Scholar] [CrossRef]
- da Silva, A.K.V.; Borges, M.V.V.; Batista, T.S.; da Junior, C.A.S.; Furuya, D.E.G.; Osco, L.P.; Teodoro, L.P.R.; Baio, F.H.R.; Ramos, A.P.M.; Gonçalves, W.N.; et al. Predicting eucalyptus diameter at breast height and total height with uav-based spectral indices and machine learning. Forests 2021, 12, 582. [Google Scholar] [CrossRef]
- Giannetti, F.; Pecchi, M.; Travaglini, D.; Francini, S.; D’amico, G.; Vangi, E.; Cocozza, C.; Chirici, G. Estimating vaia windstorm damaged forest area in italy using time series sentinel-2 imagery and continuous change detection algorithms. Forests 2021, 12, 680. [Google Scholar] [CrossRef]
- Kandel, S.; Heer, J.; Plaisant, C.; Kennedy, J.; Van Ham, F.; Riche, N.H.; Weaver, C.; Lee, B.; Brodbeck, D.; Buono, P. Research directions in data wrangling: Visualizations and transformations for usable and credible data. Inf. Vis. 2011, 10, 271–288. [Google Scholar] [CrossRef] [Green Version]
- Endel, F.; Piringer, H. Data Wrangling: Making data useful again. IFAC-PapersOnLine 2015, 28, 111–112. [Google Scholar] [CrossRef]
- Furche, T.; Gottlob, G.; Libkin, L.; Orsi, G.; Paton, N.W. Data wrangling for big data: Challenges and opportunities. Adv. Database Technol.-EDBT 2016, 2016, 473–478. [Google Scholar] [CrossRef]
- Bellomarini, L.; Fayzrakhmanov, R.R.; Gottlob, G.; Kravchenko, A.; Laurenza, E.; Nenov, Y.; Reissfelder, S.; Sallinger, E.; Sherkhonov, E.; Vahdati, S.; et al. Data science with Vadalog: Knowledge Graphs with machine learning and reasoning in practice. Futur. Gener. Comput. Syst. 2022, 129, 407–422. [Google Scholar] [CrossRef]
- Bors, C.; Gschwandtner, T.; Miksch, S. Capturing and visualizing provenance from data wrangling. IEEE Comput. Graph. Appl. 2019, 39, 61–75. [Google Scholar] [CrossRef]
- Yang, J.; Li, R.; Chen, L.; Hu, Y.; Dou, Z. Research on equipment corrosion diagnosis method and prediction model driven by data. Process Saf. Environ. Prot. 2022, 158, 418–431. [Google Scholar] [CrossRef]
- De Jaegher, B.; Larumbe, E.; De Schepper, W.; Verliefde, A.; Nopens, I. Colloidal fouling in electrodialysis: A neural differential equations model. Sep. Purif. Technol. 2020, 249, 116939. [Google Scholar] [CrossRef]
- Kudyba, S. A hybrid analytic approach for understanding patient demand for mental health services. Netw. Model. Anal. Health Inform. Bioinforma. 2018, 7, 3. [Google Scholar] [CrossRef]
- Liu, J.; Kadziński, M.; Liao, X.; Mao, X.; Wang, Y. A preference learning framework for multiple criteria sorting with diverse additive value models and valued assignment examples. Eur. J. Oper. Res. 2020, 286, 963–985. [Google Scholar] [CrossRef] [Green Version]
- Liski, E.; Jounela, P.; Korpunen, H.; Sosa, A.; Lindroos, O.; Jylhä, P. Modeling the productivity of mechanized CTL harvesting with statistical machine learning methods. Int. J. For. Eng. 2020, 31, 253–262. [Google Scholar] [CrossRef]
- Sunhare, P.; Chowdhary, R.R.; Chattopadhyay, M.K. Internet of things and data mining: An application oriented survey. J. King Saud Univ.-Comput. Inf. Sci. 2020, 34, 3569–3590. [Google Scholar] [CrossRef]
- Luo, M.; Wang, Y.; Xie, Y.; Zhou, L.; Qiao, J.; Qiu, S.; Sun, Y. Combination of feature selection and catboost for prediction: The first application to the estimation of aboveground biomass. Forests 2021, 12, 216. [Google Scholar] [CrossRef]
- Koreň, M.; Jakuš, R.; Zápotocký, M.; Barka, I.; Holuša, J.; Ďuračiová, R.; Blaženec, M. Assessment of machine learning algorithms for modeling the spatial distribution of bark beetle infestation. Forests 2021, 12, 395. [Google Scholar] [CrossRef]
- Kusiak, A. Data mining: Manufacturing and service applications. Int. J. Prod. Res. 2006, 44, 4175–4191. [Google Scholar] [CrossRef]
- Maxwell, A.E.; Warner, T.A.; Strager, M.P.; Conley, J.F.; Sharp, A.L. Assessing machine-learning algorithms and image- and lidar-derived variables for GEOBIA classification of mining and mine reclamation. Int. J. Remote Sens. 2015, 36, 954–978. [Google Scholar] [CrossRef]
- Taylor, P.; Griffiths, N.; Bhalerao, A.; Anand, S.; Popham, T.; Xu, Z.; Gelencser, A. Data Mining for Vehicle Telemetry. Appl. Artif. Intell. 2016, 30, 233–256. [Google Scholar] [CrossRef] [Green Version]
- Chatzimparmpas, A.; Martins, R.M.; Kucher, K.; Kerren, A. Empirical Study: Visual Analytics for Comparing Stacking to Blending Ensemble Learning. In Proceedings of the 2021 23rd International Conference on Control Systems and Computer Science (CSCS), Bucharest, Romania, 26–28 May 2021; pp. 1–8. [Google Scholar] [CrossRef]
- Hansrajh, A.; Adeliyi, T.T.; Wing, J. Detection of Online Fake News Using Blending Ensemble Learning. Sci. Program. 2021, 2021, 3434458. [Google Scholar] [CrossRef]
- Wu, T.; Zhang, W.; Jiao, X.; Guo, W.; Alhaj Hamoud, Y. Evaluation of stacking and blending ensemble learning methods for estimating daily reference evapotranspiration. Comput. Electron. Agric. 2021, 184, 106039. [Google Scholar] [CrossRef]
- Divina, F.; Gilson, A.; Goméz-Vela, F.; Torres, M.G.; Torres, J.F. Stacking ensemble learning for short-term electricity consumption forecasting. Energies 2018, 11, 949. [Google Scholar] [CrossRef] [Green Version]
- Malik, F.A.; Ye, W.; Chen, Q.; Li, D. Recommendation algorithm based on blending learning. In Proceedings of the 2019 3rd High Performance Computing and Cluster Technologies Conference, Guangzhou, China, 22–24 June 2019; pp. 113–117. [Google Scholar] [CrossRef]
- Fang, Z.; Wang, Y.; Peng, L.; Hong, H. A comparative study of heterogeneous ensemble-learning techniques for landslide susceptibility mapping. Int. J. Geogr. Inf. Sci. 2021, 35, 321–347. [Google Scholar] [CrossRef]
- Hao, M.; Cao, W.H.; Liu, Z.T.; Wu, M.; Xiao, P. Visual-audio emotion recognition based on multi-task and ensemble learning with multiple features. Neurocomputing 2020, 391, 42–51. [Google Scholar] [CrossRef]
- Sun, W.; Trevor, B. A stacking ensemble learning framework for annual river ice breakup dates. J. Hydrol. 2018, 561, 636–650. [Google Scholar] [CrossRef]
- Lee, J.; Kim, J.; Ko, W. Day-ahead electric load forecasting for the residential building with a small-size dataset based on a self-organizing map and a stacking ensemble learning method. Appl. Sci. 2019, 9, 1231. [Google Scholar] [CrossRef] [Green Version]
- Ünver-Okan, S. Modelling of work efficiency in cable traction with tractor implementing the least-squares methods and robust regression. Croat. J. For. Eng. 2020, 41, 109–117. [Google Scholar] [CrossRef]
- Arumugam, K.; Swathi, Y.; Sanchez, D.T.; Mustafa, M.; Phoemchalard, C.; Phasinam, K.; Okoronkwo, E. Towards applicability of machine learning techniques in agriculture and energy sector. Mater. Today Proc. 2022, 51, 2260–2263. [Google Scholar] [CrossRef]
- Morera, A.; Martínez de Aragón, J.; De Cáceres, M.; Bonet, J.A.; De-Miguel, S. Historical and future spatially-explicit climate change impacts on mycorrhizal and saprotrophic macrofungal productivity in Mediterranean pine forests. Agric. For. Meteorol. 2022, 319, 108918. [Google Scholar] [CrossRef]
- Jin, Z.; Shang, J.; Zhu, Q.; Ling, C.; Xie, W.; Qiang, B. RFRSF: Employee Turnover Prediction Based on Random Forests and Survival Analysis. In Web Information Systems Engineering—WISE 2020; Lecture Notes in Computer Science; Huang, Z., Beek, W., Wang, H., Zhou, R., Zhang, Y., Eds.; Springer: Cham, Switzerland, 2020; Volume 123, pp. 503–515. [Google Scholar] [CrossRef]
- Chen, Y.; Dong, C.; Wu, B. Crown Profile Modeling and Prediction Based on Ensemble Learning. Forests 2022, 13, 410. [Google Scholar] [CrossRef]
- Palonen, T.; Hyyti, H.; Visala, A. Augmented Reality in Forest Machine Cabin. IFAC-PapersOnLine 2017, 50, 5410–5417. [Google Scholar] [CrossRef]
- Marčeta, D.; Petković, V.; Ljubojević, D.; Potočnik, I. Harvesting System Suitability as Decision Support in Selection Cutting Forest Management in Northwest Bosnia and Herzegovina. Croat. J. For. Eng. 2020, 41, 251–265. [Google Scholar] [CrossRef]
- Aworka, R.; Cedric, L.S.; Adoni, W.Y.H.; Zoueu, J.T.; Mutombo, F.K.; Kimpolo, C.L.M.; Nahhal, T.; Krichen, M. Agricultural decision system based on advanced machine learning models for yield prediction: Case of East African countries. Smart Agric. Technol. J 2022, 2, 100048. [Google Scholar] [CrossRef]
- Kamarulzaman, A.M.M.; Jaafar, W.S.W.M.; Maulud, K.N.A.; Saad, S.N.M.; Omar, H.; Mohan, M. Integrated Segmentation Approach with Machine Learning Classifier in Detecting and Mapping Post Selective Logging Impacts Using UAV Imagery. Forests 2022, 13, 48. [Google Scholar] [CrossRef]
- National Institute of Meteorology. Available online: https//portal.inmet.gov.br/dadoshistoricos (accessed on 18 February 2021).
- Speight, J.G.; Isbell, R.F. Soil Profiles. In Australian Soil and Land Survey Field Handbook; CSIRO: Canberra, Australia, 2009; pp. 132–133. ISBN 9780643093959. [Google Scholar]
- R Development Core Team. A Language and Environment for Statistical Computing; R Foundation for Computing Statistical: Vienna, Austria, 2021; ISBN 3-900051-07-0. [Google Scholar]
- Suzuki, Y.; Yoshimura, T. Assessment of broad-leaved forest stand management: Stock densities, thinning costs and profits over a 60-year rotation period. Croat. J. For. Eng. 2019, 40, 365–375. [Google Scholar] [CrossRef]
- Lemm, R.; Blattert, C.; Holm, S.; Bont, L.; Thees, O. Improving economic management decisions in forestry with the sorsim assortment model. Croat. J. For. Eng. 2020, 41, 71–83. [Google Scholar] [CrossRef] [Green Version]
- Konstantinou, N.; Paton, N.W. Feedback driven improvement of data preparation pipelines. Inf. Syst. 2020, 92, 101480. [Google Scholar] [CrossRef] [Green Version]
- Tukey, J.W. Exploratory Data Analysis, 1st ed.; Pearson: London, UK, 1977; ISBN 978-0201076165. [Google Scholar]
- Zhang, A.; Yu, H.; Zhou, S.; Huan, Z.; Yang, X. Instance weighted SMOTE by indirectly exploring the data distribution. Knowl.-Based Syst. 2022, 249, 108919. [Google Scholar] [CrossRef]
- Juez-Gil, M.; Arnaiz-González, Á.; Rodríguez, J.J.; López-Nozal, C.; García-Osorio, C. Approx-SMOTE: Fast SMOTE for Big Data on Apache Spark. Neurocomputing 2021, 464, 432–437. [Google Scholar] [CrossRef]
- PyCaret Org. 2021. Available online: https://pycaret.org (accessed on 18 February 2021).
- Mitchell, T.M. Machine Learning, 1st ed.; McGraw-Hill Science/Engineering/Math: New York, NY, USA, 1977; ISBN 978-0070428072. [Google Scholar]
- Lin, X.; Wu, J.; Wei, Y. An ensemble learning velocity prediction-based energy management strategy for a plug-in hybrid electric vehicle considering driving pattern adaptive reference SOC. Energy 2021, 234, 121308. [Google Scholar] [CrossRef]
- Maktoubian, J.; Taskhiri, M.S.; Turner, P. Intelligent predictive maintenance (Ipdm) in forestry: A review of challenges and opportunities. Forests 2021, 12, 1495. [Google Scholar] [CrossRef]
- Demirci, M.; Yesil, A.; Bettinger, P. Introducing a New Approach in Stand Tending Planning and Thinning Block Designation by Using Mixed Integer Goal Programming. Croat. J. For. Eng. 2022, 43, 134–151. [Google Scholar] [CrossRef]
- Abbasi, R.; Martinez, P.; Ahmad, R. The digitization of agricultural industry—A systematic literature review on agriculture 4.0. Smart Agric. Technol. 2022, 2, 100042. [Google Scholar] [CrossRef]
- Buccafurri, F.; De Meo, P.; Fugini, M.; Furnari, R.; Goy, A.; Lax, G.; Lops, P.; Modafferi, S.; Pernici, B.; Redavid, D.; et al. Analysis of QoS in cooperative services for real time applications. Data Knowl. Eng. 2008, 67, 463–484. [Google Scholar] [CrossRef]
- Shi, M.; Xu, J.; Liu, S.; Xu, Z. Productivity-Based Land Suitability and Management Sensitivity Analysis: The Eucalyptus E. urophylla × E. grandis Case. Forests 2022, 13, 340. [Google Scholar] [CrossRef]
- An, Y.; Zhou, H. Short term effect evaluation model of rural energy construction revitalization based on ID3 decision tree algorithm. Energy Rep. 2022, 8, 1004–1012. [Google Scholar] [CrossRef]
- Geurts, P.; Ernst, D.; Wehenkel, L. Extremely randomized trees. Mach. Learn. 2006, 63, 3–42. [Google Scholar] [CrossRef] [Green Version]
- Ahmad, M.W.; Reynolds, J.; Rezgui, Y. Predictive modelling for solar thermal energy systems: A comparison of support vector regression, random forest, extra trees and regression trees. J. Clean. Prod. 2018, 203, 810–821. [Google Scholar] [CrossRef]
- Prokhorenkova, L.; Gusev, G.; Vorobev, A.; Dorogush, A.V.; Gulin, A. Catboost: Unbiased boosting with categorical features. Adv. Neural Inf. Process. Syst. 2018, 2018, 6638–6648. [Google Scholar]
- Ortiz-Bejar, J.; Graff, M.; Tellez, E.S.; Ortiz-Bejar, J.; Jacobo, J.C. κ-Nearest neighbor regressors optimized by using random search. In Proceedings of the 2018 IEEE International Autumn Meeting on Power, Electronics and Computing (ROPEC), Ixtapa, Mexico, 14–16 November 2018. [Google Scholar] [CrossRef]
- Jong, N.; Krumeich, J.S.M.; Verstegen, D.M.L. To what extent can PBL principles be applied in blended learning: Lessons learned from health master programs. Med. Teach. 2017, 39, 203–211. [Google Scholar] [CrossRef] [Green Version]
- Jordan, M.I.; Mitchell, T.M. Machine learning: Trends, perspectives, and prospects. Science 2015, 349, 255–260. [Google Scholar] [CrossRef]


| Timber Harvesters | Quantities of Timber Harvesters | ||
|---|---|---|---|
| Brand | Model | Power (kW) | |
| Harvester Ponsse | ERGO 8W | 205 | 17 |
| Harvester John Deere | 1270E | 170 | 2 |
| Harvester Ponsse | BEAVER | 150 | 1 |
| Harvester John Deere | 1270G | 200 | 1 |
| Data Wrangling Procedures | Input | Output |
|---|---|---|
| Duplicate instances | 144,973 | 144,781 |
| Removal of missing data | 144,781 | 98,459 |
| Annotation errors | 98,459 | 1703 |
| Outlier removal | 1703 | 1629 |
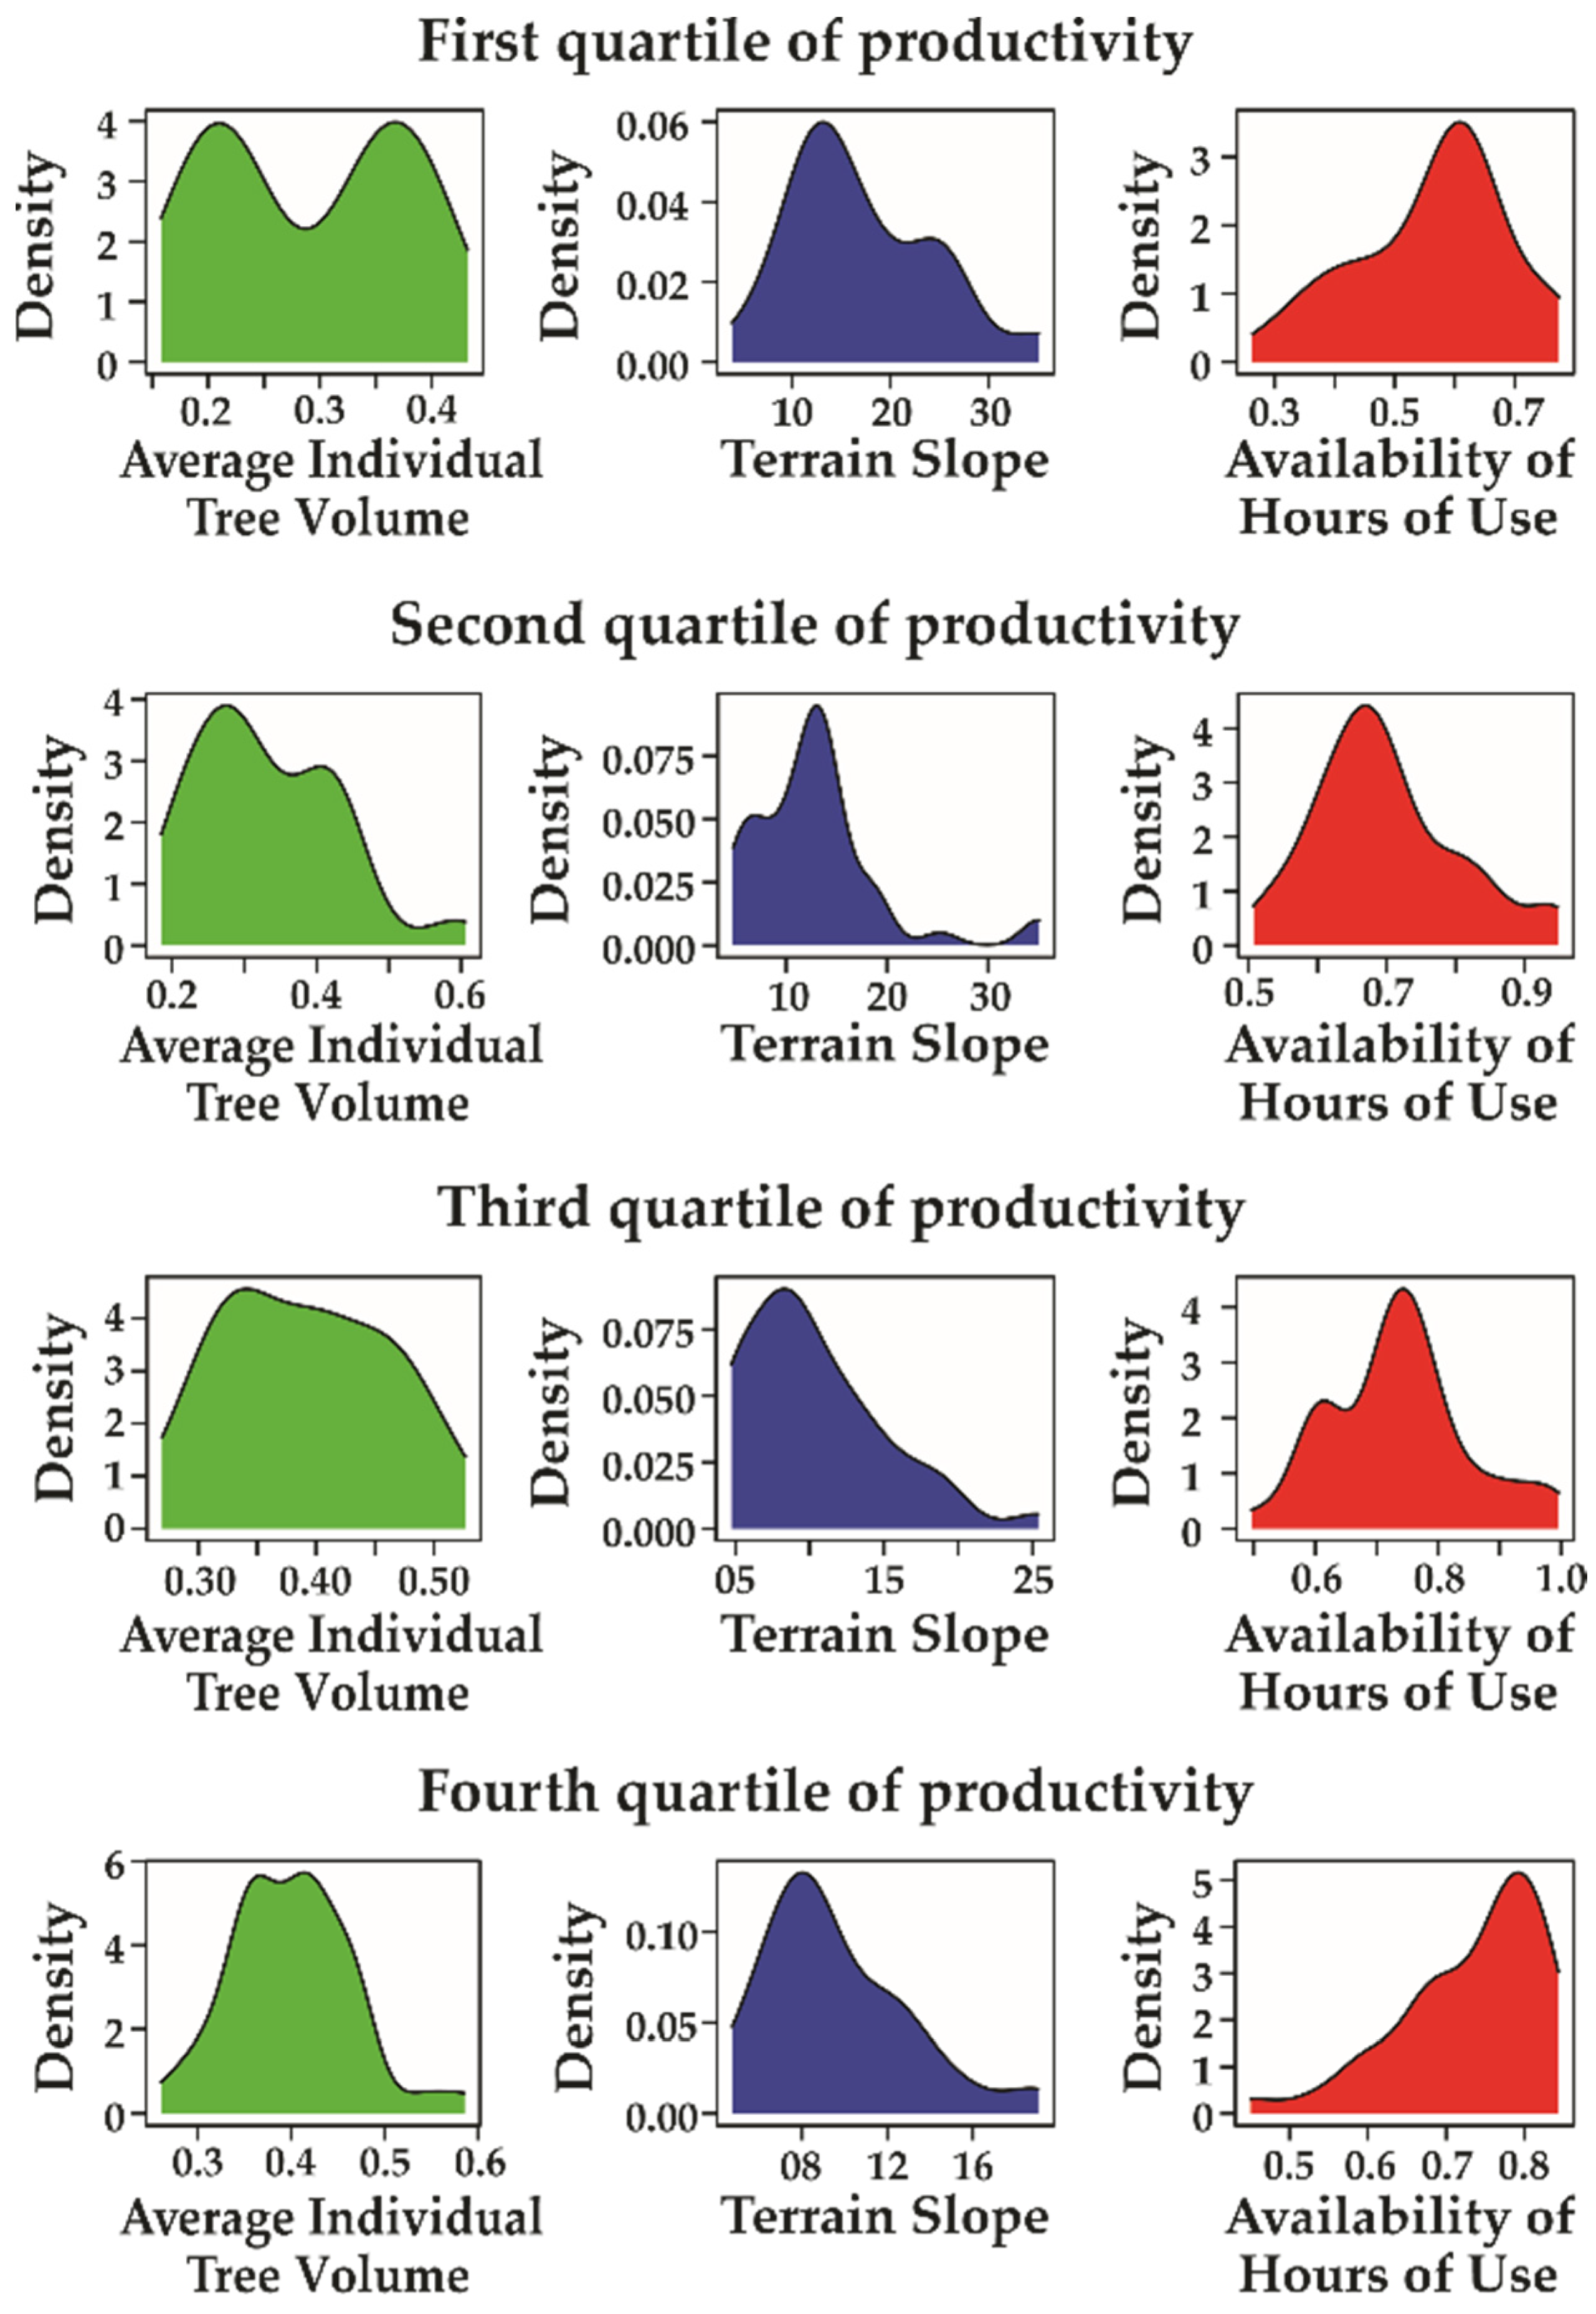
| Attribute | Minimum | Maximum | Mean | Standard Deviation | Median | Skewness | Kurtosis |
|---|---|---|---|---|---|---|---|
| Individual Mean Volumes of Trees [m3] | 0.11 | 0.62 | 0.35 | 0.09 | 0.36 | 0.09 | 2.83 |
| Terrain Slope [%] | 2.86 | 35.06 | 12.37 | 6.46 | 11.40 | 1.62 | 6.26 |
| Availability of Hours of Machine use [h] | 0.15 | 1.33 | 0.69 | 0.12 | 0.70 | −0.55 | 5.19 |
| Model | MAE [m3 h−1] | RMSE [m3 h−1] | R2 | MAPE [%] | Time [s] |
|---|---|---|---|---|---|
| Extra Trees Regressor | 3.21 | 4.68 | 0.72 | 17 | 0.12 |
| Random Forest Regressor | 3.36 | 4.72 | 0.71 | 18 | 0.13 |
| Decision Tree Regressor | 4.26 | 6.22 | 0.50 | 22 | 0.01 |
| Model | MAE [m3 h−1] | RMSE [m3 h−1] | R2 | MAPE [%] | Time [s] |
|---|---|---|---|---|---|
| CatBoost Regressor | 3.35 | 4.55 | 0.73 | 18 | 1.40 |
| Gradient Boosting Regressor | 3.68 | 4.91 | 0.69 | 20 | 0.04 |
| AdaBoost Regressor | 4.82 | 6.04 | 0.53 | 28 | 0.03 |
| Model | MAE [m3 h−1] | RMSE [m3 h−1] | R2 | MAPE [%] | Time [s] |
|---|---|---|---|---|---|
| Automatic Relevance Determination | 4.62 | 6.02 | 0.53 | 25 | 0.03 |
| Kernel Ridge | 4.65 | 6.04 | 0.53 | 25 | 0.02 |
| Linear Regression | 4.62 | 6.03 | 0.53 | 25 | 0.30 |
| Huber Regressor | 4.58 | 6.05 | 0.53 | 25 | 0.02 |
| Ridge Regression | 4.64 | 6.04 | 0.53 | 25 | 0.20 |
| Bayesian Ridge | 4.62 | 6.03 | 0.53 | 25 | 0.02 |
| TheilSen Regressor | 4.72 | 6.19 | 0.51 | 26 | 0.51 |
| Least Angle Regression | 4.87 | 6.38 | 0.47 | 26 | 0.01 |
| Orthogonal Matching Pursuit | 5.49 | 6.87 | 0.40 | 29 | 0.01 |
| Lasso Regression | 6.68 | 8.35 | 0.11 | 40 | 0.28 |
| Elastic Net | 6.68 | 8.34 | 0.11 | 40 | 0.02 |
| Lasso Least Angle Regression | 7.32 | 8.86 | 0.00 | 44 | 0.02 |
| Model | MAE [m3 h−1] | RMSE [m3 h−1] | R2 | MAPE [%] | Time [s] |
|---|---|---|---|---|---|
| K-Neighbors Regressor | 4.09 | 5.59 | 0.60 | 24 | 0.02 |
| Multilayer Perceptron Regressor | 4.57 | 5.94 | 0.55 | 25 | 0.40 |
| Random Sample Consensus | 5.10 | 6.73 | 0.42 | 27 | 0.02 |
| Support Vector Regression | 6.35 | 8.18 | 0.15 | 37 | 0.03 |
| Dummy Regressor | 7.32 | 8.86 | 0.00 | 44 | 0.01 |
| Passive-Aggressive Regressor | 8.25 | 10.02 | −0.49 | 52 | 0.02 |
| Model | Process | MAE [m3 h−1] | RMSE [m3 h−1] | R2 | MAPE [%] |
|---|---|---|---|---|---|
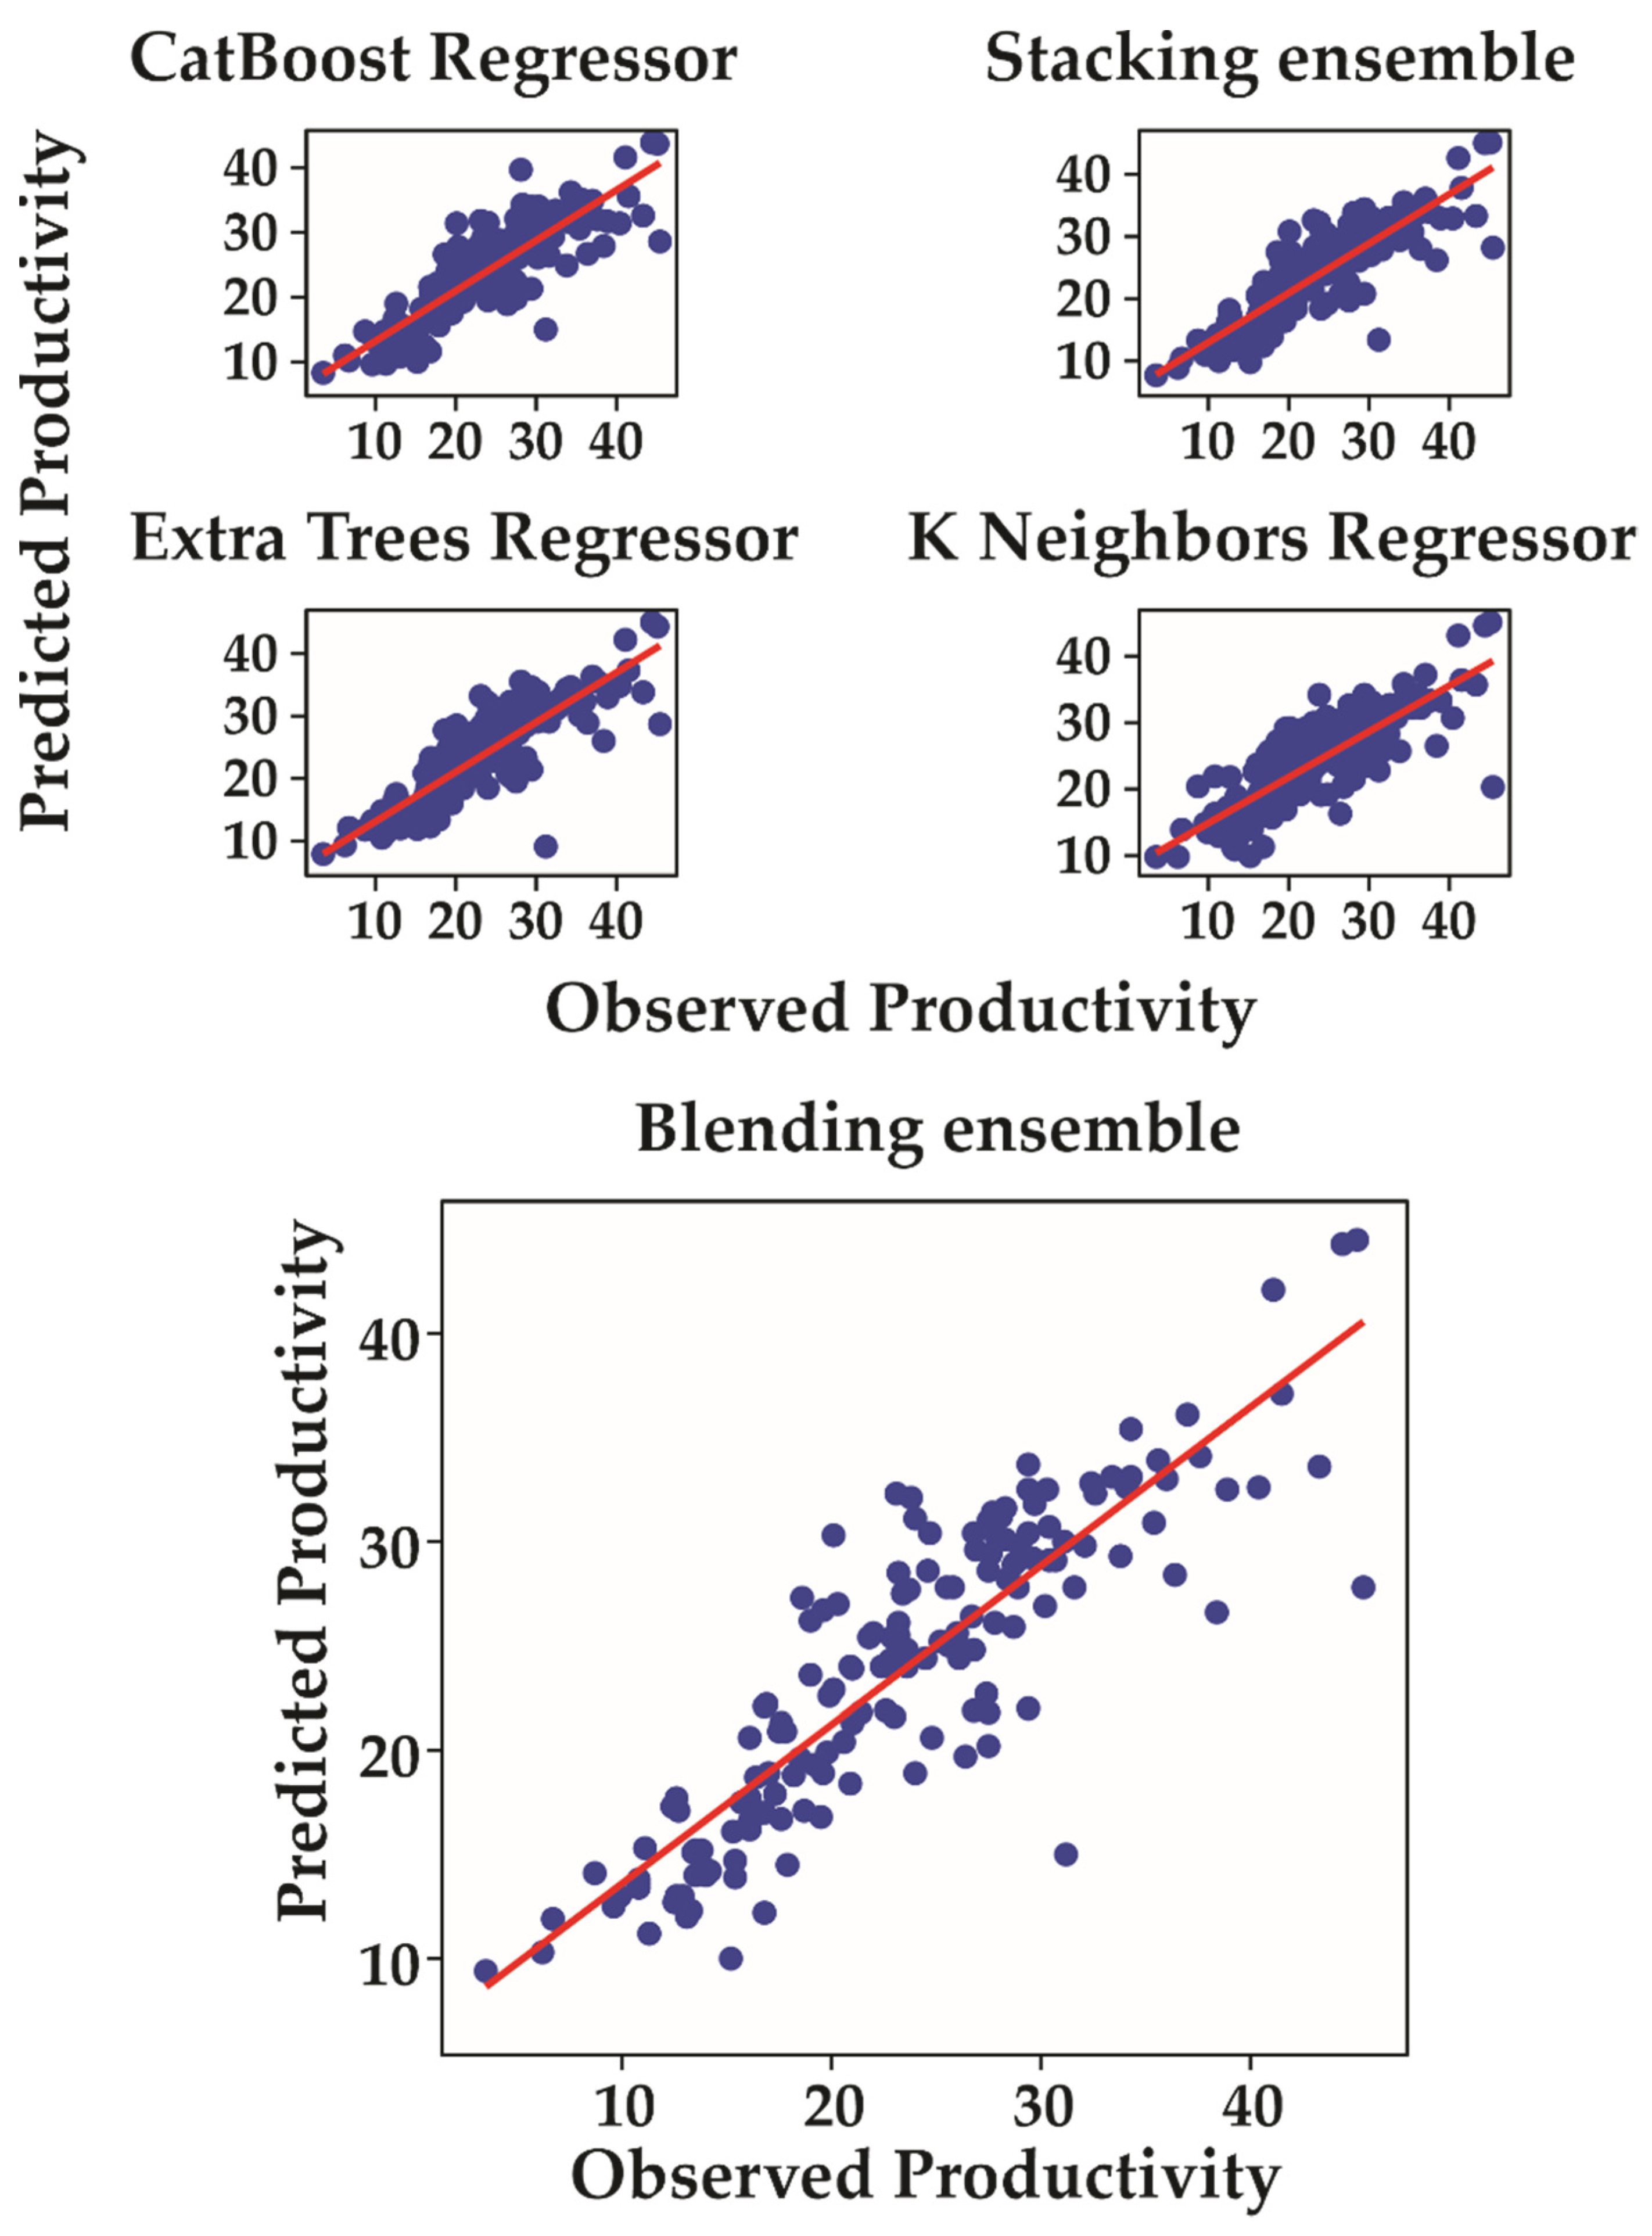
| Extra Trees Regressor (A) | Default | 3.31 | 4.49 | 0.74 | 18 |
| CatBoost Regressor (B) | Default | 3.13 | 4.58 | 0.73 | 17 |
| K-Neighbors Regressor (C) | Default | 4.06 | 5.54 | 0.61 | 24 |
| A, B e C | Blending ensemble | 3.18 | 4.43 | 0.75 | 18 |
| A, B e C–A | Stacking ensemble | 3.21 | 4.43 | 0.75 | 18 |
| Model | Process | R2 | MAPE [%] |
|---|---|---|---|
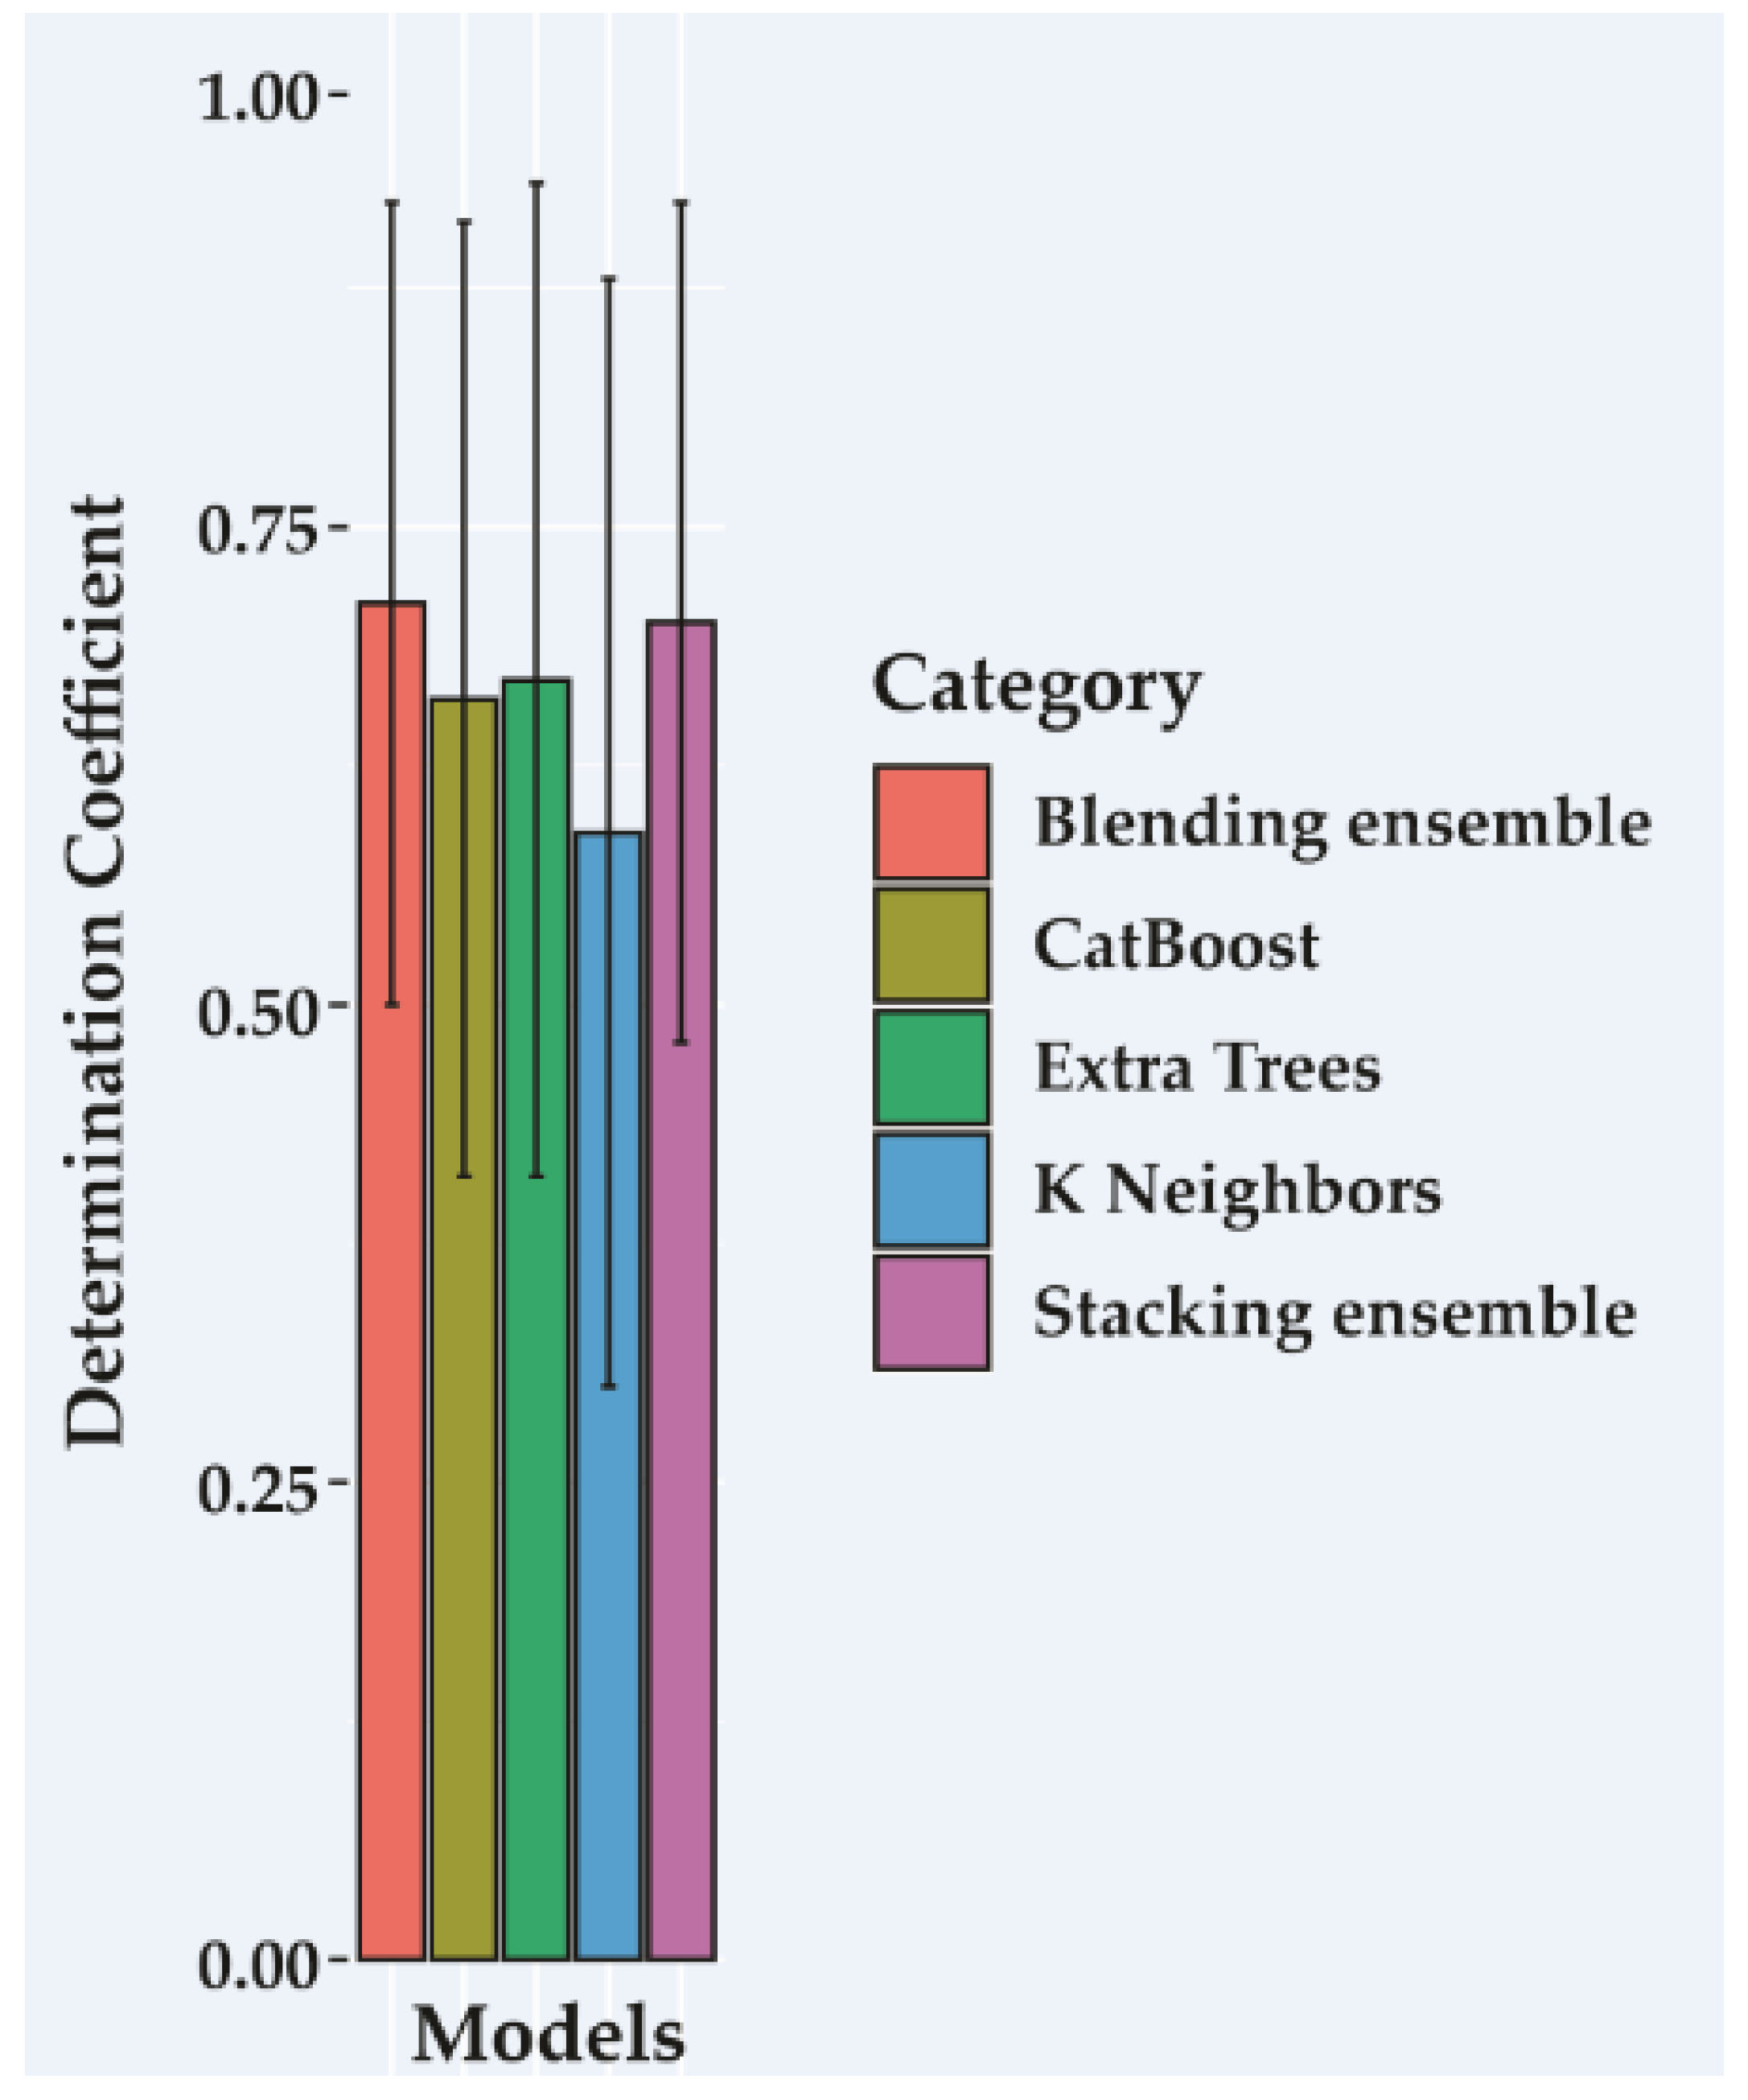
| A, B e C | Blending ensemble | 0.77 | 15 |
| A, B e C–A | Stacking ensemble | 0.76 | 14 |
| Extra Trees Regressor | Default | 0.74 | 14 |
| CatBoost Regressor | Default | 0.74 | 15 |
| K-Neighbors Regressor | Default | 0.67 | 19 |
Publisher’s Note: MDPI stays neutral with regard to jurisdictional claims in published maps and institutional affiliations. |
© 2022 by the authors. Licensee MDPI, Basel, Switzerland. This article is an open access article distributed under the terms and conditions of the Creative Commons Attribution (CC BY) license (https://creativecommons.org/licenses/by/4.0/).
Share and Cite
Munis, R.A.; Almeida, R.O.; Camargo, D.A.; da Silva, R.B.G.; Wojciechowski, J.; Simões, D. Machine Learning Methods to Estimate Productivity of Harvesters: Mechanized Timber Harvesting in Brazil. Forests 2022, 13, 1068. https://doi.org/10.3390/f13071068
Munis RA, Almeida RO, Camargo DA, da Silva RBG, Wojciechowski J, Simões D. Machine Learning Methods to Estimate Productivity of Harvesters: Mechanized Timber Harvesting in Brazil. Forests. 2022; 13(7):1068. https://doi.org/10.3390/f13071068
Chicago/Turabian StyleMunis, Rafaele Almeida, Rodrigo Oliveira Almeida, Diego Aparecido Camargo, Richardson Barbosa Gomes da Silva, Jaime Wojciechowski, and Danilo Simões. 2022. "Machine Learning Methods to Estimate Productivity of Harvesters: Mechanized Timber Harvesting in Brazil" Forests 13, no. 7: 1068. https://doi.org/10.3390/f13071068