
Spatiotemporal Dynamics and Climate Influence of Forest Fires in Fujian Province, China
by
 , , and
Aicong Zeng
1, 
Song Yang
1,
He Zhu
1,
Mulualem Tigabu
1,2,
Zhangwen Su
3,
Guangyu Wang
4 and
Futao Guo
1,* 1
College of Forestry, Fujian Agriculture and Forestry University, Fuzhou 350002, China
2
Southern Swedish Forest Research Centre, Swedish University of Agricultural Sciences, P.O. Box 190, SE-234 22 Lomma, Sweden
3
Zhangzhou Institute of Technology, Zhangzhou 363000, China
4
Asia Forest Research Centre, Faculty of Forestry, University of British Columbia, Vancouver, BC V6T 1Z4, Canada
*
Author to whom correspondence should be addressed.
Forests 2022, 13(3), 423; https://doi.org/10.3390/f13030423
Submission received: 11 February 2022
/
Revised: 2 March 2022
/
Accepted: 3 March 2022
/
Published: 8 March 2022
(This article belongs to the Topic The Future of Wildfires: Latest Geo-Technologies Applied to Fires and a New Perspective of Forest Resilience)
Abstract
:Climate determines the spatiotemporal distribution pattern of forest fires by affecting vegetation and the extent of drought. Thus, analyzing the dynamic change of the forest fire season and its response to climate change will play an important role in targeted adjustments of forest fire management policies and practices. In this study, we studied the spatiotemporal variations in forest fire occurrence in Fujian Province, China using the Mann–Kendall trend test and correlation analysis to analyze Moderate Resolution Imaging Spectroradiometer (MODIS) data from 2001 to 2016 and meteorological data. The results show that forest fire occurrence rose first and then declined over the years, but the proportion of forest fires during the fire prevention period decreased. The forest fires increased significantly in spring and summer, exceeding the forest fires occurring in the fire prevention period in 2010. The spatial distribution of forest fires decreased from northwest to southeast coastal areas, among which the number of forest fires in the northwest mountainous areas was large in autumn and winter. The fire risk weather index was strongly and positively correlated with forest fire occurrence across various sites in the province. The findings accentuate the need for properly adjusting the fire prevention period and resource allocation, strengthening the monitoring and early warning of high fire risk weather, and publicizing wildfire safety in spring and summer. As the forest fire occurrence frequency is high in the western and northwest mountainous areas, more observation towers and forest fire monitoring facilities should be installed.
1. Introduction
Forest fires play an important role in terrestrial carbon circulation and are an integral part of the global ecosystem [1]. They are not only a natural disturbance prevalent in forests, but also a disturbance caused by humans, especially in agricultural–forest systems that consider fire a production tool [2,3]. Forest fires pose significant threats to ecosystems, communities, and human life [4] as strongly evidenced by successive extreme forest fires in the United States and Australia [5,6]. In the 21st century, the global frequency and harm of forest fire activity have attracted wide attention from the international community [7,8,9]. Thus, the application of Moderate Resolution Imaging Spectroradiometer (MODIS) data [10] or high-precision image data [11] for forest fires has been gradually enhanced to improve forest fire monitoring, modeling, and prediction [12,13] as well as to improve forest fire prevention and control capacity.
Geophysical parameters and dynamics of atmosphere and land data acquired by satellites are useful in monitoring fire risk hazards and disasters [14]. Near real-time (NRT) satellite data have been used to monitor and forecast fire risk. An NRT disturbance detection method named the Jumps Upon Spectrum and Trend (JUST) and a remote sensing-based model for forecasting forest fire danger conditions (FFFDC) have been proposed [15,16]. Both methods are part of the underlying enhanced algorithm of MODIS series products. Further analysis showed that JUST is robust to fire detection of both simulated and real-world datasets [17]. Ahmed et al. [14] proposed a method coupled with FFFDC to directly generate a fire risk map. Hyunjin et al. [18] used a statistical model coupled with a future climate model to assess climate change impacts on wildfire risk. In general, many studies have employed a MODIS-derived variable or detective method for deriving a meaningful research conclusion.
With changes in forest fire frequency, the impact of climate change on sporadic and long-term trends has received increasing attention in recent years [19,20,21]. The analysis of trends in hydro-meteorological data is a significant problem in environmental science. JUST provides a seasonal trend fitting tool based on least-squares spectral analysis (LSSA), which can decompose real-world time series into three components—the trend, seasonal, and remainder components [15]. However, the NRT method requires that the time series have at least a two-year stable history period (SHP); that is, for an enhanced vegetation index (EVI) time series, the time span is at least 2 years [17]. If the research purpose focuses on forest fire dynamics, even in coarse spatiotemporal resolution scenarios, the SHP of a fire point time series will be very long. For instance, Abatzoglou and Williams used a 50-y low-pass filter to capture anthropogenic signals [22]. As one of the widely used non-parametric trend tests, the Mann–Kendall (MK) trend test has been well used in many fields [23,24]. Jain et al. used the MK trend test to examine changes in the length of fire seasons and extreme fire weather indices (FWIs) in North America [25].
Fuel flammability and ignition are necessary factors of forest fire activity [22,26] that are limited in space and time [27,28]. Human activities can inhibit or promote forest fire occurrence by affecting fire sources, fire extinguishing, forestry policies, and so forth [7,29,30,31]. This leads to a more complex forest fire occurrence mechanism and difficulty determining the influence of pure biophysical drivers [32,33]. Climate and weather mainly affect fuel types and their combustion, and compared to other factors, atmospheric processes are the macro driver of the temporal changes of forest fires [34]. It has been suggested that the current increase in forest fires and changes in forest fire seasons and regions are affected by climate change [35]. However, such analysis is limited by geographical regions, and how climate change affects forest fire variation needs further study.
Forest fire season is a summary of the long-term forest fire occurrence, and it is a period of the year when forest fires easily occur and spread. It is of great significance to regional forest fire management [36,37]. Climate change influences the forest fire season [38], leading to the uncoordinated distribution of the original fire prevention resources and the spatial and temporal distribution of forest fires, and promoting the growth of forest fire hazards [39]. To gain a better understanding of the impact of climate on forest fire frequency, the strength and direction of its relationship with climate change, and the temporal trend of seasonal fire, this study used MODIS satellite forest fire data and meteorological data from 2001–2016. The study analyzed the distribution and change trend of forest fires for the whole year, the fire prevention period, different seasons, and various sites in Fujian Province, southern China. The rest of the paper is organized as follows. In Section 2, the study region, datasets, and methodology are described. Section 3 deals with the major findings, and Section 4 discusses the results and the limitations. Finally, Section 5 presents concluding remarks.
2. Materials and Methods
2.1. The Study Area
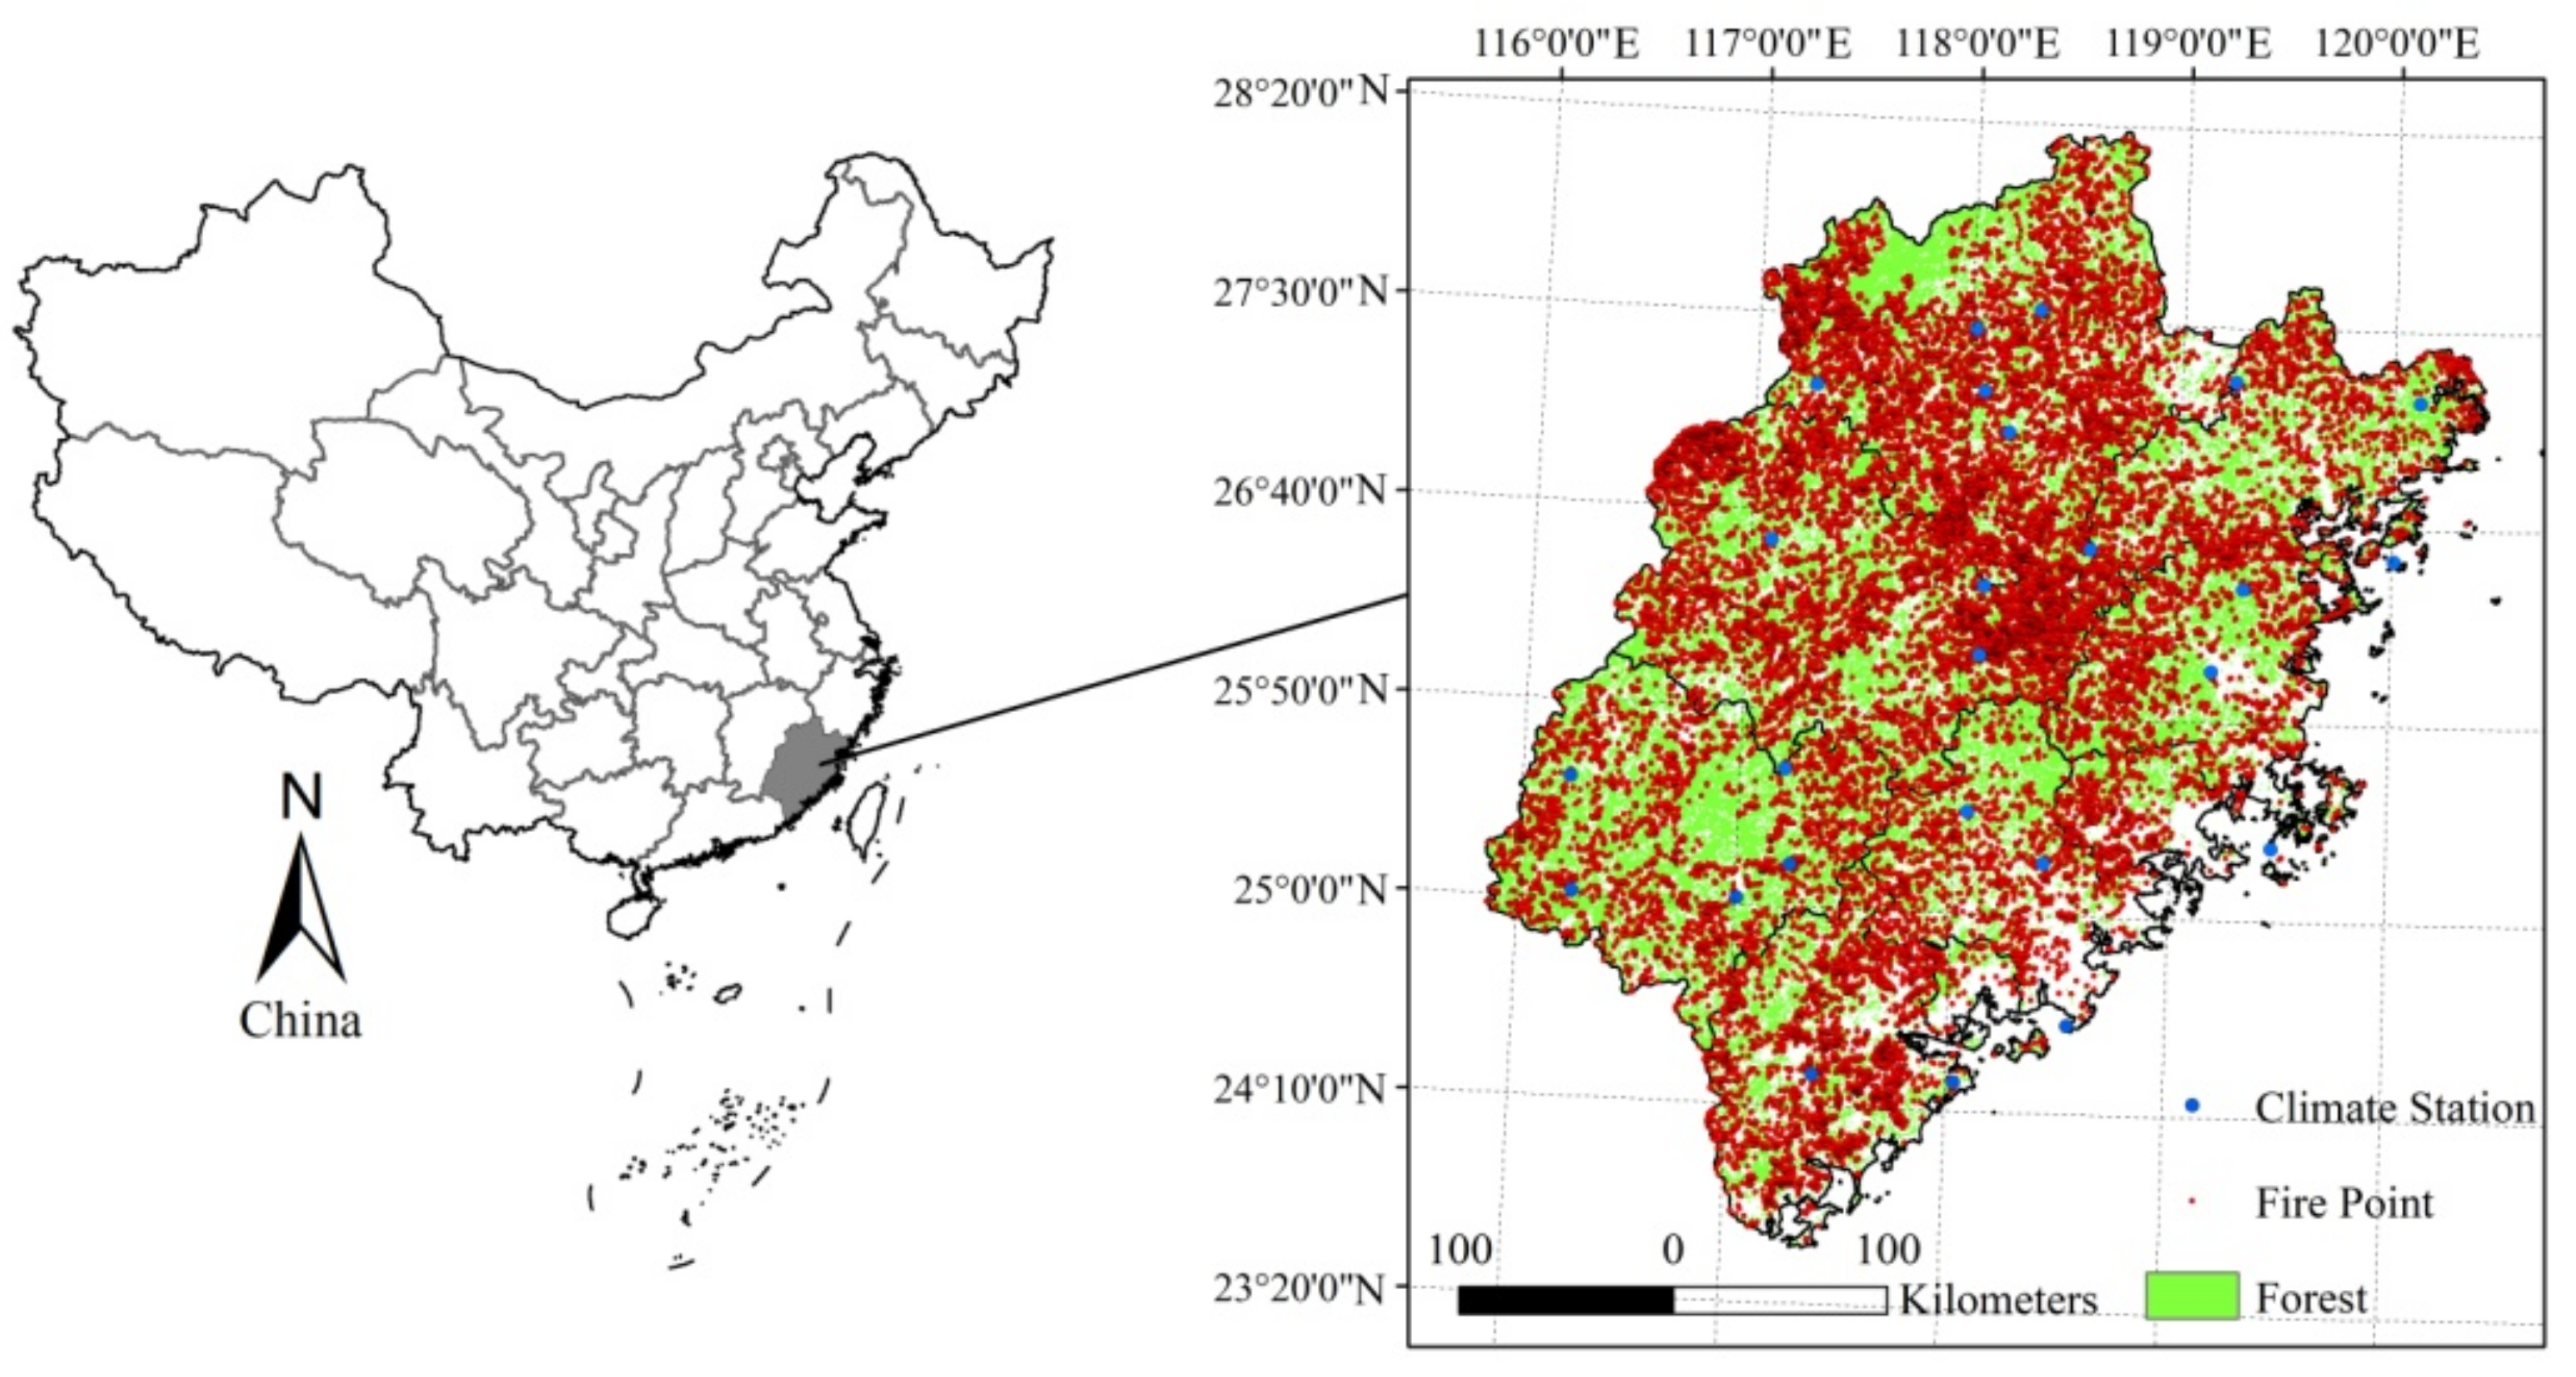
The study was conducted at nine sites in Fujian Province, which is located on the southeast coast of China (23°33′–28°20′ N, 115°50′–120°40′ E; Figure 1), with a forest area of 9267 ha and a coverage rate of 66.80%, ranking first in China. The region has a subtropical monsoon climate, with annual temperatures of 17~21 °C and an average annual rainfall of 1400~2000 mm. The province is mainly mountainous, where the northeast mountainous areas are dominated by forests and farmlands, and the coastal areas have a high population density. The main plantation tree species are horsetail pine (Pinus massoniana Lamb), and Chinese fir (Cunninghamialanceolata (Lamb.)) accounts for about 75.25% of the total forest area. These species are coniferous species with relatively high lateral branches, and surface fires occur in mature forests [40]. From 2001 to 2016, there were 6167 forest fires in the region alone, burning an area of 117 300 ha. The legal fire prevention period is from 15 September to 30 April of the next year (http://www.slfh.gov.cn/Item/21398.aspx/, last accessed date: 28 November 2020).
2.2. Datasets
Forest fire data were obtained from the MODIS with a 1 km resolution of daily forest fire products, MOD14A1 [41]. The Terra and Aqua satellites were used, capable of 12 h flight cycles and enabling effective fire observations but unable to distinguish forest fires from other fire types, as well as forest fire hotspots recorded multiple times in a fire. Using this data, the Collection 6 algorithm can effectively distinguish cloud-covered areas, while forest fires cannot be assessed in thick cloud-covered areas. Therefore, in this study, we assumed that there were no fires in cloud-covered areas. This method has almost no effect on regional-scale forest fire dynamic analysis and was verified with high-precision ASTER satellite images. The overall forest fire error rate is about 1.2% [42]. In this study, the satellite hotspots in Fujian Province from 2001 to 2016 were selected to eliminate the hotspots of 1 km, using the map of land-use types of 1 km and less than 1 km within 24 h, and the earliest forest hotspots were selected as representative [43]. The forest fire season concept of reference [44], combined with China’s forest fire policy, further defined the forest fire season as the minimum continuous period containing more than 90% of the number of forest fires.
We recorded the forest fire data according to the occurrence dates from 1 January to 31 December across all years, and according to seasons—spring (March to May), summer (June to August), autumn (September to November), winter (December to February), and the fire prevention period from 15 September to 30 April. Meteorological data came from the China Meteorological Data Sharing Network (https://data.cma.cn/data/detail/dataCode/A.0012.0001.html, last accessed date: 28 October 2021), including 21 national meteorological stations in Fujian Province. The daily meteorological data include the surface temperature (°C), wind speed (m/s), relative humidity (%), and precipitation (mm).
The FWI is a composite index of the Canadian Forest Fire Danger Rating System (CFFDRS) [45]. The FWI uses daily observations of temperature, relative humidity, wind speed, and 24-h accumulated precipitation to estimate the fuel moisture content and associated fire behavior potential. The corresponding meteorological data of each meteorological station from 2001 to 2016 were extracted to calculate the FWI, and the FWI of each site within the province were calculated according to the year, fire prevention period, and fire seasons.
2.3. Methods
As the Mann–Kendall trend test does not require samples to follow a certain distribution, is not disturbed by a few outliers, has high quantification, and performs well for the analysis of temporal order variables, it was used to analyze the forest fire data time series of 16 samples to construct an order column Sk, as follows:
It can be seen that the order column Sk is the cumulative number of hot spots at time i, which is greater than the number of hot spots at time j. The statistics were defined under the assumption of random independence of the time series, as follows:
where UF1 = 0, E(sk) and var(sk) are the mean and variance of sk.
When X1, X2, …, Xn are independent of each other and have the same continuous distribution, they can be calculated by the following equation:
UFk has a standard normal distribution, according to the calculated statistical sequence of forest fire hotspot data time series X1, X2, …, Xn, and then in reverse order by time series Xn, Xn−1, …, X1; UBk = −UFk (k = n, n−1, …,1), UB1 = 0. The given significance of p < 0.05, the critical value of u0.05 = ±1.96, the sequence curves of UFk and UBk, and the two straight lines p = 0.05 (u0.05 = ±1.96) were plotted on the same graph.
If the UFk line changes within the critical line p = 0.05 (u0.05 = ±1.96), the change is not obvious; a value of UBk greater than 0 indicates that the frequency of forest fires is rising, and when it exceeds the critical line, the rise or downward trend is significant. If the UFk curve and UBk curve have an intersection between the critical line, the year corresponding to the intersection is the time of the mutation. If multiple intersections appear outside the critical line, we applied the sliding t-test to further determine the existence of mutation based on the results of the two test methods.
The sliding t-test has no strict requirements on the data, which can be used to determine whether two samples were mutated, mainly by comparing whether there is a significant difference between the average of the two samples [46]. If the difference between the means of the two-subsequence forest fire hotspots exceeds the specified significance level, the mutation between the two subsequences is considered, and the reference point indicates the existence of mutation.
For the time series X with a sample size of 16, a certain year was artificially set as the reference point. The two subsequences before and after the reference points are and , respectively, whose sample sizes are and , respectively. The average values of the two sequences are and , respectively and the variances are and . The sliding t-test was computed using the following formula:
The significance level was set at p ≤ 0.05, and the critical value of t 0.05 was obtained from the t-distribution table. If the calculated t is greater than t 0.05, the reference point year is considered mutated; otherwise, the two subsequences before and after the base point are not mutated.
The correlations between the FWIs and forest fires in each region of the study sites were analyzed by non-parametric correlation analysis. In order to prevent the contingency of a single test, Spearman’s and Kendall rank correlation tests were used in this study.
3. Results
3.1. Temporal Dynamics of Forest Fire Characteristics
From 2001 to 2016, there were 27,839 forest fires in Fujian Province, of which 24,542 forest fires occurred in the fire prevention period, all showing a rising trend first and then decreasing. The trend of forest fires from 2001 to 2010 was the same as the annual change in forest fires, but the forest fire mutation in 2011 (Figure 2 and Figure A1) changed to a downward trend exceeding the annual forest fires. The proportion of forest fires increased from 9.1% before 2011 to 21.16%, and the annual forest fires had a downward trend in 2013 (Figure 2).
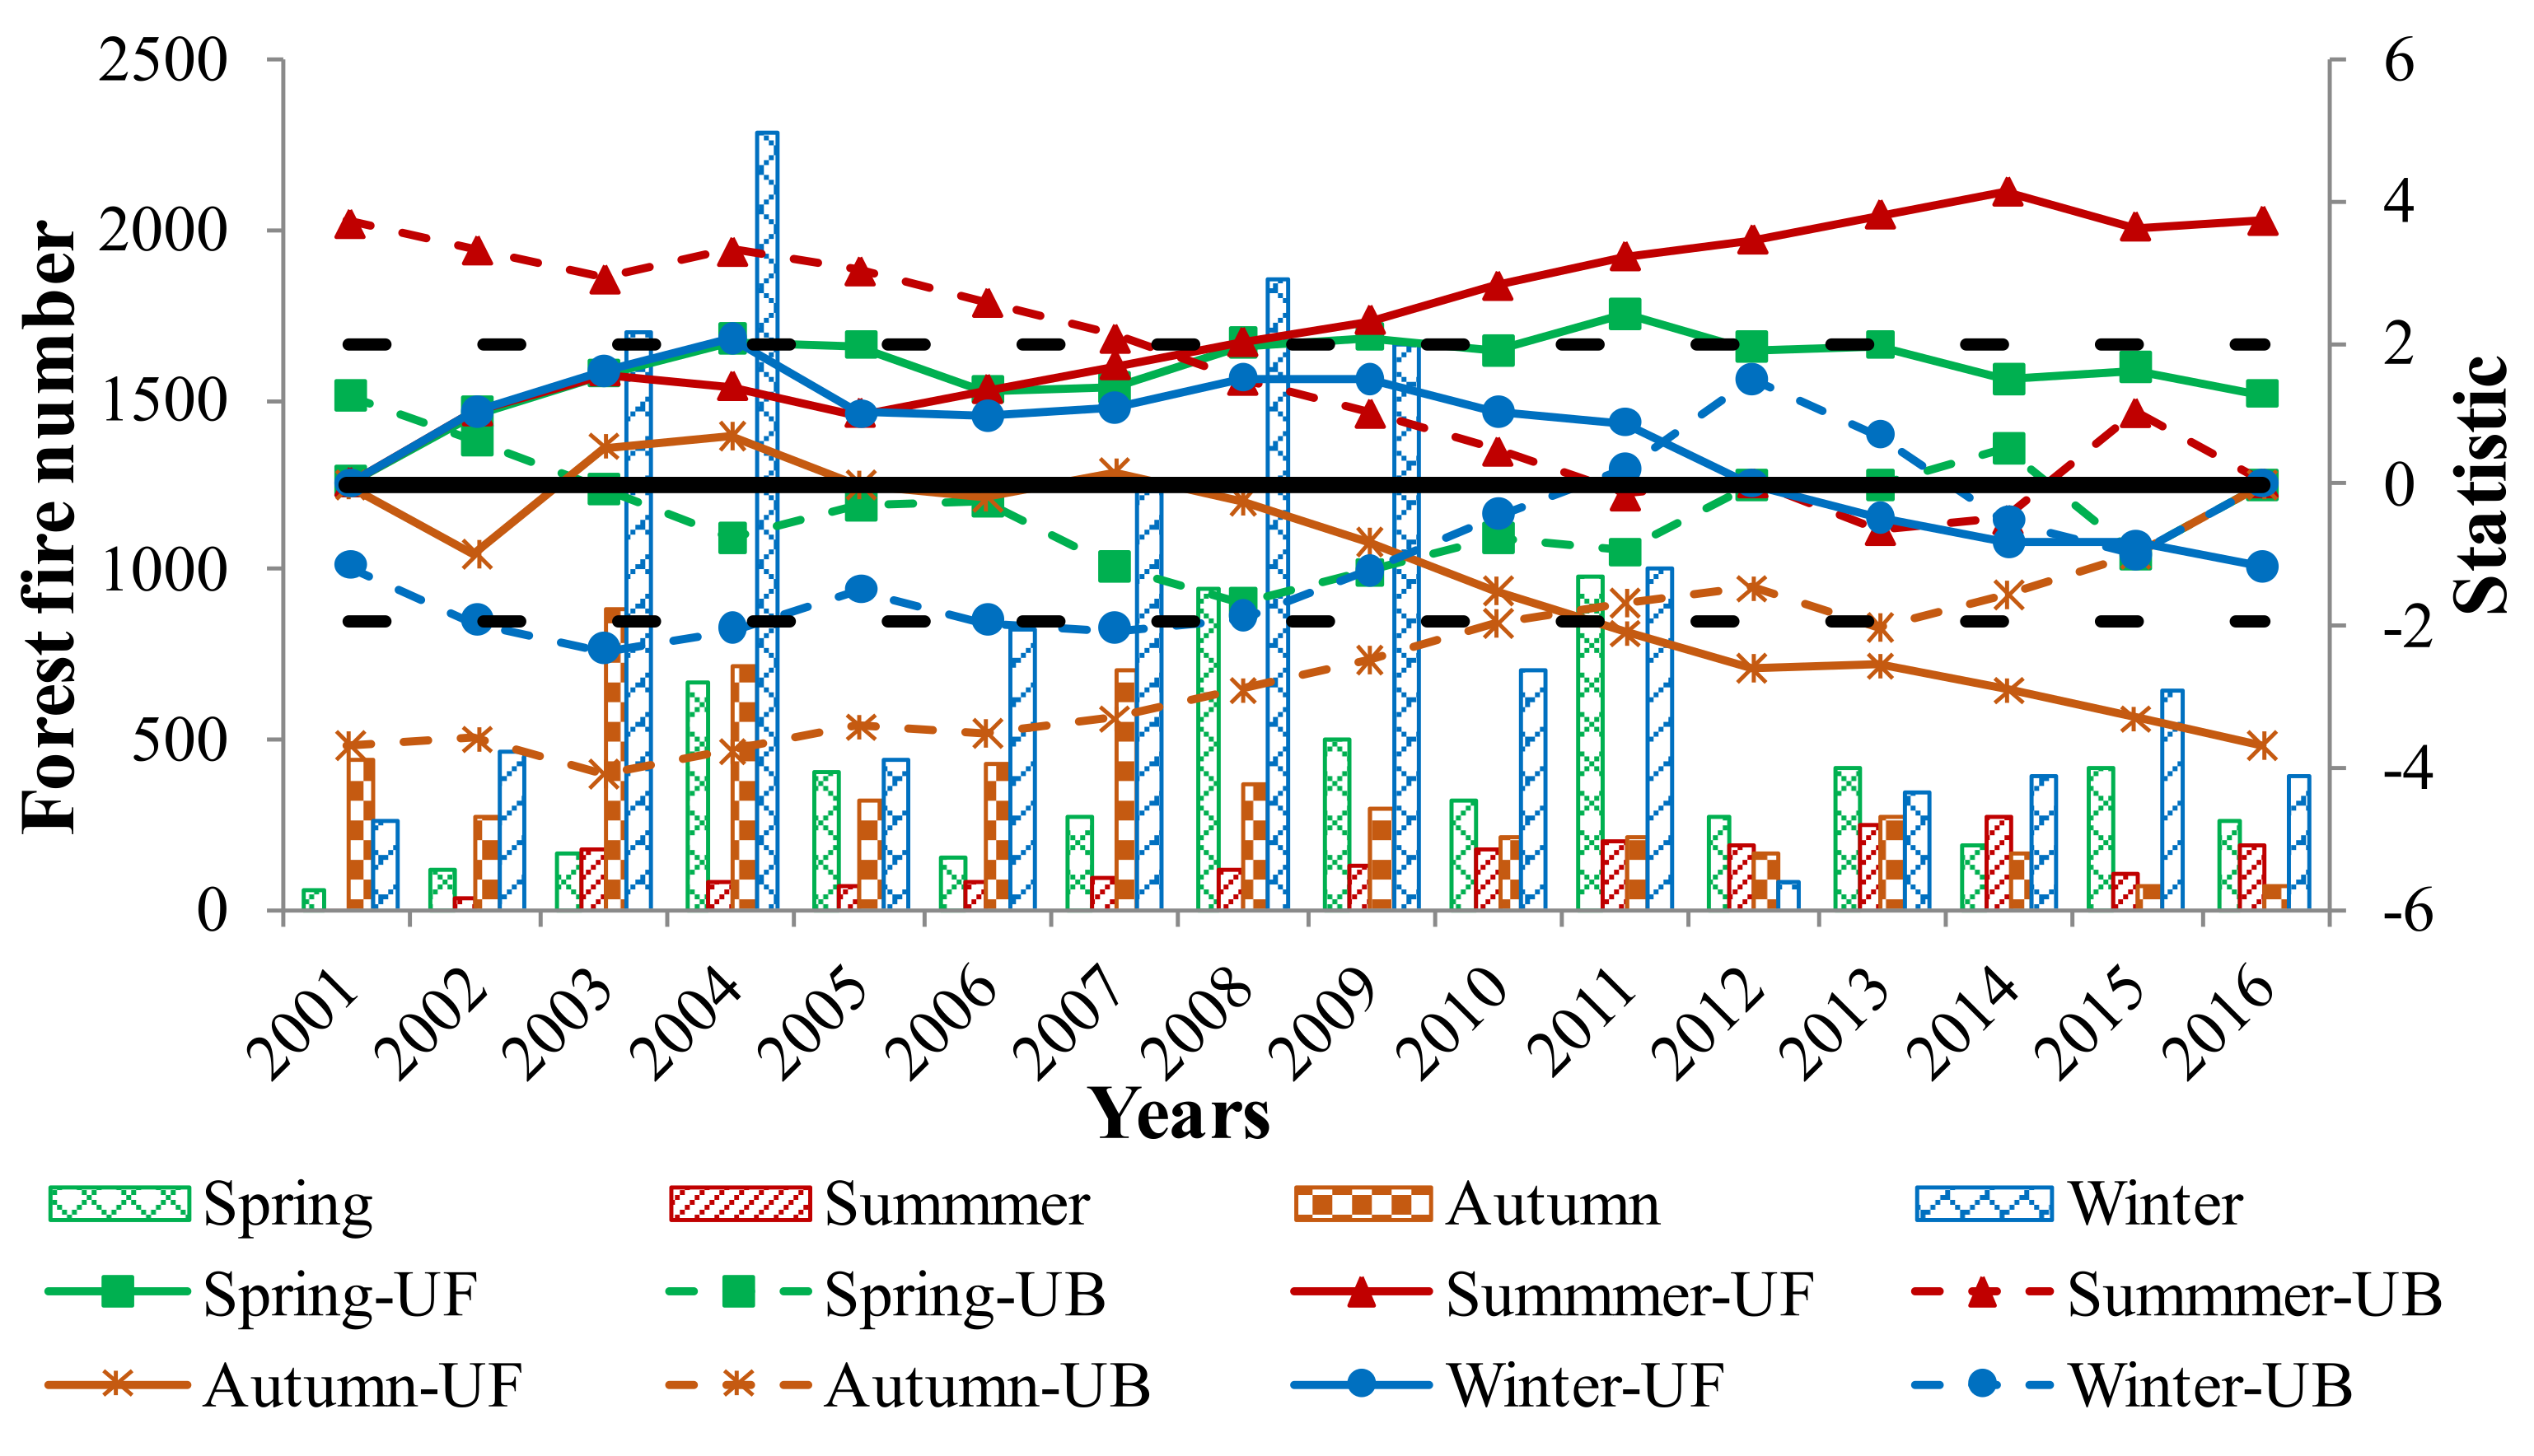
Seasonally, the numbers of forest fires were 6056, 2104, 5487, and 14,192 in the spring, summer, autumn, and winter, respectively, from 2001 to 2016, with a rising trend in the spring and summer, and a decreasing trend in the autumn and winter (Figure 3). According to the numbers and trends of forest fires, the main fire seasons could be divided into autumn and winter from 2001–2008 and spring and winter from 2009–2016 (Figure 3). Spring and summer fires mutated in 2002 and 2007, respectively, and increased significantly in 2004, 2008, 2009, and 2011 in the spring, maintaining significantly high levels in 2008–2016. Autumn forest fires had a downward trend in 2008 and mutated in 2011 with winter forest fires (Appendix A Figure A2), which had a significant downward trend (Figure 3).
3.2. Spatial Dynamic of Forest Fire Characteristics
The spatial distribution of forest fires in Fujian Province decreased from the northeast to the southwest, mainly in Sanming City and Nanping City, accounting for about 54.81% of the provincial forest fires, followed by Ningde City, Longyan City, and Zhangzhou City, while other cities had relatively few forest fire events. The distribution of forest fires in the fire prevention period was consistent with that in the whole year (Figure 4a). There was an increasing trend of forest fires in Ningde City and Sanming City, while the other cities had a decreasing trend from an increasing trend in 2011 (Figure 4b). Most cities had significantly high forest fire events in 2004, while Longyan City and Sanming City had significantly higher forest fire events in 2008 and 2009 (Figure 4b).
Forest fires in Longyan City, Sanming City, and Nanping City in western Fujian Province mainly occurred in the autumn and winter and were significantly more frequent than in the spring and summer, and maintained a growing trend after 2010 (Figure 5a). Forest fires in other eastern coastal cities mainly occurred in the spring and winter, rising in the spring and winter, with relatively few in summer and most significantly decreasing in autumn (Figure 5b).
3.3. Dynamic Characteristics of Forest Fire Season
The 2001–2016 forest fire season in Fujian Province could be divided into two stages; the first stage was the 2001–2008 forest fire season, which fell within the legal fire season limit, and the overflow fire period was 2009–2016 (Figure 6). During the period from 2001 to 2008, the fire season was within the legal limits of fire season. The forest fire season started to extend in spring 2009 and autumn 2010, highly exceeding the spring fire season period boundary in 2012 and the autumn fire period boundary in 2013. The forest fire season in spring increased by about 3.5 days per year to about 40 to 50 days. There was no obvious trend in the summer season, which was about 30 to 40 days.
3.4. Correlation between Forest Fire and Fire Risk Weather Index
Kendall and Spearman’s rank correlation analyses gave similar results, although the correlation coefficients were relatively lower in the former than the latter (Table 1). Significant correlations were observed between the FWI and forest fires in the spring, autumn, winter, the fire prevention period, and the whole year in Fujian, among which the correlations with autumn forest fires were the strongest, and the correlations with the fire prevention period were relatively weak. There was no significant correlation between summer forest fires and the climate. Region-wise, the correlation between spring forest fires and the FWI in southwest regions, such as Zhangzhou City, Xiamen City, Quanzhou City, and Longyan City, was weak, while the correlations between spring and winter forest fires and the FWI in Northeast regions, such as Ningde City, Sanming City, and Nanping City, were strong.
4. Discussion
Most forest fire studies show that human activities [22], vegetation [47] and climate [48,49] are the main factors determining the temporal and spatial pattern of forest fires. Human activities, vegetation cover, and climate are different in different time scales, as are their impacts on forest fires and their temporal trends. The forest fires in Fujian Province increased first and then decreased in the whole year and fire prevention period. This is mainly attributed to an increase in rainfall in Fujian Province over the study period [50], which resulted in the increase in the moisture content of combustibles. In addition, the strict implementation of the forest fire policy during the fire prevention period resulted in the reduction of fire sources, which restrained the occurrence of forest fires [10]. Forest fires mainly occur in the spring, autumn, and winter in Fujian Province. In spring, forest fires had an overall upward trend, but after 2011, affected by increasing precipitation [51], forest fires had a decreasing trend. Due to more frequent human activities, such as farming, picnics, and ancestor worship in the spring [40], the impact of climate was small, but the trend remained at a high level, which is consistent with the findings of Xiong et al. in Southwest China [31]. The overall trend of summer forest fires is on the rise, which may be due to the fact that summer forest fires mostly occur with extreme weather [1]. With the increase in extreme weather frequency due to climate change [51], summer forest fires reach and maintain a significant increase. In autumn and winter, due to the increase in precipitation [50] and the policy of the fire prevention period (http://www.slfh.gov.cn/Item/21398.aspx, last accessed date: 2 November 2020), the forest fires changed into a downward trend. The trend change in this study is basically consistent with that of a previous study in China [52], except for a certain difference in spring, which may be caused by the obvious decline of agricultural fires in spring and the elimination of farmland fires in the data of this study.
Forest fire events decreased from the northwest to the southeast and were mainly distributed in Sanming City and Nanping City and closely related to human factors, climate factors, and vegetation [53]. Most of the other cities are coastal cities with high precipitation, large population densities, developed industry, and low forest coverage; thus, combustibles are not as continuous as the vegetation of remote forests. More concentrated firefighting and preventive measures [54,55] are implemented in these regions. In addition, the cities of Sanming and Longyan are relatively less economically developed, mainly relying on agricultural production [40], and most fields are interactively distributed among mountains and forests, resulting in more human fire sources in autumn and winter [56] and a high frequency of forest fires. Forest fires in coastal cities mainly occur in spring and winter, which are jointly determined by frequent human activities in spring and a drier climate in winter [57]. Zhangzhou City, Longyan City, Sanming City, and Nanping City had the most significant forest fire changes in spring, summer, and autumn. Compared to other cities, the agricultural and forest economy is more developed and the land is vast and sparsely populated [58]. The large accumulation of combustibles and climate change during the fire prevention period promote a significant increase in forest fires in spring and summer. Autumn forest fires are just the opposite. The main season of forest fire occurrence changed from autumn and winter to spring and winter, and continued to extend and deviate into spring and summer. As a whole, forest fires are affected by biophysical and human interference, which is consistent with previous studies [43,57], although these studies did not carry out detailed analyses according to seasons.
There were significant correlations between forest fires and the FWI in Fujian Province in the whole year, the fire prevention period, and in different seasons, indicating that climate has a significant impact on forest fires in Fujian Province [57]. However, there was no significant correlation between summer forest fires and the FWI, which might be because the FWI is a quarterly average. Summer forest fires occur in extreme weather or are influenced by human factors [22], resulting in a weak correlation between the two, but the frequent occurrence of extreme weather is closely related to climate change [9,38].
In this study, there were some limitations in using MODIS data and the MK trend test for analysis. Overall, the latest MODIS data have a global commission error of about 1.2%, and the observed variability in the probability of detection was strongly driven by regional differences in fire size. We also did not consider the intensity and severity of forest fires; that is, the burned area of forest fires. At the same time, the occurrence of forest fires in the area masked by clouds during the study period was not considered in this study. The uncertainty of all these data sources may have an effect on the analysis results. Furthermore, the MK trend test cannot effectively distinguish the periodic component and trend component of forest fire sequences, and the short sequence length may have a certain impact on the determination of trend change.
5. Conclusions
Against the background of global climate change, forest fire prevention and control have become increasingly important. Thus, accurate information about temporal and spatial variations in forest fire occurrence is imperative. In this regard, our study revealed both temporal and spatial variations in forest fire occurrence and the extension of the fire season in Fujian Province, which is related to the fire risk weather index. This, in turn, accentuates the need for appropriately adjusting the fire prevention period, strengthening the monitoring and early warning of high fire risk weather, publicizing wildfire safety, and allocating fire prevention resources in spring and summer. At the same time, more observation towers and other forest fire monitoring facilities should be built in the northwest mountainous areas, where forest fires occur frequently and fighting is difficult. By doing so, it would be possible to improve forest fire prevention and control efficiency and reduce the devastating impact of forest fires. Our results provide valuable insights to similar areas, where fire occurrence shows spatiotemporal variability.
Author Contributions
Conceptualization, G.W. and F.G.; methodology, G.W., F.G., A.Z., S.Y. and H.Z.; software, A.Z. and S.Y.; validation, A.Z. and F.G.; formal analysis, F.G., A.Z. and S.Y.; investigation, H.Z.; resources, F.G.; data curation, Z.S.; writing—original draft preparation, A.Z. and F.G.; writing—review and editing, M.T., G.W. and F.G.; visualization, A.Z.; supervision, F.G.; project administration, F.G.; funding acquisition, F.G. All authors have read and agreed to the published version of the manuscript.
Funding
This research was funded by the National Key R&D Plan of Strategic International Scientific and Technological Innovation Cooperation Project (grant No. 2018YFE0207800).
Data Availability Statement
The fire datasets used in our work can be freely accessed at http://www.gscloud.cn, accessed on 18 November 2017. The climate data were obtained from http://cdc.cma.Gov.cn, accessed on 17 December 2020.
Acknowledgments
We thank our colleagues at the Forest College, Fujian Agriculture and Forestry University for their support during equipment support and data processing.
Conflicts of Interest
The authors declare no conflict of interest.
Appendix A
Figure A1.
Mutation test for forest fire occurrence of fire season.

Figure A2.
Mutation test for forest fire occurrence of the winter.

References
- Bowman, D.M.J.S.; Williamson, G.J.G.; Abatzoglou, J.T.; Kolden, C.A.; Cochrane, M.A.; Smith, A.M.S. Human exposure and sensitivity to globally extreme wildfire events. Nat. Ecol. Evol. 2017, 1, 58. [Google Scholar] [CrossRef] [PubMed]
- Cochrane, M.A. Fire science for rainforests. Nature 2003, 421, 913. [Google Scholar] [CrossRef] [PubMed]
- Achu, A.L.; Thomas, J.; Aju, C.D.; Gopinath, G.; Kumar, S.; Reghunath, R. Machine-learning modelling of fire susceptibility in a forest-agriculture mosaic landscape of southern India. Ecol. Inform. 2021, 1, 101348. [Google Scholar] [CrossRef]
- Reid, C.E.; Brauer, M.; Johnston, F.H.; Jerrett, M.; Balmes, J.R.; Elliott, C.T. Critical review of health impacts of wildfire smoke exposure. Environ. Health Perspect. 2016, 124, 1334. [Google Scholar] [CrossRef] [PubMed] [Green Version]
- Tim, B.; Steve, L.; Brent, W.; Billy, G. The Extreme 2018 Northern California Fire Season. Bull. Am. Meteorol. Soc. 2020, 101, S1–S4. [Google Scholar]
- Boer, M.M.; Nolan, R.H.; Resco De Dios, V.; Clarke, H.; Price, O.F.; Bradstock, R.A. Changing Weather Extremes Call for Early Warning of Potential for Catastrophic Fire. Earth’s Future 2017, 5, 1196–1202. [Google Scholar] [CrossRef]
- Marlon, J.R.; Bartlein, P.J.; Gavin, D.G.; Long, C.J.; Anderson, R.S.; Briles, C.E.; Brown, K.J.; Colombaroli, D.; Hallett, D.J.; Power, M.J.; et al. Long-term perspective on wildfires in the western USA. Proc. Natl. Acad. Sci. USA 2012, 109, E535–E543. [Google Scholar] [CrossRef] [Green Version]
- Ahmed, M.R.; Khan, R.R.; Quazi, K.H. Remote Sensing of Wildland Fire-Induced Risk Assessment at the Community Level. Sensors 2018, 18, 1570. [Google Scholar] [CrossRef] [Green Version]
- Müller, M.M.; Vacik, H. Characteristics of lightnings igniting forest fires in Austria. Agric. For. Meteorol. 2017, 240, 26–34. [Google Scholar] [CrossRef]
- Su, Z.W.; Hu, H.Q.; Tigabu, M.; Wang, G.Y.; Zeng, A.C.; Guo, F.T. Geographically Weighted Negative Binomial Regression Model Predicts Wildfire Occurrence in the Great Xing’an Mountains Better Than Negative Binomial Model. Forests 2019, 10, 377. [Google Scholar] [CrossRef] [Green Version]
- Hassan, Q.K.; Rahaman, K.R.; Ahmed, M.R.; Hossain, S.M. Examining Post-Fire Perceptions of Selected Mitigation Strategies after the 2016 Horse River Wildland Fire in Alberta, Canada. Appl. Sci. 2021, 11, 10155. [Google Scholar] [CrossRef]
- Naderpour, M.; Rizeei, H.M.; Ramezani, F. Forest Fire Risk Prediction: A Spatial Deep Neural Network-Based Framework. Remote Sens. 2021, 13, 2513. [Google Scholar] [CrossRef]
- Rosadi, D.; Andriyani, W. Prediction of forest fire using ensemble method. J. Phys. Conf. Ser. 2021, 1918, 42–43. [Google Scholar] [CrossRef]
- Ahmed, M.R.; Quazi, K.H.; Masoud, A.; Anil, G. Processing of Near Real Time Land Surface Temperature and Its Application in Forecasting Forest Fire Danger Conditions. Sensors 2020, 20, 984. [Google Scholar] [CrossRef] [Green Version]
- Ghaderpour, E. JUST: MATLAB and python software for change detection and time series analysis. GPS Solut. 2021, 25, 1–9. [Google Scholar]
- Ahmed, M.R.; Hassan, Q.K.; Abdollahi, M.; Gupta, A. Introducing a new remote sensing-based model for forecasting forest fire danger conditions at a four-day scale. Remote Sens. 2019, 11, 2101. [Google Scholar] [CrossRef] [Green Version]
- Ghaderpour, E.; Vujadinovic, T. The Potential of the Least-Squares Spectral and Cross-Wavelet Analyses for Near-Real-Time Disturbance Detection within Unequally Spaced Satellite Image Time Series. Remote Sens. 2020, 12, 2446. [Google Scholar] [CrossRef]
- Hyunjin, A.; Gan, J.; Sung, J.C. Assessing Climate Change Impacts on Wildfire Risk in the United States. Forests 2015, 6, 3197–3211. [Google Scholar] [CrossRef] [Green Version]
- Zhao, F.J.; Liu, Y.Q.; Shu, L.F. Change in the fire season pattern from bimodal to unimodal under climate change: The case of Daxing’anling in Northeast China. Agric. For. Meteorol. 2020, 291, 108075. [Google Scholar] [CrossRef]
- Goss, M.; Swain, D.L.; Abatzoglou, J.T.; Sarhadi, A.; Kolden, C.; Williams, A.P.; Diffenbaugh, N.S. Climate change is increasing the risk of extreme autumn wildfire conditions across California. Environ. Res. Lett. 2020, 15, 94016–94029. [Google Scholar] [CrossRef] [Green Version]
- Miquelajauregui, Y.; Cumming, S.G.; Gauthier, S. Sensitivity of boreal carbon stocks to fire return interval fire severity and fire season: Simulation study of black spruce forests. Ecosystems 2019, 22, 544–562. [Google Scholar] [CrossRef]
- Abatzoglou, J.T.; Williams, A.P. Impact of anthropogenic climate change on wildfire across western US forests. Proc. Natl. Acad. Sci. USA 2016, 113, 11770–11775. [Google Scholar] [CrossRef] [PubMed] [Green Version]
- Jung, K.Y.; Lee, I.J.; Lee, K.L.; Cheon, S.U.; Hong, J.Y.; Ahn, J.M. Long-Term Trend Analysis and Exploratory Data Analysis of Geumho River based on Seasonal Mann-Kendall Test. J. Environ. Sci. Int. 2016, 25, 217–229. [Google Scholar] [CrossRef]
- Guan, Y.; Lu, H.; Yin, C.; Xue, Y.; Jiang, Y.; Kang, Y.; Heiskanen, J. Vegetation response to climate zone dynamics and its impacts on surface soil water content and albedo in China. Sci. Total Environ. 2020, 747, 141537. [Google Scholar] [CrossRef]
- Jain, P.; Wang, X.; Flannigan, M.D. Trend analysis of fire season length and extreme fire weather in North America between 1979 and 2015. Int. J. Wildland Fire 2017, 26, 1009. [Google Scholar] [CrossRef]
- Bradstock, R.A. A biogeographic model of fire regimes in Australia: Current and future implications. Glob. Ecol. Biogeogr. 2010, 19, 145–158. [Google Scholar] [CrossRef]
- Littell, J.S.; Peterson, D.L.; Riley, K.L.; Liu, Y.; Luce, C.H. A review of the relationships between drought and forest fire in the United States. Glob. Chang. Biol. 2016, 22, 2352–2369. [Google Scholar] [CrossRef] [PubMed]
- Rodrigues, M.; Jiménez-Ruano, A.; de la Riva, J. Analysis of recent spatial-temporal evolution of human driving factors of wildfires in Spain. Nat. Hazards 2016, 84, 2049–2070. [Google Scholar] [CrossRef] [Green Version]
- Pausas, J.G.; Keeley, J.E. A burning story: The role of fire in the history of life. Bioscience 2009, 59, 593–601. [Google Scholar] [CrossRef] [Green Version]
- Pereira, P.; Mierauskas, P.; Novara, A. Stakeholders’ perceptions about fire impacts on Lithuanian protected areas. Land Degrad. Dev. 2016, 27, 871–883. [Google Scholar] [CrossRef] [Green Version]
- Xiong, Q.L.; Xiao, Y.; Halmy, M.W.A.; Dakhil, M.A.; Liang, P.H.; Liu, C.G.; Zhang, L.; Pandey, B.; Pan, K.W.; Kafraway, S.B.; et al. Monitoring the impact of climate change and human activities on grassland vegetation dynamics in the northeastern Qinghai-Tibet Plateau of China during 2000–2015. J. Arid Land 2019, 11, 637–651. [Google Scholar] [CrossRef] [Green Version]
- Balch, J.K.; Bradley, B.A.; Abatzoglou, J.T.; Nagy, R.C.; Fusco, E.J.; Mahood, A.L.; Chelsea Nagy, R. Human-started wildfires expand the fire niche across the United States. Proc. Natl. Acad. Sci. USA 2017, 114, 2946–2951. [Google Scholar] [CrossRef] [PubMed] [Green Version]
- Parisien, M.A.; Snetsinger, S.; Greenberg, J.A.; Nelson, C.R.; Schoennagel, T.; Dobrowski, S.Z.; Moritz, M.A. Spatial variability in wildfire probability across the western United States. Int. J. Wildland Fire 2012, 21, 313–327. [Google Scholar] [CrossRef]
- Aldersley, A.; Murray, S.J.; Cornell, S.E. Global and regional analysis of climate and human drivers of wildfire. Sci. Total Environ. 2011, 409, 3472–3481. [Google Scholar] [CrossRef] [PubMed]
- Parks, S.A.; Abatzoglou, J.T. Warmer and Drier Fire Seasons Contribute to Increases in Area Burned at High Severity in Western US Forests From 1985 to 2017. Geophys. Res. Lett. 2020, 47, 1–10. [Google Scholar] [CrossRef]
- Running, S.W. Climate Change: Is global warming causing more, larger wildfires? Science 2006, 313, 927–928. [Google Scholar] [CrossRef] [Green Version]
- Westerling, A.L.; Hidalgo, H.G.; Cayan, D.R.; Swetnam, T.W. Warming and earlier spring increase western U.S. forest wildfire activity. Science 2006, 313, 940–943. [Google Scholar] [CrossRef] [Green Version]
- Rodrigues, M.; Jiménez-Ruano, A.; Peña-Angulo, D.; de la Riva, J. A comprehensive spatial-temporal analysis of driving factors of human-caused wildfires in Spain using geographically weighted logistic regression. J. Environ. Manag. 2018, 225, 177–192. [Google Scholar] [CrossRef] [Green Version]
- Lindenmayer, D.B.; Taylor, C. New spatial analyses of Australian wildfires highlight the need for new fire, resource, and conservation policies. Proc. Natl. Acad. Sci. USA 2020, 117, 12481–12485. [Google Scholar] [CrossRef]
- National Forestry Bureau of China. China Forestry Statistical Yearbook; China Forestry Publishing House: Beijing, China, 2017; pp. 266–269. (In Chinese) [Google Scholar]
- Abatzoglou, J.T.; Williams, A.P.; Boschetti, L.; Zubkova, M.; Kolden, C.A. Global patterns of interannual climate-fire relationships. Glob. Chang. Biol. 2018, 24, 5164–5175. [Google Scholar] [CrossRef]
- Louis, G.; Wilfrid, S.; Christopher, O.J. The collection 6 MODIS active fire detection algorithm and fire products. Remote Sens. Environ. 2016, 178, 31–41. [Google Scholar]
- Su, Z.W.; Tigabu, M.; Cao, Q.Q.; Wang, G.Y.; Hu, H.Q.; Guo, F.T. Comparative analysis of spatial variation in forest fire drivers between boreal and subtropical ecosystems in China. For. Ecol. Manag. 2019, 454, 117669. [Google Scholar] [CrossRef]
- Archibald, S.; Lehmann, C.E.R.; Gómez-Dans, J.L.; Bradstock, R.A. Defining pyromes and global syndromes of fire regimes. Proc. Natl. Acad. Sci. USA 2013, 110, 6442–6447. [Google Scholar] [CrossRef] [PubMed] [Green Version]
- Taylor, S.W.; Alexander, M.E. Science, technology, and human factors in fire danger rating: The Canadian experience. Int. J. Wildland Fire 2006, 15, 121–135. [Google Scholar] [CrossRef]
- Du, R.S.; Shang, F.H.; Nan, M. Automatic mutation feature identification from well logging curves based on sliding t test algorithm. Clust. Comput. 2019, 22, 14193–14200. [Google Scholar] [CrossRef]
- Ruffault, J.; Mouillot, F. Contribution of human and biophysical factors to the spatial distribution of forest fire ignitions and large wildfires in a French Mediterranean region. Int. J. Wildland Fire 2017, 26, 498–508. [Google Scholar] [CrossRef] [Green Version]
- Chen, F.; Du, Y.; Niu, S.; Zhao, J. Modeling forest lightning fire occurrence in the Daxinganling Mountains of Northeastern China with MAXENT. Forests 2015, 6, 1422–1438. [Google Scholar] [CrossRef] [Green Version]
- Lan, Z.G.; Su, Z.W.; Guo, M.; Alvarado, E.C.; Guo, F.T.; Hu, H.Q.; Wang, G.Y. Are climate factors driving the contemporary wildfire occurrence in China? Forests 2021, 12, 392. [Google Scholar] [CrossRef]
- Li, W.; Chen, Y. Detectability of the trend in precipitation characteristics over China from 1961 to 2017. Int. J. Climatol. 2020, 41, E1980–E1991. [Google Scholar] [CrossRef]
- Li, J.; Zhu, Z.; Dong, W. A new mean-extreme vector for the trends of temperature and precipitation over China during 1960–2013. Meteorol. Atmos. Phys. 2016, 129, 273–282. [Google Scholar] [CrossRef]
- Wei, X.; Wang, G.; Chen, T.; Daniel, F.T.H.; Waheed, U. A Spatio-Temporal Analysis of Active Fires over China during 2003–2016. Remote Sens. 2020, 12, 1787. [Google Scholar] [CrossRef]
- Cao, Q.Q.; Zhang, L.J.; Su, Z.W.; Wang, G.Y.; Sun, S.C.; Guo, F.T. Comparing four regression techniques to explore factors governing the number of forest fires in Southeast, China. Geomatics. Nat. Hazards Risk 2021, 12, 499–521. [Google Scholar] [CrossRef]
- Maingi, J.K.; Henry, M.C. Factors influencing wildfire occurrence and distribution in eastern Kentucky, USA. Int. J. Wildland Fire 2007, 16, 23–33. [Google Scholar] [CrossRef] [Green Version]
- Miranda, B.R.; Sturtevant, B.R.; Stewart, S.I.; Hammer, R.B. Spatial and temporal drivers of wildfire occurrence in the context of rural development in northern Wisconsin, USA. Int. J. Wildland Fire 2012, 21, 141–154. [Google Scholar] [CrossRef]
- Guo, F.T.; Wang, G.Y.; Su, Z.W.; Liang, H.L.; Wang, W.H.; Lin, F.F.; Liu, A.Q. What drives forest fire in Fujian, China? Evidence from logistic regression and Random Forests. Int. J. Wildland Fire 2016, 25, 505–519. [Google Scholar] [CrossRef]
- Guo, F.T.; Su, Z.W.; Wang, G.Y.; Sun, L.; Lin, F.F.; Liu, A.Q. Wildfire ignition in the forests of southeast China: Identifying drivers and spatial distribution to predict wildfire likelihood. Appl. Geogr. 2016, 66, 12–21. [Google Scholar] [CrossRef]
- Guo, F.T.; Su, Z.W.; Wang, G.Y.; Sun, L.; Tigabu, M.; Yang, X.; Hu, H.Q. Understanding fire drivers and relative impacts in different Chinese forest ecosystems. Sci. Total Environ. 2017, 605–606, 411–425. [Google Scholar] [CrossRef]
Figure 1.
Study area showing the forest cover, the fire points, and climate stations.

Figure 2.
Forest fire distribution and change trend in the whole year and fire prevention period.

Figure 3.
Distribution and variation trend of forest fires in four seasons.

Figure 4.
Number of forest fires during fire prevention period and year (a) and change trend (b).

Figure 5.
Number of forest fires in four seasons (a) and change trend (b).

Figure 6.
Dynamic change of forest fire season.


Table 1.
Correlations between forest fires and fire weather index (FWI) in different regions and scales in Fujian Province.
Table 1.
Correlations between forest fires and fire weather index (FWI) in different regions and scales in Fujian Province.
| Test Method | Regions | Spring | Summer | Autumn | Winter | Fire Prevention Period | Entire Year |
|---|---|---|---|---|---|---|---|
| Kendall | Fujian Province | 0.52 ** | 0.12 | 0.57 ** | 0.58 ** | 0.48 ** | 0.48 ** |
| Ningde City | 0.60 ** | 0.25 | 0.55 ** | 0.57 ** | 0.45 * | 0.50 ** | |
| Longyan City | 0.43 * | 0.15 | 0.50 ** | 0.53 ** | 0.43 * | 0.50 ** | |
| Zhangzhou City | 0.37 * | 0.07 | 0.43 * | 0.45 * | 0.45 * | 0.53 ** | |
| Sanming City | 0.62 ** | 0.07 | 0.67 ** | 0.67 ** | 0.47 * | 0.53 ** | |
| Xiamen City | 0.23 | 0.18 | 0.40 * | 0.47 * | 0.32 | 0.40 * | |
| Quanzhou City | 0.35 | 0.30 | 0.62 ** | 0.50 ** | 0.50 ** | 0.47 * | |
| Putian City | 0.58 ** | 0.02 | 0.53 ** | 0.50 ** | 0.45 * | 0.50 ** | |
| Fuzhou City | 0.55 ** | 0.05 | 0.53 ** | 0.60 ** | 0.47 * | 0.55 ** | |
| Nanping City | 0.52 ** | 0.12 | 0.52 ** | 0.58 ** | 0.33 | 0.42 * | |
| Spearman | Fujian Province | 0.66 ** | 0.15 | 0.74 ** | 0.71 ** | 0.69 ** | 0.68 ** |
| Ningde City | 0.80 ** | 0.33 | 0.72 ** | 0.71 ** | 0.62 ** | 0.69 ** | |
| Longyan City | 0.53 * | 0.21 | 0.64 ** | 0.68 ** | 0.59 * | 0.69 ** | |
| Zhangzhou City | 0.51 * | 0.15 | 0.59 * | 0.60 * | 0.62 * | 0.71 ** | |
| Sanming City | 0.74 ** | 0.13 | 0.82 ** | 0.85 ** | 0.64 ** | 0.73 ** | |
| Xiamen City | 0.35 | 0.31 | 0.56 * | 0.63 ** | 0.52 * | 0.58 * | |
| Quanzhou City | 0.46 | 0.44 | 0.82 ** | 0.62 ** | 0.68 ** | 0.62 * | |
| Putian City | 0.71 ** | 0.01 | 0.72 ** | 0.67 ** | 0.62 * | 0.68 ** | |
| Fuzhou City | 0.70 ** | 0.05 | 0.72 ** | 0.69 ** | 0.64 ** | 0.75 ** | |
| Nanping City | 0.74 ** | 0.22 | 0.68 ** | 0.73 ** | 0.44 | 0.59 * |
Note: * and ** indicate that FWI are significantly correlated with forest fire at p < 0.05 and p < 0.01 level, respectively.
Publisher’s Note: MDPI stays neutral with regard to jurisdictional claims in published maps and institutional affiliations. |
© 2022 by the authors. Licensee MDPI, Basel, Switzerland. This article is an open access article distributed under the terms and conditions of the Creative Commons Attribution (CC BY) license (https://creativecommons.org/licenses/by/4.0/).
Share and Cite
MDPI and ACS Style
Zeng, A.; Yang, S.; Zhu, H.; Tigabu, M.; Su, Z.; Wang, G.; Guo, F. Spatiotemporal Dynamics and Climate Influence of Forest Fires in Fujian Province, China. Forests 2022, 13, 423. https://doi.org/10.3390/f13030423
AMA Style
Zeng A, Yang S, Zhu H, Tigabu M, Su Z, Wang G, Guo F. Spatiotemporal Dynamics and Climate Influence of Forest Fires in Fujian Province, China. Forests. 2022; 13(3):423. https://doi.org/10.3390/f13030423
Chicago/Turabian StyleZeng, Aicong, Song Yang, He Zhu, Mulualem Tigabu, Zhangwen Su, Guangyu Wang, and Futao Guo. 2022. "Spatiotemporal Dynamics and Climate Influence of Forest Fires in Fujian Province, China" Forests 13, no. 3: 423. https://doi.org/10.3390/f13030423
Note that from the first issue of 2016, this journal uses article numbers instead of page numbers. See further details here.