
Evaluating the Recreation Value of Alishan National Forest Recreation Area in Taiwan


1
Innovation and Development Center of Sustainable Agriculture, Department of Forestry, National Chung Hsing University, 145 Xingda Rd., South Dist., Taichung City 40227, Taiwan
2
International Bachelor Program of Agribusiness, National Chung Hsing University, Taichung City 40227, Taiwan
*
Author to whom correspondence should be addressed.
Forests 2021, 12(9), 1245; https://doi.org/10.3390/f12091245
Submission received: 20 June 2021
/
Revised: 6 September 2021
/
Accepted: 7 September 2021
/
Published: 14 September 2021
(This article belongs to the Special Issue Forest Management to Optimise Forest Ecosystem Services)
Abstract
:This study aimed to construct an effective model to estimate the recreation value and total annual recreation benefits of the Alishan National Forest Recreation Area (ANFR) through the travel cost method. Negative binomial regression was also employed to estimate the demand function. This study sorted participants based on gender, age, level of education, personal monthly income, occupation, and place of residence to examine their differences in perceived recreation value and recreation demand. The survey responses revealed that most tourists were mainly middle aged, and took family vacations. The findings indicate that the recreation benefits of traveling to Alishan per person each year equaled NTD 1703. Furthermore, the annual recreation benefits of Alishan were approximately between NTD 2,157,121,944 and NTD 2,452,136,112 based on a total of 1,353,276 visits traveling to Alishan in 2019. Recommendations and suggestions are drawn for ANFR based the results.
1. Introduction
In contemporary society, green spaces can effectively improve the public’s physical and mental health while also improving social welfare [1]. Large forest recreation areas are key green spaces that can provide numerous benefits [2,3], such as clean air and headwater protection [4,5], the elimination of waste or chemical pollution and an increase in carbon sequestration [6,7], and the provision of cultural ecosystem services. Forest recreation areas also have recreational value [8,9,10]. The recreational benefits offered by the forest and green space in forest recreation areas can improve both physical and mental health [11,12,13,14]. Although forest parks can provide many services, they are threatened by urbanization and increases in population density [15]. Indicators are required to assess the supply and demand of these valuable forest ecosystems in order to maintain their survival. Typically, a series of biophysical and social ecological indicators is used to evaluate the benefits that can be reaped from forest ecosystems [2]. In addition, several economic evaluation methods have been developed to express how much, in the form of currency, the revenue stream delivered by natural ecosystems is valued. This provides referential information for managers who must weigh the costs and benefits of policies and measures that affect environmental products and services that do not have a market [11].
Until now, economic evaluations of forests have mainly used contingent valuation [16,17] or the hedonic pricing method [18]; for recent discourse on methods for assessing forest ecosystem services, refer to Gómez-Baggethun and Barton (2013) [19]. Following pioneering studies and subsequent methodological development based on theories obtained from Clawson and Knetsch (1966) [20], the travel cost method (TCM) is often used to evaluate the profits of rural area forests. Among research cases, the random utility model has been used for the selection of recreational forests in rural surrounding areas, such as in Bestard and Font’s (2009) [21] analysis of Majorca, Spain, and in the Termansen et al. (2013) [22] study on forests in Denmark. Research cases that assess the benefits of rural area forests by applying TCM on single scenic sites include those by Elsasser (1996) [23], Garrod and Willis (1992) [24], Ovaskainen and Kniivil (2005) [25], Zandersen and Tol (2009) [10], and Bertram and Larondelle [11]. Chaudhry and Tewari (2006) [26] used the zonal TCM to evaluate the recreational benefits of forest parks in India. Dwyer et al. (1983) [27] used TCM to estimate willingness-to-pay for hypothetical entry to parks in Chicago. Liu et al. (2019) [28] used TCM to appraise the benefits of forest parks in Taiwan. The main objections to using TCM involve the allegedly numerous alternative venues, various modes of transportation, and the resulting low costs associated with visiting recreation areas in forests [19,29]. If visitors arrive at the recreation area by using free transportation, their evaluation of the recreation area is not captured by TCM, and the calculated consumer surplus may, therefore, be underestimated (Zandersen et al., 2012). However, this method has been argued to be useful for large forest parks, which are rare within city limits and require further travel to reach [29]. Forest areas are the most complex ecosystem [30], and the supply and demand of ecological services are often unbalanced, typically with excessive demands and insufficient supply; these are further exacerbated by potential population and development pressures, and evaluation of the intangible benefits of green areas is also important [19]. Furthermore, within forest environments, lifestyles and their approaches to recreation, transportation, and admiring nature often vary dramatically. Consequently, studies on the social and ecological effects of forest recreation areas are challenging but provide significant insights [11,31].
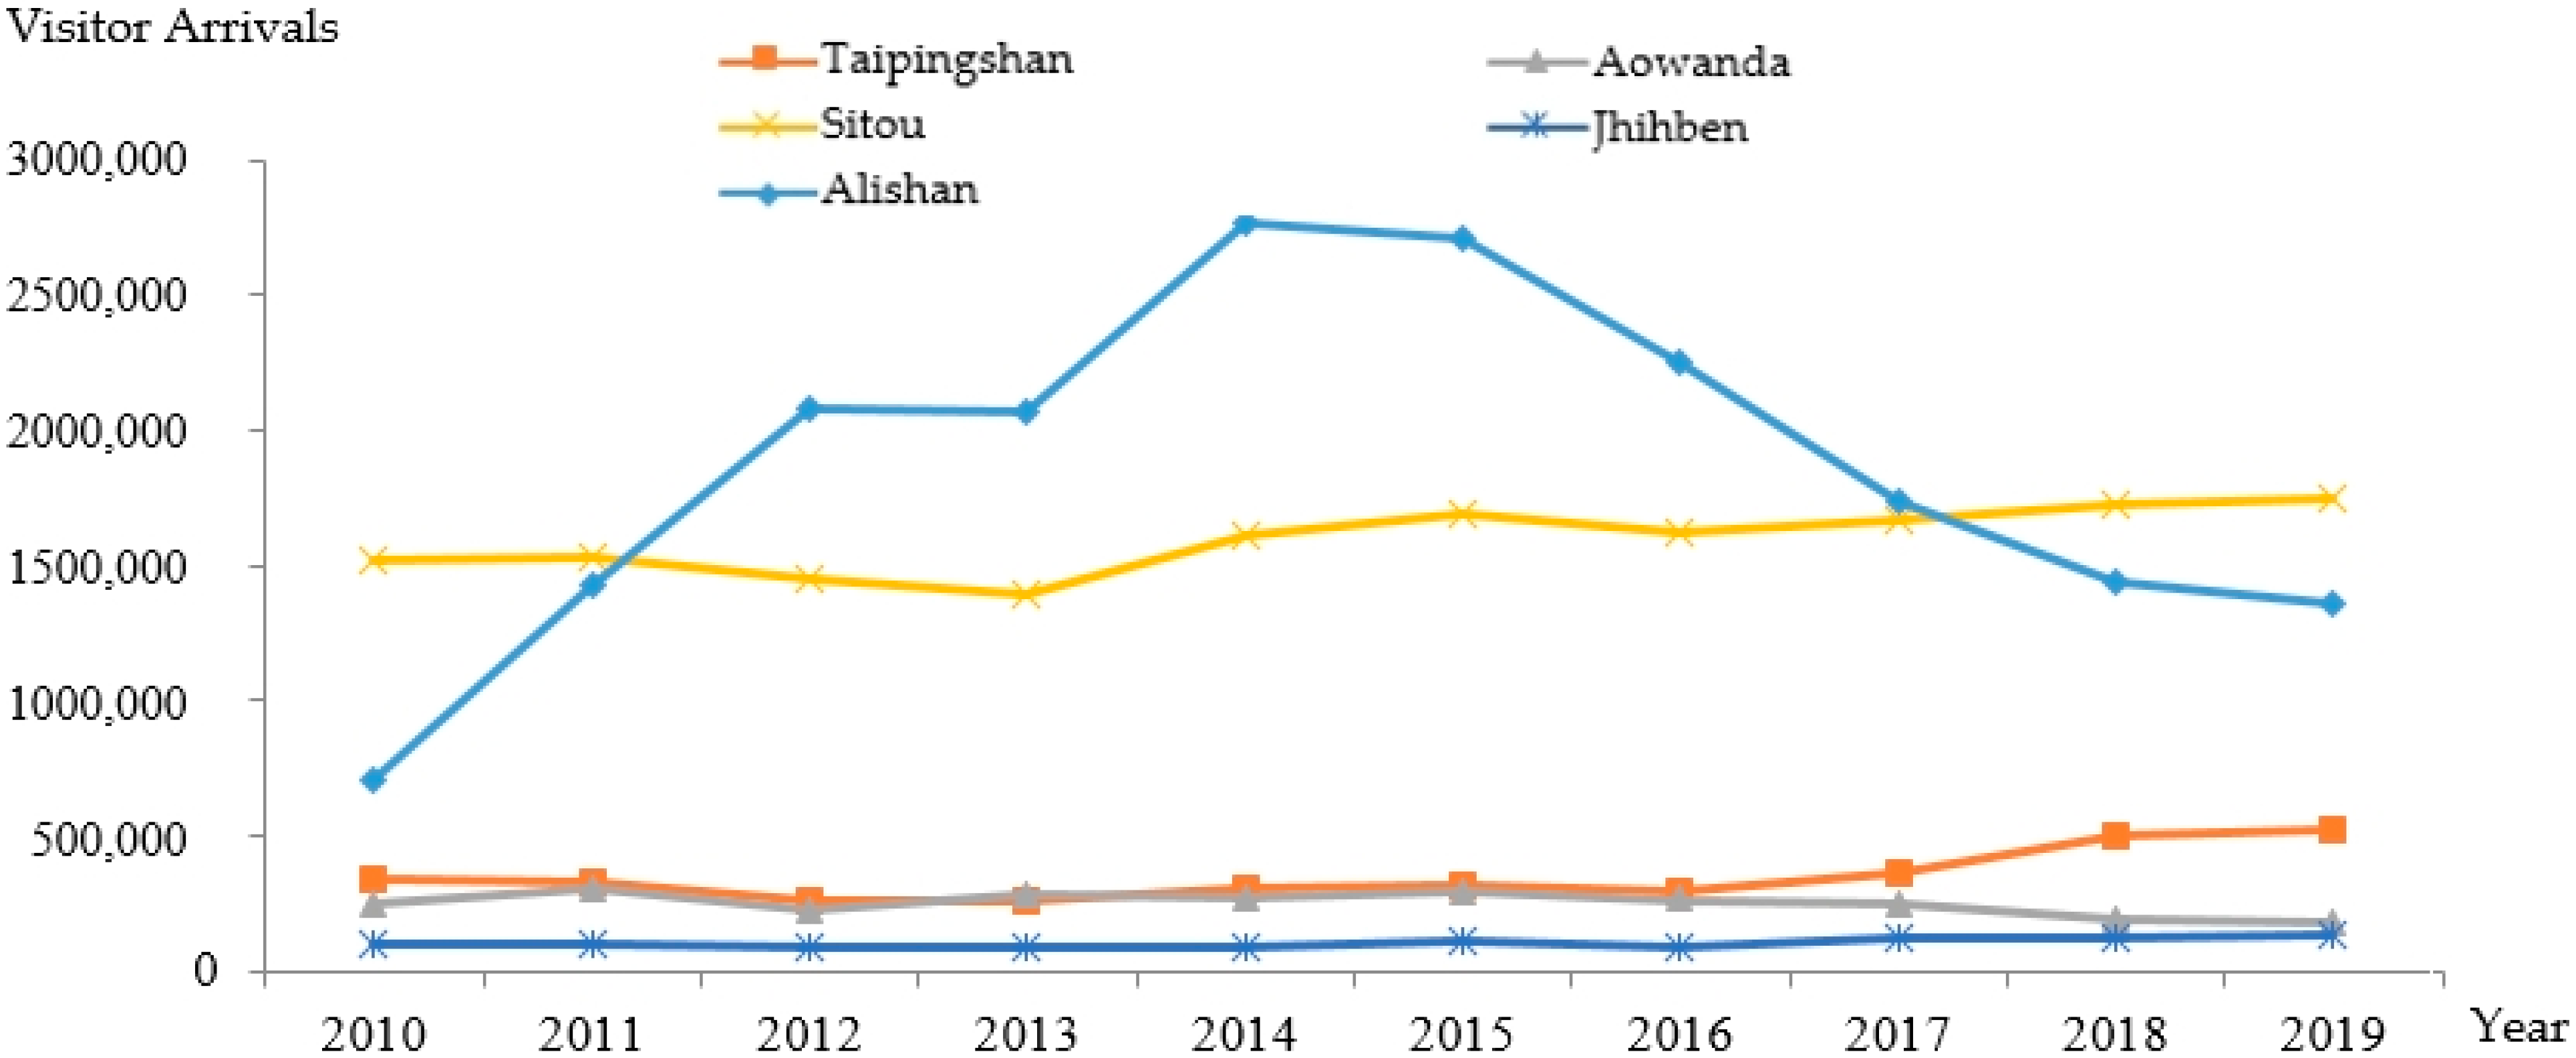
Taiwan has 22 national forest recreation areas, each with feature facilities such as historical railroads, hot springs, and unique scenery. The extreme popularity of national forest recreation areas in Taiwan can be seen in the 57,474,631 visitors to the areas in 2019. Table 1 presents the five most popular areas by number of visitors [32]; in the 2010–2017 period, Alishan ranked first, demonstrating its prominent status as seen in Figure 1. The recreational benefits gained by visitors to Alishan are worth investigating. Therefore, in this study, the individual TCM was used to analyze the recreation benefits, and the factors influencing visitors.
2. Materials and Methods
2.1. Research Area
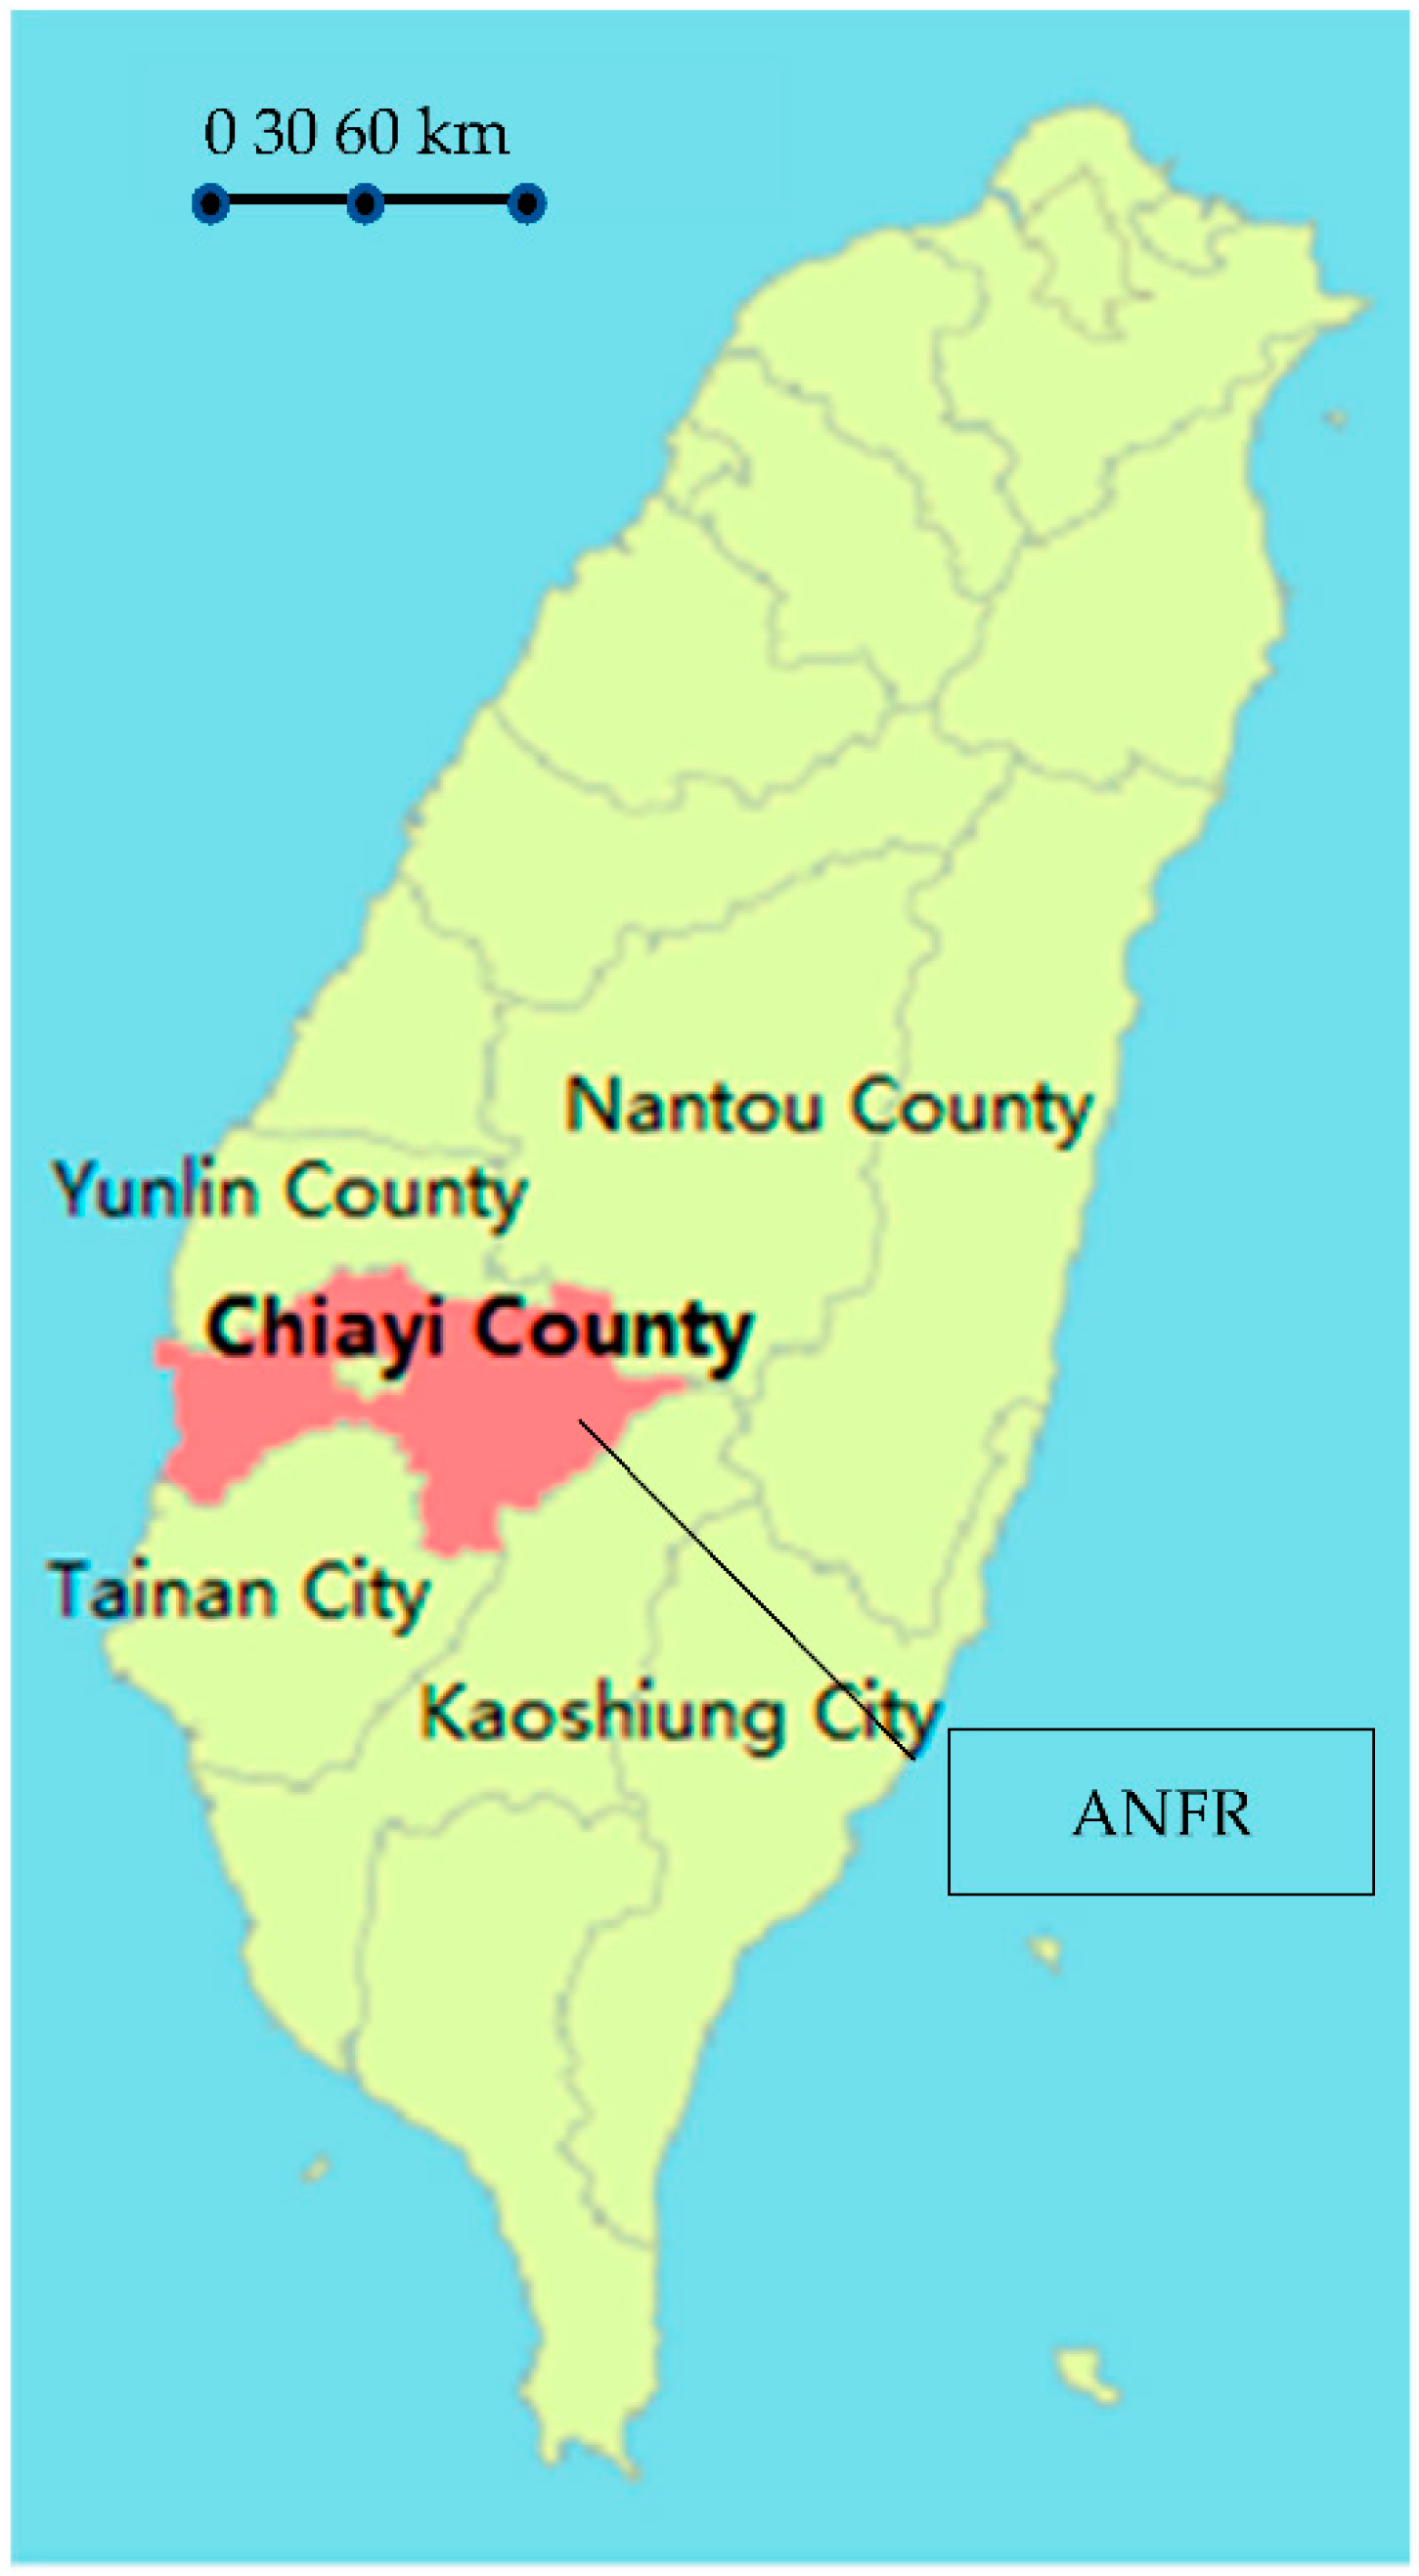
This study focused on the ANFR, located at 23°30′30.6” N, 120°48′04.1” E, at the southeast corner of the Alishan National Scenic Area, one of the national scenic areas planned and managed by the Tourism Bureau of the Ministry of Travel and Communication (MOTC) (Figure 2). It is situated in the administrative district of Alishan Village, Chiayi County. Alishan is not a single mountain but refers to the entire mountainous area in the Jiji-Zhuoshui River catchment area in Nantou; as such, the Alishan Range is one of five major mountain ranges in Taiwan. The region is rich with Formosan cypress and Japanese cypress trees and, from 1912 until the end of the 1960s, was the largest forest farm in Taiwan. After logging by Japanese and later governments, the original cypress forests have almost been depleted; at present, fewer than 40 Formosa cypress trees remain on the Giant Tree Plank Trail, which inspire people to imagine the magnificence of the past. The tallest Formosan cypress is No. 28 Giant Tree, which is 45 m tall and has a circumference of 12.3 m. Approximately 2300 years old, the tree is a must-see destination when visiting Alishan [33]. Tashan is the highest peak in the Alishan Range, at 2663 m above sea level; according to indigenous Tsou legends, benevolent spirits reside there. The rocky cliffs at the peak have distinct layers, and the craggy formations are a magnificent sight. Walking up the Tashan Trail from the Jiemei (Sister) Lakes, an observation deck at the Tashan peak can be reached, which offers a panoramic view in all four directions and a bird’s eye view of the recreation area and the rivers in the Alishan Range. Visitors can also admire the sea of clouds and the evening sky and see as far as the main peak of Yushan, Xiuguluan Mountain, and Duegaoyue [33]. Among the abundant ecologies in the ANFR, the most unique plants are the rare Oleandra wallichii, the Huperzia somai (Hayata) Ching, the Mahonia oiwakensis, and the Pleione formosana. The star line-up of indigenous fauna includes the Formosan rock macaque, the Mikado pheasant, Steere’s liocichla, the collared bush robin, and the Alishan salamander, drawing many visitors to the area [33].
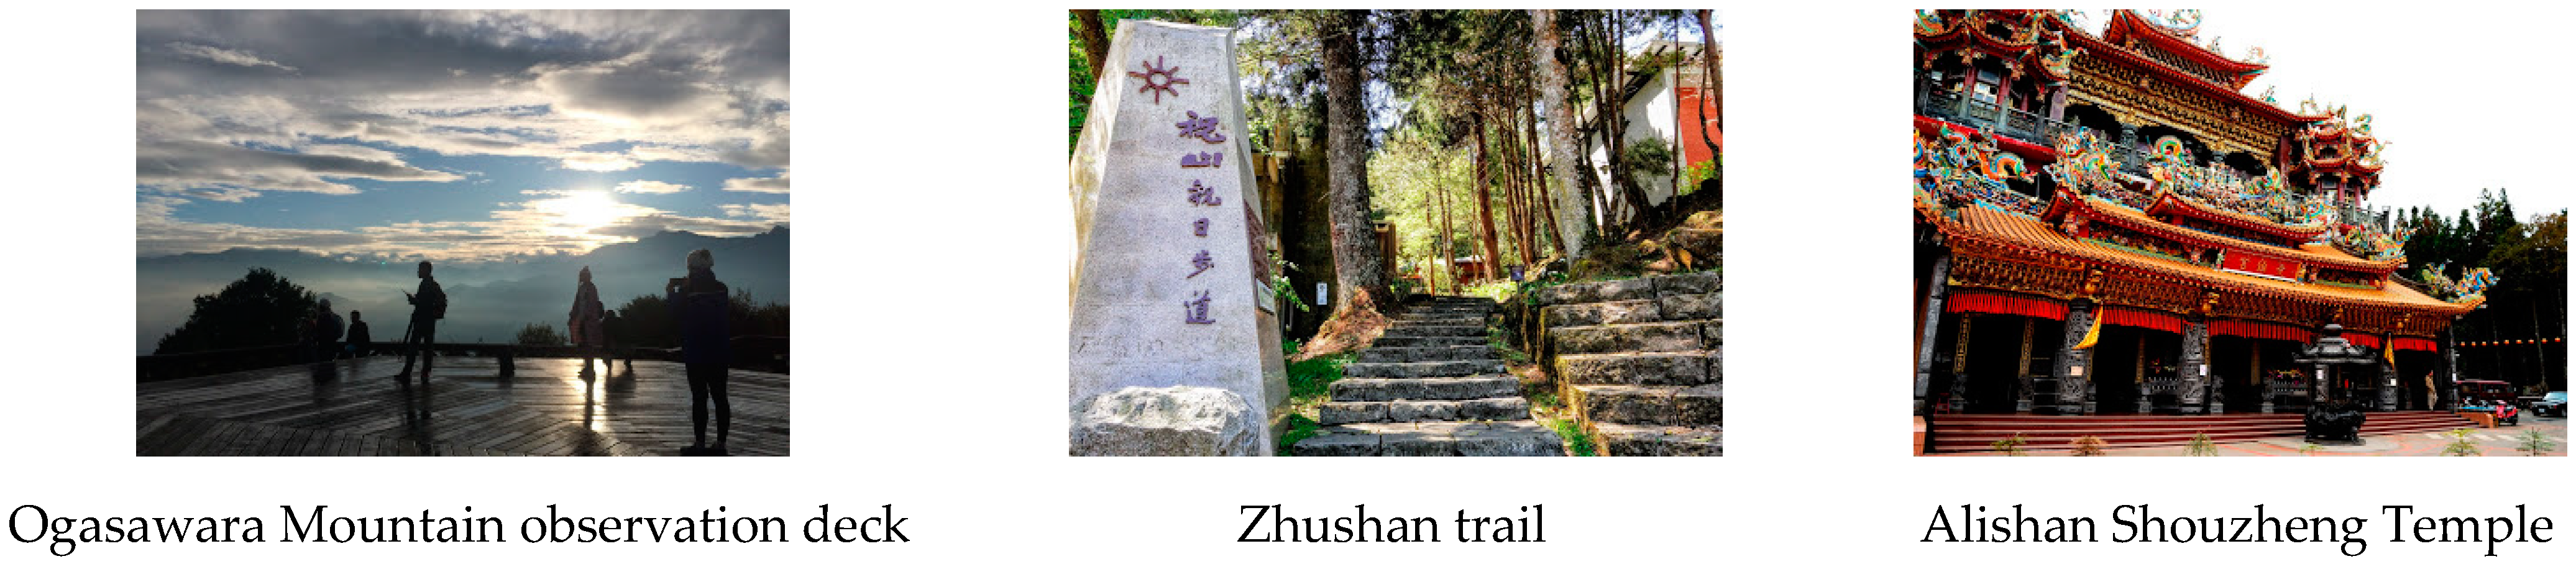
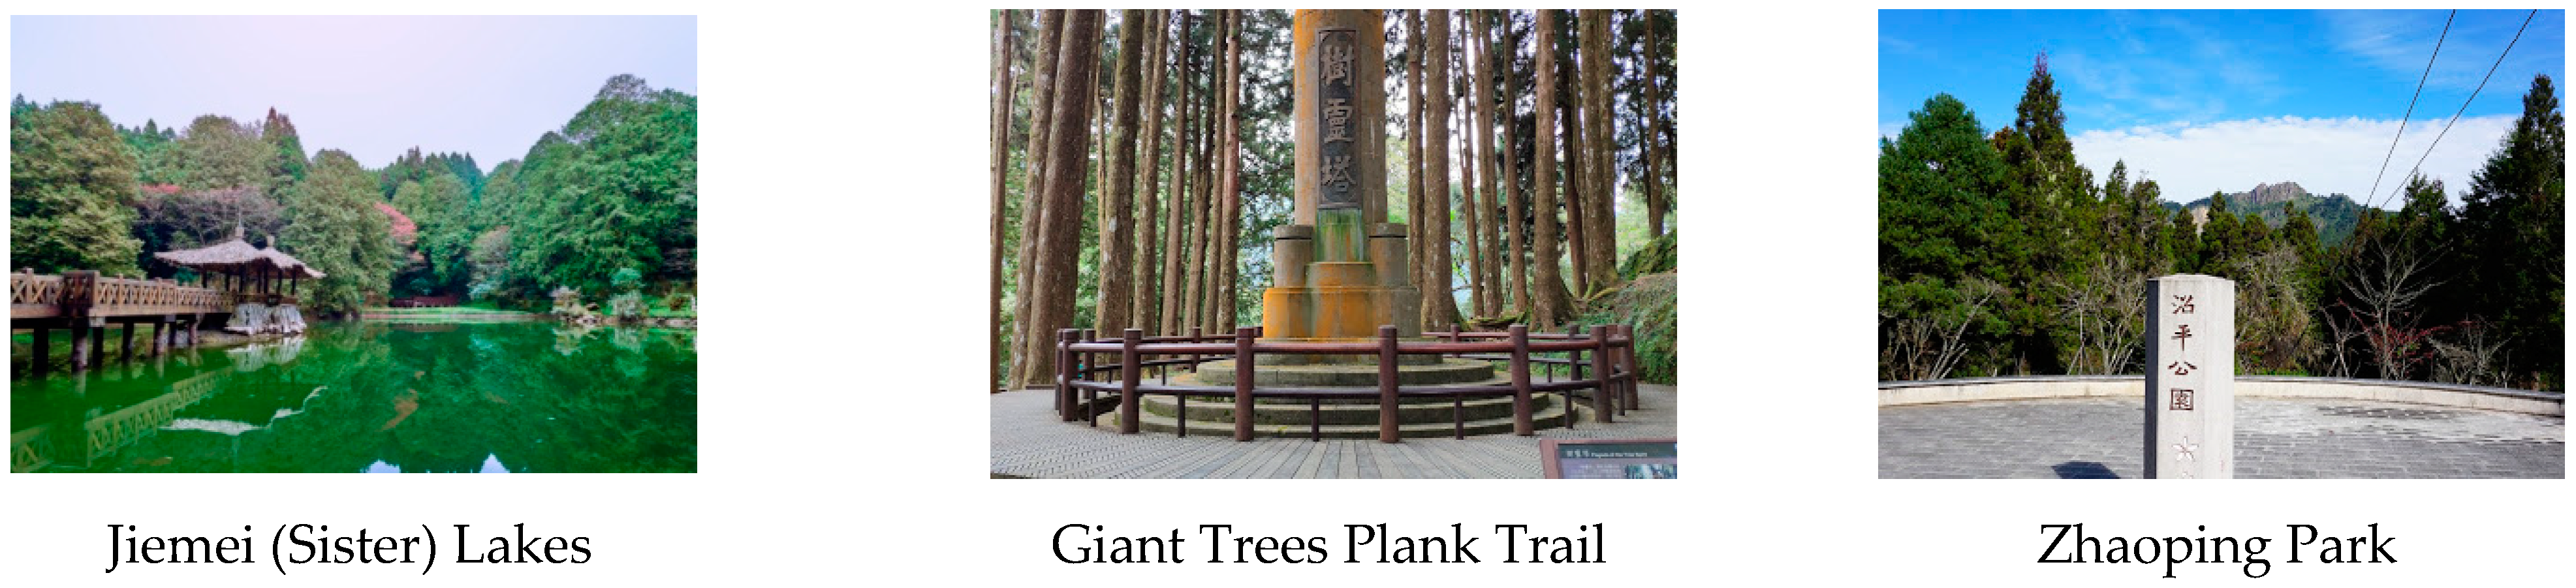
In addition to the giant trees, the ANFR has many popular scenic sites: the forest train, the misty Jiemei (Sisters) Lakes, the moving sea of clouds, the dazzling sunrise from Zhushan, and other attractions studied in this research, including Ogasawara observation deck, Zhushan Trail, Alishan Shouzheng Temple, Jiemei (Sister) Lakes, Giant Trees Plank Trail, and Zhaoping Park (Figure 3). The ANFR is an international tourism destination that sufficiently represents the cloud forest belt in Taiwan. Furthermore, due to the forest recreation area’s situation at a mid-high altitude in a relatively remote mountainous region, visiting tourists predominantly opt for travel itineraries of more than 1 day [33]. These features draw many tourists to this area and, therefore, estimating the recreation value of Alishan is crucial for regional development.
2.2. Research Methods
This study adopted the travel cost model (TCM) to appraise the economic benefits of recreation. Its different types of travel cost formulas, which can be traced back to Clawson and Knetsch (1966) [20], calculate the travel costs incurred from the number of visits to a site during a specific time frame. The core concept is that the costs that people must pay to travel to a recreational scenic site reflect the price that they are willing to pay for the travel destination. The consumer surplus, which happens when the price that consumers pay for a product or service is less than the price they are willing to pay, from one visit can be calculated based on the estimated demand function, which shows the functional relationship between recreational quantities demanded for a recreational spot and its various prices [11].
The base assumption of TCM is that a person’s travel costs to a certain recreation venue are determined by several variables, such as transportation costs, tickets to the scenic site, and opportunity costs of time. The number of personal recreations (yi) is the function of the travel cost (tc ij) to scenic site j, the travel cost to alternative destinations (tcis), and the individual traits of the respondent i (zi).
The demand function was constructed with a regression model that involves multiple independent variables (e.g., cost) and one dependent variable (the number of visits). A negative binomial regression (NBR) model was used to predict relationships between respondents’ Alishan recreation demands and their socioeconomic background and recreation behavior, which covered the following variables: place of residence, gender, age, level of education, monthly income, duration of visit, and transportation time. To ensure analysis stability, logarithms were taken for variables whose factor values were too large, such as monthly income and travel costs, without affecting the modeling results. Tourist recreation demand in Alishan was considered the dependent variable, and socioeconomic background and recreation behavior the independent variables.
The negative binomial model, in which the expected number of visits was recognized as the indicator of potential influencing factors, was employed to conduct the TCM. If the consumer surplus of each visit were to be calculated [34], TCM assumes weak complementarity between environmental assets and consumer spending. Individual economic benefits are estimated by calculating the consumer surplus. Then, the economic benefit for the entire recreation area was estimated by multiplying individual TCM with population.
This suggests that if the scenic site is not visited and the travel cost is zero, then the marginal benefits of the scenic site are also zero. TCM only captures use values typically associated with recreation uses and does not calculate non-use values or option values. Furthermore, TCM assumes that the need to visit a recreation area for recreational purposes is not related to the demand of other recreational activities or non-recreational products in alternative markets [11,35]. Recreational benefits are often calculated using consumer surplus (CS) as the evaluation method, which derives the maximum net benefits of tourists using a recreational area by measuring the consumer’s willingness-to-pay and the prices they actually paid [36]. This study analyzes the recreational benefits, based on the NBR model; the coefficient of each variable was entered into the demand model to obtain the logarithm of income and travel cost. Lastly, the t-test and one-way analysis of variance (ANOVA) were adopted to investigate the significant differences of means between two or more groups regarding variables.
2.3. Questionnaire Design and Distribution
The questionnaire comprised three major sections covering tourist background information, recreation experiences in the ANFR, and willingness to revisit. These were evaluated on a 5-point Likert scale.
First surveyed were visitor demographics. This section was designed to understand visitor backgrounds and included items on gender, age, level of education, personal monthly income, occupation, marital status, and place of residence [11]. Analysis of this information indicated whether these datapoints were representative of the overall population [37]. The questionnaire was distributed to tourists 18 years of age or older; as younger tourists were considered to have no financial resources of their own and may skew the survey results, they were excluded from the investigative scope. An appropriate response rate was also a vital part of the survey [38,39,40]. The second section of the survey represented an attempt to understand tourist experiences in the ANFR, and the items included number of visits within the past year; frequency of visiting green areas [36]; the method, duration, and cost of traveling to the area; the estimated duration of the visit; and spending within the park (tickets, parking fees, dining fees, Alishan products, souvenirs, and accommodations). Tickets and parking fees were based on prices posted on the ANFR’s website [33]. The survey also inquired about tourist preferences within the park [33]. The number of visits to the area within the past year was taken as the dependent variable within the consumer demand function [11,36,41]. Travel time and transportation can indicate transportation costs and time costs [11,41,42]. Duration and number of travel companions can indirectly affect a tourist’s recreational needs [11,41,42,43]. These items can indicate consumer spending and the accommodation costs of individual tourists in the ANFR, as well as their familiarity with the park.
The third section examined tourist willingness to revisit the ANFR. This part included items on whether the respondent was willing to revisit, whether they would recommend the park to others, whether they would give Alishan priority consideration for their next outing, the importance of the ANFR, and their level of satisfaction with ANFR. These items were measured using a 5-point scale and the responses were sorted into three groups. Group 1 responses were very unwilling, unwilling, neutral, willing, and very willing. Group 2 responses were not important at all, not important, neutral, important, and very important. Group 3 responses were very unsatisfied, unsatisfied, neutral, satisfied, and very satisfied. The responses were assigned scores from 1 to 5, in that order, across all three groups [11,41].
As for the survey distribution, the survey was administered on 15–18 August 2020, during weekdays and a weekend during the summer holiday period. The online survey was administered from 22 August to 3 September 2020. The paper surveys covered popular scenic sites for recreation, including the Alishan forest railway, Zhaoping Park, Zhushan trail, Alishan Shouzheng Templ, and the Jiemei (Sister) Lakes. To ensure that the respondents were tourists who actually visited the area, the respondents had to be 18 years of age or older; the inclusion of younger respondents may result in invalid responses or erroneous results. Each respondent was awarded a gift for completing the survey. The respondents were not selected through random sampling but through on-site convenience sampling; any tourist willing to be surveyed was invited to fill out the questionnaire. To ensure that the responses were accurate and that each tourist understood the items, the survey items were explained individually to each respondent. Assistance was provided when a respondent encountered a problem to ensure all the items were answered, unless the tourist was unwilling to answer [11,41].
3. Results and Discussion
The printed questionnaire was distributed to 217 respondents, and the online survey was distributed to 216 respondents; 424 valid samples were collected for a recovery rate of 97.9%. The collected data were analyzed using descriptive statistics, analysis of variance, and truncated binomial regression analysis to ultimately calculate the recreation benefits to tourists visiting Alishan National Forest Recreation Park.
3.1. Descriptive Statistics
The respondents were analyzed by gender, age, level of education, personal monthly income, occupation, marital status, and place of residence (Table 2). Female tourists formed the majority, accounting for 59.4% of the total sample. In terms of age, the largest age group was in the 30–49 year range, accounting for 42.7% of the whole; 41.85 years was the average age. College-educated tourists accounted for 51.9%. In terms of monthly income, the majority (25.5%) earned New Taiwan Dollar (NTD) 20–40 thousand a month, and respondents with a monthly salary of NTD 80–100 thousand a month comprised 4.0% of the sample. The average monthly income was NTD 47,971.70. The majority of respondents were employed in military and civil services (20.8%), followed by the service industry (17%); retirees, students, and laborers were also common. The results demonstrated that the respondents were predominantly service providers, military or civil servants, retirees, students, or laborers.
3.2. Recreation Behavior
The recreation behavior of tourists visiting Alishan is presented in Table 2 and Table 3. Most of the recreation demands for Alishan were one-time demands, accounting for 79.0% of all demands; the average was 1.41 demands. In all, 45.5% of the tourists were from the central or southern region, as opposed to the northern or eastern region or outlying islands. One inference is that because Alishan is situated in the central southern region, and the distance from the tourist’s place of residence affects the travel cost, greater distances result in higher transportation costs or longer travel times, decreasing the motivation to travel to Alishan. As a result, recreation demand is closely related to the location of the recreation area and tourist’s place of residence. As for the recreation demand for green spaces, the most frequent response was no more than once a month (46.5%), followed by one to three times a month (34.9%); an inference is that growing urbanization has resulted in reduced green spaces near tourists, resulting in less access to them. A majority stayed in Alishan for 2 days and 1 night (32.3%), and the second largest group stayed 2–4 h (25.7%); the average visit duration was 23.40 h. As for transportation, 297 respondents traveled using their own or a rented car, accounting for 70.0% of the sample, followed by 51 respondents who traveled by tour bus (12.0%). The inference is that tourists from farther away mostly visit Alishan as part of a tour group traveling by bus and, therefore, they have more travel companions on average. Because the survey period was during the summer holiday period, one study inference is that most of the visits were short, autonomous family trips. The average travel time was 3.71 h. As traveling from the Chiayi City area to the Alishan region already takes approximately an hour, one inference is that most tourist groups come from the central southern region where Alishan is situated. Most of the respondents stayed the night, with 218 people accounting for 51.4% of the total group. According to visit duration, overnight stays, and transportation method, the inference is that most tourists are part of group tours or on independent family holidays.
3.3. Travel Costs
The travel costs are presented in Table 4. “A” represents the accommodation costs, that is, the total amount spent by an individual staying in Alishan, which was approximately NTD 1867.52 per person. The MTC roundtrip travel cost and parking fee per person or roundtrip travel on public transportation per person was approximately NTD 550.60, while the transportation cost for walking or cycling was zero. However, for tourists traveling greater distances, the travel cost from their home to the ANFR had to be calculated and distinguished into two types. The first type was the cost of fuel when traveling by car or motorbike; the cost for cars was based on typical passenger cars traveling at 70 km per hour, and the motorbike cost was based on a speed of 60 km per hour. One of the items in the survey measured the time the tourist spent to reach the area and, multiplying by the assumed speeds, the travel distance can be obtained [11]. This travel distance was then divided by the average fuel consumption rate; according to the MOTC’s (2019) [44] survey, passenger cars have an average fuel consumption of 11.1 km per liter on typical roads and highways, and motorbikes have an average fuel consumption rate of 23.1 km per liter. The results yielded the fuel consumption to reach the ANFR, which was multiplied by the fuel price per liter for 95 octane gasoline or 92 octane gasoline. The survey was distributed during 15–18 August 2020 and, according to the Bureau of Energy, the average price for 95 octane then was NTD 23.85 per liter, and the average for 92 was NTD 22.42 per liter. The fuel cost for a passenger car or motorbike to reach the ANFR was thus calculated and then divided by the size of the travel group to obtain the travel cost per person. The second type of travel cost involved public transportation or tour bus. This item was surveyed using open form answers, and the respondents stated one person’s transportation cost. Parking fees were NTD 100 for passenger cars and NTD 20 for motorbikes [45].
TTC signifies travel time cost. Travel time is a major independent variable, as significant as travel distance (Blackwell, 2003), and was approximately NTD 420.79 per person. The calculation of the travel time to the recreation area was affected by distance factors and, therefore, was an exogenous variable. (Travel costs should include fuel costs and depreciation, which are determined by the chosen mode of transportation [34]. Therefore, these two variables were not included in the calculations.) Furthermore, endogenous variables result in endogeneity problems; therefore, time cost in this study included only the time to travel to and from Alishan and did not include the duration in Alishan. The currency value of the travel costs was calculated based on wage rates [43], by multiplying the roundtrip travel times by 40% of the tourist’s hourly income [11,46,47,48,49]. In summary, travel time cost = unit time cost × roundtrip travel time; the unit time cost = 40% × hourly income of each tourist, and hourly income = monthly income ÷ paid days per month ÷ 8. Paid days per month = (365 − 104) ÷ 12 = 21.75 days [50].
OE represents consumer spending and includes spending on souvenirs, food and drink, and tickets within the ANFR [41]. Ticket prices are based on prices posted on the ANFR website [45]. OE was approximately NTD 1006.60 per person.
This study made four cost calculations (Table 4). The first travel cost calculation was A + MTC (accommodation cost + transportation cost) and was approximately NTD 2418.12 per person. The second travel cost calculation was A + TTC + MTC (accommodation cost + transportation cost + time cost) and totaled approximately NTD 2838.91 per person. The third travel cost calculation was A + OE + MTC (accommodation cost + transportation cost + consumer spending) and was approximately NTD 3561.03 per person. The fourth travel cost calculation was A + OE + TTC + MTC (accommodation cost + transportation cost + time cost + consumer spending) and was approximately NTD 3981.82 per person [41]. This indicates that the average accommodation expense per person accounted for the highest percentage of the total travel cost at 46.9%, whereas the average time cost per person accounted for the lowest percentage at 7.3%.
3.4. Preferences
As shown in Table 5, the three most popular Alishan scenic sites were the Alishan Forest Train (203 people, 31.8%), the Giant Trees Plank Trail (142 people, 22.2%), and the Ogasawara observation deck (71 people, 11.1%). The remaining scenic sites—Zhushan Trail, Jiemei (Sister) Lakes, Zhaoping Park, and Alishan Shouzheng Temple—were less popular among the respondents.
3.5. Willingness to Revisit
Table 6 demonstrates that the items measuring willingness to revisit, “I will recommend the ANFR to others”, had the highest average score with 4.09, followed by “I am willing to visit the ANFR again” at 4.06. The high estimates are because Alishan is rich with natural, beautiful, and historical scenery, which the tourists wished to share with others. Unique festival activities, such as the early autumn planetary season and cherry blossom festivals, only occur during specific times, and special leisure activities—park tour buses, the Alishan Forest Train, and the afternoon mists—can stimulate the desire to share the experience with friends.
3.6. Analysis of Variance in Socioeconomic Background, Recreation Behavior, and Total Travel Costs
T tests were performed on respondent gender and marital status, and single-factor ANOVA was conducted for age, level of education, monthly income, occupation, visit duration, and place of residence (Table 7). These analyses were used to determine whether the variables exhibited significant differences regarding the total travel cost. Finally, least significant difference (LSD) post hoc analysis was used to ascertain the size of the travel costs spent.
The total travel cost did not differ significantly with gender, a finding consistent with that of Dong et al. (2011) [51]. By contrast, respondents with different marital statuses were observed to exhibit significantly different travel costs and, according to the LSD post hoc analysis, those who were married had higher travel costs than those who were single. The total travel cost also different significantly with age, and the LSD post hoc analysis indicated that those aged 50–64 years had higher travel costs than those aged 30–49 years, who had higher travel costs than those aged 18–29 years. Different levels of education exhibited significant differences in total travel costs, and the LSD post hoc analysis indicated that respondents with a junior college or university degree and those with a graduate degree or higher spent more on travel costs than respondents with a vocational or general high school degree. Significant differences in travel costs were observed between respondents with differing incomes, and the LSD post hoc analysis indicated that travel costs among respondents earning NTD 100,000 or more and those earning NTD 60,000–80,000 were higher than those respondents earning under NTD 20,000, NTD 20,000–40,000, or NTD 40,000–60,000; an inference is that high earners are more willing to travel, resulting in a positive correlation between high incomes and high expenditures [52,53,54,55]. Conversely, low earners spent less on travel costs, and this phenomenon is attributable to their low income: low earners choose to travel to nearby locations and choose cheaper modes of transportation, such as cycling, motorbike, or walking, to reduce their travel costs [56]. The total travel cost also differed significantly with occupation. The LSD post analysis indicated that respondents who were employed in military or civil services, the commercial sector, the service sector, or freelancing spent more than students, whereas respondents in the commercial sector spent more than those in the industrial sector; respondents in other occupations or the commercial sector also spent more than respondents between jobs. Significant differences in total travel costs were also observed in terms of the duration in Alishan, and the LSD post hoc analysis demonstrated that respondents who stayed longer incurred higher total travel costs. This indicates that the number of days that a tourist spends in a recreation area affects their expenses, which is consistent with the finding of Wang et al. (2009) [57], and direct relationships are present among accommodation costs, dining costs, and duration [58,59,60,61,62]. Therefore, the longer a tourist spent in the ANFR, the higher their total travel costs were. Finally, the total travel cost differed with the tourist’s place of residence. Specifically, tourists from northern Taiwan had higher total travel costs than tourists from central Taiwan, who had higher travel costs than tourists from southern Taiwan. This finding is attributable to how tourists from northern Taiwan live farther away from Alishan and, therefore, spent more on transportation.
3.7. Recreation Demand
The results of a negative binomial regression (NBR) model are presented in Table 8.
Models 1–4 describe different dependent variables of travel cost. The travel cost of Model 1 only considers the accommodation cost and transportation cost. The travel cost of Model 4 considers most complete items such as accommodation cost, transportation cost, time cost, and consumer spending cost. The results showed that a negative relationship was exhibited between the travel cost and recreation demand, but it was not significant. This demonstrates that when travel costs are higher, recreation demand is lower, which is consistent with the findings of predecessors such as Martinez-Espineira and Amoako-Tuffour (2008) [63], and Zhang et al. (2015) [41], as well as the principles of demand theory. The demand curve indicates the demand for an object, and each additional unit purchased results in diminishing marginal utility and, therefore, higher prices are linked to lower demand. Significant negative correlations existed between place of residence and recreation demand after further assessment (βnorth = −0.383 ***, −0.392 ***, −0.365 ***, −0.393 ***; βcentral = −0.241 **, −0.244 **, −0.235 **, −0.244 **), indicating that the recreation demand of tourists from northern Taiwan was lower than that of tourists from central Taiwan. This finding is consistent with those of Abildtrup et al. (2013) [64]. This indicates that because Alishan is somewhat remote, compared with tourists from central Taiwan, tourists from other parts of Taiwan incur higher transportation costs due to longer travel times, resulting in lower overall recreation demand. Gender and recreation demand exhibited a significant negative correlation, while age had a significant positive correlation (β = 0.010 **, 0.010 **, 0.010 **, 0.010 **), indicating that higher age groups demonstrated higher recreation needs. This is consistent with findings by Oppermann (1995) [65], and Schröder and Widmann (2007) [66]. The inference is that senior citizens near retirement or who have retired have more flexible schedules and more time for recreational activities. Log (monthly income) demonstrated a positive correlation that did not meet significance, indicating that higher incomes were linked to higher recreation demand. This is consistent with findings by Hesseln et al. (2003) [67], Martinez-Espineira and Amoako-Tuffour (2005) [63], and Bin et al. (2005) [68], but inconsistent with findings by Zhang et al. (2015) [41], and Chen et al. (2011) [69]. This inconsistency is attributable to regional differences across the studies. Duration of visit exhibited a non-significant yet positive correlation, indicating that recreation demand increased with visit duration. This is consistent with the findings of Loomis et al. (2000) [70], Huang and Chen (2011) [71], and Xu (2013) [72]. Because the tourists demonstrated high levels of preference for Alishan, longer visits to Alishan formed deeper impressions of the site, which increased recreation demand. A non-significant negative correlation was observed between transportation time and recreation demand, demonstrating that greater distances were linked to lower demand, which is consistent with the findings of Xu (2013) [72].
The α value is used to verify whether data demonstrate overdispersion. If the α value is equal to 0, there is no overdispersion. An α value of >0 indicates the presence of overdispersion. As shown in Table 8, the α value was equal to 0, and the data did not demonstrate overdispersion and, therefore, could be analyzed using NBR and Poisson regression. The fit of the predictive model to the hypothetical model was tested using likelihood ratio chi-square. Significant differences were present in the overall sample model, indicating that the predictive model of the total study sample had a decent fit. “Overall sample model 4” was used to estimate the overall recreational benefits, with travel costs as the independent variable and Alishan recreation demand as the dependent variable. The reason for selecting Model 4 was because the travel costs of the model represented the total travel costs of traveling to Alishan and was, therefore, more representative.
3.8. Analyzing Recreational Benefits
This yielded the Alishan recreation demand function, which was the demand function of overall tourists to Alishan (E (y|x) Total) and was calculated as follows:
E(y|x)Total = exp(−0.000458A OETTCMTC − 0.259AREA − 0.156SEX + 0.009AGE + 0.154EDU
− 0.002INC + 0.001LOS − 0.011TRATIME − 0.072
− 0.002INC + 0.001LOS − 0.011TRATIME − 0.072
In the equation, variables other than travel costs were brought into the regression equation as their average values and viewed as constants. These variables were then combined with the intercept terms to form a fixed constant, and the recreation demand regression equation was derived as the relationship between recreation demand and travel costs. We assumed that the average travel cost to the tourists during the present period was the upper limit of the recreational cost in the total sample; the travel costs of zero tourist demand was the lower limit. The recreation benefits (person/year) could be further obtained by estimating the total tourist population of ANFR (CSTotal):
For the entire sample, the recreation benefit of traveling to Alishan, per person per year, was NTD 1703, and the 95% confidence interval was NTD 1594–1812. Multiplied by the 1,353,276 travelers to Alishan in the year 2019, the results indicate that the recreation benefits of Alishan for the year were between NTD 2,157,121,944 and NTD 2,452,136,112 (Table 9).
4. Conclusions and Suggestions
Most research and analysis in Taiwan targeting the ANFR have employed questionnaire statistics, but this approach lacks the evaluation of recreation benefits and economic value. Assessing the benefits generated by recreation activities in the park is crucial to both academic research and the implementation of management policies. When planning the use of space in the ANFR and promoting improvements to the environment, park managers must first understand the recreation value of Alishan itself. By understanding and quantifying its recreation value, park managers can determine the public’s preferences and adopt adequate economic strategies, thereby devising suitable plans and making reasonable, wise decisions. Therefore, the objective of this study was to construct an effective model for appraising the recreation value of the ANFR by using TCM. Tourists present at the recreation area were targeted as survey participants. After calculation of the total recreation benefits of Alishan, differences in recreation demand and travel costs due to the influences of tourist socioeconomic backgrounds and recreational behavior were investigated.
The results indicate that most of the tourists who travel to Alishan recreationally are women who are middle-aged (30–40 years old) and who have received college-level (or higher) educations with an average monthly income of approximately NTD 50,000. The tourists are mainly from the central southern region of Taiwan and typically spend 2 days and 1 night in Alishan. The average number of visits to Alishan per person over the previous year was 1.41. Most tourists traveled to Alishan by car, with an average travel time of 3.71 h.
The travel cost analysis results demonstrate the average accommodation and transportation costs per person for each visit was NTD 2418.12. The average accommodation, transportation, and time costs per visit was NTD 2838.91. The average accommodation and transportation costs and consumer spending per visit totaled NTD 3561.03. The average accommodation, transportation, and time costs and consumer spending per person per visit equaled NTD 3981.82. This indicates that on average, individuals spend most on accommodation, whereas time costs account for only 7.3% of travel spending (the lowest cost).
The NBR results indicate that socioeconomic background (place of residence, gender, and age) and recreational behavior, as variables, have significant influences on the recreation demand of Alishan. Looking at the total sample model based on place of residence, tourists from the southern region of Taiwan have greater recreation demand than tourists from the central region, who in turn have greater recreation demand than tourists from the northern region. Female tourists outnumber male tourists and, by age, older tourists have greater recreation demand for Alishan.
The recreation benefits of the ANFR indicate that the recreation benefit of traveling to Alishan per person each year was NTD 1703. The MOTC’s statistics for 2019 reveal that 1,353,276 people traveled to Alishan that year; therefore, the total recreation benefits of Alishan for 2019 were between NTD 2,157,121,944 and NTD 2,452,136,112.
Based on the cited literature and the survey performed in this study, we propose the following three suggestions.
- The ANFR management team can reduce the price of accommodations within the park, promote the accommodations, and offer discounts to increase the recreation demand of tourists visiting Alishan.
According to the study results and conversations with Alishan tourists and workers, tourists living in regions further from Alishan have lower recreation demand. Therefore, to increase the recreation demand of remote tourists, we propose that the management of the ANFR suppresses accommodation prices to lower costs for remote tourists, who will then be more willing to revisit Alishan. The results of this study indicate that remote tourists are more likely to stay in the park for 2 days and 1 night and, therefore, accommodation prices are a key factor for remote tourists. From the surveyed tourist accounts and based on personal experience, the accommodation prices in Alishan are far higher than accommodation prices outside the park, without any indication of dropping. Furthermore, hotel booking websites have become an alternate form of booking; park management can partner with these websites to create some mutually beneficial accommodation packages, such as monthly early bird discounts or specials, which can effectively lower the expensive accommodation prices in the park.
- 2.
- The ANFR management team can create diverse travel methods to increase willingness to consume and recreation demand.
According to the results of this study, most of the recreation demand involves medium or low earners (monthly income of approximately NTD 30,000) who have limited spending power. To increase their willingness to consume, we propose that the ANFR offer diverse travel methods. For instance, cherry blossom trees are one of Alishan’s famous attractions. Therefore, management can roll out parent–child DIY activities with Alishan’s natural resources, such as naturally fallen cherry blossoms, as project materials to create interesting crafts such as cherry blossom pendants or artisan carvings. These activities can deepen family connections and attract more tourists for recreation purposes, while also increasing willingness to consume. This, in turn, will indirectly promote the recreation benefits.
- 3.
- The ANFR management team can improve the convenience of transportation to the park and introduce group tour travel options to increase the recreation demand.
The study results indicate that cars are the most common form of transportation used by tourists, and few tourists use public transportation. However, personal driving is quite harmful to the environment, and the number of cars on the road should be reduced to protect it. We propose that the Alishan National Forest Recreation Park management plans convenient modes of public transportation and increases the number of shuttle depots. This will have direct benefits such as raising the recreation demand of senior tourists. Furthermore, management can partner with travel agencies to add group travel packages and promote group tours, which will have positive benefits for reducing the travel costs of remote tourists. This will address the lower recreation intentions of remote tourists due to long travel times. In brief, convenient public transportation and additional group travel methods can increase recreation demand for the ANFR, and these measures can also effectively reduce air pollution caused by cars.
Author Contributions
Three co-authors contributed to the completion of this article together. W.-Y.L. was the first author and contributed to conceptualizing the research framework, data analysis, the results and conclusions, and draft reviewing and editing; B.-S.F. mainly contributed to the conducting of research investigation, data analysis, and results and conclusions; C.-M.H. acted as a corresponding author on their behalf throughout the review, editing, and submission process. All authors have read and agreed to the published version of the manuscript.
Funding
This research was funded by Taiwan Ministry of Science and Technology, Reference No. MOST 108-2410-H-005-045-MY2, and MOST 110-2321-B-005 -003.
Data Availability Statement
The data presented in this study are available on request from the corresponding author. The data are not publicly available due to containing information that could compromise the privacy of research participants.
Conflicts of Interest
The authors declare no conflict of interest.
References
- Elmqvist, T.; Fragkias, M.; Goodness, J.; Güneralp, B.; Marcotullio, P.J.; McDonald, R.I.; Wilkinson, C. Urbanization, Biodiversity and Ecosystem Services: Challenges and Opportunities: A Global Assessment; Springer Nature: Berlin/Heidelberg, Germany, 2013; p. 755. [Google Scholar]
- Dobbs, C.; Escobedo, F.J.; Zipperer, W.C. A framework for developing urban forest ecosystem services and goods indicators. Landsc. Urban Plan. 2011, 99, 196–206. [Google Scholar] [CrossRef]
- Ninan, K.N.; Inoue, M. Valuing forest ecosystem services: What we know and what we don’t. Valuing Ecosyst. Serv. 2013, 93, 137–149. [Google Scholar] [CrossRef]
- Baumgardner, D.; Varela, S.; Escobedo, F.J.; Chacalo, A.; Ochoa, C. The role of a peri-urban forest on air quality improvement in the Mexico City megalopolis. Environ. Pollut. 2012, 163, 174–183. [Google Scholar] [CrossRef] [PubMed]
- Larondelle, N.; Haase, D.; Kabisch, N. Mapping the diversity of regulating ecosystem services in European cities. Glob. Environ. Chang. 2014, 26, 119–129. [Google Scholar] [CrossRef]
- Brack, C.L. Pollution mitigation and carbon sequestration by an urban forest. Environ. Pollut. 2002, 116, 195–200. [Google Scholar] [CrossRef]
- Jansson, Å.; Nohrstedt, P. Carbon sinks and human freshwater dependence in Stockholm County. Ecol. Econ. 2001, 39, 361–370. [Google Scholar] [CrossRef]
- Hörnsten, L.; Fredman, P. On the distance to recreational forests in Sweden. Landsc. Urban Plan. 2000, 51, 1–10. [Google Scholar] [CrossRef]
- Jim, C.Y.; Chen, W.Y. Ecosystem services and valuation of urban forests in China. Cities 2009, 26, 187–194. [Google Scholar] [CrossRef]
- Zandersen, M.; Tol, R. A meta-analysis of forest recreation values in Europe. J. For. Econ. 2009, 15, 109–130. [Google Scholar] [CrossRef]
- Bertram, C.; Larondelle, N. Going to the woods is going home: Recreational benefits of a larger urban forest site—A travel cost analysis for Berlin, Germany. Ecol. Econ. 2017, 132, 255–263. [Google Scholar] [CrossRef]
- Bratman, G.; Daily, G.; Levy, B.; Gross, J. The benefits of nature experience: Improved affect and cognition. Landsc. Urban Plan. 2015, 138, 41–50. [Google Scholar] [CrossRef]
- Clement, J.; Cheng, A. Using analyses of public value orientations, attitudes and preferences to inform national forest planning in Colorado and Wyoming. Appl. Geogr. 2011, 31, 393–400. [Google Scholar] [CrossRef]
- Velarde, M.; Fry, G.; Tveit, M. Health effects of viewing landscapes–Landscape types in environmental psychology. Urban For. Urban Green 2007, 6, 199–212. [Google Scholar] [CrossRef]
- Loewenstein, E. Conversion of uniform broadleaved stands to an uneven-aged structure. For. Ecol. Manag. 2005, 215, 103–112. [Google Scholar] [CrossRef]
- Tyrväinen, L. Economic valuation of urban forest benefits in Finland. J. Environ. Manag. 2001, 62, 75–92. [Google Scholar] [CrossRef]
- Vesely, É. Green for green: The perceived value of a quantitative change in the urban tree estate of New Zealand. Ecol. Econ. 2007, 63, 605–615. [Google Scholar] [CrossRef]
- Sander, H.; Polasky, S.; Haight, R. The value of urban tree cover: A hedonic property price model in Ramsey and Dakota Counties, Minnesota, USA. Ecol. Econ. 2010, 69, 1646–1656. [Google Scholar] [CrossRef]
- Gómez-Baggethun, E.; Barton, D. Classifying and valuing ecosystem services for urban planning. Ecol. Econ. 2013, 86, 235–245. [Google Scholar] [CrossRef]
- Clawson, M.; Knetsch, J. Economics of Outdoor Recreation; Routledge: London, UK; New York, NY, USA, 2013. [Google Scholar]
- Bestard, À.B.; Font, A. Environmental diversity in recreational choice modelling. Ecol. Econ. 2009, 68, 2743–2750. [Google Scholar] [CrossRef]
- Zandersen, M.; Termansen, M. TEEB Nordic Case: Assessing Recreational Values of Danish Forests to Guide National Plans for Afforestation. Socio-Economic Importance of Ecosystem Services in the Nordic Countries—Scoping Assessment in the Context. Kettunen, M., Vihervaara, P., Kinnunen, S., D’Amato, D., Badura, T., Argimon, M., Ten Brink, P., Eds.; 2013. Available online: http://www.teebweb.org/wp-content/uploads/2013/01/TEEB-case_TEEBNordic_Assessing-recreational-values-of-Danish-forests-to-guide-national-plans-for-afforestation.pdf (accessed on 20 June 2021).
- Elsasser, P. Der Erholungswert des Waldes: Monetäre Bewertung der Erholungsleistung ausgewählter Wälder in Deutschland. 1996. 245p. Available online: https://www.researchgate.net/publication/34474612_Der_Erholungswert_des_Waldes_monetare_Bewertung_der_Erholungsleistung_ausgewahlter_Walder_in_Deutschland (accessed on 20 June 2021).
- Garrod, G.D.; Willis, K.G. Valuing goods’ characteristics: An application of the hedonic price method to environmental attributes. J. Environ. Manag. 1992, 34, 59–76. [Google Scholar] [CrossRef]
- Ovaskainen, V.; Kniivilä, M. Consumer versus citizen preferences in contingent valuation: Evidence on the role of question framing. Aust. J. Agric. Resour. Econ. 2005, 49, 379–394. [Google Scholar] [CrossRef] [Green Version]
- Chaudhry, P.; Tewari, V. A comparison between TCM and CVM in assessing the recreational use value of urban forestry. Int. For. Rev. 2006, 8, 439–448. [Google Scholar] [CrossRef]
- Dwyer, T.; Coonan, W.; Leitch, D.; Hetzel, B.; Baghurst, R. An investigation of the effects of daily physical activity on the health of primary school students in South Australia. Int. J. Epidemiol. 1983, 12, 308–313. [Google Scholar] [CrossRef]
- Liu, W.; Chen, P.; Hsieh, C. Assessing the recreational value of national forest park from ecotourists’ perspective in Taiwan. Sustainability 2019, 11, 4084. [Google Scholar] [CrossRef] [Green Version]
- Tyrväinen, L.; Pauleit, S.; Seeland, K.; de Vries, S. Benefits and uses of urban forests and trees. In Urban Forests and Trees; Springer: Berlin/Heidelberg, Germany, 2005; pp. 81–114. [Google Scholar]
- McPhearson, T.; Hamstead, A.; Kremer, P. Urban ecosystem services for resilience planning and management in New York City. Ambio 2014, 43, 502–515. [Google Scholar] [CrossRef] [PubMed] [Green Version]
- Coles, R.; Bussey, S. Urban forest landscapes in the UK—progressing the social agenda. Landsc. Urban Plan. 2000, 52, 181–188. [Google Scholar] [CrossRef]
- Taiwan Tourism Bureau Ministry. Annual Report on Tourism from 2010 through 2019. Available online: https://admin.taiwan.net.tw/FileUploadCategoryListC003330.aspx?CategoryID=a240d053-6206-4445-a097-0bcd9d29da97&appname=FileUploadCategoryListC003330 (accessed on 17 August 2021).
- Taiwan Forest Recreation. Alishan National Scenic Area. Available online: https://recreation.forest.gov.tw (accessed on 17 March 2020).
- Parsons, T. A Manual of Chemical & Biological Methods for Seawater Analysis; Elsevier: Amsterdam, The Netherlands, 2013. [Google Scholar]
- Hanley, N.; Barbier, E.; Barbier, E. Pricing Nature: Cost-Benefit Analysis and Environmental Policy; Edward Elgar Publishing: Cheltenham, UK, 2009. [Google Scholar]
- Grünigen, S.; Montanari, D. Swiss forest recreation: Monetary value and influencing factors. Schweiz. Z. Forstwes. 2014, 165, 113–120. [Google Scholar]
- Bateman, I.; Carson, R.; Day, B.; Hanemann, M.; Hanley, N.; Hett, T.; Swanson, J. Economic Valuation with Stated Preference Techniques: A Manual; Edward Elgar Publishing: Cheltenham, UK, 2002; Available online: https://econpapers.repec.org/bookchap/elgeebook/2639.htm (accessed on 20 June 2021).
- Alreck, P.L.; Settle, R.B. The Survey Research Handbook, 3rd ed.; McGraw Hill Irwin: New York, NY, USA, 2004. [Google Scholar]
- Babbie, E. Research design. In The Practice of Social Research; Wadsworth Publishing Company: Belmont, CA, USA, 2010; pp. 85–88. Available online: https://people.uvawise.edu/pww8y/Supplement/MESup/Babbie%20PracSocRes%201995/02PracSocRes%20Bab%20TheoryRes.pdf (accessed on 20 June 2021).
- Singleton, R.A.; Straits, B.C. Approaches to Social Research; Oxford University Press: New York, NY, USA, 2009. [Google Scholar]
- Zhang, L.; Wang, J.; You, J. Consumer environmental awareness and channel coordination with two substitutable products. Eur. J. Oper. Res. 2015, 241, 63–73. [Google Scholar] [CrossRef]
- Ho, C.; Mulley, C. Tour-based mode choice of joint household travel patterns on weekend and weekday. Transportation 2013, 40, 789–811. [Google Scholar] [CrossRef]
- Zhang, L.; Wang, J.; Liu, T. Landscape reconstruction and recreation of damaged land in opencast coal mine: A review. Adv. Earth Sci. 2016, 31, 1235–1246. [Google Scholar]
- Minister of Transportation and Communication. Statistics of Scenic Spots. Available online: https://stat.taiwan.net.tw/scenicSpot (accessed on 21 August 2020).
- Alishan Forest Recreation Area. Statistics of Scenic Spots. Available online: https://recreation.forest.gov.tw/Forest/RA?typ=0&typ_id=0500001 (accessed on 14 October 2020).
- Blackwell, B. The value of a recreational beach visit: An application to Mooloolaba beach and comparisons with other outdoor recreation sites. Econ. Anal. Policy 2007, 37, 77–98. [Google Scholar] [CrossRef]
- Hesseln, H.; Loomis, J.B.; González-Cabán, A. The effects of fire on recreation demand in Montana. West. J. Appl. For. 2004, 19, 47–53. [Google Scholar] [CrossRef] [Green Version]
- Ward, F.; Beal, D. Valuing Nature with Travel Cost Models; Edward Elgar Publishing: Cheltenham, UK, 2000; Available online: https://econpapers.repec.org/bookchap/elgeebook/1768.htm (accessed on 20 June 2021).
- Xue, D.; Cook, A.; Tisdell, C. Biodiversity and a Travel Cost Evaluation of Tourism: The Case of Changbaishan Mountain Biosphere Reserve, China (No. 274); University of Queensland, Department of Economics: Queensland, Australia, 2000. [Google Scholar]
- Ministry of Labor. Statistics. Available online: https://www.mol.gov.tw/statistics/2452/ (accessed on 5 June 2020).
- Dong, C.M.; Ho, T.P.; Hu, S.Y.; Shih, H.Y.; Huang, W.T. Estimation of the recreation benefit of Tainan first-grade historical sites. Chia. Nan. Ann. Bull. 2011, 37, 539–549. [Google Scholar]
- Cannon, T.F.; Ford, J. Relationship of demographic and trip characteristics to visitor spending: An analysis of sports travel visitors across time. Tour. Econ. 2002, 8, 263–271. [Google Scholar] [CrossRef]
- Kruger, M.; Saayman, M. Travel motivation of tourists to Kruger and Tsitsikamma National Parks: A comparative study. Afr. J. Wildl. Res. 2010, 40, 93–102. [Google Scholar] [CrossRef]
- Mehmetoglu, M. Nature-based tourists: The relationship between their trip expenditures and activities. J. Sustain. Tour. 2007, 15, 200–215. [Google Scholar] [CrossRef]
- Thrane, C. Jazz festival visitors and their expenditures: Linking spending patterns to musical interest. J. Travel Res. 2002, 40, 281–286. [Google Scholar] [CrossRef]
- Cheng, J.; Bertolini, L. Measuring urban job accessibility with distance decay, competition and diversity. J. Transp. Geogr. 2013, 30, 100–109. [Google Scholar] [CrossRef] [Green Version]
- Wang, W.C.; Wu, C.C. Exploring the Relationships among Environmental Attitude, Activity Involvement and Environmental Behavior by Early-life Outdoor Experience of Visitors. J. Tour. Leis. Stud. 2009, 15, 23–47. [Google Scholar]
- De Menezes, A.; Moniz, A. Determinants of length of stay: Parametric survival analysis. Tour. Anal. 2011, 16, 509–524. [Google Scholar] [CrossRef] [Green Version]
- Barros, C.P.; Machado, L.P. The length of stay in tourism. Ann. Tour. Res. 2010, 37, 692–706. [Google Scholar] [CrossRef]
- Barros, C.P.; Butler, R.; Correia, A. Heterogeneity in destination choice: Tourism in Africa. J. Travel Res. 2008, 47, 235–246. [Google Scholar] [CrossRef]
- Kozak, M. Repeaters’ behavior at two distinct destinations. Ann. Tour. Res. 2001, 28, 784–807. [Google Scholar] [CrossRef]
- Legohérel, P. Toward a market segmentation of the tourism trade: Expenditure levels and consumer behaviour instability. J. Travel Tour. Mark. 1998, 7, 19–39. [Google Scholar] [CrossRef]
- Martinez-Espineira, R.; Amoako-Tuffour, J. Recreation demand analysis under truncation, overdispersion, and endogenous stratification: An application to Gros Morne National Park. J. Environ. Manag. 2008, 88, 1320–1332. [Google Scholar] [CrossRef] [PubMed]
- Abildtrup, J.; Garcia, S.; Olsen, S.B.; Stenger, A. Spatial preference heterogeneity in forest recreation. Ecol. Econ. 2013, 92, 67–77. [Google Scholar] [CrossRef] [Green Version]
- Oppermann, M. Travel life cycle. Ann. Tour. Res. 1995, 22, 535–552. [Google Scholar] [CrossRef]
- Schröder, A.; Widmann, T. Demographic change and its impact on the travel industry: Oldies—Nothing But Goldies? In Trends and Issues in Global Tourism 2007; Springer: Berlin, Heidelberg, Germany, 2007; pp. 3–17. [Google Scholar]
- Hesseln, H.; Loomis, J.B.; González-Cabán, A.; Alexander, S. Wildfire effects on hiking and biking demand in New Mexico: A travel cost study. J. Environ. Manag. 2003, 69, 359–368. [Google Scholar] [CrossRef] [Green Version]
- Bin, O.; Landry, C.E.; Ellis, C.; Vogelsong, H. Some consumersurplus estimates for North Carolina beaches. Mar. Resour. 2005, 20, 145–161. [Google Scholar] [CrossRef]
- Chen, C.C.; Tseng, M.L.; Lin, Y.H. Recreation demand of consumer with experiential marketing in festival. Procedia-Soc. Behav. Sci. 2011, 25, 447–453. [Google Scholar] [CrossRef] [Green Version]
- Loomisa, J.; Kentb, P.; Strangec, L.; Fauschc, K.; Covichc, A. Measuring the total economic value of restoring ecosystem services in an impaired river basin: Results from a contingent valuation survey. In Economics of Water Resources; Routledge: London, UK, 2018; pp. 77–91. Available online: https://doi.org/10.1016/S0921-8009(99)00131-7 (accessed on 20 June 2021).
- Huang, Y.L.; Chen, K.L. The effect of multiple destination trips on recreation benefits-an example of leisure agriculture in Yilan County, Taiwan. Taiwan. Agric. Econ. Rev. 2011, 16, 41–76. [Google Scholar]
- Xu, H. A remote sensing index for assessment of regional ecological changes. China Environ. Sci. 2013, 33, 889–897. [Google Scholar]
Figure 1.
Visit numbers of the five most popular forest recreation areas in Taiwan.

Figure 2.
Geographical location of the ANFR.

Figure 3.
Famous scenic areas in the ANFR.


Table 1.
Five most visited forest recreation areas in Taiwan.
| Year | Alishan | Taipingshan | Aowanda | Sitou | Jhihben |
|---|---|---|---|---|---|
| 2010 | 710,354 | 345,713 | 246,267 | 1,522,216 | 94,649 |
| 2011 | 1,424,986 | 332,311 | 303,383 | 1,530,370 | 105,732 |
| 2012 | 2,080,500 | 258,923 | 231,425 | 1,449,526 | 94,250 |
| 2013 | 2,063,566 | 256,760 | 283,358 | 1,387,677 | 90,292 |
| 2014 | 2,761,479 | 307,816 | 271,760 | 1,610,522 | 92,935 |
| 2015 | 2,713,389 | 321,837 | 299,690 | 1,688,369 | 107,906 |
| 2016 | 2,245,787 | 297,736 | 266,181 | 1,626,030 | 88,105 |
| 2017 | 1,730,948 | 358,329 | 252,646 | 1,670,041 | 123,980 |
| 2018 | 1,444,536 | 495,414 | 192,739 | 1,723,480 | 124,718 |
| 2019 | 1,353,276 | 525,787 | 180,797 | 1,746,003 | 132,050 |
| Total | 18,528,821 | 3,500,626 | 2,528,246 | 15,954,234 | 1,054,617 |
Source: Taiwan Tourism Bureau Ministry (2021) [32].
Table 2.
Demographic characteristics of ANFR respondents (n = 424).
| Variables | Total Sample (n = 424) | ||
|---|---|---|---|
| Count | Percentage (%) | ||
| Gender | F | 252 | 59.4 |
| M | 172 | 40.6 | |
| Marital status | Single | 145 | 34.2 |
| Married | 279 | 65.8 | |
| Age (years) | 18–29 | 108 | 25.5 |
| 30–49 | 181 | 42.7 | |
| 50–64 | 111 | 26.2 | |
| 65 or older | 24 | 5.7 | |
| Level of education | Elementary school | 4 | 0.9 |
| Junior high school | 10 | 2.4 | |
| (Vocational) high school | 78 | 18.4 | |
| Junior college/university | 220 | 51.9 | |
| Graduate or higher | 112 | 26.4 | |
| Monthly income ((New Taiwan Dollar, NTD; 1 NTD = 0.03571 US dollar)) | Under 20,000 | 94 | 22.2 |
| 20,000–40,000 | 108 | 25.5 | |
| 40,000–60,000 | 93 | 21.9 | |
| 60,000–80,000 | 72 | 17.0 | |
| 80,000–100,000 | 17 | 4.0 | |
| 100,000 or above | 40 | 9.4 | |
| Occupation | Student | 69 | 16.3 |
| Military or civil service | 88 | 20.8 | |
| Industrial sector | 54 | 12.7 | |
| Commercial sector | 37 | 8.7 | |
| Service sector | 72 | 17.0 | |
| Freelance | 29 | 6.8 | |
| Agriculture, forestry, fishing, or animal husbandry | 6 | 1.4 | |
| Between jobs | 3 | 0.7 | |
| Retired | 42 | 9.9 | |
| Other | 24 | 5.7 | |
| Place of residence | Keelung City | 5 | 1.2 |
| New Taipei City | 49 | 11.6 | |
| Taipei City | 20 | 4.7 | |
| Taoyuan City | 125 | 29.5 | |
| Hsinchu City/County | 12 | 2.8 | |
| Miaoli County | 12 | 2.8 | |
| Taichung City | 52 | 12.3 | |
| Changhua County | 23 | 5.4 | |
| Nantou County | 0 | 0 | |
| Yunlin County | 3 | 0.7 | |
| Chiayi City/County | 25 | 5.9 | |
| Tainan City | 44 | 10.4 | |
| Kaohsiung City | 42 | 9.9 | |
| Pingtung County | 4 | 0.9 | |
| Taitung County | 0 | 0 | |
| Hualian County | 1 | 0.2 | |
| Yilan County | 7 | 1.7 | |
| Penghu County | 0 | 0 | |
| Kinmen County | 0 | 0 | |
| Lienchiang County | 0 | 0 | |
| Recreation demand for green spaces | Less than once a month | 197 | 46.5 |
| 1–3 times a month | 148 | 34.9 | |
| Once a week | 45 | 10.6 | |
| 2–3 times a week | 18 | 4.2 | |
| 4–6 times a week (or more) | 16 | 3.8 | |
| Recreation demand for Alishan (times/year) | Once | 335 | 79.0 |
| Twice | 49 | 11.6 | |
| Three times | 14 | 3.3 | |
| Four times | 6 | 1.4 | |
| Five times or more | 20 | 4.7 | |
| Duration in Alishan | Under 2 h | 16 | 3.8 |
| 2–4 h | 109 | 25.7 | |
| 4–6 h | 101 | 23.8 | |
| 6–8 h | 32 | 7.5 | |
| 2 days and 1 night | 137 | 32.3 | |
| 3 days and 2 nights | 22 | 5.2 | |
| 4 days and 3 nights | 7 | 1.7 | |
| Transportation in Alishan | Walking and cycling | 16 | 3.8 |
| Motorbike | 13 | 3.1 | |
| Tour bus | 51 | 12.0 | |
| Car (own or rented) | 297 | 70.0 | |
| Public transportation | 47 | 11.1 | |
| Did you stay overnight in Alishan? | No | 206 | 48.6 |
| Yes | 218 | 51.4 | |
Note: gray highlighting indicates highest value.
Table 3.
Quantitative analysis of the tourist respondents.
| Variables | Total (n = 424) | |
|---|---|---|
| Average | Standard Deviation | |
| Age | 41.85 | 14.15 |
| Gender 1 | 0.41 | 0.49 |
| Level of education 2 | 4.00 | 0.79 |
| Monthly income (NTD/month) | 47,971.70 | 25,822.44 |
| Recreation demand for Alishan (times/year) | 1.41 | 0.98 |
| Recreation demand for green spaces (times/year) | 2.77 | 3.91 |
| Travel time to Alishan (hours) | 3.71 | 1.57 |
| Duration of stay (hours) | 23.40 | 25.14 |
Note: 1 gender (M = 1, F = 0); 2 level of education (elementary = 1, junior high = 2, high school = 3, college/university = 4, graduate or higher = 5).
Table 4.
Travel costs (per visit).
| Variable Symbol | Total (n = 424) | |
|---|---|---|
| Average (NTD) | Standard Deviation (NTD) | |
| A | 1867.52 | 3278.65 |
| MTC | 686.91 | 952.25 |
| TTC | 420.79 | 309.69 |
| OE | 1006.60 | 1103.09 |
| Travel cost 1, A + MTC | 2554.43 | 4230.90 |
| Travel cost 2, A + TTC + MTC | 2975.22 | 4540.59 |
| Travel cost 3, A + OE + MTC | 3561.03 | 5333.99 |
| Travel cost 4, A + OE + TTC + MTC | 3981.82 | 5643.68 |
Note: A is accommodation cost, MTC is transportation cost, TTC is travel time cost, and OE is consumer spending; these are expressed in NTD.
Table 5.
Popular recreation sites and activities.
| Item | Alishan Forest Train | Ogasawara Observation Deck | Zhushan Trail | Alishan Shouzheng Temple | Jiemei (Sister) Lakes | Giant Trees Plank Trail | Zhaoping Park |
|---|---|---|---|---|---|---|---|
| Count (%) | 203 (31.8%) | 71 (11.1%) | 66 (10.3%) | 32 (5.0%) | 63 (9.9%) | 142 (22.2%) | 62 (9.7%) |
Note: For this item, respondents were allowed to select more than one answer, and therefore the total score exceeds 100%. The site with the highest score is highlighted in gray.
Table 6.
Willingness to visit again.
| Measurement Item | Very Unwilling | Unwilling | Neutral | Willing | Very Willing | AVG |
|---|---|---|---|---|---|---|
| Willing to visit Alishan again | 5 (1.2%) 1 | 3 (0.7%) | 76 (17.9%) | 216 (50.9%) | 124 (29.2%) | 4.06 |
| Will recommend Alishan to others | 8 (1.9%) | 2 (0.5%) | 67 (15.8%) | 214 (50.5%) | 133 (31.4%) | 4.09 |
| Priority consideration of Alishan | 8 (1.9%) | 10 (2.4%) | 137 (32.3%) | 186 (43.9%) | 83 (19.6%) | 3.77 |
| Not important at all | Not important | Neutral | Important | Very important | AVG | |
| Esteem for Alishan | 6 (1.4%) | 4 (0.9%) | 154 (36.3%) | 177 (41.7%) | 83 (19.6%) | 3.77 |
| Very unsatisfied | Unsatisfied | Neutral | Satisfied | Very satisfied | AVG | |
| Satisfaction with Alishan | 9 (2.1%) | 0 (0.0%) | 71 (16.7%) | 245 (57.8%) | 99 (23.3%) | 4.00 |
Note: 1 responses are expressed in count (percentage) and measured on a 5-point Likert scale.
Table 7.
Socioeconomic background and travel costs.
| Variables | Travel Costs | |||
|---|---|---|---|---|
| F Values | Significance | LSD Analysis | ||
| Gender 1 | Male | 1.699 | 0.193 | - |
| Female | ||||
| Marital status 1 | a. Married | 8.295 | 0.004 *** | a > b |
| b. Single | ||||
| Age | a. 18–29 | 10.936 | 0.000 *** | c > b > a |
| b. 30–49 | ||||
| c. 50–64 | ||||
| d. 65 or older | ||||
| Education | a. Elementary school | 2.664 | 0.032 ** | d, e > c |
| b. Junior high school | ||||
| c. (Vocational) high school | ||||
| d. Junior college/university | ||||
| e. Graduate or higher | ||||
| Monthly income | a. Under NTD 20,000 | 4.224 | 0.01 ** | f > d > a, b |
| b. NTD 20,000–40,000 | ||||
| c. NTD 40,000–60,000 | ||||
| d. NTD 60,000–80,000 | ||||
| e. NTD 80,000–100,000 | ||||
| f. NTD 100,000 or more | ||||
| Occupation | a. Student | 1.701 | 0.087 * | b, d, e, f > a d > c j, d > h |
| b. Military or civil service | ||||
| c. Industrial sector | ||||
| d. Commercial sector | ||||
| e. Service sector | ||||
| f. Freelance | ||||
| g. Agriculture, forestry, fishing, or animal husbandry | ||||
| h. Between jobs | ||||
| i. Retired | ||||
| j. Other | ||||
| Duration in Alishan | a. Under 2 h | 21.494 | 0.000 *** | e, f > d > a, b e, f, g > c g > a, b |
| b. 2–4 h | ||||
| c. 4–6 h | ||||
| d. 6–8 h | ||||
| e. 2 days, 1 night | ||||
| f. 3 days, 2 nights | ||||
| g. 4 days, 3 nights | ||||
| Residence | a. Northern Taiwan | 30.523 | 0.000 *** | a > b > c |
| b. Central Taiwan | ||||
| c. Southern Taiwan | ||||
1 Method of analysis: independent sample t tests; other methods of testing: single-factor ANOVA. Note: * p < 0.1, ** p < 0.05, *** p < 0.01.
Table 8.
Estimates of the Alishan Recreation Demand Model.
| Variable | Total Sample | |||
|---|---|---|---|---|
| Model 1 | Model 2 | Model 3 | Model 4 | |
| Ln(A + MTC) | −0.020 | |||
| Ln(A + TTC + MTC) | −0.014 | |||
| Ln(A + OE + MTC) | −0.053 | |||
| Ln(A + OE + TTC + MTC) | −0.005 | |||
| Place of residence (AREA) | ||||
| Northern | −0.383 *** | −0.392 *** | −0.365 *** | −0.393 *** |
| Central | −0.241 ** | −0.244 ** | −0.235 ** | −0.244 ** |
| Southern | - | - | - | - |
| Gender (SEX) | ||||
| M | - | - | - | - |
| F | −0.148 * | −0.148 * | −0.153 * | −0.148 * |
| Age (AGE) | 0.010 *** | 0.010 *** | 0.010 *** | 0.010 *** |
| Level of education (EDU) | ||||
| Elementary school | 0.003 | 0.005 | 0.003 | 0.005 |
| Junior high school | 0.238 | 0.231 | 0.272 | 0.232 |
| (Vocational) high school | 0.149 | 0.153 | 0.154 | 0.153 |
| College or university | 0.183 | 0.183 | 0.189 | 0.183 |
| Graduate or higher | - | - | - | - |
| Ln(INC) | 0.013 | 0.018 | 0.022 | 0.017 |
| Duration of visit (LOS) | −0.002 | 0.001 | 0.002 | 0.001 |
| Transportation time (TRATIME) | −0.009 | 0.010 | −0.006 | −0.011 |
| α value 1 | 0.000 | 0.000 | 0.000 | 0.000 |
| Likelihood ratio chi-square | 39.007 | 38.463 | 40.409 | 38.455 |
| Log likelihood | −546.392 | −546.664 | −545.691 | −546.668 |
Note: the dependent variable is recreation demand. Gray highlighting indicates significance, with * p < 0.1, ** p < 0.05, *** p < 0.01. 1 α value = 0, no overdispersion is present in the data; α value > 0, overdispersion is present. The table demonstrates that α = 0, thus, no overdispersion is present.
Table 9.
Recreation benefits.
| Total (n = 424) | |
|---|---|
| Recreation benefits per person per year (counts) | 1.41 |
| Upper limit of the 95% confidence interval | 1.50 |
| Lower limit of the 95% confidence interval | 1.32 |
| Recreation benefits per person per year (NTD/count) | 1208 |
| Recreation benefits per person per year (NTD) | 1703 |
| Upper limit of the 95% confidence interval | 1812 |
| Lower limit of the 95% confidence interval | 1594 |
| Recreation benefits per year (NTD) | 2,304,629,028 |
| Upper limit of the 95% confidence interval | 2,452,136,112 |
| Lower limit of the 95% confidence interval | 2,157,121,944 |
Note: recreation benefits per person per year: recreation benefits per person per year/number of travels per person per year. Total recreation benefits of Alishan each year: recreation benefits per person per year × total number of tourists in 2019 (1,353,276 people).
Publisher’s Note: MDPI stays neutral with regard to jurisdictional claims in published maps and institutional affiliations. |
© 2021 by the authors. Licensee MDPI, Basel, Switzerland. This article is an open access article distributed under the terms and conditions of the Creative Commons Attribution (CC BY) license (https://creativecommons.org/licenses/by/4.0/).
Share and Cite
MDPI and ACS Style
Liu, W.-Y.; Fang, B.-S.; Hsieh, C.-M. Evaluating the Recreation Value of Alishan National Forest Recreation Area in Taiwan. Forests 2021, 12, 1245. https://doi.org/10.3390/f12091245
AMA Style
Liu W-Y, Fang B-S, Hsieh C-M. Evaluating the Recreation Value of Alishan National Forest Recreation Area in Taiwan. Forests. 2021; 12(9):1245. https://doi.org/10.3390/f12091245
Chicago/Turabian StyleLiu, Wan-Yu, Bo-Sheng Fang, and Chi-Ming Hsieh. 2021. "Evaluating the Recreation Value of Alishan National Forest Recreation Area in Taiwan" Forests 12, no. 9: 1245. https://doi.org/10.3390/f12091245
Note that from the first issue of 2016, this journal uses article numbers instead of page numbers. See further details here.