
The Effect of Land Use/Cover Change on Soil Erosion Change by Spatial Regression in Changwu County on the Loess Plateau in China

1
College of Forestry, Northwest A&F University, Yangling 712100, China
2
State Key Laboratory of Soil Erosion and Dryland Farming on the Loess Plateau, Northwest A&F University, Yangling 712100, China
3
Northwest Surveying, Planning and Designing Institute of National Forestry and Grassland Administration, Xi’an 710048, China
4
Key Laboratory National Forestry Administration on Ecological Hydrology and Disaster Prevention in Arid Regions, Xi’an 710048, China
5
College of Economics & Management, Northwest A&F University, Yangling 712100, China
6
Changwu County Hongxing State-Owned Ecological Forest Farm, Changwu 713600, China
*
Author to whom correspondence should be addressed.
Forests 2021, 12(9), 1209; https://doi.org/10.3390/f12091209
Submission received: 8 July 2021
/
Revised: 1 September 2021
/
Accepted: 3 September 2021
/
Published: 6 September 2021
(This article belongs to the Special Issue Simulation Models of the Dynamics of Forest Ecosystems)
Abstract
:Changwu County is a typical soil and water loss area on the Loess Plateau. Soil erosion is an important ecological process, and the impact of land use/cover change on soil erosion has received much attention. The present study used remote sensing images of the study area in 1987, 1997, 2007, and 2017 to analyze the land use/cover change (LULCC), and the RUSLE model was applied to estimate the soil erosion in different times. We exploited the Sankey diagram to visualize the spatiotemporal changes in land use/cover and soil erosion. We planned to obtain the most suitable model by comparing the application of different spatial regression models (Geographically weighted regression model, Spatial lag model, Spatial error model) and Ordinary least squares in LULCC and soil erosion changes. The results revealed that land use/cover has significantly changed in the last 30 years. From 1987 to 1997, cropland expansion came mainly from planted land and orchards, which transformed 68.99 km2 and 64.93 km2, respectively. In 1997–2007, the planted land increase was mainly through the conversion of cropland. In 2007–2017, the increase in orchard area came mainly from cropland. The forest land increase was mainly from the planted land. Soil erosion in Changwu County was dominated by slight erosion and light erosion, although the area of slight erosion and light erosion continued to decrease. The annual average soil erosion increased, which was estimated at 977.84 ton km−2 year−1, 1305.17 ton km−2 year−1, 1310.60 ton km−2 year−1, and 1891.46 ton km−2 year−1 in 1987, 1997, 2007, and 2017, respectively. These amounts of transformation mainly occurred when slight erosion was converted to light erosion, light erosion was converted to moderate erosion, and moderate erosion was converted to light and severe erosion. The Spatial lag model and Spatial error model have higher accuracy than the Geographically weighted regression model and Ordinary least squares when fitting the effect of LULCC and soil erosion change, where the accuracy exceeded 0.62 in different periods.
1. Introduction
The human understanding of nature has gone through a long process, from plunder to protection. Land use and land cover change (LULCC) reflects the process of humans getting along with nature [1,2,3]. Land use has been defined as the purpose for which humans exploit the land cover. This involves both the manner in which the biophysical attributes of land are manipulated and the intent underlying that manipulation, that is, the purpose for which the land is used. Land cover has been defined by the attributes of the Earth’s land surface and immediate subsurface, including biota, soil, topography, surface- and ground-water, and human (mainly built-up) structures [4]. In recent years, research on LULCC has become more extensive and in-depth, mainly focusing on the driving factors of LULCC (including human activities, population increase, ecological factors, economic development, and government policies) [5,6,7], the effect of LULCC (including on land quality, hydrological cycle, climate change, biodiversity reduction, and agricultural production) [8,9,10,11], and the prediction of future changes in LULCC [12,13].
Soil erosion leads to the degradation of soil fertility, the decline in soil productivity, the destruction of surface vegetation, the deterioration of the environment, the restriction of economic development in the region, and the massive transfer of sediment and pollutants in the erosion process, which causes the eutrophication and siltation of the rivers and lakes in downstream areas [14,15,16,17]. Soil erosion assessments have received extensive attention since soil erosion threatens environmental and socio-economic conditions worldwide [16]. The RUSLE has been widely used in estimating soil erosion in the Loess Plateau. Jin used the RUSLE to estimate soil erosion in the Loess Plateau to study its response to vegetation and climate change [18]. Zhang estimated soil erosion in the largest tableland of the Loess Plateau by RUSLE to study effect of land use changes on soil erosion [19].
Extensively covered by characteristic powdery, dry soil (called loess), and coupled with unreasonable human activities and heavy rain, the Loess Plateau in China has suffered serious soil erosion [20]. Since the founding of the People’s Republic of China, the government has implemented a series of measures to control soil erosion [20,21]. This has achieved significant results after long-term efforts by the Chinese government.
Changwu County is located in the loess gully region of the Loess Plateau [22]. As a typical area of soil erosion on the Loess Plateau, soil and water conservation began in the 1950s, and has undergone local decentralized governance, centralized continuous management, comprehensive watershed management, and county-scale management. In the late 1990s, the implementation of the Grain for Green Project played a key role in suppressing local soil erosion [23]. However, government policies and human activities all had an impact on the land use/cover pattern, and also brought great challenges or chances for soil and water conservation in Changwu County. Research on land use/cover and soil erosion in different areas of the loess plateau has attracted the continued attention of researchers [24,25,26]. However, with the intervention of long-term government policies and human activities, the spatial and temporal changes of the land use/cover pattern and soil erosion in the study area remains unclear and the effect of LULCC on soil erosion change is not established.
LULCC and soil erosion changes have obvious spatial attributes, which cannot meet the requirement of independent variables in classical statistics. So as to more accurately study the effect of LULCC on soil erosion changes, we chose different spatial regression models (Geographically weighted regression model, Spatial lag model, Spatial error model) to fit the relationship between the LULCC on soil erosion changes. We planned to obtain the most suitable model by comparing the application of different spatial regression models in LULCC and soil erosion changes. Ordinary least squares (OLS) is used as the reference of the spatial regression models. The present study aims to analyze the spatial and temporal change process of land use/cover by classifying the four remote sensing images of the study area in 1987, 1997, 2007, and 2017, and analyze the spatial and temporal change process of soil erosion through the quantitative estimation of soil erosion with the use of the Revised Universal Soil Loss Equation (RUSLE) model, and we choose suitable spatial regression models to fit the effect of LULCC on soil erosion changes.
2. Materials and Methods
2.1. Study Region
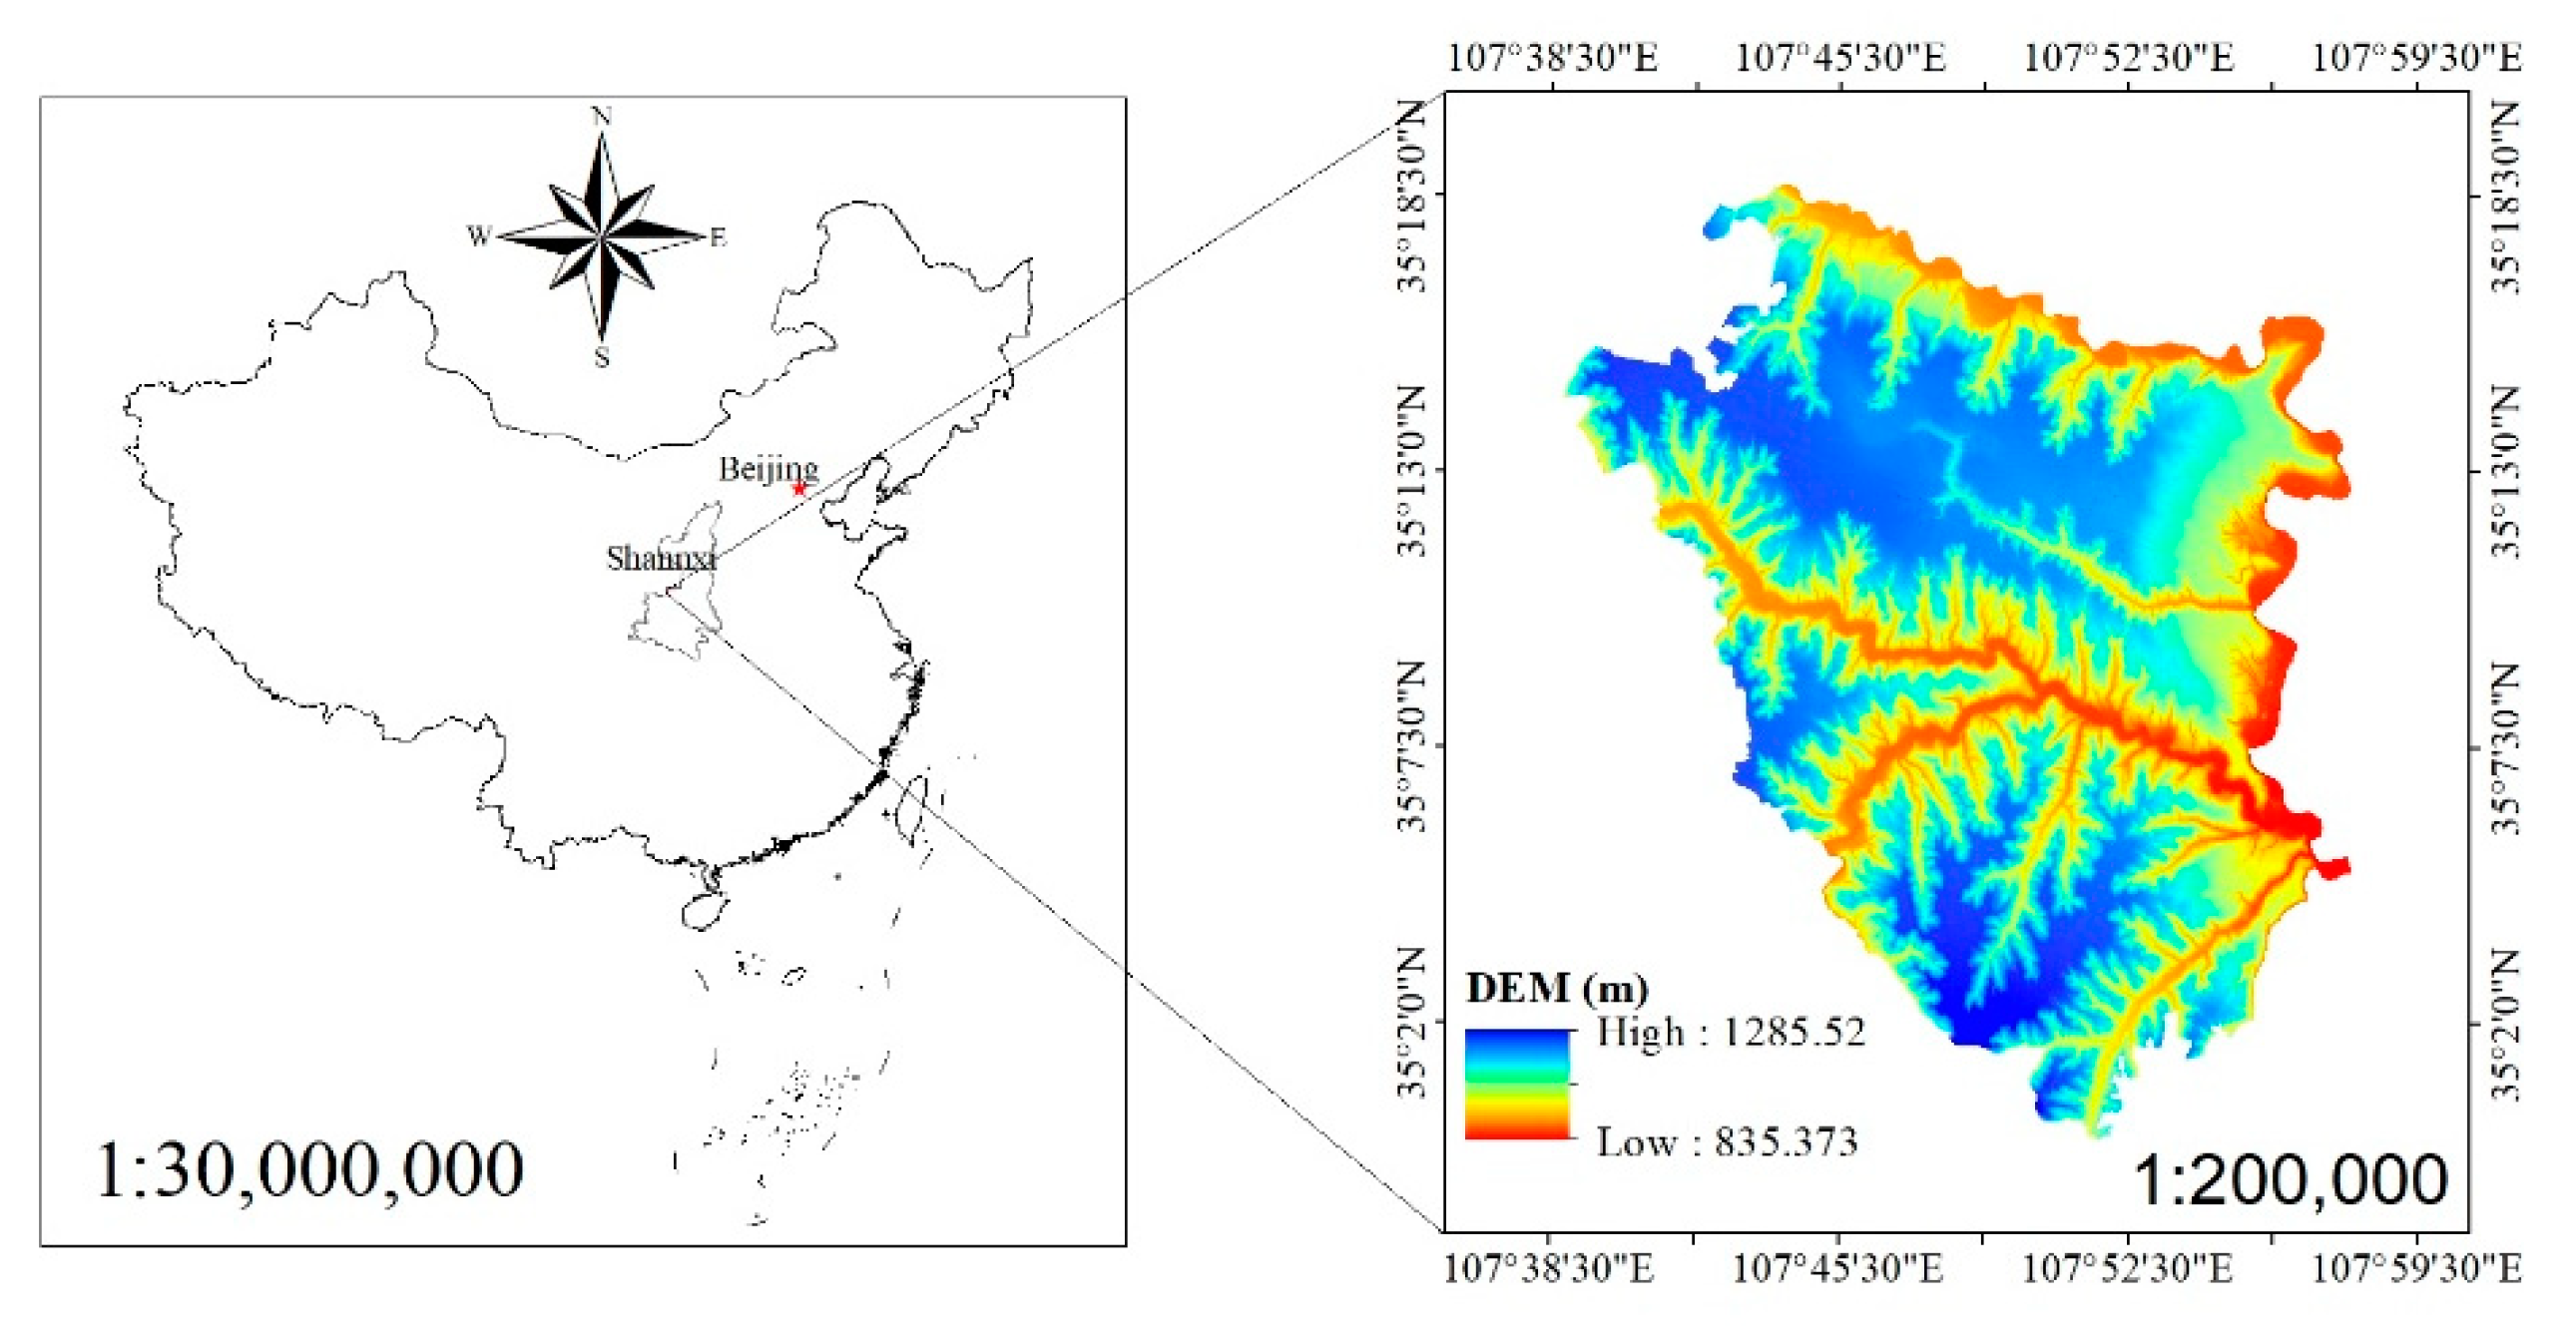
The study area is situated in Changwu County, Shaanxi Province in the south of the Loess Plateau of China, which extends from a latitude of approximately 34°59′ N–35°18′ N and a longitude of 107°38′ E–107°58′ E, occupying an area of 567.1 km2 (Figure 1) [23,27]. The study area belongs to the loess gully region of the Loess Plateau. The “Yuan” (a highland formed by erosion in the Loess Plateau, steep on four sides, flat on top) and “Chuan” (a low-lying, open, and flat area formed by erosion between the Yuan and Yuan) alternately had a gully development, forming crisscross gullies. The landforms were mainly “Yuan” and slope land, followed by “Chuan”. The landform features were characterized by high “Yuan”, deep gully, and steep slope. This area was drained by three main river systems, namely, the Jinghe River, Heihe River and Nanhe River, which are tributaries of the Yellow River. The dominant soil type was dark loessial soil, which is at “Yuan”, and loessial soil, which is at the valley slope and gully channel. The altitude ranged from 847 m to 1274 m above sea level [23,28].
Changwu County belongs to a warm, temperate, semi-humid continental monsoon climate zone, with an average annual temperature of 9.1 °C. Furthermore, the frost-free period is 171 days, and the annual precipitation is 587.8 mm. The annual rainfall concentration period is 7, 8 and 9 months, and rainfall can reach up to 321.4 mm, accounting for 54.9% of the total annual precipitation. The study area was mainly planted forest, and afforestation began in the 1950s. The main tree species are Robinia pseudoacacia, Platycladus orientalis, Pinus tabuliformis, Armeniaca sibirica, and Populus spp. Among these, R. pseudoacacia accounts for more than 90% of the forested area [22,23,27].
The research area has few land resources and has experienced agricultural reclamation for a long time. Agriculture occupies a major position in the county’s national economy. The cropland and orchard are mainly concentrated on the plateau and gully bottom, and the main plants were wheat, apple, and persimmon.
2.2. Data Sources
The land use/cover maps of Changwu County on 28 August 1987, 23 August 1997, 20 September 2007, and 27 June 2017 were derived from Landsat TM/ETM+/OLI imageries with 30 m resolution (derived from the USGS website, http://www.usgs.gov, accessed on 16 July 2019), considering the vegetation growing season and image quality. The digital elevation model (DEM) was sourced from the geospatial data cloud (http://www.gscloud.cn/, accessed on 16 July 2019) with a resolution of 30 m.
Then, each image was radiometrically, atmospherically processed using the ENVI 5.3 image processing software to eliminate the scattering and absorption effects from the atmosphere and to obtain authentic the surface reflectance character. Finally, the images were geometrically corrected and registered to the Xian_1980 datum and Xian_1980_3_Degree_GK_CM_108E projections using the ArcGIS 10.5 image processing software to correct image distortion.
The object-based classification segmented the image into objects and identified both the spectral and spatial features between the objects for classification. Object-based classification reduces the within-class spectral variation, and generally eliminates salt-and-pepper effects to potentially improve the classification accuracy. This approach identifies the image objects using a multi-resolution segmentation approach, as implemented in the software package eCognition [29,30,31]. In the present study, the combination of the threshold and decision-tree approach classifications based on object-oriented classification methods were used by the eCognition Developer 9.0 remote sensing information extraction software.
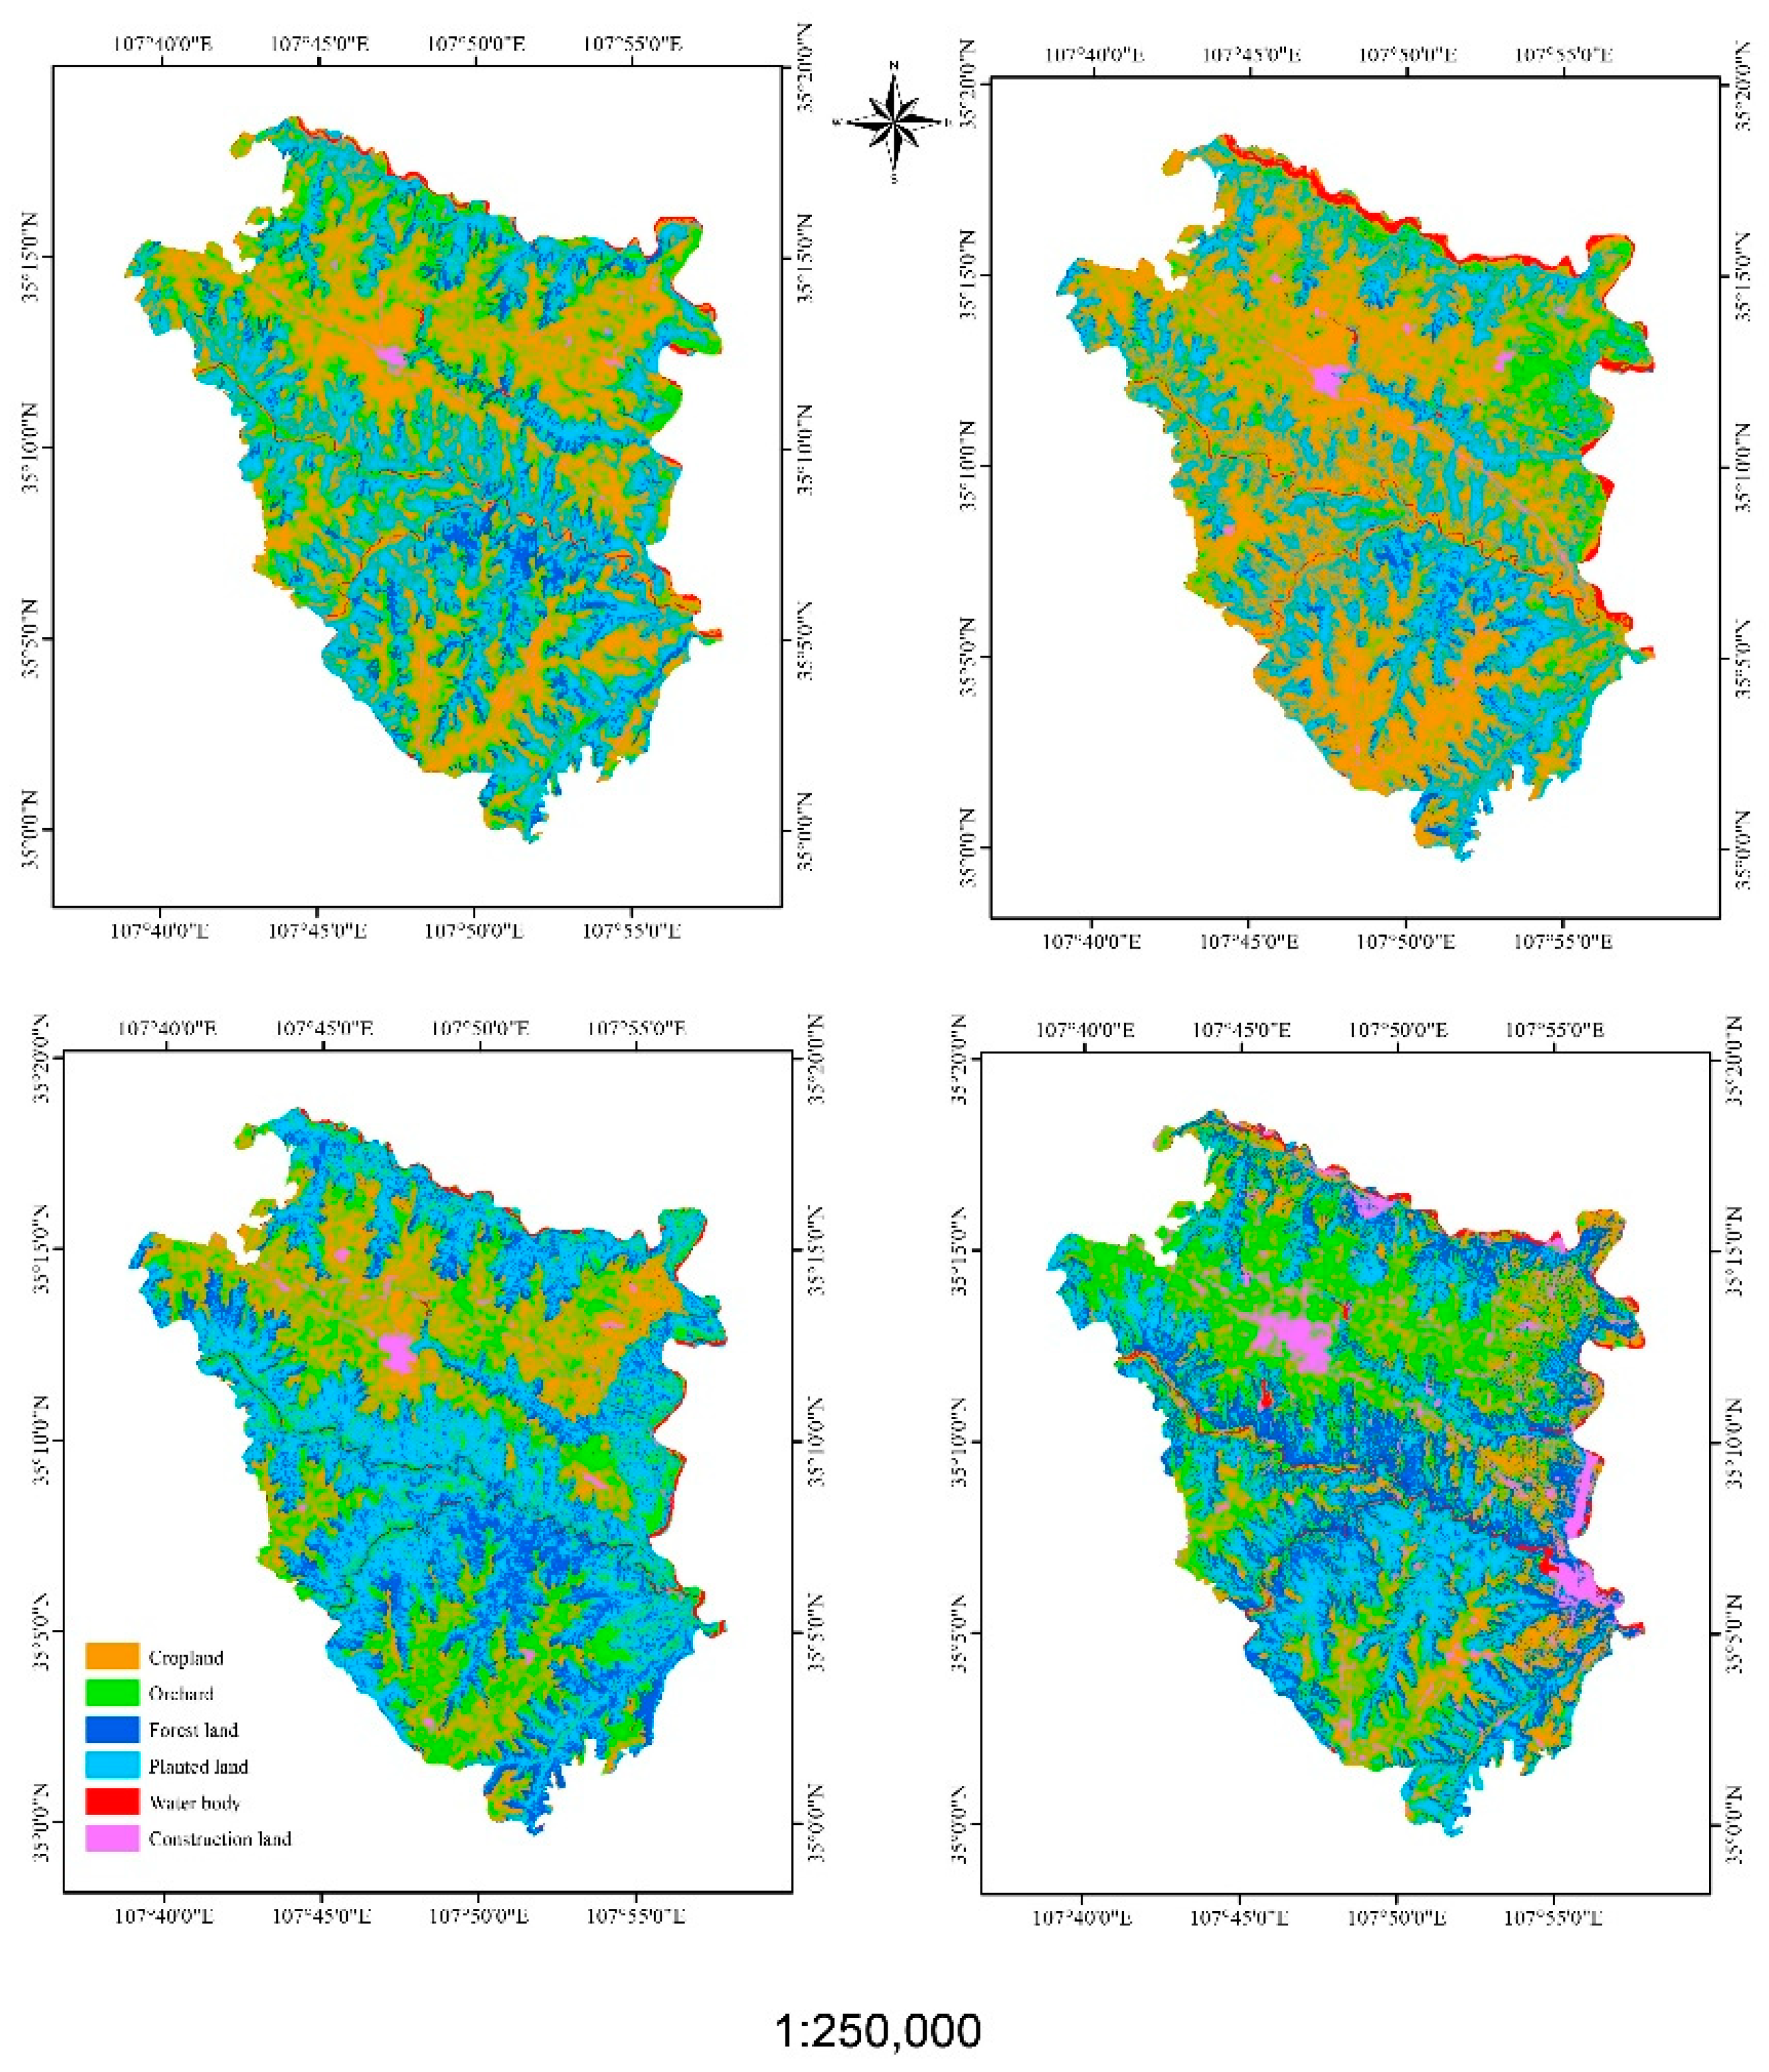
We interpreted six land use/cover classes from the images (Table 1), which were orchard, cropland, forest land, planted land, water body and construction land. A total of 388 points (some inaccessible control points with high resolution images in Google earth) were randomly selected to determine the classification accuracy by computing the overall accuracy and Kappa coefficient. Overall accuracy is the sum of correctly classified values from the diagonal values divided by the total number of randomly generated reference values of the error matrix [32]. The Kappa coefficient, which reflects the consistency between classification results and reference data, was also calculated, as follows [1]:
where: Kc is the Kappa coefficient; N is the total number of verification points; r is the number of type; xi+ is the sum of the data in row i of the confusion matrix; x+i is the sum of the data in column i of the confusion matrix; xii is the value of row i and column i in confusion matrix.
2.3. LULCC Analysis
After completing the classification and accuracy verification, we used the intersect tool in ArcGIS 10.6 to calculate the transfer matrix of the image classification results of different periods, and counted the area transferred by type.
The transfer matrix can intuitively reflect the transfer trend between different land use/cover types within a certain period, and the model can be expressed, as follows:
where: Sij is the area of the land use/cover type i at time t converted to the land use/cover type j at time (t + 1); n is the total number of land use types.
where: PR is the land use/cover type transfer rate.
In order to reveal the changes in land use/cover area in different periods, the land use/cover annual area change rate (LR) was calculated, as follows [33]:
where: LR is the land use/cover annual area change rate; Lt is the area of the land use land cover class at time t; Lt+n is the area of the same land use land cover class at time t + n; n is the time difference between t and t + n.
In order to visualize the temporal and spatial changes in land use/cover, we finally used the Sankey diagrams to illustrate the transfer situation of land use/cover classes at different times. Sankey diagrams are a type of flow diagram, in which the width of the arrows is proportional to the flow rate. These diagrams have mostly been applied to analyze energy- or material-flows [34]. The Sankey diagram has had few applications in land use/cover change [35,36]. In the Sankey diagrams, the width of the lines represents the transfer areas of land use/cover class. The stacked bars visualize the land use/cover class in 1987, 1997, 2007, and 2017, and the height of each component in the stacked bars is proportional to the amount of area occupied by land use/cover class in the study area. We used the R software package called networkD3 to map the Sankey diagrams [37].
2.4. Soil Erosion Estimation
In the present study, we used the revised universal soil loss equation (RUSLE) model to estimate the mean annual soil erosion in the study area at different times. The RUSLE model has been widely used to estimate soil erosion by considering the climate, topography, soil, and land use factor.
The RUSLE model equation was defined by Renard [38] as follows:
where: A is the average annual soil erosion rate (t km−2 year−1); R is the rainfall erosivity factor (MJ mm hm−2 h−1 year−1); K is the soil erodibility factor (thm2 h hm−2 MJ−1 mm−1); LS is the topographic factor; C is the crop management factor; P is the conservation supporting practice factor.
2.4.1. R, Rainfall Erosivity Factor
Rainfall data was collected from the Loess plateau science data center, National Earth System Science Data Sharing Infrastructure, National Science and Technology Infrastructure of China (http://loess.geodata.cn, accessed on 6 July 2020). The monthly average rainfall data during the period of 1987–2017 was used to calculate the R factor. The study area has no record of rainfall intensity. As a result, the monthly rainfall data was used to calculate the R factor using the following equation developed by Wischmeier and Smith [39].
where: Pi is the monthly amount of rainfall and P is the annual rainfall.
2.4.2. K, Soil Erodibility Factor
The K factor was measured under a standard plot, since this represents the susceptibility of soil to erosion, the amount and rate of runoff, and transportability of the sediment. The K factor was obtained from Loess Plateau Data Center, National Earth System Science Data Sharing Infrastructure, National Science and Technology Infrastructure of China (http://loess.geodata.cn, accessed on 6 August 2020).
2.4.3. LS, Slope Length and Steepness Factor
The LS factor reflects the impact of topographic features on soil erosion. We used the formula for the graded slope factor proposed by Foster and Wishcmeier [39], and the formula for the slope length factor proposed by Desmet and Govers [40].
where: S is the slope factor and θ is the slope (°).
where: Li is the slope length factor of the i raster; Ain is the confluence area of the grid entrance, m2; Aout is the confluence area of the grid outlet; Δx is the grid resolution, m; L is the non-cumulative slope length related to the flow direction of the grid inlet and outlet; m is the slope length index, according to the research results of Liu et al. [41]. These take the values as follows:
2.4.4. C, Crop Management Factor
The C factor reflects the effect of vegetation types and cover on soil erosion. Vegetation has the function of intercepting rainfall, slowing down surface runoff, maintaining soil and water, and inhibiting soil erosion [39]. Different vegetation types and cover show different effects in inhibiting soil erosion. The C factor values were assigned by combining the land use/land cover classification map of the study area and the results of previous studies on the C factor in the Loess Plateau and a drawn C factor map [42,43].
2.4.5. P, Conservation Supporting Practice Factor
The P factor expresses the impact of support practice in the reduction of soil erosion, which is defined as the ratio of soil erosion by a support practice to the corresponding loss with upslope and downslope tillage [39]. The P factor ranges from 0 to 1 (non-dimensional). The lower the value, the better the conservation practice. The P factor values were assigned by the results of previous studies on the P factor in the Loess Plateau and a drawn P factor map [42,43,44,45].
2.5. Soil Erosion Analysis
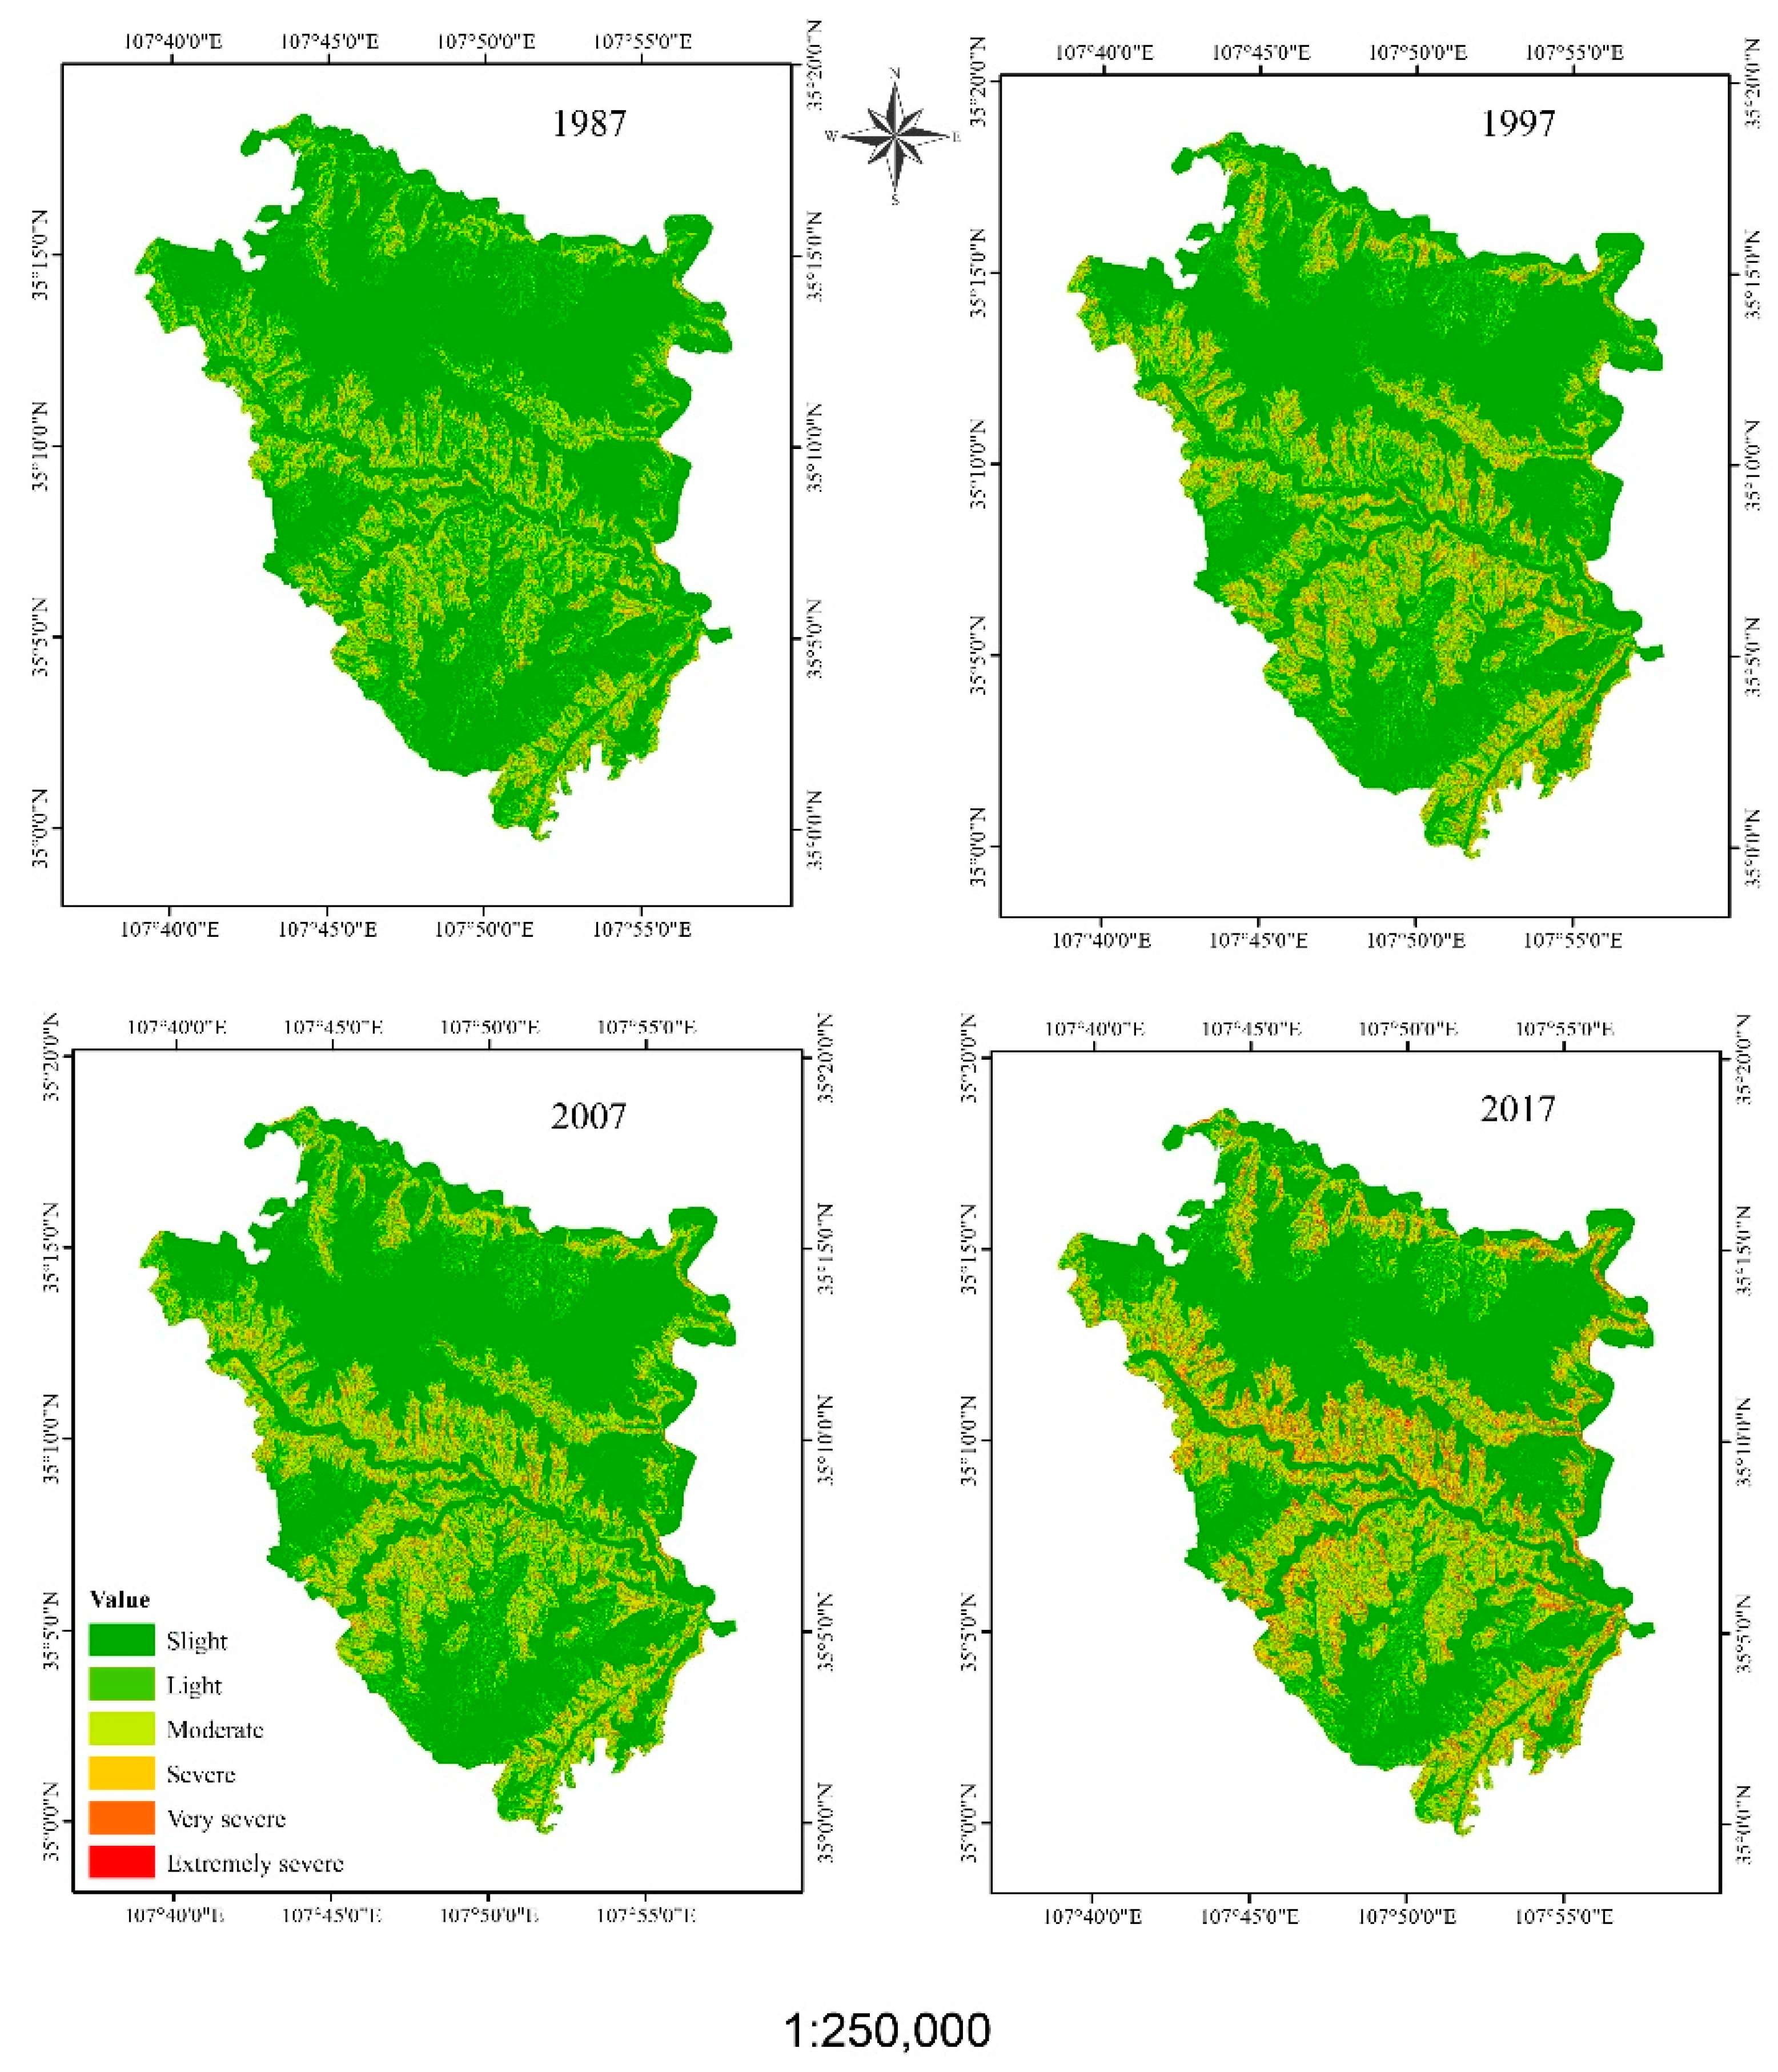
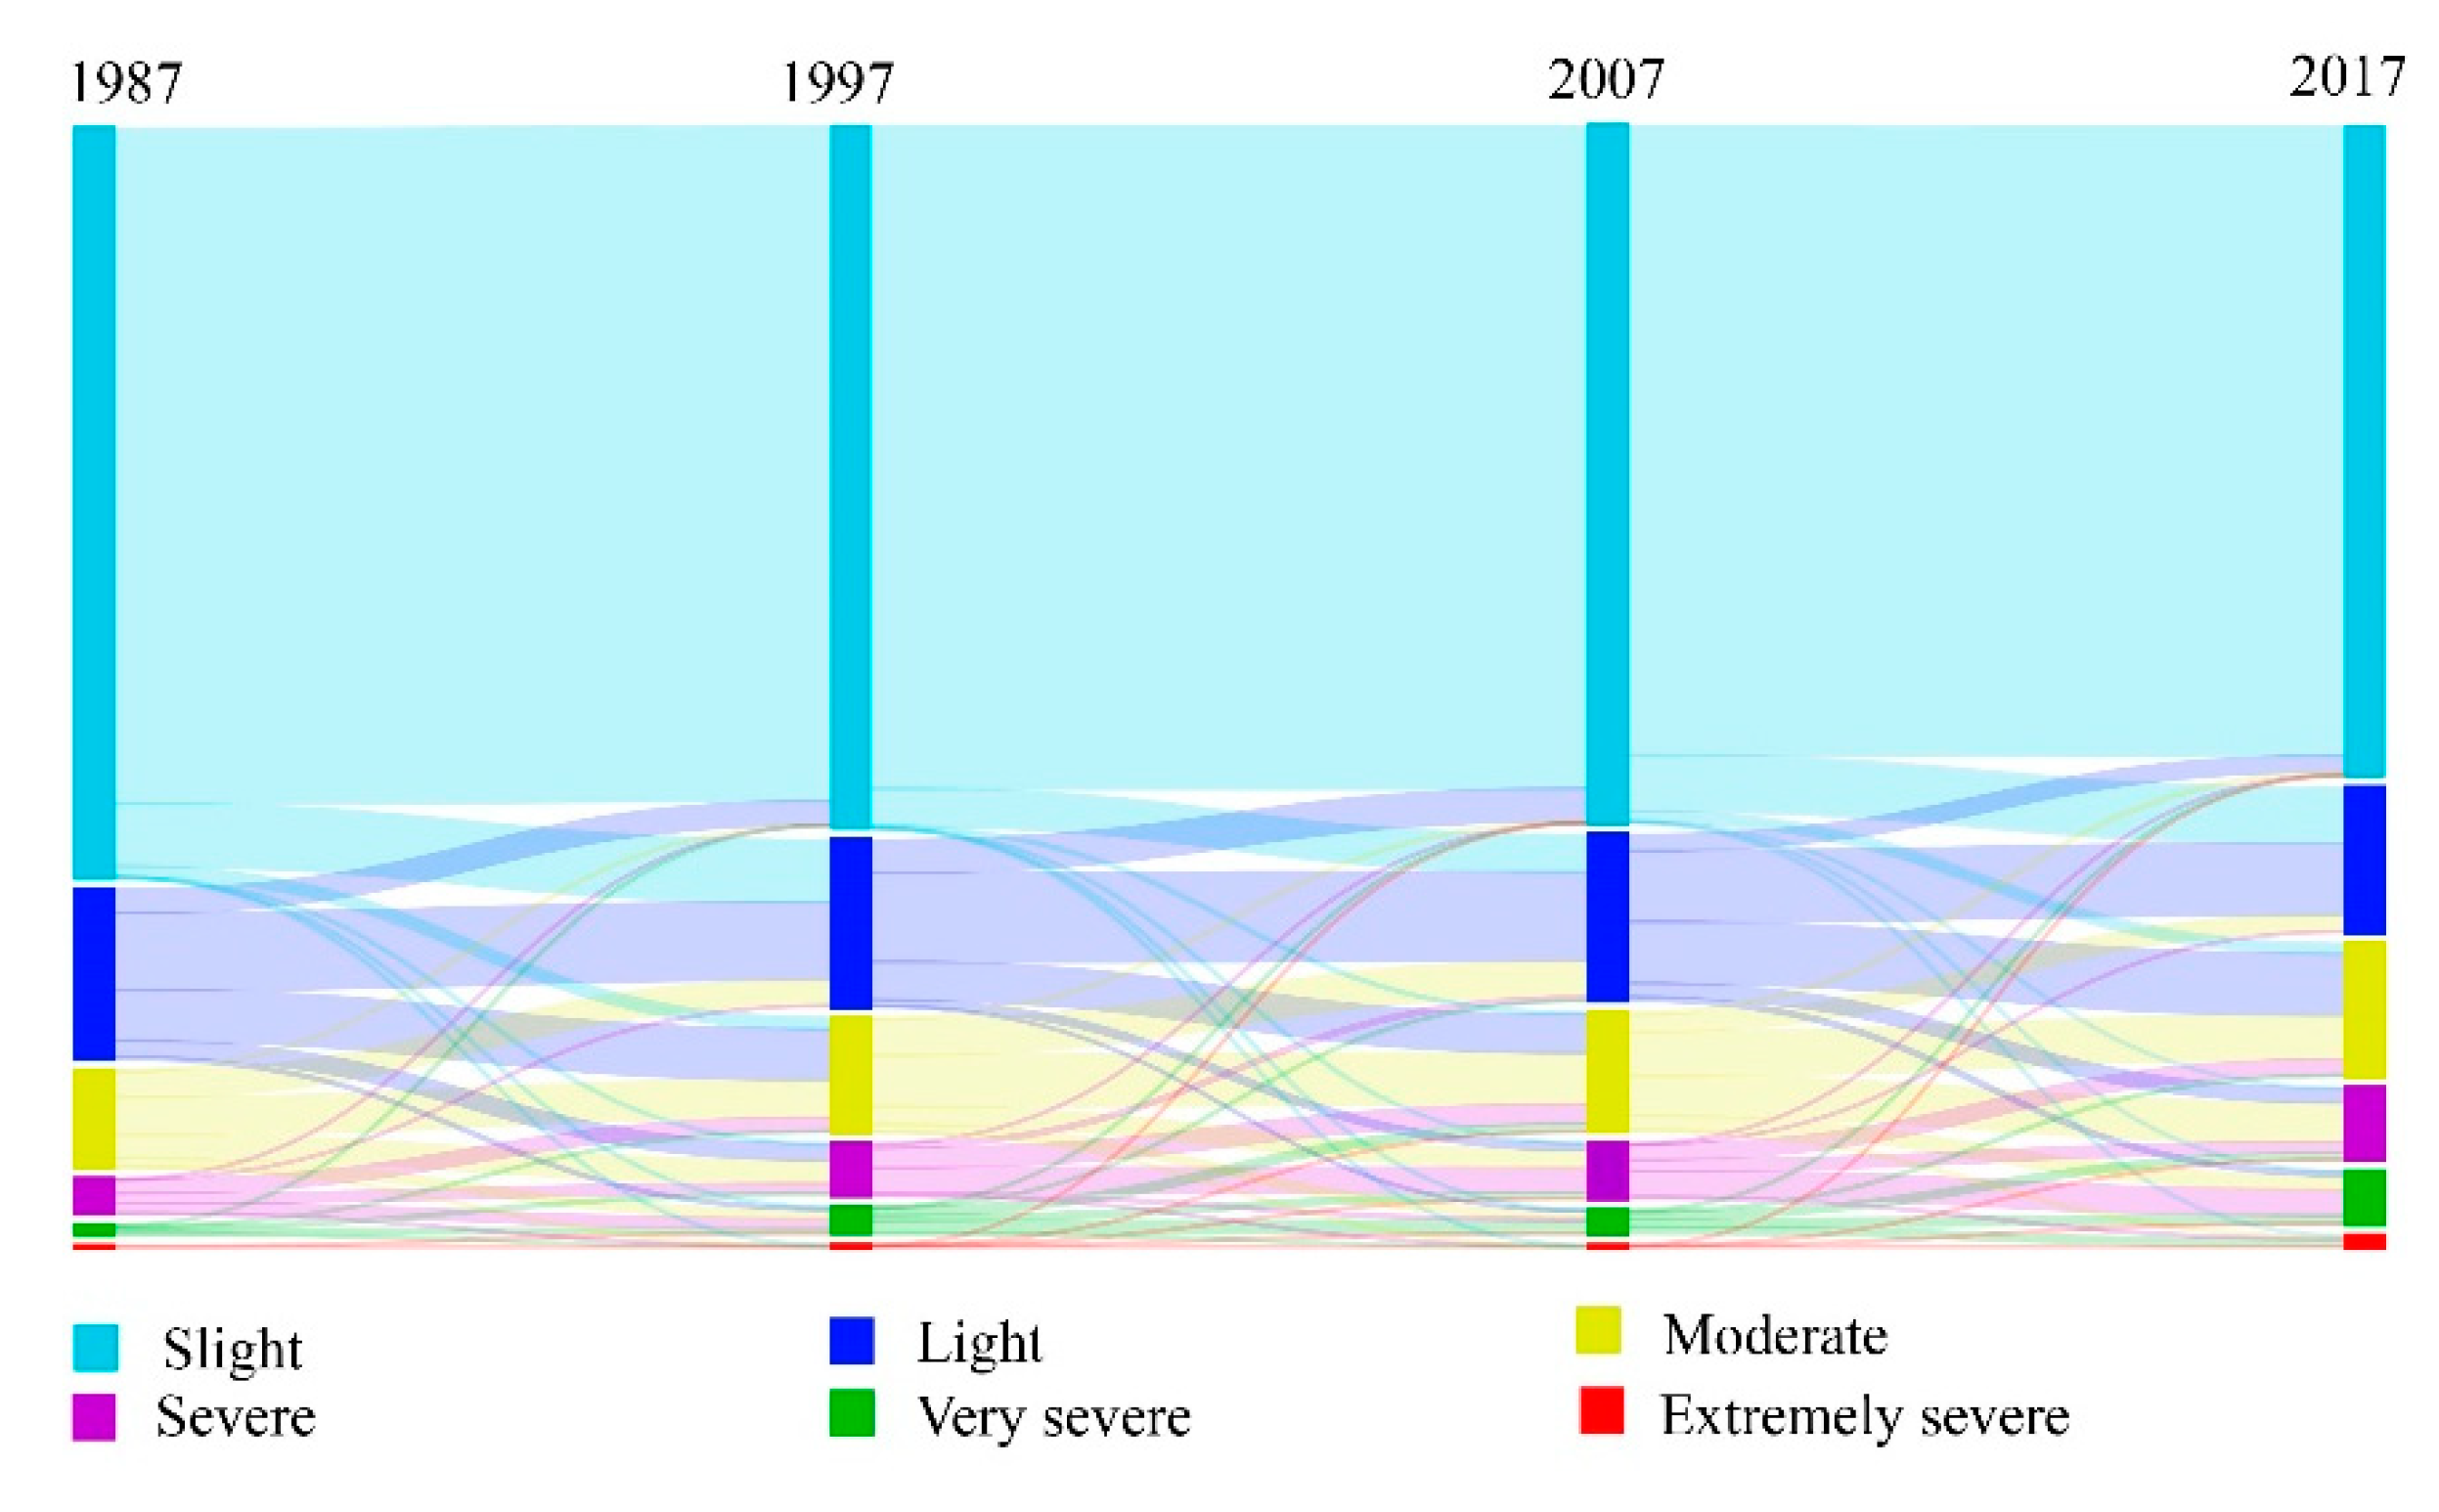
We classified the annual average soil erosion into six classes (slight, light, moderate, severe, very severe, and extremely severe) in the study area (Table 2), based on the standards for the classification and gradation of soil erosion SL190-2007 issued by the Ministry of Water Resources of China. In order to visualize the temporal and spatial changes in soil erosion, we referenced the Sankey diagrams to illustrate the transfer situation of soil erosion classes at different time and used the R software package called networkD3 to map this. Similarly, in the Sankey diagrams, the width of the lines represents the transfer areas of the soil erosion classes, and the height of each component in the stacked bars is proportional to the amount of area occupied by the soil erosion class in the study area.
2.6. Regression Models
2.6.1. Ordinary Least Squares (OLS)
OLS is mainly used for parameter estimation of linear regression, which obtains the minimum value of the sum of the squares of the difference between the actual value and the model estimate and uses the minimum value as the parameter estimation value [46]. In this study, we used OLS as the reference of the spatial regression models. The formula is as follows:
where Yi is the dependent variable; X1 to Xn are independent variables; α is the intercept; β1 to βn are estimated regression coefficients; ε is the error term.
2.6.2. Spatial Regression Model
Geographically Weighted Regression Model (GWR)
The geographically weighted regression model (GWR) is a local spatial technique that can be used to examine the spatial variabilities of regression parameters and model performance [46]. Compared with the general liner models, the GWR model carries out separate regressions at each location (observation), considering only other observations within a specific distance to that location. The formula is as follows:
where Yi is the dependent variable; X1 to Xn are independent variables; β0 (μi, νi) is the intercept; μi and νi represent the coordinates of the sample i in space; βk are estimated regression coefficients; ε is the error term.
where β (μi, νi) is the regression parameter vector in location (μi, νi); X is a sampling matrix of the independent variable; C is a sampling vector of the dependent variable; W (μi, νi) is a diagonal matrix, whose diagonal elements represent the geographical weightings of each observation around point i.
where win is the weight assigned to the observation at location i.
Spatial Lag Model (SLM)
The spatial lag model (SLM) can solve the influence of adjacent independent variables on another independent variable, which was afresh regarded as an explanatory variable to be used for regression [47]. The formula is as follows:
where t is an index for the time dimension (years in this study), with t = 1, 2, 3, …, T; i is individual in cross section, with i = 1, 2, 3, …, N; δ is the spatial autoregressive coefficient; Wij is the row standardized spatial weight matrix; Yit is the dependent variable at i and t; Xit represents the vector of the independent variables at i and t; β represents the coefficient vector; μi denotes a spatial-specific effect for i; εit is an error term for i and t.
Spatial Error Model (SEM)
The spatial error model assumes that the error terms have an impact on spatial dependence [48]. The formula is as follows:
where φit is the spatially autocorrelated error term; ρ is the spatial autocorrelation coefficient; denotes the interaction effects among the disturbance terms of the different units; λ refers to the spatial autocorrelation coefficient.
In this study, we used soil erosion change as the dependent variable and land use/cover area change as the independent variable to undertake regression analysis. The OLS model and the GWR model were run in ArcMap10.7 software. The SLM model and the SEM model were run in GeoDa 1.18 software (http://geodacenter.github.io/formats.html, accessed on 6 August 2020).
3. Results
3.1. LULCC Classification and Accuracy Evaluation
The LULCC classification maps of Changwu Country were generated for each of the following years: 1987, 1997, 2007, and 2017 (Figure 2). The overall classification accuracy in 1987, 1997, 2007, and 2017 was 89.1%, 90.2%, 92.4%, and 93.5%, respectively, and the respective Kappa coefficients were 0.81, 0.87, 0.90, and 0.92, respectively, which met the needs for the present study.
3.2. LULCC Analysis
The rate and trend of changes markedly varied between land use/cover in the intervals of the study period. We divided our data into the three research periods (1987–1996, 1997–2006, and 2007–2017), and the differences in LULCC were significant during each study period. Cropland expanded rapidly in the period of 1987–1997 at a rate of 3.48% per annum. However, from 1997 to 2007, the cropland area had a substantial shrinkage at a rate of 4.97% per annum. By 2007, this was only 146.11 km2, accounting for 50.31% of the cropland area in 1997. The cropland area successively decreased in the period of 2007–2017, but the rate of decline slowed down, and the area decreased by 25%. The orchard area decreased in the first period of 1987–1997, and successively increased in the other two periods (1997–2007 and 2007–2017). A comparison of 1987 and 1997 revealed a reduction in orchard area percentage from 20.95% to 12.73%. However, from 1997 to 2007, the orchard area rapidly increased at a rate of 6.66% per year, with an increase of 48.15 km2. From 2007 to 2017, the orchard area continued to increase at a rate of 3.34% per year, with an increase of 40.19 km2.
The construction land area successively increased from 1987 to 2017, although the changes varied in different periods in the whole area. The construction land area increased by 37.85% and 23.58% from 1987 to 1997 and from 1997 to 2007, respectively. However, the rate of construction land increase quickly changed with the rapid economic development and increased by 313.50% from 2007 to 2017. This covered 34.96 km2 in 2017, which was the largest in the last 30 years. The water body area drastically changed, with an increase of 79.53% from 1987 to 1997, a decrease of 37.67% from 1997 to 2007, and a slight increase of 8.51% from 2007 to 2017.
In the 1950s, the Changwu County Government began to carry out large-scale locusts by organizing people, mainly to obtain timber and firewood. In the 1990s, due to the need for economic development, a large number of forest trees were cut for the construction of houses and mine pillars. This led to the substantial shrinkage of forest land, reduced by 52.34% from 1987 to 1997. As the government’s awareness of forest land protection gradually increased, the government began to implement the Grain for Green Project in 1999, and the forest land was quickly restored. In 2007, forest land rapidly increased by 310.49%, when compared with 1997. In 2017, there was a continuous increase in forest land, with an increase of 37.55%, when compared with 2007.
However, the planted land and forest land change were inconsistent. The planted land decreased by 7.01% from 1987 to 1997, increased by 19.68% from 1997 to 2007, and decreased by 33.29% from 2007 to 2017.
The cropland, orchard, planted land and forested land were converted into large areas with other land types at each time period, and there was less conversion between construction land, water bodies, and other land types (Figure 3). From 1987 to 1997, the largest increase in area of cropland was mainly due to the conversion of planted land and orchards, which transformed 68.99 km2 and 64.93 km2, respectively. The forest land was mainly converted into planted land and cropland, which were converted to 26.92 km2 and 7.91 km2, respectively. The large-scale conversion of cropland and planted land occurred between 1997 and 2007. The conversions of cropland to planted land and forest land were 80.33 km2 and 19.72 km2, respectively. The area converted from cropland to orchard was 81.46 km2, which was the largest conversion between all land types in this period.
From 2007 to 2017, the area converted from planted land to forested land was the largest among all land types at 54.46 km2, followed by the conversion of cropland to orchards, which was 52.94 km2. The rapid expansion of construction land mainly came from the conversion of cropland, orchards and planted land to cope with the development process of urbanization.
3.3. Soil Erosion Estimation and Analysis
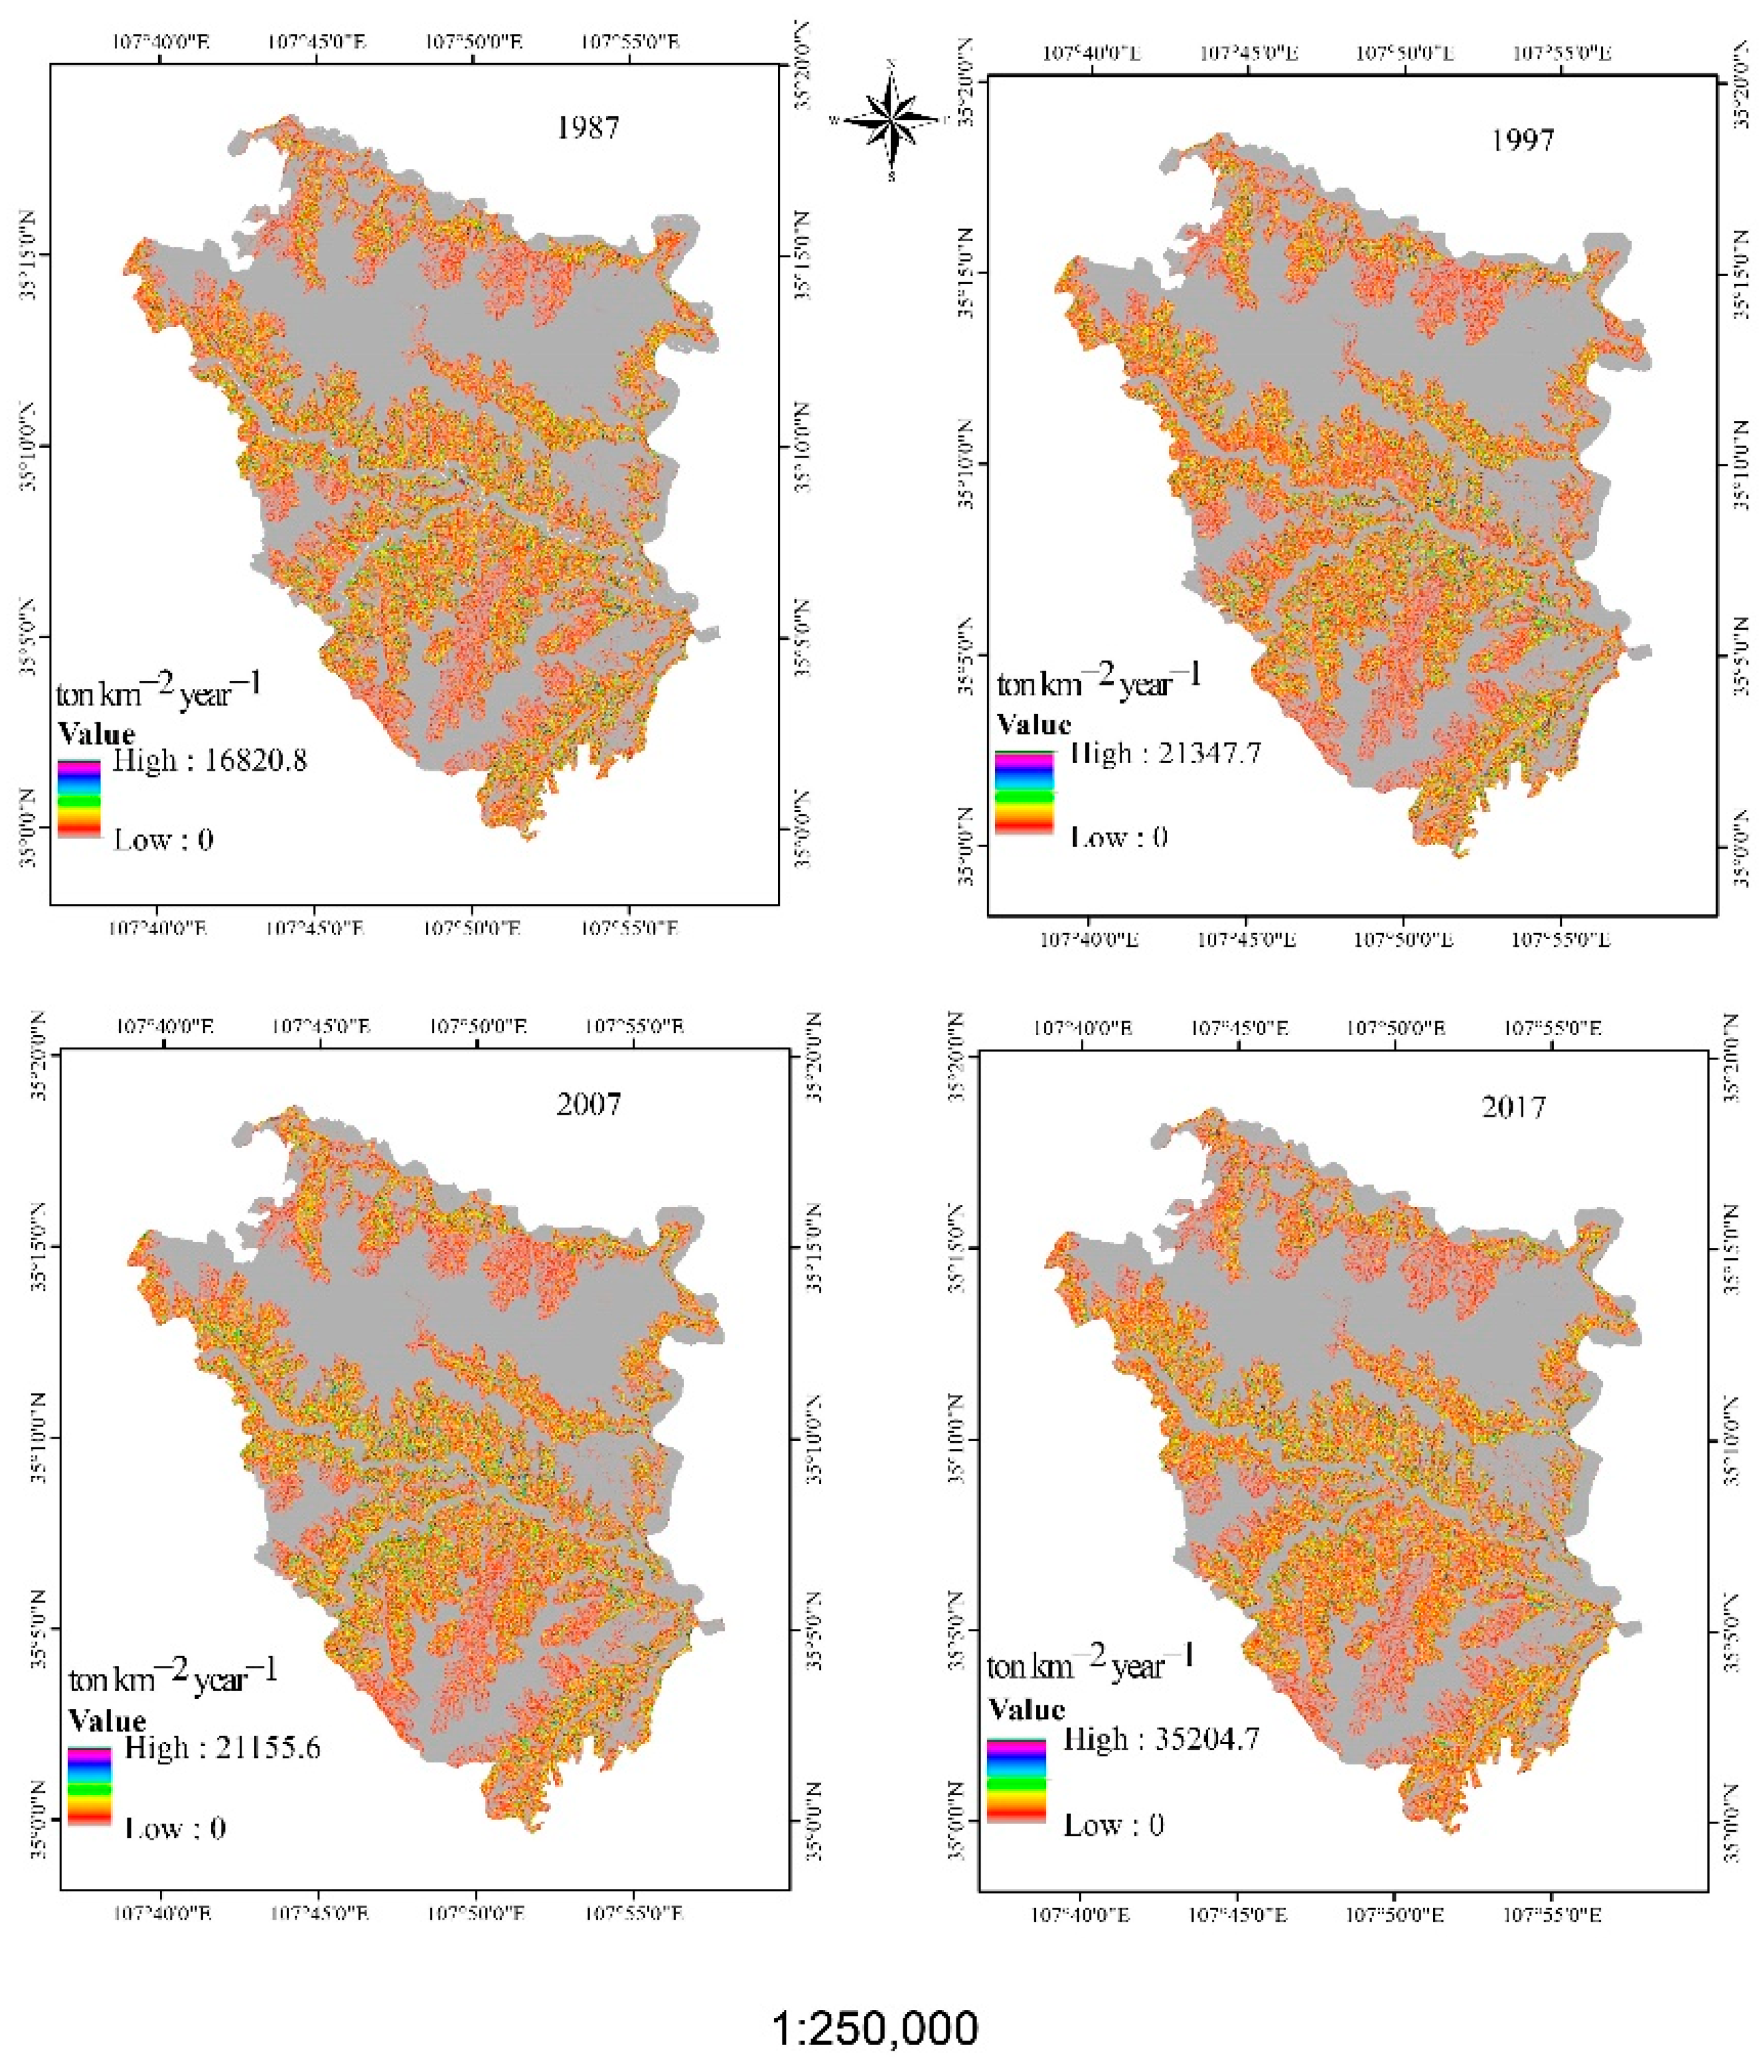
We used the RUSLE to estimate the soil erosion in Changwu County. Figure 4 shows the spatial distribution of soil erosion intensity in 1987, 1997, 2007, and 2017. The annual average soil erosion for Changwu Country was estimated at 977.84 ton km−2 year−1, 1305.17 ton km−2 year−1, 1310.60 ton km−2 year−1, and 1891.46 ton km−2 year−1 in 1987, 1997, 2007, and 2017, respectively. The rates of annual average soil erosion increase were significantly different between the periods of 1987–1997, 1997–2007, and 2007–2017, with increases at the rate of 3.35%, 0.04%, and 4.43% per year in these three time periods, although the annual average soil erosion continued to increase over time.
Figure 5 shows the spatial distribution of six classes of annual average soil erosion in 1987, 1997, 2007, and 2017. The areas of slight erosion and light erosion continued to decrease, but the areas of moderate erosion and severe erosion continued to increase during these three periods (1987–1997, 1997–2007, and 2007–2017) (Figure 5). The areas of very severe erosion and extremely severe erosion decreased during the period of 1997–2007 but increased during the period of 1987–1997 and 2007–2017. The area of slight erosion was the largest, accounting for 70.88%, 66.30%, 65.79%, and 61.31% of the study area in every year. As the soil erosion intensity increased, the corresponding area gradually decreased.
The transformation amount of soil-erosion class area varied at different time periods. The amount of transformation mainly occurred when slight erosion was converted to light erosion, light erosion was converted to moderate erosion, and moderate erosion was converted to light and severe erosion (Figure 6). The area converted from slight erosion to light erosion was the largest at 33.30 km2, followed by light erosion converted to moderate at 27.11 km2 and then moderate erosion converted to light erosion at 13.73 km2, during the period of 1987–1997. However, during the period of 1997–2007, the area converted from light to moderate erosion was the largest at 20.32 km2, indicating that soil erosion intensity was increasing, followed by slight erosion converted to light erosion at 19.78 km2 and moderate erosion converted to slight erosion at 18.91 km2. It noteworthy that not only the area converted from light to moderate erosion was the largest at 32.83 km2 during the period of 2007–2017, but moderate erosion converted to severe erosion at 21.21 km2 also first appeared as the third in the three time periods (1987–1997, 1997–2007 and 2007–2017). This result further revealed that the soil erosion intensity was increasing. The transformation amount of slight erosion, light erosion to severe erosion, very severe erosion, and extremely severe erosion was very small, indicating that slight erosion and light erosion were relatively stable without drastic changes.
3.4. LULCC Effect on Soil Erosion Change and Model Comparison
The OLS and Spatial regression models (GWR, SLM and SEM) were applied to fit the relationship between LULCC and soil erosion change and their accuracies R2 were shown in Table 3. The results showed that the SEM and SLM have higher accuracy than the GWR and OLS in fitting the effect of LULCC and soil erosion change in different periods. In 1987–1997, SEM has the highest accuracy (R2 = 0.659), followed by SLM (R2 = 0.653), GMR has lower accuracy (R2 = 0.203), and OLS has the lowest accuracy (R2 = 0.025). However, SLM has the highest accuracy (R2 = 0.644) in 1997–2007, followed by SEM (R2 = 0.639), GMR has lower accuracy (R2 = 0.211), and OLS has the lowest accuracy (R2 = 0.047). In 2007–2017, SEM and SLM have higher accuracies (R2) at 0.639 and 0.627, respectively, and GMR and OLS have lower accuracies (R2) at 0.300 and 0.004, respectively. In summary, the SEM and SLM have better explanations for the effect of LULCC on soil erosion change.
4. Discussion
LULCC reflects the results of human–environment interactions [49,50]. The Loess Plateau has been disturbed by human activities for a long time, and human activities are the main factors that affect LULCC in the Loess Plateau [51,52]. Changwu County is an area dominated by agricultural production. Population expansion has led to long-term pressure on resources. The results indicate that the cropland area expanded significantly between 1987 and 1997 (Section 3.2). This was due to the population growth, backward economic development during this period, and per capita income of farmers which depended on the expansion of cropland to improve. Hence, large areas of planted land were converted into cropland. The orchard mainly comprised of persimmon orchard and apple orchard during this period. However, a large area of persimmon and apple trees fell and these areas were turned into cropland, due to economic benefits. However, the agricultural structure has changed as the orchard area continues to increase, while cropland has continued to decrease from 1997 to 2017, which plays an important role in alleviating pressure on resources. This change was correlated with the national policy on ecological environment protection, but the huge benefits brought by orchards were the direct driving force for the conversion of cropland into orchards. Wang [53] investigated the rural transformation from the perspective of regime shifts of socio-ecological systems in Changwu County and reported that the apple’s income (41,370 yuan/ha) was 138 times of that of grain in 2007. This result supports the present research results very well.
The results of the spatial and temporal changes in forest land in the study area reflect the changes in people’s attitudes towards the environment. Protecting the environment has attracted the government’s attention. The area of forested land has continuously increased since the implementation of Grain for Green Project in 1999. The implementation of the Grain for Green Project resulted in large areas of cropland being used for afforestation. Hence, cropland was mainly transformed into planted land and forested land between 1997 and 2007. During this period, the government’s awareness of forest land protection gradually increased, and the forest was quickly restored as the forest tree cover quickly grew. Some unclosed forests grew into forests. Therefore, forest land mainly comes from the conversion of planted land and cropland. In 2017, the forested area reached 123.93 km2, accounting for 21.8% of the research area. This result indicates that the forest land was continuously recovered with the government’s emphasis on the ecological environment, and that the agricultural structure is continuously changing. The conversion of cropland to planted land was 18.78 km2 between 2007 and 2017, which indicates that the conversion of cropland to forests is continuous.
The complex structure of forests could intercept rainfall and reduce soil erosion, thereby improving soil protection [54,55]. Hence, the increase in forest area not only benefits water and soil conservation, regulates the climate, and purifies the environment, but also brings business opportunities to the local tourism industry. Forest-based well-being tourism is becoming more and more popular due to the comfortable environment provided by the forest, which derived the development of the tertiary industry from 67.50 million yuan in 1997 to 1843 million yuan during the period. Furthermore, R. pseudoacacia forests are an important source of honey plants, and a large area of R. pseudoacacia forests have attracted bee farmers. The ecological service function provided by forests for humans guarantees the continuous increase in forest land. The continuous expansion of construction land area reflects the improvement of people’s quality of life. That is, from a GDP of 544.3 million yuan in 1987 to a GDP of 9.596 billion yuan in 2017. Especially from 2007 to 2017, Changwu Country witnessed rapid economic development and urbanization, which all determined the expansion of construction land. Xiao et al. [56] investigated the urbanization and land use change in Shijiazhuang in China, and reported that construction land, as a ‘fast-expansion stage’, was at the period of fast economic development. This coincides with the present research results.
Changwu County is an area with severe soil erosion on the Loess Plateau. The average annual soil erosion was 6500 ton/km2 from 1949 to 1979 in Changwu County, according to the statistical data of soil and water conservation in Shaanxi province (derived from http://loess.geodata.cn, accessed on 6 August 2020).
However, it was found that the erosion in the study area was mainly slight and light erosion in Changwu County in the past 30 years. Severe erosion, very severe erosion, and extremely severe erosion account for only a small amount. It can be observed from the spatial and temporal variation of soil erosion that the transformation mainly occurred in low-level soil erosion. Furthermore, the amount of high-level soil erosion transformation was less. This shows that the earlier soil and water conservation projects played an important role in the water and soil management in the study area.
In 2020, Wen [21] studied the cost effectiveness of soil erosion control practices in the Chinese Loess Plateau and found that engineering erosion control techniques implemented in the Loess Plateau are effective in controlling soil erosion, which is consistent with the present research results.
As early as the 1950s, the state recognized the importance of protecting soil and water loss but did not put forward scientific treatment methods. The treatment of soil erosion was still in the exploratory stage, and farmers were called upon to build protection projects. It was not until 1981 that a scientific treatment method was developed to comprehensively treat mountains, rivers, cropland, forest, and roads, according to the scope of the drainage basin, and effectively control the local soil and water loss.
When we analyzed the temporal and spatial changes of soil erosion, it was found that the soil erosion changes in the study area had a kind of “inertia”. This “inertia” means that each erosion level prefers to convert to a neighboring level, rather than a large number of cross-level transformations. Furthermore, this “inertia” allows for the optimistic estimation that the erosion in the study area is at a relatively safe stage, and that this would not rapidly deteriorate.
However, what we must pay attention to is that the annual average soil erosion, moderate erosion, and severe erosion in the study area all increased with time. Furthermore, the very severe erosion and extreme erosion area was the largest in 2017, when compared with the other time points (1987, 1997, and 2007). Hence, there is a need to further strengthen the soil and water conservation work in Changwu County.
From the results of the LULCC, it can be observed that from 1987 to 1997, the forest land decreased, and the people’s logging, illegal logging and cropland expansion caused great damage to the local vegetation. This is also the direct cause of the increase in soil erosion intensity from 1987 to 1997. The vegetation began to recover after the state implemented the Grain for Green Project in 1999. Vegetation restoration can intercept rainfall, reduce surface runoff, and alleviate soil erosion [57,58,59]. The influence of vegetation on soil erosion can be reflected by the value of the C factor. The C factor value increased from 1987 to 1997, but the C factor value continued to decrease from 1997 to 2017, indicating that the increase of vegetation area may reduce soil erosion. However, the R factor value was determined by rainfall. From 2007 to 2017, the rapid increase in the R factor value was due to the increase in rainfall, which resulted in increased soil erosion intensity. This was the direct basis for the different effects of LULCC and rainfall on soil erosion in different periods.
This study used spatial regression model comparison for the first time to determine the impact of LULCC on soil erosion change and has significance for future studies. The results show that the relationship between soil erosion and LULCC obtained by SLM and SEM is more reliable than that derived by GWR and OLS. As spatial panel data models, SLM and SEM may consider the spatial and temporal impact on dependent variables to obtain accurate estimates. Fang [60] found that panel data models may be applied to the impact of land use changes on catchment soil erosion and sediment yield in northeastern China. This result supports our research, and our research further expands the application of panel data in LULCC and soil erosion change. This study used the selection of spatial regression models to obtain the effect of LULCC on soil erosion change, which can provide a reference for the relationship between LULCC and soil erosion change in other regions.
5. Conclusions
The LULCC in Changwu County has been significant over the last 30 years. The implementation of the Grain for Green Project, the change in agricultural structure, and good income from orchards, have controlled the expansion of cropland which was conducive to the harmony between humans and nature. The decrease to increase in forest land was the direct result of the implementation of the Grain for Green Project, reflecting the importance of people’s attachment to environmental issues. Construction land has continued to increase in the past 30 years, which is closely correlated with the local economic development and urbanization process. The soil erosion in Changwu County in the past 30 years has been dominated by slight erosion and light erosion, and other erosion levels have been less prevalent. The early soil and water conservation projects played an important role. The changes in soil erosion in the study area had both positive (the soil erosion changes showed a kind of “inertia”) and negative (the intensification trend of soil erosion intensity) aspects. The SEM and SLM have higher accuracy in explaining the effect of LULCC and soil erosion change in different periods. The explanatory power of LULCC on soil erosion exceeded 0.62 in different periods.
Author Contributions
Conceptualization, Z.Z. and S.Y.; methodology, S.Y.; software, S.Y.; validation, Z.Z. and S.Y.; formal analysis, S.Y.; investigation, S.Y. and B.Y.; resources, F.W. and M.Q.; data curation, S.Y.; writing—original draft preparation, S.Y.; writing—review and editing, S.Y.; visualization, S.Y.; supervision, Z.Z.; project administration, Z.Z.; funding acquisition, Z.Z. All authors have read and agreed to the published version of the manuscript.
Funding
This research was funded by National Key Research and Development Program of China, grant number 2016YFC0501706-1.
Data Availability Statement
The study did not report any data.
Conflicts of Interest
The authors declare no conflict of interest.
References
- Minta, M.; Kibret, K.; Thorne, P.; Nigussie, T.; Nigatu, L. Land use and land cover dynamics in Dendi-Jeldu hilly-mountainous areas in the central Ethiopian highlands. Geoderma 2018, 314, 27–36. [Google Scholar] [CrossRef]
- Borrelli, P.; Robinson, D.A.; Fleischer, L.R.; Lugato, E.; Ballabio, C.; Alewell, C.; Meusburger, K.; Modugno, S.; Schutt, B.; Ferro, V.; et al. An assessment of the global impact of 21st century land use change on soil erosion. Nat. Commun. 2017, 8, 2013. [Google Scholar] [CrossRef] [PubMed] [Green Version]
- Qi, J.C.; Liu, H.P.; Liu, X.P.; Zhang, Y.H. Spatiotemporal evolution analysis of time-series land use change using self-organizing map to examine the zoning and scale effects. Comput. Environ. Urban Syst. 2019, 76, 11–23. [Google Scholar] [CrossRef]
- Lambin, E.F.; Geist, H.J. Land-Use and Land-Cover Change: Local Processes and Global Impacts; Springer Science & Business Media: Berlin, Germany, 2008. [Google Scholar]
- Handavu, F.; Chirwa, P.W.C.; Syampungani, S. Socio-economic factors influencing land-use and land-cover changes in the miombo woodlands of the Copperbelt province in Zambia. For. Policy Econ. 2019, 100, 75–94. [Google Scholar] [CrossRef] [Green Version]
- Phiri, D.; Morgenroth, J.; Xu, C. Long-term land cover change in Zambia: An assessment of driving factors. Sci. Total Environ. 2019, 697, 134206. [Google Scholar] [CrossRef]
- Schielein, J.; Borner, J. Recent transformations of land-use and land-cover dynamics across different deforestation frontiers in the Brazilian Amazon. Land Use Policy 2018, 76, 81–94. [Google Scholar] [CrossRef]
- Guerrero, J.V.R.; Escobar-Silva, E.V.; Chaves, M.E.D.; Mataveli, G.A.V.; Bourscheidt, V.; de Oliveira, G.; Picoli, M.C.A.; Shimabukuro, Y.E.; Moschini, L.E. Assessing Land Use and Land Cover Changes in the Direct Influence Zone of the Braco Norte Hydropower Complex, Brazilian Amazonia. Forests 2020, 11, 988. [Google Scholar] [CrossRef]
- de Mello, K.; Valente, R.A.; Randhir, T.O.; dos Santos, A.C.A.; Vettorazzi, C.A. Effects of land use and land cover on water quality of low-order streams in Southeastern Brazil: Watershed versus riparian zone. Catena 2018, 167, 130–138. [Google Scholar] [CrossRef]
- Zhang, J.; Qu, M.; Wang, C.; Zhao, J.; Cao, Y. Quantifying landscape pattern and ecosystem service value changes: A case study at the county level in the Chinese Loess Plateau. Glob. Ecol. Conserv. 2020, 23, e01110. [Google Scholar] [CrossRef]
- Verstegen, J.A.; van der Laan, C.; Dekker, S.C.; Faaij, A.P.C.; Santos, M.J. Recent and projected impacts of land use and land cover changes on carbon stocks and biodiversity in East Kalimantan, Indonesia. Ecol. Indic. 2019, 103, 563–575. [Google Scholar] [CrossRef]
- Verburg, P.H.; Alexander, P.; Evans, T.; Magliocca, N.R.; Malek, Z.; Rounsevell, M.D.A.; van Vliet, J. Beyond land cover change: Towards a new generation of land use models. Curr. Opin. Environ. Sust. 2019, 38, 77–85. [Google Scholar] [CrossRef]
- Wang, Q.R.; Liu, R.M.; Men, C.; Guo, L.J. Application of genetic algorithm to land use optimization for non-point source pollution control based on CLUE-S and SWAT. J. Hydrol. 2018, 560, 86–96. [Google Scholar] [CrossRef]
- Rickson, R.J. Can control of soil erosion mitigate water pollution by sediments? Sci. Total Environ. 2014, 468, 1187–1197. [Google Scholar] [CrossRef] [PubMed]
- Wang, X.; Zhao, X.L.; Zhang, Z.X.; Yi, L.; Zuo, L.J.; Wen, Q.K.; Liu, F.; Xu, J.Y.; Hu, S.G.; Liu, B. Assessment of soil erosion change and its relationships with land use/cover change in China from the end of the 1980s to 2010. Catena 2016, 137, 256–268. [Google Scholar] [CrossRef]
- Xiong, M.Q.; Sun, R.H.; Chen, L.D. A global comparison of soil erosion associated with land use and climate type. Geoderma 2019, 343, 31–39. [Google Scholar] [CrossRef]
- Novara, A.; Pisciotta, A.; Minacapilli, M.; Maltese, A.; Capodici, F.; Cerda, A.; Gristina, L. The impact of soil erosion on soil fertility and vine vigor. A multidisciplinary approach based on field, laboratory and remote sensing approaches. Sci. Total Environ. 2018, 622, 474–480. [Google Scholar] [CrossRef] [PubMed] [Green Version]
- Jin, F.; Yang, W.; Fu, J.; Li, Z. Effects of vegetation and climate on the changes of soil erosion in the Loess Plateau of China. Sci. Total Environ. 2021, 773, 145514. [Google Scholar] [CrossRef]
- Zhang, J.; Wang, N.; Wang, Y.; Wang, L.; Hu, A.; Zhang, D.; Su, X.; Chen, J. Responses of Soil Erosion to Land-Use Changes in the Largest Tableland of the Loess Plateau. Land Degrad. Dev. 2007, 107, 2411–2502. [Google Scholar] [CrossRef]
- Zhang, Q.F.; Wu, F.Q.; Wang, L.; Yuan, L.F.; Zhao, L.S. Application of PCA integrated with CA and GIS in eco-economic regionalization of Chinese Loess Plateau. Ecol. Econ. 2011, 70, 1051–1056. [Google Scholar] [CrossRef]
- Wen, X.; Zhen, L. Soil erosion control practices in the Chinese Loess Plateau: A systematic review. Environ. Dev. 2020, 34, 100493. [Google Scholar] [CrossRef]
- Zhang, X.C.; Liu, W.Z. Simulating potential response of hydrology, soil erosion, and crop productivity to climate change in Changwu tableland region on the Loess Plateau of China. Agric. For. Meteorol. 2005, 131, 127–142. [Google Scholar] [CrossRef]
- Wu, H.; Qian, H. Innovative trend analysis of annual and seasonal rainfall and extreme values in Shaanxi, China, since the 1950s. Int. J. Climatol. 2017, 37, 2582–2592. [Google Scholar] [CrossRef]
- Deng, L.; Kim, D.G.; Li, M.Y.; Huang, C.B.; Liu, Q.Y.; Cheng, M.; Shangguan, Z.P.; Peng, C.H. Land-use changes driven by ’Grain for Green’ program reduced carbon loss induced by soil erosion on the Loess Plateau of China. Glob. Planet. Chang. 2019, 177, 101–115. [Google Scholar] [CrossRef]
- Fu, B.J.; Meng, Q.H.; Qiu, Y.; Zhao, W.W.; Zhang, Q.J.; Davidson, D.A. Effects of land use on soil erosion and nitrogen loss in the hilly area of the Loess Plateau, China. Land Degrad. Dev. 2004, 15, 87–96. [Google Scholar] [CrossRef]
- Sun, W.Y.; Shao, Q.Q.; Liu, J.Y.; Zhai, J. Assessing the effects of land use and topography on soil erosion on the Loess Plateau in China. Catena 2014, 121, 151–163. [Google Scholar] [CrossRef]
- Zhang, X.C. A comparison of explicit and implicit spatial downscaling of GCM output for soil erosion and crop production assessments. Clim. Chang. 2007, 84, 337–363. [Google Scholar] [CrossRef]
- Jiang, C.; Mu, X.M.; Wang, F.; Zhao, G.J. Analysis of extreme temperature events in the Qinling Mountains and surrounding area during 1960–2012. Quatern. Int. 2016, 392, 155–167. [Google Scholar] [CrossRef]
- Guo, Q.H.; Kelly, M.; Gong, P.; Liu, D.S. An object-based classification approach in mapping tree mortality using high spatial resolution imagery. Gisci. Remote Sens. 2007, 44, 24–47. [Google Scholar] [CrossRef]
- Liu, D.S.; Xia, F. Assessing object-based classification: Advantages and limitations. Remote Sens. Lett. 2010, 1, 187–194. [Google Scholar] [CrossRef]
- Rahman, M.R.; Saha, S.K. Multi-resolution Segmentation for Object-based Classification and Accuracy Assessment of Land Use/Land Cover Classification using Remotely Sensed Data. Photonirvachak-J. Ind. 2008, 36, 189–201. [Google Scholar]
- Langley, S.K.; Cheshire, H.M.; Humes, K.S. A comparison of single date and multitemporal satellite image classifications in a semi-arid grassland. J. Arid. Environ. 2001, 49, 401–411. [Google Scholar] [CrossRef]
- Xie, Y.W.; Zhao, H.; Wang, G.S. Spatio-temporal changes in oases in the Heihe River Basin of China: 1963–2013. Ecoscience 2015, 22, 33–46. [Google Scholar] [CrossRef]
- Schmidt, M. The sankey diagram in energy and material flow management. J. Ind. Ecol. 2008, 12, 82–94. [Google Scholar] [CrossRef]
- Cuba, N. Research note: Sankey diagrams for visualizing land cover dynamics. Landsc. Urban. Plan. 2015, 139, 163–167. [Google Scholar] [CrossRef]
- Yushanjiang, A.; Zhang, F.; Kung, H.T.; Li, Z. Spatial-temporal variation of ecosystem service values in Ebinur Lake Wetland National Natural Reserve from 1972 to 2016, Xinjiang, arid region of China. Environ. Earth Sci. 2018, 77, 586. [Google Scholar] [CrossRef]
- Allaire, J.J.; Ellis, P.; Gandrud, C. Package ‘NetworkD3’. D3 JavaScript Network Graphs from R. 2017. Available online: https://github.com/eliztang/networkD3 (accessed on 8 July 2021).
- Renard, K.G. Predicting Soil Erosion by Water: A Guide to Conservation Planning with the Revised Universal Soil Loss Equation (RUSLE); United States Government Printing: Washington, DC, USA, 1997.
- Wischmeier, W.H.; Smith, D.D. Predicting Rainfall Erosion Losses: A Guide to Conservation Planning; Department of Agriculture; Science and Education Administration; United States Government Printing: Washington, DC, USA, 1978.
- Desmet, P.J.J.; Govers, G. A GIS procedure for automatically calculating the USLE LS factor on topographically complex landscape units. J. Soil Water Conserv. 1996, 51, 427–433. [Google Scholar]
- Liu, B.Y.; Nearing, M.A.; Shi, P.J.; Jia, Z.W. Slope length effects on soil loss for steep slopes. Soil Sci. Soc. Am. J. 2000, 64, 1759–1763. [Google Scholar] [CrossRef] [Green Version]
- Tang, Q.; Xu, Y.; Bennett, S.J.; Li, Y. Assessment of soil erosion using RUSLE and GIS: A case study of the Yangou watershed in the Loess Plateau, China. Environ. Earth Sci. 2015, 73, 1715–1724. [Google Scholar] [CrossRef] [Green Version]
- Yan, Z.; Liu, B.Y.; Zhang, Q.C.; Xie, Y. Effect of different vegetation types on soil erosion by water. Acta Bot. Sin. 2003, 45, 1204–1209. [Google Scholar]
- Yan, Z.; Baoyuan, L.; Peijun, S.; Zhongshan, J.J.A.E.S. Crop cover factor estimating for soil loss prediction. Acta Ecol. Sin. 2001, 21, 1050–1056. [Google Scholar]
- Gao, H.D.; Li, Z.B.; Jia, L.L.; Li, P.; Xu, G.C.; Ren, Z.P.; Pang, G.W.; Zhao, B.H. Capacity of soil loss control in the Loess Plateau based on soil erosion control degree. J. Geogr. Sci. 2016, 26, 457–472. [Google Scholar] [CrossRef] [Green Version]
- Mollalo, A.; Vahedi, B.; Rivera, K.M. GIS-based spatial modeling of COVID-19 incidence rate in the continental United States. Sci. Total Environ. 2020, 728, 138884. [Google Scholar] [CrossRef] [PubMed]
- Brunsdon, C.; Fotheringham, A.S.; Charlton, M.E. Geographically weighted regression: A method for exploring spatial nonstationarity. Geogr. Anal. 2015, 28, 281–298. [Google Scholar]
- Anselin, L. Spatial econometrics: Methods and models. Econ. Geogr. 1988, 65, 160–162. [Google Scholar]
- Drummond, M.A.; Auch, R.F.; Karstensen, K.A.; Sayler, K.L.; Taylor, J.L.; Loveland, T.R. Land change variability and human-environment dynamics in the United States Great Plains. Land Use Policy 2012, 29, 710–723. [Google Scholar] [CrossRef] [Green Version]
- Ge, Y.W.; Zhang, K.; Yang, X.D. A 110-year pollen record of land use and land cover changes in an anthropogenic watershed landscape, eastern China: Understanding past human-environment interactions. Sci. Total Environ. 2019, 650, 2906–2918. [Google Scholar] [CrossRef]
- Fan, X.G.; Ma, Z.G.; Yang, Q.; Han, Y.H.; Mahmood, R. Land use/land cover changes and regional climate over the Loess Plateau during 2001–2009. Part II: Interrelationship from observations. Clim. Chang. 2015, 129, 441–455. [Google Scholar] [CrossRef] [Green Version]
- Zheng, K.; Wei, J.Z.; Pei, J.Y.; Cheng, H.; Zhang, X.L.; Huang, F.Q.; Li, F.M.; Ye, J.S. Impacts of climate change and human activities on grassland vegetation variation in the Chinese Loess Plateau. Sci. Total Environ. 2019, 660, 236–244. [Google Scholar] [CrossRef]
- Wang, Z.; Shi, C.; Jiang, W.J.G.R. Rural transformation from the perspective of regime shifts of socio-ecological systems in the Loess Plateau: A case study of Hongjia town in Changwu county, China. Geogr. Res. 2016, 35, 1510–1524. [Google Scholar]
- Návar, J. Modeling rainfall interception loss components of forests. J. Hydrol. 2020, 584, 124449. [Google Scholar] [CrossRef]
- Grunicke, S.; Queck, R.; Bernhofer, C. Long-term investigation of forest canopy rainfall interception for a spruce stand. Agric. For. Meteorol. 2020, 292, 108125. [Google Scholar] [CrossRef]
- Xiao, J.Y.; Shen, Y.J.; Ge, J.F.; Tateishi, R.; Tang, C.Y.; Liang, Y.Q.; Huang, Z.Y. Evaluating urban expansion and land use change in Shijiazhuang, China, by using GIS and remote sensing. Landsc. Urban Plan. 2006, 75, 69–80. [Google Scholar] [CrossRef]
- Feng, J.; Wei, W.; Pan, D.L. Effects of rainfall and terracing-vegetation combinations on water erosion in a loess hilly area, China. J. Environ. Manag. 2020, 261, 110247. [Google Scholar] [CrossRef]
- Jian, S.Q.; Hu, C.H.; Zhang, G.D.; Zhang, J.P. Study on the throughfall, stemflow, and interception of two shrubs in the semiarid Loess region of China. Agr. For. Meteorol. 2019, 279, 107713. [Google Scholar] [CrossRef]
- Zhou, J.; Fu, B.J.; Gao, G.Y.; Lu, Y.H.; Liu, Y.; Lu, N.; Wang, S. Effects of precipitation and restoration vegetation on soil erosion in a semi-arid environment in the Loess Plateau, China. Catena 2016, 137, 1–11. [Google Scholar] [CrossRef]
- Fang, H. Impact of land use changes on catchment soil erosion and sediment yield in the northeastern China: A panel data model application. Int. J. Sediment Res. 2020, 35, 540–549. [Google Scholar] [CrossRef]
Figure 1.
Map of the study area.

Figure 2.
The land use/cover maps for 1987, 1997, 2007, and 2017.

Figure 3.
This figure shows the LULCC for 1987, 1997, 2007, and 2017. The stacked bars’ colors represent land use/cover class. The stacked bars’ height represents area of land use/cover class. The width of the lines represents the transfer areas of land use/cover class.
Figure 3.
This figure shows the LULCC for 1987, 1997, 2007, and 2017. The stacked bars’ colors represent land use/cover class. The stacked bars’ height represents area of land use/cover class. The width of the lines represents the transfer areas of land use/cover class.

Figure 4.
The soil erosion intensity maps for 1987, 1997, 2007 and 2017.

Figure 5.
This figure shows the annual average soil erosion in six classes (slight, light, moderate, severe, very severe, and extremely severe) for 1987, 1997, 2007, and 2017. The soil erosion classes are based on the RUSLE model applied and the standards for the classification and gradation of soil erosion SL190-2007 issued by the Ministry of Water Resources of China.

Figure 6.
This figure shows the soil erosion change for 1987, 1997, 2007, and 2017. The stacked bars’ colors represent soil erosion class. The stacked bars’ height represents area of soil erosion class. The width of the lines represents the transfer areas of soil erosion class.
Figure 6.
This figure shows the soil erosion change for 1987, 1997, 2007, and 2017. The stacked bars’ colors represent soil erosion class. The stacked bars’ height represents area of soil erosion class. The width of the lines represents the transfer areas of soil erosion class.


Table 1.
Description of land use/cover types identified in the study area.
| Type | Description |
|---|---|
| Orchard | Agricultural land for planting fruit trees |
| Cropland | All agricultural land used for growing food crops |
| Forest land | The trees closed to canopy or have closed canopy |
| Planted land | Including open forest, bushes, shrubs and grass |
| Water body | Including river and reservoir |
| Construction land | Including settlements, roads and buildings |
Table 2.
The soil erosion classification index based on the standards for the classification and gradation of soil erosion SL190-2007 issued by the Ministry of Water Resources of China.
Table 2.
The soil erosion classification index based on the standards for the classification and gradation of soil erosion SL190-2007 issued by the Ministry of Water Resources of China.
| Code | Erosion Intensity Ton km−2 year−1 | Erosion Intensity Class |
|---|---|---|
| 1 | <1000 | slight |
| 2 | 1000–2500 | light |
| 3 | 2500–5000 | moderate |
| 4 | 5000–8000 | severe |
| 5 | 8000–15,000 | very severe |
| 6 | >15,000 | extremely severe |
Table 3.
Accuracy R2 value (p < 0.01) of different models in fitting the effect of LULCC on soil erosion change in different periods.
Table 3.
Accuracy R2 value (p < 0.01) of different models in fitting the effect of LULCC on soil erosion change in different periods.
| Period | OLS | GWR | SLM | SEM |
|---|---|---|---|---|
| 1987–1997 | 0.025 | 0.203 | 0.653 | 0.659 |
| 1997–2007 | 0.047 | 0.211 | 0.644 | 0.639 |
| 2007–2017 | 0.004 | 0.300 | 0.627 | 0.639 |
Publisher’s Note: MDPI stays neutral with regard to jurisdictional claims in published maps and institutional affiliations. |
© 2021 by the authors. Licensee MDPI, Basel, Switzerland. This article is an open access article distributed under the terms and conditions of the Creative Commons Attribution (CC BY) license (https://creativecommons.org/licenses/by/4.0/).
Share and Cite
MDPI and ACS Style
Yu, S.; Wang, F.; Qu, M.; Yu, B.; Zhao, Z. The Effect of Land Use/Cover Change on Soil Erosion Change by Spatial Regression in Changwu County on the Loess Plateau in China. Forests 2021, 12, 1209. https://doi.org/10.3390/f12091209
AMA Style
Yu S, Wang F, Qu M, Yu B, Zhao Z. The Effect of Land Use/Cover Change on Soil Erosion Change by Spatial Regression in Changwu County on the Loess Plateau in China. Forests. 2021; 12(9):1209. https://doi.org/10.3390/f12091209
Chicago/Turabian StyleYu, Shichuan, Fei Wang, Mei Qu, Binhou Yu, and Zhong Zhao. 2021. "The Effect of Land Use/Cover Change on Soil Erosion Change by Spatial Regression in Changwu County on the Loess Plateau in China" Forests 12, no. 9: 1209. https://doi.org/10.3390/f12091209
Note that from the first issue of 2016, this journal uses article numbers instead of page numbers. See further details here.