Drought Enhances the Role of Competition in Mediating the Relationship between Tree Growth and Climate in Semi-Arid Areas of Northwest China


Abstract
:1. Introduction
2. Materials and Methods
2.1. Study Site and Climatic Data
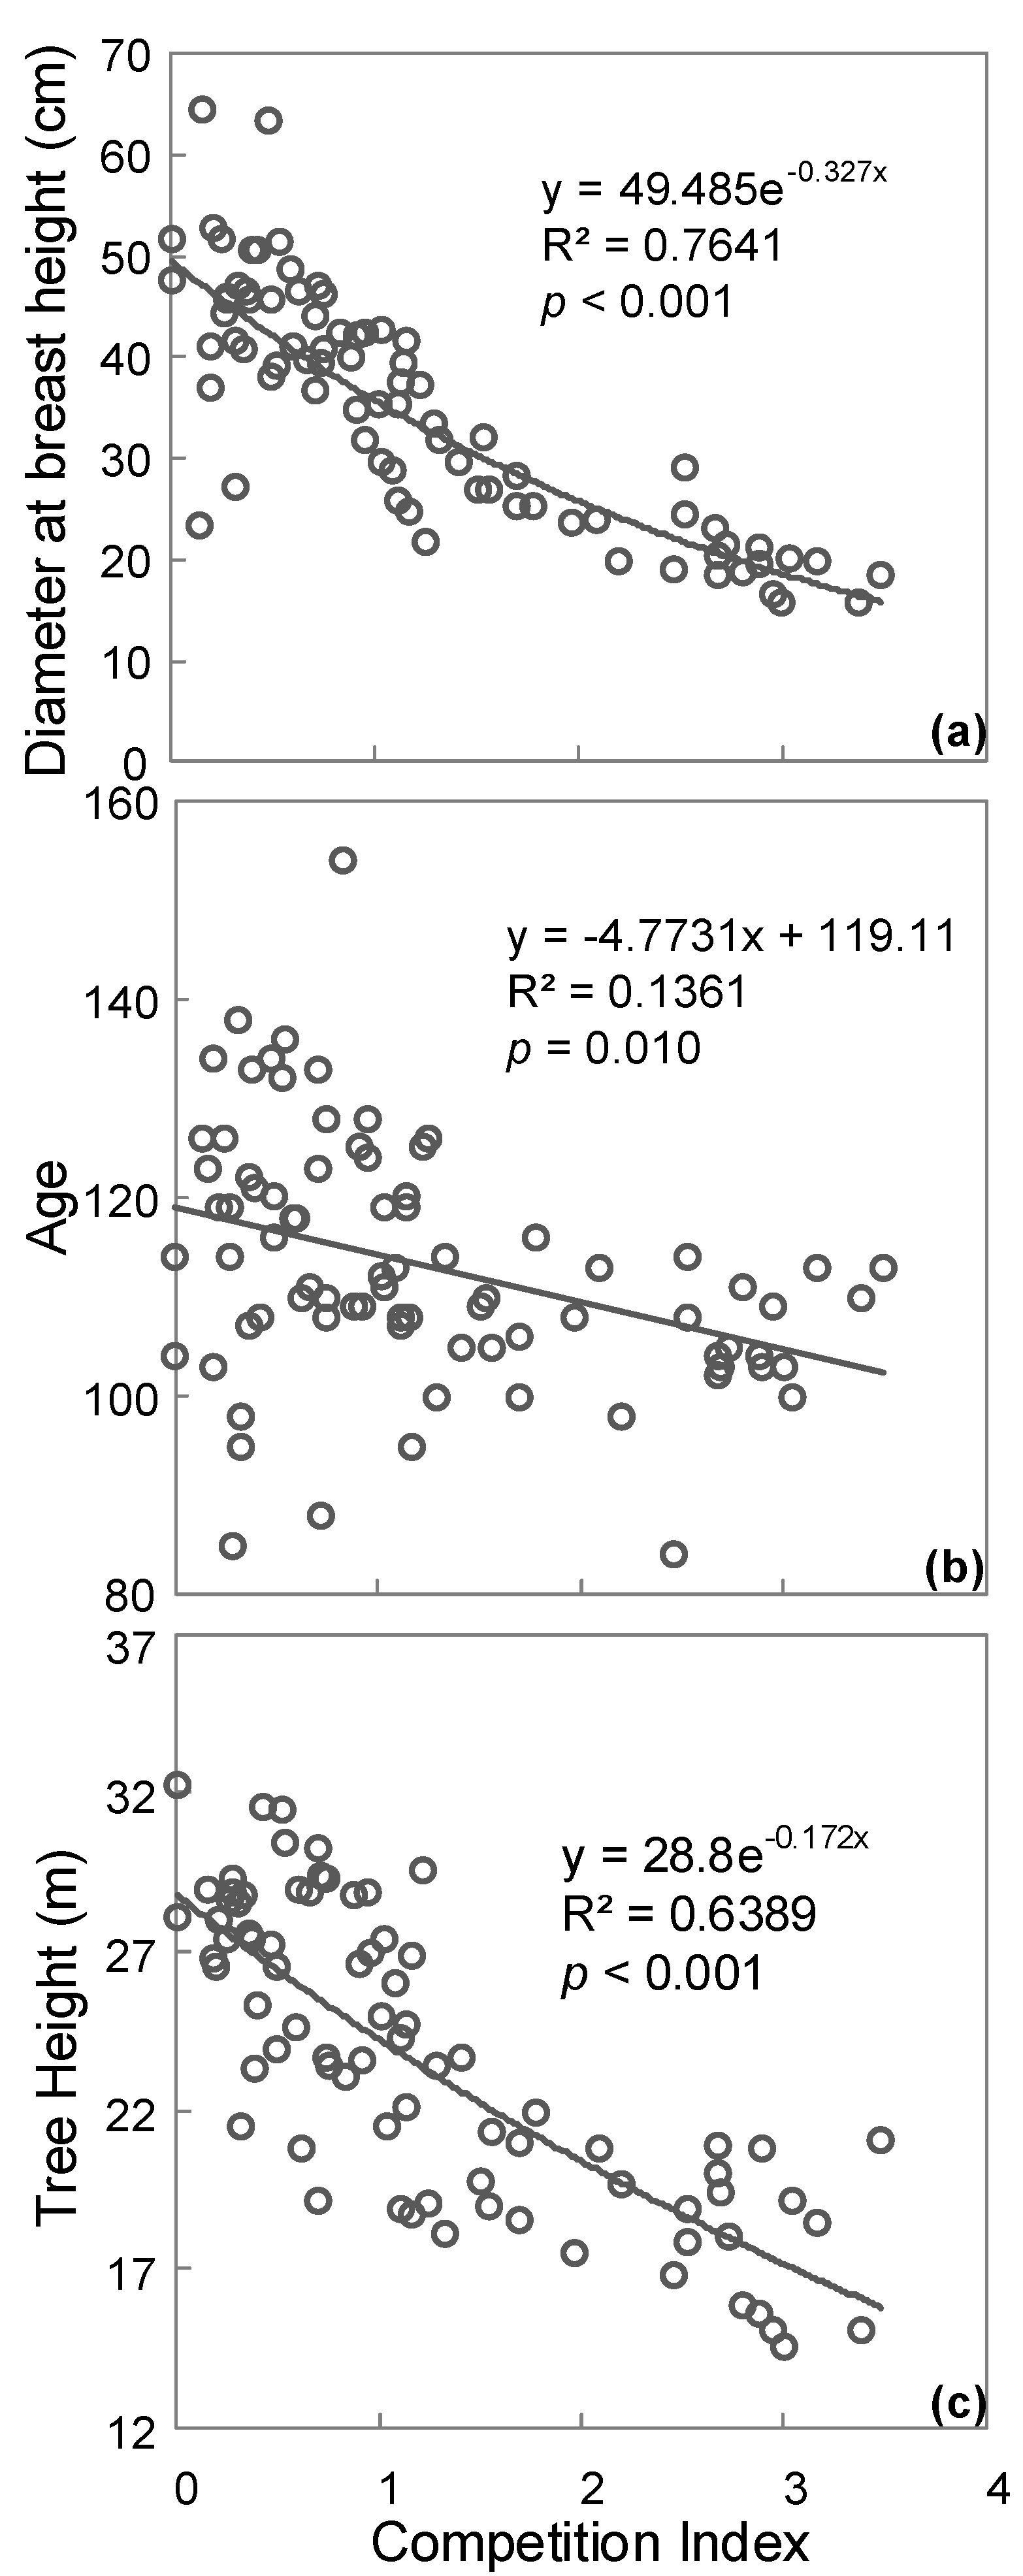
2.2. Field Survey and Individual Tree Competition Index
2.3. Field Sampling and Dendrochronological Methods
2.4. Intrinsic Water-Use Efficiency
2.4.1. Tree-Ring Carbon Isotopes
2.4.2. Conversion of Carbon Isotope to Intrinsic Water-Use Efficiency
2.5. Data Analysis
3. Results
4. Discussion
5. Conclusions
Author Contributions
Funding
Acknowledgments
Conflicts of Interest
Appendix A


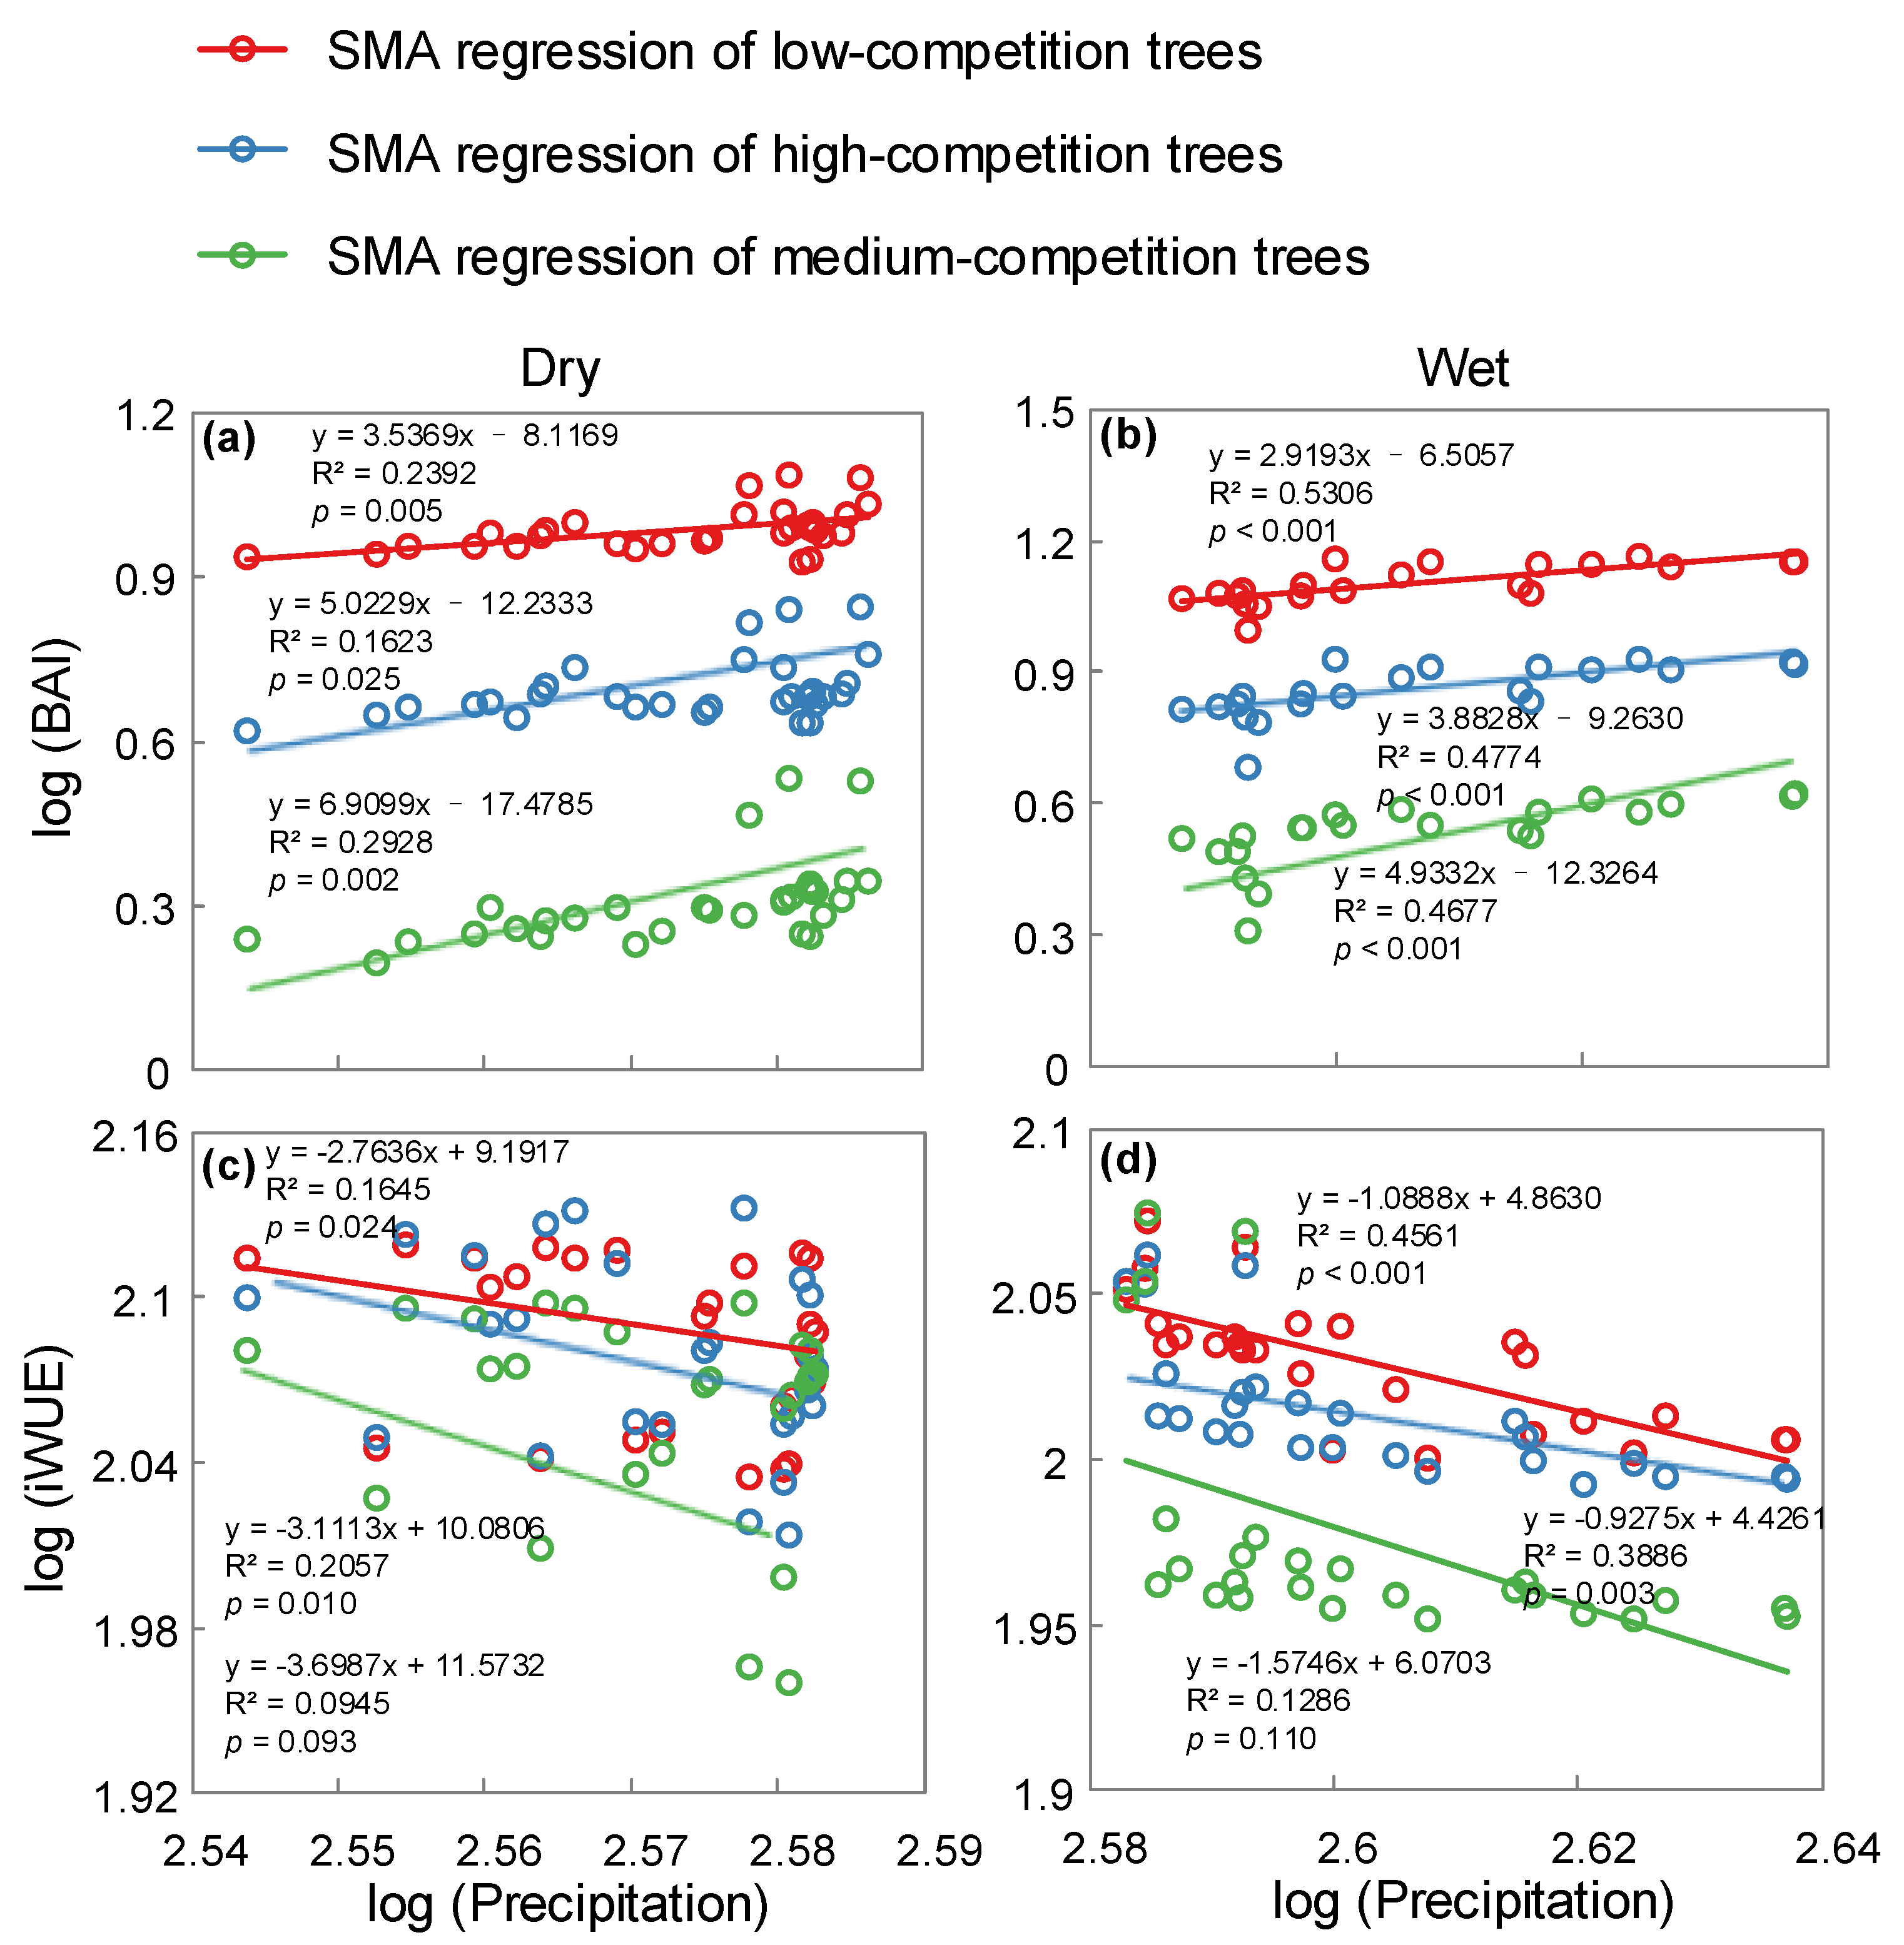
| Precipitation Level | Slope Test | Likelihood Ratio Statistic | df | p-Value |
|---|---|---|---|---|
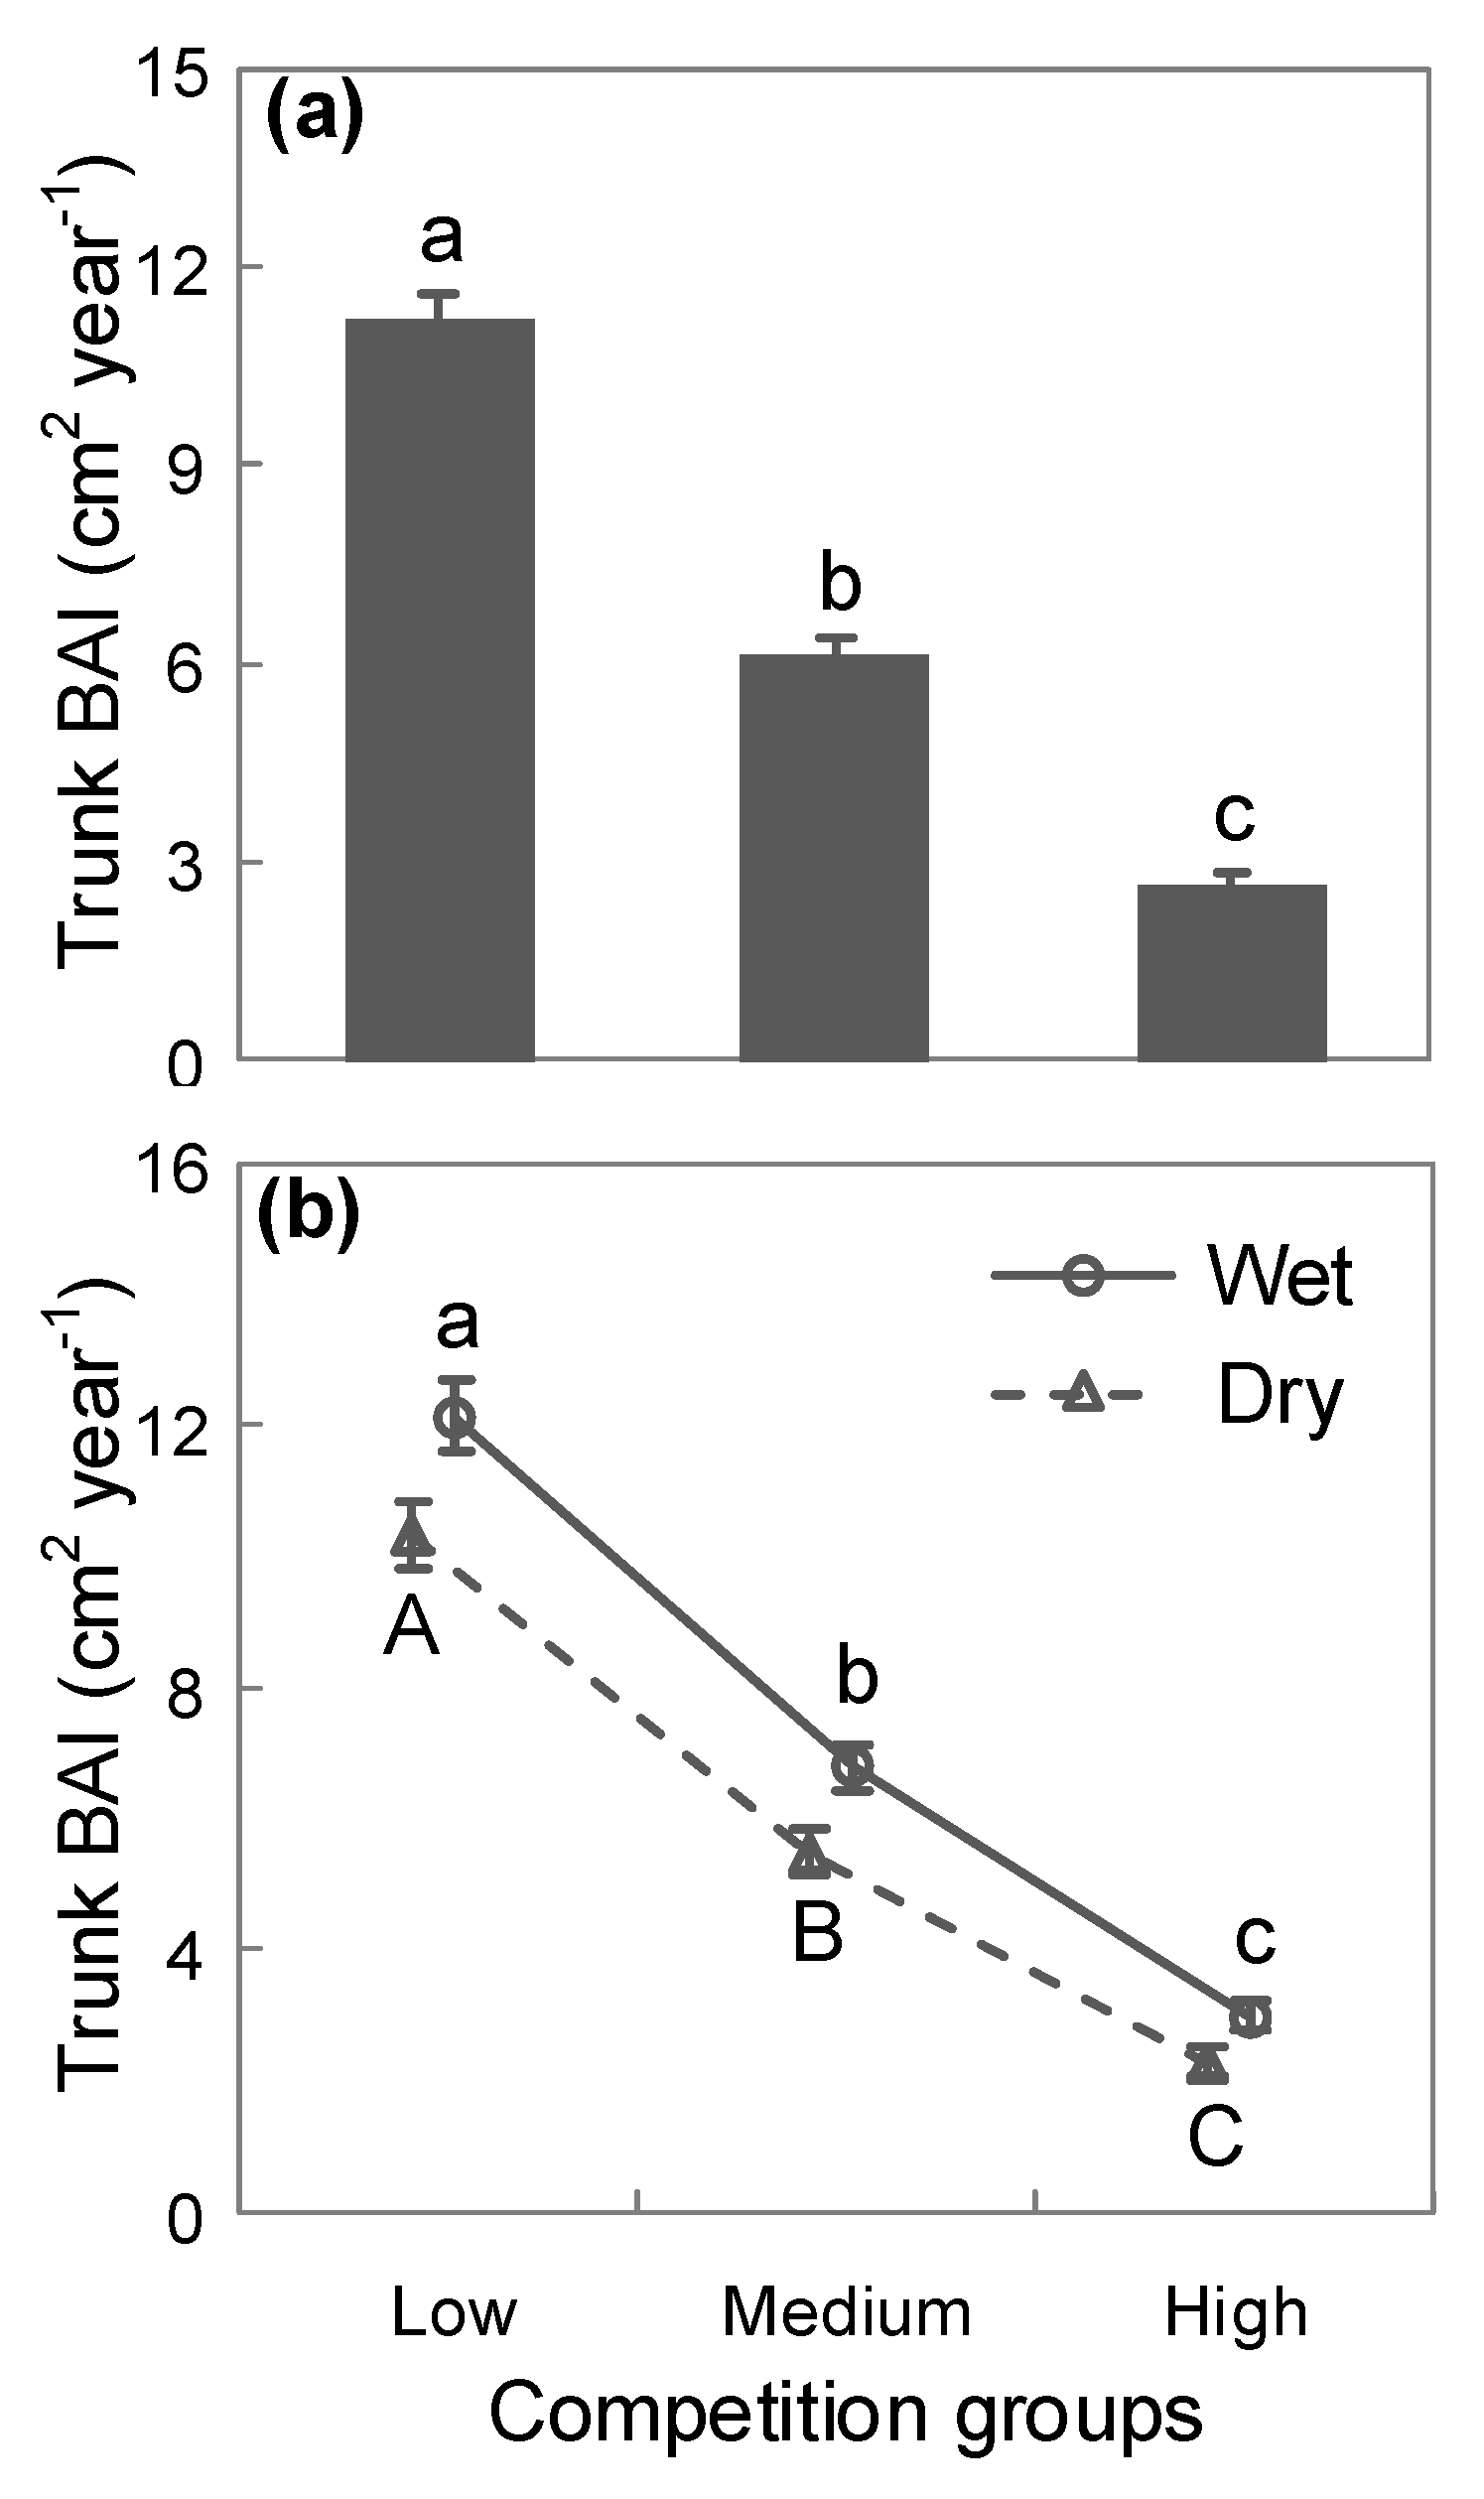
| Dry | BAI and precipitation | 8.389 | 2 | 0.0151 |
| Wet | BAI and precipitation | 4.902 | 2 | 0.0862 |
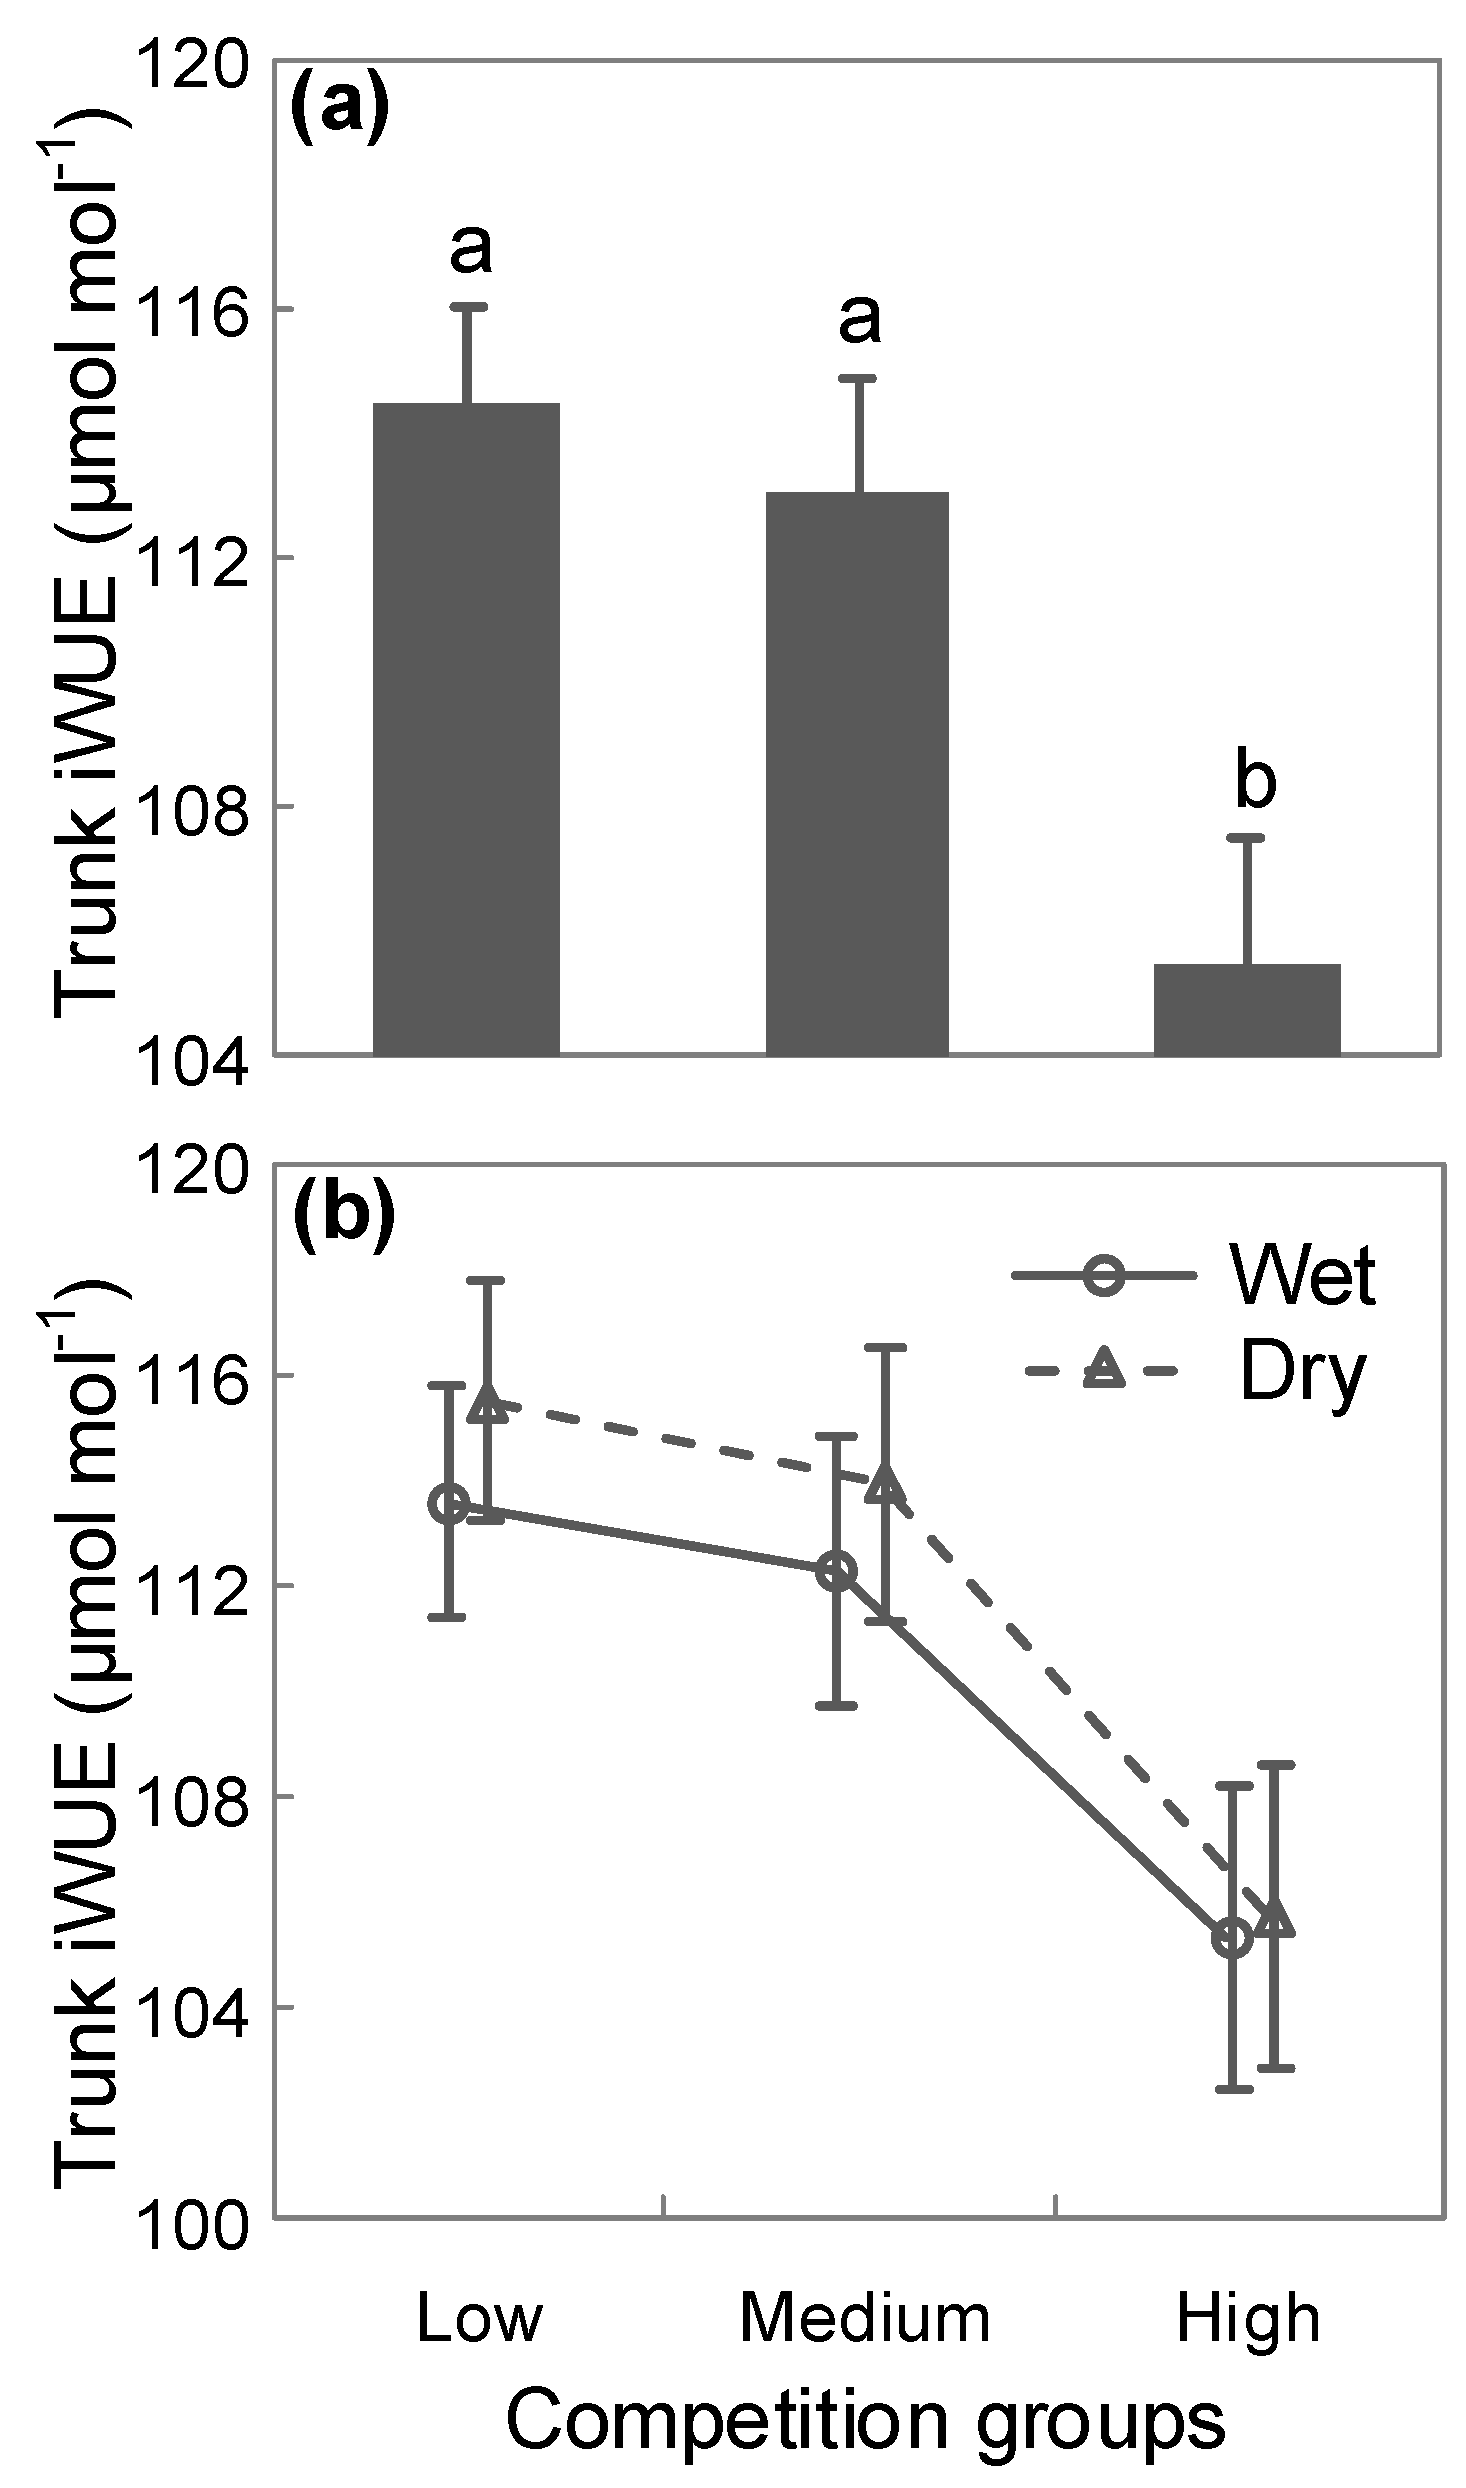
| Dry | iWUE and precipitation | 1.394 | 2 | 0.4981 |
| Wet | iWUE and precipitation | 3.482 | 2 | 0.1753 |
References
- Greenlee, J.T.; Callaway, R.M. Abiotic stress and the relative importance of interference and facilitation in montane bunchgrass communities in western Montana. Am. Nat. 1996, 148, 386–396. [Google Scholar] [CrossRef]
- Dunnett, N.; Grime, J. Competition as an amplifier of short-term vegetation responses to climate: An experimental test. Funct. Ecol. 1999, 13, 388–395. [Google Scholar] [CrossRef]
- Kikvidze, Z.; Khetsuriani, L.; Kikodze, D.; Callaway, R.M. Seasonal shifts in competition and facilitation in subalpine plant communities of the central Caucasus. J. Veg. Sci. 2006, 17, 77–82. [Google Scholar] [CrossRef]
- Bertness, M.D.; Callaway, R. Positive interactions in communities. Trends Ecol. Evol. 1994, 9, 191–193. [Google Scholar] [CrossRef]
- Grime, J.P. Plant Strategies, Vegetation Processes, and Ecosystem Properties; John Wiley & Sons: Hoboken, NJ, USA, 2006. [Google Scholar]
- Tilman, D. Plant Strategies and the Dynamics and Structure of Plant Communities; Princeton University Press: Princeton, NJ, USA, 1988; p. 359. [Google Scholar]
- Callaway, R.M. Positive Interactions and Interdependence in Plant Communities; Springer: Dordrecht, The Netherlands, 2007. [Google Scholar]
- Chu, C.J.; Weiner, J.; Maestre, F.T.; Xiao, S.; Wang, Y.S.; Li, Q.; Yuan, J.L.; Zhao, L.Q.; Ren, Z.W.; Wang, G. Positive interactions can increase size inequality in plant populations. J. Ecol. 2009, 97, 1401–1407. [Google Scholar] [CrossRef]
- McIntire, E.J.B.; Fajardo, A. Facilitation within species: A possible origin of group-selected superorganisms. Am. Nat. 2011, 178, 88–97. [Google Scholar] [CrossRef] [PubMed]
- Carnwath, G.C.; Nelson, C.R. The effect of competition on responses to drought and interannual climate variability of a dominant conifer tree of western North America. J. Ecol. 2016, 104, 1421–1431. [Google Scholar] [CrossRef]
- Via, S.; Gomulkiewicz, R.; De Jong, G.; Scheiner, S.M.; Schlichting, C.D.; Van Tienderen, P.H. Adaptive phenotypic plasticity: Consensus and controversy. Trends Ecol. Evol. 1995, 10, 212–217. [Google Scholar] [CrossRef]
- Awad, H.; Barigah, T.; Badel, E.; Cochard, H.; Herbette, S. Poplar vulnerability to xylem cavitation acclimates to drier soil conditions. Physiol. Plant. 2010, 139, 280–288. [Google Scholar] [CrossRef] [PubMed]
- Woods, K.D. Living long by staying small: Stem layering as an adaptive life-history trait in shade-tolerant tree seedlings. Can. J. For. Res. 2008, 38, 480–487. [Google Scholar] [CrossRef]
- Barnard, D.M.; Meinzer, F.C.; Lachenbruch, B.; McCulloh, K.A.; Johnson, D.M.; Woodruff, D.R. Climate-related trends in sapwood biophysical properties in two conifers: Avoidance of hydraulic dysfunction through coordinated adjustments in xylem efficiency, safety and capacitance. Plant Cell Environ. 2011, 34, 643–654. [Google Scholar] [CrossRef] [PubMed]
- Pedersen, B.S. The role of stress in the mortality of midwestern oaks as indicated by growth prior to death. Ecology 1998, 79, 79–93. [Google Scholar] [CrossRef]
- Ogle, K.; Whitham, T.G.; Cobb, N.S. Tree-ring variation in pinyon predicts likelihood of death following severe drought. Ecology 2000, 81, 3237–3243. [Google Scholar] [CrossRef]
- Suarez, M.L.; Ghermandi, L.; Kitzberger, T. Factors predisposing episodic drought-induced tree mortality in Nothofagus–site, climatic sensitivity and growth trends. J. Ecol. 2004, 92, 954–966. [Google Scholar] [CrossRef]
- McDowell, N.G.; Allen, C.D.; Marshall, L. Growth, carbon-isotope discrimination, and drought-associated mortality across a Pinus ponderosa elevational transect. Glob. Change Biol. 2010, 16, 399–415. [Google Scholar] [CrossRef]
- Sánchez-Salguero, R.; Linares, J.C.; Camarero, J.J.; Madrigal-González, J.; Hevia, A.; Sánchez-Miranda, Á.; Ballesteros-Cánovas, J.A.; Alfaro-Sánchez, R.; García-Cervigón, A.I.; Bigler, C. Disentangling the effects of competition and climate on individual tree growth: A retrospective and dynamic approach in Scots pine. For. Ecol. Manag. 2015, 358, 12–25. [Google Scholar] [CrossRef]
- Mérian, P.; Lebourgeois, F. Size-mediated climate–growth relationships in temperate forests: A multi-species analysis. For. Ecol. Manag. 2011, 261, 1382–1391. [Google Scholar] [CrossRef]
- Bennett, A.C.; McDowell, N.G.; Allen, C.D.; Anderson-Teixeira, K.J. Larger trees suffer most during drought in forests worldwide. Nat. Plants 2015, 1, 15139. [Google Scholar] [CrossRef]
- Giardina, F.; Konings, A.G.; Kennedy, D.; Alemohammad, S.H.; Oliveira, R.S.; Uriarte, M.; Gentine, P. Tall Amazonian forests are less sensitive to precipitation variability. Nat. Geosci. 2018, 11, 405. [Google Scholar] [CrossRef]
- Rozas, V.; DeSoto, L.; Olano, J.M. Sex-specific, age-dependent sensitivity of tree-ring growth to climate in the dioecious tree Juniperus thurifera. New Phytol. 2009, 182, 687–697. [Google Scholar] [CrossRef]
- Vieira, J.; Campelo, F.; Nabais, C. Age-dependent responses of tree-ring growth and intra-annual density fluctuations of Pinus pinaster to Mediterranean climate. Trees 2009, 23, 257–265. [Google Scholar] [CrossRef]
- Getzin, S.; Worbes, M.; Wiegand, T.; Wiegand, K. Size dominance regulates tree spacing more than competition within height classes in tropical Cameroon. J. Trop. Ecol. 2011, 27, 93–102. [Google Scholar] [CrossRef]
- Weiner, J.; Thomas, S.C. Size variability and competition in plant monocultures. Oikos 1986, 47, 211–222. [Google Scholar] [CrossRef]
- Connolly, J.; Wayne, P. Asymmetric competition between plant species. Oecologia 1996, 108, 311–320. [Google Scholar] [CrossRef] [PubMed]
- Martínez-Vilalta, J.; Cochard, H.; Mencuccini, M.; Sterck, F.; Herrero, A.; Korhonen, J.; Llorens, P.; Nikinmaa, E.; Nole, A.; Poyatos, R. Hydraulic adjustment of Scots pine across Europe. New Phytol. 2009, 184, 353–364. [Google Scholar] [CrossRef] [PubMed]
- Koch, G.W.; Sillett, S.C.; Jennings, G.M.; Davis, S.D. The limits to tree height. Nature 2004, 428, 851. [Google Scholar] [CrossRef] [PubMed]
- Ryan, M.G.; Yoder, B.J. Hydraulic limits to tree height and tree growth. Bioscience 1997, 47, 235–242. [Google Scholar] [CrossRef]
- Clark, D.A.; Brown, S.; Kicklighter, D.W.; Chambers, J.Q.; Thomlinson, J.R.; Ni, J. Measuring net primary production in forests: Concepts and field methods. Ecol. Appl. 2001, 11, 356–370. [Google Scholar] [CrossRef]
- Fernández-de-Uña, L.; McDowell, N.G.; Canellas, I.; Gea-Izquierdo, G. Disentangling the effect of competition, CO2 and climate on intrinsic water-use efficiency and tree growth. J. Ecol. 2016, 104, 678–690. [Google Scholar] [CrossRef]
- Anderegg, W.R.; Schwalm, C.; Biondi, F.; Camarero, J.J.; Koch, G.; Litvak, M.; Ogle, K.; Shaw, J.D.; Shevliakova, E.; Williams, A. Pervasive drought legacies in forest ecosystems and their implications for carbon cycle models. Science 2015, 349, 528–532. [Google Scholar] [CrossRef] [Green Version]
- Biondi, F.; Qeadan, F. A theory-driven approach to tree-ring standardization: Defining the biological trend from expected basal area increment. Tree Ring Res. 2008, 64, 81–96. [Google Scholar] [CrossRef]
- Vaganov, E.A.; Hughes, M.K.; Shashkin, A.V. Growth Dynamics of Conifer Tree Rings: Images of Past and Future Environments; Springer Science & Business Media: Berlin, Germany, 2006; Volume 183. [Google Scholar]
- Ciais, P.; Sabine, C.; Bala, G.; Bopp, L.; Brovkin, V.; Canadell, J.; Chhabra, A.; DeFries, R.; Galloway, J.; Heimann, M. Carbon and other biogeochemical cycles. In Climate Change 2013: The Physical Science Basis. Contribution of Working Group I to the Fifth Assessment Report of the Intergovernmental Panel on Climate Change; Cambridge University Press: Cambridge, UK, 2014; pp. 465–570. [Google Scholar]
- Jump, A.S.; Hunt, J.M.; Penuelas, J. Rapid climate change-related growth decline at the southern range edge of Fagus sylvatica. Glob. Change Biol. 2006, 12, 2163–2174. [Google Scholar] [CrossRef]
- Lu, K.; Chen, N.; Zhang, X.; Wang, J.; Wang, M.; Khan, S.; Han, C.; Zhang, C.; Wang, S.; Wang, L.; et al. Increased drought and atmospheric CO2 positively impact intrinsic water use efficiency but do not promote tree growth in semi-arid areas of northwestern China. Trees Struct Funct. 2019, 33, 669–679. [Google Scholar] [CrossRef]
- McCarroll, D.; Loader, N.J. Stable isotopes in tree rings. Quat. Sci. Rev. 2004, 23, 771–801. [Google Scholar] [CrossRef]
- Hegyi, F. A Simulation Model for Managing Jack-Pine Standssimulation; Royal College of Forestry: Stockholm, Sweden, 1974; pp. 74–90. [Google Scholar]
- LeBlanc, D.C. Relationships between breast-height and whole-stem growth indices for red spruce on Whiteface Mountain, New York. Can. J. For. Res. 1990, 20, 1399–1407. [Google Scholar] [CrossRef]
- R Development Core Team. R: A Language and Environment for Statistical Computing; R. Development Core Team: Vienna, Austria, 2016. [Google Scholar]
- Bunn, A.G. A dendrochronology program library in R (dplR). Dendrochronologia 2008, 26, 115–124. [Google Scholar] [CrossRef]
- Brendel, O.; Iannetta, P.P.M.; Stewart, D. A rapid and simple method to isolate pure alpha-cellulose. Phytochem. Anal. 2000, 11, 7–10. [Google Scholar] [CrossRef]
- Evans, M.N.; Schrag, D.P. A stable isotope-based approach to tropical dendroclimatology. Geochim. Cosmochim. Acta 2004, 68, 3295–3305. [Google Scholar] [CrossRef]
- Gaudinski, J.B.; Dawson, T.E.; Quideau, S.; Schuur, E.A.; Roden, J.S.; Trumbore, S.E.; Sandquist, D.R.; Oh, S.-W.; Wasylishen, R.E. Comparative analysis of cellulose preparation techniques for use with 13C, 14C, and 18O isotopic measurements. Anal. Chem. 2005, 77, 7212–7224. [Google Scholar] [CrossRef]
- Chen, T.; Qin, D.; Li, J. Response of CO2 concentration parameters and water-use efficiency derived from tree-ring 13C series to atmospheric CO2 increase. J. Glaciol. Geocryol. 2001, 23, 41–45. [Google Scholar]
- Farquhar, G.D.; O’Leary, M.H.; Berry, J.A. On the relationship between carbon isotope discrimination and the intercellular carbon dioxide concentration in leaves. Funct. Plant Biol. 1982, 9, 121–137. [Google Scholar] [CrossRef]
- Farquhar, G.D.; Ehleringer, J.R.; Hubick, K.T. Carbon isotope discrimination and photosynthesis. Annu. Rev. Plant Biol. 1989, 40, 503–537. [Google Scholar] [CrossRef]
- Bolte, A.; Villanueva, I. Interspecific competition impacts on the morphology and distribution of fine roots in European beech (Fagus sylvatica L.) and Norway spruce (Picea abies (L.) Karst.). Eur. J. For. Res. 2006, 125, 15–26. [Google Scholar] [CrossRef]
- Rajaniemi, T.K. Evidence for size asymmetry of belowground competition. Basic Appl. Ecol. 2003, 4, 239–247. [Google Scholar] [CrossRef]
- Rewald, B.; Leuschner, C. Does root competition asymmetry increase with water availability? Plant Ecol. Divers. 2009, 2, 255–264. [Google Scholar] [CrossRef]
- Lei, P.; Scherer-Lorenzen, M.; Bauhus, J. Belowground facilitation and competition in young tree species mixtures. For. Ecol. Manag. 2012, 265, 191–200. [Google Scholar] [CrossRef]
- Weremijewicz, J.; Janos, D.P. Common mycorrhizal networks amplify size inequality in Andropogon gerardii monocultures. New Phytol. 2013, 198, 203–213. [Google Scholar] [CrossRef] [PubMed]
- Richardson, A.D.; Carbone, M.S.; Keenan, T.F.; Czimczik, C.I.; Hollinger, D.Y.; Murakami, P.; Schaberg, P.G.; Xu, X. Seasonal dynamics and age of stemwood nonstructural carbohydrates in temperate forest trees. New Phytol. 2013, 197, 850–861. [Google Scholar] [CrossRef]
- Locosselli, G.M.; Buckeridge, M.S. Dendrobiochemistry, a missing link to further understand carbon allocation during growth and decline of trees. Trees Struct Funct. 2017, 31, 1745–1758. [Google Scholar] [CrossRef]
- Maestre, F.T.; Callaway, R.M.; Valladares, F.; Lortie, C.J. Refining the stress-gradient hypothesis for competition and facilitation in plant communities. J. Ecol. 2009, 97, 199–205. [Google Scholar] [CrossRef]
- Kawai, T.; Tokeshi, M. Testing the facilitation–competition paradigm under the stress-gradient hypothesis: Decoupling multiple stress factors. Proc. R. Soc. B Biol. Sci. 2007, 274, 2503. [Google Scholar] [CrossRef] [PubMed]
- Tielbörger, K.; Kadmon, R. Temporal environmental variation tips the balance between facilitation and interference in desert plants. Ecology 2000, 81, 1544–1553. [Google Scholar] [CrossRef]
- Holzapfel, C.; Tielbörger, K.; Parag, H.A.; Kigel, J.; Sternberg, M. Annual plant–shrub interactions along an aridity gradient. Basic Appl. Ecol. 2006, 7, 268–279. [Google Scholar] [CrossRef]
- Carrick, P.J. Competitive and facilitative relationships among three shrub species, and the role of browsing intensity and rooting depth in the Succulent Karoo, South Africa. J. Veg. Sci. 2003, 14, 761–772. [Google Scholar] [CrossRef]
- Ludwig, F.; Dawson, T.; Prins, H.; Berendse, F.; De Kroon, H. Below-ground competition between trees and grasses may overwhelm the facilitative effects of hydraulic lift. Ecol. Lett. 2004, 7, 623–631. [Google Scholar] [CrossRef]
- Lin, Y.; Berger, U.; Grimm, V.; Ji, Q.-R. Differences between symmetric and asymmetric facilitation matter: Exploring the interplay between modes of positive and negative plant interactions. J. Ecol. 2012, 100, 1482–1491. [Google Scholar] [CrossRef]
- Linares, J.C.; Camarero, J.J.; Carreira, J.A. Plastic responses of Abies pinsapo xylogenesis to drought and competition. Tree Physiol. 2009, 29, 1525–1536. [Google Scholar] [CrossRef]
- Kolb, T.E.; Agee, J.; Fule, P.Z.; McDowell, N.; Pearson, K.; Sala, A.; Waring, R. Perpetuating old ponderosa pine. For. Ecol. Manag. 2007, 249, 141–157. [Google Scholar] [CrossRef]
- Kunstler, G.; Albert, C.H.; Courbaud, B.; Lavergne, S.; Thuiller, W.; Vieilledent, G.; Zimmermann, N.E.; Coomes, D.A. Effects of competition on tree radial-growth vary in importance but not in intensity along climatic gradients. J. Ecol. 2011, 99, 300–312. [Google Scholar] [CrossRef]
- Coates, K.D.; Lilles, E.B.; Astrup, R. Competitive interactions across a soil fertility gradient in a multispecies forest. J. Ecol. 2013, 101, 806–818. [Google Scholar] [CrossRef]
- Begon, M.; Townsend, C.R.; Harper, J.L. Ecology: From Individuals to Ecosystems, 4th ed.; Blackwell: Oxford, UK, 2006. [Google Scholar]
- Gómez-Aparicio, L.; García-Valdés, R.; Ruíz-Benito, P.; Zavala, M.A. Disentangling the relative importance of climate, size and competition on tree growth in Iberian forests: Implications for forest management under global change. Glob. Change Biol. 2011, 17, 2400–2414. [Google Scholar] [CrossRef]


| Competition Groups | CI | Tree Height (m) | DBH (cm) | Age | Crown Area (m2) | No. of Trees |
|---|---|---|---|---|---|---|
| Low | 0.34 (0.03) | 26.94 (0.72) | 45.51 (1.69) | 118 (3) | 62.19 (5.72) | 27 |
| Medium | 1.00 (0.04) | 24.70 (0.70) | 36.50 (1.25) | 115 (2) | 41.23 (3.98) | 28 |
| High | 2.48 (0.12) | 19.01 (0.50) | 22.61 (0.92) | 106 (1) | 14.15 (2.05) | 27 |
| Fixed Effects | Estimate | Std. Error | df | t-Value | p-Value |
|---|---|---|---|---|---|
| (Intercept) | 0.6914 | 0.0470 | 4934 | 14.703 | <0.0001 |
| CI | −0.1472 | 0.0297 | 64 | −4.951 | <0.0001 |
| Precip | 0.0008 | 0.0001 | 4934 | 7.024 | <0.0001 |
| CI: Precip | 0.0003 | 7.37e-05 | 4934 | 4.531 | <0.0001 |
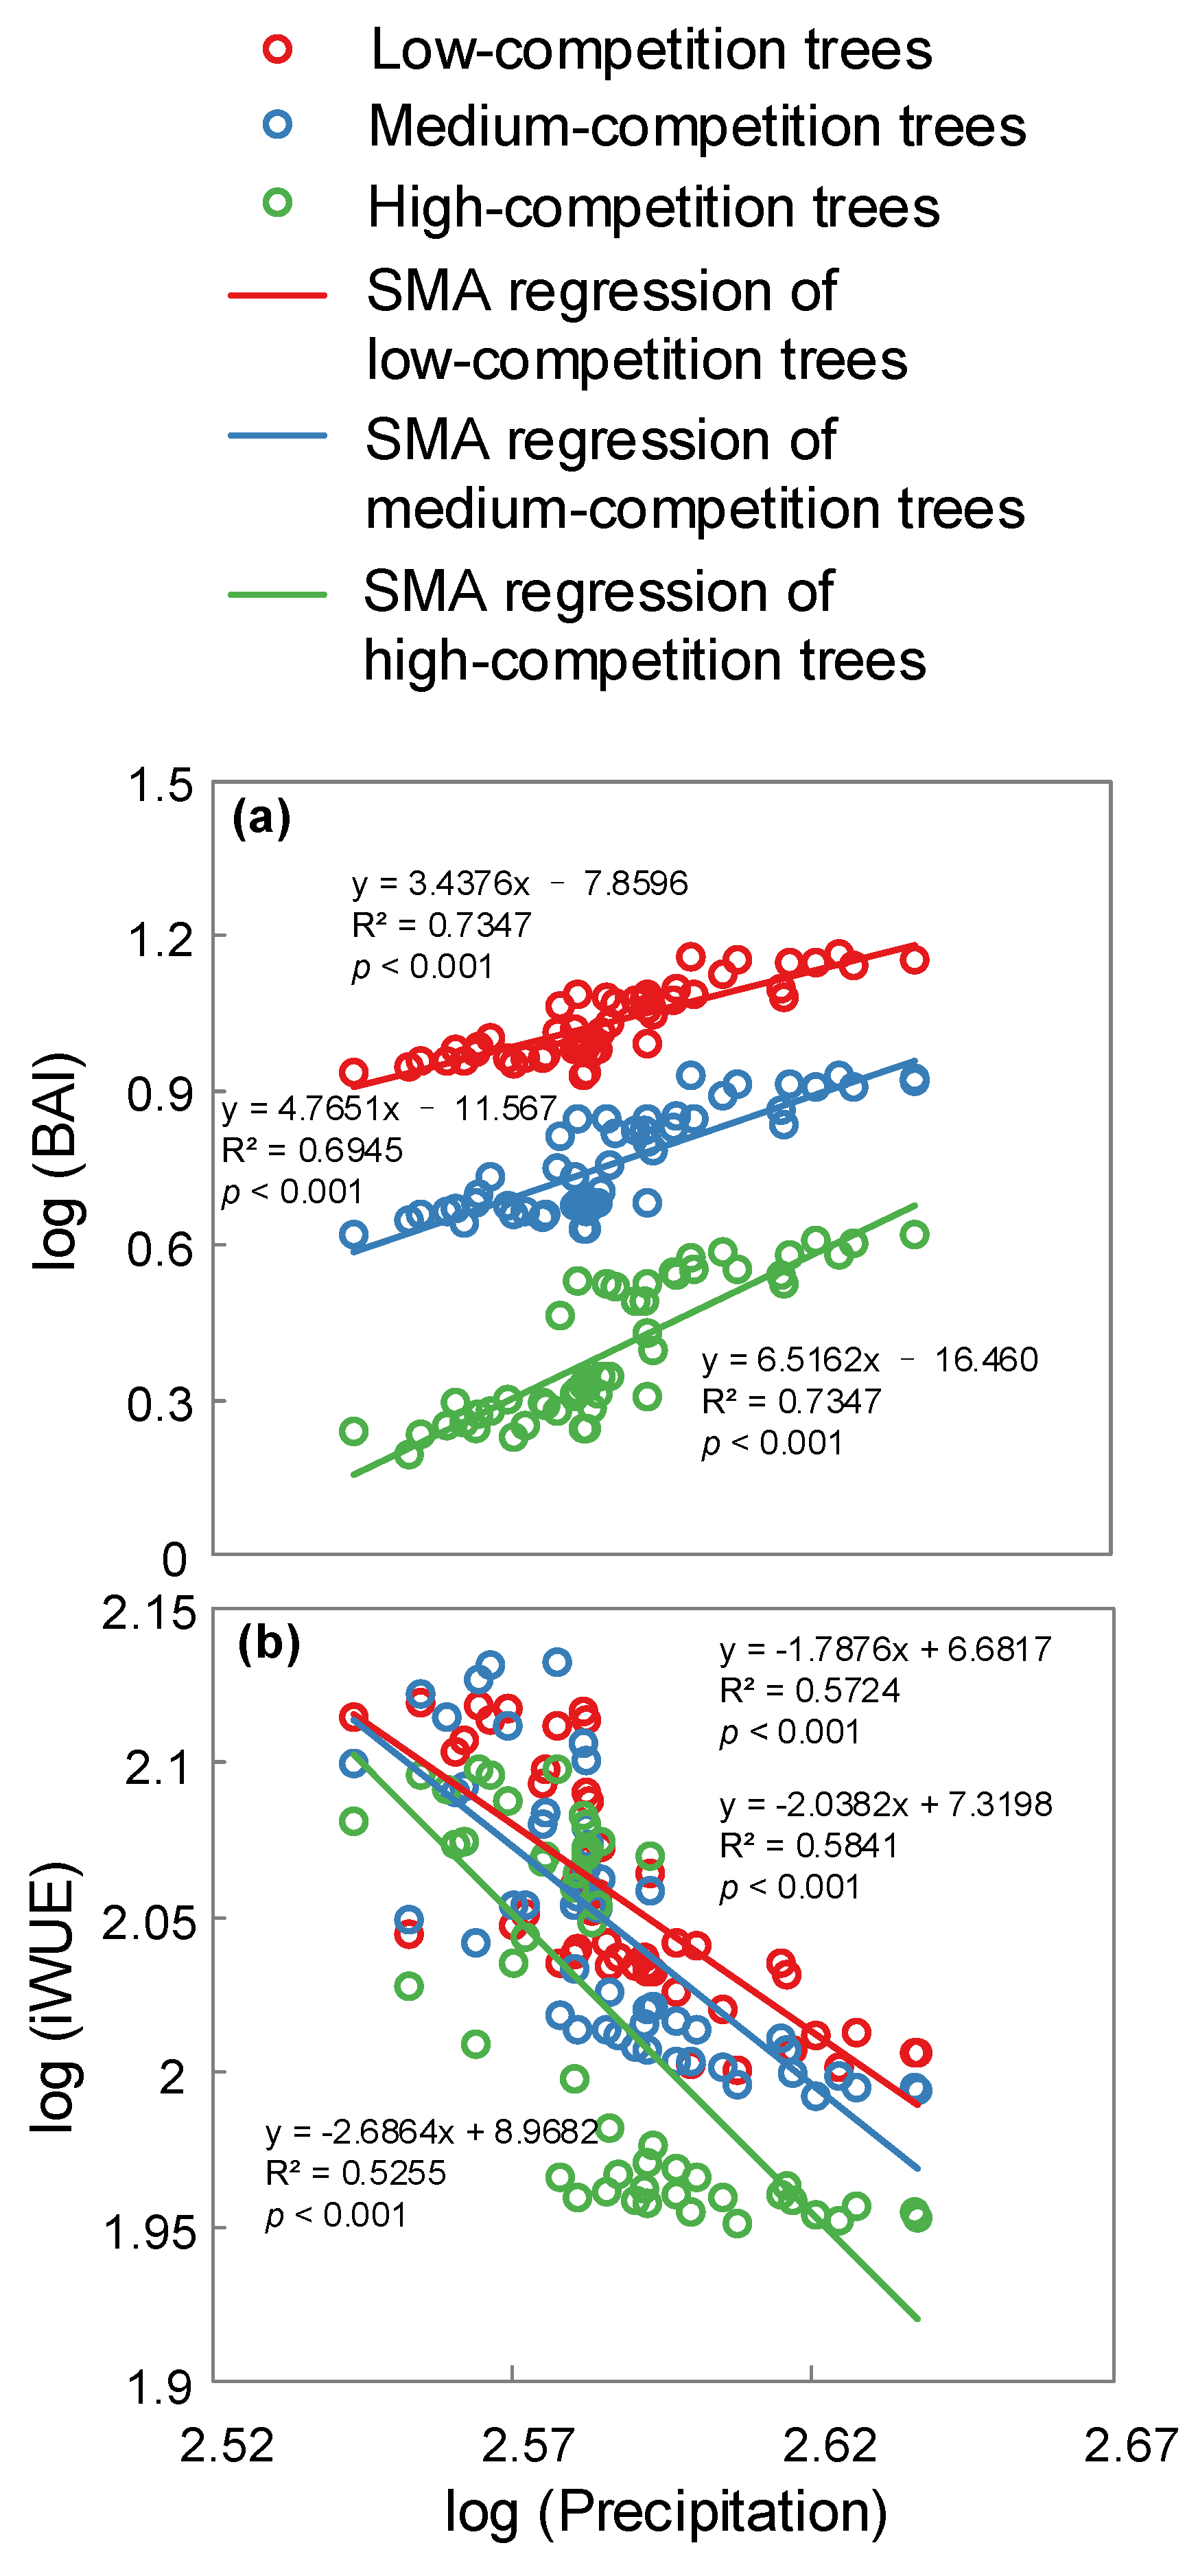
| Slope Test | Likelihood Ratio Statistic | df | p-Value |
|---|---|---|---|
| BAI and precipitation | 33.22 | 2 | <0.0001 |
| iWUE and precipitation | 9.099 | 2 | 0.0106 |
| Slope Test | Test Statistic | df | p-Value |
|---|---|---|---|
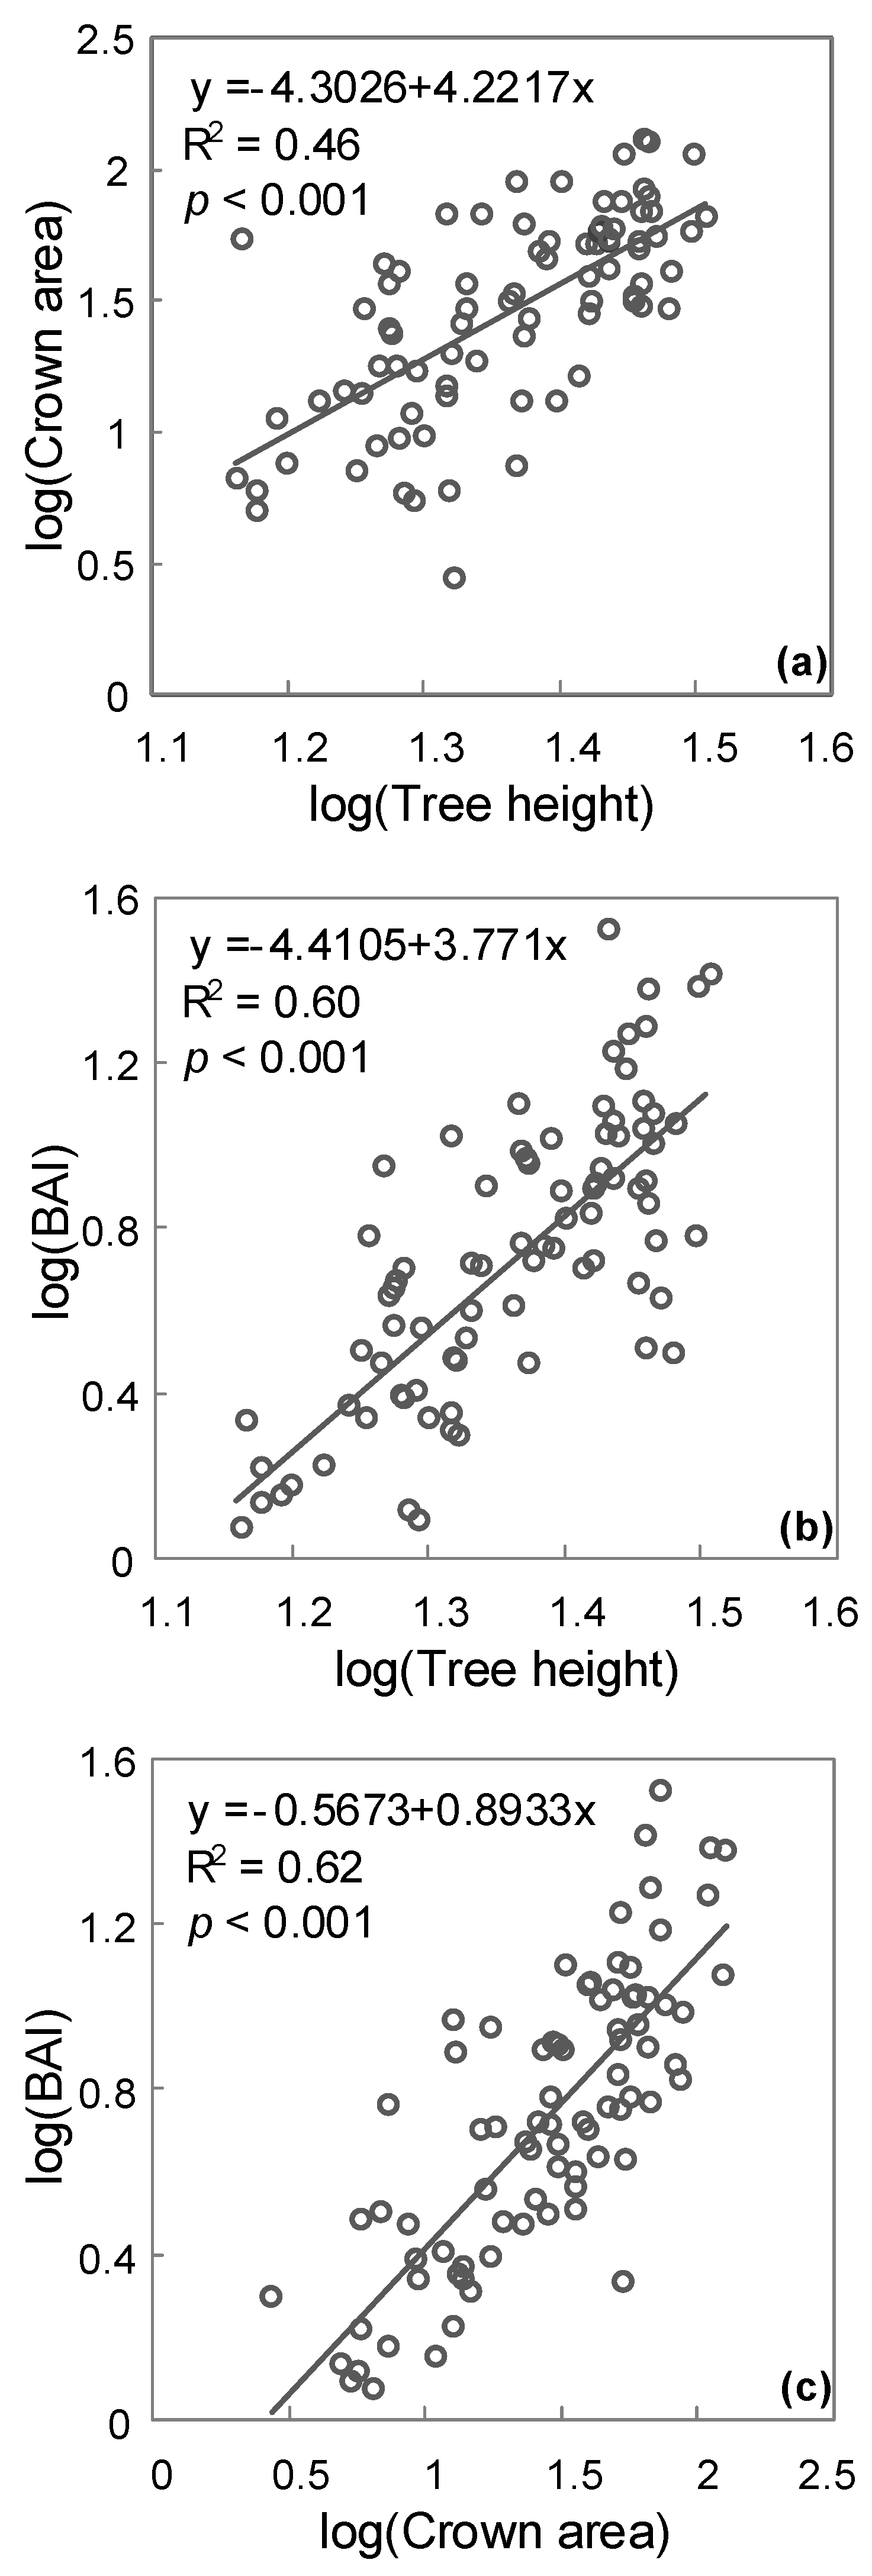
| Tree height and crown area | 0.9365 | 80 | <0.0001 |
| Crown area and BAI | 0.9385 | 80 | <0.0001 |
| Tree height and BAI | −0.1794 | 60 | 0.1068 |
© 2019 by the authors. Licensee MDPI, Basel, Switzerland. This article is an open access article distributed under the terms and conditions of the Creative Commons Attribution (CC BY) license (http://creativecommons.org/licenses/by/4.0/).
Share and Cite
Lu, K.; Chen, N.; Zhang, C.; Dong, X.; Zhao, C. Drought Enhances the Role of Competition in Mediating the Relationship between Tree Growth and Climate in Semi-Arid Areas of Northwest China. Forests 2019, 10, 804. https://doi.org/10.3390/f10090804
Lu K, Chen N, Zhang C, Dong X, Zhao C. Drought Enhances the Role of Competition in Mediating the Relationship between Tree Growth and Climate in Semi-Arid Areas of Northwest China. Forests. 2019; 10(9):804. https://doi.org/10.3390/f10090804
Chicago/Turabian StyleLu, Kanglong, Ning Chen, Cankun Zhang, Xiaoxue Dong, and Changming Zhao. 2019. "Drought Enhances the Role of Competition in Mediating the Relationship between Tree Growth and Climate in Semi-Arid Areas of Northwest China" Forests 10, no. 9: 804. https://doi.org/10.3390/f10090804