1. Introduction
Forests are vital ecosystems with significant ecological, economic, and social values, providing a wide range of ecosystem services [
1]. However, their growth, composition, and structure can be affected by climatic variables. Over the past few decades, climate change and its severe impacts on natural ecosystems have raised concerns among governments and the scientific community. These concerns were further amplified in the Intergovernmental Panel on Climate Change (IPCC) Fifth Assessment Report. The report particularly underscores that southern Europe is at risk of experiencing warmer and drier conditions in the future [
2]. In this context, assessing and monitoring aridity conditions in forested areas is crucial for understanding the relationships between climate and forest ecosystem health and vitality [
3].
Aridity is a persistent, long-term climatic condition that concerns a period of at least 30 years, contrary to drought, which is a temporary, short-term weather event that can occur in a variety of climates. Several aridity indices (AIs) have been proposed to quantify the degree of dryness in a given region. Most of them are defined by the ratio of precipitation (P) to potential evapotranspiration (PET). Therefore, PET is a key parameter for AI assessment [
4]. The Penman–Monteith method is considered a benchmark method for estimating PET but has high input data requirements (temperature, radiation, windspeed, and humidity) [
5], which are often unavailable globally. To address this challenge, scholars use other less data-demanding methods to estimate PET and subsequently the AI [
6]. However, few studies have evaluated the variability in the AI among different climatic periods, and even fewer have used data from meteorological stations in forested areas [
7]. This is due to the challenges associated with installing and maintaining meteorological stations, particularly at high elevations in mountainous regions.
The objective of this study is to investigate the temporal changes in the AI at a fir forest site in central Greece over the past six decades. The analysis is carried out for two distinct climatic periods, 1961–1990 and 1991–2020, using long-term meteorological data from a forest meteorological station.
2. Materials and Methods
2.1. Study Area
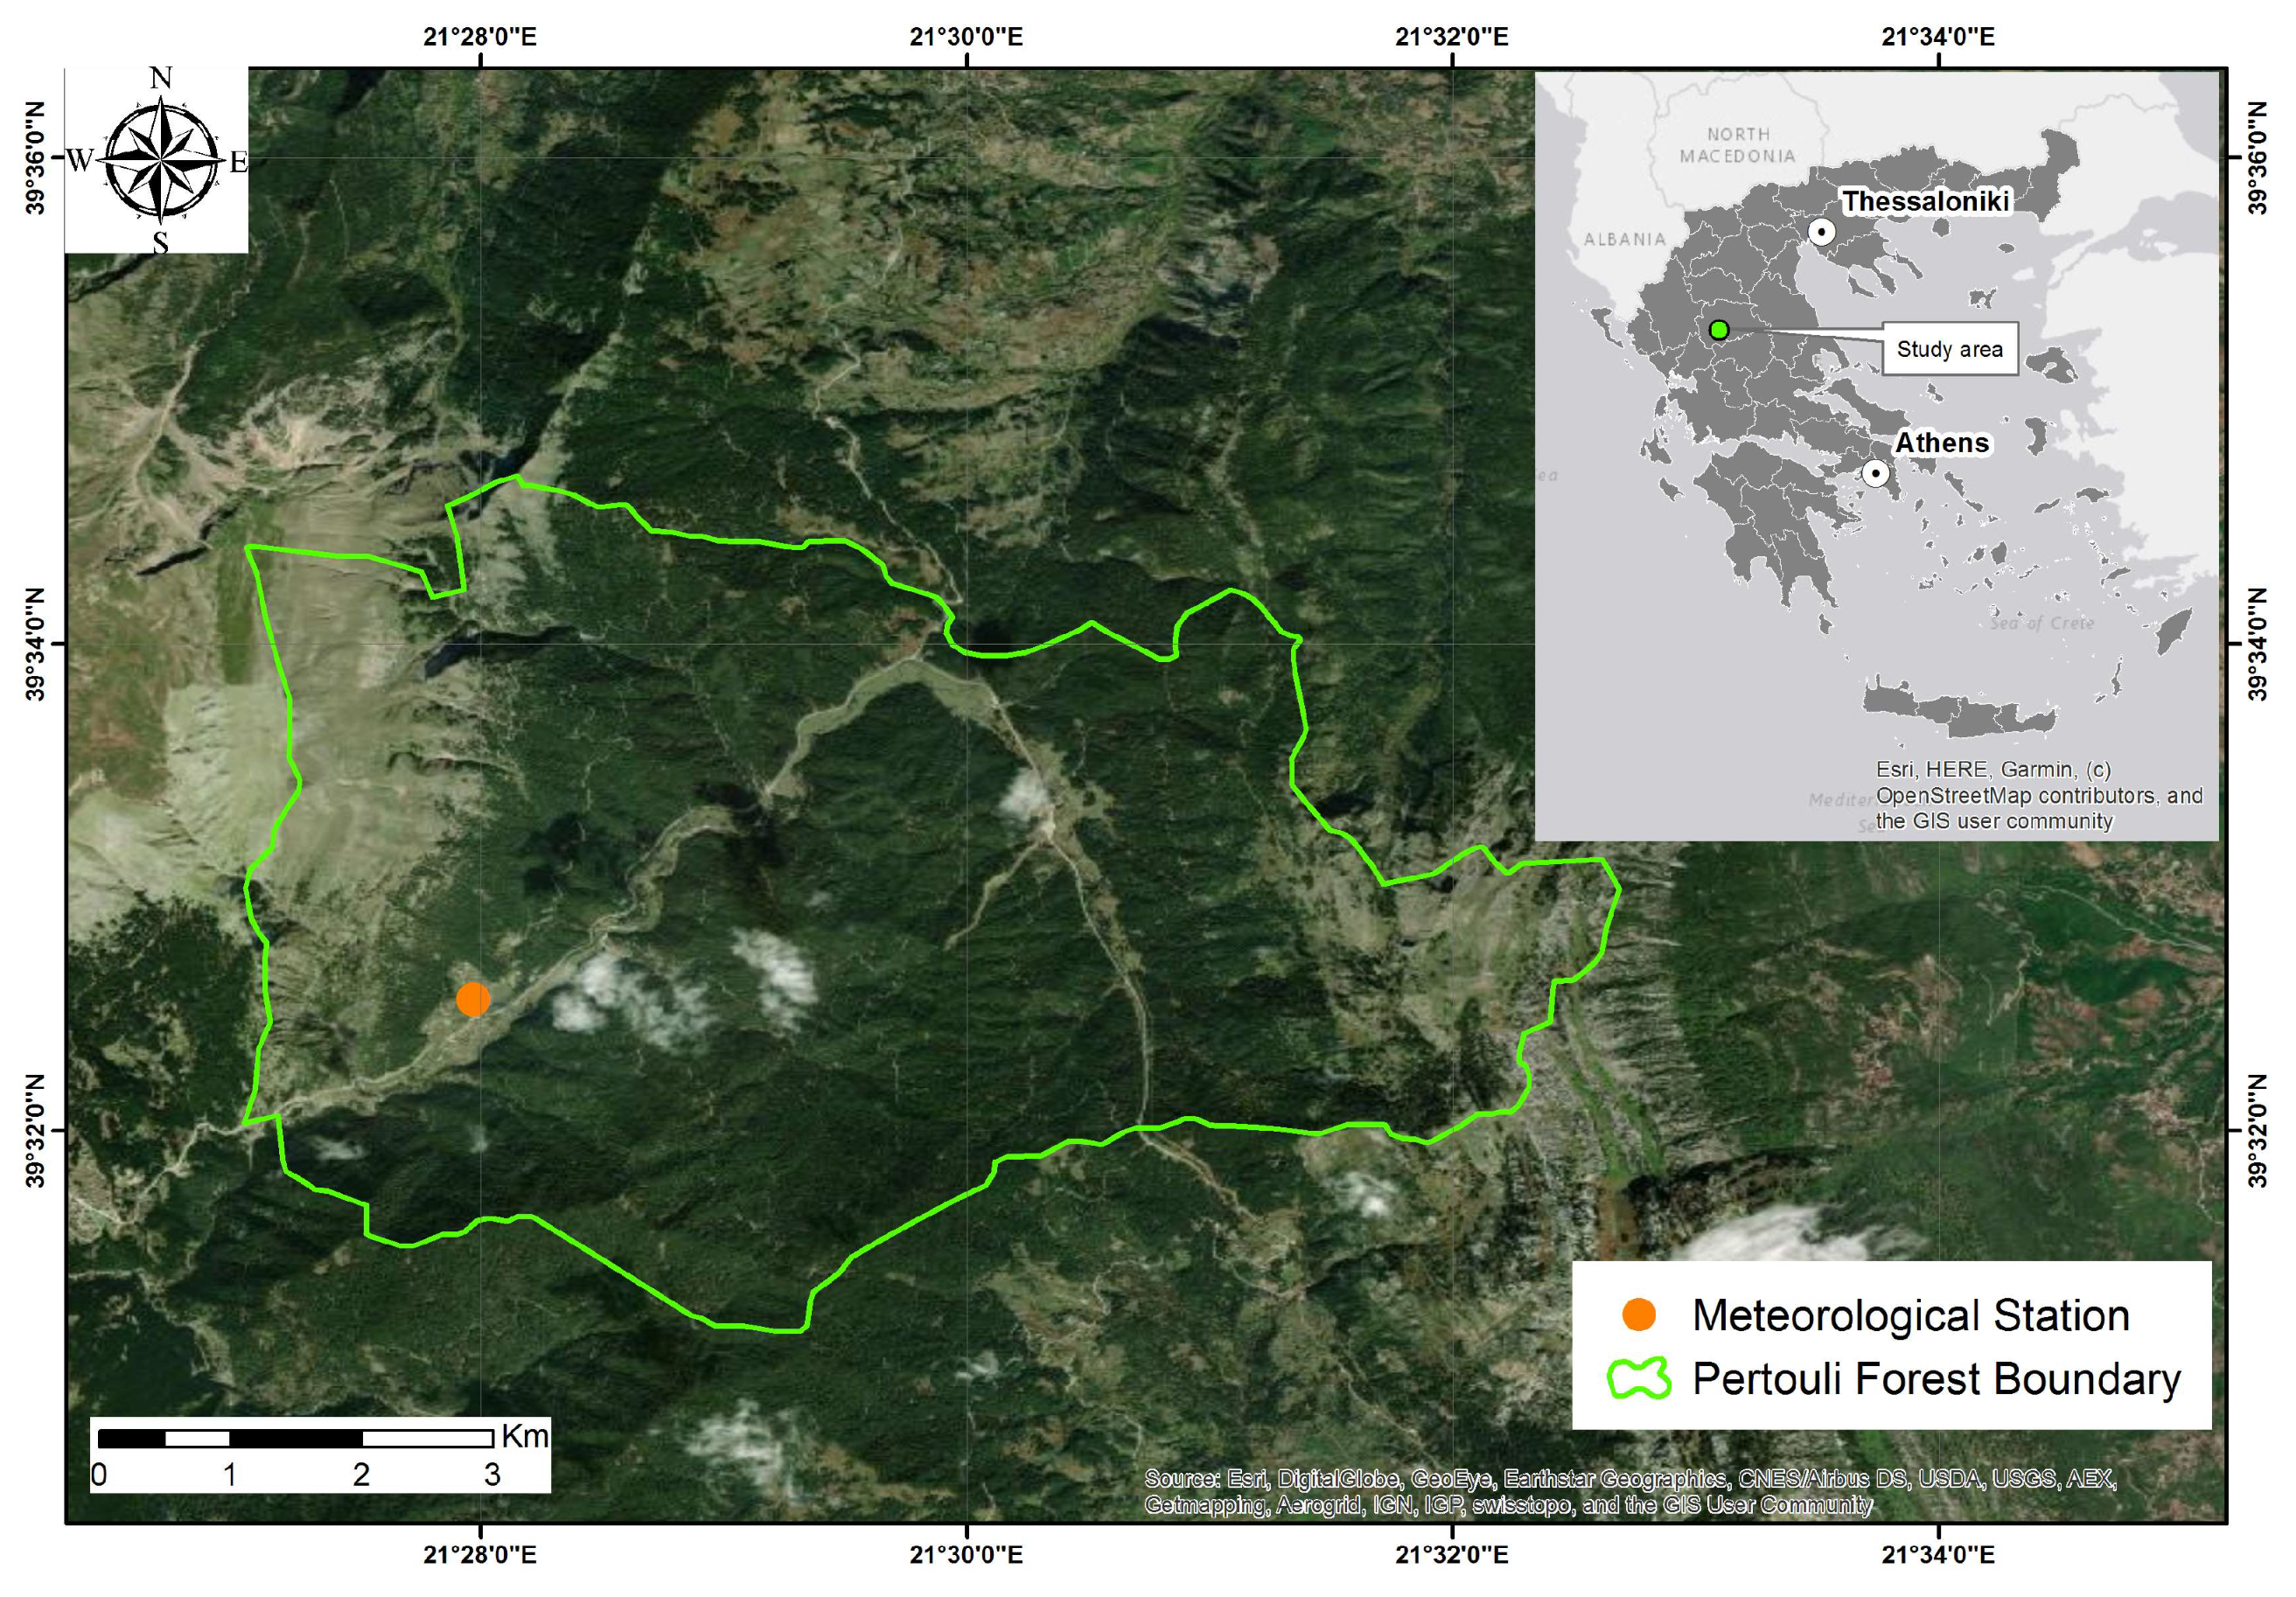
The study area is the University Forest of Pertouli, which is located in the Pindus Mountain Range of central Greece. The forest was granted to the Aristotle University of Thessaloniki in 1934 for research and educational purposes and is managed by the University Forests Administration and Management Fund (UFAMF). It covers an area of approximately 3290 ha and extends from 39°32′ E to 39°35′ E and 21°33′ N to 21°38′ N (
Figure 1). It consists mainly of pure fir stands (
Abies borisii regis), and the elevation ranges between 1100 m and 2073 m above sea level (a.s.l). The climate is characterized as transitional, Mediterranean–mid-European, with cold, rainy winters and warm, dry summers. Furthermore, the area is included in the European environmental protection network, Natura 2000, pursuant to the criteria of Directive 92/43/EEC, and is characterized as a Site of Community Importance (SCI) with code GR1440002, namely
“Kerketio Oros (Koziakas)”.
In the study area, a meteorological station has been installed (1180 m a.s.l.) since 1961 and is operated by the UFAMF. The time series are complete, without missing values, and the instruments and observing practices were common and remained consistent throughout the study period (1961–2020). Based on the long-term data recorded at the Pertouli station, the average annual precipitation is 1461.6 mm and the average mean annual air temperature is 9.1 °C.
2.2. Aridity Index
An aridity index (AI) is a numerical indicator of the degree of dryness of the climate at a given location. In this study, a well-known formula was used to estimate AI, expressed as follows [
8]:
where P is the average annual precipitation (mm) and PET is the average annual evapotranspiration (mm). The thresholds of AI values for climatic zone classification according to UNESCO [
9] are given in the following table (
Table 1).
In the present work, a parsimonious regional parametric evapotranspiration model (PET) based on a simplification of the Penman–Monteith formula was applied [
10]:
where R
a (kJ m
−2) is the extraterrestrial shortwave radiation calculated without measurements and T (°C) is the air temperature. The model has three additional parameters, a (kg kJ
−1), b (kg m
−2), and c (°C), that should be inferred from either measured or modeled calibration. It is noteworthy that the aforementioned parameterizations have some physical similarities with the original Penman–Monteith approach. This is due to the fact the overall energy term (incoming minus outgoing solar radiation) is represented by αRa and the missing aerodynamic term is represented by b, whereas (1-cT) is a rough approximation of the formula’s denominator term. T is characterized as temperature-based methods since it uses only air temperature as an explanatory variable, and extraterrestrial radiation, Ra, can be assessed directly through analytical equation [
11]. The methodology for extracting the parameters a, b, and c for setting up a temperature-based PET model based on the well-known Penman–Monteith model is presented in the paper by Tegos et al. [
12]. Interpolated parameters associated with I.D.W model were used in our study. The a, b, and c factors were set equal to 0.0000976, 0.83, and 0.02, respectively, in the case of the Pertouli area.
3. Results and Discussion
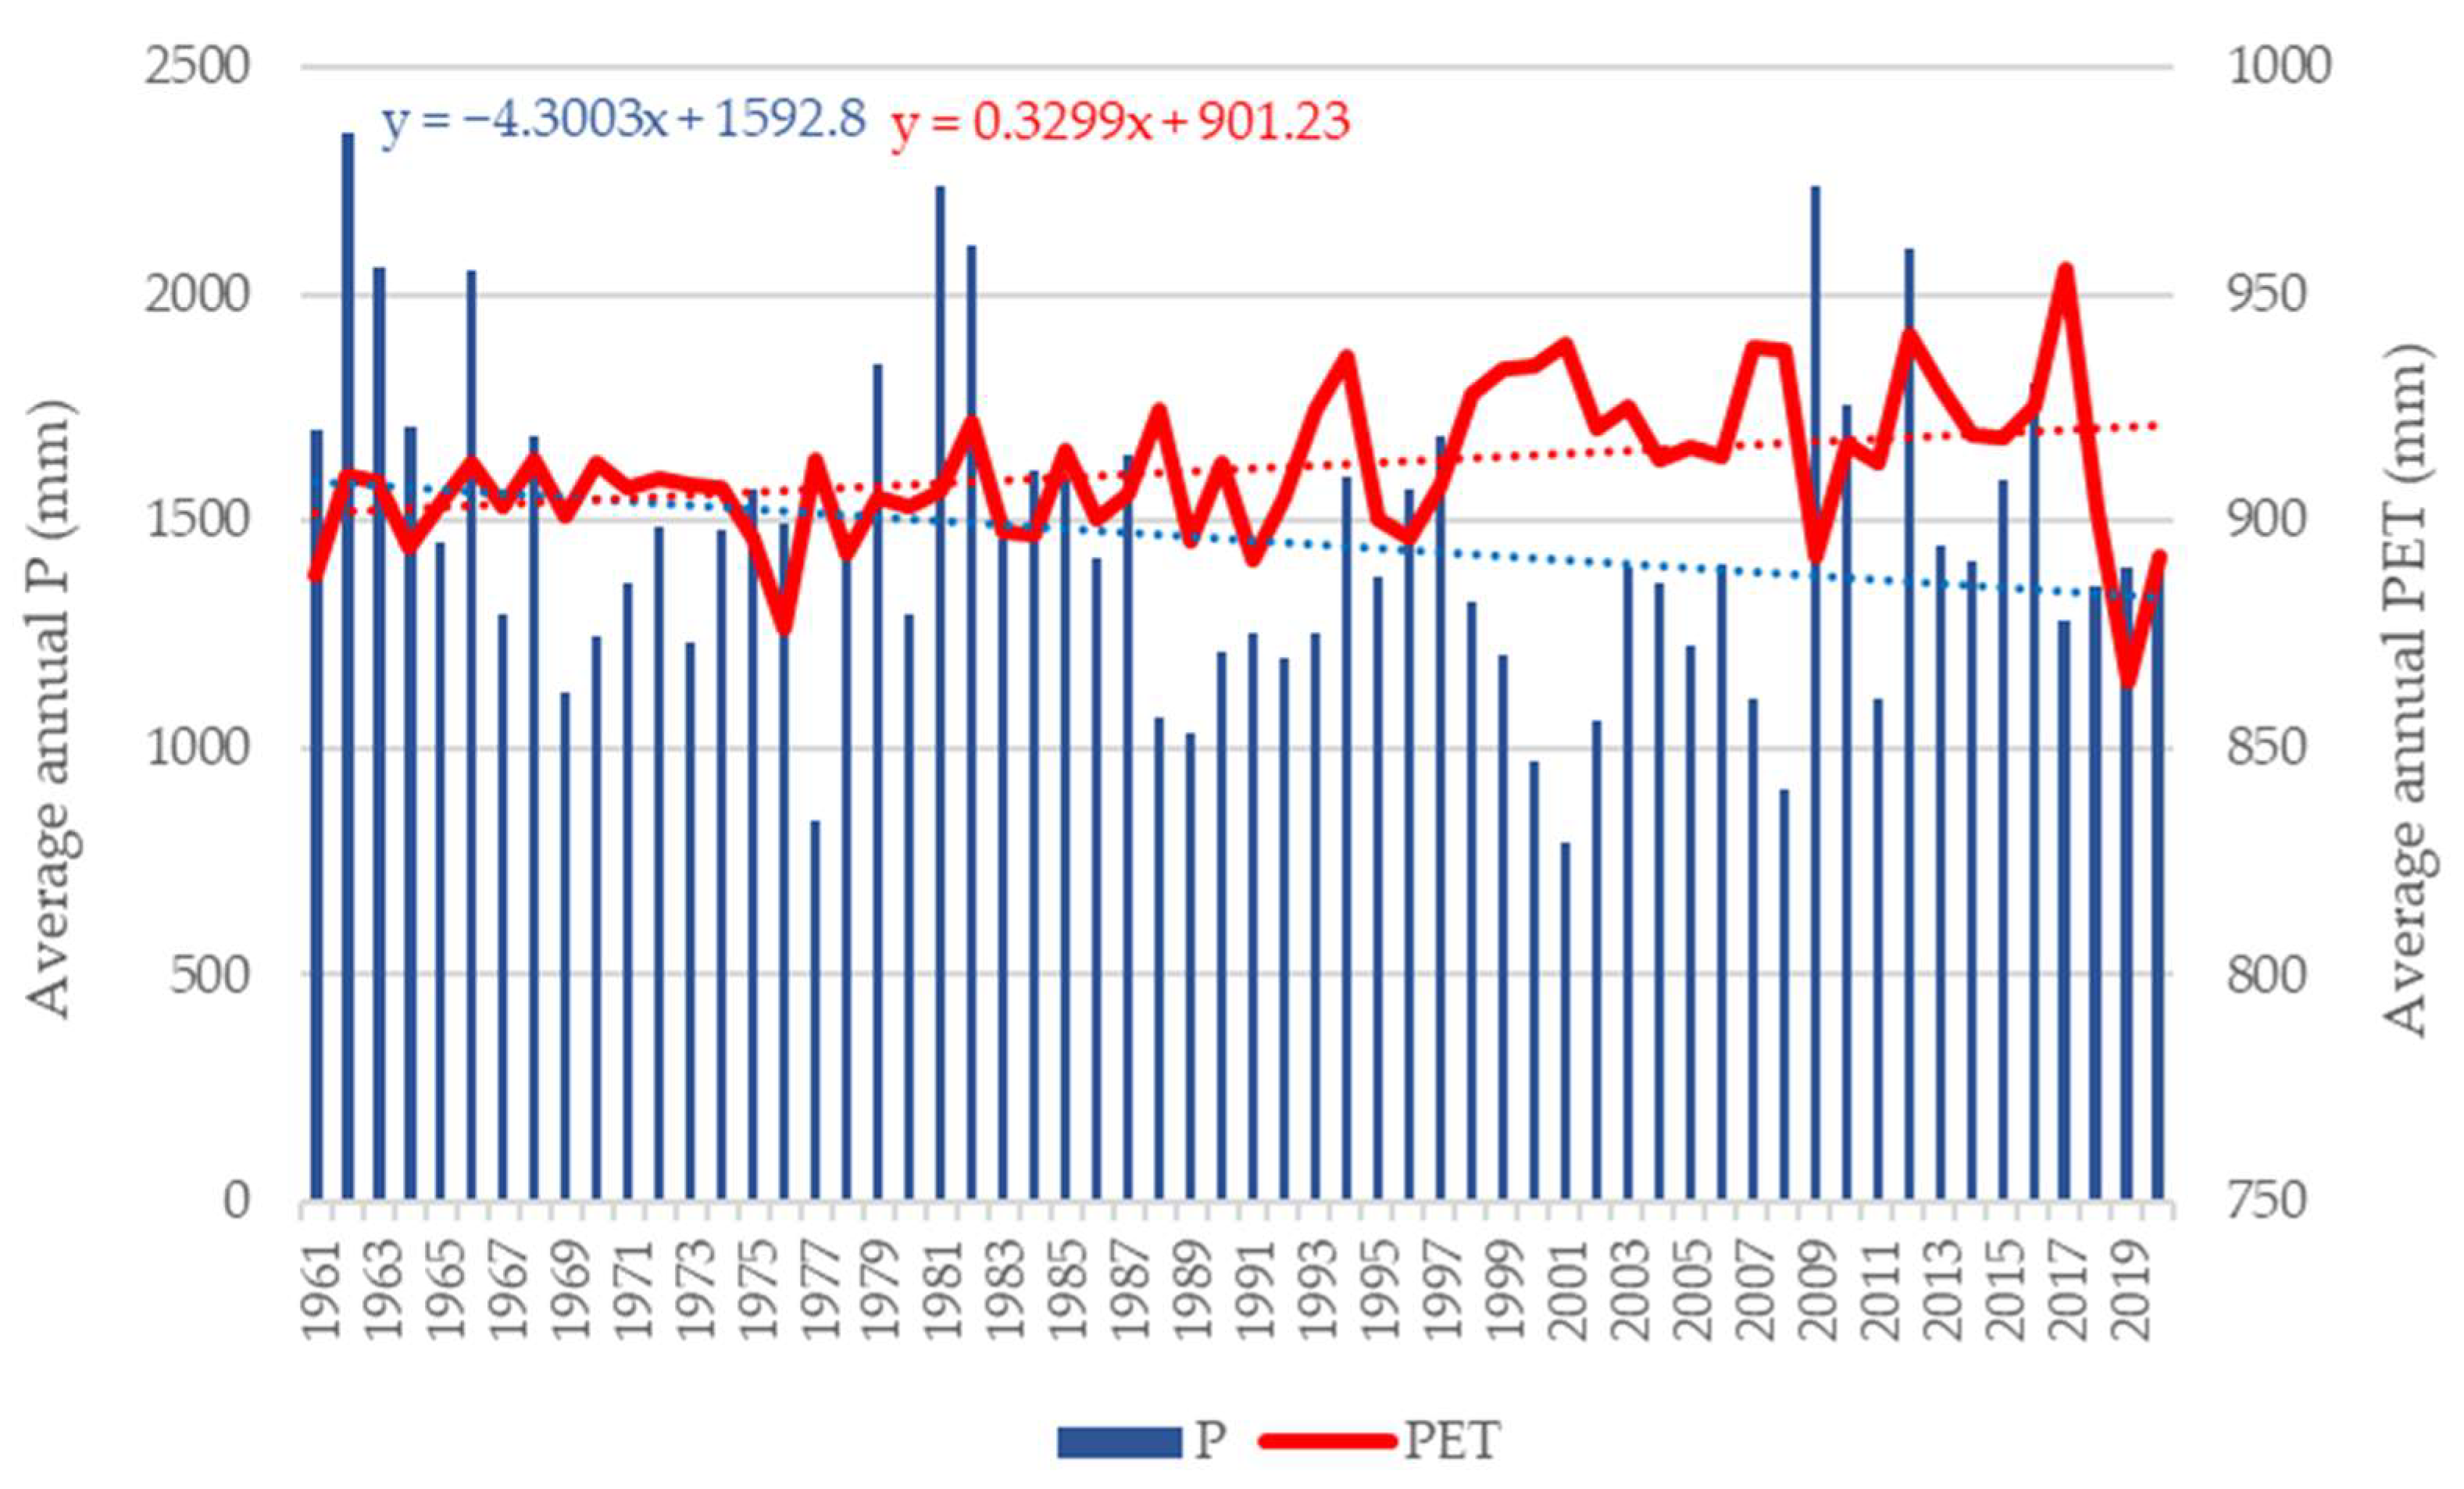
Figure 2 graphically depicts the temporal variability in P and PET parameters over the examined period (1961–2020). Our analysis reveals a decreasing trend of 4.3 mm per year in the annual precipitation rate, along with a slight increase of 0.3 mm per year in the annual PET. During the two climatic periods examined (1961–1990 and 1991–2020), an average annual precipitation decrease from 1536.5 mm to 1386.7 mm was observed, while the average annual PET remained relatively stable with estimated values of 904.8 mm and 917.7 mm, respectively. Similar findings have been obtained through studies in Greece’s mountainous regions regarding long-term climatic variables [
7,
13].
The aforementioned changes have also affected the aridity index (AI) values, presenting a minor decrease of 8% during the second period compared with the first. In particular, the AI was determined to be 1.70 for the time period between 1961 and 1990, and 1.56 for the period from 1991 to 2020. Nevertheless, the climate in the region is classified as ‘Humid’ and has remained the same during the examined climatic periods of the last sixty years. These results are in line with the findings by Tsiros et al. [
13] for the wider area, which also address issues with the AI variability using data from mountainous meteorological stations over the last century. However, the previous study reports changes from the ‘Humid’ class to the ‘Sub-humid’ class in parts of continental Greece, in eastern Crete, and in mountainous areas.
4. Conclusions
This study examines aridity changes at a fir forest site in central Greece during two distinct climatic periods: 1961–1990 and 1991–2020. The aridity index (AI) consists of two components: precipitation and PET. In many studies, the Thornthwaite PET method is used to calculate PET. However, our proposed approach uses a simplified version of the Penman–Monteith equation instead. This approach allows for more accurate PET calculations. Subsequently, we classified the climatic aridity zones using UNESCO’s threshold values.
The analysis revealed that the aridity index (AI) values exhibited only slight variations between the two climatic periods, reflecting the minor changes in both precipitation and PET. As a result, the climate remained classified as humid and unchanged. Trends and changes in the AI values have important implications on forest growth, species diversity, and treeline shift in forest ecosystems. Moreover, further research is needed to fully understand and address these impacts on biodiversity and ecosystem services.
Future research can focus on investigating the changes in AI values in forest ecosystems with varying geomorphological and forest-type attributes at a national scale. Additionally, changes in AI values under future climate conditions should be considered to inform adaptive and resilient forest management strategies in the context of climate change.
Author Contributions
Conceptualization, S.S. and A.T.; methodology, S.S. and A.T.; software, S.S. and V.A; formal analysis, S.S.; investigation, S.S.; writing—original draft preparation, S.S.; writing—review and editing, S.S., A.T., and V.A.; visualization, S.S. All authors have read and agreed to the published version of the manuscript.
Funding
This research received no external funding.
Data Availability Statement
The data that support the findings of this study are available from the corresponding author upon reasonable request.
Conflicts of Interest
The authors declare no conflict of interest.
References
- Grammatikopoulou, I.; Vačkářová, D. The value of forest ecosystem services: A meta-analysis at the European scale and application to national ecosystem accounting. Ecosyst. Serv. 2021, 48, 101262. [Google Scholar] [CrossRef]
- IPCC. Climate change 2013: The physical science basis. In Contribution of Working Group I to the Fifth Assessment Report of the Intergovernmental Panel on Climate Change; Cambridge University Press: Cambridge, UK, 2013. [Google Scholar]
- Keenan, R.J. Climate change impacts and adaptation in forest management: A review. Ann. For. Sci. 2015, 72, 145–167. [Google Scholar] [CrossRef]
- Tegos, A.; Stefanidis, S.; Cody, J.; Koutsoyiannis, D. On the Sensitivity of Standardized-Precipitation-Evapotranspiration and Aridity Indexes Using Alternative Potential Evapotranspiration Models. Hydrology 2023, 10, 64. [Google Scholar] [CrossRef]
- Allen, R.G.; Pereira, L.S.; Pereira, L.S.; Raes, D.; Smith, M. Crop Evapotranspiration-Guidelines for Computing Crop Water Requirements-FAO Irrigation and Drainage Paper 56; FAO: Rome, Italy, 1998; Volume 300, p. D05109. [Google Scholar]
- Proutsos, N.D.; Tsiros, I.X.; Nastos, P.; Tsaousidis, A. A note on some uncertainties associated with Thornthwaite’s aridity index introduced by using different potential evapotranspiration methods. Atmos. Res. 2021, 260, 105727. [Google Scholar] [CrossRef]
- Tsiros, I.X.; Nastos, P.; Proutsos, N.D.; Tsaousidis, A. Variability of the aridity index and related drought parameters in Greece using climatological data over the last century (1900–1997). Atmos. Res. 2020, 240, 104914. [Google Scholar] [CrossRef]
- Food and Agriculture Organization (FAO). Forest Resources Assessment 1990 Tropical Countries; FAO: Rome, Italy, 1993. [Google Scholar]
- UNESCO. Map of the world distribution of arid regions: Explanatory note. In MAP Technical Notes 7; UNESCO: Paris, France, 1979; p. 54. [Google Scholar]
- Tegos, A.; Malamos, N.; Koutsoyiannis, D. A parsimonious regional parametric evapotranspiration model based on a simplification of the Penman–Monteith formula. J. Hydrol. 2015, 524, 708–717. [Google Scholar] [CrossRef]
- Tegos, A.; Malamos, N.; Efstratiadis, A.; Tsoukalas, I.; Karanasios, A.; Koutsoyiannis, D. Parametric modelling of potential evapotranspiration: A global survey. Water 2017, 9, 795. [Google Scholar] [CrossRef]
- Tegos, A.; Efstratiadis, A.; Koutsoyiannis, D. A Parametric Model for Potential Evapotranspiration Estimation Based on a Simplified Formulation of the Penman-Monteith Equation, Evapotranspiration—An Overview; Alexandris, S.G., Ed.; InTech: Rijeka, Croatia, 2013; Available online: https://www.intechopen.com/chapters/44363 (accessed on 3 July 2023).
- Proutsos, N.D.; Solomou, A.D.; Koulelis, P.P.; Bourletsikas, A.; Chatzipavlis, N.E.; Tigkas, D. Detecting changes in annual precipitation trends during the last two climatic periods (1955–1984 and 1985–2018) in Nestos River basin, N. Greece. In Proceedings of the 10th International Conference on Information and Communication Technologies in Agriculture, Food and Environment, HAICTA, Athens, Greece, 22–25 September 2022. [Google Scholar]
| Disclaimer/Publisher’s Note: The statements, opinions and data contained in all publications are solely those of the individual author(s) and contributor(s) and not of MDPI and/or the editor(s). MDPI and/or the editor(s) disclaim responsibility for any injury to people or property resulting from any ideas, methods, instructions or products referred to in the content. |
© 2023 by the authors. Licensee MDPI, Basel, Switzerland. This article is an open access article distributed under the terms and conditions of the Creative Commons Attribution (CC BY) license (https://creativecommons.org/licenses/by/4.0/).


