Proceeding Paper

Design and Development of Information and Computational System for Energy Facilities’ Impact Assessment on Environment †

by
Vladimir R. Kuzmin
*,
Tatyana N. Vorozhtsova
and
Liudmila V. Massel
Melentiev Energy Systems Institute of the Siberian Branch of the RAS, Lermontova Str. 130, 664058 Irkutsk, Russia
*
Author to whom correspondence should be addressed.
Presented at the 15th International Conference “Intelligent Systems” (INTELS’22), Moscow, Russia, 14–16 December 2022.
Eng. Proc. 2023, 33(1), 21; https://doi.org/10.3390/engproc2023033021
Published: 13 June 2023
(This article belongs to the Proceedings of 15th International Conference “Intelligent Systems” (INTELS’22))

Abstract

:
In this article we consider authors’ information and computational system for energy facilities’ impact assessment on the environment. The necessity of such assessments and development of this system is substantiated. We developed this system as a Web application using the agent-service approach. To develop a database for the system, we utilized ontological engineering of energy and ecology. For assessments, we developed a set of information susbsystems that use approved regulatory methods. Our system can be used for assessment of the impact of both existing and planning energy facilities and also for planning measures to reduce the harmful impact of such facilities. We also performed a set of computational experiments in order to test the developed system. Experiments have shown the correctness of the methods used, and the results of one of them are presented in the article.

1. Introduction

A necessity of impact assessment and requirement for a reduction in the impact of polluting (harmful) substances from industrial facilities (including energy facilities) on the environment are gaining more and more attention in the world. Currently, in the Russian Federation, the following have been approved and taken effect: “Energy strategy of the Russian Federation until 2035” [1], the national project “Ecology” [2], and “Strategy for socio-economic development of the Russian Federation with low greenhouse gas emissions until 2050” [3]. These documents envisage, among other things, a shift to environmentally friendly and resource-saving energy, the rational use of natural resources, and a reduction in dangerous polluting substances’ emissions [4,5]. Various teams, both Russian [6,7] and foreign [8,9], perform research on assessing the impact of industrial facilities on the environment. To carry out impact assessments, the results of measurements of environmental elements (air, water, soil) are used, as well as monitoring and statistical information: state reports and reports of industrial facilities. If that information is not available, then the assessment of the impact of pollutants on the environment is carried out using officially approved regulatory methods, such as [10,11]. However, these methods are used separately and we did not find information about attempts to integrate them. Methods also require a significant amount of information about object of study, starting from the technical parameters of the facility (brand and model of the boiler, characteristics of the used fuel) and ending with information about the weather in the area where the facility is located (wind speed and direction, air temperature) and terrain data. Research on the impact assessment of energy facilities on the environment is interdisciplinary, as it requires the involvement of experts from various subject areas, such as energy, ecology, and economics (to assess the economic feasibility of measures to reduce the harmful effects of pollutants). When conducting research, it will also be advisable to be able not only to assess the current state of environmental pollution, but also to provide an opportunity to evaluate the effectiveness of measures to reduce the harmful effects of energy facilities and plan the placement of new facilities.
Based on the above, it is required to develop an information and computational system (ICS), which will allow for a comprehensive assessment of the impact of energy facilities on the environment and will include decision support tools to reduce the harmful effects of these facilities.

2. Methods and Tools Used for Development

To solve the problem mentioned in the introduction, we developed ICS WICS (Web-oriented Information and Computational System). ICS is based on the authors’ methodical approach for impact assessment of energy facilities on the environment. A detailed description of this approach was given in [12]. ICS allows us to
  • assess the amount of pollutants from energy facilities and dispersion of these pollutants in the air using approved regulatory methods [10,11,13,14];
  • assess economical damage [15,16];
  • work with the results of analysis of snow samples;
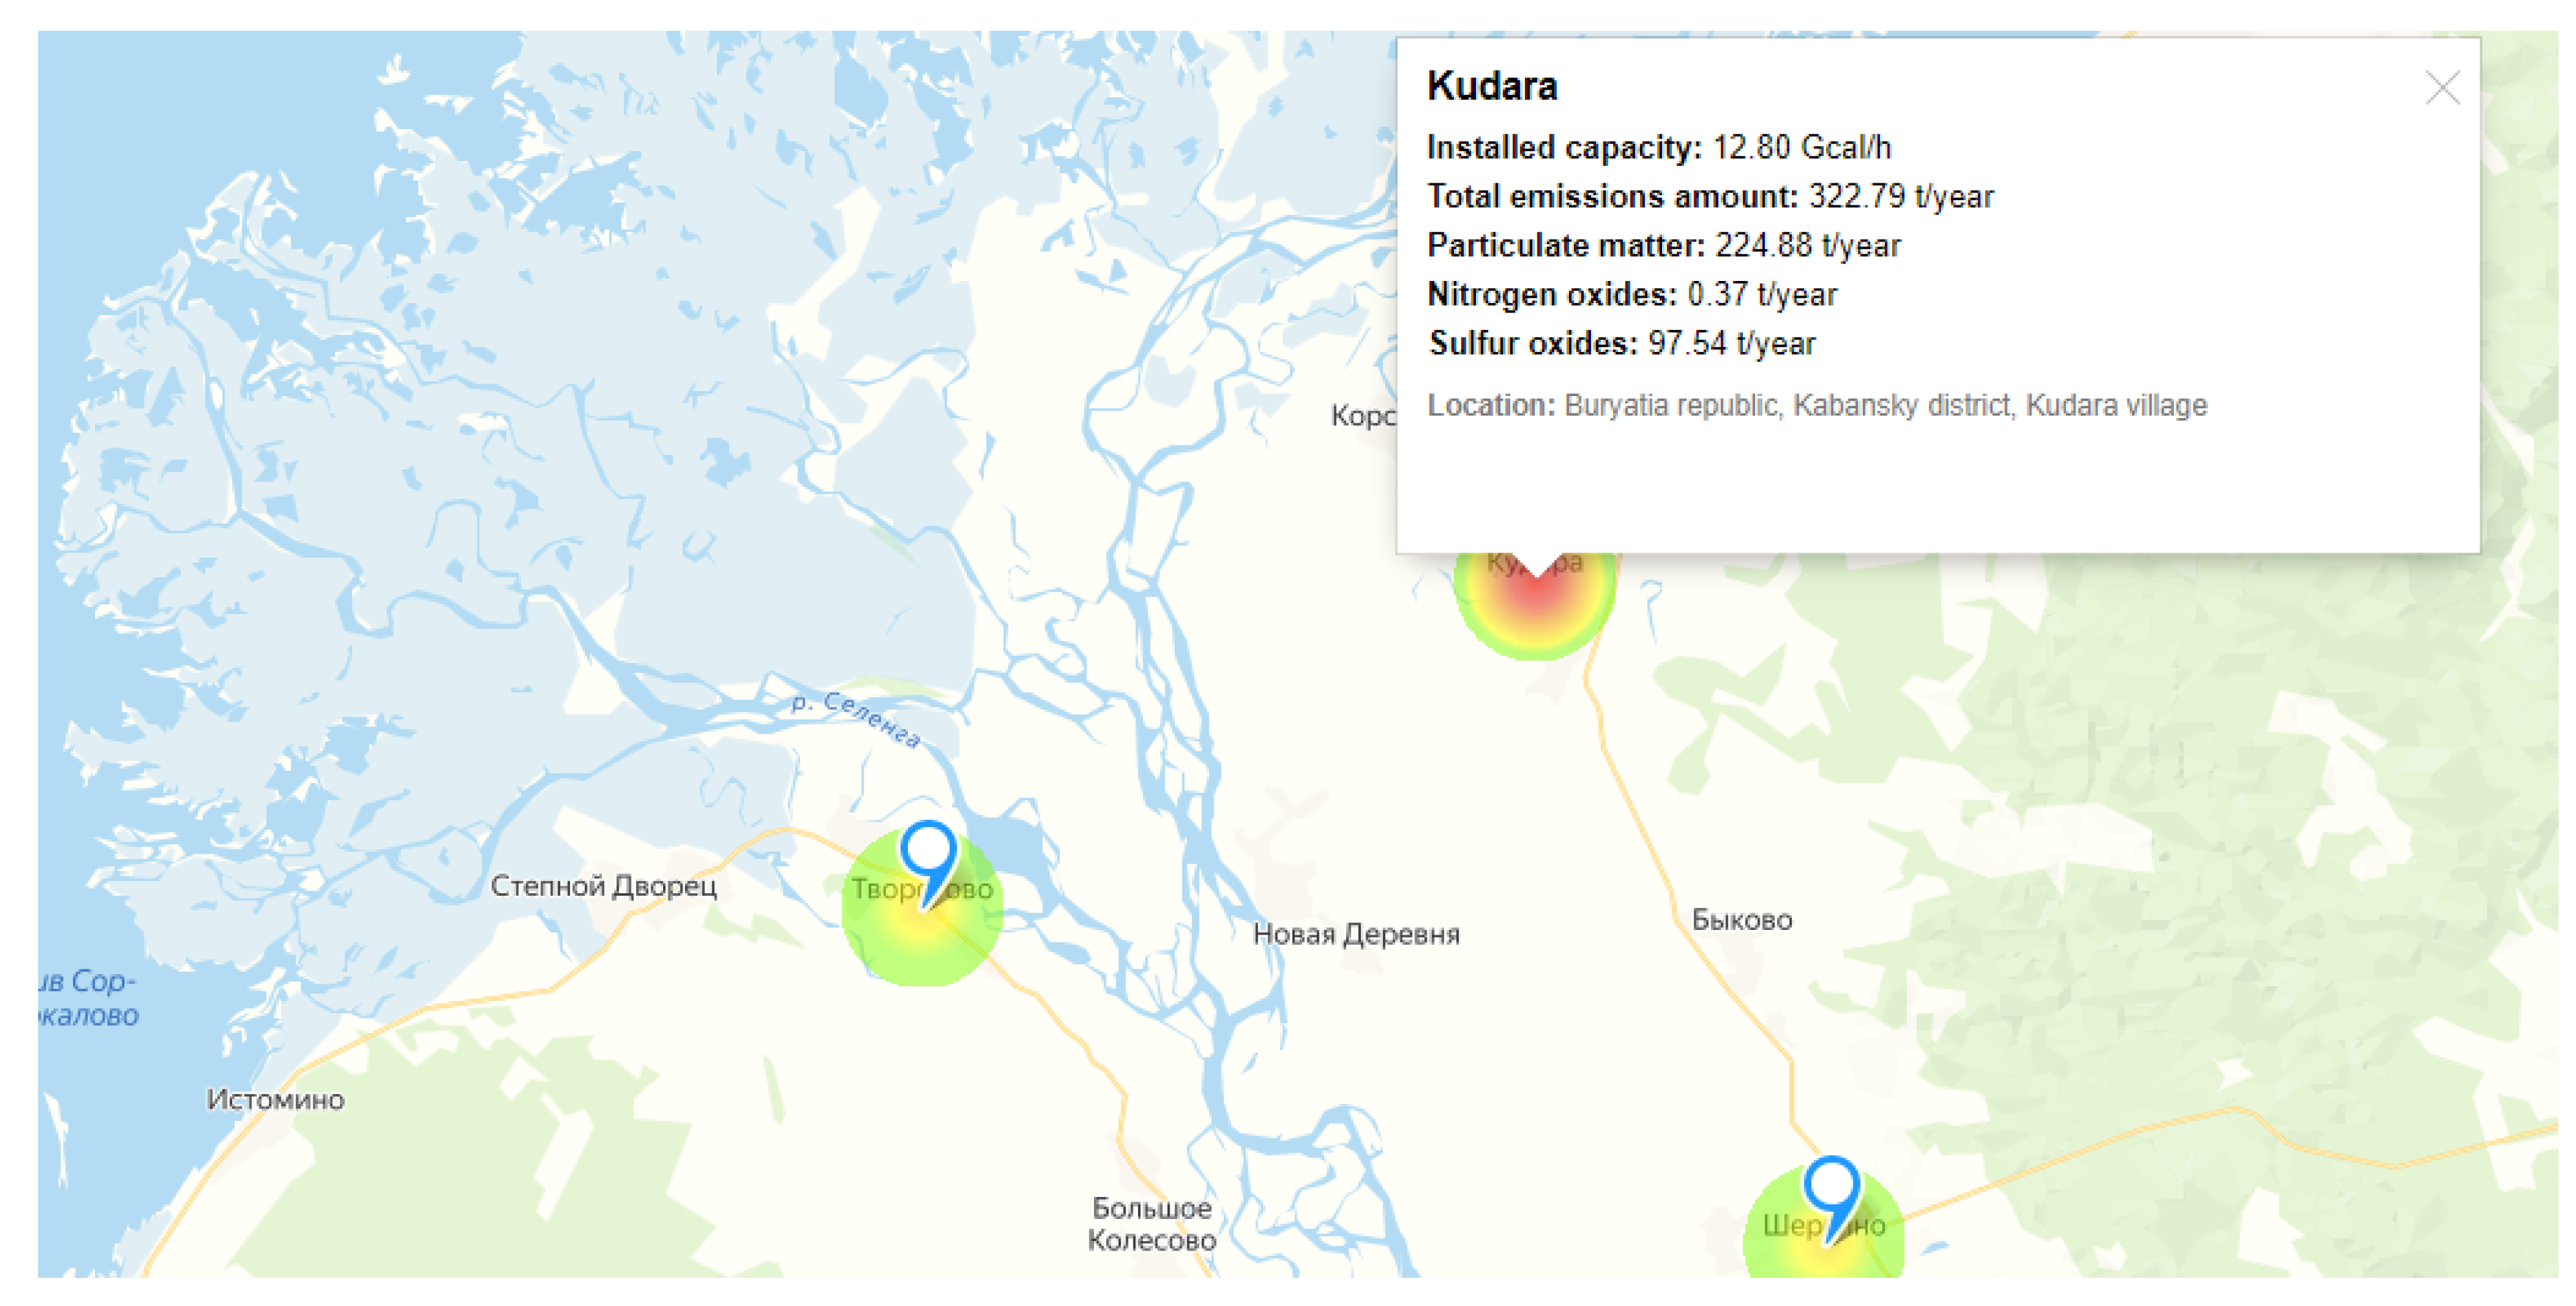
  • visualize results.
The components responsible for work with the mentioned methods will be discussed in the next section.
While developing ICS, we decided to develop it as a multiagent system (or MAS). The concept of MAS is to increase system’s performance (speed of processing and output results’ quality) by distributing tasks [17]. In [18], a multiagent system is considered as a network of asynchronous objects that jointly solve problems that cannot be solved by a single agent. Thus, the system consists of decentralized autonomously operating elements (or agents). To develop ICS as an MAS, we used the authors’ method based on the agent-service approach, which was given in a previous paper [19]. In this paper, we also considered information and the analytical system WIS, which is a conceptual prototype of the ICS described in this article. The main steps of the method are
  • Give a description of the system, taking into account the characteristics of the problem. For this it is necessary to:
    -
    Determine the purpose of the ICS;
    -
    Define the set of tasks { T } that the ICS must be able to solve;
    -
    Define the function set of the ICS { F } ;
    -
    Create a list of agents { A } of the ICS based on the { F } ;
    -
    Develop set of basic components { C B } .
  • Develop agent scenarios:
    -
    Define agents’ call order { P A } ;
    -
    Develop agent call scripts { S A } ;
    -
    Give a description of the developed scenarios using event models { E S } .
  • Develop an architecture of the ICS;
  • Design the ICS;
  • Implement the ICS.
In this article, we will not consider the second step because the description of their development requires an additional article. The purpose of the ICS, tasks, and functions were described in the introduction and the beginning of this section. The architecture and implementation of the ICS will be considered in the next section.
To store the information necessary for conducting research and research results, a database (DB) was developed, which is also used to store the knowledge base. The studies themselves require, as mentioned in the introduction, a significant amount of data and are interdisciplinary. Therefore, when formalizing knowledge in the considered subject areas, inaccuracies may occur, leading to the construction of incorrect models. Therefore, to formalize knowledge about the subject areas under consideration, ontological engineering of the considered subject areas was performed [20]. We also proposed a database design methodology for assessing environmental pollution by energy facilities based on ontologies. The main steps of the method are:
  • Determine the energy facilities that will be assessed and establish their internal hierarchy based on the subsystem of ontologies of the energy facility;
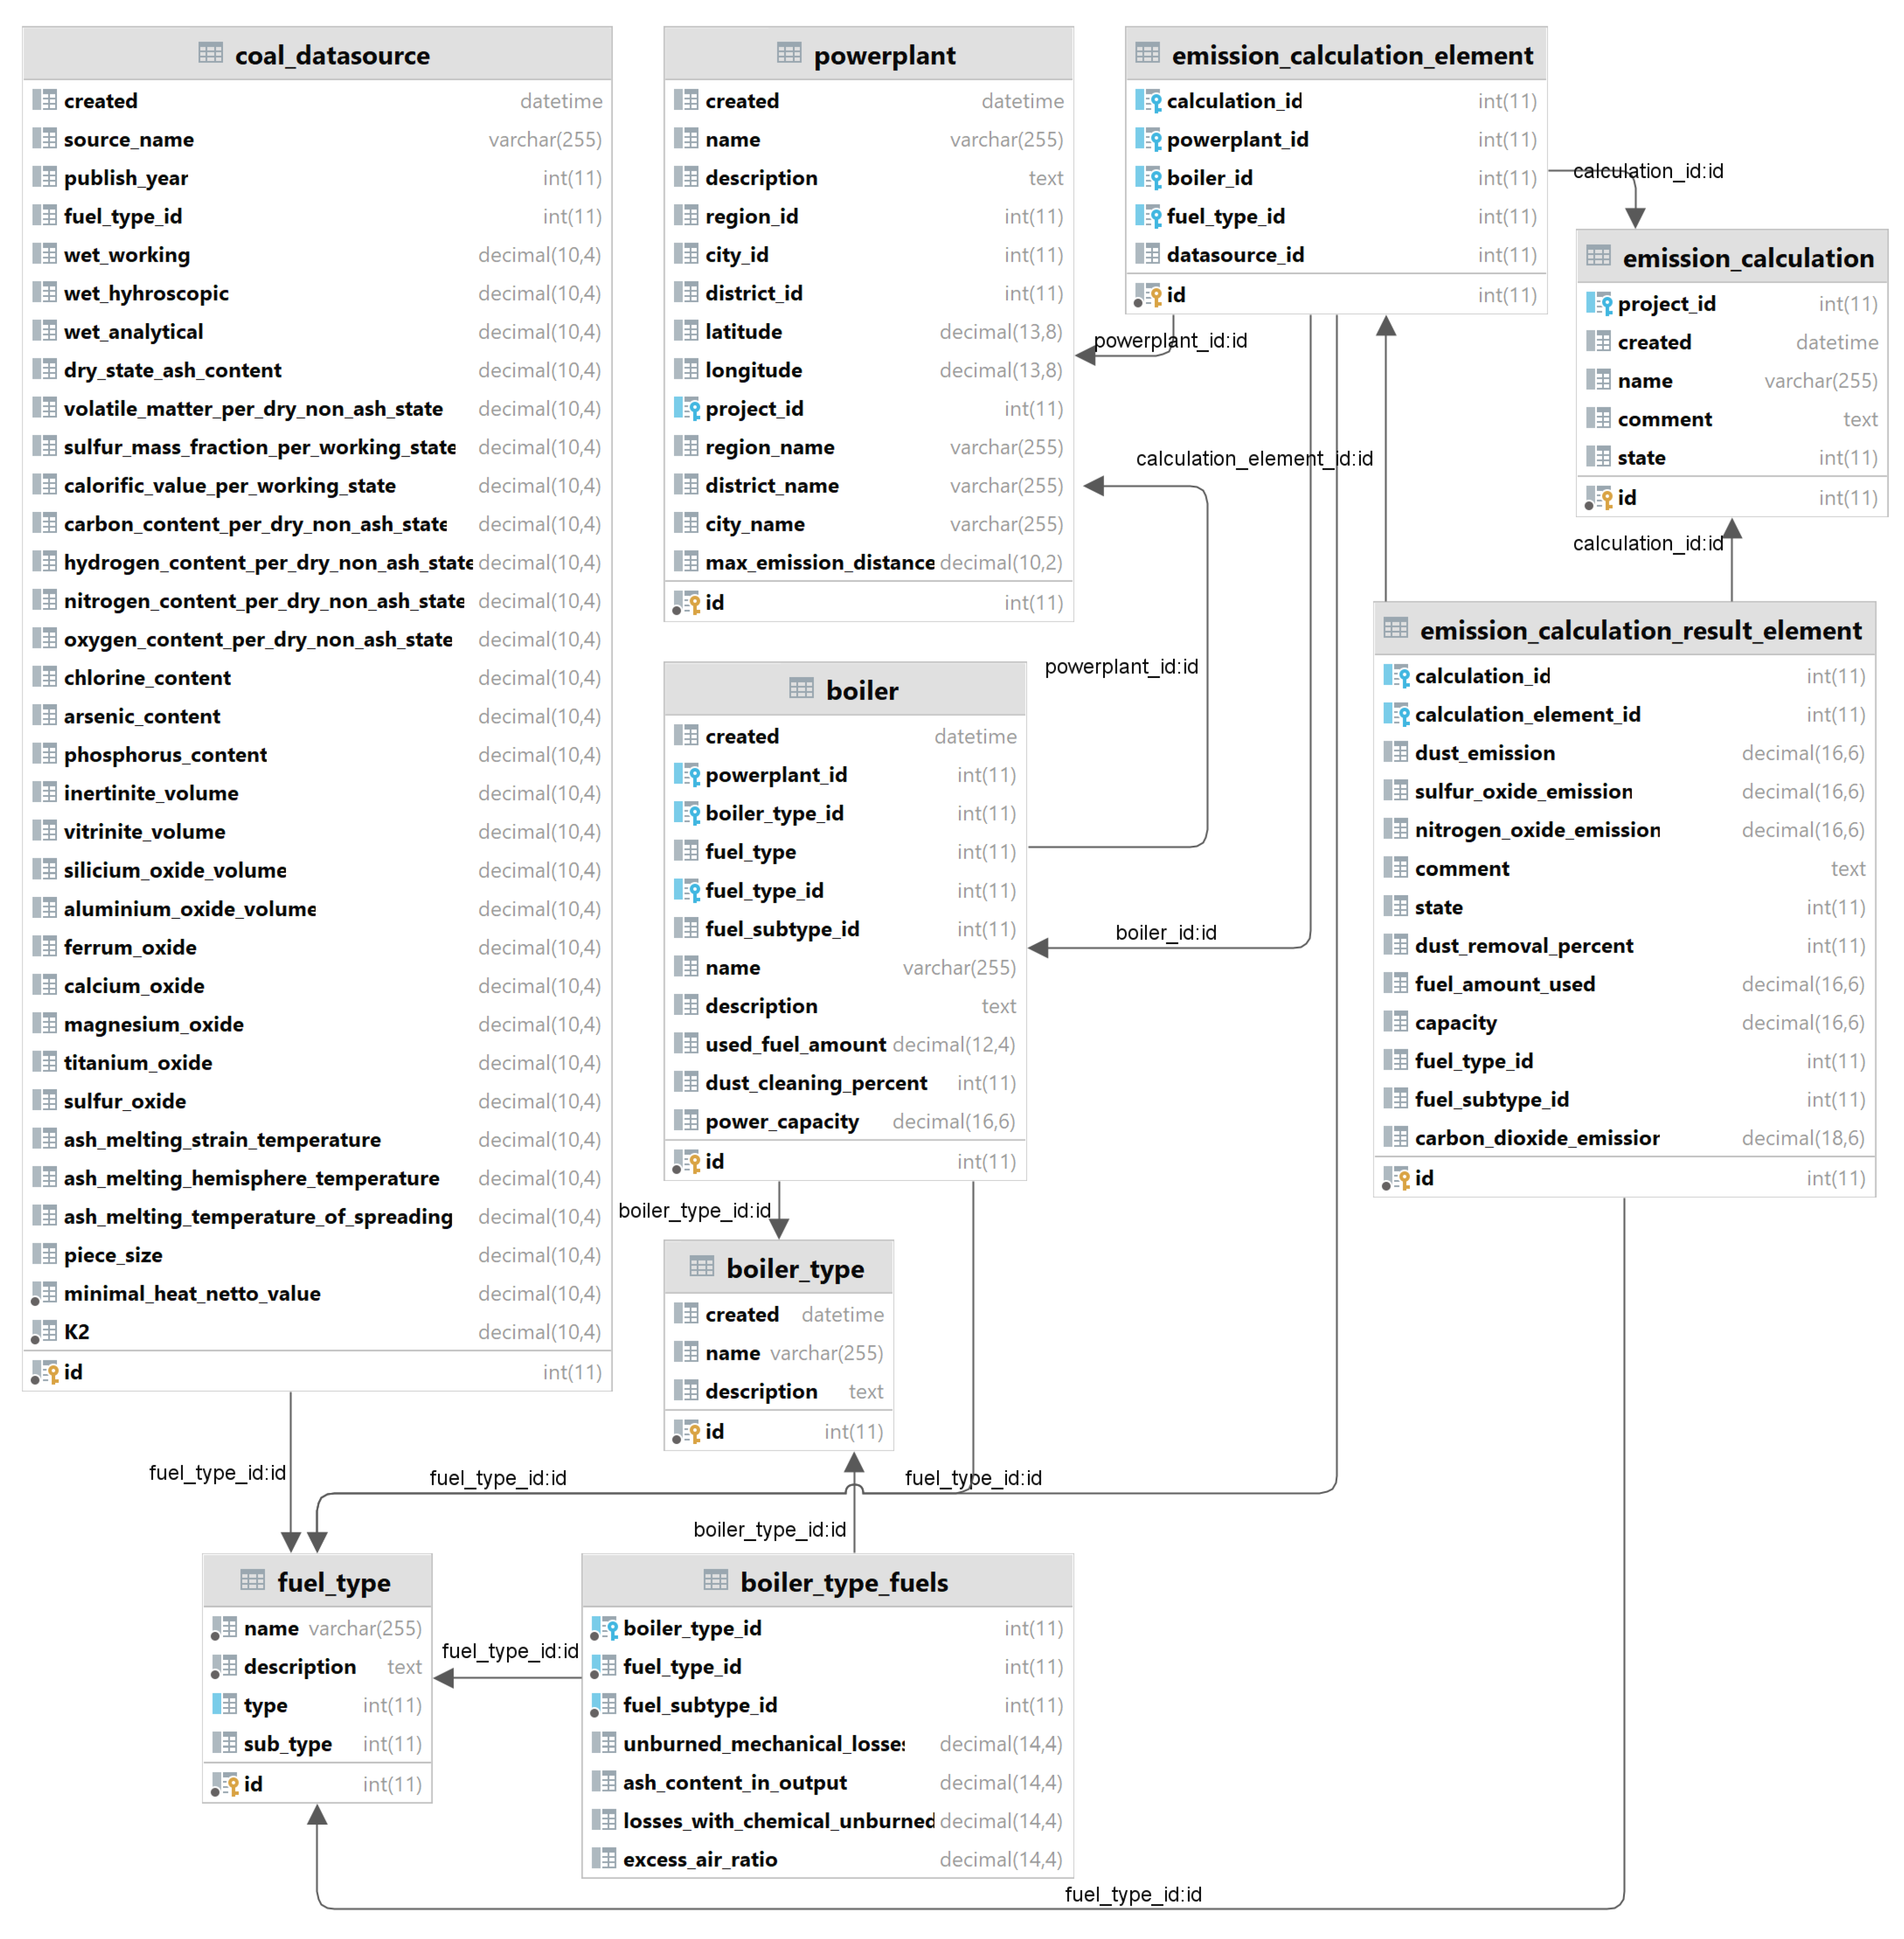
  • Create infological data models based on ontologies;
  • Create appropriate tables in the database for each object in the hierarchy;
  • Determine the characteristics of the object of assessment and create fields in the corresponding tables;
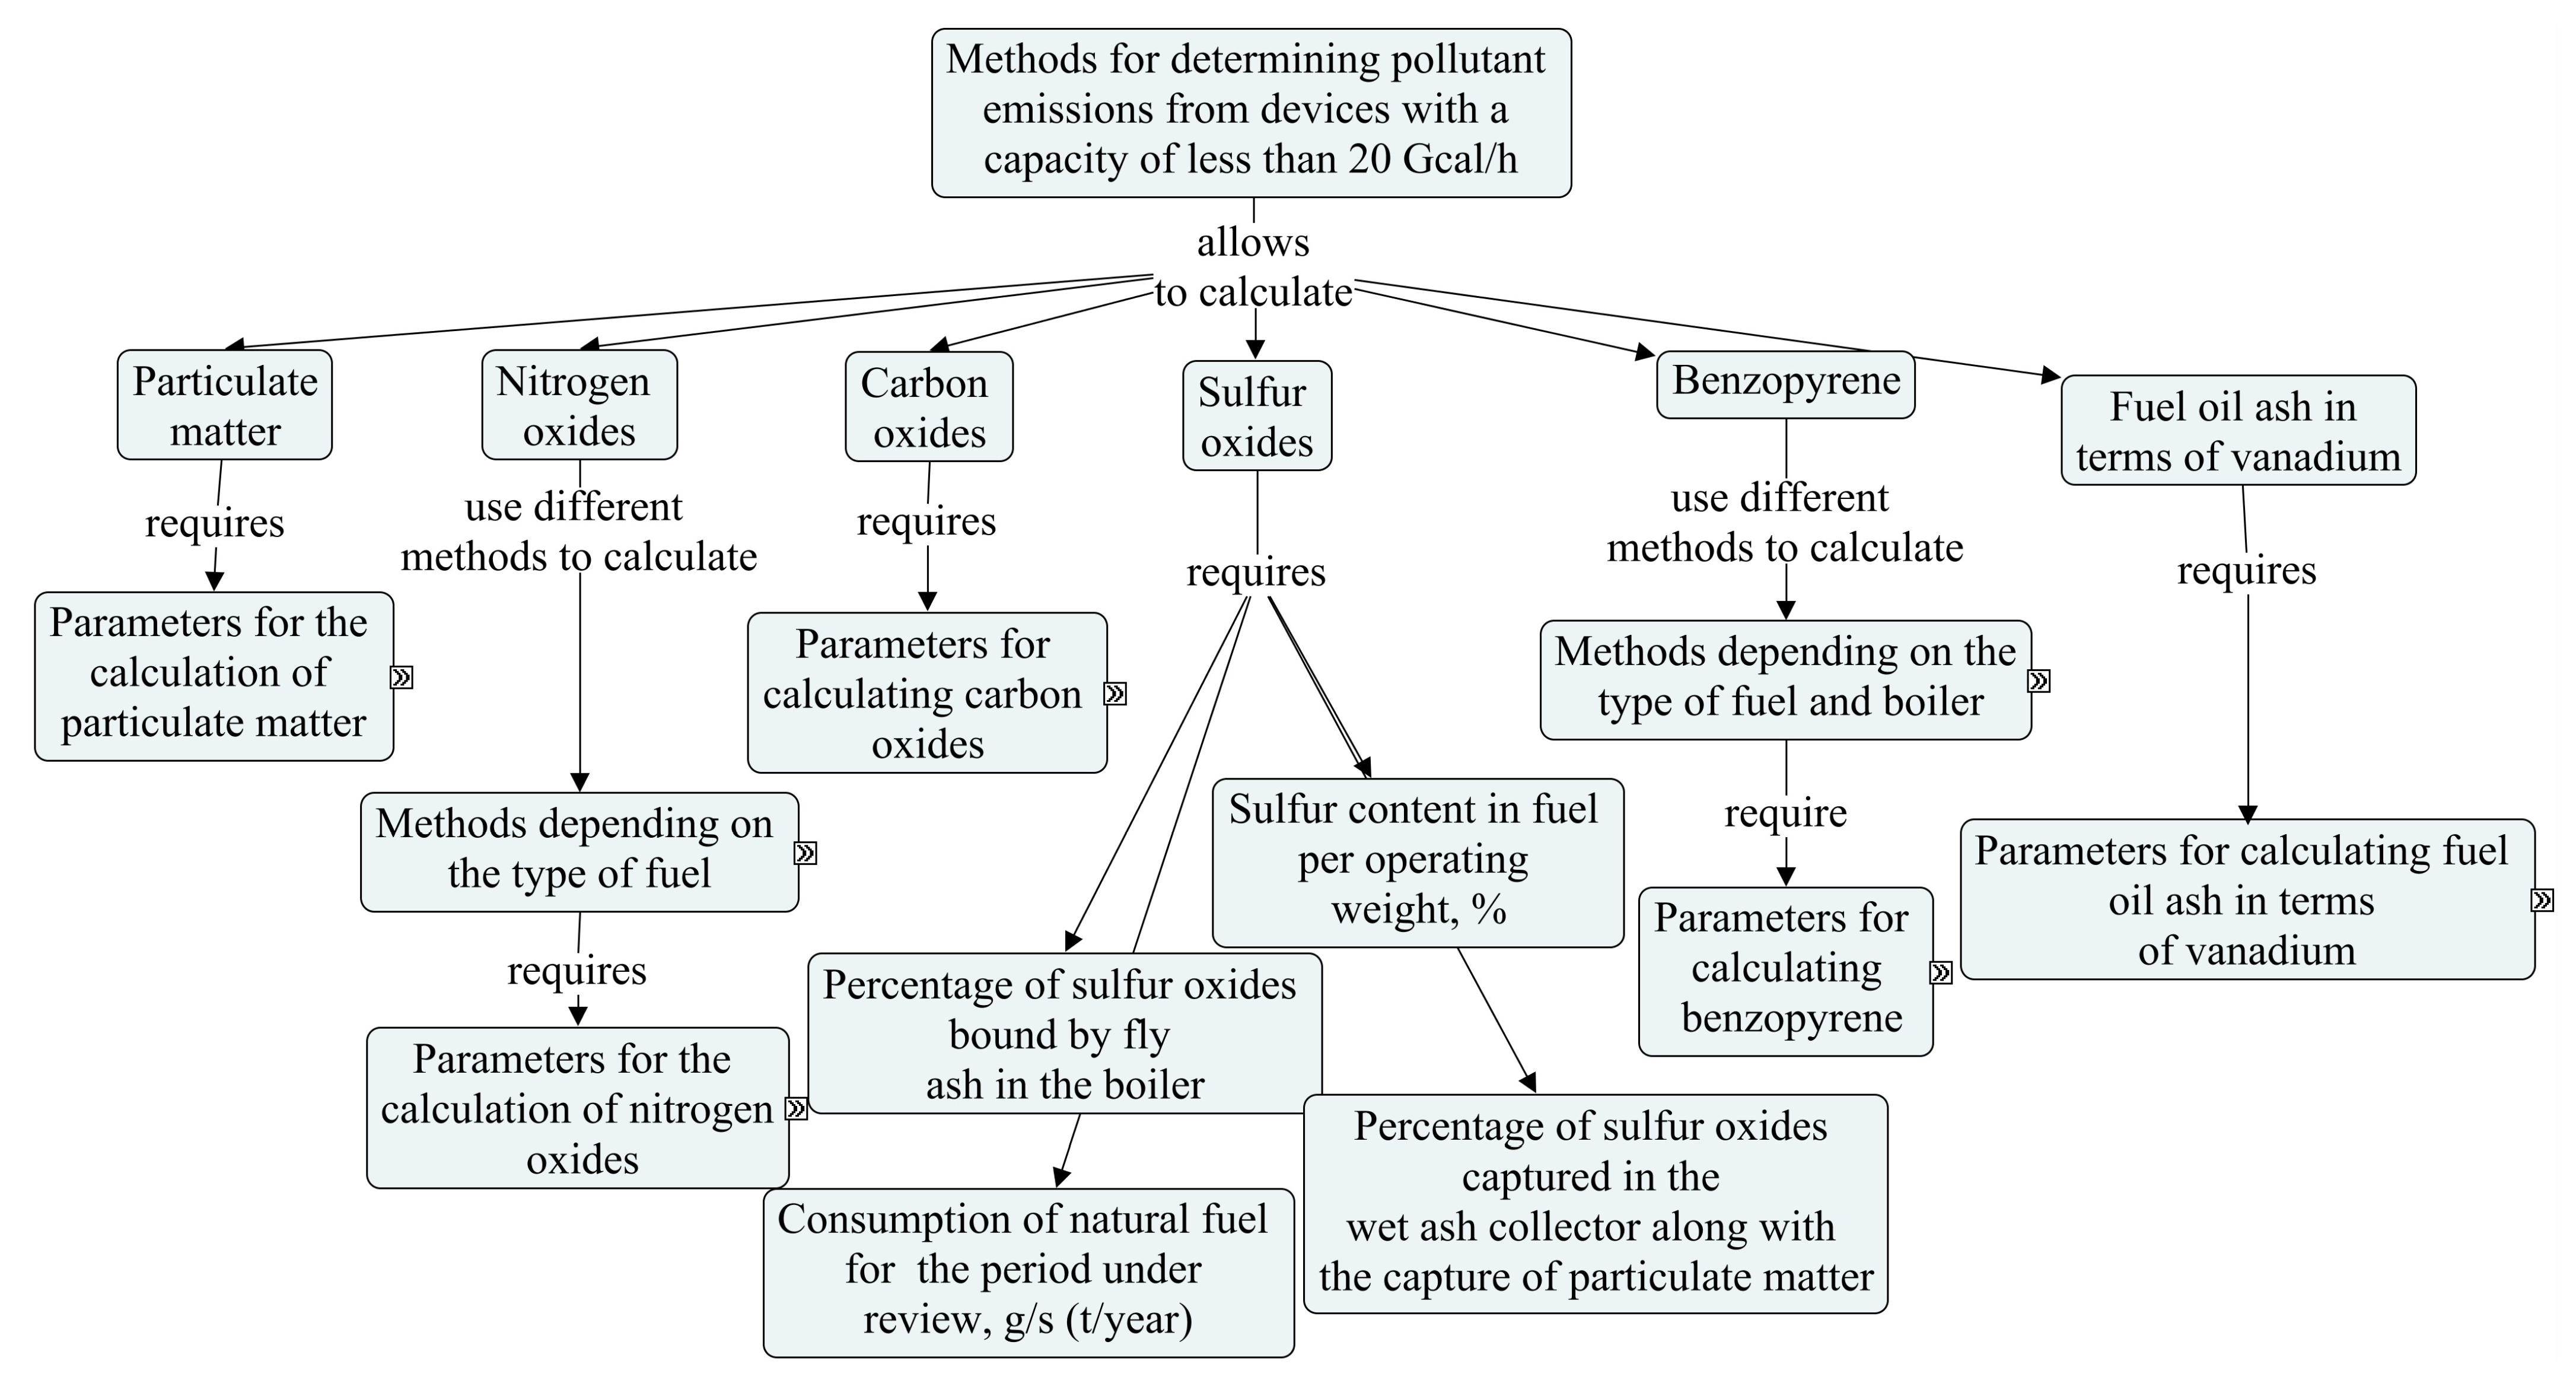
  • Analyze the selected methods for calculating the quantitative indicators of emissions and calculating the dispersion of pollutants in the atmospheric air and create tables for these calculations that include the fields corresponding to the calculation formula;
  • Determine the list of pollutants from the object of assessment based on the calculation method and the subsystem of ontologies for assessing emissions;
  • Create tables of calculation results according to the methods and the list of pollutants;
  • Based on the analysis of calculation methods, create tables for storing auxiliary data, for example, information about weather conditions and terrain data.
Next, we will consider the process of creating tables in a database using the constructed ontologies and the proposed methodology. Figure 1 shows an ontology describing the method from [10].
As can be seen from the ontology, in order to calculate the volume of emissions from an energy facility, it is required to know both the fuel parameters (for example, the lower heating value of the fuel) and the parameters of the boiler (fuel consumption, the fraction of particles captured in ash collectors). Based on the constructed ontologies, the corresponding tables in the database were developed. Figure 2 shows some of the tables.
Comments. The powerplant table stores basic information about the energy facility, such as name and location. The boiler table stores data on the boiler units installed at the energy facility—type of boiler, fuel used, volume of fuel burned, installed capacity. The boiler_type_fuels table contains information about the allowed types of fuel that can be burned in the boiler and technical parameters, for example, heat loss from mechanical incomplete combustion of the fuel (unburned_mechanical_losses). The coal_datasource table contains information about the parameters of the coal. The emission_calculation and emission_calculation_element tables store data on emission calculation and calculation element, respectively. They indicate which energy facilities will participate in the calculation. The emission_calculation_result_element table stores the results of the performed calculations. Next, we will consider in more detail the implementation of the proposed ICS: the architecture and main components, as well as the approbation of the ICS.

3. Implementation of ICS WICS

ICS WICS is implemented as a Web application, due to the following reasons:
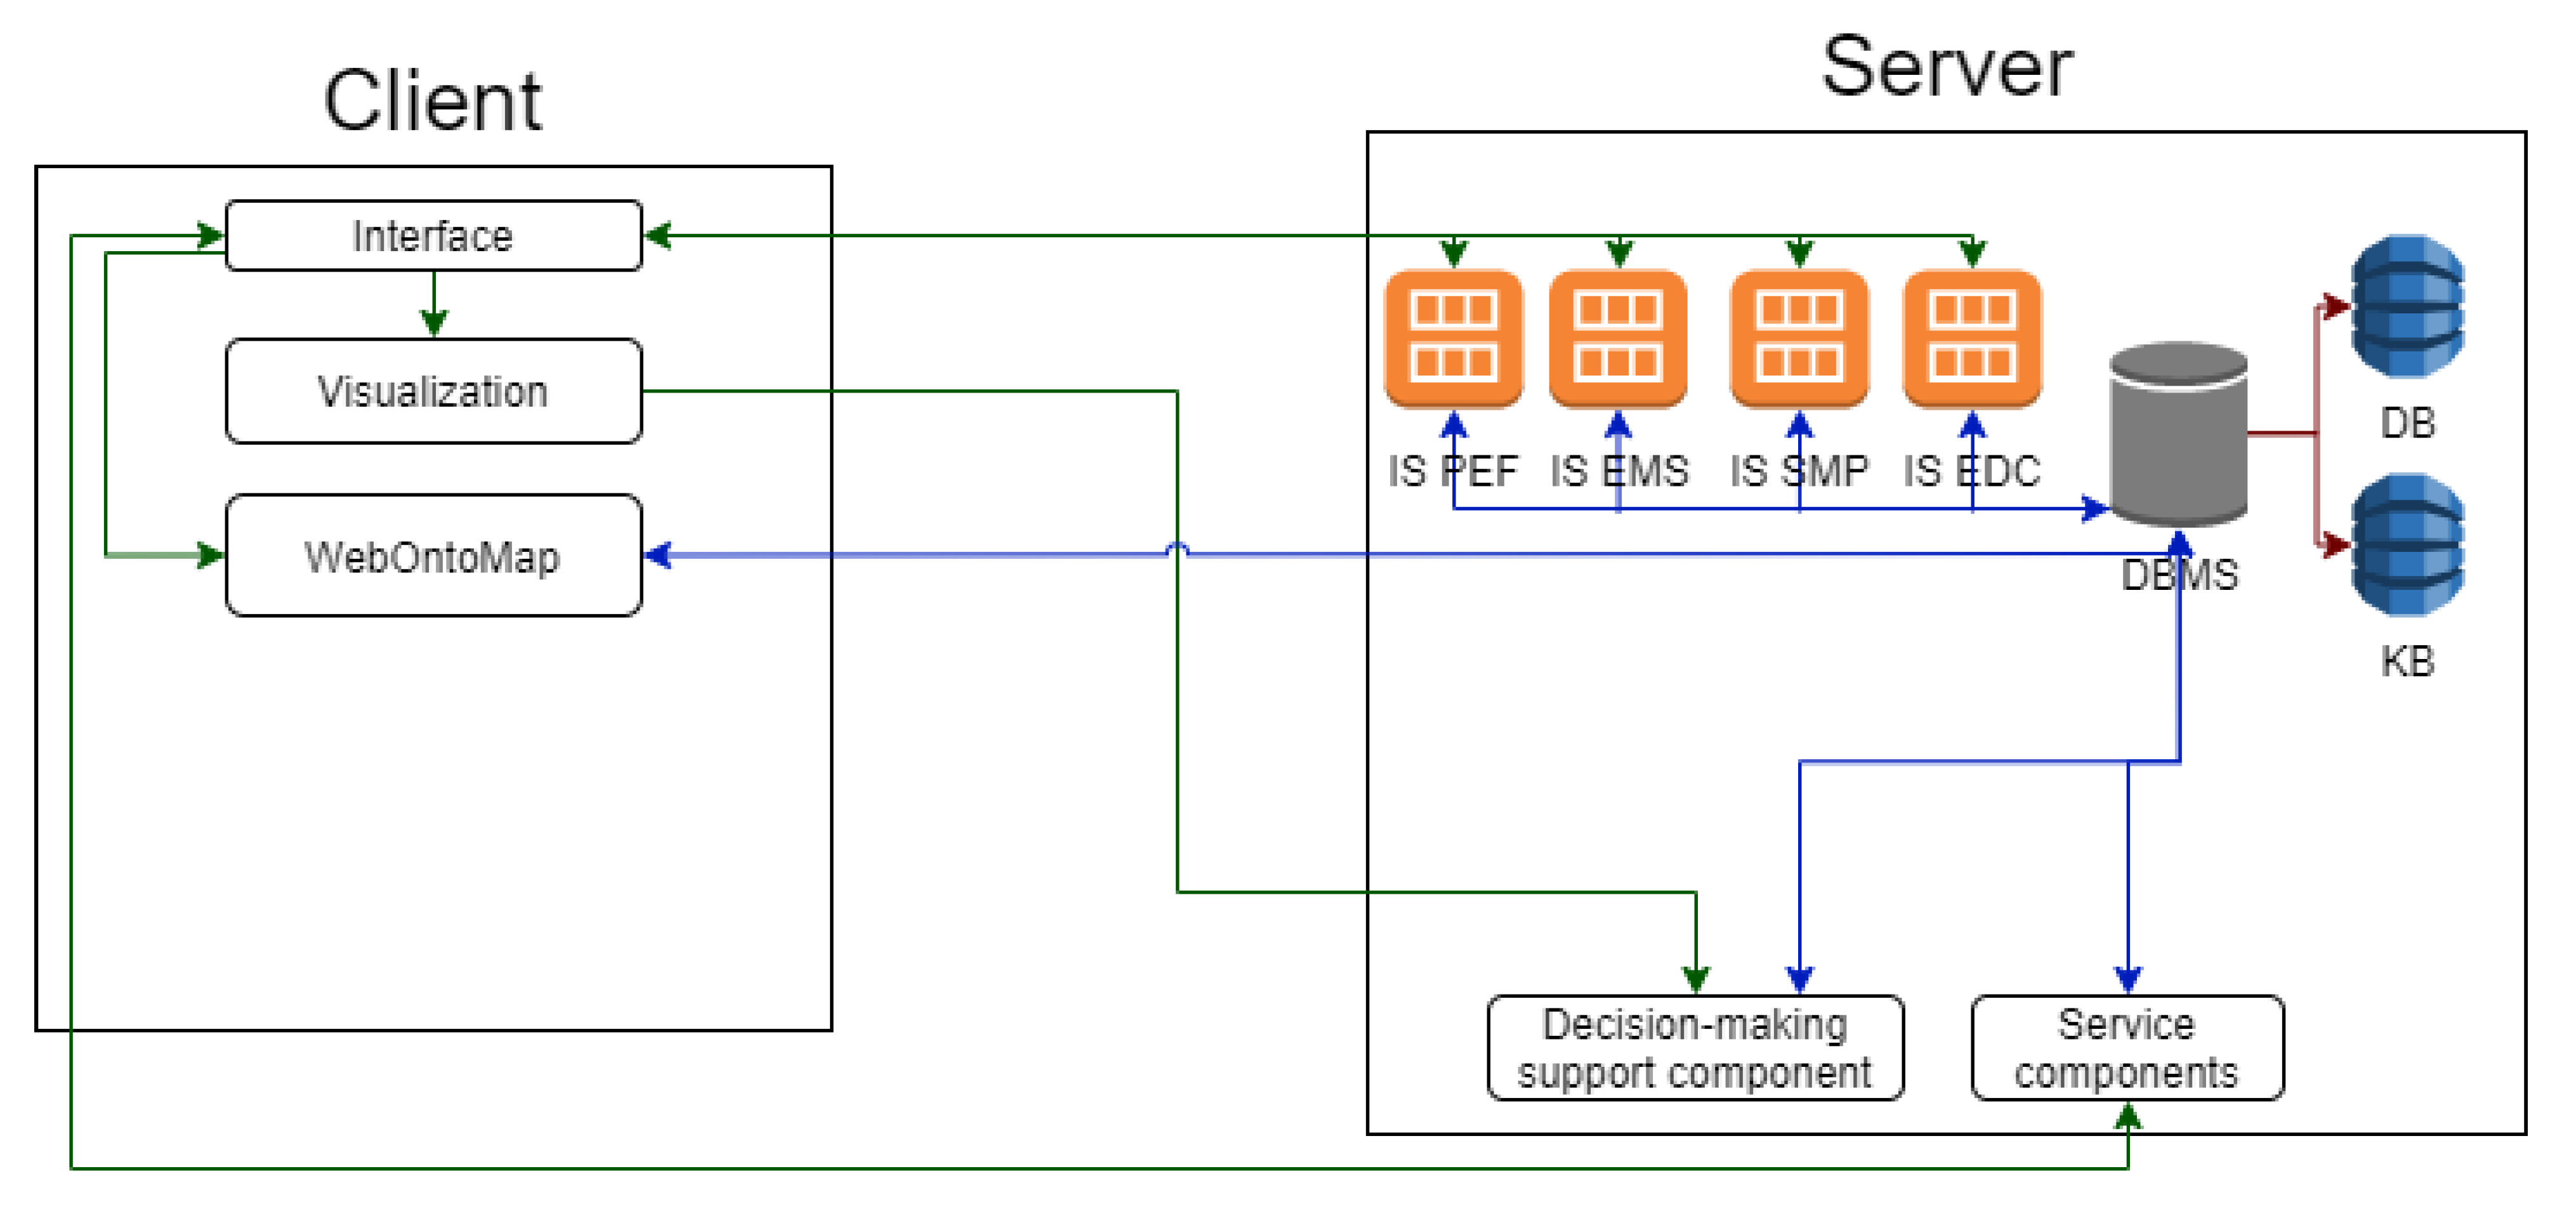
  • The ICS should provide the mutual work of several experts. The web application allows us to organize the storage of data and results in one place.
  • Emission calculations and pollutant dispersion calculations, especially when dealing with a significant number of energy facilities, are complex, both due to the amount of data used and the complexity of the calculation methods. The implementation of the ICS as a Web application with an agent-service architecture allows us to speed up the process of calculations by distributing them among various agent-executors.
  • The Web application helps us to reduce the requirements for experts’ PCs, because in this case, the expert needs only a Web browser with Internet access to work with the ICS. It also reduces time needed for the development and testing of the ICS, since it is not required to compile for various operating systems and platforms.
  • The process of supporting the ICS and adding new functionality to the system is simplified.
Figure 3 shows the client-server architecture of the ICS.
The server side includes the following subsystems: calculation subsystem, DBMS subsystem, and subsystem with auxiliary components. The calculation subsystem consists of:
  • IS PEF—implements calculations of quantitative indicators of pollutant emissions from an energy facility based on regulatory methods [10,13];
  • IS EMS—implements pollutant dispersion calculations based on normative methods [7,10] using the results obtained from the IS PEF subsystem;
  • IS SMP—allows the user to work with the results of the analysis of snow samples;
  • IS EDC—provides work with calculations of economic damages based on methods [11,12] and uses the calculation results obtained from the IS PEF subsystem.
ICS WICS is a multiagent system, so it includes a main server that handles client requests and coordinates agents, responsible for calculations; auxiliary servers (four servers) that contain the mentioned calculation subsystems (currently, one server per subsystem) and a server with service components; database server.
The client part includes a user interface, tools for visualizing results (including geovisualization), as well as WebOntoMap, a component for working with ontologies stored in the knowledge base.
The developed ICS allows us to calculate pollutant emissions from energy facilities, assess the economic damage from emissions, calculate the dispersion of pollutants in the atmospheric air, and work with the results of analyzing snow samples for pollutant content. The system can be used to assess the current situation with environmental pollution, to assess the effectiveness of measures to reduce the harmful impact of energy facilities, for example, when planning the placement of new energy facilities.

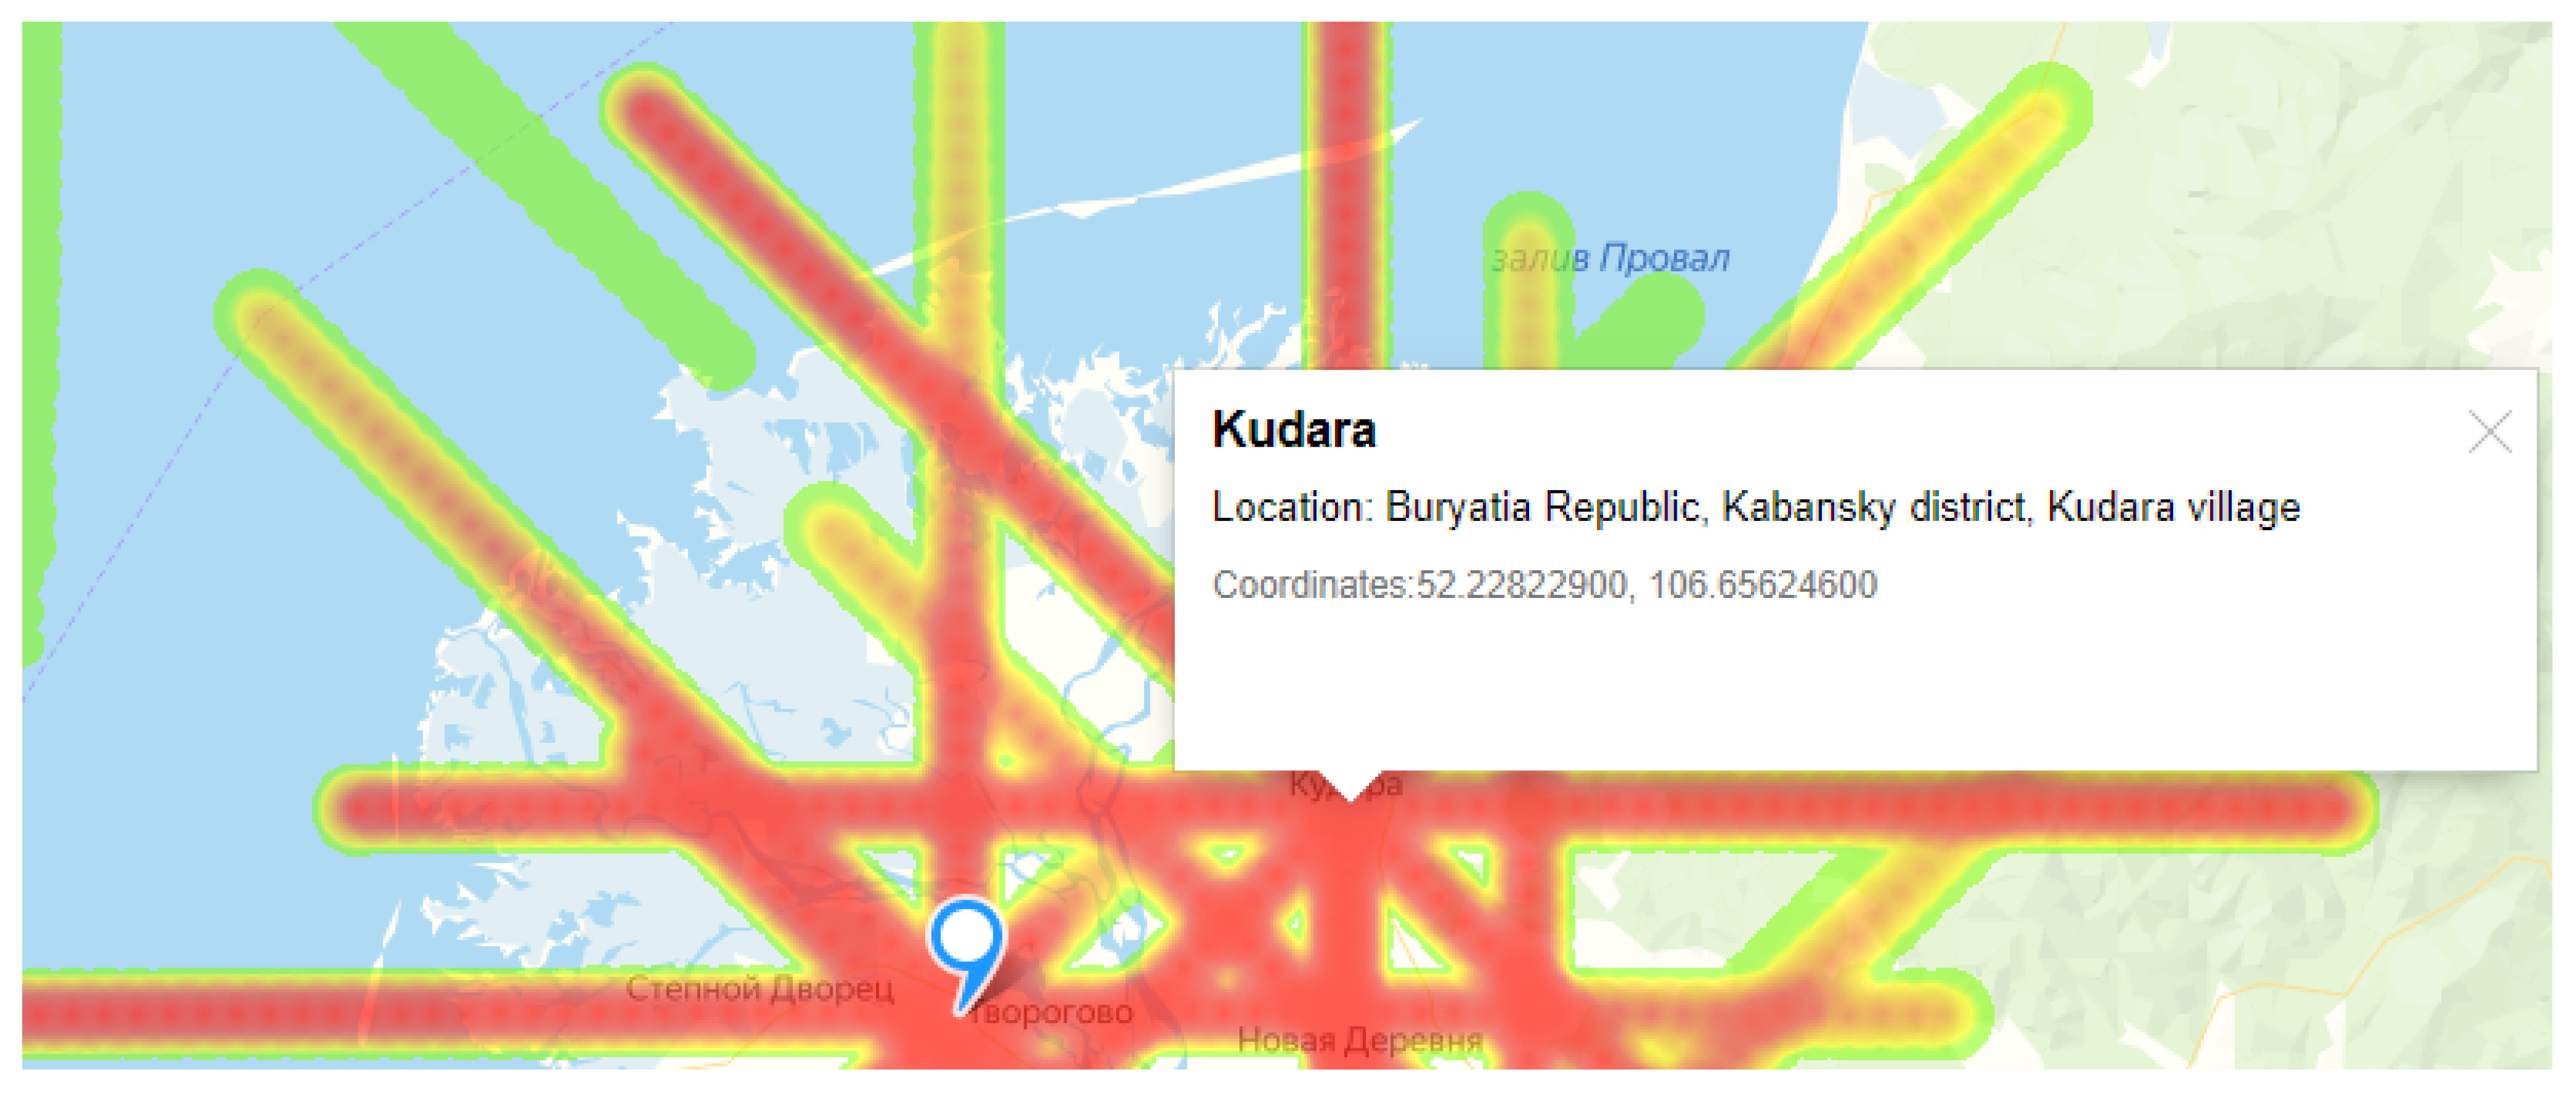
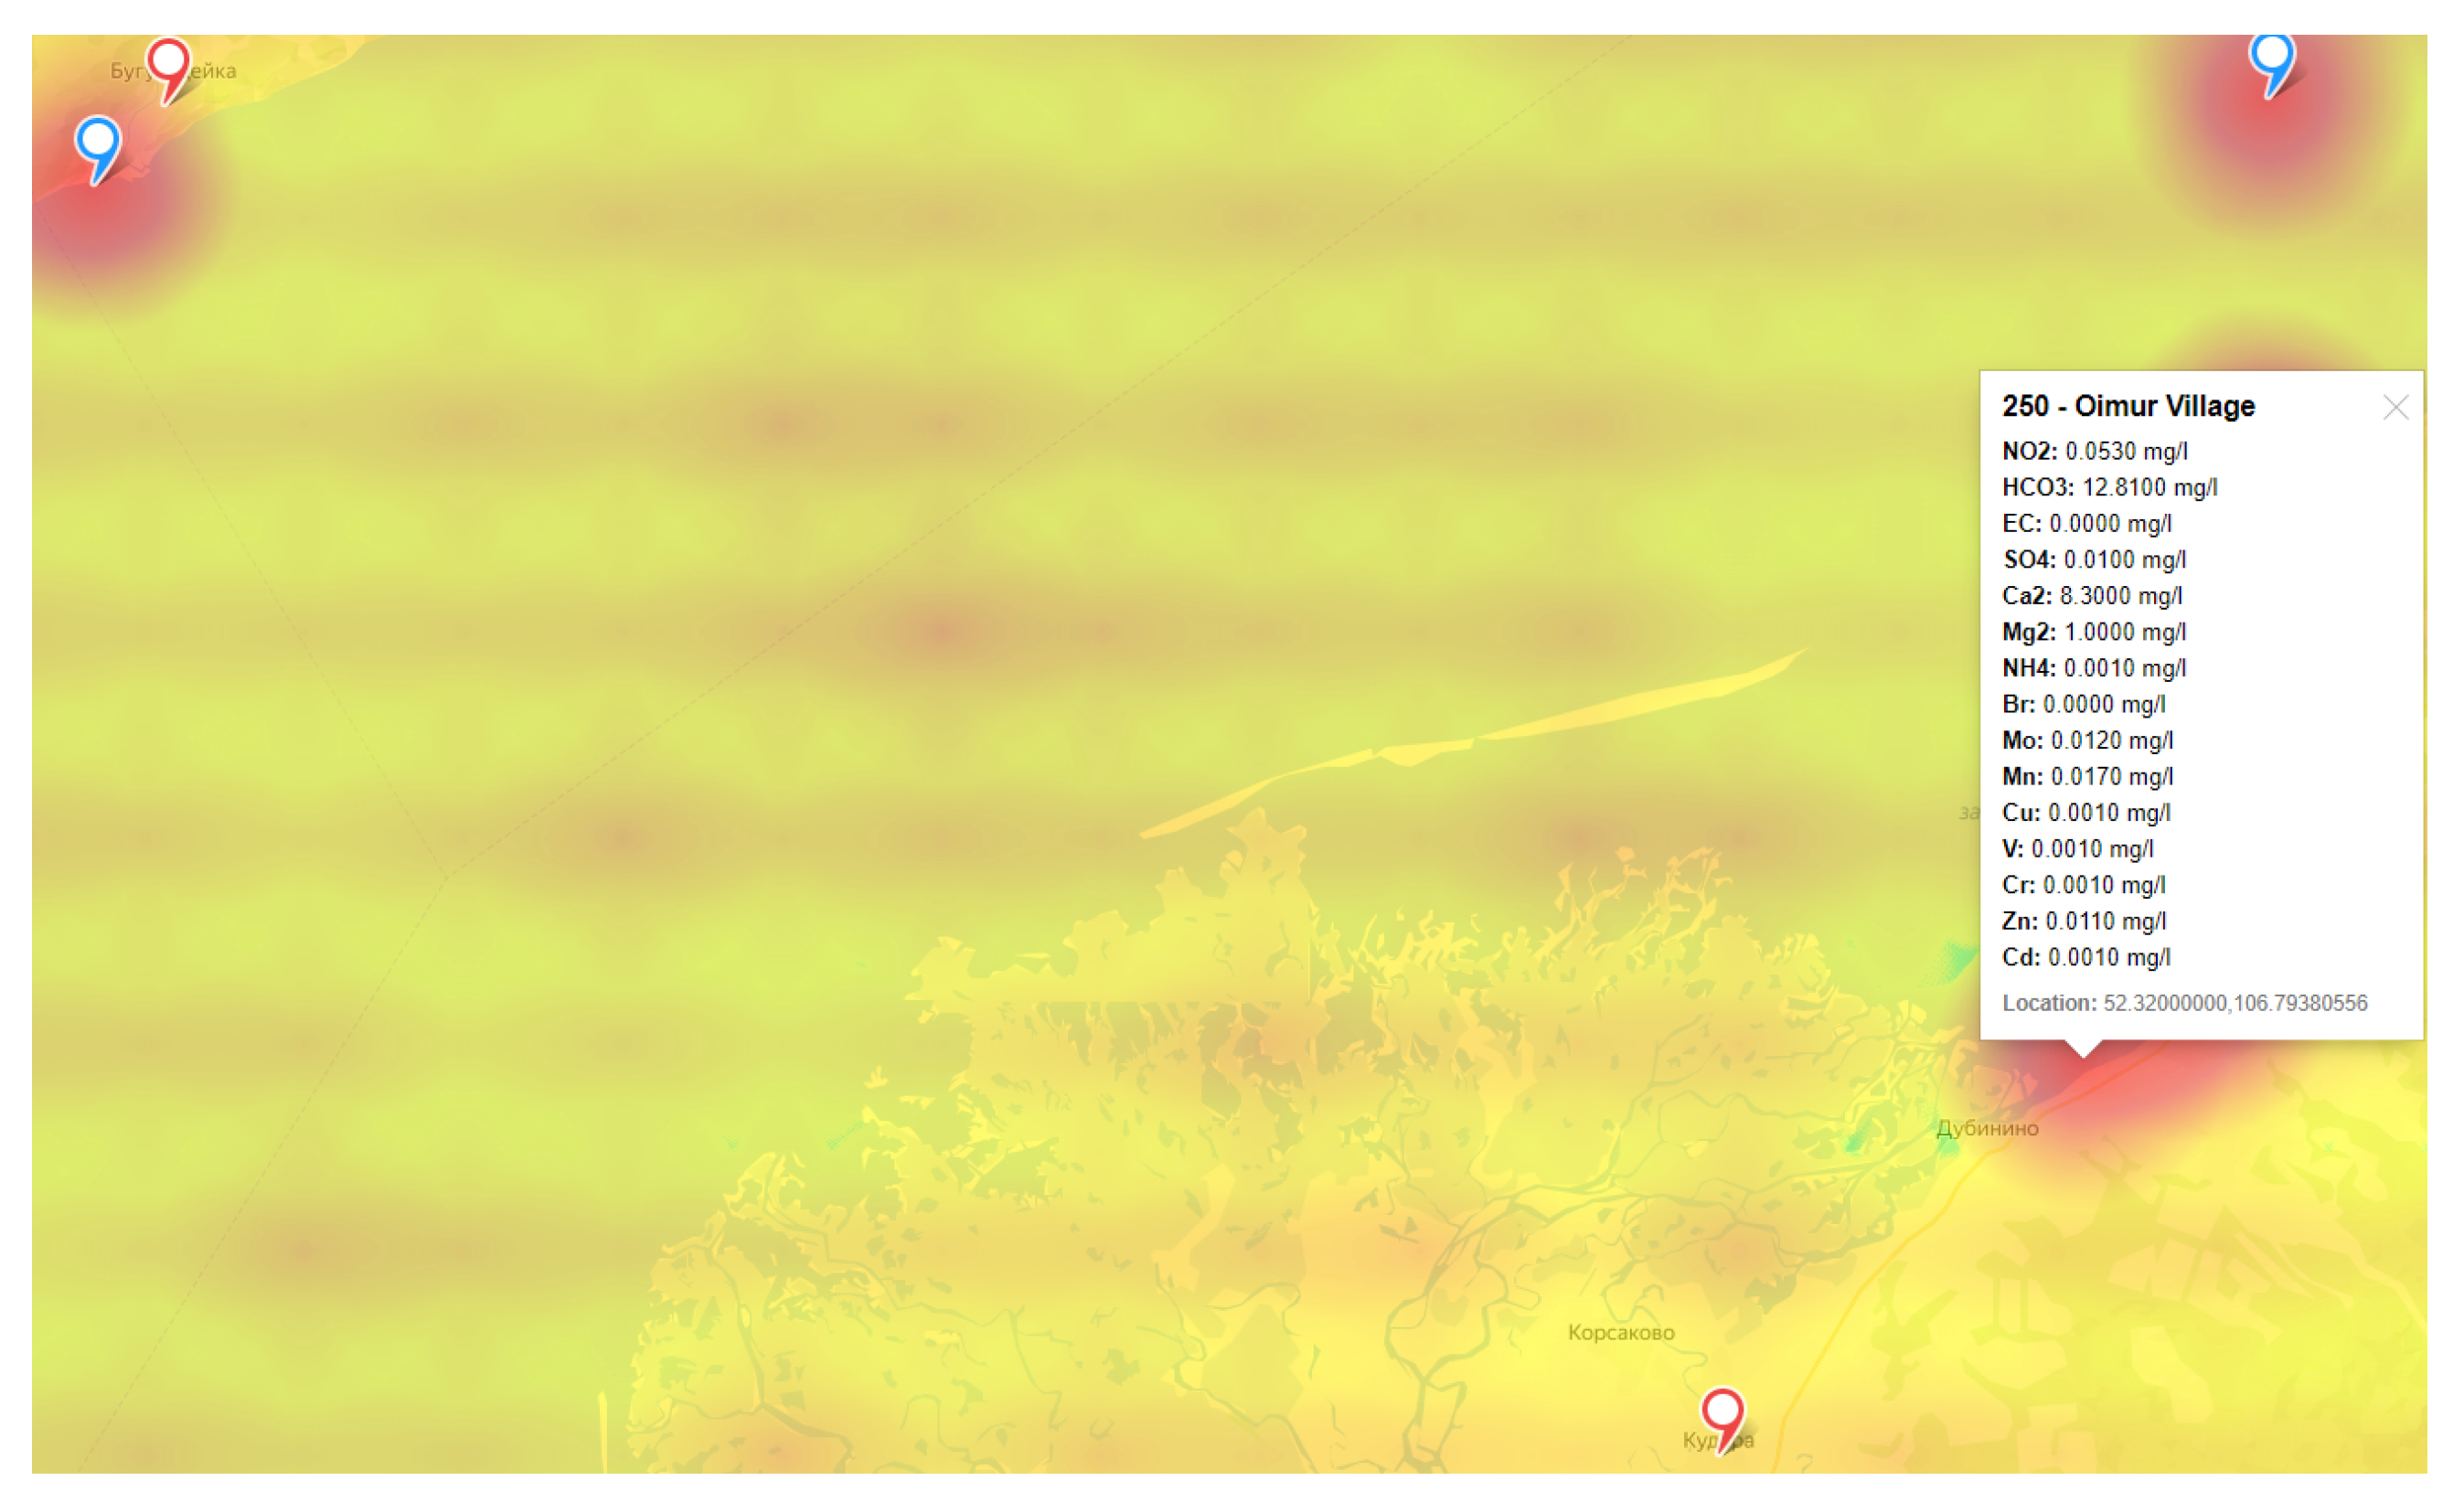
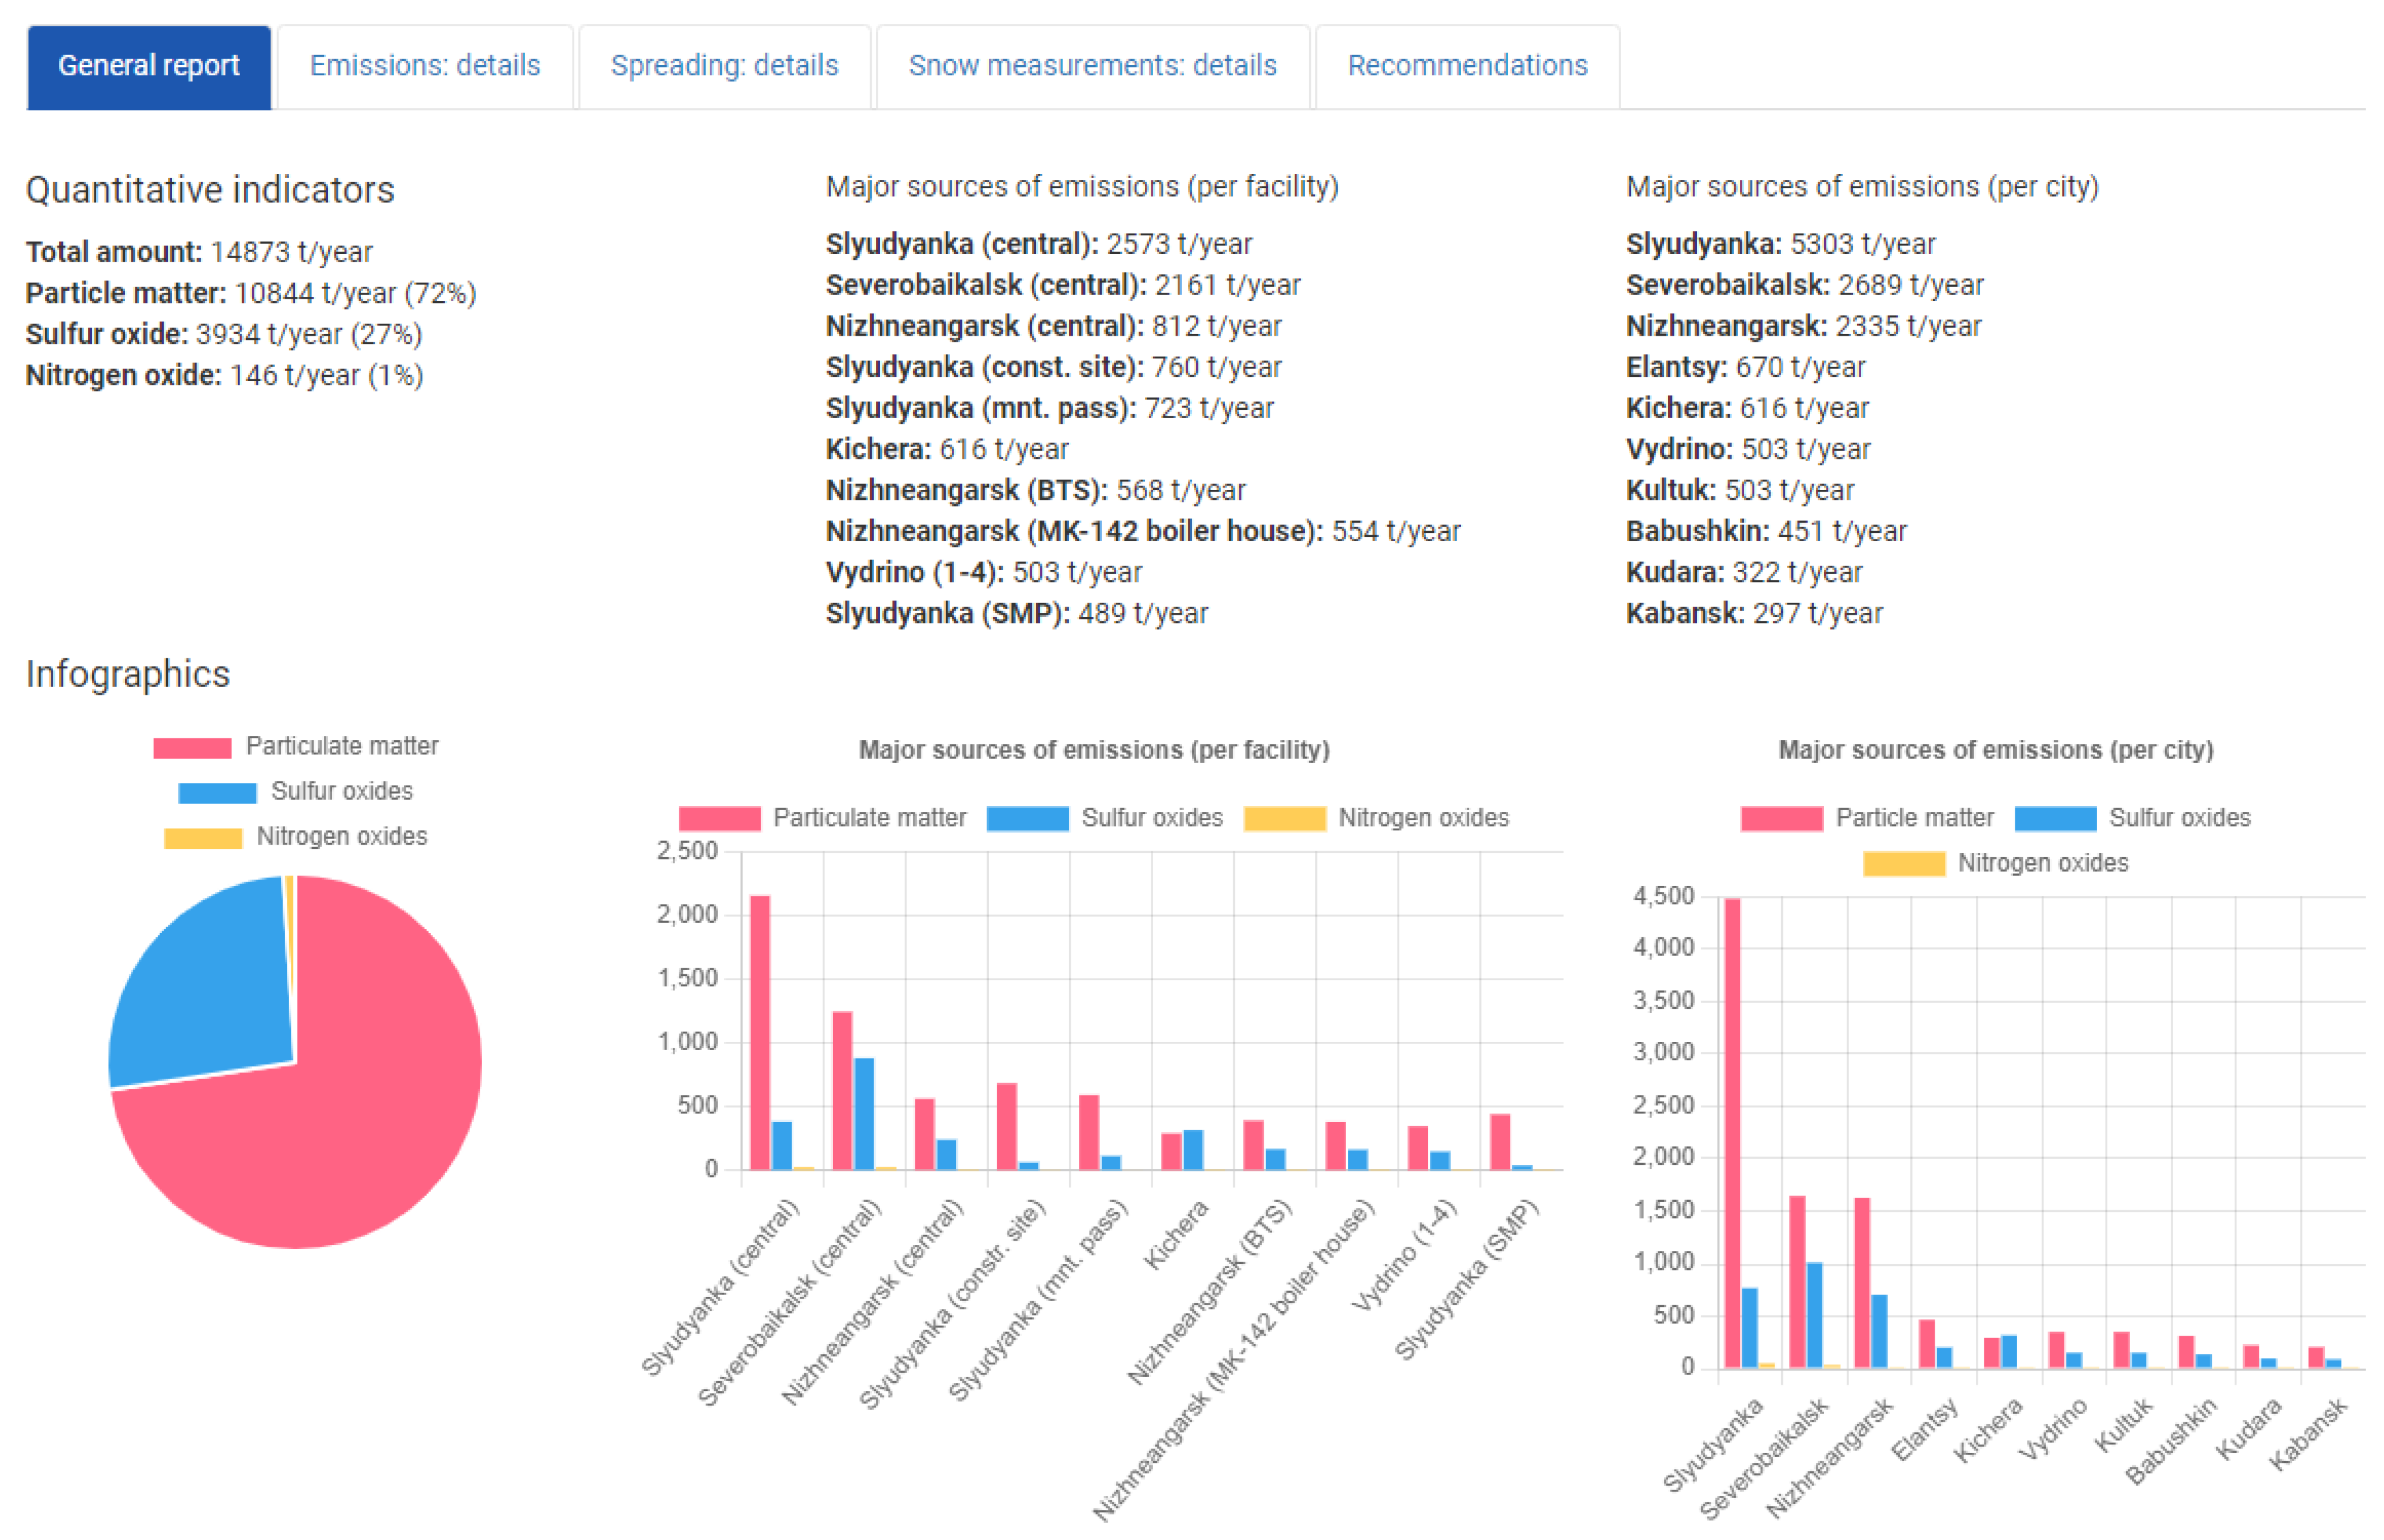
4. Computational Experiment

To test the ICS WICS, computational experiments were carried out based on information about energy facilities (boiler houses) located in the Central Ecological Zone of the Baikal Natural Territory (CEZ BNT) [21]. Boiler houses have different installed capacity and equipment; coal is used as fuel (the results of calculations are given based on data for 2015). First, the quantitative indicators of pollutant emissions into the atmospheric air from the assessed facilities were calculated. In an aggregated form, a fragment of the results obtained is shown in Table 1.
The geovisualization of the results was also performed in the form of a heat map using the the Yandex.Maps cartographic service. Figure 4 shows the visualization of particulate matter emissions.
Blue marks indicate the assessed energy facilities. When a mark is clicked, a legend (detailed information about the facility) will be shown at the top left. The redder the heat map, the higher the volume of pollutant emissions relative to other facilities.
Based on the results of calculating the quantitative indicators of pollutant emissions, the calculation of the economic damage caused to the environment was carried out according to the methodology [11]. A fragment of the results is shown in Table 2.
The calculation of the dispersion of pollutants in the atmospheric air was also performed; Table 3 shows a fragment of the calculation results for particulate matter.
The results of the dispersion calculation can also be geovisualized in the form of a heat map; an example is shown in Figure 5.
The results of the analysis of snow samples for the content of pollutants were additionally uploaded to the system. Figure 6 shows the geovisualization of the results of the analysis of samples for the content of S O 4 in the form of a heat map after interpolation using Bayesian empirical kriging [22,23].
Blue dots on the map indicate sampling sites, while red dots indicate energy facilities. The redder and brighter the heat map at sampling points, the higher the pollutant concentration.
The ICS also includes a subsystem for supporting the development of recommendations, which aggregates the results and visualizes them using infographics. An example of the subsystem operation is shown in Figure 7.

5. Conclusions

In this article, we substantiated the need for research on the impact assessment of energy facilities on the environment and described the ICS WICS developed for this purpose. The ICS allows us to assess the impact of both existing and planned energy facilities. The approaches and methods used in the development of the ICS are shown: the agent-service approach and ontological engineering. The ICS architecture is presented and its main blocks are described; examples of system interfaces are shown. The results of approbation confirming the correctness of the applied methods are presented.
In the future, as a part of the research on the sustainability of energy and socio-ecological systems, it is planned to integrate the ICS WICS with the INTEC-A software package (developed in a team represented by the authors [24]) to study the directions for the development of the fuel and energy complex, taking into account the requirements of energy security. This will make it possible to carry out comprehensive research on the directions of development of the fuel and energy complex of the Russian Federation, taking into account the impact of decisions made on the environment.

Author Contributions

Conceptualization, L.V.M.; investigation, V.R.K.; methodology, V.R.K. and T.N.V.; software, V.R.K.; validation, T.N.V. and L.V.M.; writing—original draft preparation, V.R.K. and T.N.V.; writing—review and editing, L.V.M. All authors have read and agreed to the published version of the manuscript.

Funding

The research was carried out under State Assignment Project (No FWEU-2021-0007 AAAA-A21-121012090007-7).

Institutional Review Board Statement

Not applicable.

Informed Consent Statement

Not applicable.

Data Availability Statement

Not applicable.

Conflicts of Interest

The authors declare no conflict of interest.

References

  1. Energy Strategy of the Russian Federation for the Period up to 2035: Decree of the Government of the Russian Federation, 9 June 2020, No. 1523-r. Available online: http://static.government.ru/media/files/w4sigFOiDjGVDYT4IgsApssm6mZRb7wx.pdf (accessed on 15 July 2022). (In Russian)
  2. Passport of the National Project “Ecology”. Available online: http://static.government.ru/media/files/pgU5Ccz2iVew3Aoel5vDGSBjbDn4t7FI.pdf (accessed on 15 July 2022). (In Russian)
  3. Strategy for Socio-Economic Development of the Russian Federation with Low Greenhouse Gas Emissions Until 2050: Decree of the Government of the Russian Federation, 29 October 2021, No. 3052-r. Available online: http://static.government.ru/media/files/ADKkCzp3fWO32e2yA0BhtIpyzWfHaiUa.pdf (accessed on 16 July 2022). (In Russian)
  4. Egorchenkov, A.V.; Egorchenkov, D.A. Social aspects of environmental issues in the context of the national project “Ecology”. IOP Conf. Ser. Earth Environ. Sci. 2020, 579, 012099. [Google Scholar] [CrossRef]
  5. Alekseev, A.N.; Bogoviz, A.V.; Goncharenko, L.P.; Sybachin, S.A. A Critical Review of Russia’s Energy Strategy in the Period until 2035. Int. J. Energy Econ. Policy 2019, 9, 95–102. [Google Scholar] [CrossRef] [Green Version]
  6. Zorina, T.G.; Aleksandrovich, S.A.; Maysyuk, E.P.; Massel, A.G. The impact of energy on the geoecology of regions (Russian Federation and Republic of Belarus). Inf. Math. Technol. Sci. Manag. 2019, 2, 151–161. [Google Scholar]
  7. Khaustov, A.P.; Redina, M.M.; Nedostup, P.Y.; Silaev, A.V. Problems of Assessment and Management of Environmental Risks at Fuel and Energy Complex Enterprises. Energy Secur. Energy Sav. 2005, 6, 25–30. (In Russian) [Google Scholar]
  8. Wyrwa, A.; Zyśk, J.; Mirowski, T. Assessment of Environmental Impacts of Energy Scenarios Using the πESA Platform. In eScience on Distributed Computing Infrastructure; Lecture Notes in Computer Science; Bubak, M., Kitowski, J., Wiatr, K., Eds.; Springer: Cham, Switzerland, 2014. [Google Scholar]
  9. Schiavo, B.; Morton-Bermea, O.; Salgado-Martínez, E.; García-Martínez, R.; Hernández-Álvarez, E. Health risk assessment of gaseous elemental mercury (GEM) in Mexico City. Environ Monit Assess. 2022, 194, 19. [Google Scholar] [CrossRef] [PubMed]
  10. Methodology for Determining Emissions of Pollutants into the Atmosphere during Fuel Combustion in Boilers with a Capacity of Less Than 30 Tons of Steam per Hour or Less Than 20 Gcal per Hour; State Committee for Environmental Protection of the Russian Federation (with the Participation of the Firm “Integral”, St. Petersburg): Moscow, Russia, 1999; 53p. (In Russian)
  11. On Approval of Methods for Calculating the Dispersion of Emissions of Harmful (Polluting) Substances in the Atmospheric Air: Decree of the Ministry of Natural Resources of Russia, 6 June 2017, No. 273. Available online: https://docs.cntd.ru/document/456074826 (accessed on 1 August 2022). (In Russian).
  12. Kuzmin, V.R.; Massel, L.V. Methodical Approach for Impact Assessment of Energy Facilities on Environment. In Information Systems and Design; ICID 2021. Communications in Computer and Information Science 1539; Taratukhin, V., Matveev, M., Becker, J., Kupriyanov, Y., Eds.; Springer: Cham, Switzerland, 2022. [Google Scholar]
  13. Methodology for Determining Gross Emissions of Pollutants into the Atmosphere from Boiler Plants of Thermal Power Plants; RD34.02.305-98/VTI; PMB VTI: Moscow, Russia, 1998; 36p. (In Russian)
  14. Berlyand, M.E. Forecasting and Regulation of Atmospheric Pollution; Gidrometeoizdat: Leningrad, Russia, 1985; 272p. (In Russian) [Google Scholar]
  15. On Approval of the Methodology for Calculating the Amount of Damage Caused to Atmospheric Air as a Component of the Natural Environment: Decree of the Ministry of Natural Resources of Russia, 28 January 2021, No. 59. Available online: https://docs.cntd.ru/document/573536168 (accessed on 31 July 2022). (In Russian).
  16. Temporary Standard Methodology for Determining the Economic Efficiency of the Implementation of Environmental Measures and Assessing the Economic Damage Caused to the National Economy by Environmental Pollution: Decree of the USSR State Planning Committee, the USSR State Construction Committee and the Presidium of the USSR Academy of Sciences, 21 October 1983 No. 254/284/134. Available online: http://www.consultant.ru/document/cons_doc_LAW_94300/ (accessed on 22 August 2022). (In Russian).
  17. Alonso, E. From Articial Intelligence to Multi-Agent Systems: Some Historical and Computational Remarks. 2001. Available online: http://citeseerx.ist.psu.edu/viewdoc/summary?doi=10.1.1.26.3210 (accessed on 23 September 2014).
  18. Reducing the Risk of Cascading Accidents in Power Systems; Voropai, N.I.; Russian Academy of Sciences; Siberian Branch; ESI SB RAS (Eds.) SB RAS Publishing: Novosibirsk, Russia, 2011; 303p. (In Russian) [Google Scholar]
  19. Kuzmin, V.R.; Zagorulko, Y.A. Usage of the Agent-Service Approach for the Development of Intelligent Decision Support Systems in the Energy Sector. Vestn. NSU Ser. Inf. Technol. 2020, 18, 5–18. (In Russian) [Google Scholar] [CrossRef]
  20. Massel, L.V.; Ivanova, I.Y.; Vorontsova, T.N.; Maysyuk, E.P.; Izhbuldin, A.K.; Zorina, T.G.; Barseghyan, A.R. Ontological aspects of the study of the mutual influence of energy and geoecology. Ontol. Des. 2018, 4, 550–561. (In Russian) [Google Scholar] [CrossRef]
  21. Kuzmin, V.R.; Zarodnyuk, M.S.; Massel, L.V. Impact assessment of emissions from energy facilities on the Baikal natural area. iPolytech J. 2022, 26, 70–80. (In Russian) [Google Scholar] [CrossRef]
  22. Diggle, P.J.; Tawn, J.A.; Moyeed, R.A. Model-Based Geostatistics; Springer: New York, NY, USA, 2007; 230p. [Google Scholar]
  23. Gribov, A.; Krivoruchko, K. Empirical Bayesian kriging implementation and usage. Sci. Total. Environ. 2020, 722, 137290. [Google Scholar] [CrossRef] [PubMed]
  24. Massel, A.G.; Mamedov, T.G.; Pyatkova, N.I. Computational experiment technology in research of power industries when implementing threats to energy security. Inf. Math. Technol. Sci. Manag. 2021, 3, 62–73. (In Russian) [Google Scholar]
Figure 1. Ontology of the method for determining emissions of pollutants into the atmosphere during fuel combustion in boilers with a capacity of less than 30 tons of steam per hour or less than 20 Gcal per hour.
Engproc 33 00021 g001
Figure 2. Tables in the database developed on the basis of ontologies.
Engproc 33 00021 g002
Figure 3. Architecture of ICS WICS.
Engproc 33 00021 g003
Figure 4. Geovisualization of the results of calculating the volume of pollutant emissions from energy facilities.
Engproc 33 00021 g004
Figure 5. Geovisualization of the results of calculating the dispersion of pollutants (particle matter) for energy facilities located in the Kabansky district of the Republic of Buryatia.
Engproc 33 00021 g005
Figure 6. Interpolation of the results of the analysis of snow samples for S O 4 content.
Engproc 33 00021 g006
Figure 7. Decision-making support subsystem.
Engproc 33 00021 g007
Table 1. Fragment of the results of calculations of pollutant emissions into the atmospheric air.
FacilityTotal Emission,Particulate Matter,SO, NO X ,Installed Capacity,
tons/yeartons/yeartons/yeartons/yearGcal/hour
Kudara322.8224.997.50.412.8
Tvorogovo, Shigaevo77.553.923.40.14.4
Elantsy (central)361.16251.79109.20.173.5
Table 2. A fragment of the results of the calculation of economic damage.
FacilityParticulate Matter Damage,SO Damage, NO X Damage,Total Damage,
RUBRUBRUBRUB
Kudara817,600354,00016001,173,900
Tvorogovo, Shigaevo209,00090,000600301,000
Elantsy (central)1,700,000737,00014002,439,500
Table 3. Fragment of the results of the calculation of dispersion of particulate matter from energy facilities in the atmospheric air.
FacilityMin. One-TimeAvg. One-TimeMax. One-TimeMin.Avg.Max.
Concentration,Concentration,Concentration,Distance,Distance,Distance,
mg/m3mg/m3mg/m3kmkmkm
Kudara65493812,4161.53.24.8
Tvorogovo, Shigaevo529237030390.40.515.3
Elantsy (central)20195710,4871.64.15.0
Disclaimer/Publisher’s Note: The statements, opinions and data contained in all publications are solely those of the individual author(s) and contributor(s) and not of MDPI and/or the editor(s). MDPI and/or the editor(s) disclaim responsibility for any injury to people or property resulting from any ideas, methods, instructions or products referred to in the content.

