
Learning Thermographic Models for Optimal Image Processing of Decorated Surfaces †


1
Department of Industrial and Information Engineering and Economics (DIIIE), University of L’Aquila, Piazzale E. Pontieri 1, Monteluco di Roio, 67100 L’Aquila, AQ, Italy
2
Individual Company of Restoration (Gianfranco Gargiulo), Via Tiberio 7b, 80073 Capri, NA, Italy
3
Industrial and Systems Engineering Department, Khalifa University of Science and Technology, Abu Dhabi 54224, United Arab Emirates
*
Author to whom correspondence should be addressed.
†
Presented at the 16th International Workshop on Advanced Infrared Technology & Applications, 26–28 October 2021; Available online: https://aita2021.sciforum.net/ .
Eng. Proc. 2021, 8(1), 13; https://doi.org/10.3390/engproc2021008013
Published: 22 November 2021
(This article belongs to the Proceedings of The 16th International Workshop on Advanced Infrared Technology & Applications)
Abstract
:The use of infrared thermography presents unique perspectives in imaging of artifacts to help interrogate their surface and subsurface characteristics, highlight deviations and detect contrast. This research capitalizes on active and passive thermal imagery along with advanced machine learning-based algorithms for pre- and post-processing of acquired scans. Such codes operate efficiently (compress data) to help link the observed temperature variations and the thermophysical parameters of targeted samples. One such processing modality is dictionary learning, which infers a “frame dictionary” to help represent the scans as linear combinations of a small set of features, thus training data to show a sparse representation. This technique (along factorization and component analysis-based methods) was used in current research on ancient polychrome marquetries aimed at detecting aging anomalies. The presented research is unique in terms of the targeted samples and the applied approaches and should provide specific guidance to similar domains.
1. Introduction
The structures with decorated surfaces due to their very nature and historical context (material, assembly, and aging), present a number of challenges specific to their diagnosis and restoration, which limit the adoption of standard methods and known techniques borrowed from other applications. As the strict fulfilment of established guidelines is necessary to ensure both rational analyses and repair approaches, which are appropriate to the cultural context. Consequently, the formation of the multidisciplinary team of experts, is not trivial, as it should be guided by the domains, the scale, and the sciences involved in each assessment and restoration step. This typically starts by the visual inspection/evaluation of the work of art under analysis [1]. Thermographic analyses offer imaging perspectives across an electromagnetic spectrum (i.e., the infrared band) that is beyond the visible, thus furnishing new information and exposing new material structures (delaminating, splits, inclusions, etc.), otherwise undetectable by the naked eye [2]. Furthermore, thermographic images are coupled nowadays to efficient pre and post processing routines, to help increase the contrast and defects’ detectability in real-time and at larger frames (with higher resolutions). For the current application on the samples under test (SUT), these techniques will be adjusted to highlight the variations of the SUT constituting materials’ via their thermophysical properties and structural integrity. Thus, providing a visual representation of the SUT structure and its unique aging, in passive [3] and active [4] modes of thermography. Several techniques based on physics (of heat conduction), mathematics, and/or statistics have recently been proposed within the thermographic research field, such as principal components thermography [5], thermographic signal reconstruction [6], dynamic thermal tomography [7], higher order statistics thermography [8], among many other [9,10,11]. On the other hand, recent advances in machine learning can help process, discern and interpret images thoroughly and in real-time. When applied to image processing, artificial intelligence (AI) may, e.g., detect and recognize objects and patterns in images. Most effective machine learning models for image processing use neural networks and deep learning. Recently, machine learning techniques found greater adoption in the infrared thermography processing context [12]. The contribution from current work can be considered novel as a data mining search on Scopus® website [13], via the combined keywords of “machine learning” + “thermography” + “cultural heritage”, resulted in “No documents were found”. Thus, the current research can present a pioneering approach to obtaining clear defect maps of ancient marquetries using thermography, specifically via a controlled heating regime [14]. Furthermore, the unique application of dictionary learning (DL) to raw thermal images is compared against other advanced algorithms described in the next section [15]. For the sake of brevity, only the main DL results will be shown and discussed in Section 3; the remaining ones will be illustrated during the virtual presentation.
2. Algorithms for Thermal Image Processing
A test campaign, in reflection mode, used a halogen lamp rated at 230 V and 2.5 kW synchronized to an Indium Antimonide InSb thermal camera (commercial name GF309 from FLIR®) to produce 250 thermal images in total, at a frame rate of 25 Hz. The following algorithms were then applied to the acquired scans.
2.1. Dictionary Learning (DL)
It is a recent modality of signal processing and machine learning that infers a sparse representation of the input thermal images using a DL approach. The sparser the representation, the better the dictionary [15]. A common setup for the dictionary learning problem starts with access to a training set, a collection of training vectors, each of length N. This training set may be finite, and then the training vectors are usually collected as columns in a matrix X of size NxL, or of infinite size. For the finite case, the aim of DL is to find both a dictionary, D, of size NxK, and a corresponding coefficient matrix W of size KxL such that the representation error, R = X − DW, is minimized and W fulfill some sparseness criterion. The DL problem can be formulated as an optimization problem with respect to W and D.
2.2. Non-Negative Matrix Factorization (NMF)
By combining attributes, NMF can produce, e.g., meaningful patterns. Each feature created by NMF is a linear combination of the original attribute set. Thus, each feature will have a set of coefficients that measure the weightage of each attribute on the feature. Such that, there is a separate coefficient for each numerical attribute and for each distinct value of each categorical attribute. The coefficients are all non-negative, hence the name [16].
2.3. Fast Independent Component Analysis (ICA)
The ICA approach uses statistical independence of the source input to solve the blind signal separation problems. The fast ICA algorithm improves efficiency of ICA. Here, the independent components can be estimated one by one, which is roughly equivalent to conducting projection pursuit [17].
2.4. Mini Batch Sparse Principal Component Analysis (PCA)
Sparse PCA is a variant of PCA. Consequently, Mini Batch Sparse PCA is a variant of Sparse PCA that is faster yet less accurate. The increased speed is reached by iterating over small chunks of the set of features, for a defined number of iterations. Therefore, Mini Batch Sparse PCA performs the dimensionality reduction process using a part of the sample features and at a given number of iterations, to help solve the problem of slow feature decomposition in large samples. It may require tuning for the L1 regularization parameters [18].
2.5. Factor Analysis (FA)
The FA model allows information reduction from a larger set of variables into a smaller one. Such variables are termed “latent variables”. FA is based on the common factor model. FA measures the impact of one specific factor on the measured variables. In short, the mathematical difference between PCA and FA is the use of specific factors for each original variable [19].
3. Description of the Marquetry Samples and Main DL Results Obtained
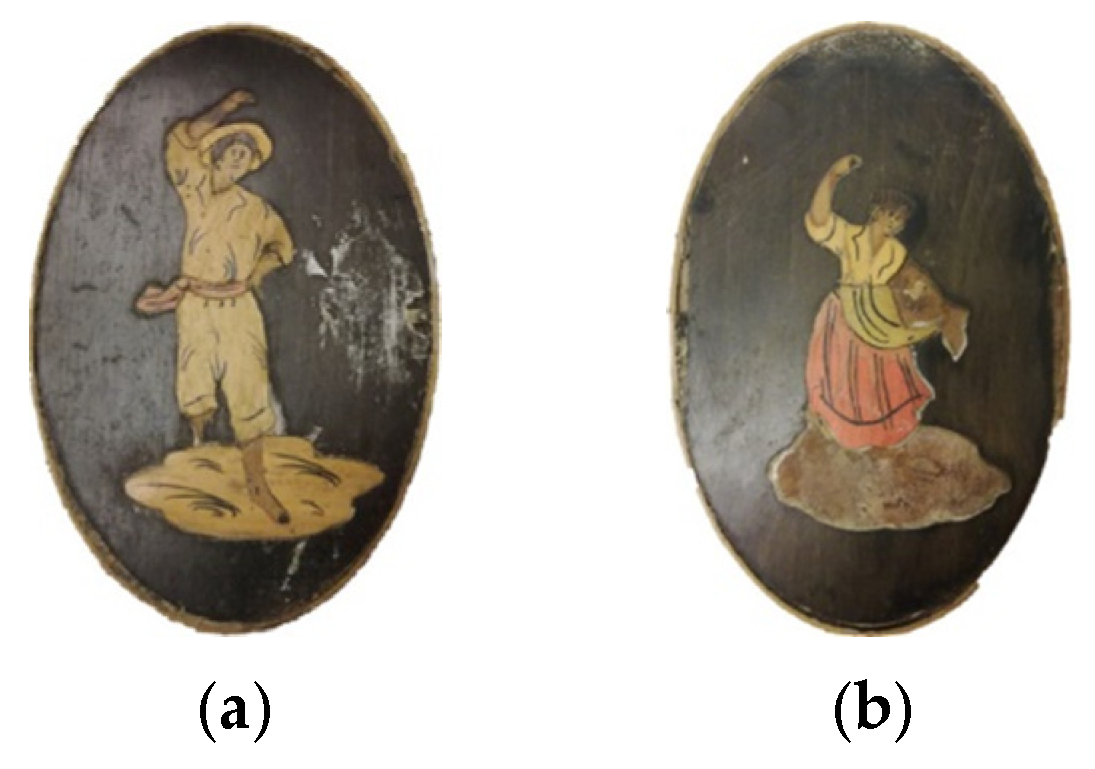
The thickness of the marquetries (19th century) called, for simplicity, Boy and Girl was ~0.5 mm. Multicolored tesserae were applied by means of an adhesive (presumably, a protein glue) on a solid, planar and visible support realized in fruit wood (Figure 1). In the Boy sample (Figure 1a), large detachments can be revealed along with a deformation inherent to tesserae of the ground and of the arm. As for the Girl sample, a lack of tesserae that make up the marquetry is evident on the feet, ground, and left arm (Figure 1b). More information regarding the marquetry samples can be found in [14].
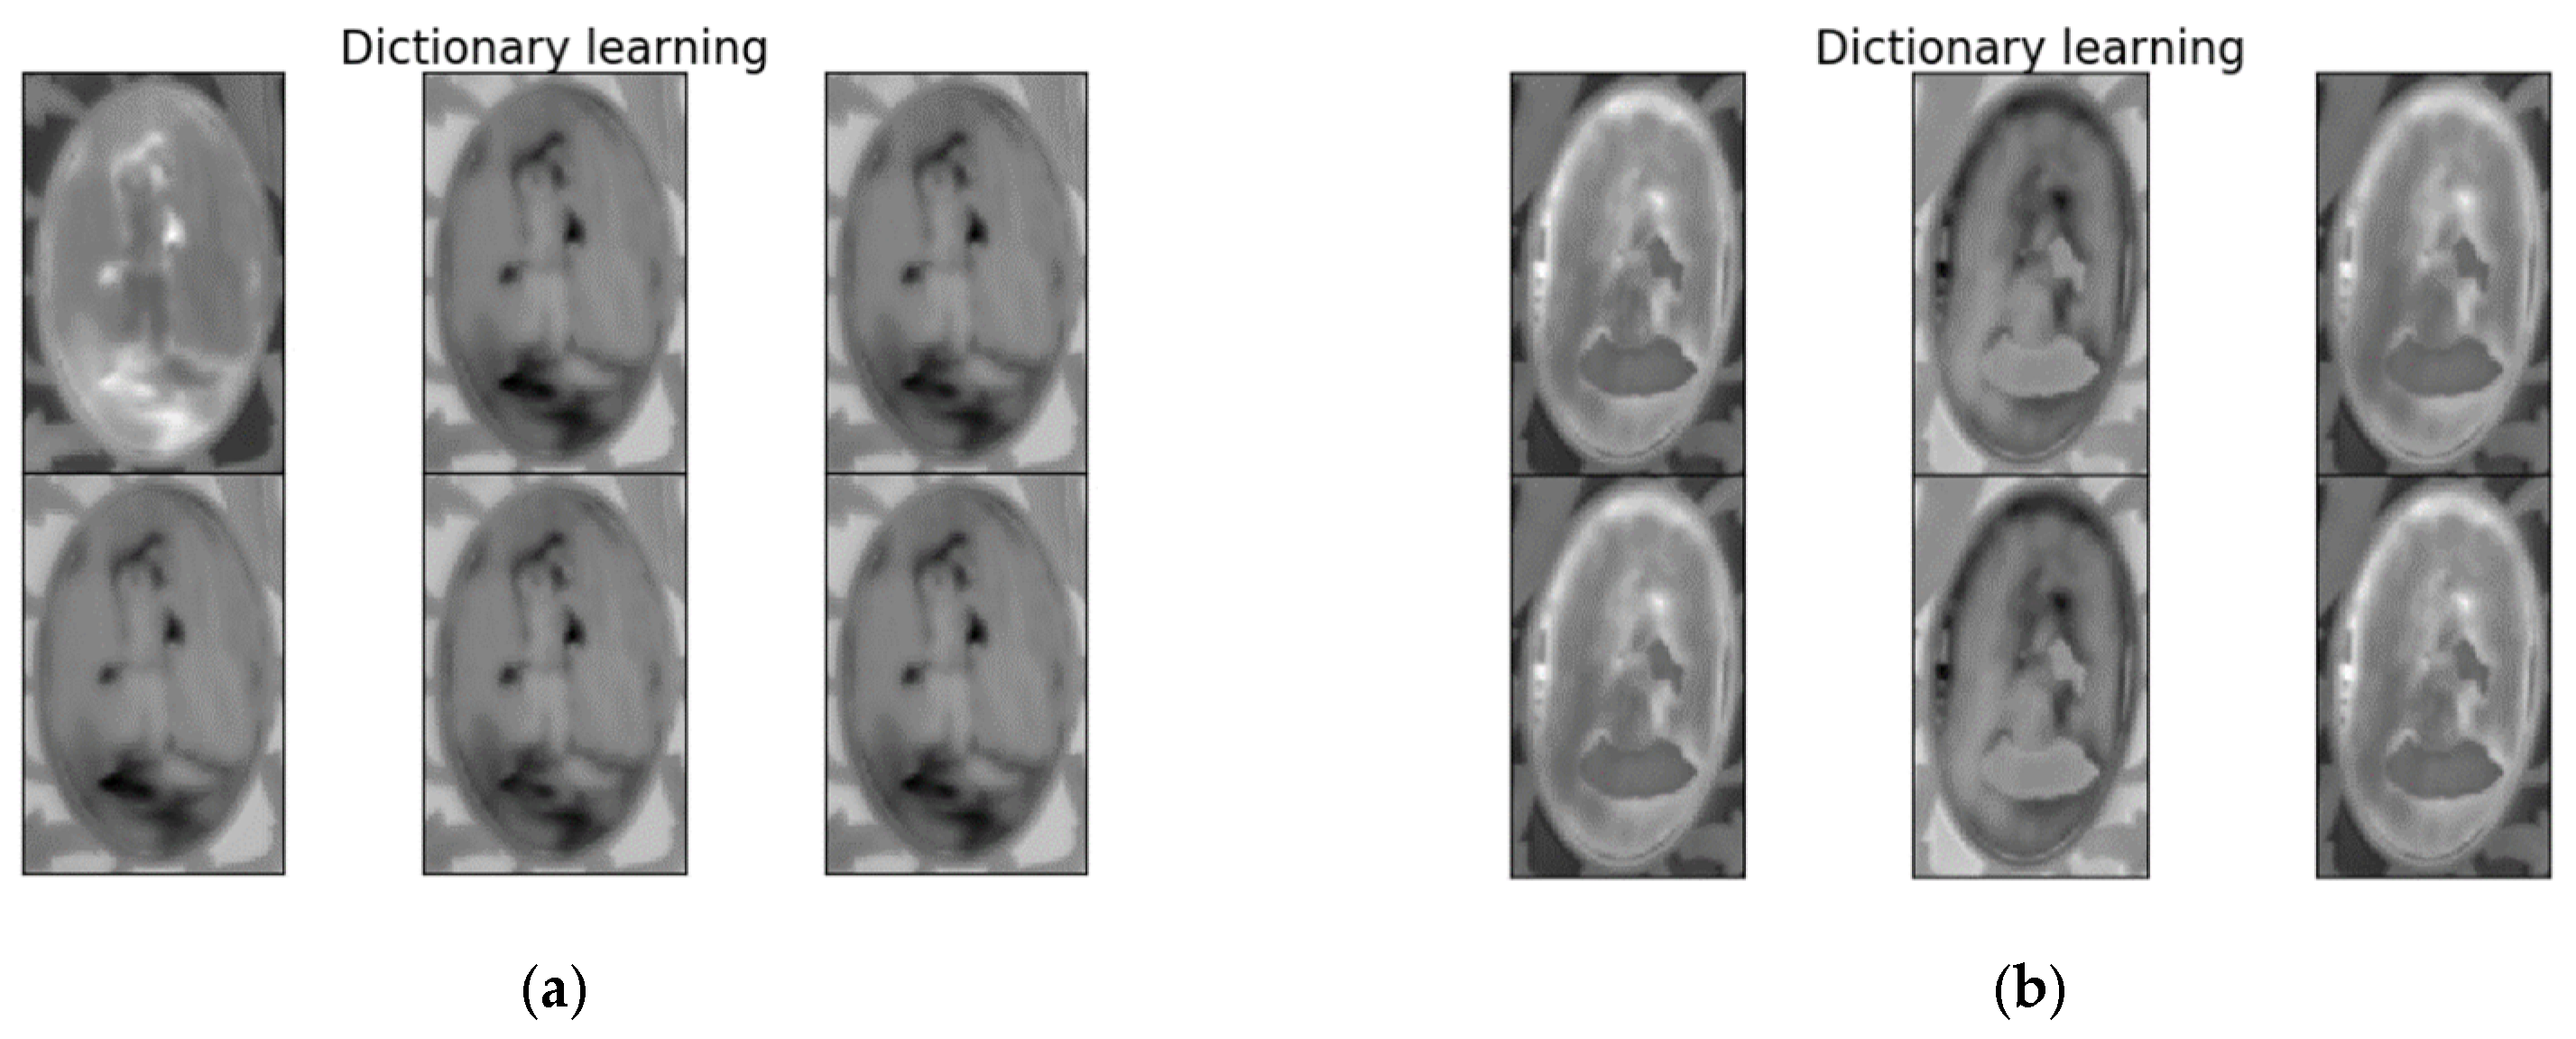
In both cases, DL was able to detect several splitting between the support layer and tesserae, as well as highlighting the areas in which tesserae are missing (Figure 2a,b). In particular, by comparing the marquetries, the Girl sample has more critical splits across the border of the oval frame. It should also be noted that the detachment at the bottom, depicted in the Boy sample, appears larger relative to the rest of the image. The restorer ruled the results an added value and sufficiently accurate for moving to the next step, i.e., the restoration.
4. Conclusions
Several advanced algorithms were applied to raw thermal images acquired on two ancient marquetries with the aim to detect different types of defects. For the sake of brevity, here the authors reported and discussed only the DL results; the remaining presented techniques and algorithms (from Section 2) will be shown during the virtual presentation. The results obtained will help the restoration efforts in repairing similar cultural artifacts. Supervised methods will be used in the future for additional comparative analyses.
Author Contributions
Conceptualization, S.S. and M.O.; methodology, M.O.; software, M.O.; validation, S.S. and M.O.; formal analysis, M.O.; investigation, M.O.; resources, G.G.; data curation, S.S. and M.O.; writing—original draft preparation, S.S. and G.G.; writing—review and editing, S.S. and M.O.; visualization, S.S., G.G. and M.O.; supervision, S.S. and M.O.; project administration, M.O.; funding acquisition, S.S., G.G. and M.O. All authors have read and agreed to the published version of the manuscript.
Funding
This research received no external funding.
Institutional Review Board Statement
Not applicable.
Informed Consent Statement
Not applicable.
Data Availability Statement
Data are available upon reasonable request.
Acknowledgments
Authors would like to thank Gianluca Tartaglia (Academy of Fine Arts in Naples, Italy) for the fruitful discussion concerning the nature of the tesserae used to realize the ancient marquetries.
Conflicts of Interest
The authors declare no conflict of interest.
References
- ICOMOS Charter—Principles for the Analysis, Conservation and Structural Restoration of Architectural Heritage. 2003. Available online: https://www.icomos.org/charters/structures_e.pdf (accessed on 6 July 2021).
- Vavilov, V.; Burleigh, D. Infrared Thermography and Thermal Nondestructive Testing, 1st ed.; Springer: Cham, Switzerland, 2020; p. 598. [Google Scholar]
- Larbi Youcef, M.H.A.; Feuillet, V.; Ibos, L.; Candau, Y. In situ quantitative diagnosis of insulated building walls using passive infrared thermography. Quant. Infr. Therm. J. 2020. [Google Scholar] [CrossRef]
- Suchan, J.; Hendorfer, G. Thermal effusivity determination of carbon fibre-reinforced polymers by means of active thermography. Quant. Infr. Therm. J. 2019. [Google Scholar] [CrossRef]
- Rajic, N. Principal component thermography for flaw contrast enhancement and flaw depth characterization in composite structures. Compos. Struct. 2002, 58, 521–528. [Google Scholar] [CrossRef]
- Shepard, S.M.; Lhota, J.R.; Rubadeux, B.A.; Wang, D.; Ahmed, T. Reconstruction and enhancement of active thermographic image sequences. Opt. Eng. 2003, 42, 1337–1342. [Google Scholar] [CrossRef]
- Vavilov, V.P. Dynamic thermal tomography: Recent improvements and applications. NDT&E Int. 2015, 71, 23–32. [Google Scholar]
- Madruga, F.J.; Ibarra-Castanedo, C.; Conde, O.M.; López-Higuera, J.M.; Maldague, X. Infrared thermography processing based on higher-order statistics. NDT&E Int. 2010, 43, 661–666. [Google Scholar]
- Liu, Y.; Wu, J.-Y.; Liu, K.; Wen, H.-L.; Yao, Y.; Sfarra, S.; Zhao, C. Independent component thermography for non-destructive testing of defects in polymer composites. Meas. Sci. Technol. 2019, 30, 044006. [Google Scholar] [CrossRef]
- Yao, Y.; Sfarra, S.; Ibarra-Castanedo, C.; You, R.; Maldague, X.P.V. The multi-dimensional ensemble empirical mode decomposition (MEEMD): An advanced tool for thermographic diagnosis of mosaics. J. Therm. Anal. Calorim. 2017, 128, 1841–1858. [Google Scholar] [CrossRef]
- Zheng, K.; Chang, Y.-S.; Yao, Y. Defect detection in CFRP structures using pulsed thermographic data enhanced by penalized least squares methods. Compos Part B-Eng. 2015, 79, 351–358. [Google Scholar] [CrossRef]
- Benitez, H.D.; Loaiza, H.; Caicedo, E.; Ibarra-Castanedo, C.; Bendada, A.; Maldague, X. Defect characterization in infrared non-destructive testing with learning machines. NDT&E Int. 2009, 42, 630–643. [Google Scholar]
- Scopus. Available online: https://www.scopus.com/search/form.uri#basic (accessed on 11 July 2021).
- Chulkov, A.O.; Sfarra, S.; Saeed, N.; Peeters, J.; Ibarra-Castanedo, C.; Gargiulo, G.; Steenackers, G.; Maldague, X.P.V.; Omar, M.A.; Vavilov, V. Evaluating quality of marquetries by applying active IR thermography and advanced signal processing. J. Therm. Anal. Calorim. 2021, 143, 3835–3848. [Google Scholar] [CrossRef]
- Kreutz-Delgado, K.; Murray, J.F.; Rao, B.D.; Engan, K.; Le, W.-T.; Sejnowski, T.J. Dictionary learning algorithms for sparse representation. Neural Comput. 2003, 15, 349–396. [Google Scholar] [CrossRef] [PubMed] [Green Version]
- Yousefi, B.; Sfarra, S.; Ibarra-Castanedo, C.; Avdelidis, N.P.; Maldague, X.P.V. Thermography data fusion and nonnegative matrix factorization for the evaluation of cultural heritage objects and buildings. J. Therm. Anal. Calorim. 2019, 136, 943–955. [Google Scholar] [CrossRef] [Green Version]
- Jing, S.; Liu, Q.; Luo, C.; Shi, P. Comparison study of fast independent component analysis and constrained independent component analysis. Vibroeng. PROCEDIA 2018, 20, 57–63. [Google Scholar] [CrossRef]
- de Pierrefeu, A.; Löfstedt, T.; Hady-Selem, F.; Dubois, M.; Jardri, R.; Fovet, T.; Ciuciu, P.; Frouin, V.; Duchesnay, E. Structured sparse principal components analysis with the TV-elastic net penalty. IEEE Trans. Med. Imaging 2018, 37, 396–407. [Google Scholar] [CrossRef] [PubMed] [Green Version]
- Harman, H.H. Modern Factor Analysis, 1st ed.; University of Chicago Press: Chicago, IL, USA, 1976; p. 175. [Google Scholar]
Figure 1.
Marquetry samples: (a) Boy, and (b) Girl.

Figure 2.
Dictionary learning results: (a) Boy, and (b) Girl.

Publisher’s Note: MDPI stays neutral with regard to jurisdictional claims in published maps and institutional affiliations. |
© 2021 by the authors. Licensee MDPI, Basel, Switzerland. This article is an open access article distributed under the terms and conditions of the Creative Commons Attribution (CC BY) license (https://creativecommons.org/licenses/by/4.0/).
Share and Cite
MDPI and ACS Style
Sfarra, S.; Gargiulo, G.; Omar, M. Learning Thermographic Models for Optimal Image Processing of Decorated Surfaces. Eng. Proc. 2021, 8, 13. https://doi.org/10.3390/engproc2021008013
AMA Style
Sfarra S, Gargiulo G, Omar M. Learning Thermographic Models for Optimal Image Processing of Decorated Surfaces. Engineering Proceedings. 2021; 8(1):13. https://doi.org/10.3390/engproc2021008013
Chicago/Turabian StyleSfarra, Stefano, Gianfranco Gargiulo, and Mohammed Omar. 2021. "Learning Thermographic Models for Optimal Image Processing of Decorated Surfaces" Engineering Proceedings 8, no. 1: 13. https://doi.org/10.3390/engproc2021008013