Article

Decomposing Industrial Energy-Related CO2 Emissions in Yunnan Province, China: Switching to Low-Carbon Economic Growth

State Key Laboratory of Water Environment Simulation, School of Environment, Beijing Normal University, Beijing 100875, China
*
Author to whom correspondence should be addressed.
Energies 2016, 9(1), 23; https://doi.org/10.3390/en9010023
Submission received: 28 July 2015 / Revised: 19 November 2015 / Accepted: 7 December 2015 / Published: 4 January 2016
(This article belongs to the Special Issue Economics of Bioenergy 2015)

Abstract

:
As a less-developed province that has been chosen to be part of a low-carbon pilot project, Yunnan faces the challenge of maintaining rapid economic growth while reducing CO2 emissions. Understanding the drivers behind CO2 emission changes can help decouple economic growth from CO2 emissions. However, previous studies on the drivers of CO2 emissions in less-developed regions that focus on both production and final demand have been seldom conducted. In this study, a structural decomposition analysis-logarithmic mean Divisia index (SDA-LMDI) model was developed to find the drivers behind the CO2 emission changes during 1997–2012 in Yunnan, based on times series energy consumption and input-output data. The results demonstrated that the sharp rise in exports of high-carbon products from the metal processing and electricity sectors increased CO2 emissions, during 2002–2007. Although increased investments in the construction sector also increased CO2 emissions, during 2007–2012, the carbon intensity of Yunnan’s economy decreased substantially because the province vigorously developed hydropower and improved energy efficiency in energy-intensive sectors. Construction investments not only carbonized the GDP composition, but also formed a carbon-intensive production structure because of high-carbon supply chains. To further mitigate CO2 emissions in Yunnan, measures should promote the development and application of clean energy and the formation of consumption-based economic growth.

1. Introduction

As the top CO2 emitter in the world, China’s annual CO2 emissions in 2013 were more than the sum of the amount from the United States and the European Union (EU) [1]. In addition, its per capita CO2 emissions exceeded the EU for the first time [1]. Facing severe international pressure to mitigate its CO2 emissions, China has pushed its provinces to reduce their CO2 emissions. As a mitigating action, China’s central government has chosen provinces to conduct pilot work in low-carbon development in alignment with the development stage and characteristics of the different regions. Yunnan province was chosen as a pilot province and tasked with finding ways to achieve low-carbon transition by utilizing its underdevelopment to its advantage [2]. Yunnan is located in southwest China and is famous for its abundant hydropower, tourism and biological and cultural diversity [3] (see Figure S1 in the Supplementary Materials (SM)). The per capita gross domestic product (GDP) in Yunnan is approximately 60% of the national average [4]. In 2012, approximately 17% of the population (approximately eight million) was labeled as living in poverty [5]. Thus, Yunnan faces challenges to develop its economy and reduce poverty.
Since the 12th Five Year Plan (FYP) period (2010–2015), the central government has set a compulsory target to reduce the carbon intensity (CO2 emissions per unit of GDP) by 17% and has disaggregated the target to its provinces [6]. As one of China’s low-carbon pilot provinces, the carbon intensity reduction target in Yunnan is higher than the national government’s standard for the country as a whole [2]. In 2014, the central government further committed to prevent CO2 emissions from increasing after 2030 [7] instead of only reducing the carbon intensity. Under these circumstances, in the near future, Yunnan will face an even stricter target for controlling the volume of its CO2 emissions. To achieve these targets, Yunnan faces large challenges in its transition to a low-carbon future.
From 1997–2012, Yunnan’s total energy consumption more than tripled, rising from 34.3 million tons (Mt) of coal equivalent in 1997 to 104.3 in 2012 (Figure 1). The total energy-related CO2 emissions grew 3.5-times during the same period, from 56.6 Mt–197.1 Mt (Figure 1). The CO2 emissions are predicted to reach 216.6 Mt in 2015 and 278.3 Mt in 2020 [8]. Industrial CO2 emissions in Yunnan increased by 209.6% during the period 1997–2007, a figure that is 102.4% higher than the national growth rate over the same period [9]. This growth rate is 4.6-, 2.6- and 1.5-times greater than that of Beijing municipality [10], Liaoning province [11] and Jiangsu province [12], respectively. These facts raise a question: what are the driving forces behind the rapid growth of CO2 emissions in a less-developed region with abundant low-carbon resources? From 1997–2012, the carbonization process of Yunnan’s economy experienced three different stages (Figure 1). From 1997–2002, low CO2 emission growth was accompanied by low economic growth. During this period, the average annual CO2 emission elasticity ratio (CEER) (industrial CO2 emissions’ growth rate/GDP growth rate) was one. From 2002–2007, a high CO2 emissions increase was accompanied by rapid economic growth. The average annual CEER in this period was 1.6. From 2007–2012, a low CO2 emissions increase was accompanied by rapid economic growth. During this period, the average annual CEER was 0.4. It can be seen that from 2007–2012, Yunnan experienced relatively low-carbon economic growth. The factors driving the changes in the economic growth pattern in Yunnan have attracted our attention because the question of how to achieve rapid economic growth in less-developed regions while maintaining relatively low CO2 emissions is important and is a challenge for policy makers [13].
Figure 1. Annual GDP growth rate, total energy consumption and related CO2 emissions in Yunnan from 1997–2012.
Energies 09 00023 g001
Currently, research on CO2 emissions in Yunnan focuses on CO2 inventories [14], and prediction analysis is based on the realization of carbon intensity reduction targets [8]. These studies have provided some data resources and analytical approaches for low-carbon development in Yunnan. However, empirical studies on the drivers of Yunnan’s CO2 emissions that focus on the entire economic system from both production and final demand perspectives have been insufficient, lacking a relevant basis for formulating a low-carbon economic growth policy. Thus, an in-depth analysis to identify the drivers of CO2 emission changes is helpful for finding a way to decouple the economic growth from CO2 emissions in Yunnan.
There are two main decomposition techniques for identifying the drivers: structural decomposition analysis (SDA) and index decomposition analysis (IDA) [15]. The latest comparisons between IDA and SDA are shown in [16]. IDA has been applied to analyze the drivers of CO2 emissions in China [17,18,19]. However, it can only analyze direct CO2 emissions and provides fewer details about economic sectors than SDA. [20]. Compared to IDA, SDA is based on environmental input-output analysis [21], which is a widely-accepted method for quantifying sectoral CO2 emissions considering both direct effects from the production process and indirect effects from the entire supply chain [16]. For the regional economy in Yunnan, SDA can analyze more comprehensive issues and is helpful for the low-carbon management of the entire economic chain from production to final demand. Because of the advantages of SDA, it was widely applied to analyze the drivers of the increase of CO2 emissions in China as a whole [9,20,22] and in specific regions, such as Beijing [10,23], Jiangsu [12] and Liaoning [11]. These studies contributed to understanding the determinants of changes in CO2 emissions and to forming policy implications that are suitable for local conditions. However, all of these studies focus on the national level or on developed regions in eastern China. Studies for less-developed regions (such as Yunnan province) in central or western China are not sufficient. Low-carbon development in less-developed regions is vital to achieve China’s national carbon reduction target, because emissions in those regions are projected to increase substantially in the coming decades. In the time scale, most of these studies analyzed drivers from 1997–2007, but the impact of the 2008 Global Financial Crisis on changes in regional CO2 emission drivers has seldom been analyzed. Moreover, these studies did not analyze the impact of changes in the GDP composition on CO2 emissions. For the less-developed regions, GDP composition greatly changed over time; therefore, it is very important to study how GDP composition changes affect regional CO2 emissions.
There are different decomposition forms in SDA, such as additive and multiplicative SDA [16]. The specific decomposing methods in SDA are also abundant, such as the method developed by Dietzenbacher and Los [24] (D&L) and the logarithmic mean Divisia index (LMDI) method [16]. Su and Ang [16] reviewed the new development of SDA in energy and emission fields and provided a guide on method selection in additive SDA for empirical studies. According to the review of the literature from 2000–2010 by Su and Ang [16], most energy and emission SDA research applied an additive SDA form and D&L method. However, recent SDA research on changes in the CO2 emissions embodied in exports [25] and carbon intensity [26] in China applied the multiplicative SDA form. Due to the advantages of the simple decomposition process and the easy results representation [16], the additive SDA form is adopted in this study. The wide applications of additive SDA in China have proven its applicability and practicality. For methods selection in additive SDA, Su and Ang [16] have suggested that the LMDI method should be selected when the factors are more than four. However, all of the SDA studies in China’s regions applied the D&L method [24]. The SDA-D&L model has non-unique decomposition problems, and when the drivers increase, the calculation will increase greatly [16]. Compared to the SDA-D&L model, the SDA-LMDI model is characterized by a simple expression, and its computation requirements are minimal [27]. The advantages of the SDA-LMDI model are more obvious for studies with four or more drivers [16]. Since the number of factors is seven in this study and the LMDI method is easy to use and has a simple computation in this situation, the LMDI method was selected in the decomposition analysis following the suggestions by Su and Ang [16]. At present, the SDA-LMDI model has been widely used in different countries and regions to analyze the driving forces behind changes in the economic systems [27], energy consumption and energy intensity [28,29] and greenhouse gas (GHG) emissions [30]. All of the previous research indicated that the SDA-LMDI model is applicable to this study.
This paper has two aims. The first is to understand the factors that drove the rapid CO2 emissions’ growth in Yunnan from 1997–2012. The second is to determine how the drivers contributed to the relatively low-carbon economic growth pattern in Yunnan from 2007–2012. We focused on the low-carbon development of the less-developed regions, of which Yunnan is the best case. Based on newly-released data, the time scale was extended to 2012. Seven drivers were analyzed in our decomposition analysis, including changes in the GDP composition. We focused on analyzing energy-related CO2 because of the availability of data and the large share of energy-related CO2 in the total emissions. According to China’s GHG inventories [31], energy-related CO2 accounted for more than 90% of the total CO2 emissions. Following other SDA research, we focused on the emissions created by the production of goods and services for consumers and did not consider the direct fuel use of households [20]. Direct CO2 emissions from household energy consumption accounted for 4%–16% of the total emissions in Yunnan and continued to decline with the development of the economy (Figure 1).
The contents of the next sections are as follows: Section 2 is the description of the SDA-LMDI model employed in this paper, along with information on the data sources and the required preparation processes for using the data. Section 3 presents the results from the analysis, an in-deep discussion of them and a number of policy recommendations. Section 4 offers conclusions.

2. Method and Data

2.1. Method

Before conducting SDA, some assumptions in the input-output analysis framework should be made. The most important assumptions are “processing and normal exports” [32] and “competitive versus non-competitive imports” [33]. Uniform exports are assumed in this study, which means that processing and normal exports have the same input structures, since the processing exports in Yunnan are less and the data of processing and normal exports in the interregional exports for a region in China are unavailable. Imports are assumed as a competitive import assumption. Since Yunnan’s primary input-output tables (IOTs) are compiled based on the competitive import assumption, excluding imports from these IOTs will cause the information on regional imports to be missed and will introduce uncertainties into the final results (see more discussions on the technology assumption about imports in the SM).
Changes in regional CO2 emissions are affected by many factors [34]. The SDA-LMDI model can be used to analyze each factor’s contribution to CO2 emission changes from the perspective of the entire economic system. The model can be expressed mathematically as Equation (1):
e = F ( I A ) 1 y = F L y
where e =   ( e i ) is the n × 1 vector of CO2 emissions from n sectors in an industrial system and e i is the direct CO2 emissions from the i-th sector’s production. This means the CO2 emission responsibilities are allocated to the producers under Equation (1). In addition, F = ( f i j ) is an n × n diagonal matrix, where the diagonal element f i i   is the ratio of the CO2 emissions from sector i to the sector’s total output; i.e., the direct carbon intensity (DCI) of sector i. I is the n × n identity matrix. The n × n matrix A =   ( a i j ) is the direct requirement coefficient matrix, where a i j is the value of the intermediate products sector i required to bring about a unit increase in the output of sector j. L =   ( I A ) 1 =   ( l i j ) is the n × n Leontief inverse matrix, where l i j represents the output increase of sector i by a unit increase in final demand in sector j. y = ( y i )   is an n × 1 vector, where   y i represents the final demand of sector i.
The vector y can be further divided into four components: final demand structure, W ; GDP composition, v ; per capita GDP, g ; and population, p   . Each element, w i k , in the n × m matrix, W , represents the contribution rates of the products demanded by sector i to the sum of the k-th final demand column, where k indicates the final demand categories, such as household consumption, government consumption, capital investment, exports and imports and m indicates the number of final demand categories. The element v k in the m × 1 vector v indicates the total of k-th final demand conlumn divided by GDP. Similarly, F can be further divided into three components: CO2 emission coefficient, c ; energy structure, J ; and energy intensity, Q . The element c d in the 1 × z vector c is the CO2 emission coefficient of energy d, and z indicates number of energy types. Each element, j d i , in the z × n matrix, J , represents the proportion of the amount of energy d in the total energy consumption by sector i. Q = ( q i j ) is an n × n diagonal matrix, where the diagonal element q i i   is the ratio of the energy consumption from sector i to the sector’s total output; i.e., the energy intensity of sector i. As a result, CO2 emissions (Equation (2)) can be specified as follows:
e = c J Q L W v g p
As CO2 emission coefficient c is constant in different years, changes in the technology (or energy efficiency) of the economic system are captured by two drivers, which are the changes in the energy structure and changes in the energy intensity. Therefore, seven CO2 emission drivers are finally included in this study. The purpose of decomposition is to demonstrate changes in CO2 emissions, Δ e , in a particular period through the variation of each factor in Equation (2) as follows (Equation (3)):
Δ e =   Δ J + Δ Q +   Δ L +   Δ W +   Δ v + Δ g + Δ p
where Δ J indicates changes in the energy structure; Δ Q represents changes in the energy intensity; Δ L means changes in the Leontief inverse matrix (i.e., changes in the production structure); Δ w is changes in the final demand structure; Δ v is changes in the GDP composition; Δ g is changes in the per capita GDP; and Δ p is changes in the population.
In this study, changes in the CO2 emissions have been decomposed into seven factors. De Boer [27] has developed the detailed model on which our work is based by utilizing two factors as an example. By extending De Boer’s development in a similar manner to seven factors, we obtain the following: e = c J Q L w v g p , where e i =   d = 1 z j = 1 n k = 1 m c d j d i q i i l i j w j k v k g p .     Taking 0 and 1 to represent the base year and end year, respectively, and setting e d i j k =   c d j d i q i i l i j w j k v k g p , the following equations can be deduced (Equations (3a)–(3g)):
Δ J = d = 1 z j = 1 n k = 1 m e d i j k ( 1 ) e d i j k ( 0 ) l n [ e d i j k ( 1 ) e d i j k ( 0 ) ] l n [ j d i ( 1 ) j d i ( 0 ) ]
Δ Q = d = 1 z j = 1 n k = 1 m e d i j k ( 1 ) e d i j k ( 0 ) l n [ e d i j k ( 1 ) e d i j k ( 0 ) ] l n [ q i i ( 1 ) q i i ( 0 ) ]
Δ L = d = 1 z j = 1 n k = 1 m e d i j k ( 1 ) e d i j k ( 0 ) l n [ e d i j k ( 1 ) e d i j k ( 0 ) ] l n [ l i j ( 1 ) l i j ( 0 ) ]
Δ W = d = 1 z j = 1 n k = 1 m e d i j k ( 1 ) e d i j k ( 0 ) l n [ e d i j k ( 1 ) e d i j k ( 0 ) ] l n [ w j k ( 1 ) w j k ( 0 ) ]
Δ v = d = 1 z j = 1 n k = 1 m e d i j k ( 1 ) e d i j k ( 0 ) l n [ e d i j k ( 1 ) e d i j k ( 0 ) ] l n [ v k ( 1 ) v k ( 0 ) ]
Δ g = d = 1 z j = 1 n k = 1 m e d i j k ( 1 ) e d i j k ( 0 ) l n [ e d i j k ( 1 ) e d i j k ( 0 ) ] l n [ g ( 1 ) g ( 0 ) ]
Δ p = d = 1 z j = 1 n k = 1 m e d i j k ( 1 ) e d i j k ( 0 ) l n [ e d i j k ( 1 ) e d i j k ( 0 ) ] l n [ p ( 1 ) p ( 0 ) ]
The model is characterized by simple expressions, and the calculations are straight-forward. However, difficulty in applying the model arises when there is a zero or negative number in the dataset. To solve this problem, we follow the practice of De Boer [27] and replace the zero value in the preliminary dataset with 10−29. For negative numbers, we follow the processing method of Ang and Liu [35].
From the consumption perspective, CO2 emissions can be allocated to the sectors whose products were consumed by the final demand categories [36,37], which can be expressed mathematically as (Equation (4)):
e f = F f ( I A ) 1 y f = T y f
where e f =   ( e i f ) is the 1 × n vector of CO2 emissions caused by the n sectors’ final demand consumption and e i f is the CO2 emissions from the consumption of i-th sector’s products. This means that the CO2 emission responsibilities are allocated to the consumers under Equation (4). In addition, F f = ( f i f ) is a 1 × n vector, where the element f i f   is the DCI of sector i. T = F f ( I A ) 1 = ( t i ) is a 1 × n vector, where the element t i   is the total carbon intensity (TCI) of sector i, which represents CO2 emissions from sector i’s supply chains (including direct and indirect emissions) by the final demand unit products’ value from sector i. Therefore, indirect carbon intensity (ICI) can be obtained by TCI minus DCI. y f = ( y i j f ) is an n × n diagonal matrix, where the diagonal element y i i f represents the final demand of sector i.

2.2. Data Sources and Processing

Two datasets were employed in our analysis: the input-output tables (IOTs) in time series and the sectoral energy use and CO2 emission factor statistics. In China, provincial IOTs are published every five years, and the most recent IOT is from 2012. Yunnan’s IOTs for 1997, 2002, 2007 and 2012 were obtained from the Yunnan Statistical Bureau. The 1997 Table contained 40 sectors, whereas other tables contained 42 sectors. Nineteen types of energy sources were included in the calculations: raw coal, cleaned coal, other washed coal, briquettes, coke, coke oven gas, other gas, crude oil, gasoline, kerosene, diesel, fuel oil, liquefied petroleum gas, natural gas, other petroleum products, other coke products, heat, electricity and other energy. The energy data for agriculture, industry, construction, transport, storage and post, wholesale, retail trade and hotels, restaurants and other services originated from Yunnan’s energy balance sheets from 1997, 2002, 2007 and 2012, which can be found in the China Energy Statistical Yearbooks for the various years [38]. Energy data for the industrial sub-sectors for the years 2002, 2007 and 2012 came from the Yunnan Energy Statistical Yearbook [39]. Energy data for the industrial sub-sectors in 1997 were missing. To compensate, these data were estimated based on the total industrial energy data that are provided in available energy balance sheets and the energy proportion of industrial sub-sectors in 2000.
The energy and CO2 emission statistics were processed following the method proposed by Peters et al. [40] and the National Development and Reform Commission of China [31]. Because coal usage in China is usually inefficient [41], instead of the default values of the Intergovernmental Panel on Climate Change (IPCC), we employed the specific CO2 emission factors (including carbon content, net calorific value and carbon oxidation factors), which are more suitable for China [31]. The final demand columns of Yunnan’s 2007 and 2012 IOTs consisted of rural residential consumption, urban residential consumption, government consumption, fixed capital formation, stock changes, interprovincial and international exports and interprovincial and international imports. One of the final demand columns in the Yunnan 1997 IOT is called “others”, which represents the margin of error among different data sources [20]. In our analysis, each sector’s total output in 1997 was calculated as the sum of intermediate deliveries and final demand; thus, the “others” column was excluded [12]. Because Yunnan’s 1997 and 2002 IOTs did not differentiate interprovincial and international trade, they were combined into two columns titled exports and imports. Since we do not know the detailed sources of imports, we assumed that all imports are produced under the same conditions in Yunnan; therefore, the emissions embodied in these imports were designated as the “emissions avoided in Yunnan through imports” [20]. By synthesizing sectors in the IOTs and sectors with available energy data, all of the sectors were combined into a total of 29 sectors according to “classification of national economic industries (GB/T 4754-2011, GB/T represents the recommended national standards and it is the abbreviation of Guo Biao/Tui in Chinese.)” [42] (Table 1). To avoid the influence of price changes, we utilized the double deflation method [43] and transformed all of the IOTs into constant prices in 2002. Price index data were obtained from the Yunnan Survey Yearbook 2014 [5], and population data were taken from the Yunnan Statistical Yearbook [4] (see more discussions on the double deflation method in the SM).
After comprehensively considering the availability of sectoral energy data and the consistency of sector classification in IOTs from different years, 29 sectors were finally adopted in this study. However, this would cause sector aggregation issues mentioned by Su et al. [44]. Through comparing the results of CO2 emissions embodied in China and Singapore’s exports under different sector aggregation situations, Su et al. [44] suggested a sector aggregation of more than 40 sectors. If so, the 29 sector aggregation in this study might cause some uncertainties to the results. In addition, the extended IOTs in 2000, 2005 and 2010 were not compiled in Yunnan, instead being done at the national scale or for some developed regions, such as Beijing. Therefore, the time intervals of IOTs were determined as 5 years in this study. This would cause the temporal aggregation issues mentioned by Su and Ang [45], and also cause some uncertainties to the results. Furthermore, the trend of changes in the drivers would be missed and regarded as some kind of average values within the sub-periods 1997–2002, 2002–2007 and 2007–2012, respectively. Missing some peculiarities of the drivers would increase the uncertainties when the results were discussed. As these uncertainties existed, the results in this study were regarded as approximate values. However, these uncertainties were unlikely to extremely affect the scale and trend of the results in any one direction [46]. Keeping these uncertainties in mind, detailed and in-depth analysis and discussions were conducted by combining our results with other statistics and materials in both official publications and literature, before policy suggestions were made. The results and discussions could be improved when more detailed data are available.
Table 1. Sectoral carbon intensity in 1997, 2002, 2007 and 2012 in Yunnan (unit: tons/104 Yuan of 2002 constant price).
SectorsDirect Carbon Intensity Indirect Carbon Intensity Total Carbon Intensity
1997200220072012 1997200220072012 1997200220072012
1-AGRAgriculture0.30.40.40.3 1.22.01.41.4 1.52.41.81.7
2-MWCMining and washing of coal8.24.12.00.2 1.47.55.64.1 9.611.67.64.3
3-EPNExtraction of petroleum and natural gas0.00.00.00.0 0.05.40.00.0 0.05.40.00.0
4-MPMMining and processing of metal ores1.41.61.71.1 2.87.26.55.5 4.28.88.26.6
5-MPNMining and processing of nonmetal ores1.11.13.81.6 3.56.56.85.5 4.67.610.67.1
6-MFTProcessing and manufacture of food and tobacco0.20.10.20.1 0.71.81.00.8 0.91.91.20.9
7-MOTManufacture of textiles0.40.52.71.0 2.14.43.62.3 2.54.96.33.3
8-MCLManufacture of clothes, leather and related products0.30.30.50.1 2.33.53.11.7 2.63.83.61.8
9-MWFManufacture of wood products and furniture0.20.50.60.1 4.55.03.01.3 4.75.53.61.4
10-PMPPaper making, printing and articles manufacture0.50.40.80.5 3.54.02.12.0 4.04.42.92.5
11-PPCPetroleum processing and coking 6.310.61.51.2 4.57.43.62.8 10.818.05.14.0
12-CHEChemistry3.94.01.91.9 5.96.75.93.7 9.810.77.85.6
13-MNMManufacture of non-metallic mineral products6.04.615.57.0 5.26.97.75.3 11.211.523.212.3
14-SPMSmelting and pressing of metals5.85.22.82.8 6.98.14.23.6 12.713.37.06.4
15-MMPManufacture of metal products0.20.30.20.1 8.08.54.33.3 8.28.84.53.4
16-MGSManufacture of general and special purpose machinery0.30.30.20.1 3.86.83.53.2 4.17.13.73.3
17-MTEManufacture of transportation equipment0.30.20.10.2 4.15.92.72.6 4.46.12.82.8
18-MEMManufacture of electrical machinery and equipment0.00.10.00.0 5.96.74.63.8 5.96.84.63.8
19-MCEManufacture of communication and electronic equipment0.90.50.00.0 3.84.52.51.4 4.75.02.51.4
20-IMCManufacture of measuring instruments and machinery for cultural activity and office work0.00.00.00.0 4.45.62.81.9 4.45.62.81.9
21-MAOManufacture of artwork and other manufacturing0.00.10.30.7 4.26.13.22.4 4.26.23.53.1
22-RDWRecycling and disposal of waste0.10.10.10.0 0.00.00.00.3 0.10.10.10.3
23-PSEProduction and supply of electric and heat power30.211.112.96.8 3.95.28.74.5 34.116.321.611.3
24-PSGProduction and supply of gas5.32.84.60.1 5.57.03.71.4 10.89.88.31.5
25-PSWProduction and supply of water0.10.00.00.0 2.95.11.62.5 3.05.11.62.5
26-CONConstruction0.10.10.10.1 5.47.25.84.5 5.57.35.94.6
27-TSPTransport, storage and post1.53.33.74.1 2.86.32.32.2 4.39.66.06.3
28-WRHWholesale, retail trade and hotel, restaurants0.10.10.10.2 1.62.11.41.2 1.72.21.51.4
29-OSEOther services0.10.10.00.1 1.52.71.71.5 1.62.81.71.6

3. Results and Discussion

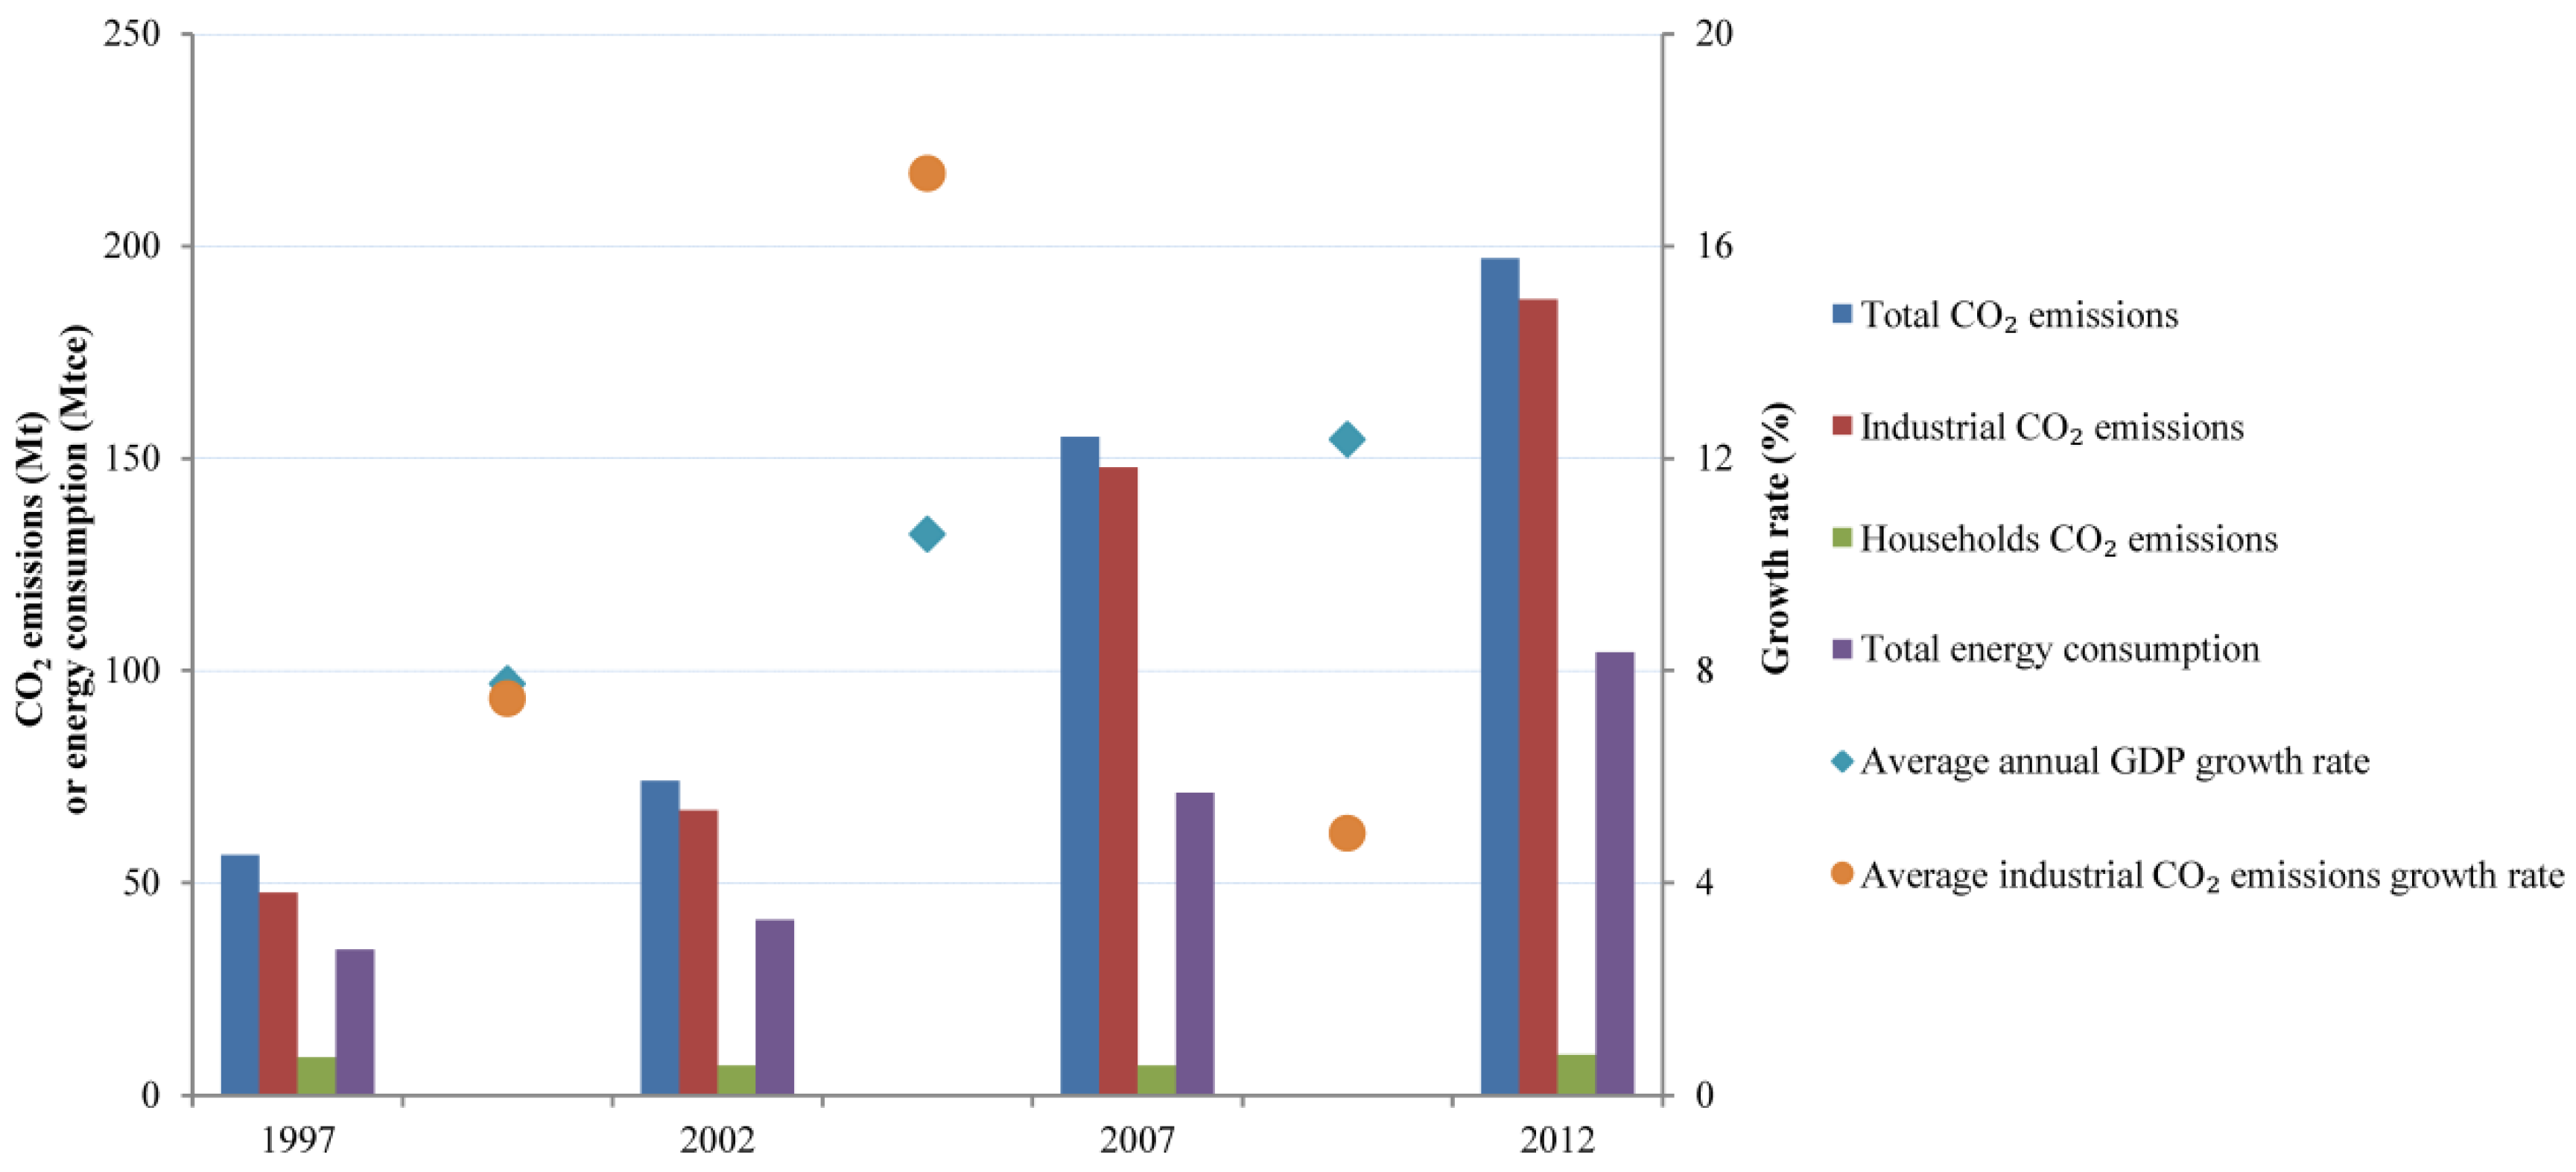
3.1. Overall Trend of CO2 Emission Variations in Yunnan from 1997–2012

From 1997–2012, Yunnan’s industrial CO2 emissions grew from 47.8 Mt–187.6 Mt, a four-fold increase. Most of this total growth of 139.8 Mt was concentrated in the period 2002–2007. In this period, CO2 emissions grew by 80.9 Mt, which constitutes 57.9% of the growth that occurred in the 1997–2012 period, with the remaining 28.2% (39.5 Mt) in 2007–2012 and 13.9% (19.4 Mt) in 1997–2002.
From a production perspective, 23-PSE (production and supply of electric and heat power) (33.7%), 14-SPM (smelting and pressing of metals) (29.6%), 27-TSP (transport, storage and post) (12.3%) and 13-MNM (manufacture of non-metallic mineral products) (10.6%) contributed 86.2% (120.5 Mt) of the total CO2 emissions increase during 1997–2012 (see Table S1 in SM). These sectors have a high DCI in their production processes (Table 1) and their contributions to the CO2 emissions increase were much larger than their contributions to GDP growth (Table S1). From a final demand perspective, 26-CON (construction) (64.8%), 14-SPM (35.7%), 29-OSE (other services) (19.6%) and 23-PSE (10.7%) contributed 130.9% (183.0 Mt) of the total CO2 emissions increase (Table S2 in SM). 14-SPM and 23-PSE not only have a high DCI, but also a high TCI (Table 1). The DCI for 26-CON and 29-OSE is extremely low, whereas their TCI is much higher than their DCI (Table 1). The expansion of the final demand volume of products in these sectors will boost their carbon-intensive supply chains. For example, the final demand sector 26-CON increased its CO2 emissions by 90.7 Mt during 1997–2012 with 28.2% contributed by 13-MNM, 25.9% by 23-PSE, 23% by 14-SPM and 10.4% by 27-TSP in the construction supply chains (Figure 2). Compared to most other sectors, 29-OSE has lower carbon intensity in both DCI and TCI (Table 1). The increments of expenditure on products from 29-OSE have a 33.7% share in GDP, while contributing only 19.6% to the CO2 emissions increase (Table S2) (see more analysis about sectoral carbon intensity changes in the SM).
Figure 2. Major sectors contributing to the CO2 emissions increase from the final demand perspective during 1997–2012 and their carbon-intensive supply chains.
Energies 09 00023 g002

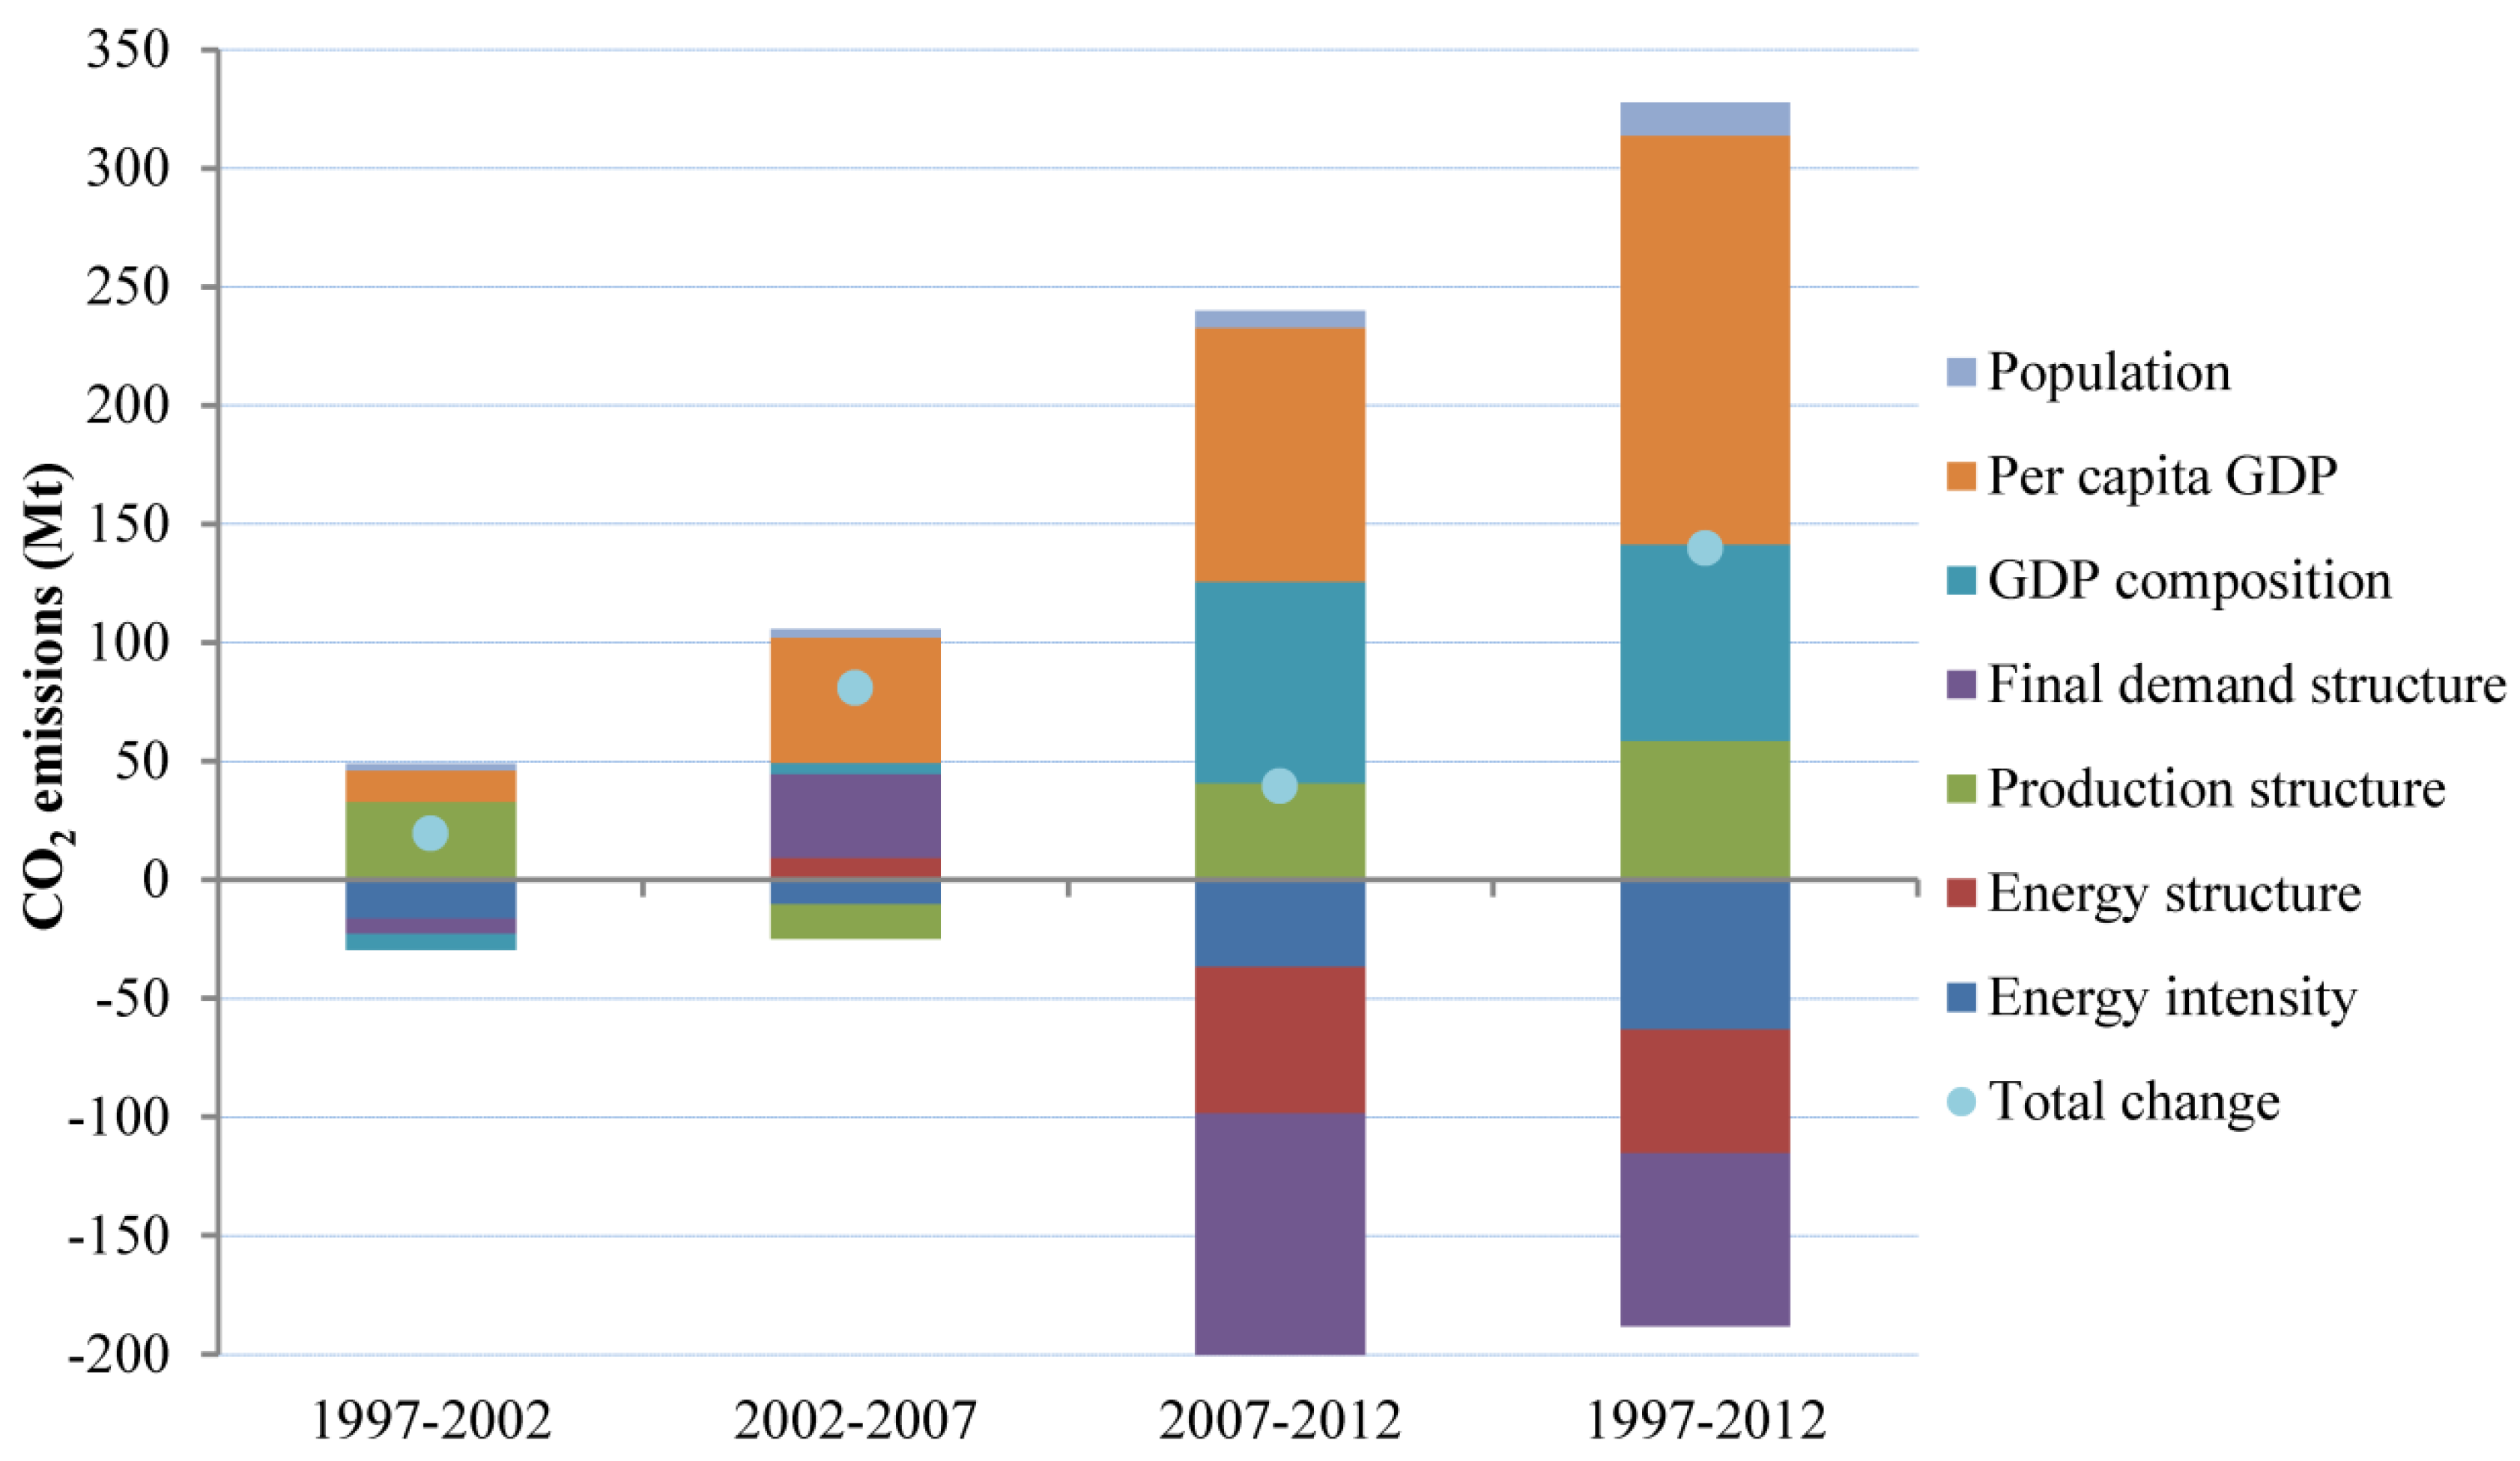
3.2. Drivers from Decomposition Analysis

The largest driver of changes in CO2 emissions was the growth of per capita GDP, leading to a 172.5-Mt CO2 emissions increase from 1997–2012 (Figure 3). In the previous decades, Yunnan had been struggling to develop its economy and reduce poverty. The per capita GDP of Yunnan in 2012 was more than 3.5-times that of 1997 [4]. Yunnan’s per capita GDP is expected to continue increasing to catch up with other developed regions in China, which will signify its contribution to CO2 emission increments in the following decades.
Figure 3. Drivers contributing to changes in Yunnan’s industrial CO2 emissions in different time periods from a decomposition analysis.
Energies 09 00023 g003
The second largest driver was GDP composition change, causing an 82.7-Mt increase in CO2 emissions from 1997–2012 (Figure 3). The sub-periods data showed a positive correlation between changes in the fraction of capital investment in GDP and CO2 emissions (see Figure 3 and Table 2). The Yunnan government was aware of the problem and aimed to decrease capital investment in its economy since the 11th FYP period (2006–2010) [47], but this policy did not achieve the desired effect because of the Global Financial Crisis. Under the impact of the four-trillion-Yuan stimulus plan in China [48], the fraction of capital investment in GDP increased by 38.9% during 2007–2012 in Yunnan (Table 2). This GDP composition change caused an 84.9-Mt increase in CO2 emissions during this period (Figure 3).
Table 2. Changes in the GDP composition in Yunnan from 1997–2012 (unit: %).
YearFraction of Investment in GDPFraction of Consumption in GDPFraction of Exports in GDP
199742.859.833.3
200239.868.438.1
200744.361.963.8
201283.261.251.5
Production structure modifications caused a 58.6-Mt increase in the total CO2 emissions during 1997–2012 (Figure 3). This production structure change reflects the expansion of the heavy industry in Yunnan as it transitioned from an economy dominated by the tobacco industry [49]; the proportion of heavy industry among total industry increased from 47.8% in 1997 to 69.5% in 2012 [4]. During 2002–2007, changes in the production structure had a positive effect decreasing CO2 emissions by 14.9 Mt (Figure 3). This seemed to be the policy dividend of Yunnan’s promotion of development in the green economy since 2000 [50]. Relatively low-carbon industries, such as biological development and tourism, developed rapidly during this period [47], but these benefits were stopped by the 2008 Global Financial Crisis. Under China’s four-trillion-Yuan stimulus plan [48], capital investments (most in the construction sector) in Yunnan increased rapidly (Table 2), and the carbon-intensive supply chains of the construction sector increased sharply during 2007–2012. Carbonization of the production structure increased CO2 emissions by 40.9 Mt during this period (Figure 3).
The driving effect of population growth was small; its contribution to the growth in CO2 emissions was only 14.0 Mt from 1997–2012 (Figure 3). This was primarily due to the strict implementation of the “one-child policy” in Yunnan. In each FYP, a target is set to control the population growth rate. It is expected that Yunnan will continue following the population planning policy formulated by the central government to control the population growth rate. The contribution of changes in population to CO2 emissions will remain small (see more information about the “one-child policy” in China in the SM).
From 1997–2012, the largest driver leading to a reduction in industrial CO2 emissions was changes in the carbon intensity (the sum of changes in the energy intensity and energy structure; Figure 3). Of the 115.1-Mt CO2 emissions offset by improvements in carbon intensity during this period, 45.1% was from 23-PSE, 37.1% was from 13-MNM and 12.0% was from 14-SPM (Table S3 in SM). However, a DCI increase in 27-TSP led to 5.9 Mt in carbon intensity-related CO2 increments (Table 1 and Table S3). Figure 4 shows the changes in energy intensity and energy structure in these four energy-intensive sectors. It highlights the expansion of renewable electricity (mostly from hydropower) share in total electricity generation during 2007–2012. Hydropower generation in Yunnan grew seven-fold, from 16.8 terawatt hours in 1997 to 123.8 terawatt hours in 2012, and the share of hydropower in total electricity generation was 71% in 2012 [39]. The application of non-fossil energy in sectors 13-MNM and 14-SPM also increased through a “combination of mineral industry and hydropower” policy in Yunnan [47]. Changes in the energy structure led to a reduction of CO2 emissions as much as 61.8 Mt during 2007–2012 (Figure 3 and Table S4). From a sector perspective, 14-SPM, 13-MNM and 23-PSE contributed to 26.2-, 16.2- and 13.4-Mt energy structure-related CO2 emissions decreases during this period, respectively (Table S4). Although the process was lengthy and complex, the implementation of key energy-saving projects and the elimination of backward production capacity under a mandatory target set by the central government to encourage the provincial government to reduce energy intensity since the 11th FYP period (2006–2010) [47] resulted in significant improvements in energy intensity in key energy consumption sectors, such as 13-MNM, 14-SPM and thermal power. From 1997–2012, changes in the energy intensity reduced CO2 emissions constantly by 63.1 Mt, with 58.0% of this reduction in 2007–2012, 25.8% in 1997–2002 and only 16.2% in 2002–2007 (Figure 3 and Table S4). From a sector perspective, 23-PSE and 13-MNM contributed 65.6% (−41.4 Mt) and 45.4% (−28.7 Mt) to energy intensity-related CO2 emissions reduction during 1997–2012, respectively (Table S4). However, coal and petroleum still dominated energy use in the 13-MNM, 14-SPM and 27-TSP sectors. Meanwhile, energy intensity and structure improvements were mostly found in industrial sectors. For transportation (27-TSP), both the energy intensity and structure deteriorated. Road transportation composes more than 90% of total transportation in Yunnan, and most roads in Yunnan are labeled as low grade [4].
Optimization of the final demand structure was another driving force offsetting the increase of CO2 emissions by 72.9 Mt between 1997 and 2012 (Figure 3). However, it has not always played a positive role in CO2 mitigation. During 2002–2007, changes in the final demand structure increased CO2 emissions by 35.3 Mt (Figure 3). The next section presents a detailed analysis showing how changes in the final demand structure affect CO2 emissions in separate final demand categories.
Figure 4. Energy intensity and structure change in major sectors from a production perspective from 1997–2012. (a) 23-PSE; (b) 14-SPM; (c) 13-MNM; and (d) 27-TSP.
Energies 09 00023 g004

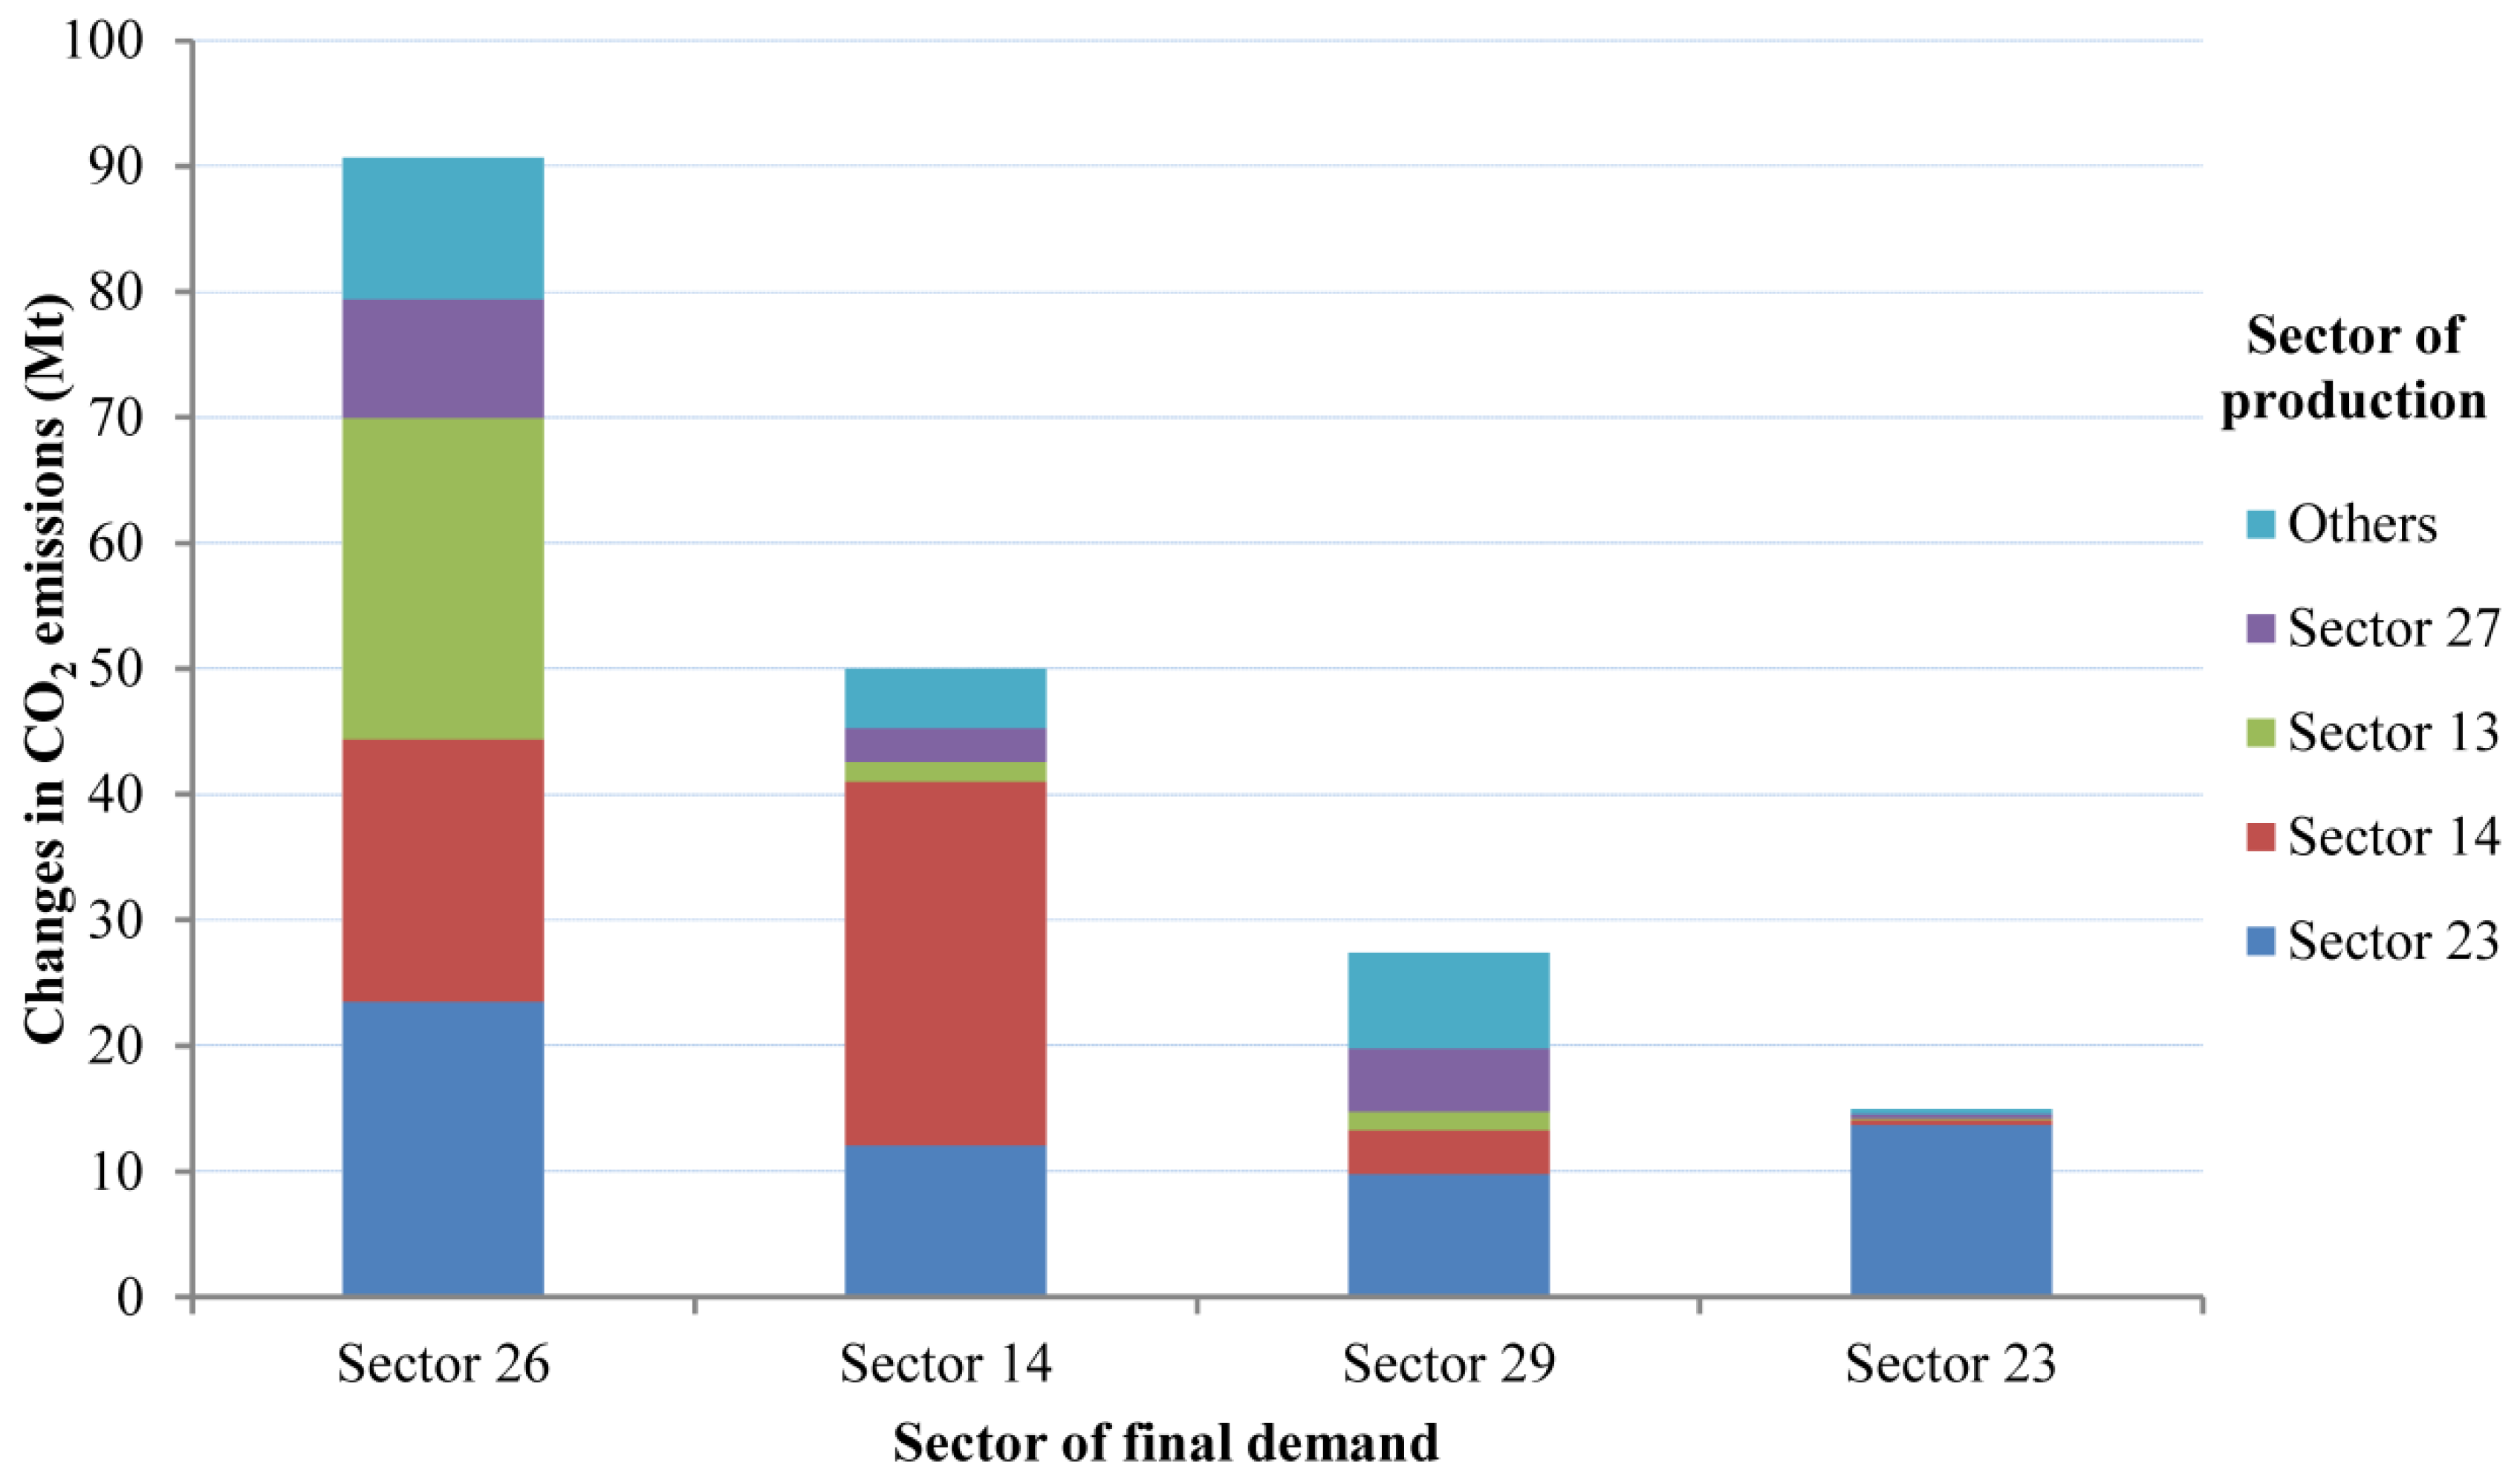
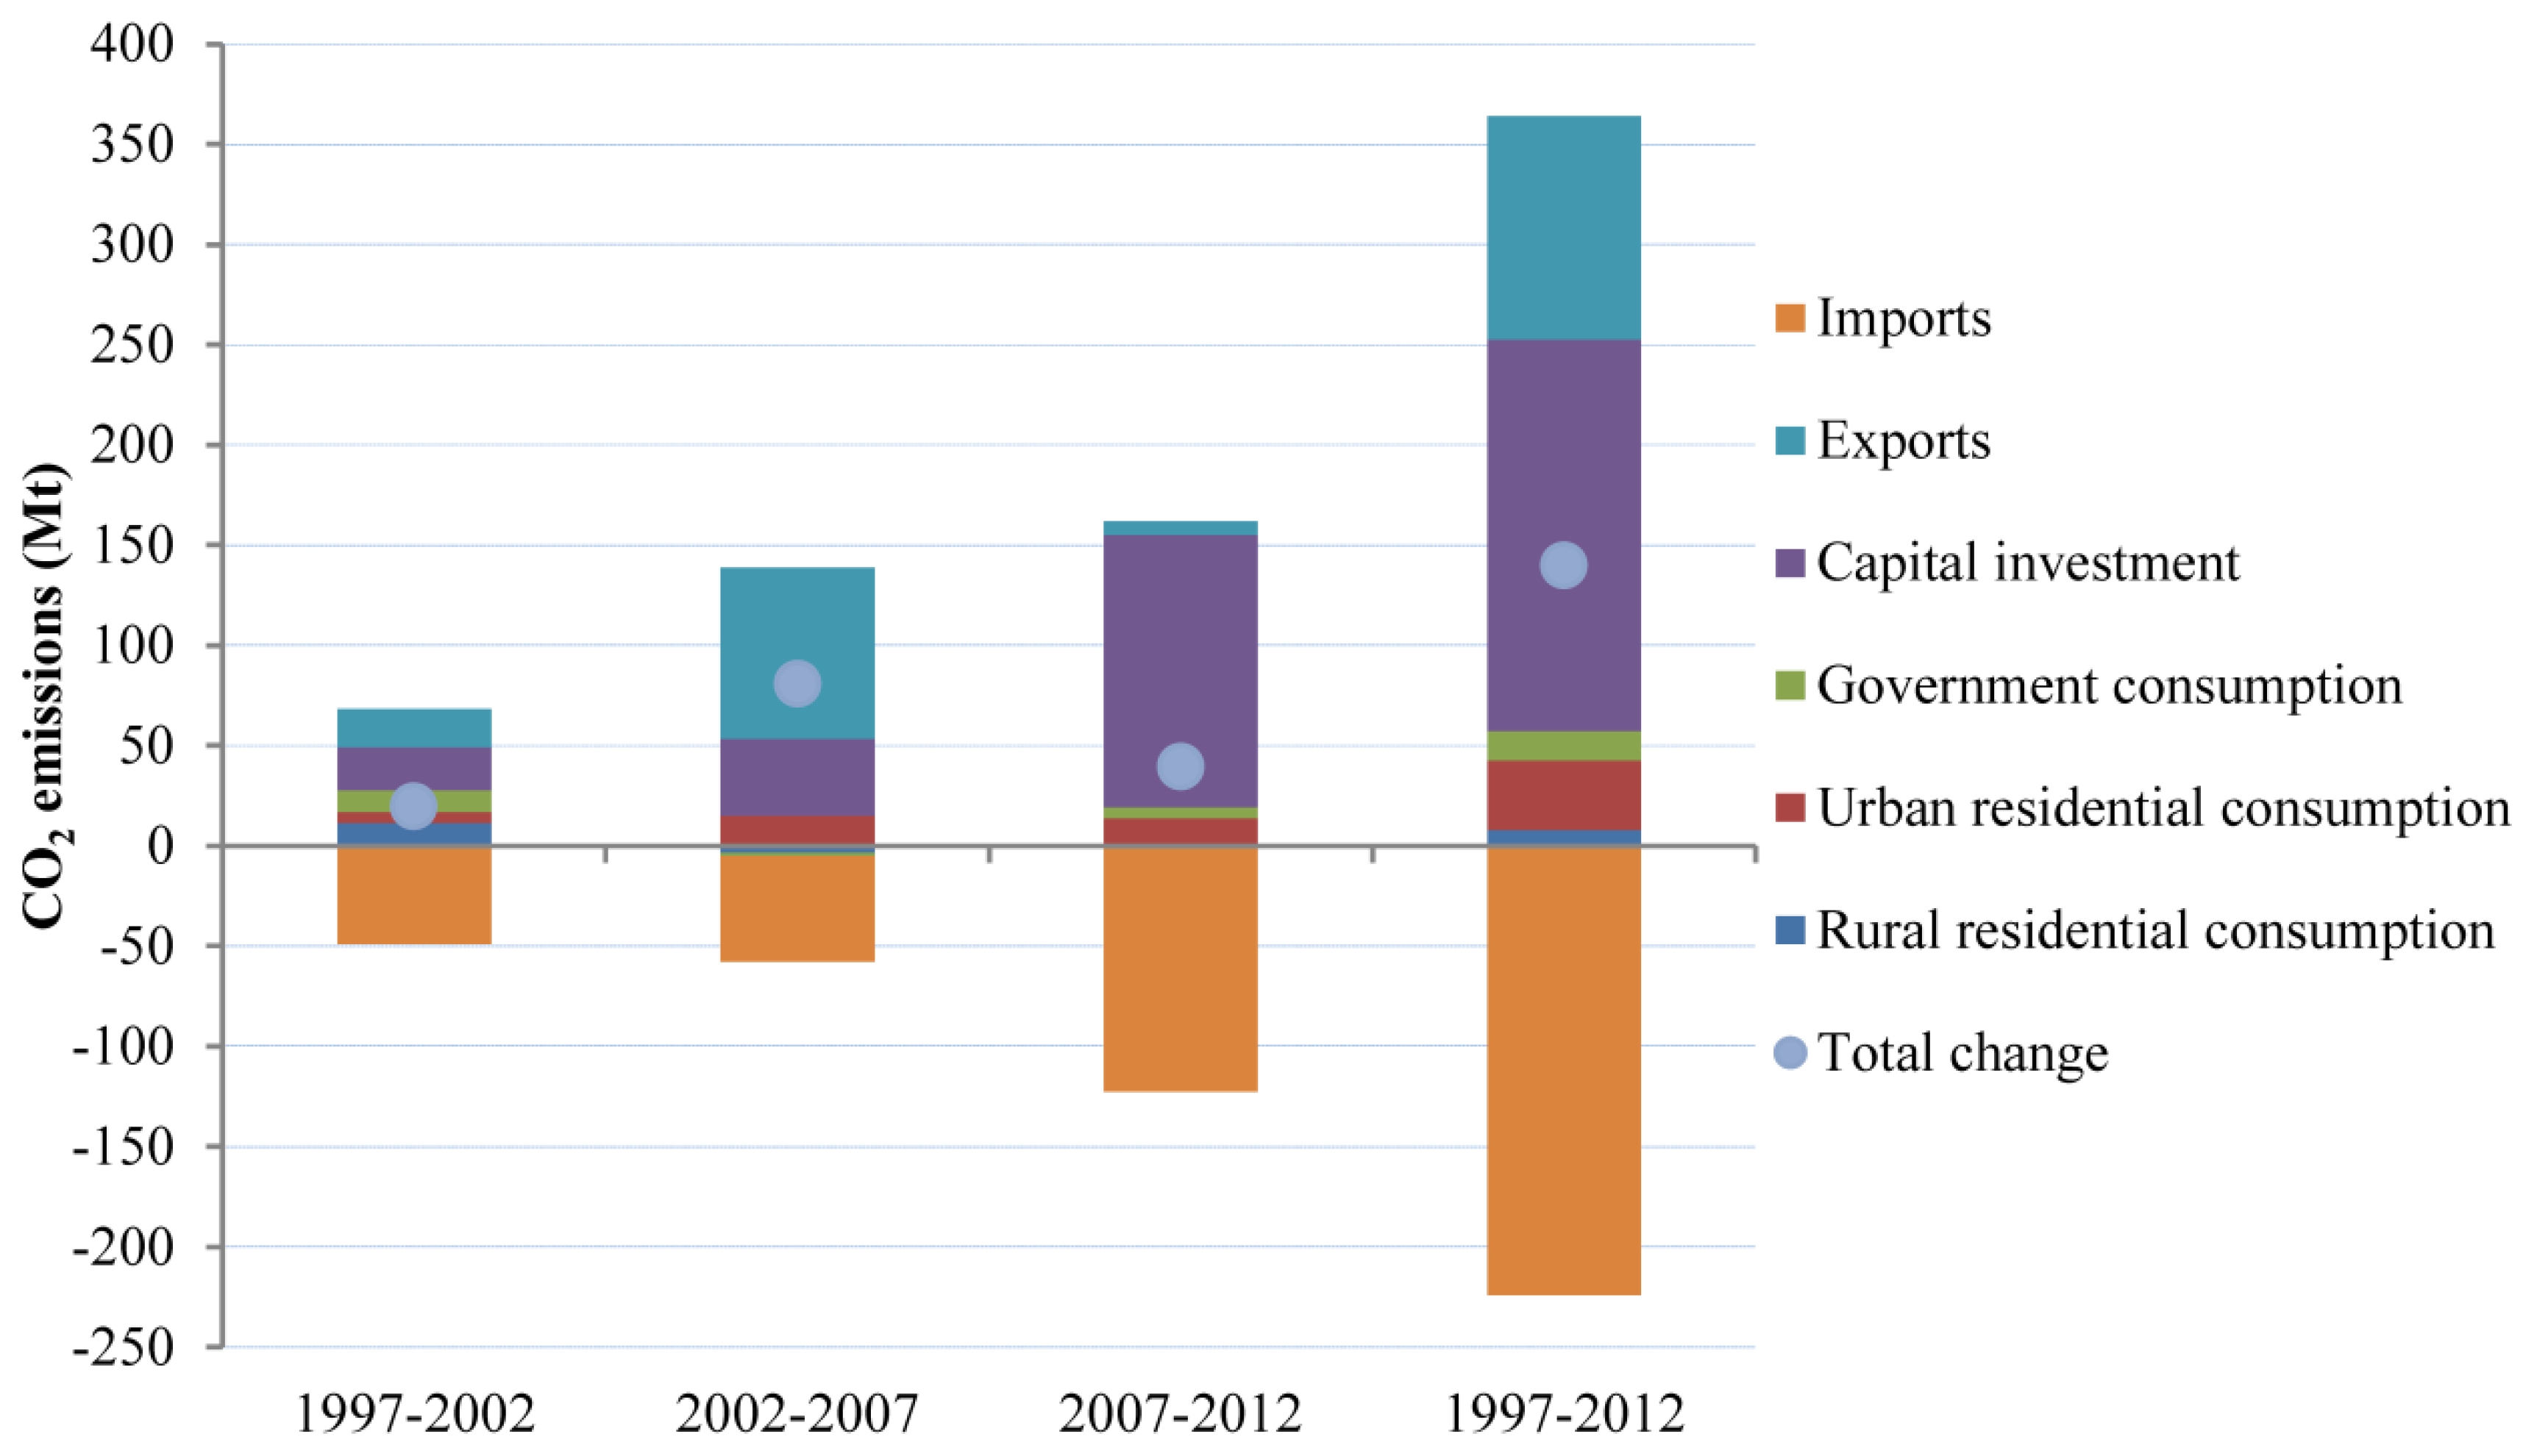
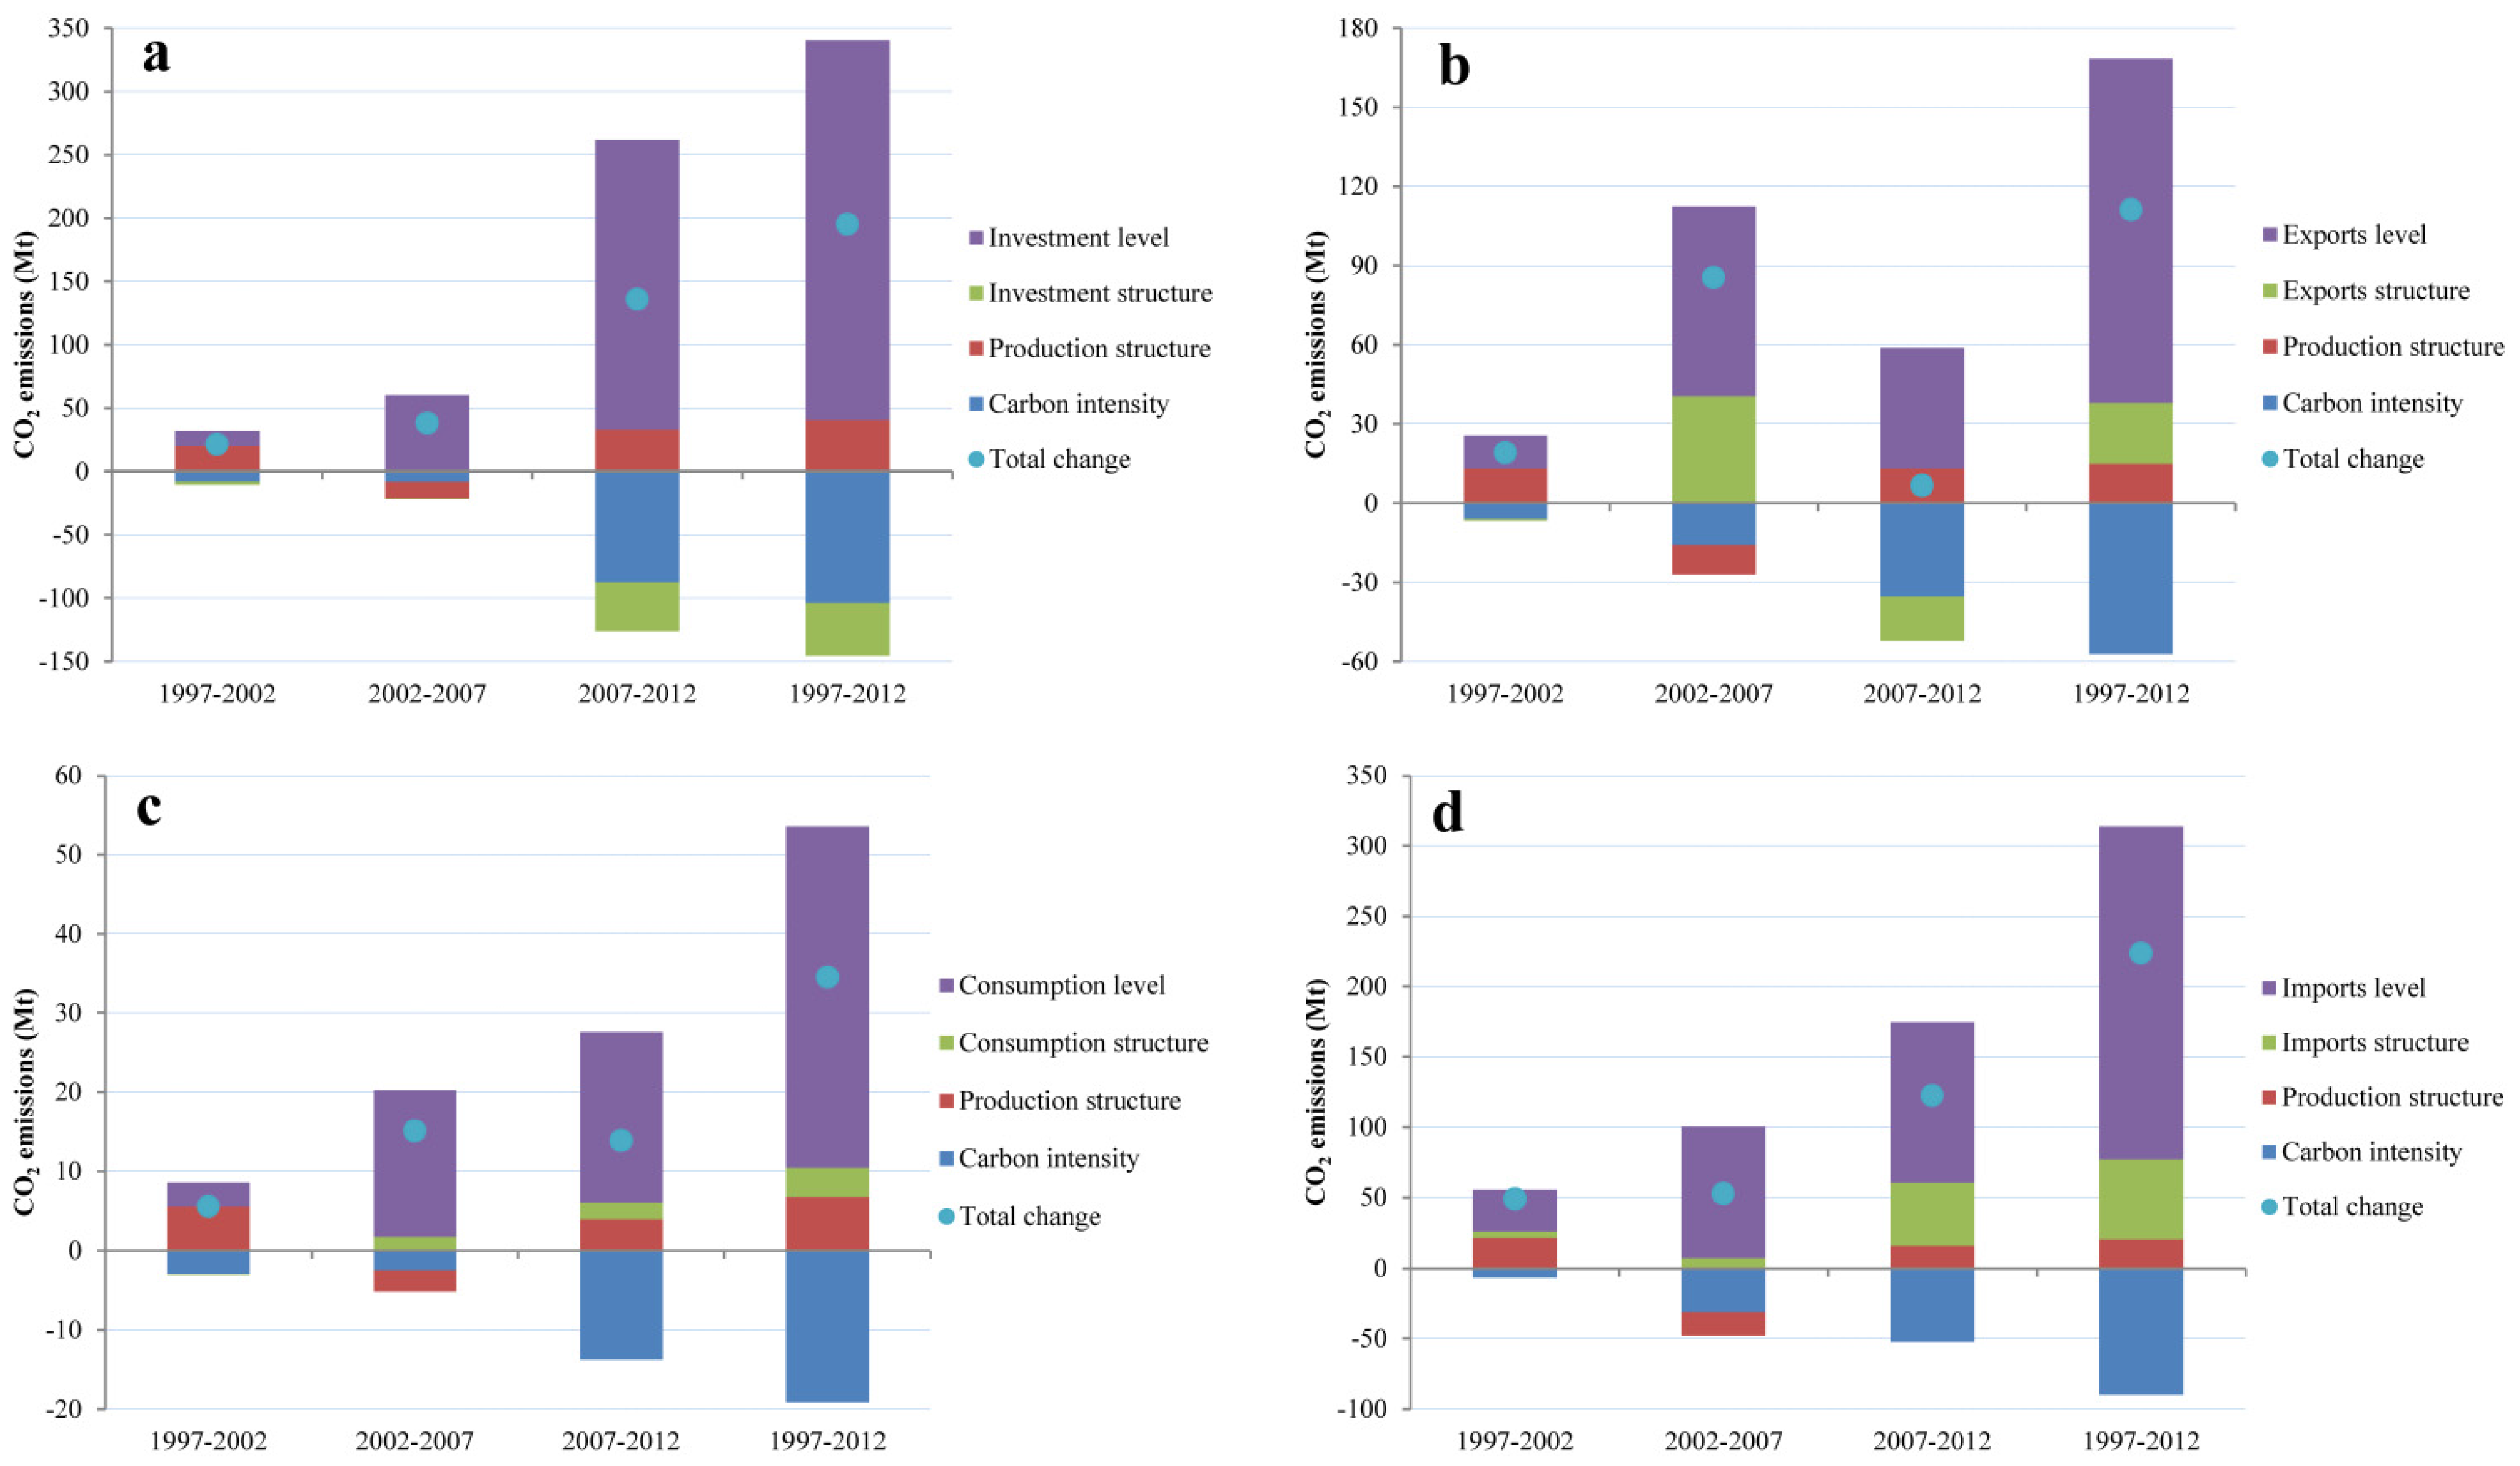
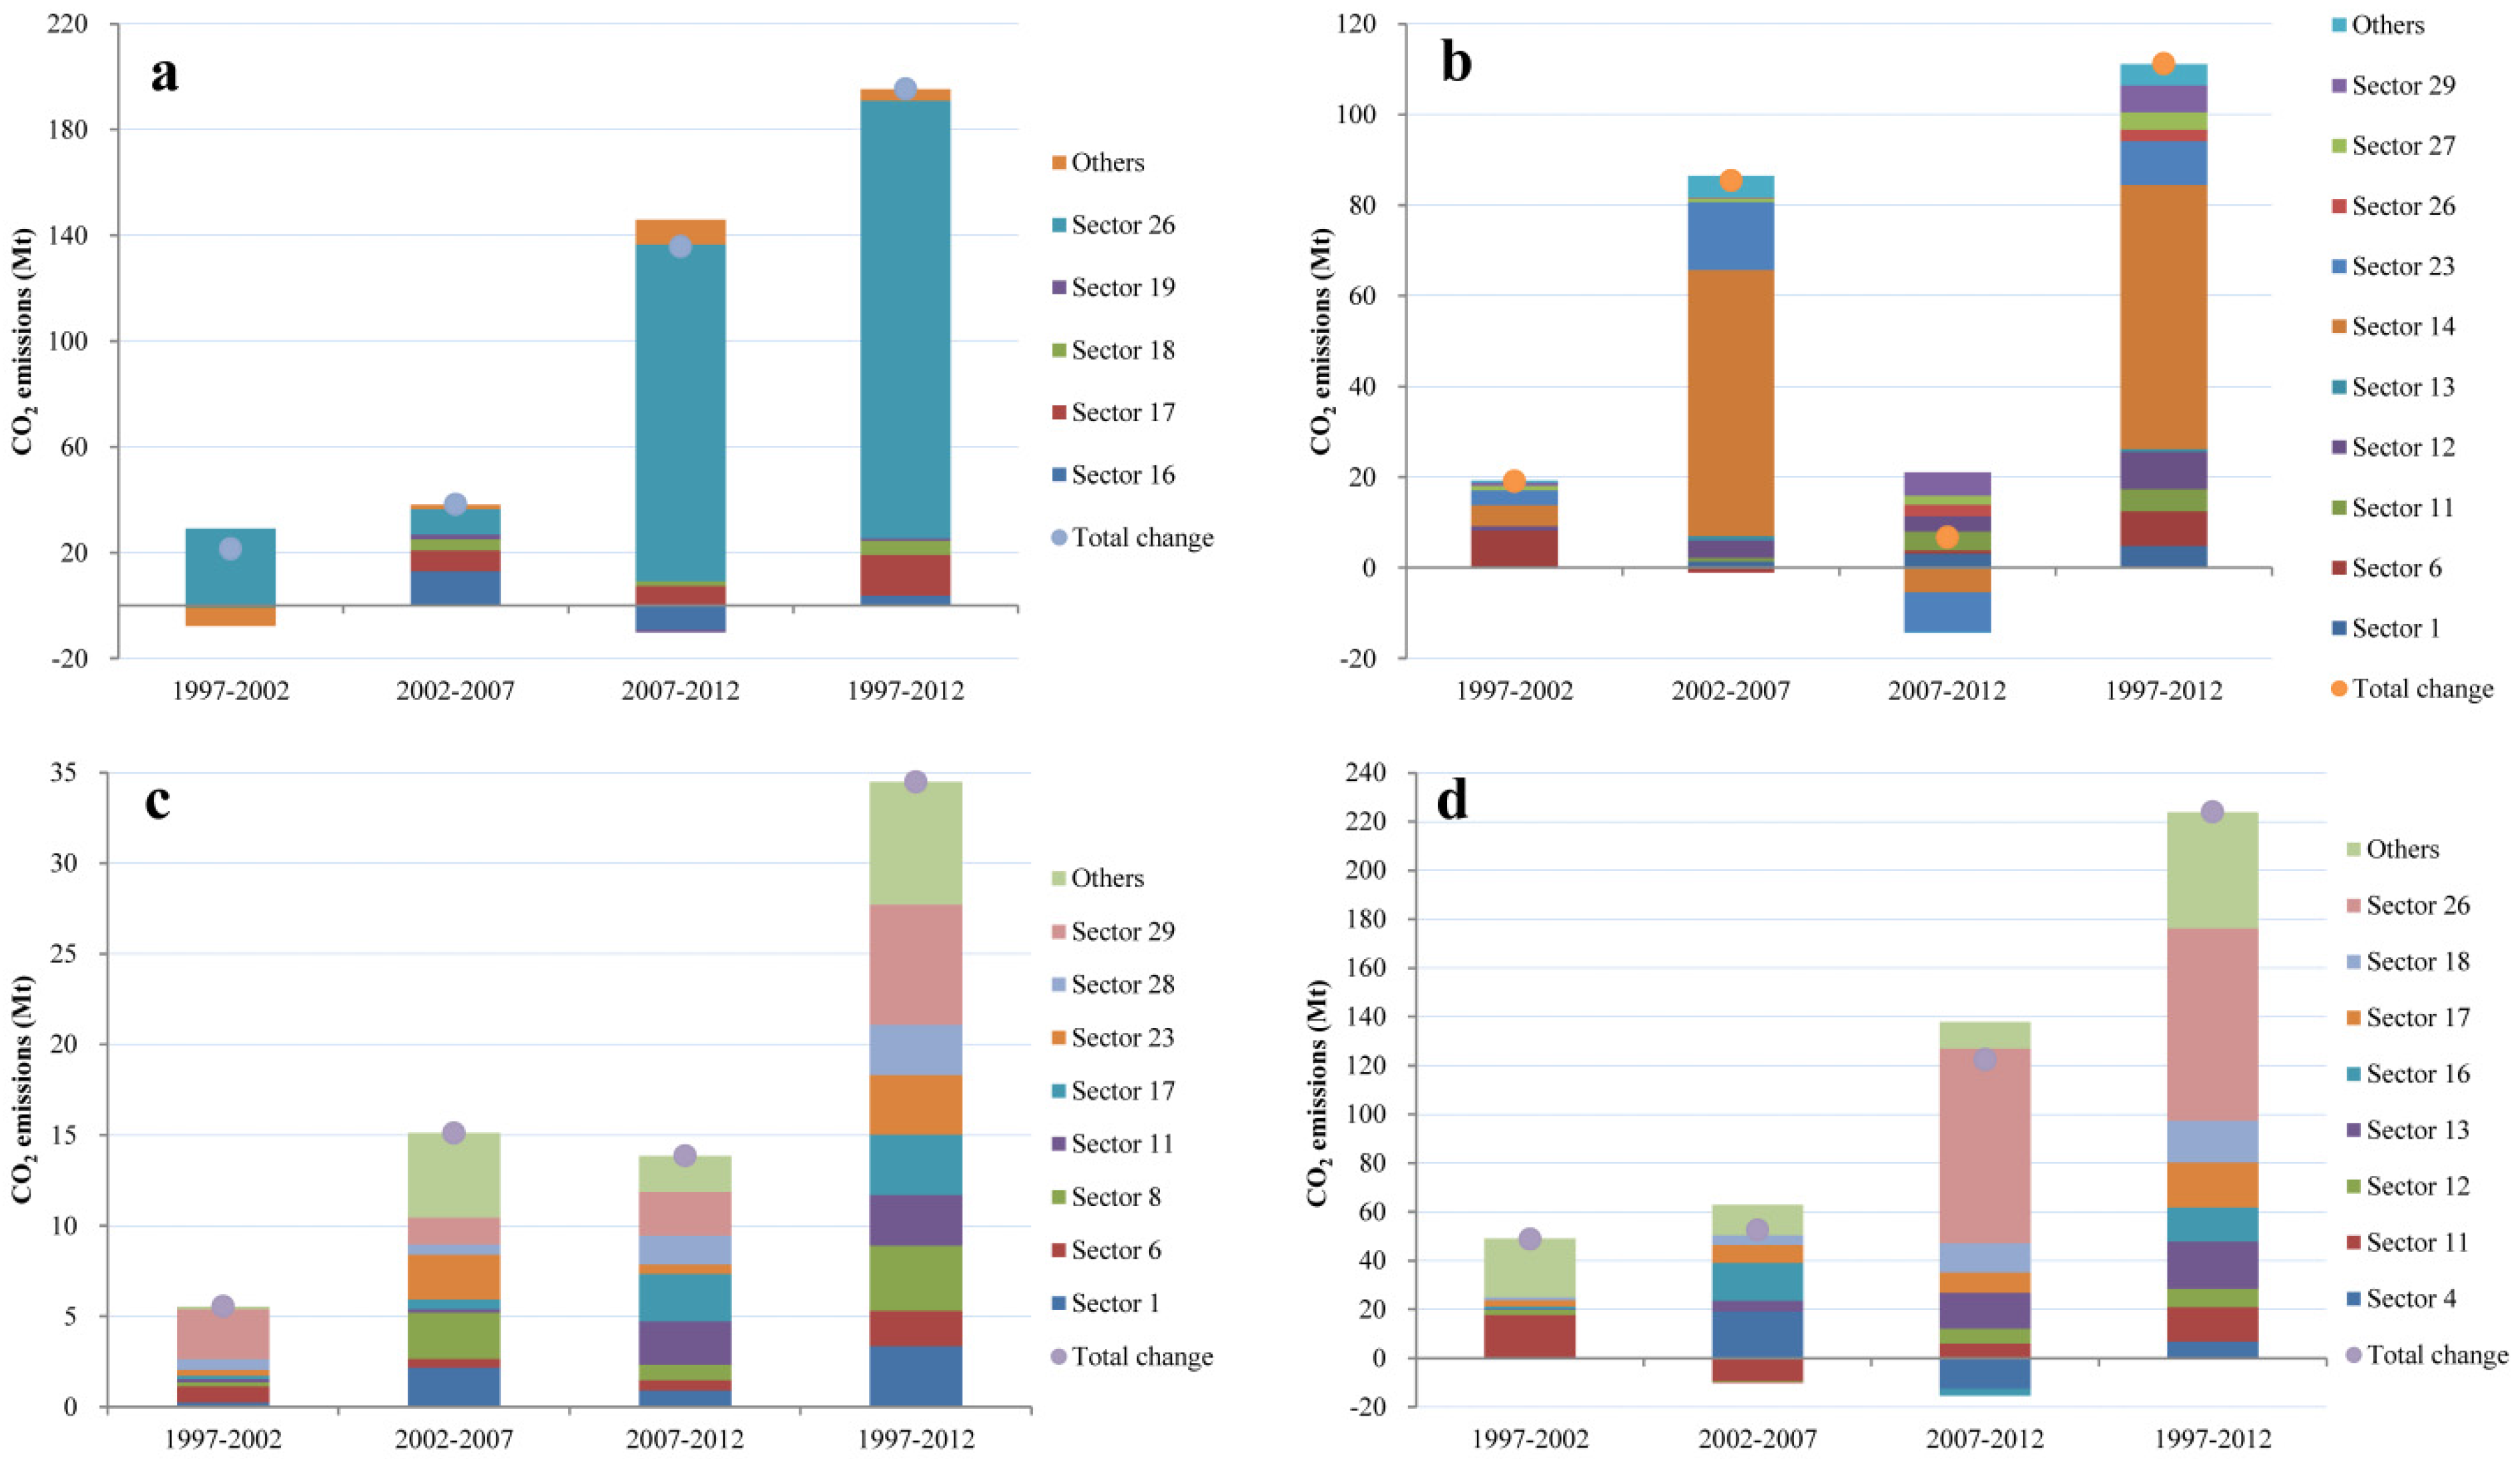
3.3. Drivers from a Final Demand Perspective

From a final demand perspective, capital investment (the sum of fixed capital formation and stock changes) was the largest driving force between 1997 and 2012. It drove a CO2 emissions increase of 195.3 Mt, 69.5% of which occurred in the period 2007–2012 (Figure 5). To reduce the impact of the Global Financial Crisis on the economy, the Chinese government adopted the four-trillion-Yuan stimulus plan, of which 45% was invested in constructing infrastructure, such as roads, airports and buildings [6]. This plan caused the growth of CO2 emissions in construction investments in Yunnan to explode (Figure 6a and Figure 7a).
Figure 5. Drivers contributing to changes in Yunnan’s industrial CO2 emissions in different time periods when analyzed from a final demand perspective.
Energies 09 00023 g005
Exports were the second largest driver of the CO2 emissions increase in Yunnan during 1997–2012. Of the 111.2-Mt increase in export-related CO2 emissions during this period, 76.8% occurred in 2002–2007, 17.2% occurred in 1997–2002 and only 6.0% in 2007–2012 (Figure 5). Figure 6b and Figure 7b demonstrate the main decomposition drivers and sectors contributing to the increase in export-related CO2 emissions. They indicate that from 2002–2007, the export-related CO2 emissions increase was caused primarily by growth in the exports of carbon-intensive products from 14-SPM and 23-PSE. During this period, exports from these two sectors increased by 1106.2% and 269.6%, respectively (Table S5). This change also caused carbonization of the exports’ structure, which led to an increase of 40.5 Mt in export-related CO2 during this period (Figure 6b). The share of carbon-intensive products from 14-SPM and 23-PSE in total exports increased from 9.4% and 2.7% in 2002 to 38.7% and 3.4% in 2007, respectively (Table S5). During 2007–2012, the situation was different. Although carbon-intensive product exports from 14-SPM and 23-PSE increased by 0.3% and 3.2%, respectively, their shares in total exports decreased to 26.6% and 2.4% in 2012 (Table S5). Low-carbon products from the agriculture and service sectors increased their share in total exports during the same period (Table S5). Changes in the exports’ structure led to a decrease of 16.8 Mt CO2 during this period (Figure 6b). Most of Yunnan’s exports were raw materials to support the development of developed coastal regions in China. For example, Yunnan was important to China’s “West to East Transmission Scheme”, increasing deliveries of electricity to developed eastern areas (e.g., Guangdong Province) [3] from 0.2 terawatt hours in 1997 to 42.6 in 2012 [39].
Urban residential consumption was another important driver of the growth of CO2 emissions. This was especially the case between 2002 and 2007, when urban residential consumption exceeded both rural residential consumption and government consumption and became the third largest driving force (Figure 5). The urban population of Yunnan grew from 23.4% of the total population in 2000 to 39.3% in 2012, increasing by 8.4 million in these twelve years [4]. The increase in urban population strengthened the driving effect of urban residential consumption, which increased CO2 emissions by 34.5 Mt during 1997–2012 (Figure 5). Growth in consumption level was the primary driver of the 43.2-Mt increase in urban-related CO2 emissions during 1997–2012 (Figure 6c). From a sectoral perspective, increased consumption of life-cycle carbon-intensive products, such as electricity, petroleum and cars, contributed to an urban-related CO2 emissions increase in recent years (Figure 6c and Figure 7c). The urbanization rate in Yunnan is far below the national average. In 2012, 39.3% of Yunnan’s population was classified as urban, whereas the figure was 52.6% for the country as a whole [4]. With increasing urbanization, it is foreseeable that urban residential consumption in Yunnan will continue to strengthen as a driving force.
Rural residential consumption and government consumption had lesser driving effects during 1997–2012, increasing CO2 emissions by only 7.9 Mt and 14.8 Mt, respectively (Figure 5). Meanwhile, for the period 1997–2012, increasing imports of carbon-intensive products from construction and heavy manufacturing sectors avoided a 224.0-Mt CO2 emissions increase if these products were produced in Yunnan (see Figure 5, Figure 6d and Figure 7d). Nonetheless, it will increase the carbon footprint (CO2 emissions caused by final demand within a region) of Yunnan. Furthermore, it will intensify the debate regarding the responsibility for the redistribution of CO2 emissions [37]. Thus, fundamentally decreasing local carbon footprint should become the focus of policy makers.
Figure 6. Main decomposition drivers contributing to changes in CO2 emissions by different final demand categories from 1997–2012. (a) Capital investment; (b) exports; (c) urban residential consumption; and (d) imports.
Energies 09 00023 g006
Figure 7. Main sectors contributing to changes in CO2 emissions by different final demand categories from 1997–2012. (a) Capital investment; (b) exports; (c) urban residential consumption; and (d) imports.
Energies 09 00023 g007

3.4. Policy Recommendations for Further Mitigating CO2 Emissions in Yunnan

Based on the above analysis, policy recommendations are suggested to further mitigate CO2 emissions in Yunnan from the perspective of both production and final demand.

3.4.1. Policy Recommendations from a Production Perspective

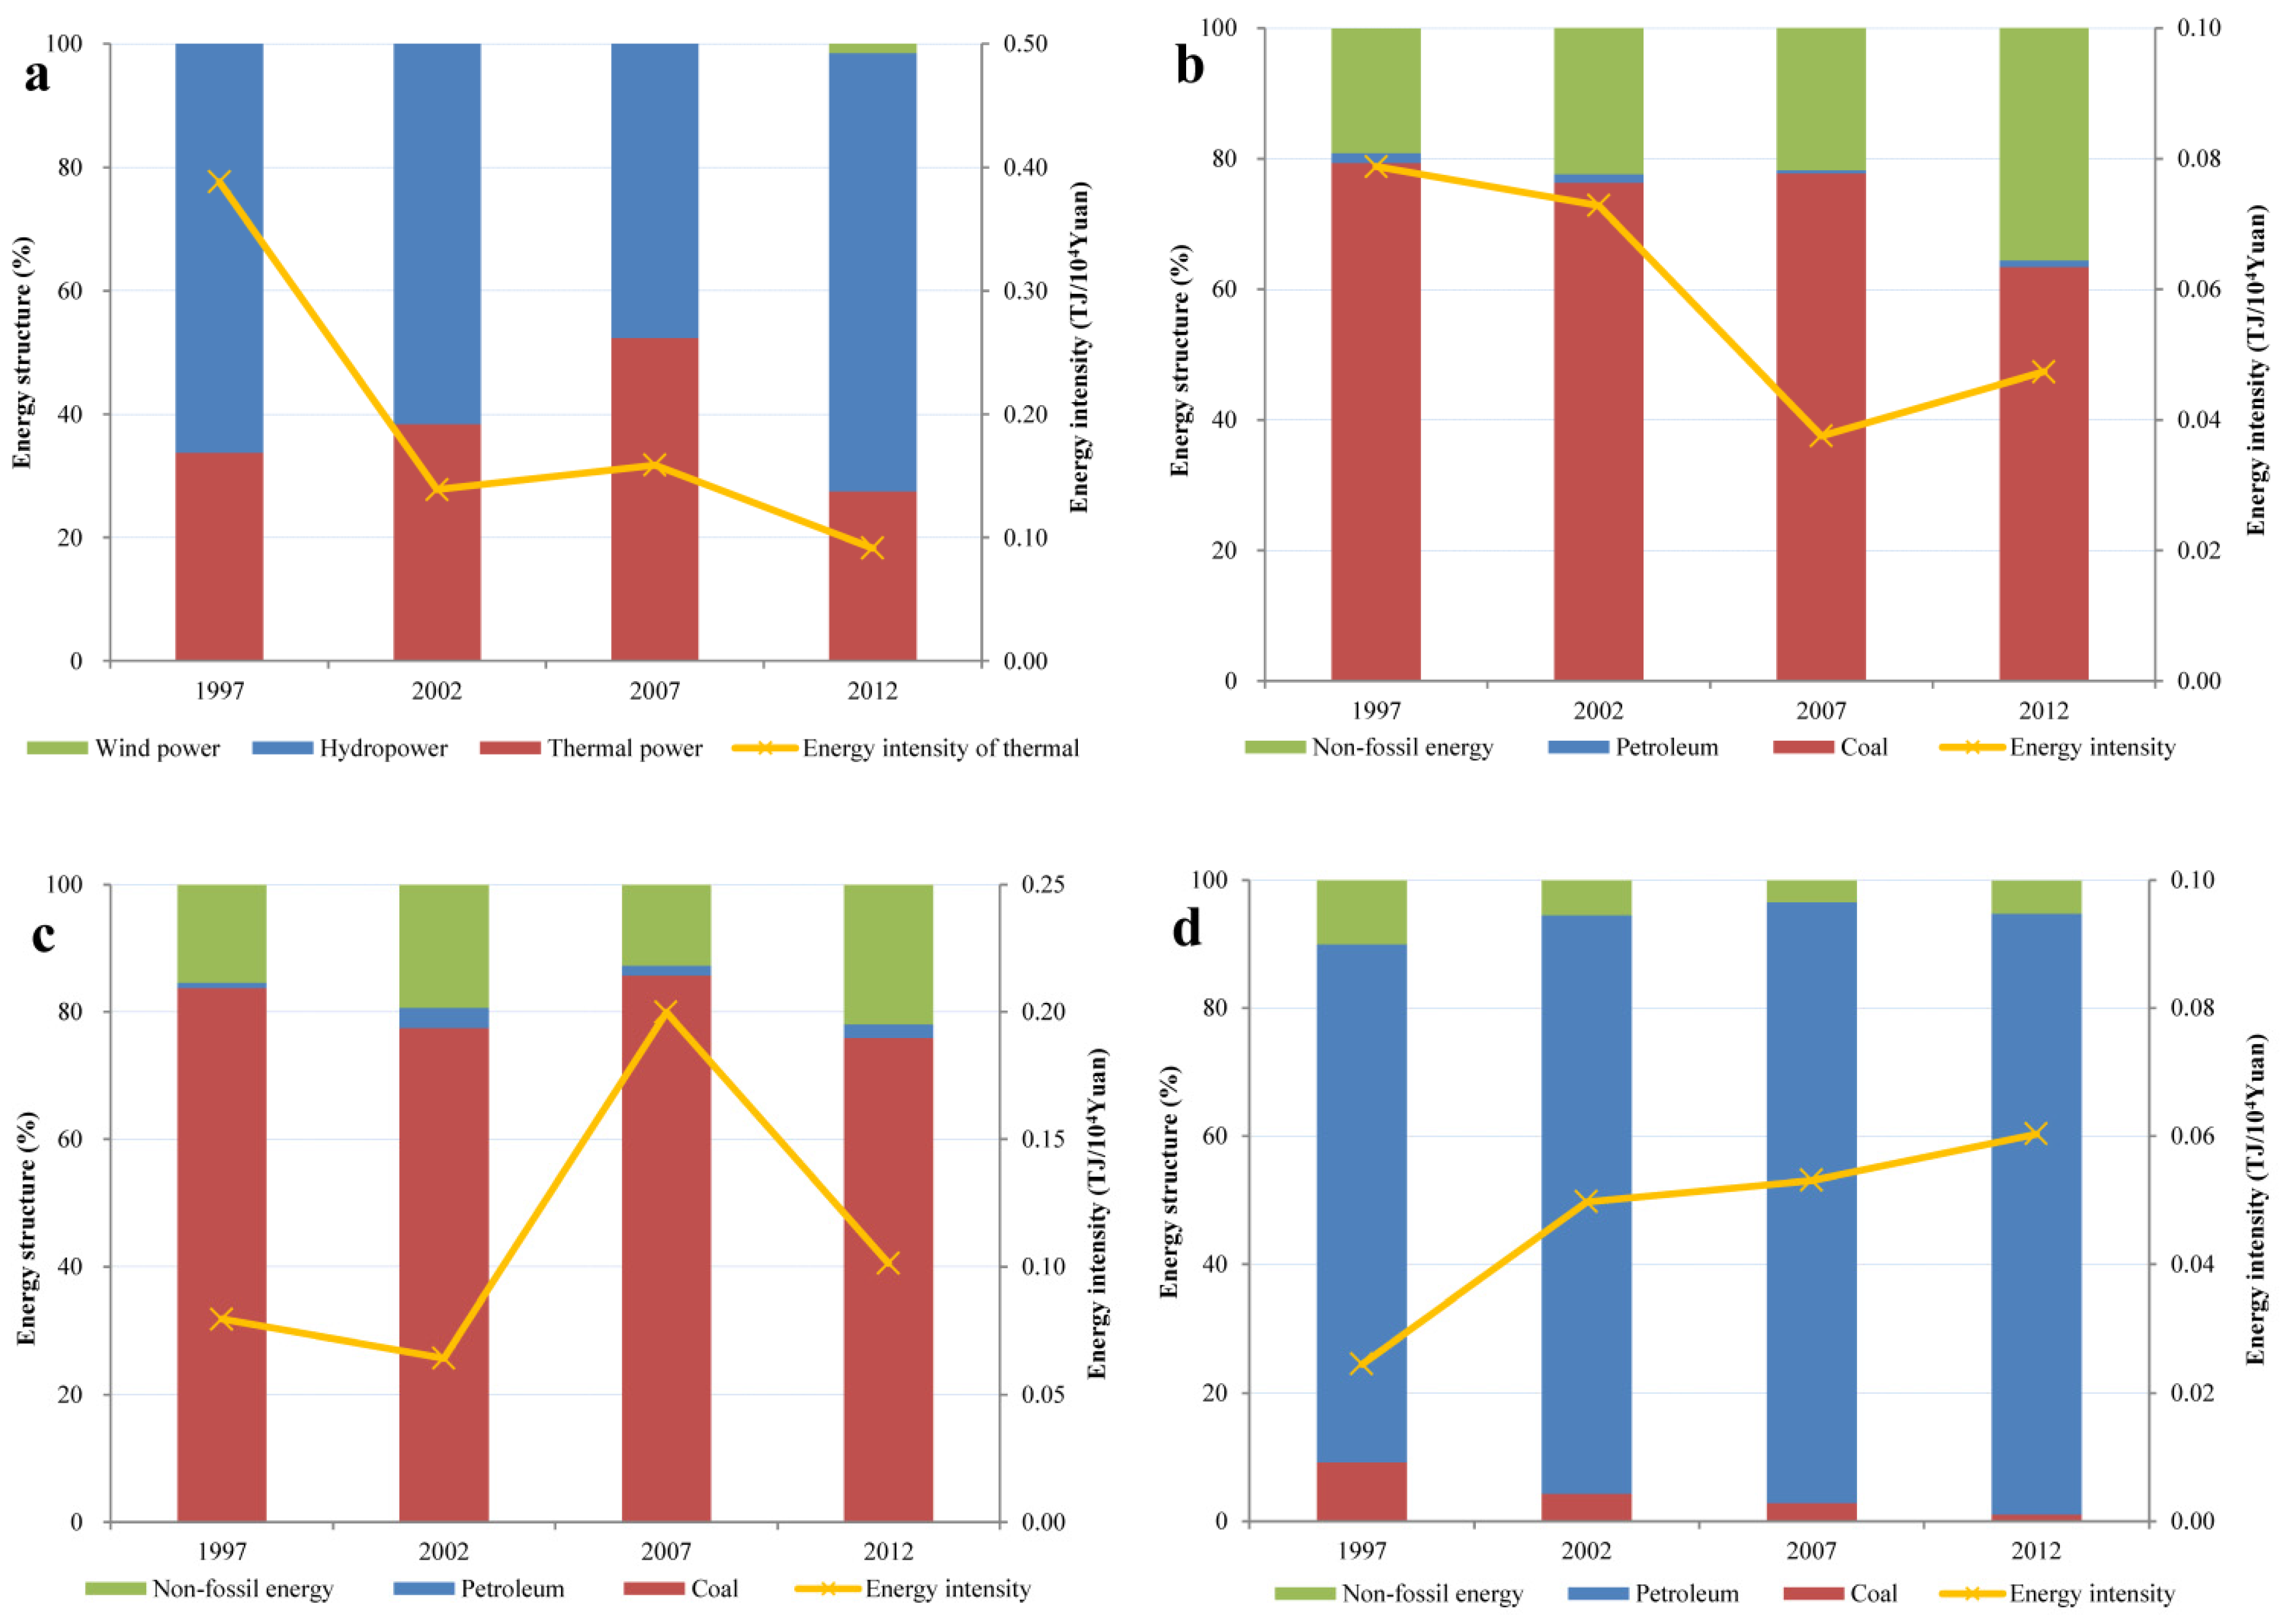
Promote the Development and Application of Clean Energy

Developing hydropower substantially decarbonized Yunnan’s energy structure in recent years, but applying clean energy in the production sectors is not enough. Thus, policy makers should formulate policies supporting the development of clean energy, such as hydropower, wind, solar and biomass, according to local conditions. However, some details should be considered in this process: (1) the cooperation among the Yunnan government, China’s central government and power grid company; (2) the ecological environment problems coupled with clean energy development; and (3) the coordination of the layout of the clean energy and industrial sectors. In addition, building a distributed clean energy supply network can increase the use of clean energy and a greener energy structure in production sectors. Increasing the use of clean energy, such as hydropower, hydrogen and natural gas, in the transportation system can also reduce a sector’s dependence on carbon-intensive petroleum products.

Further Improve the Energy Efficiency in Energy-Intensive Sectors

According to the front analysis, the decreased energy intensity in energy-intensive sectors was greatly due to the administrative measures, such as mandatory reduction targets. To further reduce sectoral energy intensity, more economic measures should be taken. If economic instruments (for example, financial subsidies and tax rebates) are integrated into sectoral low-carbon policies, the effects of technology improvements in reducing CO2 emissions are expected to be critical. For less-developed regions, such as Yunnan, technology and funds for research and development (R&D) are limited. Therefore, the forming of mechanism to promote the transfer of funds and low-carbon technologies from developed regions is worth the consideration for policy makers.
The above analysis indicated that sectors 13-MNM, 14-SPM, 23-PSE and 27-TSP were the most energy-intensive sectors, and their production processes contributed over 80% of the CO2 emissions increase during 1997–2012 in Yunnan. Therefore, strengthening the measures to improve energy efficiency in these sectors will play a more effective role in reducing CO2 emissions. For the cement sector (13-MNM), typical measures, including upgrading the existing equipment (such as the rotary kilns, mills and dryers), developing new energy-saving technologies (such as heat recovery for power generation in rotary kilns, raw meal blending systems in dry process and process control systems in all kilns) and eliminating backward production techniques (such as wet kilns and dry hollow kilns), can be applied [51]. For the metal processing sector (14-SPM), the blast furnace top gas recovery turbine (TRT) unit, converter negative energy steelmaking technology, blast furnace gas and converter gas should be well applied and used in the iron and steel making process; oxygen-rich flash and oxygen-enriched bath smelting, large pre-baked electrolytic cells, oxygen bottom blown technology and wet processing technology should be applied in copper, aluminum, lead and zinc smelting, respectively. For the electricity sector (23-PSE), encouraging the construction of large coal-fired units over 600 megawatts (MW) and large-capacity gas combined cycle plants to replace smaller and less efficient units is essential. Actively developing a smart and ultra-high voltage power grid and phasing out the low voltage electricity distribution network can reduce the electricity loss in the transmission process. For Yunnan’s carbon-intensive transportation system (27-TSP), strengthening the relatively low-carbon railway transportation system can reduce the dependence on high-carbon road transportation. Meanwhile, upgrading the road transportation system (such as building more high-grade roads), improving the fuel economy of vehicles and promoting intelligent traffic management systems are also important measures to improve the energy efficiency in the transportation sector [8].

Adjust the Industrial Structure According to the Total Carbon Intensity of Sectors and Local Advantageous Resources

It is very important to construct a low-carbon industrial system for Yunnan’s low-carbon development. Both sides, including the carbon intensity of the entire industrial supply chain (i.e., total carbon intensity of a sector) (Table S6) and the combination with local advantageous resources, should be considered in this process. Thus, policy measures should continue to promote low-carbon industries, such as plateau characteristic agriculture (1-AGR), clean power, bio-resources (6-MFT (processing and manufacture of food and tobacco)), tourism (29-OSE) and ethnic culture (29-OSE). Vigorously developing the productive service industry (29-OSE) not only increases the economic share of the low-carbon service industry, but also promotes the development of technology-intensive industries. In addition, the policy encouraging the transfer of labor-intensive (7-MOT (manufacture of textiles), 8-MCL (manufacture of clothes, leather and related products), 10-PMP (paper making, printing and articles manufacture) and 28-WRH (wholesale, retail trade and hotel, restaurants)) and technology-intensive industries (19-MCE (manufacture of communication and electronic equipment) and 22-RDW (recycling and disposal of waste)) to Yunnan from developed regions can gradually replace resource-intensive industries and create a lighter production structure.

3.4.2. Policy Recommendations from a Final Demand Perspective

Reduce the Dependence of Economic Growth on Investments and Exports and Encourage a Consumption-Based Economic Growth

Capital investments in infrastructure construction and exports of raw materials not only carbonized the GDP composition, but also formed a carbon-intensive production structure due to the high-carbon supply chains. Compared to capital investments and exports, consumption is more dependent on the relatively low-carbon service and agriculture industries, which contribute less to CO2 emissions’ growth (Table S7). Therefore, policy makers should vigorously promote policies that are conducive to consumption-based economic growth. For example, improving the minimum wage standards and establishing a sound social security system can effectively promote the growth of consumer spending.

Optimize the Life-Cycle Supply Chains for Final Demand Products

For the carbon-intensive supply chain in the construction, metal processing and electricity sectors, strengthening the recycling of resources in the production process can reduce new production of high-carbon raw materials, such as coal, cement, steel and electricity. Thus, improving the standards for clean production and developing circular economy from a life-cycle perspective in a sector’s supply chain is important.

Adjust the Final Demand Structure

The adjustment of the final demand structure is very important for Yunnan’s low-carbon development. Policy makers should focus on adjusting the export structure, the consumption structure of urban residents and the infrastructure investment direction.
Taking effective measures to reduce the exports of high-carbon raw materials is very important. China’s central government had canceled export tax rebates and levied export tariffs for international exports of products with high resource consumption and high emissions. For interprovincial exports, there are no export tariffs, because the central government promotes free trade among all regions of the country. On this background, policies that subsidize the exports of low-carbon products from the service and agriculture industries and strengthen cooperation among trade partners are necessary. Considering that Yunnan exports a great deal of electricity to Guangdong, a compensatory mechanism should be formed to encourage Guangdong to provide renewable energy technology to Yunnan to reduce the carbon intensity of Yunnan’s exports.
Optimizing the consumption structure for urban residents is essential. For example, the implementation of new established policies by the Chinese government, such as a ladder price for electricity, higher taxes on oil and a ban on disposable plastic bags, will encourage a low-carbon consumption structure in Yunnan. For urban transportation, it is imperative to increase investments in public transportation and to improve low-carbon transportation, such as walking and bicycling, to reduce the dominance of cars.
The direction of infrastructure investments will play a vital role in decreasing Yunnan’s CO2 emissions. For example, investments in mass transit or renewable energy production will benefit future low-carbon development. Thus, a low-carbon investment plan should be developed to guide long-term infrastructure investments.

4. Conclusions

In this study, a structural decomposition analysis-logarithmic mean Divisia index (SDA-LMDI) model was developed to find the drivers behind the CO2 emission changes during 1997–2012 in Yunnan, a low-carbon pilot province in China. The potential relationship between economic growth and CO2 emissions in a less-developed region was explored in order to promote the low-carbon economic development strategy.
As a less-developed region undergoing rapid development of industrialization and urbanization, the growth of per capita GDP driving by the export and capital investment increase was the primary driver of CO2 emissions’ growth in Yunnan. However, changes in the export and investment structure have become more important driving forces for CO2 emissions’ growth in Yunnan in recent years. Therefore, adjusting the economic structure to a low-carbon direction should have more attention paid to it. Vigorously developing hydropower and improving energy efficiency in energy-intensive sectors have become the backbone of CO2 emissions’ reduction. Thus, enhancing the application of clean energy and energy efficient technologies in production sectors can be essential measures to decease the CO2 emissions.
Maintaining economic growth and eliminating poverty are still important tasks for Yunnan. However, the pillar industries of Yunnan’s economy are high-carbon product sectors depending more on imports from other regions, which are not conducive to the low-carbon development in Yunnan from a long-term perspective. Hence, economic structure adjustment and technological improvements should be encouraged in the future. Based on this analysis, the further policy recommendations from both production and final demand perspectives to mitigate CO2 emissions in Yunnan are proposed. The most important measures should focus on promoting the development and application of clean energy and the formatting of consumption-based economic growth.
This study provided a theoretical basis for developing a low-carbon policy in Yunnan by revealing driving forces behind changes in local CO2 emissions, which also offered guidance for a low-carbon development mode in other less-developed regions undergoing rapid development of industrialization and urbanization. However, key economic entities in Yunnan’s CO2 emissions, such as major cities and industrial parks, were not analyzed due to the lack of relevant input-output tables in China. The ecological network analysis procedures might be helpful in compiling the input-output tables for the economic entities; however, more studies are needed in the future. Furthermore, as for the SDA-LMDI model, some improvements should be made in the future. For example, the use of more than two matrices or logarithms in the model will complicate the calculations; thus, a strengthened programming of this model is needed in the future.

Supplementary Materials

The following are available online at www.mdpi.com/1996-1073/9/1/23/s1.

Acknowledgments

We are grateful for the contributions of emeritus Prof. Robert B. Wenger from the University of Wisconsin-Green Bay, for his kind help in providing language and structural improvements to the manuscript. Thanks for the support provided by the Grant-Funded Projects of the China Clean Development Mechanism Fund (fund-key: 1213075) supervised by the National Development and Reform Commission, China. Additionally, we also want to thank the three anonymous reviewers for their valuable comments on this paper.

Author Contributions

Mingxiang Deng and Wei Li designed the framework of this research. Mingxiang Deng and Yan Hu collected the initial data and processed the data. Mingxiang Deng and Wei Li discussed the results and formed the policy recommendations and conclusions. All the authors wrote the paper.

Conflicts of Interest

The authors declare no conflict of interest.

References

  1. Friedlingstein, P.; Andrew, R.M.; Rogelj, J.; Peters, G.P.; Canadell, J.G.; Knutti, R.; Luderer, G.; Raupach, M.R.; Schaeffer, M.; van Vuuren, D.P.; et al. Persistent growth of CO2 emissions and implications for reaching climate targets. Nat. Geosci. 2014, 7, 709–715. [Google Scholar] [CrossRef] [Green Version]
  2. Qi, Y. Annual Review of Low-Carbon Development in China (2013); Social Science Academic Press: Beijing, China, 2013. (In Chinese) [Google Scholar]
  3. Hennig, T.; Wang, W.L.; Feng, Y.; Ou, X.K.; He, D.M. Review of Yunnan’s hydropower development. Comparing small and large hydropower projects regarding their environmental implications and socio-economic consequences. Renew. Sustain. Energy Rev. 2013, 27, 585–595. [Google Scholar] [CrossRef]
  4. Statistical Bureau of Yunnan Province (SBYP). Yunnan Statistical Yearbook 1998–2013; China Statistics Press: Beijing, China, 2013.
  5. National Bureau of Statistics Survey Office in Yunnan (NBSSOY). Yunnan Survey Yearbook 2014; China Statistics Press: Beijing, China, 2014.
  6. Guan, D.B.; Klasen, S.; Hubacek, K.; Feng, K.S.; Liu, Z.; He, K.B.; Geng, Y.; Zhang, Q. Determinants of stagnating carbon intensity in China. Nat. Clim. Chang. 2014, 4, 1017–1023. [Google Scholar] [CrossRef]
  7. Tollefson, J. US-China climate deal raises hopes for Lima talks. Nature 2014, 515, 473–474. [Google Scholar] [CrossRef] [PubMed]
  8. Yunnan Development and Reform Commission (YDRC). Low-carbon development plan in Yunnan (2011–2020). 2011. Available online: http://www.yn.gov.cn/yn_zwlanmu/yn_srmzfgb/201108/t20110804_537.html (accessed on 13 November 2014). (In Chinese) [Google Scholar]
  9. Minx, J.C.; Baiocchi, G.; Peters, G.P.; Weber, C.L.; Guan, D.B.; Hubacek, K. A “Carbonizing Dragon”: China’s fast growing CO2 emissions revisited. Environ. Sci. Technol. 2011, 45, 9144–9153. [Google Scholar] [CrossRef] [PubMed]
  10. Wang, Y.F.; Zhao, H.Y.; Li, L.Y.; Liu, Z.; Liang, S. Carbon dioxide emission drivers for a typical metropolis using input-output structural decomposition analysis. Energy Policy 2013, 58, 312–318. [Google Scholar] [CrossRef]
  11. Geng, Y.; Zhao, H.Y.; Liu, Z.; Xue, B.; Fujita, T.; Xi, F.M. Exploring driving factors of energy-related CO2 emissions in Chinese provinces: A case of Liaoning. Energy Policy 2013, 60, 820–826. [Google Scholar] [CrossRef]
  12. Liang, S.; Zhang, T.Z. What is driving CO2 emissions in a typical manufacturing center of South China? The case of Jiangsu Province. Energy Policy 2011, 39, 7078–7083. [Google Scholar] [CrossRef]
  13. Guan, D.B.; Barker, T. Low-carbon development in the least developed region: a case study of Guangyuan, Sichuan province, southwest China. Nat. Hazards 2012, 62, 243–254. [Google Scholar] [CrossRef]
  14. Tang, X.L.; Zhang, Y.Y.; Yi, H.H.; Ma, J.Y.; Pu, L. Development a detailed inventory framework for estimating major pollutants emissions inventory for Yunnan Province, China. Atmos. Environ. 2012, 57, 116–125. [Google Scholar] [CrossRef]
  15. Hoekstra, R.; van der Bergh, J. Comparing structural and index decomposition analysis. Energy Econ. 2003, 25, 39–64. [Google Scholar] [CrossRef]
  16. Su, B.; Ang, B.W. Structural decomposition analysis applied to energy and emissions: Some methodological developments. Energy Econ. 2012, 34, 177–188. [Google Scholar] [CrossRef]
  17. Chen, L.; Yang, Z.F.; Chen, B. Decomposition analysis of energy-related industrial CO2 emissions in China. Energies 2013, 6, 2319–2337. [Google Scholar] [CrossRef]
  18. Lu, J.C.; Fan, W.G.; Meng, M. Empirical research on China’s carbon productivity decomposition model based on multi-dimensional factors. Energies 2015, 8, 3093–3117. [Google Scholar] [CrossRef]
  19. Pan, L.Y.; Guo, Z.; Liu, P.; Ma, L.W.; Li, Z. Comparison and analysis of macro energy scenarios in China and a decomposition-based approach to quantifying the impacts of economic and social development. Energies 2013, 6, 3444–3465. [Google Scholar] [CrossRef]
  20. Peters, G.P.; Weber, C.L.; Guan, D.B.; Hubacek, K. China’s growing CO2 emissions-A race between increasing consumption and efficiency gains. Environ. Sci. Technol. 2007, 41, 5939–5944. [Google Scholar] [CrossRef] [PubMed]
  21. Leontief, W. Input-Output Economics; Oxford University Press: New York, NY, USA, 1986. [Google Scholar]
  22. Guan, D.B.; Hubacek, K.; Weber, C.L.; Peters, G.P.; Reiner, D.M. The drivers of Chinese CO2 emissions from 1980 to 2030. Glob. Environ. Change 2008, 18, 626–634. [Google Scholar] [CrossRef]
  23. Tian, X.; Chang, M.; Tanikawa, H.; Shi, F.; Imura, H. Structural decomposition analysis of the carbonization process in Beijing: A regional explanation of rapid increasing carbon dioxide emission in China. Energy Policy 2013, 53, 279–286. [Google Scholar] [CrossRef]
  24. Dietzenbacher, E.; Los, B. Structural decomposition techniques: sense and sensitivity. Econ. Syst. Res. 1998, 10, 307–324. [Google Scholar] [CrossRef]
  25. Su, B.; Ang, B.W. Attribution of changes in the generalized Fisher index with application to embodied emission studies. Energy 2014, 69, 778–786. [Google Scholar] [CrossRef]
  26. Su, B.; Ang, B.W. Multiplicative decomposition of aggregate carbon intensity change using input–output analysis. Appl. Energy 2015, 154, 13–20. [Google Scholar] [CrossRef]
  27. De Boer, P. Additive structural decomposition analysis and index number theory: an empirical application of the Montgomery decomposition. Econ. Syst. Res. 2008, 20, 97–109. [Google Scholar] [CrossRef]
  28. Chai, J.; Guo, J.E.; Wang, S.Y.; Lai, K.K. Why does energy intensity fluctuate in China? Energy Policy 2009, 37, 5717–5731. [Google Scholar] [CrossRef]
  29. Wachsmann, U.; Wood, R.; Lenzen, M.; Schaeffer, R. Structural decomposition of energy use in Brazil from 1970 to 1996. Appl. Energy 2009, 86, 578–587. [Google Scholar] [CrossRef]
  30. Wood, R. Structural decomposition analysis of Australia’s greenhouse gas emissions. Energy Policy 2009, 37, 4943–4948. [Google Scholar] [CrossRef]
  31. National Development and Reform Commission (NDRC). China Greenhouse Gas Inventory Study 2005; China Environmental Press: Beijing, China, 2014. (In Chinese)
  32. Su, B.; Ang, B.W.; Low, M. Input-output analysis of CO2 emissions embodied in trade and the driving forces: Processing and normal exports. Ecol. Econ. 2013, 88, 119–125. [Google Scholar] [CrossRef]
  33. Su, B.; Ang, B.W. Input-output analysis of CO2 emissions embodied in trade: Competitive versus non-competitive imports. Energy Policy. 2013, 56, 83–87. [Google Scholar] [CrossRef]
  34. Hubacek, K.; Feng, K.S.; Chen, B. Changing lifestyles towards a low carbon economy: an IPAT analysis for China. Energies 2012, 5, 22–31. [Google Scholar] [CrossRef]
  35. Ang, B.W.; Liu, N. Negative-value problems of the logarithmic mean Divisia index decomposition approach. Energy Policy 2007, 35, 739–742. [Google Scholar] [CrossRef]
  36. Davis, S.J.; Caldeira, K. Consumption-based accounting of CO2 emissions. Proc. Natl. Acad. Sci. USA 2010, 107, 5687–5692. [Google Scholar] [CrossRef] [PubMed]
  37. Peters, G.P. From production-based to consumption-based national emission inventories. Ecol. Econ. 2008, 65, 13–23. [Google Scholar] [CrossRef]
  38. National Bureau of Statistics (NBS). China Energy Statistical Yearbook 1998–2013; China Statistics Press: Beijing, China, 2013.
  39. Statistical Bureau of Yunnan Province (SBYP). Yunnan Energy Statistical Yearbook 2000–2013; Yunnan Science and Technology Press: Kunming, China, 2013.
  40. Peters, G.P.; Weber, C.L.; Liu, J.R. Construction of Chinese Energy and Emissions Inventory; Norwegian University of Science and Technology: Trondheim, Norway, 2006. [Google Scholar]
  41. Guan, D.B.; Liu, Z.; Geng, Y.; Lindner, S.; Hubacek, K. The gigatonne gap in China’s carbon dioxide inventories. Nat. Clim. Chang. 2012, 2, 672–675. [Google Scholar] [CrossRef]
  42. National Bureau of Statistics (NBS). Classification of national economic industries (GB/T 4754–2011). 2011. Available online: http://www.stats.gov.cn/tjsj/tjbz/hyflbz/ (accessed on 13 November 2014) . (In Chinese) [Google Scholar]
  43. United Nations Department for Economic and Social Affairs Statistics Division (UNDESASD). Hand Book of Input-Output Table Compilation and Analysis; United Nations: New York, NY, USA, 1999. [Google Scholar]
  44. Su, B.; Huang, H.C.; Ang, B.W.; Zhou, P. Input-output analysis of CO2 emissions embodied in trade: The effects of sector aggregation. Energy Econ. 2010, 32, 166–175. [Google Scholar] [CrossRef]
  45. Su, B.; Ang, B.W. Structural decomposition analysis applied to energy and emissions: aggregation issues. Econ. Syst. Res. 2012, 24, 299–317. [Google Scholar] [CrossRef]
  46. Weber, C.L.; Peters, G.P.; Guan, D.B.; Hubacek, K. The contribution of Chinese exports to climate change. Energy Policy. 2008, 36, 3572–3577. [Google Scholar] [CrossRef]
  47. People’s Government of Yunnan Province (PGYP). The Eleventh Five Year Plan for economic and social development in Yunnan province. 2006. Available online: http://xxgk.yn.gov.cn/bgt_Model1/newsview.aspx?id=130772 (accessed on 13 November 2014). (In Chinese) [Google Scholar]
  48. Yuan, C.Q.; Liu, S.F.; Xie, N.M. The impact on Chinese economic growth and energy consumption of the Global Financial Crisis: An input-output analysis. Energy 2010, 35, 1805–1812. [Google Scholar] [CrossRef]
  49. Eng, I. Agglomeration and the local state: The tobacco economy of Yunnan, China. Trans. Inst. Br. Geogr. 1999, 24, 315–329. [Google Scholar] [CrossRef]
  50. People’s Government of Yunnan Province (PGYP). The Tenth Five Year Plan for economic and social development in Yunnan province. 2001. Available online: http://www.bjpc.gov.cn/fzgh_1/guihua/10_5/gj_ws/200710/P020071024539269370799.pdf (accessed on 13 November 2014). (In Chinese) [Google Scholar]
  51. Wang, Y.; Zhu, Q.H.; Geng, Y. Trajectory and driving factors for GHG emissions in the Chinese cement industry. J. Clean. Prod. 2013, 53, 252–260. [Google Scholar] [CrossRef]

