Article

Underground Hydrogen Storage Safety: Experimental Study of Hydrogen Diffusion through Caprocks

1
Department of Environment, Land and Infrastructure Engineering (DIATI), Politecnico di Torino, 10129 Torino, Italy
2
Department of Applied Science and Technology (DISAT), Politecnico di Torino, 10129 Torino, Italy
3
Center for Sustainable Future Technologies, Fondazione Istituto Italiano di Tecnologia, 10144 Torino, Italy
4
Snam-Stogit, 26013 Crema, Italy
*
Author to whom correspondence should be addressed.
Energies 2024, 17(2), 394; https://doi.org/10.3390/en17020394
Submission received: 27 November 2023 / Revised: 29 December 2023 / Accepted: 10 January 2024 / Published: 12 January 2024
(This article belongs to the Special Issue Advanced Methods for Hydrogen Production, Storage and Utilization)

Abstract

:
Underground Hydrogen Storage (UHS) provides a large-scale and safe solution to balance the fluctuations in energy production from renewable sources and energy consumption but requires a proper and detailed characterization of the candidate reservoirs. The scope of this study was to estimate the hydrogen diffusion coefficient for real caprock samples from two natural gas storage reservoirs that are candidates for underground hydrogen storage. A significant number of adsorption/desorption tests were carried out using a Dynamic Gravimetric Vapor/Gas Sorption System. A total of 15 samples were tested at the reservoir temperature of 45 °C and using both hydrogen and methane. For each sample, two tests were performed with the same gas. Each test included four partial pressure steps of sorption alternated with desorption. After applying overshooting and buoyancy corrections, the data were then interpreted using the early time approximation of the solution to the diffusion equation. Each interpretable partial pressure step provided a value of the diffusion coefficient. In total, more than 90 estimations of the diffusion coefficient out of 120 partial pressure steps were available, allowing a thorough comparison between the diffusion of hydrogen and methane: hydrogen in the range of 1 × 10⁻¹⁰ m2/s to 6 × 10⁻⁸ m2/s and methane in the range of 9 × 10⁻¹⁰ m2/s to 2 × 10⁻⁸ m2/s. The diffusion coefficients measured on wet samples are 2 times lower compared to those measured on dry samples. Hysteresis in hydrogen adsorption/desorption was also observed.

1. Introduction

The transition to green and renewable energy is at the forefront of various energy policies. Electric energy production from renewable sources is governed by the availability of the individual energy source, i.e., wind or solar radiation. Natural fluctuations in their availability can lead to energy shortages if the share of renewable sources in the total energy production is significant. One possibility to mitigate these shortages is Power-to-Gas technology (P2G), which consists of converting electrical power into gaseous fuel [1]. Most P2G systems use electrolysis to produce hydrogen, which can be stored for a certain period and retrieved when necessary.
Currently, hydrogen is generally stored as a gas in very high-pressure vessels or in liquid form at very low temperatures in heavily insulated vessels [2]. Geological storage in underground structures, such as depleted natural gas/oil reservoirs, can provide a large-scale storage capacity. Moreover, underground storage is safer than above-ground storage tanks due to the absence of contact with atmospheric oxygen (a mixture of hydrogen and air is explosive in a very broad range, from 4% to 74% [3]). These are the reasons why underground hydrogen storage (UHS) has recently been given serious consideration [4,5].
UHS is similar to the underground storage of natural gas and most of the past and ongoing underground hydrogen projects use the experiences gained from underground natural gas storage over more than a century of successful operations (it was 1915 when the first depleted gas reservoir was converted into storage for natural gas [6]). Assessment of reservoir storativity, well injectivity and deliverability, and induced geomechanical stresses and strains are required to store fluids underground. The caprock integrity, potential subsidence and uplift of the ground level, and possible microseismicity do not depend on the type of fluid, so the established methodologies can be used. Conversely, significant differences exist between hydrogen and natural gas both in physical properties (i.e., lower viscosity, lower molecular dimension) and chemical properties (higher chemical reactivity). Thus, some additional investigations are needed to assess the technical feasibility and safety concerning caprock tightness and diffusivity, interactions with the reservoir rocks, potential subsequent changes in the storage properties, reactions with microbial communities, and compatibility with materials [5].
In this paper, we do not aim to demonstrate the overall feasibility of hydrogen storage, which requires not only the mandatory assessments for any fluid storage (recalled above) but also substantial laboratory work and multidisciplinary studies as it is emerging from the recent scientific literature [4,7,8,9,10,11,12,13]. Here, we focus on the evaluation of possible hydrogen diffusion through the caprock. To this end, the diffusion coefficient of hydrogen through the caprock has to be evaluated. Caprocks are typically characterized by the presence of abundant clay minerals. According to the technical literature, hydrogen diffusivity mainly takes place in the brine saturating the caprock [14,15]. The gas concentration in water is limited by the maximum solubility, which is very low for hydrogen compared to methane. In contrast, the diffusion ability of hydrogen is larger (Table 1).
Gas diffusion in rocks is dominated by the diffusion of gas through the fluid saturating the pores ( D f ) and also by the pore structure. The effective diffusivity coefficient ( D e ) expresses the dependence of diffusion on the pore structure in terms of the tortuosity ( τ ), porosity ( ϕ ), and constriction factor ( c ) [18]:
D e = D f ϕ c τ 2 .
The effective diffusion coefficient of the gas in clay mineral formations has been widely studied over the past few decades. Many literature measurements are related to formations for nuclear waste repository projects, such as Boom clay, Opalinus clay, and Callovo-Oxfordian clay, which are characterized by depths of a few hundred meters (Table 2). Though some experiments have been conducted to explore the potential impacts of CO2 diffusion through the impermeable caprocks for CO2 geological sequestration [19], the work on hydrogen diffusion in caprocks is relatively limited [20].
A summary of the laboratory assessment of the diffusion coefficient for hydrogen on clay rocks available in the technical literature is given in Table 2. Measurements at ambient conditions have been performed both on water-saturated samples [15,21,22,23] and dry samples [24]. Diffusion at underground storage conditions remains poorly studied [25], along with measurements on actual caprock samples of potential storage sites [26]. Most of the available hydrogen diffusion analyses are thus not fully representative of a caprock for deep hydrogen storage, either for the nature of the analyzed samples (synthetic or dry or shallow depth) or for the test conditions that do not match the geological ones of a deep hydrogen storage site. This aspect is more critical for the temperature. Underground temperature conditions could have a significant impact on the diffusivity coefficient; increasing the temperature reinforces the diffusion of confined hydrogen moderately [20]. Theoretical values of the free molecular diffusion coefficient ( D ) for gases show a direct proportionality with temperature ( T ) and an inverse proportionality with pressure ( p ) [27]:
D = D 0 ( T / T 0 ) α p 0 / p ,
where D 0 is the free diffusion coefficient at T 0 and p 0 . Inverse correlations between the diffusion coefficients and pressures were also experimentally observed for the diffusion of He in rocks [28], CH4 in rocks [29], CH4 in coal [30], and H2 in clay [24]. Thus, values of the diffusivity coefficient at an ambient pressure should represent an overestimation of the diffusivity at the reservoir pressure.
The scope of this study is to estimate the effective diffusion coefficient ( D e ) of hydrogen through real caprock samples from natural gas storage reservoirs and compare it with methane. Furthermore, experiments were conducted at the reservoir temperature. Adsorbed gas measurements under dynamic isothermal conditions at low pressure are performed with a Dynamic Gravimetric Vapor/Gas Sorption System (DVS Vacuum) based on a microbalance. During multiple adsorption/desorption cycles, the changes in the sample mass are recorded by a high-resolution microbalance. The diffusivity coefficient is then estimated from dynamic mass data, according to the solution of the diffusion equation first employed by [31].
The current paper provides a thorough analysis and characterization of the diffusion coefficient for real caprocks, based on a significant number of tests and corresponding data. Several samples extracted from cores of two different caprocks were tested. Employing a rock sample rather than using a powdered sample [32,33] provides measured sorption properties that are more representative of the shale matrix [34,35]. Both dry and non-dry samples were analyzed to verify the impact of the presence of water, which may significantly decrease the gas diffusivity in the sealing rock [36]. Each experiment was carried out twice to minimize the uncertainty associated with measurements. Each experiment consisted of four sorption steps, characterized by different partial pressures ( P p = 20%, 40%, 60%, and 80% of 740 Torr), alternated to desorption steps (at P p = 1% of 740 Torr; a vacuum was avoided to decrease overshooting between different steps). Measurements were performed both with H2 100% and with CH4 100%. A “blank test” was associated with each experiment to provide suitable data for the correction of overshooting effects. The blank test consisted of repeating each test without the rock sample in the pan (i.e., the sample holder) to isolate the variation in the measured mass due to the chamber filling or emptying operations. Experiments were conducted at a pressure approximating the ambient pressure (i.e., aforementioned pressure steps up to 740 Torr) and a temperature (45 °C) representative of the reservoir under analysis, which is about 1500 m deep. The adopted experimental setup did not allow for the reproduction of the reservoir pressure conditions. However, as previously discussed, the diffusion coefficient for gasses shows an inverse proportionality with pressure; thus, the obtained estimates are to be treated as conservative.
Table 2. Summary of laboratory assessment of gasses diffusion on clay rocks in the technical literature.
FormationDepthPorosityHydr. Conduct./PermeabilityDry/WetPressure and TemperatureMethodGas UsedValues
[37]Boom clay200 ÷ 300 m36 ÷ 43%-SaturatedT: 25 °C
p: up to 5 bar
In- and through-diffusion testsH24.2 × 10−12 m2/s
to 1.6 × 10⁻¹⁰ m2/s
[38]Callovo-Oxfordian clay430 ÷ 550 m23%K = 10 × 10−22 m2SaturatedT: 30 to 80 °C
p: 10 ÷ 50 bar
Through-diffusion method
Helium leak detection using mass spectrometry
He2 × 10−12 m2/s
[24]Callovo-Oxfordian clay~500 m13 ÷ 15%K ~ 10 × 10−22 m2DryT: Ambient
p: 1.5 ÷ 4 bar
Water vapor sorption isotherm [39]Water vapor1 × 10−8 m2/s
[22] (data reported on [23,40])Boom clay200 ÷ 300 m31 ÷ 45% SaturatedT: 25 °C
p: ambient
In-diffusion and through-diffusion experiments [38]H23.0 × 10−11 m2/s
[21]Boom clay200 ÷ 300 m31 ÷ 45% SaturatedT: 25 °CIn diffusion and through-diffusion experiments [38]H25 × 10−12 m2/s
to 4 × 10⁻¹⁰ m2/s
[36]Callovo-Oxfordian clay430 ÷ 550 m--DryT: 90 and 120 °C p: 0.45 barThrough diffusionH21.4 × 10−7 m2/s
[40]Callovo-Oxfordian clay430 ÷ 550 m--Wet--H21.1 × 10−11 m2/s
[41]Boom clay200 ÷ 300 m37%3.3 × 10⁻¹² m/sSaturatedT: 21 ± 2 °C
p ~10 bar
Through diffusionNe, ArNe: 5.1 × 10⁻¹⁰ m2/s
Ar: 2 ± 0.1 10−10 m2/s
Opalinus clay~300 m12%1.8 × 10⁻¹³ m/sSaturatedT: 21 ± 2 °C
p ~10 bar
Through diffusionHeHe: 5.4 × 10⁻¹⁰ m2/s
[23]Opalinus clay~300 m17 ÷ 19%3 × 10⁻¹² m/sWater content: 7%T: 15 ÷ 16 °C
p: 1.5 bar
Gas circulation module and a water sampling module [15]Mixture of H2 (5%) He (5%), Ne (5%), and Ar (85%)H2: 8.12 × 10⁻¹¹ m2/s
Ne: 6.39 × 10⁻¹¹ m2/s
He: 11.53 × 10⁻¹¹ m2/s
[42]Synthetic Na-montmorillonites-7 ÷ 12% DryT: 26.85 °C;
p: up to 60 bar
Thermogravimetric (TGA)H29.9 × 10−8 m2/s
[23]Boom clay200 ÷ 300 m-1.5 ÷ 8 × 10⁻¹² m/sSaturatedT: ambient (21 °C)
p: 10 bar
Double through-diffusion test [43]Mixture of H2 (5%) and Ar (95%)2.64 × 10⁻¹⁰ m2/s
[35]Marcellus shale2395.7 m--DryT: 60 °C
p: up to 100 bar
Thermogravimetric (TGA)CH4, C2H60.63 mg/g (CH4 at 5 bar)
2.99 mg/g (CH4 at 103.2 bar)
[26]Caprock samples (late Neogene)-28 ÷ 35% SaturatedT: 20° ÷ 22 °C
p: 40 bar
Binary diffusion setup [44]H28 × 10−11 m2/s (fresh)
1.1 × 10⁻⁸ m2/s (long-stored)
1.8 × 10⁻¹⁰ m2/s (re-saturated)

2. Materials and Methods

The experimental procedure mainly consists of sample preparation, the definition of the partial pressure steps sequence to be carried out, the execution of the test measurements in the DVS Vacuum, and the interpretation of the data. To evaluate the diffusion coefficient, several sorption/desorption tests on several samples of the same caprock core were performed.

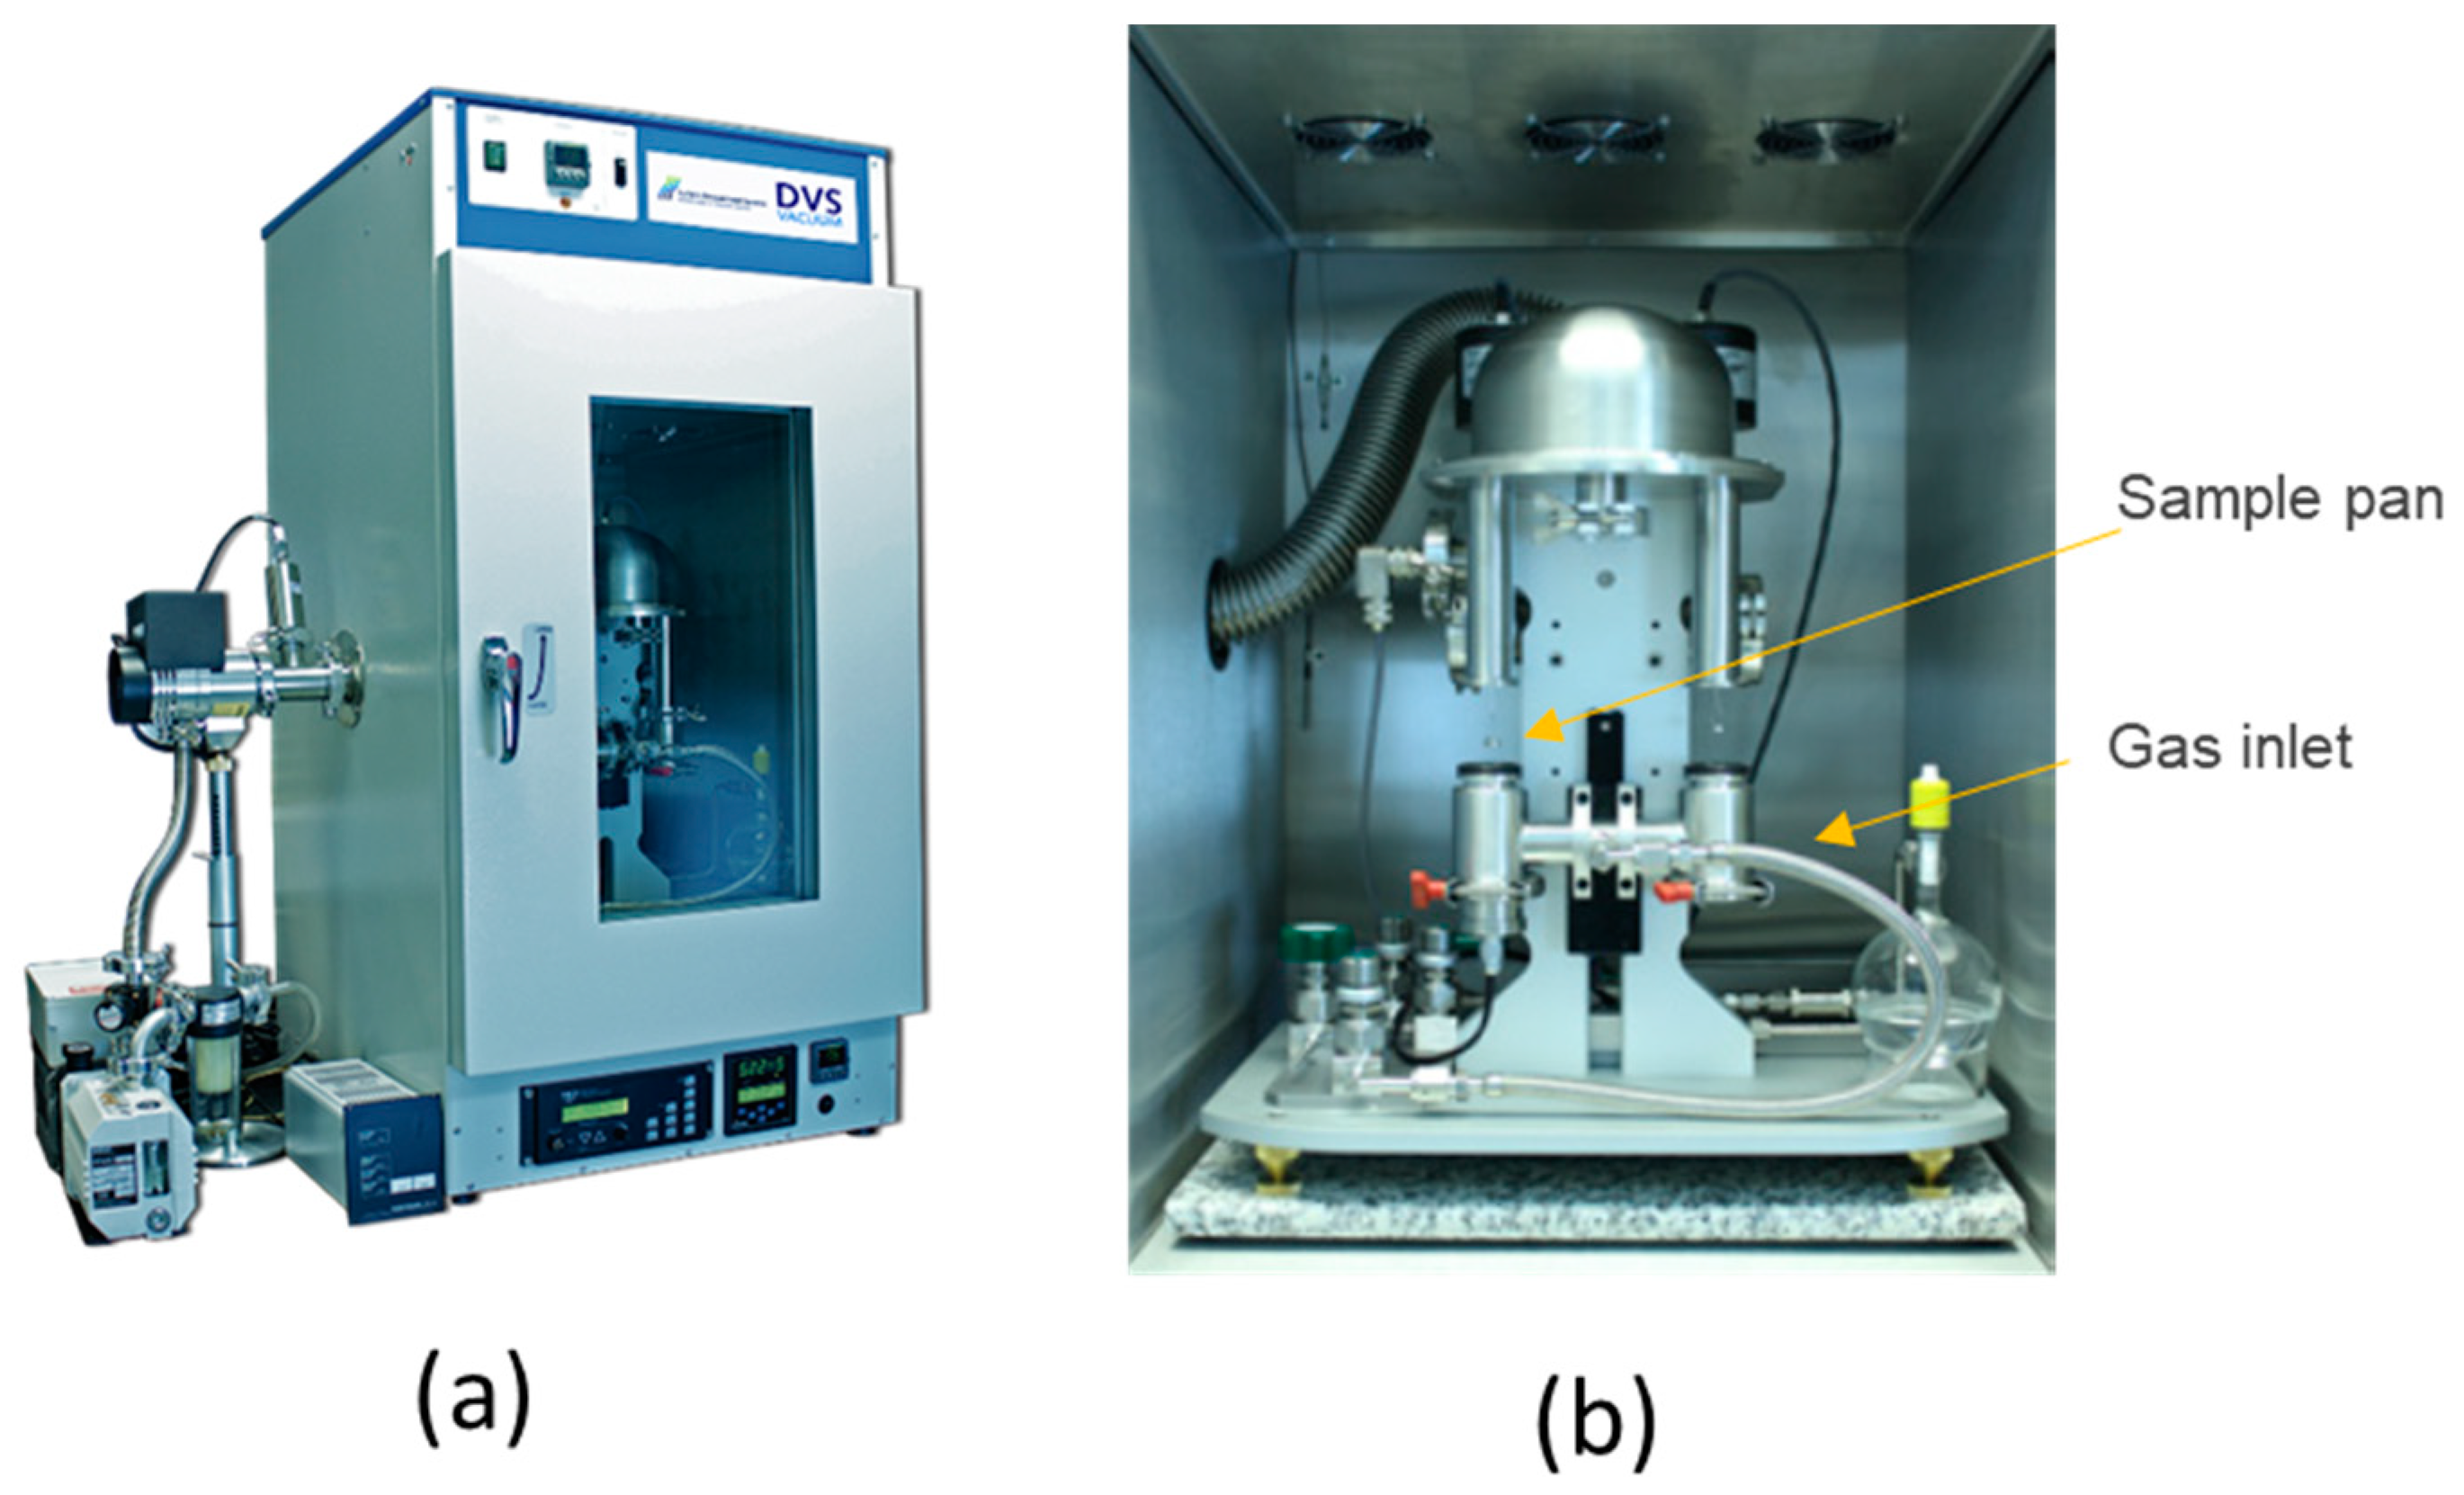
2.1. Experiment Description

Measurements of gas diffusion through samples of the caprock were carried out through an experimental apparatus, the Dynamic Gravimetric Vapor/Gas Sorption Analyzer (DVS Vacuum) by Surface Measurement Systems Limited. This device can perform measurements related to multiple adsorption/desorption cycles under dynamic conditions, thus providing dynamic data suitable for diffusion coefficient calculation. The device controls and measures the sorbate entry (water vapor and/or gas), exit flows, pressure, and temperatures while recording changes in the sample mass with a high-resolution microbalance (sample mass from 1 mg to 0.500 g, resolution 0.1 μg). In situ sample drying/degassing at elevated temperatures (up to 400 °C) and a high vacuum (2 × 10⁻⁶ Torr) is also possible [29].
The external and internal components of the DVS Vacuum apparatus are shown in Figure 1. The dynamic adsorption measurement is shown in Figure 2; further details are given in Appendix A.
The gases used in the tests are hydrogen (declared impurity of 0.0001%) and methane (declared impurity of 0.005%).
The experiment design consists of four sorption steps characterized by different P p (ex. 20%, 40%, 60%, and 80% of 740 Torr, corresponding to approximately 0.2, 0.4, 0.6, and 0.8 atm) alternated with desorption steps (Figure 3). During some preliminary experiments, each partial pressure step started from a vacuum with alternating sorption to desorption P p = 0 % . However, it was observed that overshooting effects due to pressure transient in the microbalance filling period were quite significant and could not be reliably corrected for P p ≥ 40%. In order to reduce the impact of the overshooting effects, tests were carried out setting P p = 1% (instead of P p = 0 % ) before the first partial pressure step ( P p = 20%) and for all the desorption steps.

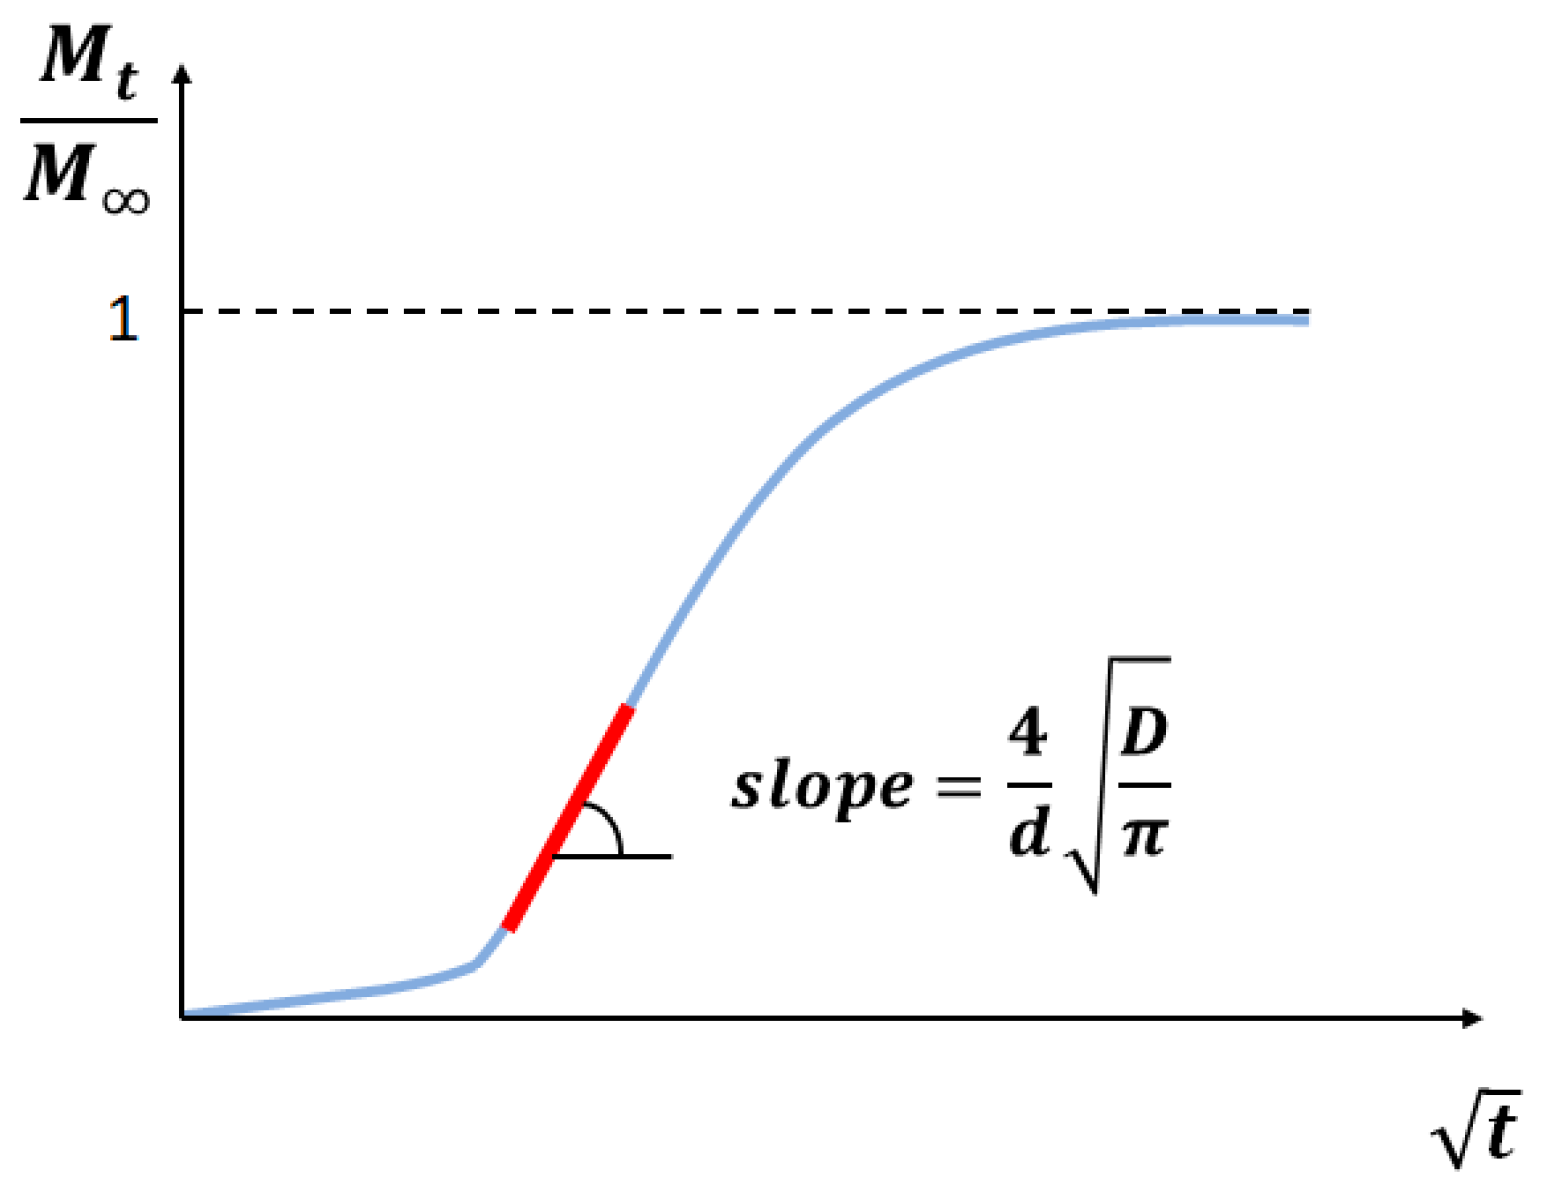
2.2. Theoretical Background

One of the main concerns about the caprock sealing capacity is related to possible hydrogen diffusion through the caprock itself in the vertical direction, leading to leakage from the storage. Therefore, a plane geometry, parallel to caprock layering, was adopted in the sample preparation phase, and a corresponding analytical interpretation model was implemented for data interpretation.
At each partial pressure step, the non-steady-state mass transfer across the sample occurs as one-dimensional diffusion, described by Fick’s second law, under the following assumptions:
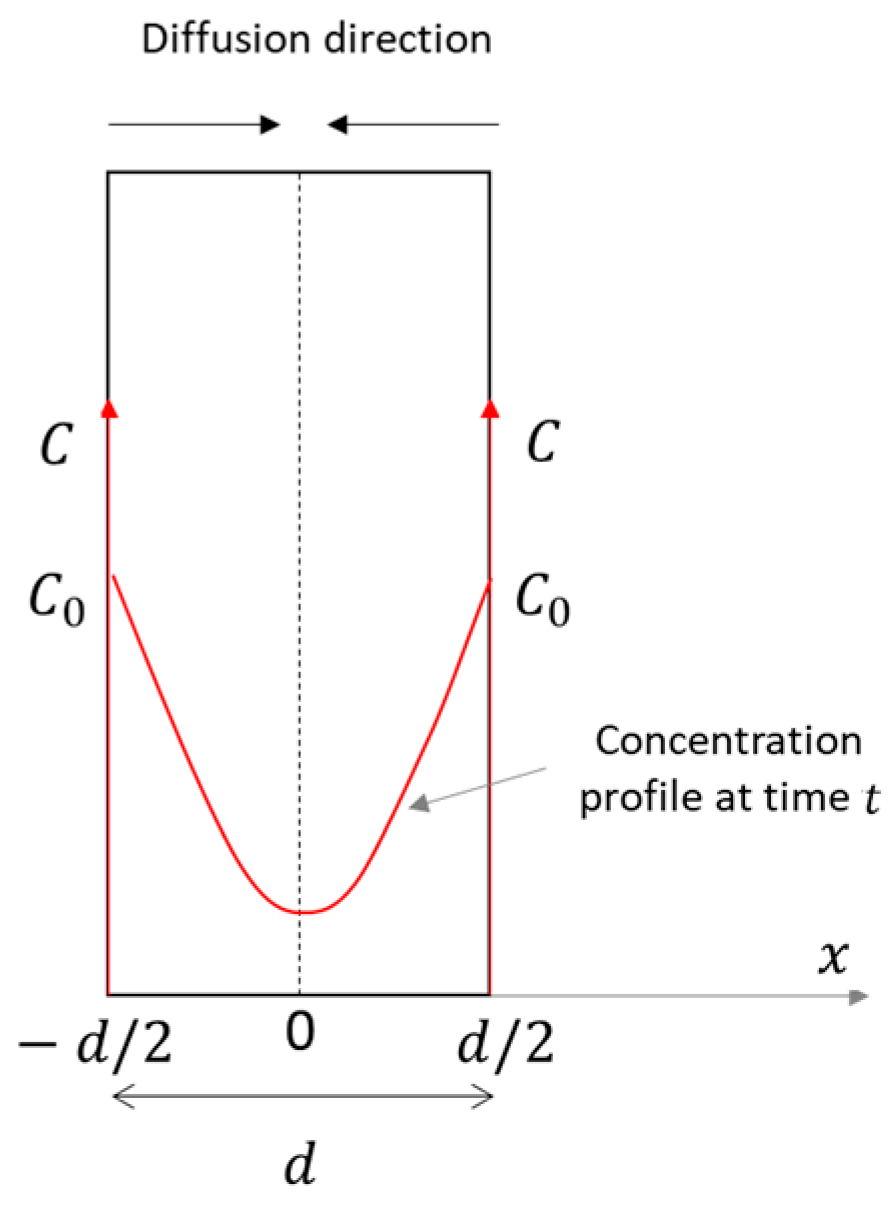
  • a thin plane geometry, with a constant thickness ( d );
  • double-side exposure;
  • diffusion only across the sample, i.e., in a single direction ( x ) (Figure 4);
  • a constant and uniform source concentration ( C 0 ), equal on both sides;
  • constant diffusion;
  • isothermal conditions.
Fick’s second law of diffusion for one-dimensional diffusion reads as follows [31]:
C t = D 2 C x 2 ,
where D is the diffusion coefficient; C is the concentration of the solute; and x is the distance from the center of the sample.
The concentration is linked to the mass of the diffusant ( M ):
M = V C d V .
At the beginning of the test, typically in a timeframe of a few minutes, the sample mass increases as an effect of the surface adsorption of the gas. After the initial surface adsorption, absorption into the bulk can occur. Usually, the bulk absorption phenomenon is much slower than surface adsorption. Therefore, it is possible to identify the time ( t = 0 ) and mass ( m 0 ) at which surface adsorption stops and to monitor further increases in mass ( M t = m ( t ) m 0 ) due to the diffusion of the gas into the bulk. After long exposures to gas, bulk diffusion will cease, and the sample will reach an equilibrium mass ( M ).
Under the assumed hypotheses, Equation (3) has the following solution [47]:
M t M = 1 8 π 2 n = 0 1 2 n + 1 2 e x p 2 n + 1 2 π 2 D t d 2 ,
where M t is the gas mass uptake adsorbed/desorbed at a given time t and M   i s the gas mass uptake at an equilibrium. The uptake mass is calculated by subtracting the initial mass ( m 0 ) to the mass recorded at each time.
For short times, Equation (5) can be reduced to a simplified form [48]:
M t M = 4 d D t π 0.5
From Equation (6), it follows that the slope of the plot M t M vs. t (Figure 5) gives the diffusion coefficient:
s l o p e = 4 d D π
Eventually, the diffusion coefficient is evaluated as follows:
D = s l o p e 2 d 2 π 16
The procedure is exploited for increasing the partial pressure ( P p ) (Figure 3), i.e., for increasing the available adsorbate mass, thus obtaining several diffusion coefficients corresponding to different P p .
According to Henry’s law of solubility, the gas concentration in the sample is directly proportional to the applied gas pressure [49]. Thus, the solubility ( S ) is estimated using M for each partial pressure step, as follows:
S = M V m w p ,
where V is the sample volume, m w is the molecular weight of the adsorbed species, and p is the applied pressure (calculated from the partial pressure value). Under steady-state conditions and assuming the diffusion and solubility coefficients to be independent of concentration, the gas permeation flux ( J ) can be expressed as follows [49]:
J = D S p x ,
where the product D S gives the permeability coefficient.

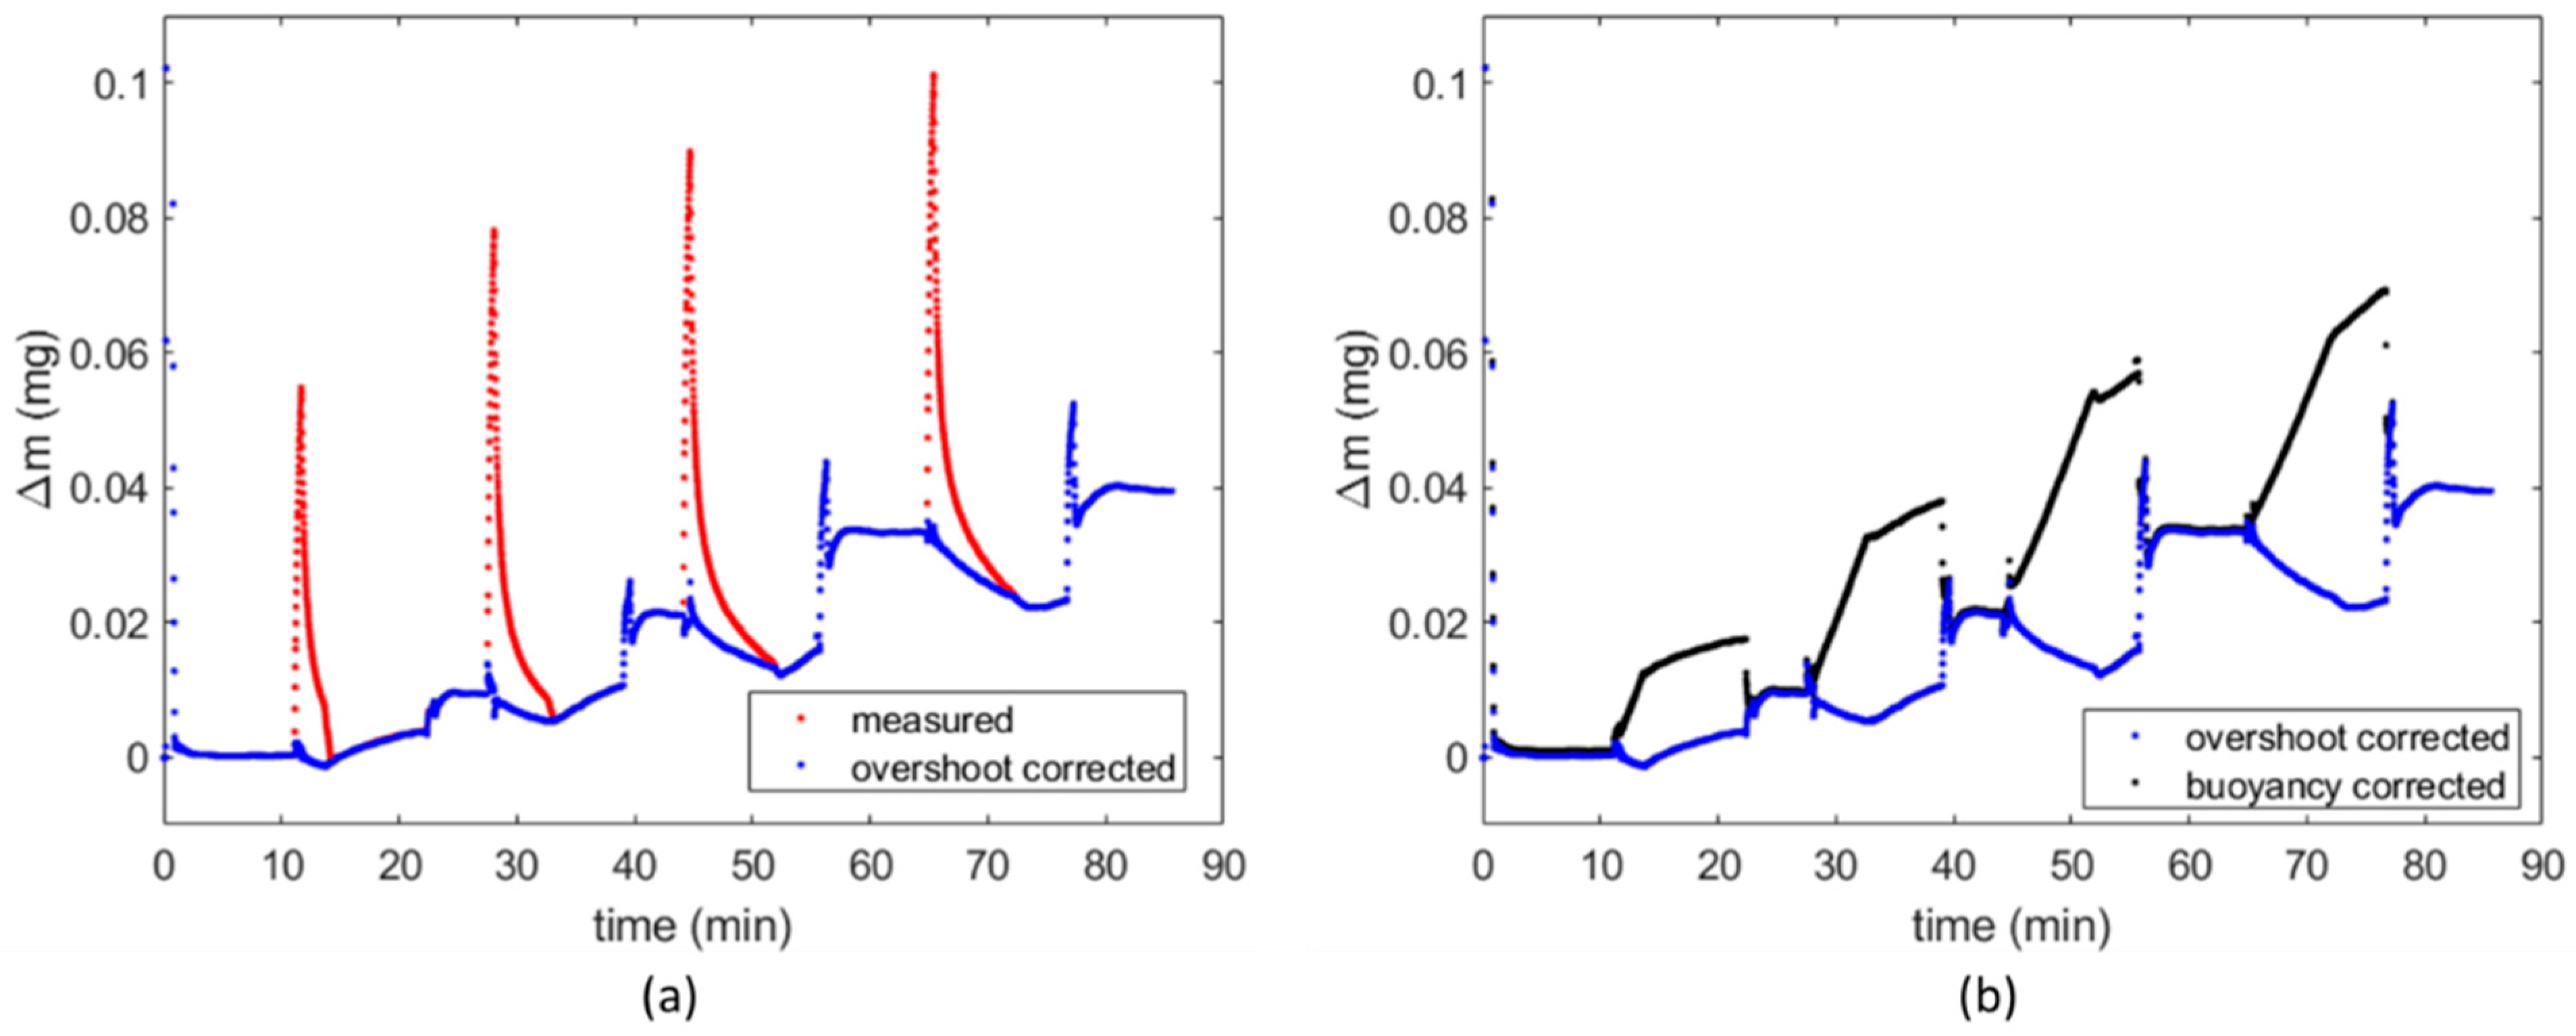
2.3. Data Processing

In ideal conditions, during the experiment, the measured mass ( m m e a s u r e d ) is the superposition of the mass of the sample, measured at vacuum conditions ( m 0 ) , called the reference mass, and the adsorbed gas ( m g a s ):
m m e a s u r e d   ( t ) = m 0 + m g a s ( t )
However, measurements may be affected by overshooting/undershooting effects due to pressure transient and buoyancy effects [35]:
m m e a s u r e d t = m 0 + m g a s ( t ) m b u o y a n c y ( t ) + m o v e r s h o o t i n g ( t ) .
Any partial pressure variation from one step to the next (e.g., from vacuum to P p = 20%) cannot occur instantaneously inside the DVS and requires a transient period in which the partial pressure variation is a function of the gas inflow rate (0.13 L/min in our experiments). Therefore, for a constant gas inflow rate, the pressure transient duration increases with the magnitude of the partial pressure step. For instance, the pressure transient from P p = 0 to P p = 20% lasts about 2.5 min, while the pressure transient from P p = 0 to P p = 80% takes about 7.5 min if the injected gas is H2 and up to 10 min if the injected gas is CH4 (Figure 6). This behavior generates the overshooting/undershooting effects. The phenomenon and the corresponding correction strategy are described below.
During the pressure transient, short-lived flow perturbations in the chamber take place while gas is entering the chamber. Immediately after a step change in the chamber pressure, a temporary fluctuation in the weight measurement occurs in the form of an overshoot/undershoot. This fluctuation has no impact on the equilibrium adsorption estimate, but it does affect the short-term sorption investigation, which is involved in diffusion calculation. Therefore, a correction should be introduced for each partial pressure step. To this end, a test with an empty pan, called a “blank run”, has to be performed to isolate the overshooting/undershooting behavior ( m o v e r s h o o t i n g ( t ) ) corresponding to each imposed partial pressure step [35]. The blank run consists of running a test applying the same gas mixture and the same partial pressure steps of the test to be corrected but testing the empty pan. In such a way, the mass increase measured during the blank test represents the flow perturbations due to the pressure transient only. The duration of partial pressure steps could be shorter for blank runs than for the corresponding test with the sample because the mass can stabilize faster since there is no adsorption process. The signal due to the pure overshooting ( m o v e r s h o o t i n g ( t ) ) can therefore be isolated for each partial pressure step to provide the correction to be applied to the actual measurements. Figure 6 shows the blank run performed for H2 and CH4, showing a significant overshooting effect for both.
Buoyancy is the upward force exerted by the gas filling the balance chamber that opposes the weight of the fully immersed sample. As a result, the weight measurement decreases in the quantity m b u o y a n c y , proportional to the partial pressure P p (t), following Archimedes’s principle:
m b u o y a n c y ( t ) = ρ g P p ( t ) V s ,
where ρ g is the gas density at P P 0 = 100 % and V s is the sample bulk volume. If the volume is not easily computable, as in the case of flakes characterized by irregular geometry, it can be estimated from the ratio between mass at vacuum conditions ( m 0 ) and the density of the clay ( ρ s ) constituting the sample under analysis:
V s = m 0 ρ s
Buoyancy effects on the sample holder are already accounted for by the balance, in which a second empty pan allows for a continuous tare measurement. The buoyancy effect was negligible on H2 tests, due to the very low density of H2, but relevant on CH4 tests. Therefore, buoyancy correction was applied to CH4 tests only. Figure 7 compares mass variations registered during a CH4 test and the effect of overshooting and buoyancy correction.
To sum up, before interpretation, data have to be corrected as follows:
m g a s t = m m e a s u r e d t m 0 + ρ g V s P p ( t ) m o v e r s h o o t i n g ( t ) .
Afterward, the mass uptake ( M t ) and equilibrium mass uptake ( M ) are calculated, respectively, as follows:
M t = m g a s ( t ) ,
M = m g a s ( t ) ,
where m g a s t is the mass measured at each time and m g a s ( t ) is the mass measured at an equilibrium. In most cases, an equilibrium is not completely reached. Mass variations toward equilibrium are usually very low, near the DVS accuracy. Thus, the partial pressure step is stopped when d m d t < 0.001   m g / s and the last registered mass for each partial pressure step is assumed to be a good approximation of the equilibrium mass.
Successively, the M t M vs. t plot is obtained for each partial pressure step and the corresponding diffusivity coefficient is calculated as described in the “Theoretical background” section. Slopes are obtained via the linear regression of selected portions of the data, namely those exhibiting a linear trend at early times.
Finally, the diffusivity coefficient is calculated with Equation (8), the solubility is calculated with Equation (9), and the permeability is calculated as the product of the two.

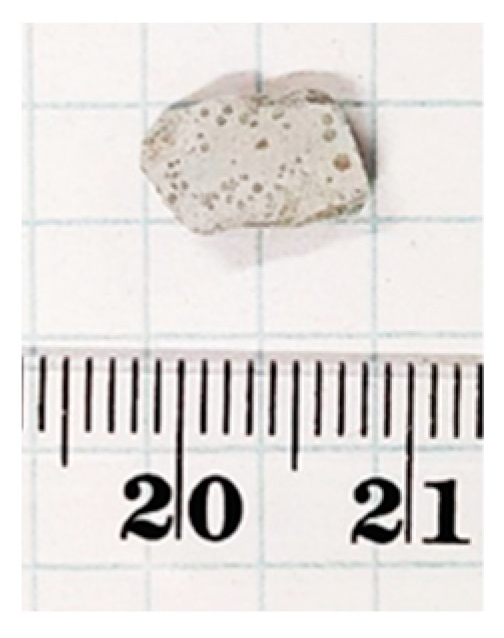
2.4. Caprock Samples and Mineralogic Analysis

Two caprock core samples collected from different reservoirs are considered and named Caprock1 and Caprock2. The reservoirs are located in the western Po plain about 40 km apart. The two reservoirs share the same caprock rock formation represented by the Argille del Santerno Formation (Pliocene) associated with depositional events of foredeep infill. Both core samples are represented by dark gray silty calcareous mudstone exhibiting a grain-supporting matrix composed of detrital clay, microcrystalline calcite particles, and local fossil content (foraminifera). The samples exhibit laminations of planar compacted detrital illitic clay. Fine silt-sized mica flakes are scattered throughout the matrix. Grains are characterized by very angular to sub-angular shapes with sizes ranging from 0.02 to 0.1 mm. Caprock1 has a porosity of 33.2% (dry helium) resulting mainly from clay-rich matrix micropores and intergranular pores; for the Caprock2 porosity, measurements are not available.
The caprock mineralogic composition was determined through X-ray powder Diffraction (XRD) experimental analyses. The spectra have been analyzed with Rietveld refinement [50] to provide the main weight percentages of the mineral classes. The analyses provided the mineralogic average composition of the caprock when performed on rock samples taken from cores that sampled several meters of the caprock and provided the information on the local compositional of the caprock when performed on the same portion of caprock that has been used for the diffusivity measurements. A set of three measurements (triplicate measurements) were collected on three different portions of the samples to increase the statistics.
The results of the XRD analyses are reported in Table 3. The average and the local mineralogic compositions of Caprock1 and Caprock2 are compared in the electronic Supplementary Materials (Figure S1). The slight difference observed between the composition of the samples used for the diffusivity tests (the local values) and the average composition of the caprock is compatible with the natural variation in the rock mineralogy of geological formations.
Flake samples were taken from the sealing rock cores of Caprock1 and Caprock2. Flakes from Caprock1 were collected from several parts of the sample within a 20 cm long sample. Flake samples of Caprock2 were collected from both the top and bottom of the core sample box at a vertical distance of approximately 1 m. All flakes were treated with ultrafine sandpaper to obtain a flat geometry. An example of a flake is shown in Figure 8. The list of flake samples is reported in Table 4. Flakes indicated as “dry” were dried in the microbalance before each test: the preheater temperature was increased to 400 °C, and the pressure was decreased to obtain a vacuum condition; after preheating, the sample was cooled down to the desired temperature (see Appendix A for details). Flakes indicated as “wet” were tested as is, avoiding the preheating phase in the microbalance. A total of 6 flakes were taken from Caprock1, and 9 flakes were taken from Caprock2.

3. Results and Discussion

To characterize and compare the diffusion coefficients of hydrogen and methane through caprocks, a significant number of adsorption/desorption tests were carried out on the caprock samples both in dry and wet conditions. A total of 15 samples (Table 4) were tested: 10 samples with hydrogen and 5 samples with methane. For each sample, two tests were performed with the same gas. Each test included four partial pressure steps ( P p = 20%, 40%, 60%, and 80% of 740 Torr), alternating sorption and desorption. Each interpretable partial pressure step provided a value of diffusion coefficient, solubility, and permeability; permeability values are reported in the Supplementary Materials (Table S1) in SI, Barrer, and Gas Permeance Unit (GPU). Most of the experimental data were interpretable after applying overshooting correction in the case of hydrogen, and after applying both overshooting and buoyancy corrections in the case of methane. In total, more than 90 estimations of the diffusion coefficient out of 120 partial pressure steps are available. The nomenclature of each test and the interpretation results for gas exposure are summarized in the Supplementary Materials (Table S1), where diffusion coefficients obtained for each sample are reported, together with solubility and permeability values. The interpretation plot of hydrogen tests on a flake of Caprock1 (F6_H2_100_a) and a flake of Caprock2 (FR2_H2_100), after overshooting correction, are also reported in the electronic Supplementary Materials as an example (Figures S2 and S3).
The overall range of the obtained diffusion coefficients is from 1 × 10⁻¹⁰ m2/s to 6 × 10⁻⁸ m2/s for hydrogen and from 9 × 10⁻¹⁰ m2/s to 2 × 10⁻⁸ m2/s for methane. Comparisons between dry and wet samples are summarized as boxplots as a function of the partial pressure steps in Figure 9, while comparisons between diffusion coefficients calculated for H2 and CH4 are summarized in Figure 10. The diffusion coefficients estimated for Caprock2 are generally higher than those obtained for Caprock1, but the same trends are observed (Figure 9 and Figure 10). For a fixed pressure value, the calculated effective diffusivity coefficients for all samples of the same caprock are within 1 order of magnitude (Figure 10). This measurement is thus more accurate than in-diffusion and through-diffusion experiments, which gave uncertainty up to 2 orders of magnitude [21,37].
The comparison between the obtained hydrogen diffusion coefficients and the values provided by the technical literature (Table 2) must take into account the differences in terms of pressure and temperature conditions, porous configuration (porosity, constriction, and tortuosity; see Equation (1)), and water saturation. However, at P p = 80% (about 0.8 atm) the obtained values are in the order of magnitude of 1 × 10⁻¹⁰ m2/s, which is within the 8.12 × 10⁻¹¹ m2/s measured by [15] on wet samples at 25 °C and 1.3 bar and the 1 × 10⁻⁸ m2/s individuated by [24] for dry samples at 1.5 bar and an ambient temperature.
Permeability values (Figure 11) are in the range of 3 × 10³ ÷ 6 × 10⁵ Barrer for hydrogen and in the range of 2 × 10³ ÷ 2 × 10⁴ Barrer for methane; similar trends are observed on both caprocks. The permeability values (3 × 10³ ÷ 2 × 10⁴ Barrer) obtained at P p = 80% (about 0.8 bar) (Figure 11) are consistent with values measured by Gajda and Lutyński [51] for a clay mineral-based mudstone (2330 Barrer) at a 1 MPa feed gas pressure. Despite the different adsorption enthalpies [52], measured gas uptakes for hydrogen and methane are comparable (Figure 12). These results are in line with Truche et al. [53], who measured hydrogen uptake values comparable to and even exceeding methane adsorption on clay minerals and shales. This result is probably due to the pore structure of shale. According to the technical literature, there is significant variation in the hydrogen [54] and methane [55] adsorption capacity in different clays, attributed to the differences in their pore structures. The shale matrix has predominantly micro (pores with a diameter of less than 2 nm) to mesopores (pores with a 2 ÷ 50 nm diameter) [56]. As the kinetic diameter of CH4 is significantly bigger than H2 (3.8 Å vs. 2.89 Å [57]), the CH4 molecule cannot enter into narrow micropores as H2 can [58]. A more complex pore structure and a larger specific surface area could provide more sorption sites for hydrogen molecules [54].
Figure 10 shows that diffusion coefficients estimated for hydrogen and methane are comparable for both the considered caprocks, especially for the first partial pressure step. This is in line with the measurements on water-saturated Boom clay samples, which gave 2.42 × 10⁻¹⁰ m2/s for methane [59] vs. 2.64 × 10⁻¹⁰ m2/s for hydrogen [23]. Conversely, the permeability to hydrogen is about 1 order of magnitude higher than the permeability to methane. This is due to a higher uptake of hydrogen compared to methane and to the molecular weight of the two species.
The water content is responsible for a difference equal to a factor of 2 on hydrogen diffusion (Figure 9), mainly for Caprock1. This result is way less pronounced than could be expected, considering that hydrogen diffusion in water is about 3 orders of magnitude less than hydrogen diffusion in air (Table 1). The limited difference observed is probably due to a reduction in the original humidity of the wet samples. Samples were extracted and/or tested days and sometimes months after the cores were opened. Compared with other experimental measurements, Didier et al. [36] measured a reduction of 4 orders of magnitude on Callovo-Oxfordian clay samples (500 m deep); Bardelli et al. [40] on the same formation found that the moisture content influenced hydrogen diffusivity by 1 to 2 orders of magnitude; Michelsen et al. [26] observed a reduction in hydrogen diffusion of 2 orders of magnitude between long-stored caprock cores and re-saturated cores. However, our results are in good agreement with the molecular dynamics simulation of Liu et al. [20] on nanopore montmorillonites at geological storage conditions: they showed that the self-diffusion coefficient of hydrogen is partly inhibited by the water content and decreases by a factor of 2.
A significant reduction in the hydrogen diffusion coefficient from P p = 20% to P p = 80% was observed, spanning more than 1 order of magnitude for both caprocks (Figure 10). The trend for the methane diffusion coefficient is similar, but the reduction is limited within 1 order of magnitude. Even if a pressure dependence of the diffusion coefficient was expected (Equation (2)), we believe that the observed reduction could be strongly influenced by incomplete or limited desorption between subsequent partial pressure steps. The fraction of hydrogen that remains adsorbed after each desorption is more significant than methane (Figure 13).
Similarly, incomplete or limited desorption is observed between two subsequent tests on the same sample, where the sample has not yet come in contact with the testing gas in the first test (denoted as “a”), while in the second test (denoted as “b”) the testing gas was already present due to the incomplete final desorption process of the first test, even under vacuum conditions. The behavior is more visible on hydrogen (Figure 13a) and less significant on methane (Figure 13b). This is probably the cause of the significant difference (factor ~2) shown in Figure 14, between the first and second measurements of the diffusion coefficient on the same sample for each corresponding P p (see, for example, tests on Flakes 4, 5, and 6 in Table S1 in the Supplementary Materials). Incomplete desorption is in line with the results of the study with nuclear magnetic resonance of Ho et al. [60], who observed a hysteresis in the adsorption/desorption of hydrogen in shale, which is not observable in sandstone.

4. Conclusions

The presented study is part of a comprehensive project that aims to evaluate the feasibility of underground hydrogen storage in two candidate reservoirs currently operated as underground storage for natural gas.
To calculate the diffusion coefficient of hydrogen through caprocks, a significant number of adsorption/desorption tests were carried out on samples retrieved from these two underground gas storage reservoirs, using a DVS Vacuum apparatus. Diffusion coefficients estimated for H2 and CH4 were compared. The data were then interpreted using the early-time approximation of the solution to the diffusion equation. The experiments were carried out at a temperature of 45 °C and at ambient pressure. Therefore, the obtained values of the diffusion coefficients can be considered representative of reservoir conditions in terms of temperature, whereas, from the point of view of pressure, they can be considered an overestimation. A total of 15 samples were tested. For each sample, two tests were performed with the same gas. Each test included four partial pressure steps of sorption alternated with desorption. Each interpretable partial pressure step provided a value of the diffusion coefficient. Most of the experimental data were interpretable after applying overshooting correction in the case of hydrogen and after applying both overshooting and buoyancy corrections in the case of methane. In total, more than 90 estimations of the diffusion coefficient out of 120 partial pressure steps are available. The main conclusions are summarized in the following:
Overall, the obtained diffusion coefficients range from 1 × 10⁻¹⁰ m2/s to 6 × 10⁻⁸ m2/s for hydrogen and from 9 × 10⁻¹⁰ m2/s to 2 × 10⁻⁸ m2/s for methane.
The diffusion coefficient measured on wet samples is 2 times lower compared to the dry samples. The limited difference observed is probably due to a reduction in the original humidity of the wet samples, which were extracted and/or tested days and sometimes months after the cores had been opened.
For all the considered tests, a significant reduction in the calculated diffusion coefficient from the first to the following partial pressure steps was observed. Even if the trend can be recognized for both the considered gasses, the phenomenon is more evident in the case of hydrogen, where the reduction can exceed 1 order of magnitude. The fraction of hydrogen that remains adsorbed after each desorption is more significant with respect to methane tests.
The incomplete desorption of hydrogen between two subsequent tests on the same sample causes a reduction of a factor of 2 of the estimated diffusion coefficients. This confirms that should any losses through the caprock ever occur due to diffusion, they would be larger at the beginning of storage operations and decrease over time, as already discussed in the technical literature [61].
According to the analysis of available results, the diffusion of hydrogen through the caprock should not be a criticality for underground hydrogen storage for the reservoirs under analysis. This work provides a step forward in the understanding and assessment of the sealing efficiency of caprocks, which will aid in the successful implementation of hydrogen storage in underground geological formations.

Supplementary Materials

The following supporting information can be downloaded at: https://www.mdpi.com/article/10.3390/en17020394/s1, Figure S1: Semi-quantitative evaluation of the main classes of minerals for Caprock1 (a) and Caprock2 (b) from X-Ray Diffraction (XRD); Figure S2: Interpretation of test F6_H2_100_a; Figure S3: Interpretation of test FR2_H2_100_a; Table S1: Results.

Author Contributions

Conceptualization, S.B. and D.V.; methodology, E.S.B., S.B. and D.V.; software, E.S.B.; validation, E.S.B. and F.P.; formal analysis, E.S.B.; investigation (mineralogical analyses), A.C. and M.F.; investigation (diffusion analysis), S.B. and M.T.; data curation, C.P.; writing—original draft, E.S.B., A.C., M.T. and D.V.; resources, F.P. and V.P.; writing—review and editing, E.S.B., S.B., F.V. and F.M.; visualization, E.S.B.; supervision, D.V.; project administration, F.V., C.F.P., A.M. and C.C.; funding acquisition, C.C. All authors have read and agreed to the published version of the manuscript.

Funding

The authors declare that this study received funding from the company SNAM-Stogit. The funder had the following involvement with the study: provided the caprock cores to perform the tests.

Data Availability Statement

Data are contained within the article and Supplementary Materials.

Acknowledgments

The authors would like to greatly acknowledge SNAM-Stogit for their support.

Conflicts of Interest

The authors declare that this study received funding from SNAM-Stogit. The funder had the following involvement with the study: provided the caprock cores to perform the tests. Authors Christian Coti, Andrea Mantegazzi, Francesco Marzano and Vincenzo Pozzovivo were employed by the company SNAM-Stogit. The remaining authors declare that the research was conducted in the absence of any commercial or financial relationships that could be construed as a potential conflict of interest.

Appendix A

The test using the DVS Vacuum device mainly consists of the following workflow:
  • Calibration of the microbalance:
    • Introduce an empty sample pan into the DVS;
    • Set the incubator temperature (45 °C) and impose the vacuum;
    • Wait until the mass measurement stabilizes (this is reached when the mass variation in time is below the threshold of d m d t < 0.001   m g / s ); the stabilization of the mass measurement could take up to 2 h;
    • Record the mass of the empty pan reached after stabilization.
  • Measurement of the initial mass:
    • Introduce the sample;
    • Dry the sample (optional): the preheater temperature is increased up to 400 °C and then decreased again to 45 °C;
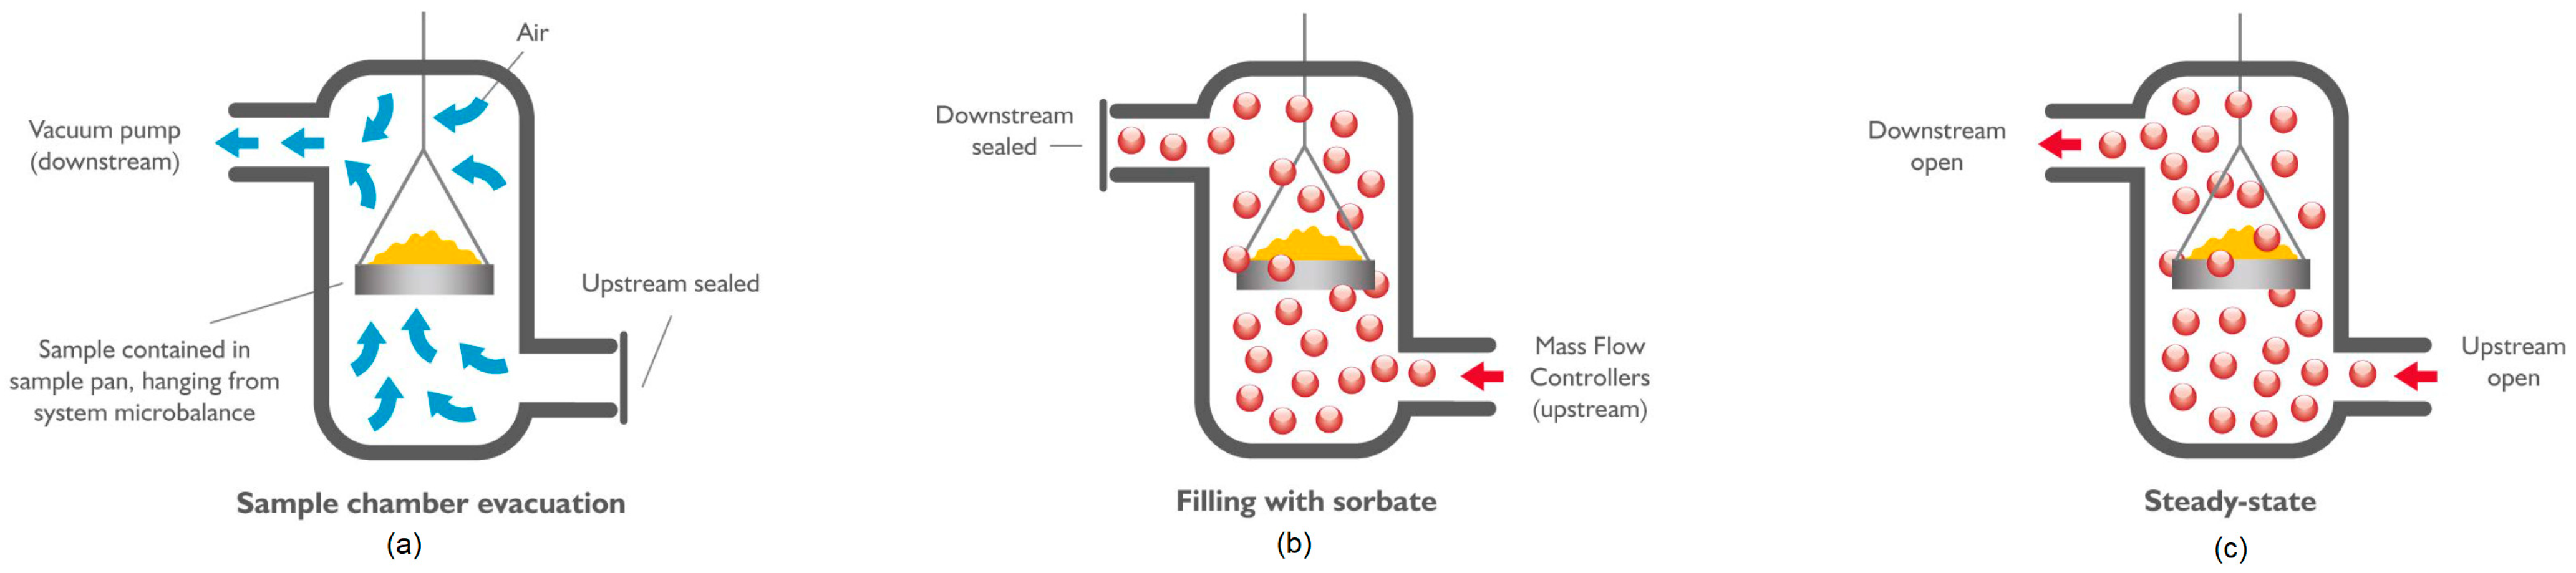
    • Impose the vacuum (Figure 2a);
    • Wait until the mass stabilizes.
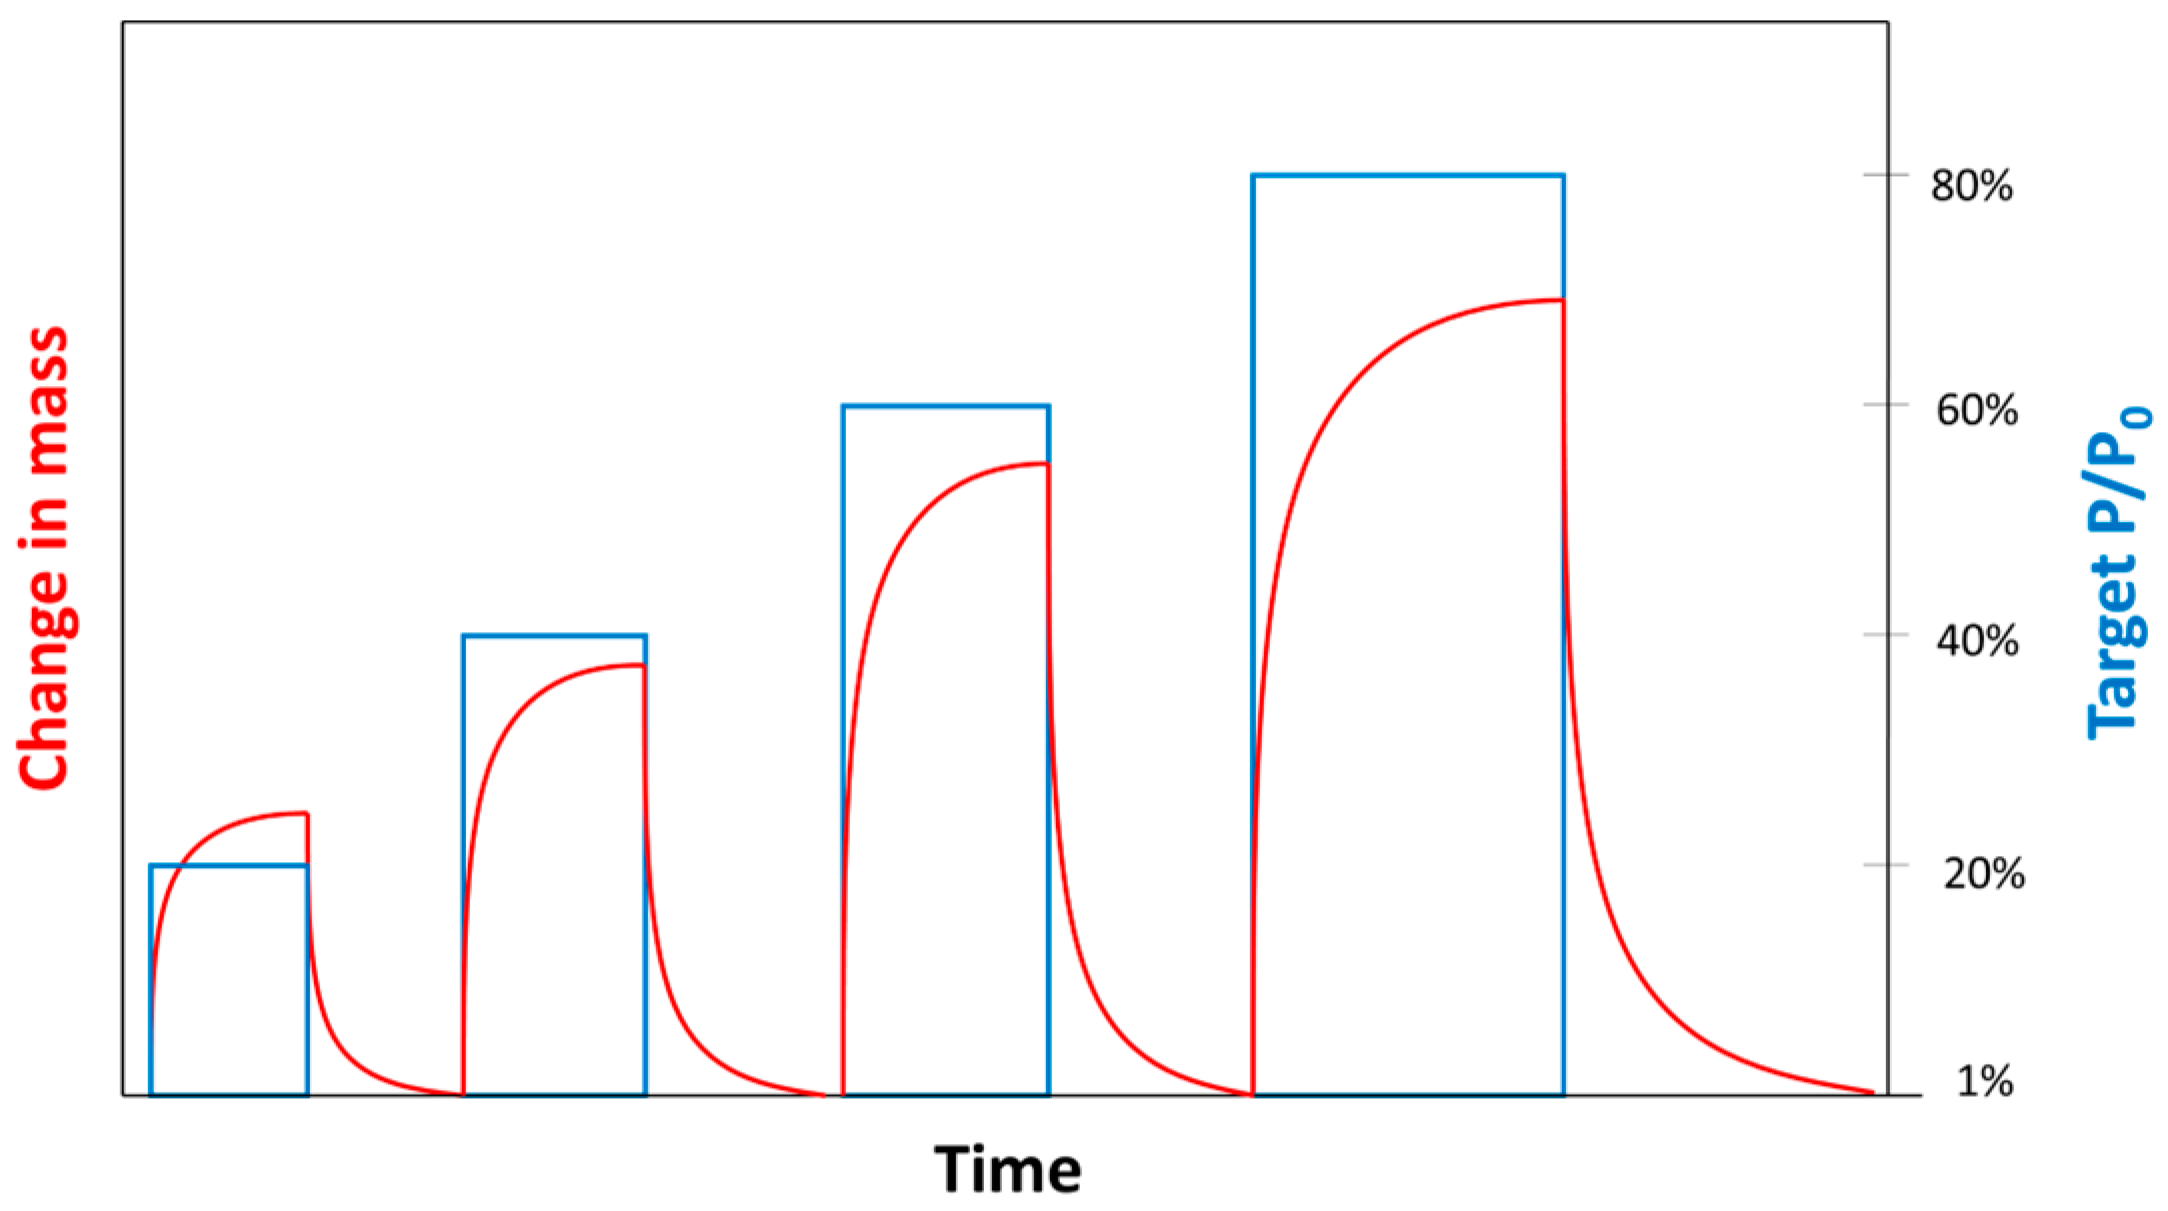
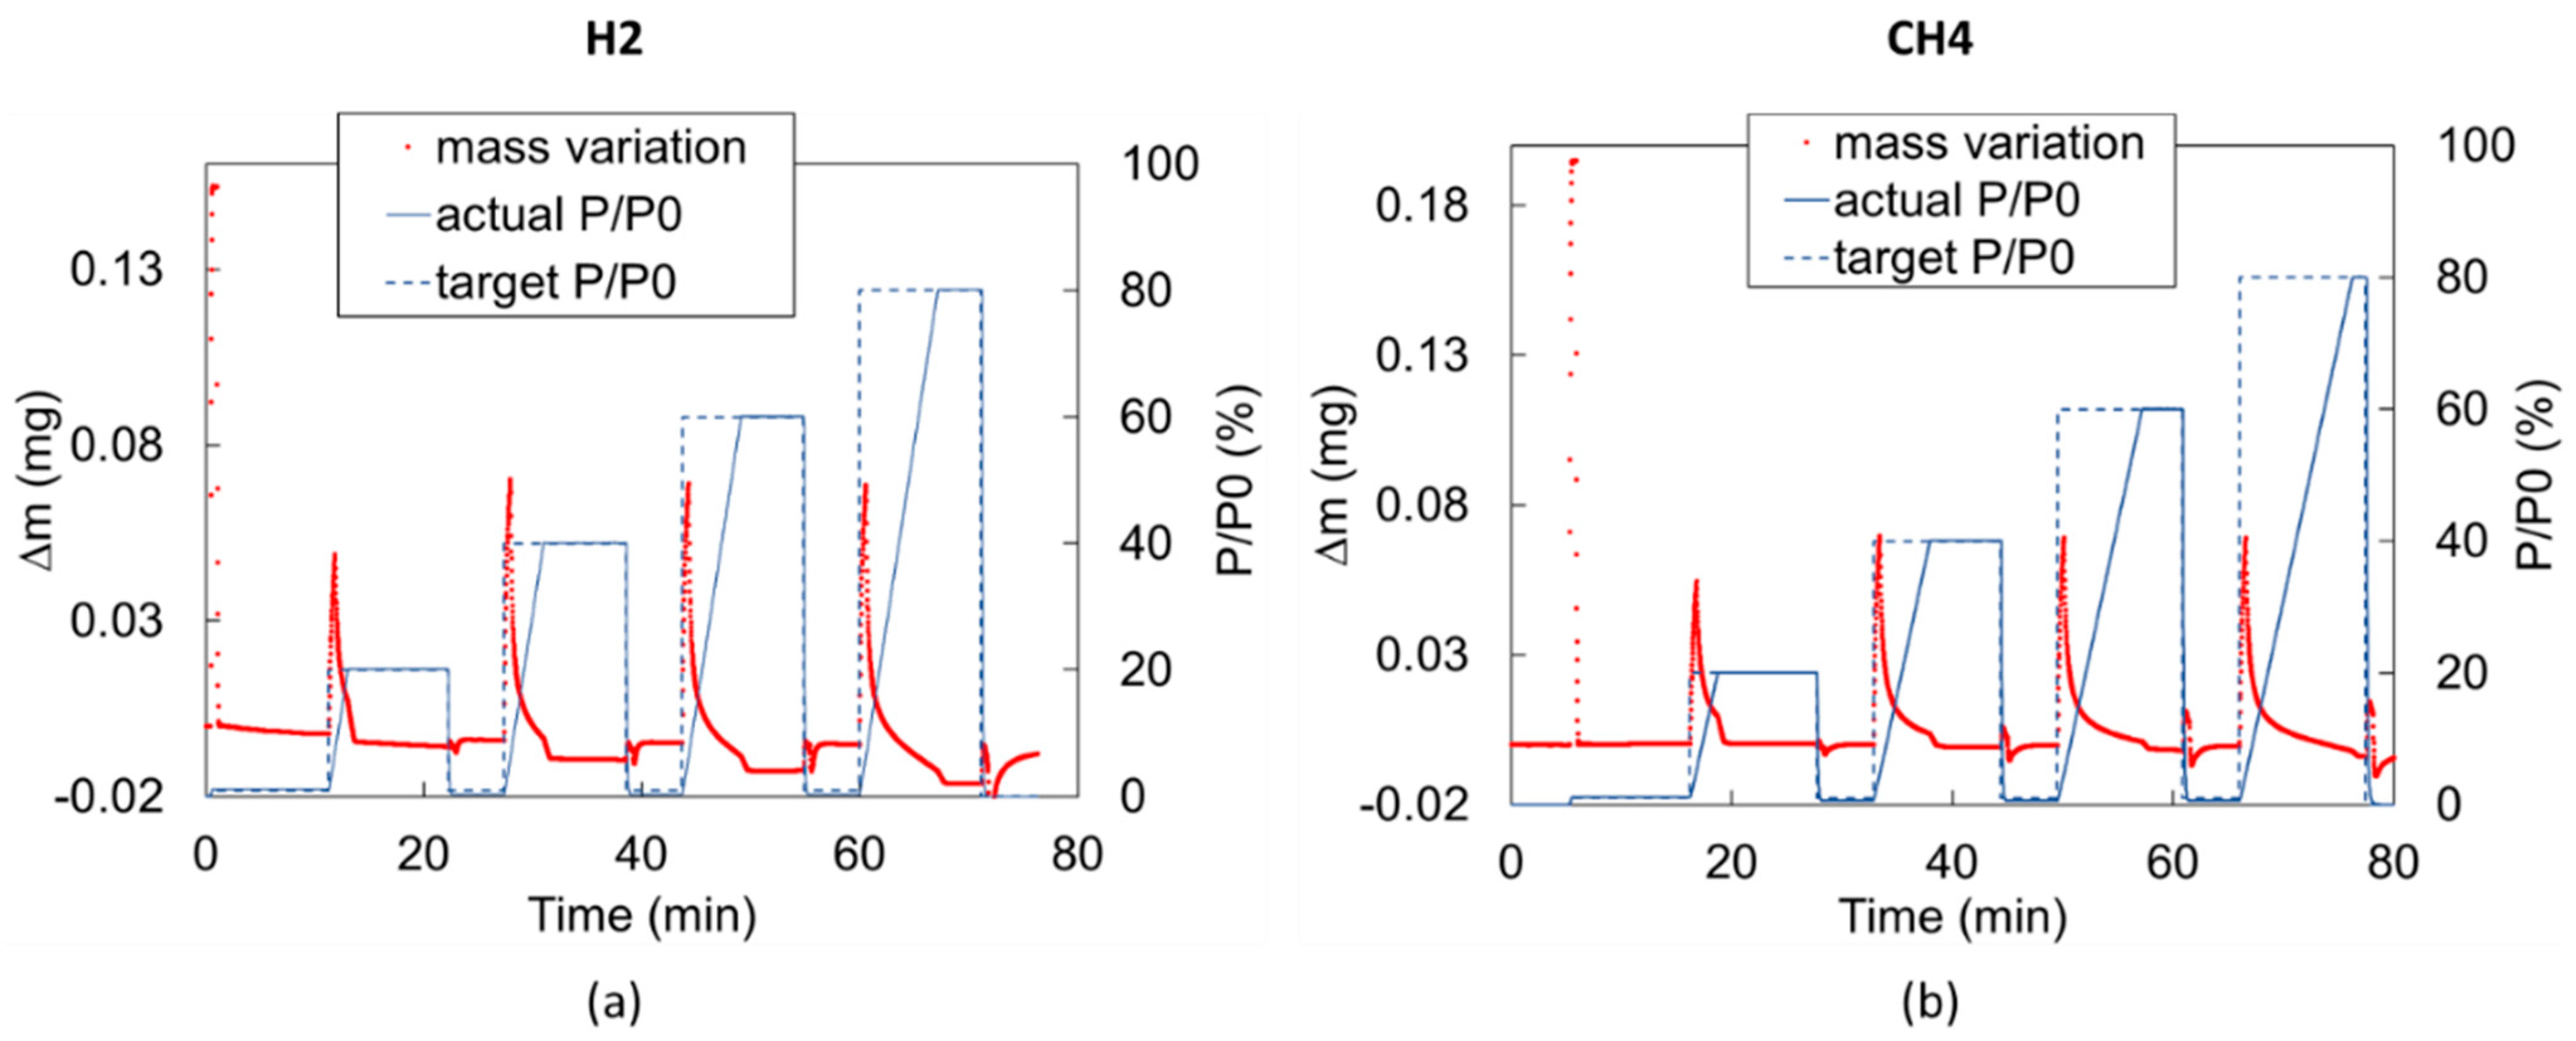
  • Sorption step:
    • A gas mixture is introduced in the chamber (Figure 2b) until a fixed partial pressure P p = p p 0   p 0 = 740   T o r r is reached;
    • p p 0 is maintained (Figure 2c);
    • The mass is measured every 1 s until the equilibrium mass is reached.
      ( d m d t < 0.001   m g / s )
  • Desorption step:
    • The chamber is evacuated;
    • The mass is measured every 1 s until the equilibrium mass is reached
      ( d m d t < 0.001   m g / s ).

References

  1. Bünger, U.; Landinger, H.; Pschorr-Schoberer, E.; Schmidt, P.; Weindorf, W.; Jöhrens, J.; Lambrecht, U.; Naumann, K.; Lischke, A. Power to Gas in Transport—Status Quo and Perspectives for Development; Federal Ministry of Transport and Digital Infrastructure (BMVI): Berlin, Germany, 2021.
  2. Langmi, H.W.; Engelbrecht, N.; Modisha, P.M.; Bessarabov, D. Hydrogen storage. In Electrochemical Power Sources: Fundamentals, Systems, and Applications; Elsevier: Amsterdam, The Netherlands, 2022; pp. 455–486. [Google Scholar] [CrossRef]
  3. Rhodes, R. Explosive Lessons in Hydrogen Safety. Apple Knowl. Serv. ASK Mag. NASA 2011, 41, 46–50. [Google Scholar]
  4. Benetatos, C.; Bocchini, S.; Carpignano, A.; Chiodoni, A.; Cocuzza, M.; Deangeli, C.; Eid, C.; Ferrero, D.; Gerboni, R.; Giglio, G.; et al. How underground systems can contribute to meet the challenges of energy transition. GEAM Geoing. Ambient. Mineraria 2021, 58, 65–80. [Google Scholar] [CrossRef]
  5. Zivar, D.; Kumar, S.; Foroozesh, J. Underground hydrogen storage: A comprehensive review. Int. J. Hydrogen Energy 2021, 46, 23436–23462. [Google Scholar] [CrossRef]
  6. Al-Shafi, M.; Massarweh, O.; Abushaikha, A.S.; Bicer, Y. A review on underground gas storage systems: Natural gas, hydrogen and carbon sequestration. Energy Rep. 2023, 9, 6251–6266. [Google Scholar] [CrossRef]
  7. Benetatos, C.; Rocca, V.; Verga, F.; Adinolfi, L.; Marzano, F. Deformation behavior of a regional shale formation from integrated laboratory and well data analysis: Insights for underground fluid storage in northern Italy. Geoenergy Sci. Eng. 2023, 229, 212109. [Google Scholar] [CrossRef]
  8. Benetatos, C.; Catania, F.; Giglio, G.; Pirri, C.F.; Raeli, A.; Scaltrito, L.; Serazio, C.; Verga, F. Workflow for the Validation of Geomechanical Simulations through Seabed Monitoring for Offshore Underground Activities. J. Mar. Sci. Eng. 2023, 11, 1387. [Google Scholar] [CrossRef]
  9. Vasile, N.S.; Bellini, R.; Bassani, I.; Vizzarro, A.; Azim, A.A.; Coti, C.; Barbieri, D.; Scapolo, M.; Viberti, D.; Verga, F.; et al. Innovative high pressure/high temperature, multi-sensing bioreactors system for microbial risk assessment in underground hydrogen storage. Int. J. Hydrogen Energy 2024, 51, 41–50. [Google Scholar] [CrossRef]
  10. Haddad, P.G.; Ranchou-Peyruse, M.; Guignard, M.; Mura, J.; Casteran, F.; Ronjon-Magand, L.; Sénéchal, P.; Isaure, M.P.; Moonen, P.; Hoareau, G.; et al. Geological storage of hydrogen in deep aquifers—An experimental multidisciplinary study. Energy Environ. Sci. 2022, 15, 3400–3415. [Google Scholar] [CrossRef]
  11. Bassani, I.; Bellini, R.; Vizzarro, A.; Coti, C.; Pozzovivo, V.; Barbieri, D.; Pirri, C.F.; Verga, F.; Menin, B. Biogeochemical characterization of four depleted gas reservoirs for conversion into underground hydrogen storage. Environ. Microbiol. 2023, 25, 3683–3702. [Google Scholar] [CrossRef]
  12. Luboń, K.; Tarkowski, R. Influence of capillary threshold pressure and injection well location on the dynamic CO2 and H2 storage capacity for the deep geological structure. Int. J. Hydrogen Energy 2021, 46, 30048–30060. [Google Scholar] [CrossRef]
  13. Shi, Z.; Jessen, K.; Tsotsis, T.T. Impacts of the subsurface storage of natural gas and hydrogen mixtures. Int. J. Hydrogen Energy 2020, 45, 8757–8773. [Google Scholar] [CrossRef]
  14. Hemme, C.; Van Berk, W. Hydrogeochemical Modeling to Identify Potential Risks of Underground Hydrogen Storage in Depleted Gas Fields. Appl. Sci. 2018, 8, 2282. [Google Scholar] [CrossRef]
  15. Vinsot, A.; Appelo, C.A.J.; Lundy, M.; Wechner, S.; Lettry, Y.; Lerouge, C.; Fernandez, A.M.; Labat, M.; Tournassat, C.; De Canniere, P.; et al. In situ diffusion test of hydrogen gas in the Opalinus Clay. Geol. Soc. Lond. Spec. Publ. 2014, 400, 563–578. [Google Scholar] [CrossRef]
  16. Wise, D.L.; Houghton, G. The diffusion coefficients of ten slightly soluble gases in water at 10–60 °C. Chem. Eng. Sci. 1966, 21, 999–1010. [Google Scholar] [CrossRef]
  17. Engineering Toolbox. Solubility of Gases in Water. 2008. Available online: https://www.engineeringtoolbox.com/gases-solubility-water-d_1148.html (accessed on 22 April 2021).
  18. Boving, T.B.; Grathwohl, P. Tracer diffusion coefficients in sedimentary rocks: Correlation to porosity and hydraulic conductivity. J. Contam. Hydrol. 2001, 53, 85–100. [Google Scholar] [CrossRef]
  19. Shukla, R.; Ranjith, P.; Haque, A.; Choi, X. A review of studies on CO2 sequestration and caprock integrity. Fuel 2010, 89, 2651–2664. [Google Scholar] [CrossRef]
  20. Liu, J.; Wang, S.; Javadpour, F.; Feng, Q.; Cha, L. Hydrogen Diffusion in Clay Slit: Implications for the Geological Storage. Energy Fuels 2022, 36, 7651–7660. [Google Scholar] [CrossRef]
  21. Aertsens, M. Re-Evaluation of the Experimental Data of the MEGAS Experiment on GasMigration through Boom-Clay. SCK CEN, Mol, Belgium, SCK CEN-ER-100. 2009. Available online: http://hdl.handle.net/10038/1182 (accessed on 22 April 2021).
  22. Krooss, B.M. Evaluation of Database on Gas Migration through Clayey Host Rocks; Belgian National Agency for Radioactive Waste and Enriched Fissile Material (ONDRAF-NIRAS): Aachen, Germany, 2008. [Google Scholar]
  23. Jacops, E.; Wouters, K.; Volckaert, G.; Moors, H.; Maes, N.; Bruggeman, C.; Swennen, R.; Littke, R. Measuring the effective diffusion coefficient of dissolved hydrogen in saturated Boom Clay. Appl. Geochem. 2015, 61, 175–184. [Google Scholar] [CrossRef]
  24. Boulin, P.F.; Angulo-Jaramillo, R.; Daian, J.-F.; Talandier, J.; Berne, P. Pore gas connectivity analysis in Callovo-Oxfordian argillite. Appl. Clay Sci. 2008, 42, 276–283. [Google Scholar] [CrossRef]
  25. Panfilov, M. Underground and pipeline hydrogen storage. In Compendium of Hydrogen Energy; Elsevier: Amsterdam, The Netherlands, 2016; pp. 91–115. [Google Scholar] [CrossRef]
  26. Michelsen, J.; Hagemann, B.; Ganzer, L.; Hujer, W. Measurement of Hydrogen Diffusion through Caprock Samples. In Proceedings of the Sixth International Conference on Fault and Top Seals, Vienna, Austria, 26–28 September 2022; European Association of Geoscientists & Engineers: Vienna, Austria, 2022; pp. 1–5. [Google Scholar] [CrossRef]
  27. Roberts, R.C. Molecular diffusion of Gases. In American Institute of Physics Handbook; Gray, D.E., Ed.; Mc-Graw Hill Book Company: New York, NY, USA, 1972; pp. 2249–2252. [Google Scholar]
  28. Pandey, G.N.; Tek, M.R. Diffusion of Fluids Through Porous Media with Implications in Petroleum Geology. Aapg Bull. 1974, 58, 291–303. [Google Scholar] [CrossRef]
  29. Schloemer, S.; Krooss, B.M. Molecular transport of methane, ethane and nitrogen and the influence of diffusion on the chemical and isotopic composition of natural gas accumulations. Geofluids 2004, 4, 81–108. [Google Scholar] [CrossRef]
  30. Wang, Y.; Liu, S. Estimation of Pressure-Dependent Diffusive Permeability of Coal Using Methane Diffusion Coefficient: Laboratory Measurements and Modeling. Energy Fuels 2016, 30, 8968–8976. [Google Scholar] [CrossRef]
  31. Crank, J.; Park, G.S. (Eds.) Diffusion in Polymers, 3rd ed.; Academic Press: London, UK, 1977. [Google Scholar]
  32. Wang, Y.; Tsotsis, T.T.; Jessen, K. Competitive Sorption of Methane/Ethane Mixtures on Shale: Measurements and Modeling. Ind. Eng. Chem. Res. 2015, 54, 12187–12195. [Google Scholar] [CrossRef]
  33. Zhang, T.; Ellis, G.S.; Ruppel, S.C.; Milliken, K.; Yang, R. Effect of organic-matter type and thermal maturity on methane adsorption in shale-gas systems. Org. Geochem. 2012, 47, 120–131. [Google Scholar] [CrossRef]
  34. Weniger, P.; Kalkreuth, W.; Busch, A.; Krooss, B.M. High-pressure methane and carbon dioxide sorption on coal and shale samples from the Paraná Basin, Brazil. Int. J. Coal Geol. 2010, 84, 190–205. [Google Scholar] [CrossRef]
  35. Dasani, D.; Wang, Y.; Tsotsis, T.T.; Jessen, K. Laboratory-Scale Investigation of Sorption Kinetics of Methane/Ethane Mixtures in Shale. Ind. Eng. Chem. Res. 2017, 56, 9953–9963. [Google Scholar] [CrossRef]
  36. Didier, M.; Leone, L.; Greneche, J.-M.; Giffaut, E.; Charlet, L. Adsorption of Hydrogen Gas and Redox Processes in Clays. Environ. Sci. Technol. 2012, 46, 3574–3579. [Google Scholar] [CrossRef]
  37. Volckaert, G.; Ortiz, L.; De Cannière, P.; Put, M.; Horseman, S.T.; Harrington, J.F.; Fioravante, V.; Impey, M. MEGAS Modelling and Experiments on Gas Migration in Repository Host Rocks; Publications Office of the EU: Luxembourg, 1994; Available online: http://bookshop.europa.eu/en/megas-pbCGNA16235/?CatalogCategoryID=DjYKABstgekAAAEjwpEY4e5L (accessed on 6 March 2023).
  38. Rebour, V.; Billiotte, J.; Deveughele, M.; Jambon, A.; Le Guen, C. Molecular diffusion in water-saturated rocks: A new experimental method. J. Contam. Hydrol. 1997, 28, 71–93. [Google Scholar] [CrossRef]
  39. Beaudoing, G. Sorption and desorption bench of water vapour and vapour transfer through unsaturated materials. In Proceedings of the 4th International Symposium on Moisture and Creep Effects on Paper, Board and Containers, Grenoble, France, 18–19 March 1999. [Google Scholar]
  40. Bardelli, F.; Mondelli, C.; Didier, M.; Vitillo, J.G.; Cavicchia, D.R.; Robinet, J.C.; Leone, L.; Charlet, L. Hydrogen uptake and diffusion in Callovo-Oxfordian clay rock for nuclear waste disposal technology. Appl. Geochem. 2014, 49, 168–177. [Google Scholar] [CrossRef]
  41. Grade, A.; Govaerts, J.; Volckaert, G.; Mazurek, M. Determination of Diffusion Coefficients of Dissolved Gases in Boom Clay and Opalinus Clay; Campus Groep T., KU Leuven: Leuven, Belgium, 2013. [Google Scholar]
  42. Mondelli, C.; Bardelli, F.; Vitillo, J.G.; Didier, M.; Brendle, J.; Cavicchia, D.R.; Robinet, J.C.; Charlet, L. Hydrogen adsorption and diffusion in synthetic Na-montmorillonites at high pressures and temperature. Int. J. Hydrogen Energy 2015, 40, 2698–2709. [Google Scholar] [CrossRef]
  43. Shackelford, C.D. Laboratory diffusion testing for waste disposal—A review. J. Contam. Hydrol. 1991, 7, 177–217. [Google Scholar] [CrossRef]
  44. Wicke, E.; Kallenbach, R. Die Oberflächendiffusion von Kohlendioxyd in aktiven Kohlen. Kolloid Z. 1941, 97, 135–151. [Google Scholar] [CrossRef]
  45. Surface Measurement Systems. DVS Vacuum, Technical Sheet. 2022. Available online: https://www.surfacemeasurementsystems.com/products/dynamic-vapor-sorption-instruments/competitive-sorption-analyzer/dvs-vacuum/ (accessed on 6 March 2023).
  46. Karimi, M. Diffusion in Polymer Solids and Solutions. In Mass Transfer in Chemical Engineering Processes; Marko, J., Ed.; InTech: London, UK, 2011. [Google Scholar] [CrossRef]
  47. Crank, J. The Mathematics of Diffusion, 2nd ed.; Oxford University Press: Oxford, UK, 2011. [Google Scholar]
  48. DVS Advanced Analysis Suite v7.0—User Manual; Surface Measurement Systems: Allentown, PA, USA, 2012.
  49. Stannett, V. The transport of gases in synthetic polymeric membranes—An historic perspective. J. Membr. Sci. 1978, 3, 97–115. [Google Scholar] [CrossRef]
  50. Rietveld, H.M. A profile refinement method for nuclear and magnetic structures. J. Appl. Crystallogr. 1969, 2, 65–71. [Google Scholar] [CrossRef]
  51. Gajda, D.; Lutyński, M. Hydrogen Permeability of Epoxy Composites as Liners in Lined Rock Caverns—Experimental Study. Appl. Sci. 2021, 11, 3885. [Google Scholar] [CrossRef]
  52. Derkowski, A.; Ziemianski, P. Similarity and dissimilarity of factors controlling methane and hydrogen gas adsorption in geologic formations. In Proceedings of the 2022 Goldschmidt Conference, Honolulu, HI, USA, 10–15 July 2022. [Google Scholar] [CrossRef]
  53. Truche, L.; Joubert, G.; Dargent, M.; Martz, P.; Cathelineau, M.; Rigaudier, T.; Quirt, D. Clay minerals trap hydrogen in the Earth’s crust: Evidence from the Cigar Lake uranium deposit, Athabasca. Earth Planet. Sci. Lett. 2018, 493, 186–197. [Google Scholar] [CrossRef]
  54. Wang, L.; Cheng, J.; Jin, Z.; Sun, Q.; Zou, R.; Meng, Q.; Liu, K.; Su, Y.; Zhang, Q. High-pressure hydrogen adsorption in clay minerals: Insights on natural hydrogen exploration. Fuel 2023, 344, 127919. [Google Scholar] [CrossRef]
  55. Li, W.; Pang, X.; Snape, C.; Zhang, B.; Zheng, D.; Zhang, X. Molecular Simulation Study on Methane Adsorption Capacity and Mechanism in Clay Minerals: Effect of Clay Type, Pressure, and Water Saturation in Shales. Energy Fuels 2019, 33, 765–778. [Google Scholar] [CrossRef]
  56. Kuila, U.; Prasad, M. Surface Area and Pore-Size Distribution in Clays and Shales. In All Days; SPE: Denver, CO, USA, 2011; p. SPE-146869-MS. [Google Scholar] [CrossRef]
  57. Ismail, A.F.; Khulbe, K.C.; Matsuura, T. Gas Separation Membranes: Polymeric and Inorganic; Springer International Publishing: Cham, Switzerland, 2015. [Google Scholar] [CrossRef]
  58. Ziemiański, P.P.; Derkowski, A. Structural and textural control of high-pressure hydrogen adsorption on expandable and non-expandable clay minerals in geologic conditions. Int. J. Hydrogen Energy 2022, 47, 28794–28805. [Google Scholar] [CrossRef]
  59. Jacops, E.; Volckaert, G.; Maes, N.; Weetjens, E.; Govaerts, J. Determination of gas diffusion coefficients in saturated porous media: He and CH4 diffusion in Boom Clay. Appl. Clay Sci. 2013, 83–84, 217–223. [Google Scholar] [CrossRef]
  60. Ho, T.A.; Dang, S.T.; Dasgupta, N.; Choudhary, A.; Rai, C.S.; Wang, Y. Nuclear magnetic resonance and molecular simulation study of H2 and CH4 adsorption onto shale and sandstone for hydrogen geological storage. Int. J. Hydrogen Energy 2024, 51, 158–166. [Google Scholar] [CrossRef]
  61. Reitenbach, V.; Ganzer, L.; Albrecht, D.; Hagemann, B. Influence of added hydrogen on underground gas storage: A review of key issues. Environ. Earth Sci. 2015, 73, 6927–6937. [Google Scholar] [CrossRef]
Figure 1. Microbalance DVS Vacuum: (a) external view and (b) internal components (after [45]).
Energies 17 00394 g001
Figure 2. The dynamic adsorption measurement: (a) sample chamber evacuation, (b) filling with sorbate, (c) steady state (amount of sorbate molecules entering and leaving the chamber is controlled simultaneously) (after [45]).
Energies 17 00394 g002
Figure 3. Qualitative plot of partial pressure steps and corresponding changes in mass.
Energies 17 00394 g003
Figure 4. Concentration profile across the sample. Modified after [46].
Energies 17 00394 g004
Figure 5. Schematic of the straight line fitting of the diffusion curve to determine the slope (after [41]).
Energies 17 00394 g005
Figure 6. Measured mass variation in time during (a) H2 blank run and (b) CH4 blank run. In both cases, a significant overshooting effect is observed.
Energies 17 00394 g006
Figure 7. Measured mass variations in time and correction for (a) overshooting and (b) buoyancy (test FR4_CH4_a).
Energies 17 00394 g007
Figure 8. Flake sample 4.
Energies 17 00394 g008
Figure 9. Comparison of diffusion coefficient values computed for hydrogen from dry and wet samples of Caprock1 (a) and Caprock2 (b).
Energies 17 00394 g009
Figure 10. Comparison of diffusion coefficients computed for hydrogen and methane from wet samples of Caprock1 (a) and Caprock2 (b).
Energies 17 00394 g010
Figure 11. Comparison of permeability values computed for hydrogen and methane for Caprock1 (a) and Caprock2 (b).
Energies 17 00394 g011
Figure 12. Comparison of measured gas uptakes (i.e., mass of adsorbed gas/sample mass) for hydrogen and methane.
Energies 17 00394 g012
Figure 13. Mass uptake comparison between first test (Test a) and second test (Test b) for (a) hydrogen (Flake 5 of Caprock1) and (b) methane (flake 10 of Caprock1).
Energies 17 00394 g013
Figure 14. Uncertainty analysis exploring the reproducibility of the experiment: relative discrepancy on diffusion coefficient between Test a and Test b (Caprock1 and Caprock2) (a) for all partial pressure steps and (b) for each partial pressure step.
Energies 17 00394 g014
Table 1. Solubility and diffusivity in pure water [16,17].
GasSolubility in Water (g/kg)Diffusivity in Water
(×10−9 m2/s)
Diffusivity in Air
(×10−6 m2/s)
@ 20 °C,
1 atm
@ 60 °C,
1 atm
@ 20 °C,
1 atm
@ 60 °C,
1 atm
@ 20 °C,
1 atm
@ 100 °C,
1 atm
CH40.0230.0071.626.70.210.321
H20.00160.00124.5813.10.7561.1536
Table 3. Main minerals classes’ weight percentages obtained with the Rietveld refinement.
MineralComposition (wt %)Formula
Caprock1Caprock2
Tectosilicatesquartz24 ÷ 25.416.7 ÷ 20.3SiO2
plagioclase (albite,
anorthite)
7.2 ÷ 9.14.0 ÷ 7.1(Na,Ca)(Si,Al)4O8
K-feldspar9.3 ÷ 9.75.5 ÷ 8.6KAlSi3O8
Carbonatescalcite32.5 ÷ 33.824.9 ÷ 35.9CaCO3
dolomite7.4 ÷ 8.116.2 ÷ 20.5CaMg(CO3)2
siderite00.4 ÷ 0.6FeCO3
Phyllosilicatesillite6.2 ÷ 10.96.1 ÷ 24.9(K,H3O)(Al,Mg,Fe)2(Si,Al)4O10[(OH)2,(H2O)]
chlorite3.5 ÷ 3.81.9 ÷ 2.5(Mg, Fe)3(Si, Al)4O10(OH)2•(Mg, Fe)3(OH)6
kaolinite2.6 ÷ 3.12.1 ÷ 3.7Al2Si2O5(OH)4
Additional mineralspyrite00.2 ÷ 0.4FeS2
halite1.1 ÷ 2.40.0 ÷ 0.2NaCl
Table 4. Flake samples.
Sample IDCore Sample IDWet/DryWidth (mm)Mass
(mg)
Density (kg/m3)Tested to Gas
Flake1_3Caprock1wet2141.81773H2
Flake1_4Caprock1dry2.66200.71676H2
Flake1_5Caprock1wet1.6157.32091H2
Flake1_6Caprock1dry2.1172.61612H2
Flake1_7Caprock1dry1.9187.71764H2
Flake1_10Caprock1wet2.36179.71523CH4
Flake2_1Caprock2 (bottom)wet1.551982276H2
Flake2_2Caprock2 (bottom)wet1.52151869H2
Flake2_3Caprock2 (top)dry1.5144.61928H2
Flake2_4Caprock2 (top)wet1.84160.62108H2
Flake2_5Caprock2 (top)wet1.83211.62290H2
Flake2_6Caprock2 (top)wet2.06203.21970CH4
Flake2_7Caprock2 (top)wet1.86193.52081CH4
Flake2_8Caprock2 (bottom)wet1.4195.91727CH4
Flake2_9Caprock2 (bottom)wet1.75235.971751CH4
Disclaimer/Publisher’s Note: The statements, opinions and data contained in all publications are solely those of the individual author(s) and contributor(s) and not of MDPI and/or the editor(s). MDPI and/or the editor(s) disclaim responsibility for any injury to people or property resulting from any ideas, methods, instructions or products referred to in the content.

