
A Review on the Effect of Electrical Steel Manufacturing Processes on the Performance of Electric Machines


School of Engineering, Newcastle University, Newcastle upon Tyne NE1 7RU, UK
*
Author to whom correspondence should be addressed.
Energies 2023, 16(24), 7954; https://doi.org/10.3390/en16247954
Submission received: 25 July 2023
/
Revised: 2 November 2023
/
Accepted: 1 December 2023
/
Published: 7 December 2023
(This article belongs to the Section F: Electrical Engineering)
Abstract
:The manufacturing processing of Electrical Steel Laminations (ESLs) for electric machines comprises cutting, stacking, and housing techniques which can result in plastic deformation and residual stress in the soft magnetic material. These manufacturing processes result in decreasing the magnetic quality and a local increase in both the static and dynamic hysteresis losses near the cut edges and consequently a reduction in the performance of the designed motor. The iron losses resulting from cutting can vary by a factor of two or more depending on geometrical, material, and processing parameters as well as the magnetic field strength. It is advantageous to consider these manufacturing effects in the design stage to reduce the probability of underperforming mass production. In this paper, the manufacturing processes of ESLs and their modelling methods are comprehensively surveyed. The gaps in scientific understanding and the research need for the expansion of accurate modelling of the cutting and joining of ESLs are subsequently discussed.
1. Introduction
Electrical machines are central to the generation, transmission, and consumption of electric power. Electro-magnetic design, thermal design, structural design, multi-physics design, material design, and manufacturing process design are a few general design methodologies that can be used in a variety of disciplines and domains [1,2,3,4,5,6]. The aim of this paper focuses on the impact of the manufacturing process on electric machine performance during operation. It is possible to fully utilize all the capabilities of the designed motors only if there is a solid understanding of the real magnetic characteristics of the steel laminations. Therefore, a good motor design engineer should consider machine optimization, manufacturing capabilities and the influence of manufacturing processes on output performance.
The manufacturing of ESLs into an electric machine consists of four main steps: cutting, joining, stress relief annealing, and shrink fitting. Each one of these steps affects the magnetic quality of the material and often locally increases both the static and dynamic hysteresis losses near the cut edges, resulting in a reduction in the performance compared to simulations [7,8,9,10,11]. It is beneficial to consider these manufacturing effects in the design stage to eliminate the probability of failure in mass production. A schematic of the manufacturing process from laminated steel to an assembled motor is illustrated in Figure 1 [12].
The effect of cutting processes on the iron losses of electrical machines can vary by a factor of two or higher. The exact ratio depends on the geometrical, material, processing parameters, and magnetic field strength. Many papers deal with lamination manufacturing processes and provide valuable tips and instructions to mitigate the impact of manufacturing in the model, design, and optimization stages of electric machine development [8,13,14,15,16]. However, currently, there is not a well-organized source for the proper presentation of different manufacturing process effects, modelling methods, and manufacturing process design tips to reduce the resultant magnetic degradation in the manufacturing process. There are several review papers on the manufacturing process of laminations which do not sufficiently cover all aspects. Also, new research outputs in this field were not covered. In [17], a review of different joining methods, modelling of the joining process, microstructure of the weld zone, mechanical strength and magnetic properties is carried out. The knowledge about the causes of material property deterioration and ways to describe this phenomenon are summarized in [18]. In [19], the reported deterioration depths due to different manufacturing process was summarized and the context of the respective measurement method was discussed.
This paper explains the loss mechanism in laminations and how it is measured. It then brings together selected results which can efficiently be used by engineers at the design stage to capture the effect of the manufacturing process on the performance of their designed motor.
Section 2 provides an overview of the core losses of electrical machines and the IEC standard test procedure to measure the core losses due to the manufacturing process. Section 3 presents the effect of different cutting techniques, the techniques for modelling the degradation effect and the implementation procedure in the FE software. Section 4 investigates different stacking and joining techniques, their effect on magnetic properties and modelling techniques. The effect of stress relief annealing on the improvement of the magnetic characteristics of the ESL is presented in Section 5 followed by the deterioration effect of final assembly and shrink fitting into motor housing. Finally, how these results should be used and suggestions for further research are given in Section 6.
2. Electrical Machines Core Losses
The manufacturing process of the stator and rotor core of electrical machines can significantly affect the core loss. The core loss of the ESLs is comprised of three parts: static hysteresis loss, dynamic eddy current loss, and excess loss. The mathematical description of the core loss in ESLs is as Equation (1). Where is fitting coefficient and usually its value is between 1.6 and 2.2 for ferromagnetic materials and alloys.
In the industry, to calculate the core loss of ESLs, three pieces of equipment can be used, based on the sample shape: Epstein (toroid) [20,21], single sheet tester [22], and ring specimens [23]. The Epstein frame is made up of four coils and a mutual inductance to correct the magnetic flux in the air. Each coil contains a primary and secondary winding, each with N1 = N2 = 700 windings. The Epstein frame measurements are carried out in accordance with IEC 60404-2 [20] for frequencies up to 400 Hz and IEC 60404-10 [21] for frequencies above 400 Hz [21]. The single sheet tester consists of two U-type cores and primary and secondary windings. The test specimen is made up of magnetic sheets that are placed inside the two windings. Yoke cross sections are much larger than test specimen cross sections. Insulated sheets of grain-oriented silicon steel or nickel iron alloy must be used for the yokes. They must also have a low reluctance and a specific total loss of no more than 1.0 W/kg at a magnetic flux density of 1.5 T and frequency of 50 Hz [22]. A typical primary coil consists of five coils, each of which can have 400 turns. The number of turns on the secondary winding will be determined by the measuring instruments’ characteristics. The measurements are performed on a closed magnetic circuit using a ring test specimen that has one or more windings. The ring must be constructed with dimensions that keep the ratio of the outer to inner diameter to 1.4 or, preferably, less than 1.25. The number of turns and windings depends on the measuring tools and technique being employed. Typically, a magnetising and a secondary winding are needed for precise total loss measurements.
To reduce the impact of the winding’s inclusion of air flux, the secondary winding in this situation must be wound as closely as possible to the test specimen. All windings must be distributed evenly along the entire length of the test specimen. The utilized electric circuit and a ring specimen sample are illustrated in Figure 2.
The fundamental method of measuring loss is the same across all three pieces of equipment. Applying an alternating current through primary winding generates a circular shifting magnetic field, H, through the laminations. H is calculated using Equation (2) [24]. The induced voltage produced by the alternating magnetic field B is measured using secondary winding.
where and are the primary winding turns and current, respectively, and L is the length of the equivalent magnetic circuit. The values of the L for Epstein, Single Sheet Tester (SST), and ring specimen are 0.94 m, 0.45 m, and , respectively. Where are the inner and outer diameters of the ring laminations. In the ring specimen, for larger ratios of , the mean length of the magnetic path in the cross-section should be determined by to correct for the nonuniformity field over the cross-sectional area [25]. Magnetic flux density through the laminations can be calculated using Equation (3).
where is the voltage between the secondary winding, is the number of turns of the secondary winding, and S is the section area of the secondary winding. The implied iron loss is calculated by Equation (4).
where is the density of the ESLs and T is the time period.
The single sheet tester and Epstein frame are useful equipment for measuring the magnetic characteristics because preparing the samples is simple and the measuring and sensing coils once made can be applied to numerous samples with little additional work. They can both be used to determine the effect of different cutting processes like laser cutting, punching, wire cutting, etc. on the performance of the ESLs. Unfortunately, this method shows negative effects in the frame’s corner zones, especially when characterizing at high-frequency values. Welding can have a major impact on the core loss of the motor which cannot be measured using Epstein and single sheet testers.
The ring specimen is the most time-consuming method due to the closed geometry [11]. The benefit of cylindrical ring cores is that they offer a continuous, air-gap-free circumferential magnetic path. Furthermore, a precise measurement of the magnetic field’s uniformly distributed path length can be made. The losses at weld joints significantly increase when measured compared to the Epstein frame [26]. The toroidal core measurement can also be used to test real stator lamination stacks [27]. Therefore, the ring specimen measurement is more accurate and applicable to the electrical machine’s lamination. For comparison of calculated core losses by different measuring equipment, in [28] the core losses and B-H curve of NO25 steel sheet are measured using Epstein Frame (EF), Single-Strip tester (SST), and Ring Core (RC) samples and the results are compared. All the samples were built from the same mother coil. The measured B-H curve of the material using different methods at 50 Hz and 200 Hz is illustrated in Figure 3. The results indicate that RC measures higher core losses compared to EF and SST. For example, the measured losses of the RC method at 1.4 T and 50 Hz were over 40% higher than EF. The exact values of the calculated core losses at a magnetic flux density of 1.4 T and different frequencies are presented in Table 1. The results indicate that the measured core losses of the EF and SST are close to each other at different frequencies, but the RC values are much higher.
3. Cutting Process
The cutting process of ESLs is a necessary manufacturing technique for the preparation of laminations. Available cutting techniques are laser cut, wire cut, photo-corrosion, water jet, punching and guillotine. The various manufacturing steps are evaluated in [29] which asserts that cutting is the most damaging of the manufacturing steps. In [8] the specific power loss caused by punching is shown to be greater than that caused by compression and welding. Therefore, it is necessary to select the appropriate cutting technique based on the application.
Punching is frequently described as the most common method in industry and mass production, due to its low cost and high speed. Despite the high initial investment, costs are low, and production is quick, making it suitable for high production volumes [19,30]. The main disadvantage of punching laminations is that as soon as the geometry of the manufactured machine changes, a new cutting tool must be fabricated. Therefore, this technique is more suitable for mass production rather than prototype and small series production. The bluntness of the cutting tool, which increases with the number of punched samples, and the burr evoked at the cut edge are two other disadvantages. These burrs result in a lower stacking factor. On the other hand, wire cut, laser cut, photo-corrosion, and waterjet methods are all suitable for prototype and low mass production, but due to the higher required time and cost, they are not preferable for mass production. For example, in the case of waterjet cutting, a speed of 800 mm/min for a material thickness of 0.5 mm is reported in [31]. The benefit of these techniques is the ability to quickly change or modify the cut geometry at a low cost. Therefore, they are generally just used for prototypes, research purposes, or small series production.
From the perspective of material deterioration due to cutting methods, there are numerous papers which investigate and compare the effect of these techniques. For the two most common cutting methods of punching and laser cutting, there is currently no agreement on whether laser or mechanical cutting is less damaging to magnetic properties. Plastic deformation and edge rounding at the cutting edge were observed in punched laminations, while thermal stresses occurred on the laser-cut edges. Both these two effects can result in magnetic deterioration of the material. The authors of [32,33,34,35] conclude that laser cutting has a greater negative effect on magnetic properties than mechanical cutting, whereas the authors of [36,37] state that laser cutting has a less negative effect on magnetic properties than mechanical cutting. The previous research studies indicate that the theoretical and experimental degrading effect of the cutting process on magnetic properties is still difficult to determine because it is dependent on many parameters, including the material investigated (chemical composition and grain size) and cutting technology settings (clearance, blade radii, tool wear, cutting speed, cutting mode, power), [38]. Also, the measurement technique, working frequency and magnetic field all have a significant impact on the calculated results. For example, in [39] at a frequency of 50 Hz and for magnetic flux density up to 1.3 T, laser cutting resulted in a 3.5% deterioration compared with mechanical shearing. On the other hand, for a working magnetic flux density of more than 1.3 T, the optimized laser cutting parameters can be directly utilized. The effect of magnetic flux density and working frequency on the judgment of mechanical cutting and laser cutting was comprehensively investigated in [40]. Figure 4 shows the point of intersection between the specific losses of guillotine-cut and laser-cut samples for different working frequencies and magnetic fields. According to Figure 4a, at a frequency of 50 Hz for working points up to 1.2 T, the loss measured in punched samples is higher than that in laser-cut samples. Above 1.2 T, however, laser cutting is shown to give higher specific losses. By increasing the frequency up to 250 Hz (Figure 4b), the intersection point is reduced from 1.2 T to 0.75 T. Therefore, to make an accurate comparison of laser cut and punching losses, it is essential to specify the working condition.
Previous studies indicate that compared to mechanical and/or laser cutting, electric discharge machining, waterjet cutting, and photo-corrosion are known to be less damaging to magnetic properties [31,32,41]. In [32], four different cutting techniques, including punching, guillotine, laser, and photo corrosion, were applied on a 2% Si non-oriented fully processed steel lamination with a resistivity of 38 cm and a thickness of 0.485 mm. Figure 5 depicts the edge profiles of the four samples. The results show that while photo-corrosion produces a less aggressive cut, allowing for the lowest loss and highest permeability, it also produces a harmful side effect that worsens as annealing is performed. Also, the laser-cut sample presents low remnants and a higher coercive force. The effect of abrasive water jet, wire electrical discharge machining, pulsed laser, and continuous wave laser techniques on the magnetic properties of the ESLs was investigated by Winter et al. [42]. They discovered that abrasive water jets produced the lowest applied field strength, the highest magnetization curves, and the lowest core losses, whereas the continuous wave produced the lowest saturation and highest core losses [42].
Previous studies reveal that the wire cut, or electric discharge machining (EDM) technique has the minimum impact on the magnetic properties of the material [41,43]. However, the slow cutting speed [44] and the possibility of a burned coating due to “high local temperatures” [45] are known disadvantages. The approach to modify the performance of the wire cut techniques of laminations is experimentally discussed in [46,47].
The effect of punching and laser cutting on the magnetic properties of ESLs is further investigated in [48], taking magnetic anisotropy into account. Samples cut in various directions were tested for this purpose. Because the direction of the field varies with time in different parts of the machine, work was completed on how to obtain average characteristics for different magnetization directions. The results show that the average characteristics obtained for samples cut at different angles in relation to the sheet’s rolling direction do not differ significantly from the average characteristics obtained for samples cut at 0 and 90 degrees.
Traditional magnetic tests give total component loss and cannot be used to deduce the distribution of iron losses and provide a detailed assessment. As a result, as shown in Figure 6, the effect of punching, wire erosion, and laser cut on ring specimen lamination was studied in [10] using a high-speed IR camera. The thermographic method, as shown in Figure 6b, shows that higher temperatures occur in the middle of the ring fabricated by punching. Although annealing can reduce the losses, the loss distribution remains identical. The losses with the wire cut are uniformly distributed on the inner side, where the wire cut was applied, as shown in Figure 6c. Instead, since the outer edge is more damaged due to punching, the magnetic flux does not cross in this area and the losses are therefore lower. For the laser-cut sample, the losses in the inside of the ring are higher than the edges. Because the ferromagnetic material is more damaged, and the magnetic flux intended to pass through the centre area of the ring. The results of thermographic methods reveal that the wire cut results in less damage than laser cutting and punching.
3.1. Modeling of the Degradation Effect by Cutting
In the design and finite element simulation of electrical machines, it is necessary to carefully consider the effect of the cutting process on the permeability and characteristics of the laminations. This is especially important for small electric machines because the impacted zone has a wider relative width. For example, in [9], it is shown that punching results in a decrease of 0.5–2% in the average torque and an increase of 30–40% in the core losses. To consider the effect of the cutting process on the performance of the motor, the first step is to extract the relation between cutting depth, grain size, chemical composition, frequency, magnetic field strength, etc. on the B-H curve and iron loss. In the literature based on experimental measurements and curve fitting, the B-H curve and iron loss model of ESLs are modified using position-dependent linear, exponential, or polynomial terms to consider the effect of the cutting process. The mathematical description of the modified models is presented in Table 2. A more detailed description of these formulas can be found in [18] and Chapter 7 of [40].
3.2. Implement the Developed B-H Curves into FEM
Three strategies were mainly considered by researchers for modelling the manufacturing impact. In the first approach, as shown in Figure 7, a region adjacent to the cutting edge is represented as a single homogeneous zone and its permeability will differ from the rest of the lamination [62,63,64]. This approach, however, does not reflect the actual physical behaviour of degradation because it assumes a sudden change in the material properties at the boundary between the degraded and the undegraded region of the lamination. Material properties are well known to deteriorate gradually from the rapture edge inward [65]. However, this approach does have the distinct advantages of simplicity, ease of implementation within a FE model, and fast computation time.
According to Figure 8, in the second approach, the geometry of the machine can be divided into a finite number of domains with a defined averaged distance to the cut edge using a layer-based approach, and the respective zones can be assigned various material properties based on the evaluated degradation. The number of regions should be increased to improve the model’s accuracy. This method can be laborious, especially in areas with complicated geometry. The implementation process of this approach is described in [7,15,65,66,67,68,69,70,71,72,73,74,75].
As shown in Figure 9, the third approach involves assigning material properties at the mesh level of finite element software to have more continuous modelling. To determine the appropriate material properties, the centroid’s distance of each finite element from the cut edge is calculated and then based on the calculated distance and evaluated degradation, the material properties are changed. The implementation process of this approach is described in [16,57,60,76,77,78,79,80,81].
The methods have their own merits and drawbacks. To use the multi-layer method, the examined sheet must be cut using the same technique as the iron core cuts. Also, the necessary magnetic curves and loss characteristics must be obtained on steel strips or ring specimens that are the same width as the geometric components of the electrical machine. As a result, to cover the machine’s main geometric dimensions, the method needs the parameters for several widths. The method is simple to use and only requires directly provided integral measurements from SST or ring measurements. The dependence of the parameters on steel width and cutting technique used, which necessitates the use of a suitable database as well as the low spatial resolution of the calculated field quantities, are disadvantages of this approach.
The effect of a changed field distribution on the overall performance of electrical machines with an air gap is usually minimal and can be adequately addressed by increasing the number of layers. The rapid change in material properties necessitates a finer mesh for the element-based method, which increases modelling effort and computation time. However, because Epstein frame or SST measurements only provide average values across the entire width of the sheet, determining the local B-H curves and power loss characteristics is challenging. Furthermore, to remove the effects of closed eddy current loops, using a time-consuming process, the local needle measurements must be numerically corrected. The details of this method are presented in [74,82].
4. Stacking Process
To reduce eddy current losses, the stator and rotor cores of electrical machines are made of thin laminations bonded together to form a strong stacked core. Techniques to hold the lamination stacks together during punching (interlocking, full-face bonding, or spot bonding) are distinguished from those used afterwards (welding, clamping, and conventional bonding). Economic aspects, physical features of the electric machine, and application are the main aspects of selecting the proper joining technique. Typical requirements are high mechanical stability, low magnetic properties degradation, low production cost, high stacking factor, and high production speed.
4.1. Back-Lack
The Back-lack self-bonding or bonding varnish is a recently introduced technology. The manufacturing process of back-lack is illustrated in Figure 10. As this technology is newly introduced, a proper comparison of these techniques with other joining technologies has not been performed, especially for high-volume production costs. The advantages of Back-lack are:
- Allowing complete design freedom because manufacturing aspects such as interlocking or welding seam positions are not required.
- Because the laminations have no way of expanding, full-face adhesive bonding allows for the tightest tolerances and excellent shape stability.
- Bonding has no effect on the magnetic flux lines of the ESLs as shown in Figure 10c.
- Lamination stacks with the tightest manufacturing tolerances improve heat dissipation by improving heat transfer between the laminations and the housing.
- Back lack effectively dampens vibrations in laminations [83].
Three parameters define the bonding varnish process: bonding time, surface pressure, and bonding temperature. The impact of various process parameters is characterized in [84], and the losses are calculated for various sample diameters and frequencies.

4.2. Interlocking Process
In [86], the effect of interlocking on magnetic properties of ESLs was investigated using ring specimens. It found that with an increasing number of interlocks, the inverse of permeability and iron loss both increase linearly. Also, the effect of interlocks along the radial direction is more significant than those along the circumferential direction. Stack length was found to have no effect on the magnetic properties. This means that the interlaminar eddy-current loss is negligible, and the increased iron loss by interlocks is caused by hysteresis and microscopic eddy-current losses, which are sensitive to internal stress and magnetic domain structure. In [87], as shown in Figure 11, a 3D electromagnetic model of the V-shape interlocking dowel is investigated to specify the produced eddy current paths due to interlocking. The results show that additional eddy currents mostly flow through the top and bottom laminations and the dowels. Therefore, it is possible to use the simplified model as Figure 11c. Figure 11c looks like a squirrel cage; therefore, it is possible to use a simplified 2-D FEM model instead of a 3-D FEM model to investigate the interlocking effect. Also, it showed that the asymmetric influence of the interlocking dowels causes more losses when the number of dowels is not a multiple of the number of phases. In [88], the effect of the dowel’s size and orientation on the efficiency of an induction machine is investigated. The results indicate that the tangential direction of the interlocking dowel has a lower negative impact on efficiency. Also, the lower the dowel’s width, the lower the losses. Therefore, the length of each interlocking dowel should be chosen to be as small as possible.
In addition to interlocking, it is conventional to clamp ESL axially causing the stack to act as a solid mechanical body. To achieve the axial clamping force, two basic methods are used. “Through bolts” are passed through holes punched in the core yoke in one. The location of bolts should be in areas with a lower flux path, such as the region illustrated in Figure 12a [89]. In the second method, shown in Figure 12b, the force is applied using the axial key bars behind the core to which the punching is attached. Using plates or ring flanges, pressure is applied to the surface of the end punching [90]. To extend the clamping pressure to the ends of the teeth, “fingers” (or “outside space blocks”) are used. Friction between punching causes peripheral bending stresses to be transmitted. Bonding of punching may be used in some places to help ensure the mechanical integrity of the core.
In [11,92], a 3-D FEM model is developed to accurately investigate the effect of interlocking on magnetic properties of ESLs. The modified model can consider the material degradation around the dowels through layered regions assigned with different magnetic material characteristics. The conductive paths of the eddy currents are considered and the eddy current and hysteresis losses in the degraded areas of the magnetic material can be calculated in the FEM model.
4.3. Welding Process
Laser welding is appealing for high-performance applications because it is suitable for an integrated manufacturing process and welding of high-alloy ESLs. Therefore, much research on the improvement and investigation of lamination welding has been carried out [24,33,52,58,93,94,95,96,97,98,99,100,101,102,103,104,105].
Mechanical strength and electro-magnetic properties must be considered during joining ESLs. Also, the weld or heat-affected zone should be kept to a minimum. The welding connection must be able to withstand different loads during production and operation. To achieve the required stacking factor, the stack must be pressed in the axial direction prior to welding. After the pressing force is removed, the seam experiences tensile stress. If the lamination stacks are handled in an axial direction during production, the tensile stresses on the seam increase. The stator’s core is subjected to radial stress after it is mounted in the housing. Shear stresses on the seam are caused by geometric deviations in the stack due to friction with the housing wall. Also, during operation, induced electromagnetic force and vibrations exert pressure on the weld seam which will have an impact on the long-term strength and result in torsional loads. Figure 13 depicts an overview of the mentioned loads [103]. Therefore, a compromise between electromagnetic performance and mechanical strength is required.
Figure 14 shows the six main parameters which influence the effectiveness of a weld, namely the environment, laser system, user, process, design, and material. In this section a comprehensive review on published papers regarding the effect of welding process on ESLs is carried out.
Very thin sheets can be welded automatically at high velocities using laser welding [103]. The thermal heat input in the welding zone and adjacent areas destroys the isolation coating on both sides of the ESLs [24]. The resultant weld seams are electrically conductive connections, which leads to an increase in eddy current losses. Additionally, the heat-affected zone’s microstructure is compromised, which raises the demand for magnetization and increases hysteresis losses. In [106], the effect of welding process on eddy current losses of the electrical sheets was investigated. The results show that the thinner sheet is much more sensitive to the welding process and has significantly higher eddy current losses. For example, at the frequency of 400 Hz, for ESLs with thickness of 0.2, 0.27, and 0.5 mm, the increase in loss was 169.6%, 88.5%, and 18.9%, respectively.
Thin ESLs are used for high performance electrical machines. Therefore, to avoid the significant difference between designed and manufactured motors, it is necessary to accurately evaluate different welding types to obtain the minimum degradation in performance.
The welding schematic of ESLs is shown in Figure 15. The joint is ultimately formed at the interface of the laminations by using a moving heat source, such as a TIG or laser, to fuse the weld seam.
4.3.1. Different Types of Welding
Laser [100], electron beams [107], plasma arcs [108], and electric arcs including Tungsten Inert Gas (TIG), Gas Tungsten Arc (GTA), Cold Metal Transfer (CMT) [99,109] are the most common heat sources employed in the fusion welding of ESLs. Several researchers have compared current fusion welding techniques to determine the best welding solution [98,99,104,109]. In [109], the effect of CMT and GTA process on the hardness variation, weld seam characterization and microstructural investigations of the welded samples of CRNGO ESLs was performed. The results indicate that CMT with pulse and low spatter control modes has fewer negative effects on grain boundaries, grain sizes, and sample hardness. As a result, for joining CRNGO ESLs, the CMT process may be preferred. Regarding the comparison of TIG and CMT welding, the same results were reported in [110]. An increase in core loss of 45.54% was found for GTAW 90 A and 38.38% for CMT 90 A welded samples compared to the non-welded sample at a flux density of 1.0 T. In [111], the performance of TIG, Plasma and Electron Beam (EB) were compared to determine the residual stress distribution in welded non-oriented electrical steel. The welding regions can be classified by the Base Material (BM), which was unaffected by the welding process, the Fusion Zone (FZ), where the fusion process occurs, and the Heat Affected Zone (HAZ), which is a transitional region between the BM and the FZ. Figure 16 depicts the size and scope of the welding zones in TIG, plasma, and EBW welding specimens. The results indicate that the EB has the narrowest FZ region followed by Plasma and TIG.
In [99], the effect of laser and TIG welding on electrical laminations are compared in terms of microstructure, mechanical performance, residual stress, and magnetic properties. As shown in Figure 17a, the laser welded laminations had a higher lap shear strength compared to TIG welded laminations. According to Figure 17b, the TIG welding results in more severe magnetic property degradation compared to laser welding. This higher degradation can be related to the higher average amplitude of residual stress than the laser welded joint. Also, according to Figure 17c, the eddy currents of TIG welding are higher due to wider weld seams.
TIG welding is a popular welding technique used to create ESL stacks. However, it has two significant restrictions: limited welding speed (<1 m/min) and the specified minimum thickness of weldable ESLs (0.35 mm). A laser welding process can get around these limitations [94]. In comparison to traditional arc welding processes, laser welding has many advantages in large-scale production. For instance, welding is typically possible on thin sheets (0.20 to 0.35 mm) with coating thicknesses greater than 1.5 micro m. On a larger scale, a different seam cross-section is appropriate, and the shear strength of the seam is greater. Despite the advantages over arc welding, adjusting the parameters in the event of a product or material change is time-consuming [94]. Also, laser heat input was much more concentrated and controllable than TIG heat input, and laser should be a better heat source for high quality welding of ESLs [99].
In [105], using experimental results the effect of blue laser welding, infrared laser welding, TIG welding, and no welding laminations on the relative permeabilities are investigated, and the results are shown in Figure 18. The relative permeability of the laminations created by blue laser welding is shown to be marginally higher than that of the laminations created by infrared laser welding. The stable welding process may be the cause of the improved magnetic performance for blue welded laminations.
To conclude, compared to other fusion welding techniques, laser welding delivered welded ESLs with better magnetic characteristics, smaller heat-affected zone, and less residual stress [96]. Therefore, this method is preferable for high-performance applications.
4.3.2. Laser Welding Types
Regarding laser welding, continuous, pulsed, and non-linear spot welding are all investigated in the literature. Continuous welding can either be linear or oscillating. Pulsed laser welding of ultra-thin ESLs is used to reduce iron loss while maintaining sufficient strength [97]. The concept of continuous welding and pulsed welding is illustrated in Figure 19. In [98], adaptive continuous and pulsed-laser welding was introduced to improve the magnetic properties of welded laminations. The benefits of continuous welding are reliable welds, fast welding, no need for extra sensors, and less maintenance of the laser source. On the other hand, because the laser power is always greater than the material melting point, it causes significant magnetic losses, resulting in strong and large welds.
The volume of molten material can be reduced using adaptive continuous welding, as depicted in Figure 19b. The power of the adaptive continuous laser is modulated to achieve maximum power at the gaps between the laminations while maintaining minimum power on the lamination surfaces, where welds are unnecessary. It results in less laser energy. However, maintaining the maximum power at the same level of continuous welding leads to unreliable welds with frequent cracks and blowholes. Increasing the total energy per weld, on the other hand, produces appropriate welds in terms of mechanical properties but has a significant impact on magnetic properties. The pulsed-laser winding, as depicted in Figure 19c, starts at the beginning of the stack, and finishes at the end of the stack, with a large overlapping of the pulses. This method typically takes longer than continuous welding because we need a specific pulse frequency to achieve the necessary level of overlapping (usually around 70%) at the desired speed. smaller but deeper welds and lower energy consumption are the benefits of pulsed welding compared to continuous welding.
In [98], the classic pulsed welding is adapted to improve the magnetic properties and consumed energy of the stacking process. The comparison of classic and adaptive pulsed welding is illustrated in Figure 20. In the classic pulsed welding, a large overlap of the laser pulses is seen. In the adapted pulse welding, only the gaps between laminations are welded, requiring a lower total pulse energy. Compared to the traditional, pulsed-welding method, the adapted method uses 23% of the energy. It should be noted that due to uncertainty in the thickness of ESLs, a sensor for monitoring the gaps is necessary. Because their thickness can vary by up to 8% [112]. Also, in [97], it is illustrated that for non-oriented ESLs B27AHV1500, the iron loss of welded laminations adopting pulsed laser welding has a 5.4–7.5% decrease compared with that of continuous laser welding.
In [104], as shown in Figure 21, a novel laser welding technique for ESLs is presented. The authors used distributed welding spots instead of conventional perpendicular lines in the axial direction of the core. To establish a correlation and identify any underlying physical influences, the magnetic properties were examined at various frequencies and polarization levels. The results indicate that at low frequency linear welding has better performance and lower magnetic loss compared to other methods. The reason is related to the mechanical residual stress state of the ring cores because of the thermal impact of welding. Additionally, in the case of welding lines, the volume of affected microstructure is smaller. By increasing the working frequency, the eddy current component becomes dominant, and the spot welding shows its better performance.
In [113], spot welding is used instead of linear welding and results in a 5% reduction in iron loss. Also, spot welding shows a significant improvement in magnetization. Eddy current loss component becomes more pronounced at higher frequencies due to an increase in the effect of magnetic short circuit of the electrical sheets. It causes the results of the welded samples to significantly deviate from the reference sample. It should be noted that the production time was about three times higher than for the line welds due to the high number of spot welds required.
Another important parameter in laser welding is the laser path. The weld seam design is influenced by the choice of the laser path. The laser path can be linear, circular, elliptical, or double circle oscillations. By varying the amplitude, frequency and shape of this oscillation, the weld result changes [101,103]. From the perspective of mechanical strength, it was found that, at the same laser power, an oscillating weld has a better characteristic compared to linear one [102]. In [93], the electromagnetic performance of linearly and oscillated welding process are compared. As shown in Figure 22, oscillating welding results in a significantly larger weld area with a similar depth. But the electromagnetic loss results indicate that at conditions of 50 Hz and 1.5 T, both methods have approximately the same iron. Therefore, wider seams do not significantly increase electromagnetic losses. As a result, the wobble strategy can produce greater mechanical strength while maintaining the same level of losses [93].
A circular type of weld combines longitudinal and transverse oscillation and is called ‘wobbling’. In [93], five test sets with the parameter settings defined in Table 3 were manufactured and the effect of laser power, wobble width and laser velocity on core losses of the ring specimens were evaluated. The results of core losses at 50 and 400 Hz are illustrated in Figure 23. The dominant losses at these frequencies are hysteresis and eddy current losses, respectively. The results at 50 Hz indicate that:
- The linear welded samples have the lowest total losses of 4.26 W/kg.
- The laser power parameters gave the most significant impact on the total losses.
- The losses are decreased by increasing the width of the wobble area because the microstructure is less damaged, and the energy input is more evenly distributed. Consequently, Hysteresis losses decrease.
The highest eddy current losses at 400 Hz are produced by high laser powers in parameter set No. 3, which are 81.06 W/kg. When compared to the hysteresis losses, the eddy current losses in parameter sets 4 and 5 are even smaller than in parameter set 1, demonstrating that deep seams influence eddy current paths more than wide seams.
In [102], the effect of the number of welding seams, laser power, laser velocity and contact torque on mechanical characteristics and shear force of the welding seams were investigated by an experimental test on five samples as Table 4. To carry out the experimental test, according to Figure 24, one half of the test piece is clamped while the other half is subjected to a compressive force. The maximum shear forces up to fracture are measured in this test. To weld the first sample, a linear beam movement is used. In this instance, even though the mechanical strength is significantly lower (roughly 1.6 kN), thinner seams are still achieved which results in lower electromagnetic losses. Using the oscillating wobble movement results in significantly higher strengths at the same laser powers. Samples 2, 3 and 5 reveal that a better shear strength can be achieved by the higher contact pressure, higher number of weld seams, and higher laser power.
To conclude, by adjustment of the welding parameters including the number of weld seams, laser power, seam width, laser velocity and contact torque the mechanical and electromagnetic performance of the test specimen can significantly improve. Therefore, according to the application a suitable welding parameter should be selected.
4.3.3. Analytical Analysis
To evaluate the effect of welding on lamination performance, FEM and experimental test setups are widely used. Although these methods have a high accuracy, their drawbacks including investigation cost and required time encourage researchers to develop a fast and accurate parameterized approach for simulating the welding effect. In [106], an analytical equation for calculating eddy current loss is developed to consider the effect of welding beam. The derived equation can quantitatively investigate the effects of weld bead size, sheet thickness, operating frequency, and magnetic flux density on the eddy current losses. To evaluate the effectiveness of the derived analytical, an FE model is utilized to calculate the distribution of eddy current losses and extra eddy current losses produced by the welding beam, respectively. The results obtained indicate that the FE and analytical results are in good agreement.
In [114], a stress-dependent magnetic equivalent circuit is presented and used to calculate iron losses in welded stacks of ESLs. In the proposed model, the stator yoke is represented simply as a ring core with a rectangular welded region and a magnetically degraded region as shown in Figure 25a. The magnetic equivalent circuit model of the welded section is illustrated in Figure 25b. In the welding seam, all the laminations are assumed to be electrically connected to each other, and a local eddy current will be produced. Also, there is a region between the welding seam and the unaffected area where the insulation coating is intact, but the welding process results in residual stress. Therefore, in the proposed model these regions are also considered. To calculate the effect of residual stress, two coefficients and are utilized in the reluctance formula as Equation (5). Where and are the length and magnetic cross-section of each reluctance, is the correction factor of the relative permeability due to stress and is equivalent stress. The procedure to accurately calculate the and is discussed in detail in [114]. The performance comparison of the MEC model with experimental results is shown in Figure 25c.
4.4. Performance Comparison of Different Joining Techniques
Published research on the performance comparison of different joining techniques focuses on comparison of specific parameters and there is no comprehensive investigation on the mechanical stability comparison, magnetic degradation, production cost, available stacking factor, and production speed. For example, in [10] two laminated cores are prepared: one with interlocks and the other with both interlocks and welding. The IR thermographic method reveals a significant increase in iron losses due to the welding process. The interlocks add to the iron losses in their vicinity. Such localized iron losses are comparable to losses from the remaining iron volume. Different stacking and joining processes, as well as relevant process parameters for product, process, and energy demand, are compared in [84]. The authors conclude that the interlocking process is very efficient but is not strong and can only absorb low mechanical forces. The mechanical strength of the laser welding samples is high, but also the electromagnetic losses are very high. Mechanical tests show that bonding varnish and joining via adhesives produce very promising results with extremely low electromagnetic losses. However, the energy requirement and process time are extremely high. In [115], three different stator cores are manufactured using different manufacturing techniques including 1. M250-35A punched with interlocking 2. laser-cut with bonding 3. laser-cut with bonding. The material of M250-35A is used for two samples and NO10 for a third sample. Iron losses, hysteresis torque, and cogging torque of them were determined and compared. The experimental test setup is illustrated in Figure 26. The results show that the three investigated stacks have significantly different magnetic performances. Whereas the core with the manufacturing process of punching and interlocking delivers lower peak-to-peak cogging torque (8.6%), it has significantly higher average core losses (37.5%) compared to its laser-cut and bonded counterpart (M250-35A). But, as expected, the eddy current losses remained constant. The hysteresis losses increase by 19.3% when the stator is made of NO10 material rather than M250-35A (both are laser cut), while the total iron losses remain lower.
5. Stress Relief Annealing
The annealing process is one of the effective solutions to remove or reduce the residual stresses and local plastic strains after stacking and interconnecting [41,54,116,117]. This process results in an improvement of magnetic properties, such as a decrease in iron loss and an increase in permeability and remanent magnetic flux density [10,116,117,118,119]. Annealing ESLs is intended to remove carbon (decarburize) from the bulk of the steel while simultaneously promoting grain growth and stress relief. The effect of annealing on the grain size of the ESL is presented in [117]. Before annealing near to the cutting edge, the material is distorted. The annealing can recover the distorted area and increase the grain sizes. The grain size of the sample 50CS1300 steel grows from 12.2 ± 4.4 µm 45.7 ± 24.2 µm (edge) and 20.1 ± 6.0 µm (center). The damaged zone after punching appears to be larger in ESLs with a larger grain size than in ESLs with a smaller grain size. Because the larger the grain size, the more easily dislocations form and move [120].
Annealing performance for ESLs is thus measured in terms of electrical loss reduction. For example, in [10], annealing is shown to improve energetic performance by 28% for punched samples, 25% for laser-cut samples and 14% for wire-eroded samples.
In ESLs, plastic and elastic stress increases core loss. Furthermore, because core loss is highly dependent on residual carbon, any additional carbon reduction, even in the parts per million (ppm) range, reduces core loss. As a result, annealing can significantly improve electrical performance by lowering core loss and exciting current by a steel grade level or more. [116]. However, because stress relief annealing adds a step to the manufacturing process, its beneficial effects clearly come at an additional cost and time.
In the previous section, the annealing process is shown to improve the magnetic properties of ESLs and can be applied after cutting or joining. To specify which one results in better performance improvement, in [121], laminated cores were fabricated in three ways:
- Punched then welded only.
- Punched, annealed for stress relief, and then welded.
- Punched, welded, and then annealed for stress relief.
The results indicate that the annealing after welding and stacking results in lower core loss and better magnetic performance.
6. Shrink Fitting/Housing
The final manufacturing step for the stator is often inserting the stator into the motor frame via either heat shrinking or press fitting. For the rotor, an interference fit is typically used to join the shaft and to the lamination stack. The effect of the pressing process on the core loss of the motor depends on the geometrical dimensions of the motor. Ref. [91] shows that for core motors with small geometrical dimensions, the pressing process of the core into the housing takes precedence. This process creates several short circuits between the core’s laminations. It also shows that the larger the geometrical dimensions, the smaller the lamination isolation damages are, because a smaller force per unit area is required to press the core into the housing.
In shrink fitting, the inner steel cylinder is subjected to a thermal contraction at temperatures around −5 °C while the outer cylinder is placed in a Carbonite oven and subjected to a thermal expansion at 300 °C [122]. Due to thermal contraction and expansion, the inner cylinder diameter will be slightly smaller than the outer cylinder diameter. As a result, large compressive stresses are introduced in radial and tangential directions along the core’s circumference. The resulting tensile and compressive mechanical tensions in the rotor and stator lamination can be increased to the material’s elastic limit. These mechanical tensions increase iron loss and decrease material permeability and remanent magnetic flux density [57,123,124,125,126]. This phenomenon is called the inverse magneto strictive effect, magnetoelastic effect, or Villari effect. An example experimental test setup to measure the effect of shrink fitting on magnetic properties of the laminations is illustrated in Figure 27. In the test setup a narrow gap is considered as shown in Figure 27a. By adjusting the gap width, different interference fits were investigated. The obtained results indicate that shrink fitting should be avoided in the amorphous stator core casing process because iron loss is increased significantly.
To model the shrinking effect on core loss, in [126] a coupled mechanical–electromagnetic finite element analysis was carried out. The effect of mechanical stress is represented by magnetic permeability in each element [127]. Both experimental and calculation results indicate that by increasing the width of the shrinking fit, the iron loss becomes larger. The same results were also obtained in [125].
7. Suggestion
Most experimental studies on the ESL manufacturing process are focused on single lamination and toroidal core and the effect of these manufacturing processes on the actual performance of the electric machines is not well studied. Therefore, experimental studies about accurate core loss measurements of the actual electric machines’ topologies should be investigated more.
To model the effect of cutting techniques in the FE software, different experimental equations were extracted in previous studies; however, the proposed models are completely dependent on the thickness of lamination, geometrical, material, and processing parameters as well as the magnetic field strength. Therefore, for new materials with different thicknesses, these equations are not adequate. Therefore, this area still needs more attention.
Currently, the concept of robust design to reduce the obsolescence ratio of electrical machines in mass production is well established [89,128]. However, this method only considers the manufacturing tolerances and material diversities and does not consider the effect of the manufacturing process which can result in a significant performance reduction, especially for small electric machines. Therefore, this area still requires more attention and can be further developed.
One of the problems that can happen during the cutting process of the ESL is the surface roughness of the lamination edges which can affect the welding process and the depth of the heat affected zone. Surface roughness is measured by the deviations of a surface from its ideal form in the normal direction. According to DIN 4760, macroscopic surface roughness can be divided into 3rd and 4th-order roughness [129]. Different cutting techniques will result in different roughness conditions and consequently, to have a proper mechanical strength of the welding through the axial direction of the core, it is necessary to adapt the power and setting of the laser machine which may result in different heat affected zones and consequently higher core losses. Based on the author’s best knowledge there is not any published paper which discusses this problem and compares different cutting techniques in terms of surface roughness and welding characteristics.
To properly select the stacking and housing method, it is necessary to consider the mechanical strength, fatigue life, production cost, and magnetic properties at an elevated temperature. Based on the author’s best knowledge there is not any published paper which compares different stacking methods and the gap in study is evident. Therefore, this area still requires more attention and can be further developed.
8. Conclusions
In this paper, a comprehensive review of the effect of ESL manufacturing processes on the performance of electric machines is presented. Three manufacturing processes of cutting, stacking, and housing techniques which can result in plastic deformation and residual stress in the ESL and consequently decrease the magnetic quality and performance of the electrical machines, are surveyed. The advantages and disadvantages of the existing manufacturing techniques in these areas are highlighted. These manufacturing processes are especially important for small electric machines because the impacted zone has a wider relative width and as reported results in a significant increase of 30–40% in the iron losses of the machines. One of the methods to recover the magnetic properties of the ESL is using the annealing process. As illustrated in the literature, the annealing process can improve energetic performance by 28% for punched samples, 25% for laser-cut samples and 14% for wire-cutting samples. However, this process is time and energy consuming.
To accurately consider the effect of the manufacturing process on the design process of the electrical machines, it is necessary to develop the FEM model to investigate the effect of the damaged area on the performance of the electrical machines. Therefore, in this paper, the proposed methods for FE implementation of the effect of different manufacturing processes for the accurate calculation of excess eddy current and hysteresis losses, are surveyed and the merits and drawbacks of the proposed modelling techniques are highlighted.
Overall, the information gathered for modelling, design, and experimental verification of the effect of ESL manufacturing processing on the performance of electric machines will be a good source for the designer of electrical machines to consider these effects and reduce the obsolescence ratio of the product in mass production.
Funding
This research was funded by UKRI under InnovateUK grant 10011291.
Data Availability Statement
The data presented in this study are available on request from the corresponding author.
Conflicts of Interest
The authors declare no conflict of interest.
References
- Mahmouditabar, F.; Vahedi, A.; Takorabet, N. Design and Analysis of Interior Permanent Magnet Motor for Electric Vehicle Application Considering Irreversible Demagnetization. IEEE Trans. Ind. Appl. 2022, 58, 284–293. [Google Scholar] [CrossRef]
- Nobahari, A.; Vahedi, A.; Nasiri-Zarandi, R. A Modified Permanent Magnet-Assisted Synchronous Reluctance Motor Design for Torque Characteristics Improvement. IEEE Trans. Energy Convers. 2022, 37, 989–998. [Google Scholar] [CrossRef]
- Rafiee, V.; Faiz, J. Robust Design of an Outer Rotor Permanent Magnet Motor through Six-Sigma Methodology Using Response Surface Surrogate Model. IEEE Trans. Magn. 2019, 55, 8107110. [Google Scholar] [CrossRef]
- Nasiri-Zarandi, R.; Ghaheri, A.; Abbaszadeh, K. Thermal Modeling and Analysis of a Novel Transverse Flux HAPM Generator for Small-Scale Wind Turbine Application. IEEE Trans. Energy Convers. 2020, 35, 445–453. [Google Scholar] [CrossRef]
- Baker, N.J.; Jordan, S. Comparison of Two Transverse Flux Machines for an Aerospace Application. IEEE Trans. Ind. Appl. 2018, 54, 5783–5790. [Google Scholar] [CrossRef]
- Baker, N.J.; Raihan, M.A.H.; Almoraya, A.A. A Cylindrical Linear Permanent Magnet Vernier Hybrid Machine for Wave Energy. IEEE Trans. Energy Convers. 2019, 34, 691–700. [Google Scholar] [CrossRef]
- Bali, M.; Muetze, A. Modeling the Effect of Cutting on the Magnetic Properties of Electrical Steel Sheets. IEEE Trans. Ind. Electron. 2017, 64, 2547–2556. [Google Scholar] [CrossRef]
- Clerc, A.J.; Muetze, A. Measurement of stator core magnetic degradation during the manufacturing process. IEEE Trans. Ind. Appl. 2012, 48, 1344–1352. [Google Scholar] [CrossRef]
- Mohammadi, A.A.; Zhang, S.; Pop, A.C.; Gyselinck, J.J.C. Effect of Electrical Steel Punching on the Performance of Fractional-kW Electrical Machines. IEEE Trans. Energy Convers. 2022, 37, 1854–1863. [Google Scholar] [CrossRef]
- Poskovic, E.; Ferraris, L.; Bramerdorfer, G.; Cossale, M. A Thermographic Method to Evaluate Different Processes and Assembly Effects on Magnetic Steels. IEEE Trans. Ind. Appl. 2022, 58, 3405–3413. [Google Scholar] [CrossRef]
- Vaschetto, S.; Gmyrek, Z.; Dobler, C.; Bramerdorfer, G.; Cavagnino, A. Experimental Assessment and Modeling of Losses in Interlocked Magnetic Cores. IEEE Trans. Ind. Appl. 2022, 58, 4450–4460. [Google Scholar] [CrossRef]
- Electrical Steel Sheet for Traction Motor of Hybrid/Electric Vehicles. Available online: https://www.researchgate.net/publication/289668081_Electrical_steel_sheet_for_traction_motor_of_hybridelectric_vehicles (accessed on 12 June 2023).
- Goldbeck, G.; Cossale, M.; Kitzberger, M.; Bramerdorfer, G.; Andessner, D.; Amrhein, W. Incorporating the Soft Magnetic Material Degradation to Numerical Simulations. IEEE Trans. Ind. Appl. 2020, 56, 3584–3593. [Google Scholar] [CrossRef]
- Cossale, M.; Kitzberger, M.; Goldbeck, G.; Bramerdorfer, G.; Andessner, D.; Amrhein, W. Local Degradation in Soft Magnetic Materials: A Simplified Modeling Approach. IEEE Trans. Ind. Appl. 2019, 55, 5897–5905. [Google Scholar] [CrossRef]
- Bali, M.; De Gersem, H.; Muetze, A. Finite-element modeling of magnetic material degradation due to punching. IEEE Trans. Magn. 2014, 50, 745–748. [Google Scholar] [CrossRef]
- M’Zali, N.; Martin, F.; Sundaria, R.; Henneron, T.; Benabou, A.; Belahcen, A. Finite-Element Modeling of Magnetic Properties Degradation Due to Plastic Deformation. IEEE Trans. Magn. 2020, 56, 7506704. [Google Scholar] [CrossRef]
- Xia, C.; Wang, H.; Wu, Y.; Wang, H. Joining of the Laminated Electrical Steels in Motor Manufacturing: A Review. Materials 2020, 13, 4583. [Google Scholar] [CrossRef]
- Dems, M.; Gmyrek, Z.; Komeza, K. The Influence of Cutting Technology on Magnetic Properties of Non-Oriented Electrical Steel—Review State of the Art. Energies 2023, 16, 4299. [Google Scholar] [CrossRef]
- Bali, M.; Muetze, A. The degradation depth of non-grain oriented electrical steel sheets of electric machines due to mechanical and laser cutting: A state-of-the-art review. IEEE Trans. Ind. Appl. 2019, 55, 366–375. [Google Scholar] [CrossRef]
- IEC 60404-2:1996/AMD1:2008/COR1:2018; Corrigendum 1—Amendment 1—Magnetic Materials—Part 2: Methods of Measurement of Magnetic Properties of Electrical Steel Strip and Sheet by Means of an Epstein Frame. International Electrotechnical Commission: Geneva, Switzerland, 2018. Available online: https://webstore.iec.ch/publication/62746 (accessed on 19 May 2023).
- IEC 60404-10:2016; Magnetic Materials—Part 10: Methods of Measurement of Magnetic Properties of Electrical Steel Strip and Sheet at Medium Frequencies. International Electrotechnical Commission: Geneva, Switzerland, 2016. Available online: https://webstore.iec.ch/publication/26102 (accessed on 19 May 2023).
- IEC 60404-3:2022; Magnetic Materials—Part 3: Methods of Measurement of the Magnetic Properties of Electrical Steel Strip and Sheet by Means of a Single Sheet Tester. International Electrotechnical Commission: Geneva, Switzerland, 2022. Available online: https://webstore.iec.ch/publication/66641 (accessed on 19 May 2023).
- IEC 60404-6:2018; Magnetic Materials—Part 6: Methods of Measurement of the Magnetic Properties of Magnetically Soft Metallic and Powder Materials at Frequencies in the Range 20 Hz to 100 kHz by the Use of Ring Specimens. International Electrotechnical Commission: Geneva, Switzerland, 2018. Available online: https://webstore.iec.ch/publication/27825 (accessed on 20 May 2023).
- Wang, H.; Zhang, Y.; Li, S. Laser welding of laminated electrical steels. J. Mater. Process. Technol. 2016, 230, 99–108. [Google Scholar] [CrossRef]
- Fiorillo, F. Characterization and Measurement of Magnetic Materials; Elsevier: Amsterdam, The Netherlands, 2004. [Google Scholar] [CrossRef]
- Krings, A.; Nategh, S.; Wallmark, O.; Soulard, J. Influence of the welding process on the performance of slotless pm motors with sife and nife stator laminations. IEEE Trans. Ind. Appl. 2014, 50, 296–306. [Google Scholar] [CrossRef]
- Schlegel, J.P.; Batistela, N.J.; Sadowski, N.; Kuo-Peng, P.; Bastos, J.; Rigoni, M.; de Etspíndola, A.A.; Dokonal, L. Testing strategies to evaluate non-oriented electrical steels losses. J. Microw. Optoelectron. Electromagn. Appl. 2012, 11, 304–315. [Google Scholar] [CrossRef]
- Colombo, L.; Soltanipour, S.; Tokat, A.; Reinap, A.; Thiringer, T.; Fernandez, F.M.; Lindström, J.; Alaküla, M. Statistical Assessment of Core Loss Measurement Techniques for Laminated Steel. In Proceedings of the [2023] IEEE Workshop on Electrical Machines Design, Control and Diagnosis (WEMDCD), Newcastle upon Tyne, UK, 13–14 April 2023. [Google Scholar] [CrossRef]
- Schoppa, A.P. Einfluss der Be- und Verarbeitung auf die Magnetischen Eigenschaften von Schlussgeglühtem, Nichtkornorientiertem Elektroband. Ph.D. Thesis, RWTH Aachen University, Aachen, Germany, 2001. [Google Scholar]
- Arshad, W.M.; Ryckebush, T.; Magnussen, F.; Lendenmann, H.; Soulard, J.; Etriksson, B.; Malmros, B. Incorporating lamination processing and component manufacturing in electrical machine design tools. In Proceedings of the 2007 IEEE Industry Applications Annual Meeting, New Orleans, LA, USA, 23–27 September 2007; pp. 94–102. [Google Scholar] [CrossRef]
- Schoppa, A.; Louis, H.; Pude, F.; Von Rad, C. Influence of abrasive waterjet cutting on the magnetic properties of non-oriented electrical steels. J. Magn. Magn. Mater. 2003, 254–255, 370–372. [Google Scholar] [CrossRef]
- Emura, M.; Landgraf, F.J.G.; Ross, W.; Barreta, J.R. The influence of cutting technique on the magnetic properties of electrical steels. J. Magn. Magn. Mater. 2003, 254–255, 358–360. [Google Scholar] [CrossRef]
- Belhadj, A.; Baudouin, P.; Breaban, F.; Deffontaine, A.; Dewulf, M.; Houbaert, Y. Effect of laser cutting on microstructure and on magnetic properties of grain non-oriented electrical steels. J. Magn. Magn. Mater. 2003, 256, 20–31. [Google Scholar] [CrossRef]
- Gaworska-Koniarek, D.; Szubzda, B.; Wilczyński, W.; Drosik, J.; Karaś, K. The influence of assist gas on magnetic properties of electrotechnical steel sheets cut with laser. J. Phys. Conf. Ser. 2011, 303, 012091. [Google Scholar] [CrossRef]
- Bayraktar, Ş.; Turgut, Y. Experimental and statistical analysis of the effects of punching and laser cutting methods on induction motor efficiency and total magnetic losses in silicon lamination sheets. J. Magn. Magn. Mater. 2023, 572, 170599. [Google Scholar] [CrossRef]
- Loisos, G.; Moses, A.J. Effect of mechanical and Nd:YAG laser cutting on magnetic flux distribution near the cut edge of non-oriented steels. J. Mater. Process. Technol. 2005, 161, 151–155. [Google Scholar] [CrossRef]
- Peksoz, A.; Erdem, S.; Derebasi, N. Mathematical model for cutting effect on magnetic flux distribution near the cut edge of non-oriented electrical steels. Comput. Mater. Sci. 2008, 43, 1066–1068. [Google Scholar] [CrossRef]
- Bali, M.; Muetze, A. Influence of Different Cutting Techniques on the Magnetic Characteristics of Electrical Steels Determined by a Permeameter. IEEE Trans. Ind. Appl. 2017, 53, 971–981. [Google Scholar] [CrossRef]
- Xiang, Q.; Cheng, L.; Wu, K. Effects of Laser Cutting Parameters on the Magnetic Properties of 50W350 High-Grade Non-Oriented Electrical Steel. Materials 2023, 16, 1642. [Google Scholar] [CrossRef]
- Bali, M. Magnetic Material Degradation due to Different Cutting Techniques and Its Modeling for Electric Machine Design. Ph.D. Thesis, Graz University of Technology, Graz, Austria, 2016. Available online: https://diglib.tugraz.at/magnetic-material-degradation-due-to-different-cutting-techniques-and-its-modeling-for-electric-machine-design-2016 (accessed on 1 July 2023).
- Kurosaki, Y.; Mogi, H.; Fujii, H.; Kubota, T.; Shiozaki, M. Importance of punching and workability in non-oriented electrical steel sheets. J. Magn. Magn. Mater. 2008, 320, 2474–2480. [Google Scholar] [CrossRef]
- Winter, K.; Liao, Z.; Ramanathan, R.; Axinte, D.; Vakil, G.; Gerada, C. How non-conventional machining affects the surface integrity and magnetic properties of non-oriented electrical steel. Mater. Des. 2021, 210, 110051. [Google Scholar] [CrossRef]
- Reinlein, M.; Verlag, S. Simulation der Eisenverluste und des Magnetisierungsbedarfs unter Berücksichtigung von Fertigungseinflüssen in Induktionsmaschinen. Shaker: Düren and Maastricht, Germany. 1986. Available online: https://www.amazon.de/Magnetisierungsbedarfs-Ber%C3%BCcksichtigung-Fertigungseinfl%C3%BCssen-Induktionsmaschinen-Kaiserslauterer/dp/3844063579 (accessed on 1 July 2023).
- Pulnikov, A.; Melkebeek, J.; Dupré, L. Modification of Magnetic Properties of Non Oriented Electrical Steels by the Production of Electromagnetic Devices/Alexandre Pulnikov. 2004. Available online: http://hdl.handle.net/1854/LU-8597986 (accessed on 8 June 2023).
- Demir, Y.; Ocak, O.; Ulu, Y.; Aydin, M. Impact of lamination processing methods on performance of permanent magnet synchronous motors. In Proceedings of the 2014 International Conference on Electrical Machines (ICEM), Berlin, Germany, 2–5 September 2014; pp. 1218–1223. [Google Scholar] [CrossRef]
- Robert, F.; Prince A, A.; Fredo A R, J. Influence of wire electrical discharge machine cutting parameters on the magnetization characteristics of electrical steel laminations. Mater. Today Proc. 2022, 52, 746–750. [Google Scholar] [CrossRef]
- Lautre, N.K.; Dharmik, B.Y. Surface Integrity and Core Loss in Lamination Coated Thin Sheets of M-43 Grade Cold Rolled Non-grain-Oriented Electrical Steel. J. Mater. Eng. Perform. 2022, 31, 9001–9018. [Google Scholar] [CrossRef]
- Dems, M.; Komeza, K.; Gmyrek, Z.; Szulakowski, J. The Effect of Sample’s Dimension and Cutting Technology on Magnetization and Specific Iron Losses of FeSi Laminations. Energies 2022, 15, 2086. [Google Scholar] [CrossRef]
- Manescu, V.; Paltanea, G.; Ferrara, E.; Nemoianu, I.V.; Fiorillo, F.; Gavrila, H. Influence of mechanical and water-jet cutting on the dynamic magnetic properties of NO Fe-Si steels. J. Magn. Magn. Mater. 2020, 499, 166257. [Google Scholar] [CrossRef]
- Manescu-Paltanea, V.; Paltanea, G.; Nemoianu, I.V. Degradation of Static and Dynamic Magnetic Properties of Non-Oriented Steel Sheets by Cutting. IEEE Trans. Magn. 2018, 54, 2001705. [Google Scholar] [CrossRef]
- Bali, M.; De Gersem, H.; Muetze, A. Determination of Original Nondegraded and Fully Degraded Magnetic Properties of Material Subjected to Mechanical Cutting. IEEE Trans. Ind. Appl. 2016, 52, 2297–2305. [Google Scholar] [CrossRef]
- Bali, M.; De Gersem, H.; Muetze, A. Determination of Original Nondegraded and Fully Degraded Magnetic Characteristics of Material Subjected to Laser Cutting. IEEE Trans. Ind. Appl. 2017, 53, 4242–4251. [Google Scholar] [CrossRef]
- Vandenbossche, L.; Jacobs, S.; Henrotte, F.; Hameyer, K. Impact of cut edges on magnetization curves and iron losses in e-machines for automotive traction. World Electr. Veh. J. 2010, 4, 587–596. [Google Scholar] [CrossRef]
- Kedous-Lebouc, A.; Cornut, B.; Perrier, J.C.; Manfé, P.; Chevalier, T. Punching influence on magnetic properties of the stator teeth of an induction motor. J. Magn. Magn. Mater. 2003, 254–255, 124–126. [Google Scholar] [CrossRef]
- Kedous-Lebouc, A.; Messal, O.; Youmssi, A. Joint punching and frequency effects on practical magnetic characteristics of electrical steels for high-speed machines. J. Magn. Magn. Mater. 2017, 426, 658–665. [Google Scholar] [CrossRef]
- Goldbeck, G.; Cossale, M.; Kitzberger, M.; Bramerdorfer, G.; Andessner, D.; Amrhein, W. Numerical Implementation of Local Degradation Profiles in Soft Magnetic Materials. In Proceedings of the 2018 23rd International Conference on Electrical Machines, ICEM 2018, Alexandroupoli, Greece, 3–6 September 2018; pp. 1037–1043. [Google Scholar] [CrossRef]
- Sundaria, R.; Lehikoinen, A.; Arkkio, A.; Belahcen, A. Effects of Manufacturing Processes on Core Losses of Electrical Machines. IEEE Trans. Energy Convers. 2021, 36, 197–206. [Google Scholar] [CrossRef]
- Sundaria, R.; Nair, D.G.; Lehikoinen, A.; Arkkio, A.; Belahcen, A. Effect of Laser Cutting on Core Losses in Electrical Machines—Measurements and Modeling. IEEE Trans. Ind. Electron. 2020, 67, 7354–7363. [Google Scholar] [CrossRef]
- Sundaria, R.; Nair, D.G.; Lehikoinen, A.; Arkkio, A.; Belahcen, A. Loss Model for the Effects of Steel Cutting in Electrical Machines. In Proceedings of the 2018 23rd International Conference on Electrical Machines, ICEM 2018, Alexandroupoli, Greece, 3–6 September 2018; pp. 1260–1266. [Google Scholar] [CrossRef]
- Gurbuz, I.T.; Martin, F.; Billah, M.M.; Belahcen, A.; Rasilo, P. Effective Implementation of the Effect of Electrical Steel Sheet Cutting into Finite-Element Simulation. In Proceedings of the 2022 IEEE 20th Biennial Conference on Electromagnetic Field Computation (CEFC), Denver, CO, USA, 24–26 October 2022. [Google Scholar] [CrossRef]
- Martin, F.; Aydin, U.; Sundaria, R.; Rasilo, P.; Belahcen, A.; Arkkio, A. Effect of Punching the Electrical Sheets on Optimal Design of a Permanent Magnet Synchronous Motor. IEEE Trans. Magn. 2018, 54, 8102004. [Google Scholar] [CrossRef]
- Gmyrek, Z.; Cavagnino, A.; Ferraris, L. Estimation of the magnetic properties of the damaged area resulting from the punching process: Experimental research and FEM modeling. IEEE Trans. Ind. Appl. 2013, 49, 2069–2077. [Google Scholar] [CrossRef]
- Gmyrek, Z.; Cavagnino, A. Analytical method for determining the damaged area width in magnetic materials due to punching process. In Proceedings of the IECON 2011—37th Annual Conference of the IEEE Industrial Electronics Society, Fort Collins, CO, USA, 7–10 November 2011; pp. 1764–1769. [Google Scholar] [CrossRef]
- Dems, M.; Gmyrek, Z.; Komeza, K. Analytical Model of an Induction Motor Taking into Account the Punching Process Influence on the Material Properties’ Change of Lamination. Energies 2021, 14, 2459. [Google Scholar] [CrossRef]
- Alatawneh, N.; Saleem, A.; Rahman, T.; Lowther, D.A.; Chromik, R. Modelling and analysis of the effects of cutting of core laminations in electric machines. IET Electr. Power Appl. 2020, 14, 2355–2361. [Google Scholar] [CrossRef]
- Rasilo, P.; Aydin, U.; Holopainen, T.P.; Arkkio, A. Analysis of iron losses on the cutting edges of induction motor core laminations. In Proceedings of the 2016 XXII International Conference on Electrical Machines (ICEM), Lausanne, Switzerland, 4–7 September 2016; pp. 1312–1317. [Google Scholar] [CrossRef]
- Colombo, L.; Tokat, A.; Bitsi, K.; Márquez-Fernández, F.J.; Alakula, M. Performance Degradation due to Cut Edge Effect for an Axial-Flux Induction Machine. In Proceedings of the 2022 International Conference on Electrical Machines, ICEM 2022, Valencia, Spain, 5–8 September 2022; pp. 1253–1259. [Google Scholar] [CrossRef]
- Bourchas, K.; Stening, A.; Soulard, J.; Broddefalk, A.; Lindenmo, M.; Dahlen, M.; Gyllensten, F. Quantifying Effects of Cutting and Welding on Magnetic Properties of Electrical Steels. IEEE Trans. Ind. Appl. 2017, 53, 4269–4278. [Google Scholar] [CrossRef]
- Mach, M.; Hajek, V. Model of a small induction machine with effects of manufacturing. In Proceedings of the 2015 International Conference on Electrical Drives and Power Electronics (EDPE), Tatranska Lomnica, Slovakia, 21–23 September 2015; pp. 319–323. [Google Scholar] [CrossRef]
- Soltanipour, S.; Thiringer, T.; Lindström, J. Battery Electric Vehicle Performance Evaluation by Considering Punching Effect on PMSM Iron Cores. In Proceedings of the 2022 International Conference on Electrical Machines (ICEM), Valencia, Spain, 5–8 September 2022; pp. 2162–2168. [Google Scholar] [CrossRef]
- Sano, H.; Narita, K.; Zeze, E.; Yamada, T.; Kazuki, U.; Akatsu, K. A practical approach for electromagnetic analysis with the effect of the residual strain due to manufacturing processes. In Proceedings of the 2016 IEEE Energy Conversion Congress and Exposition (ECCE), Milwaukee, WI, USA, 18–22 September 2016. [Google Scholar] [CrossRef]
- Credo, A.; Petrov, I.; Pyrhonen, J.; Villani, M. Impact of manufacturing stresses on multiple-rib Synchronous Reluctance Motor performance. IEEE Trans. Ind. Appl. 2022, 59, 1253–1262. [Google Scholar] [CrossRef]
- Vandenbossche, L.; Jacobs, S.; Jannot, X.; McClelland, M.; Saint-Michel, J.; Attrazic, E. Iron loss modelling which includes the impact of punching, applied to high-efficiency induction machines. In Proceedings of the 2013 3rd International Electric Drives Production Conference (EDPC), Nuremberg, Germany, 29–30 October 2013. [Google Scholar] [CrossRef]
- Hofmann, M.; Naumoski, H.; Herr, U.; Herzog, H.G. Magnetic Properties of Electrical Steel Sheets in Respect of Cutting: Micromagnetic Analysis and Macromagnetic Modeling. IEEE Trans. Magn. 2016, 52, 2000114. [Google Scholar] [CrossRef]
- Bramerdorfer, G. Effect of the Manufacturing Impact on the Optimal Electric Machine Design and Performance. IEEE Trans. Energy Convers. 2020, 35, 1935–1943. [Google Scholar] [CrossRef]
- Elfgen, S.; Steentjes, S.; Bohmer, S.; Franck, D.; Hameyer, K. Influences of Material Degradation Due to Laser Cutting on the Operating Behavior of PMSM Using a Continuous Local Material Model. IEEE Trans. Ind. Appl. 2017, 53, 1978–1984. [Google Scholar] [CrossRef]
- Weiss, H.A.; Trober, P.; Golle, R.; Steentjes, S.; Leuning, N.; Elfgen, S.; Hameyer, K.; Volk, W. Impact of Punching Parameter Variations on Magnetic Properties of Nongrain-Oriented Electrical Steel. IEEE Trans. Ind. Appl. 2018, 54, 5869–5878. [Google Scholar] [CrossRef]
- Goldbeck, G.; Bramerdorfer, G.; Amrhein, W. Impact of local degradation in soft magnetic materials on performance of permanent magnet synchronous machines. In Proceedings of the 2019 IEEE Energy Conversion Congress and Exposition (ECCE), Baltimore, MD, USA, 29 September–3 October 2019; pp. 3081–3087. [Google Scholar] [CrossRef]
- Mohammadi, A.A.; Zhang, S.; Gyselinck, J.; Pop, A.C.; Zhang, W. Manufacturing-induced Cogging Torque in Segmented Stator Permanent-magnet Machines with respect to Steel Punching. IEEE Trans. Magn. 2022, 58, 1–8. [Google Scholar] [CrossRef]
- Elfgen, S.; Steentjes, S.; Böhmer, S.; Franck, D.; Hameyer, K. Continuous Local Material Model for Cut Edge Effects in Soft Magnetic Materials. IEEE Trans. Magn. 2016, 52, 2001304. [Google Scholar] [CrossRef]
- Sundaria, R.; Lehikoinen, A.; Hannukainen, A.; Arkkio, A.; Belahcen, A. Mixed-Order Finite-Element Modeling of Magnetic Material Degradation Due to Cutting. IEEE Trans. Magn. 2018, 54, 7402008. [Google Scholar] [CrossRef]
- Crevecoeur, G.; Sergeant, P.; Dupré, L.; Vandenbossche, L.; Van De Walle, R. Analysis of the local material degradation near cutting edges of electrical steel sheets. IEEE Trans. Magn. 2008, 44, 3173–3176. [Google Scholar] [CrossRef]
- Advantages of Full-Face Bonding. Available online: https://www.voestalpine.com/isovac/en/Product-overview/Backlack/Advantages-of-full-face-bonding (accessed on 9 June 2023).
- Schneider, M.; Urban, N.; Franke, J. Relation of joining parameters of stator core production and iron loss. In Proceedings of the 2017 7th International Electric Drives Production Conference (EDPC), Würzburg, Germany, 5–6 December 2017. [Google Scholar] [CrossRef]
- Brochures. Available online: https://www.waelzholz.com/en/downloads/brochures.html (accessed on 9 June 2023).
- Imamori, S.; Steentjes, S.; Hameyer, K. Influence of Interlocking on Magnetic Properties of Electrical Steel Laminations. IEEE Trans. Magn. 2017, 53, 8108704. [Google Scholar] [CrossRef]
- Zhou, G.Y.; Hao, H.; Jin, M.J.; Shen, J.X. Influence of interlocking dowels on motor core loss. COMPEL Int. J. Comput. Math. Electr. Electron. Eng. 2016, 35, 808–820. [Google Scholar] [CrossRef]
- Shen, J.X.; Zhou, G.Y.; Jin, S.L.; Hao, H. Analysis of iron loss in interlocked lamination core. In Proceedings of the 2015 International Conference on Sustainable Mobility Applications, Renewables and Technology (SMART), Kuwait, Kuwait, 23–25 November 2015. [Google Scholar] [CrossRef]
- Mahmouditabar, F.; Vahedi, A.; Takorabet, N. Robust Design of BLDC Motor Considering Driving Cycle. IEEE Trans. Transp. Electrif. 2023, in press. [CrossRef]
- Harrington, D.B. Turbine Generators. In Encyclopedia of Physical Science and Technology; Academic Press: Cambridge, MA, USA, 2003; pp. 193–215. [Google Scholar] [CrossRef]
- Gmyrek, Z.; Cavagnino, A. Influence of Punching, Welding, and Clamping on Magnetic Cores of Fractional KiloWatt Motors. IEEE Trans. Ind. Appl. 2018, 54, 4123–4132. [Google Scholar] [CrossRef]
- Gmyrek, Z.; Cavagnino, A.; Vaschetto, S.; Bramerdorfer, G. Loss Modeling for Interlocked Magnetic Cores. In Proceedings of the 2020 IEEE Energy Conversion Congress and Exposition (ECCE), Detroit, MI, USA, 11–15 October 2020; pp. 1060–1066. [Google Scholar] [CrossRef]
- Ziegler, M.; Brandl, F.; Kuehl, A.; Franke, J. Evaluation of Laser-welded Electrical Steel Laminations for Electric Motors. In Proceedings of the 12th International Symposium on Advanced Topics in Electrical Engineering, ATEE 2021, Bucharest, Romania, 25–27 March 2021. [Google Scholar] [CrossRef]
- Brachthäuser, N.; De Paoli, A.; Schäfer, P.; Senn, G. Laserstrahlschweissen von Paketierten Elektroblechen. ATZproduktion 2011, 4, 38–43. [Google Scholar] [CrossRef]
- Bali, M.; Muetze, A. Influences of CO2 Laser, FKL Laser, and Mechanical Cutting on the Magnetic Properties of Electrical Steel Sheets. IEEE Trans. Ind. Appl. 2015, 51, 4446–4454. [Google Scholar] [CrossRef]
- Katayama, S. Defect formation mechanisms and preventive procedures in laser welding. In Handbook of Laser Welding Technologies; Woodhead Publishing: Sawston, UK, 2013; pp. 332–373. [Google Scholar] [CrossRef]
- Cui, R.; Li, S. Pulsed laser welding of laminated electrical steels. J. Mater. Process. Technol. 2020, 285, 116778. [Google Scholar] [CrossRef]
- Vegelj, D.; Zajec, B.; Gregorčič, P.; Možina, J. Adaptive pulsed-laser welding of electrical laminations. Stroj. Vestn. J. Mech. Eng. 2014, 60, 106–114. [Google Scholar] [CrossRef]
- Zhang, Y.; Wang, H.; Chen, K.; Li, S. Comparison of laser and TIG welding of laminated electrical steels. J. Mater. Process. Technol. 2017, 247, 55–63. [Google Scholar] [CrossRef]
- Schade, T.; Ramsayer, R.M.; Bergmann, J.P. Laser welding of electrical steel stacks investigation of the weldability. In Proceedings of the 2014 4th International Electric Drives Production Conference, EDPC 2014, Nuremberg, Germany, 30 September–1 October 2014. [Google Scholar] [CrossRef]
- Mahrle, A.; Beyer, E. Modeling and simulation of the energy deposition in laser beam welding with oscillatory beam deflection. In Proceedings of the 26th International Congress on Applications of Lasers and Electro-Optics, ICALEO 2007, Cincinnati, OH, USA, 29 October–1 November 2007. [Google Scholar]
- Ziegler, M.; Mayr, A.; Seefried, J.; Kuehl, A.; Franke, J. Potentials of process monitoring during laser welding of electrical steel laminations. In Proceedings of the 2019 9th International Electric Drives Production Conference, EDPC 2019, Esslingen, Germany, 3–4 December 2019. [Google Scholar] [CrossRef]
- Ziegler, M.; Brandl, F.; Franke, J.; Kuhl, A. Numerical Simulation of the Laser Welding Process for Electrical Steel Laminations. In Proceedings of the 2022 12th International Electric Drives Production Conference, EDPC 2022, Regensburg, Germany, 29–30 November 2022. [Google Scholar] [CrossRef]
- Leuning, N.; Steentjes, S.; Hameyer, K.; Gerhards, B.; Reisgen, U. Analysis of a novel laser welding strategy for electrical steel laminations. In Proceedings of the 2017 7th International Electric Drives Production Conference, EDPC 2017, Würzburg, Germany, 5–6 December 2017. [Google Scholar] [CrossRef]
- Tang, Z.; Zhang, X.; Wan, L.; Ouyang, Y.; Gao, Z.; Wei, Q.; Wang, A.; Yang, H.; Wu, Y.; Zhang, Y.; et al. Bluelaser welding of laminated electrical steels: Dynamic process, weld bead characteristics, mechanical and magnetic properties. J. Mater. Process. Technol. 2023, 312, 117859. [Google Scholar] [CrossRef]
- Wang, H.; Zhang, Y. Modeling of Eddy-Current Losses of Welded Laminated Electrical Steels. IEEE Trans. Ind. Electron. 2017, 64, 2992–3000. [Google Scholar] [CrossRef]
- Vourna, P. Characterization of Electron Beam Welded Non-Oriented Electrical Steel with Magnetic Barkhausen Noise. Key Eng. Mater. 2014, 605, 39–42. [Google Scholar] [CrossRef]
- Vourna, P.; Ktena, A. Metallurgical, Mechanical and Magnetic Properties of Electrical Steel Sheets in TIG and PLASMA Welding. Key Eng. Mater. 2013, 543, 479–482. [Google Scholar] [CrossRef]
- Dharmik, B.Y.; Lautre, N.K. Performance assessment of CMT over GTA welding on stacked thin sheets of CRNGO electrical steel. Mater. Lett. 2020, 272, 127901. [Google Scholar] [CrossRef]
- Dharmik, B.Y.; Lautre, N.K. CMT and GTA welding on microstructural characteristics and magnetic performance of thin CRNO electrical steel sheets. Mater. Chem. Phys. 2023, 295, 127128. [Google Scholar] [CrossRef]
- Vourna, P.; Ktena, A.; Tsakiridis, P.E.; Hristoforou, E. An accurate evaluation of the residual stress of welded electrical steels with magnetic Barkhausen noise. Measurement 2015, 71, 31–45. [Google Scholar] [CrossRef]
- EN 10106:2015; Cold Rolled Non-Oriented Electrical Steel Strip and Sheet Delivered in the Fully Processed State. iTeh, Inc.: Newark, DE, USA, 2015. Available online: https://standards.iteh.ai/catalog/standards/cen/abe948e0-1bf5-4929-896b-a351503f658b/en-10106-2015 (accessed on 18 May 2023).
- Ukwungwu, D.; Krichel, T.; Schauerte, B.; Leuning, N.; Olschok, S.; Reisgen, U.; Hameyer, K. Electromagnetic assessment of welding processes for packaging of electrical sheets. In Proceedings of the 2020 10th International Electric Drives Production Conference, EDPC 2020, Ludwigsburg, Germany, 8–9 December 2020. [Google Scholar] [CrossRef]
- Daem, A.; Ibrahim, M.N.; Sergeant, P.; Dupré, L. Stress-Dependent Magnetic Equivalent Circuit for Modeling Welding Effects in Electrical Steel Laminations. Machines 2022, 10, 1153. [Google Scholar] [CrossRef]
- Leitner, S.; Gruebler, H.; Muetze, A. Effect of Manufacturing Influences on Magnetic Performance Parameters of Sub-Fractional Horsepower Motors. IEEE Trans. Magn. 2021, 57, 8205209. [Google Scholar] [CrossRef]
- Hilinski, E.J.; Johnston, G.H. Annealing of electrical steel. In Proceedings of the 2014 4th International Electric Drives Production Conference, EDPC 2014, Nuremberg, Germany, 30 September–1 October 2014. [Google Scholar] [CrossRef]
- Chiang, C.C.; Knight, A.M.; Hsieh, M.-F.; Tsai, M.-G.; Liu, B.H.; Chen, I.-G.; Gaing, Z.-L.; Tsai, M.-C. Effects of annealing on magnetic properties of electrical steel and performances of SRM after punching. IEEE Trans. Magn. 2014, 50, 8203904. [Google Scholar] [CrossRef]
- Rodrigues, D.L.; Nishikawa, T.S.P.; Almeida, A.A.; Landgraf, F.J.G.; Martin, R.V. The Effect of Recovery Annealing on the Magnetic and Mechanical Properties of Nonoriented Electrical Steels. IEEE Trans. Magn. 2014, 50, 2002204. [Google Scholar] [CrossRef]
- Zhang, H.; Zeng, L.; An, D.; Pei, R. Magnetic Performance Improvement Caused by Tensile Stress in Equivalent Iron Core Fabricated by High-Strength Non-Oriented Electrical Steel. IEEE Trans. Magn. 2022, 58, 8600105. [Google Scholar] [CrossRef]
- Abbaschian, R.; Abbaschian, L.; Reed-Hill, R.E. Physical Metallurgy Principles; Cengage Learning: London, UK, 2009; 750p. [Google Scholar]
- Mierczak, L.; Denke, P.; Klimczyk, P.; Siebert, S. Advanced measurement technologies for magnetic materials used in automotive applications. In Proceedings of the 2019 22nd International Conference on Electrical Machines and Systems, ICEMS 2019, Harbin, China, 11–14 August 2019. [Google Scholar] [CrossRef]
- Camilleri, R.; Howey, D.A.; McCulloch, M.D. Experimental investigation of the thermal contact resistance in shrink fit assemblies with relevance to electrical machines. In Proceedings of the 7th IET International Conference on Power Electronics, Machines and Drives (PEMD 2014), Manchester, UK, 8–10 April 2014. [Google Scholar] [CrossRef]
- Reinlein, M.; Regnet, M.; Hubert, T.; Kremser, A.; Werner, U.; Bonig, J. Influence of Villari Effect on the magnetizing current of Induction Machines by shrink fitting of rotor cores. In Proceedings of the 2016 International Symposium on Power Electronics, Electrical Drives, Automation and Motion, SPEEDAM 2016, Capri, Italy, 22–24 June 2016; pp. 1316–1323. [Google Scholar] [CrossRef]
- Takahashi, N.; Morimoto, H.; Yunoki, Y.; Miyagi, D. Effect of shrink fitting and cutting on iron loss of permanent magnet motor. J. Magn. Magn. Mater. 2008, 320, e925–e928. [Google Scholar] [CrossRef]
- Zhu, L.; Fan, B.; Han, X.; Tang, R. Effects of shrink fitting on iron losses of a permanent magnet synchronous motor with an amorphous core. IET Electr. Power Appl. 2022, 16, 996–1003. [Google Scholar] [CrossRef]
- Fujisaki, K.; Hirayama, R.; Kawachi, T.; Satou, S.; Kaidou, C.; Yabumoto, M.; Kubota, T. Motor core iron loss analysis evaluating shrink fitting and stamping by finite-element method. IEEE Trans. Magn. 2007, 43, 1950–1954. [Google Scholar] [CrossRef]
- Fujisaki, K.; Satoh, S. Numerical calculations of electromagnetic fields in silicon steel under mechanical stress. IEEE Trans. Magn. 2004, 40, 1820–1825. [Google Scholar] [CrossRef]
- Diao, K.; Sun, X.; Yao, M. Robust-Oriented Optimization of Switched Reluctance Motors Considering Manufacturing Fluctuation. IEEE Trans. Transp. Electrif. 2022, 8, 2853–2861. [Google Scholar] [CrossRef]
- DIN 4760:1982; Form Deviations; Concepts; Classification System. German Institute for Standardisation: Berlin, Germany, 1982. Available online: https://webstore.ansi.org/standards/din/din47601982 (accessed on 25 August 2023).
Figure 1.
Iron loss deterioration in motor manufacturing process [12].
Figure 1.
Iron loss deterioration in motor manufacturing process [12].

Figure 2.
The schematic of B-H measurement frame and ring specimen’s example.

Figure 3.
The comparison of measured core losses of the NO25 steel sheet using different measurement devices (a) 50 Hz and (b) 200 Hz © [2023] IEEE. Reprinted, with permission, from [28].
Figure 3.
The comparison of measured core losses of the NO25 steel sheet using different measurement devices (a) 50 Hz and (b) 200 Hz © [2023] IEEE. Reprinted, with permission, from [28].

Figure 4.
Point of intersection at the specific losses of the guillotine-cut and laser-cut Epstein samples, (a) 50 Hz and (b) 250 Hz [40].
Figure 4.
Point of intersection at the specific losses of the guillotine-cut and laser-cut Epstein samples, (a) 50 Hz and (b) 250 Hz [40].

Figure 5.
Edge profiles before annealing (a) guillotine, (b) punching, (c) laser, and (d) photo-corrosion [32].
Figure 5.
Edge profiles before annealing (a) guillotine, (b) punching, (c) laser, and (d) photo-corrosion [32].

Figure 6.
(a) magnetizer coil and induction reference coil wound ring, (b) Punched ring at 1.4 T and 1000 Hz, (c) Wire-cut ring at the condition of 1.4 T and a frequency of 1000 Hz, and (d) laser-cut ring at the condition of 1.4 T and a frequency of 1000 Hz © [2023] IEEE. Reprinted, with permission, from [10].

Figure 7.
Model of the magnetic material strip with two marked regions © [2023] IEEE. Reprinted, with permission, from [62].
Figure 7.
Model of the magnetic material strip with two marked regions © [2023] IEEE. Reprinted, with permission, from [62].

Figure 8.
An example of a layer-based approach for a segmented switch reluctance motor with four layers (a) the layers of the modified model and (b) the modified B-H characteristics (the layer colours correspond to the colours of magnetic curves).
Figure 8.
An example of a layer-based approach for a segmented switch reluctance motor with four layers (a) the layers of the modified model and (b) the modified B-H characteristics (the layer colours correspond to the colours of magnetic curves).

Figure 9.
Single tooth model; (a) FE mesh, (b) Map of the shortest distance from the cut edges, (c) map of flux density distribution with imposed average flux density © [2023] IEEE. Reprinted, with permission, from [9].
Figure 9.
Single tooth model; (a) FE mesh, (b) Map of the shortest distance from the cut edges, (c) map of flux density distribution with imposed average flux density © [2023] IEEE. Reprinted, with permission, from [9].

Figure 11.
(a) V-shaped interlocking, (b) 3-D model of interlocking, and (c) simplified 2-D model [87].
Figure 11.
(a) V-shaped interlocking, (b) 3-D model of interlocking, and (c) simplified 2-D model [87].

Figure 12.
The clamping process (a) through bolts (b) axial key bars © [2023] IEEE. Reprinted, with permission, from [91].
Figure 12.
The clamping process (a) through bolts (b) axial key bars © [2023] IEEE. Reprinted, with permission, from [91].

Figure 13.
Mechanical loads on the weld seam © [2023] IEEE. Reprinted, with permission, from [103].
Figure 13.
Mechanical loads on the weld seam © [2023] IEEE. Reprinted, with permission, from [103].

Figure 14.
Ishikawa diagram of the welding process © [2023] IEEE. Reprinted, with permission, from [93].
Figure 14.
Ishikawa diagram of the welding process © [2023] IEEE. Reprinted, with permission, from [93].

Figure 15.
(a) Welding process of ESLs and (b) an example of the fusion welding process [24].
Figure 15.
(a) Welding process of ESLs and (b) an example of the fusion welding process [24].

Figure 16.
The details of electrical steel samples and each welded zone in (a) TIG, (b) Plasma and (c) EBW [111].
Figure 16.
The details of electrical steel samples and each welded zone in (a) TIG, (b) Plasma and (c) EBW [111].

Figure 17.
Performance comparison of TIG and laser process (a) eddy current distribution, (b) hysteresis curve, and (c) maximum lap shear-force of the welded joint [99].
Figure 17.
Performance comparison of TIG and laser process (a) eddy current distribution, (b) hysteresis curve, and (c) maximum lap shear-force of the welded joint [99].

Figure 18.
Relative permeability comparison of different methods with different speeds; lose laminations without welding, blue laser welding (50 mm/s), TIG welding (1.8 mm/s), and infrared laser welding (10 mm/s) [105].
Figure 18.
Relative permeability comparison of different methods with different speeds; lose laminations without welding, blue laser welding (50 mm/s), TIG welding (1.8 mm/s), and infrared laser welding (10 mm/s) [105].

Figure 19.
The comparison of laser welding types; (a) classic continuous welding, (b) adaptive continuous welding, (c) classic pulsed welding, and (d) adaptive pulsed welding [98].
Figure 19.
The comparison of laser welding types; (a) classic continuous welding, (b) adaptive continuous welding, (c) classic pulsed welding, and (d) adaptive pulsed welding [98].

Figure 20.
The comparison of classic and adaptive pulsed welding. (a) classic, and (b) adaptive [98].
Figure 20.
The comparison of classic and adaptive pulsed welding. (a) classic, and (b) adaptive [98].

Figure 21.
The comparison of different welding method (a) R1, two linear lines, (b) R2, four linear lines, (c) R3, spirally oriented spots, (d) R4, statistical distribution of spots, (e) magnetic loss at 1.0 T, and (f) magnetic loss at 1.3 T © [2023] IEEE. Reprinted, with permission, from [104].
Figure 21.
The comparison of different welding method (a) R1, two linear lines, (b) R2, four linear lines, (c) R3, spirally oriented spots, (d) R4, statistical distribution of spots, (e) magnetic loss at 1.0 T, and (f) magnetic loss at 1.3 T © [2023] IEEE. Reprinted, with permission, from [104].

Figure 22.
Comparison of linear and oscillating weld seam geometry© [2023] IEEE. Reprinted, with permission, from [93].
Figure 22.
Comparison of linear and oscillating weld seam geometry© [2023] IEEE. Reprinted, with permission, from [93].

Figure 23.
Electromagnetic losses for toroidal core samples, (a) at 50 Hz and 1.5 T, (b) at 400 Hz and 1.5 T © [2023] IEEE. Reprinted, with permission, from [93].
Figure 23.
Electromagnetic losses for toroidal core samples, (a) at 50 Hz and 1.5 T, (b) at 400 Hz and 1.5 T © [2023] IEEE. Reprinted, with permission, from [93].

Figure 24.
(a) Experimental setup and (b) Maximum shear force of the samples © [2023] IEEE. Reprinted, with permission, from [102].
Figure 24.
(a) Experimental setup and (b) Maximum shear force of the samples © [2023] IEEE. Reprinted, with permission, from [102].

Figure 25.
(a) The simplified rectangular model of welded stator yoke, (b)the proposed MEC model, and (c) the comparison of experimental and MEC results [114].
Figure 25.
(a) The simplified rectangular model of welded stator yoke, (b)the proposed MEC model, and (c) the comparison of experimental and MEC results [114].

Figure 26.
(a) Rheometer test setup and (b)A close-up of the rotor–stator arrangement © [2023] IEEE. Reprinted, with permission, from [115].
Figure 26.
(a) Rheometer test setup and (b)A close-up of the rotor–stator arrangement © [2023] IEEE. Reprinted, with permission, from [115].

Figure 27.
(a) Core under study, (b)Core under study with coils, and (c) tThe measurement system [125].
Figure 27.
(a) Core under study, (b)Core under study with coils, and (c) tThe measurement system [125].


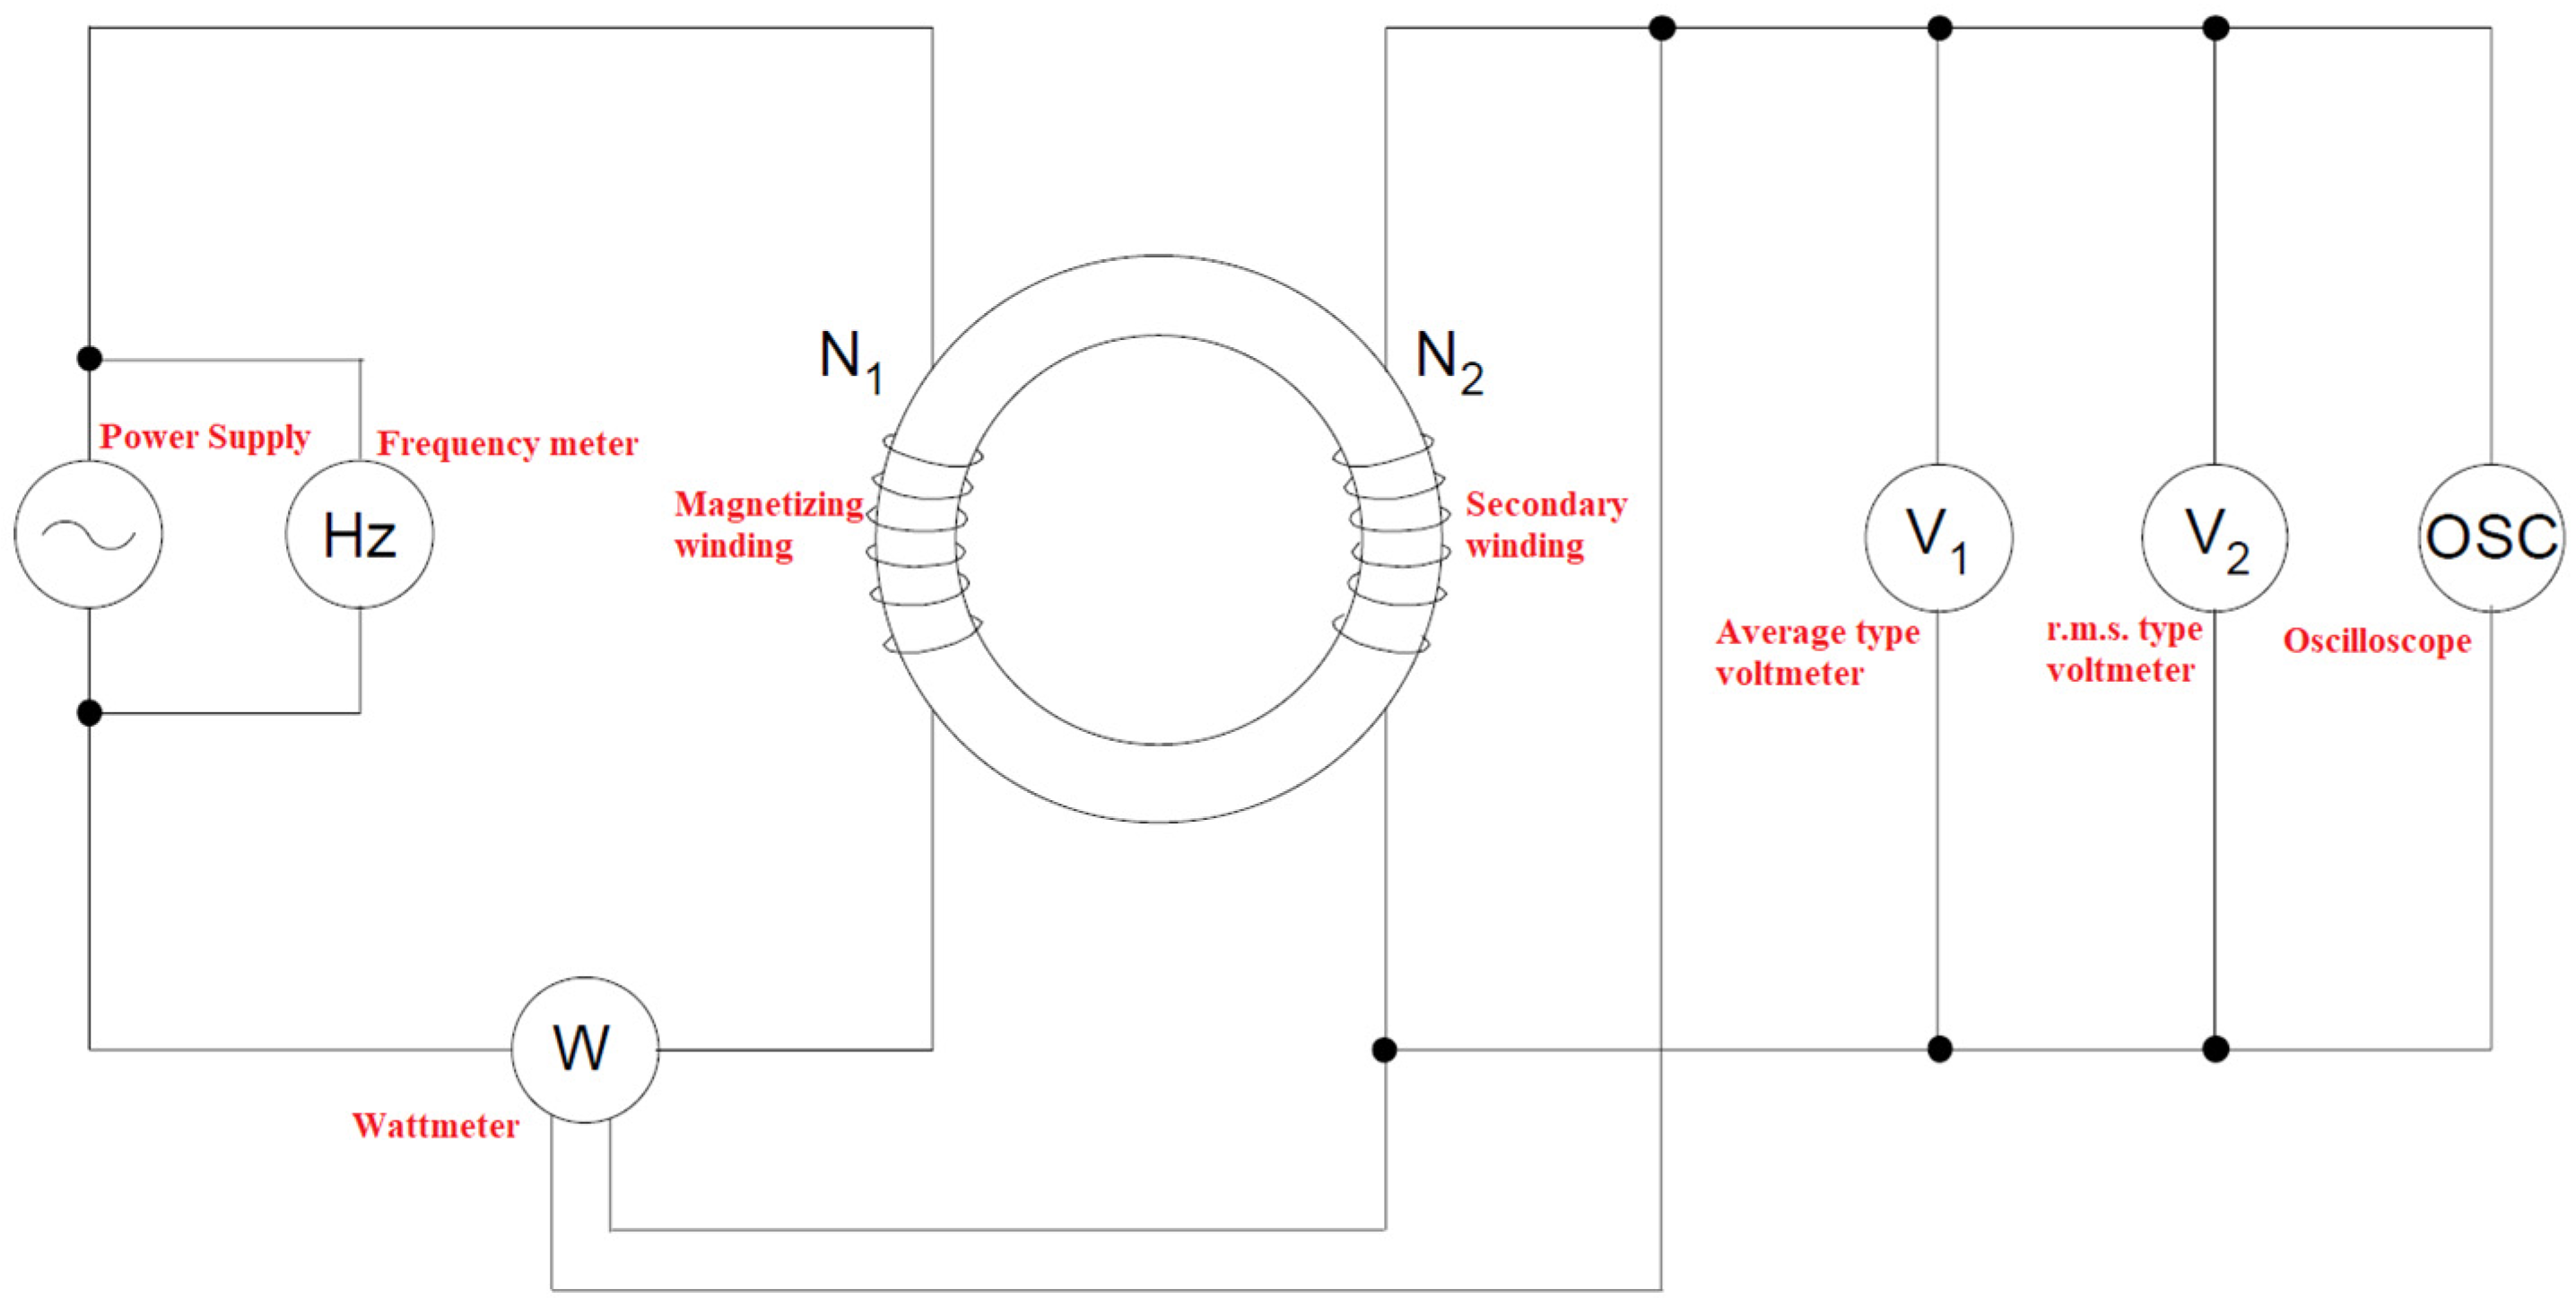
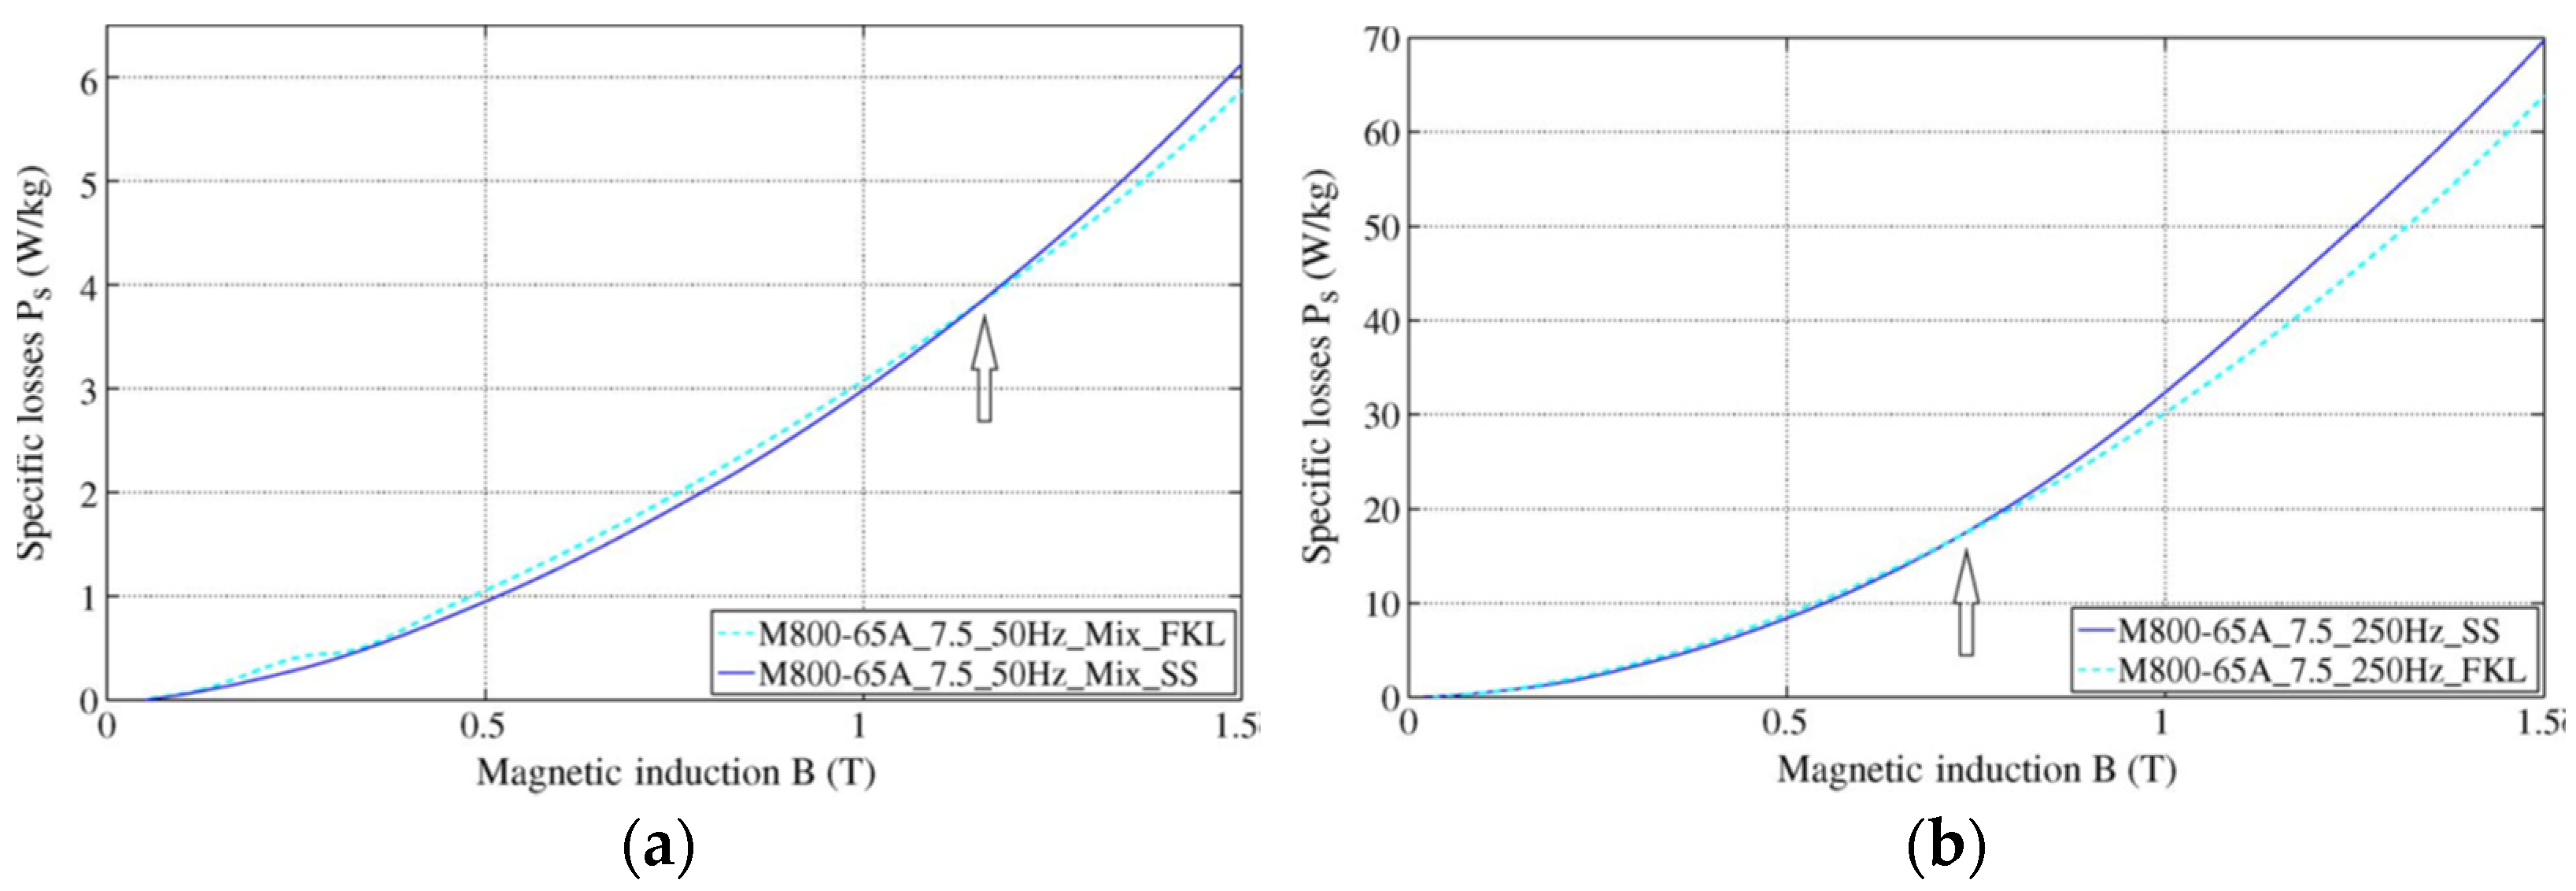
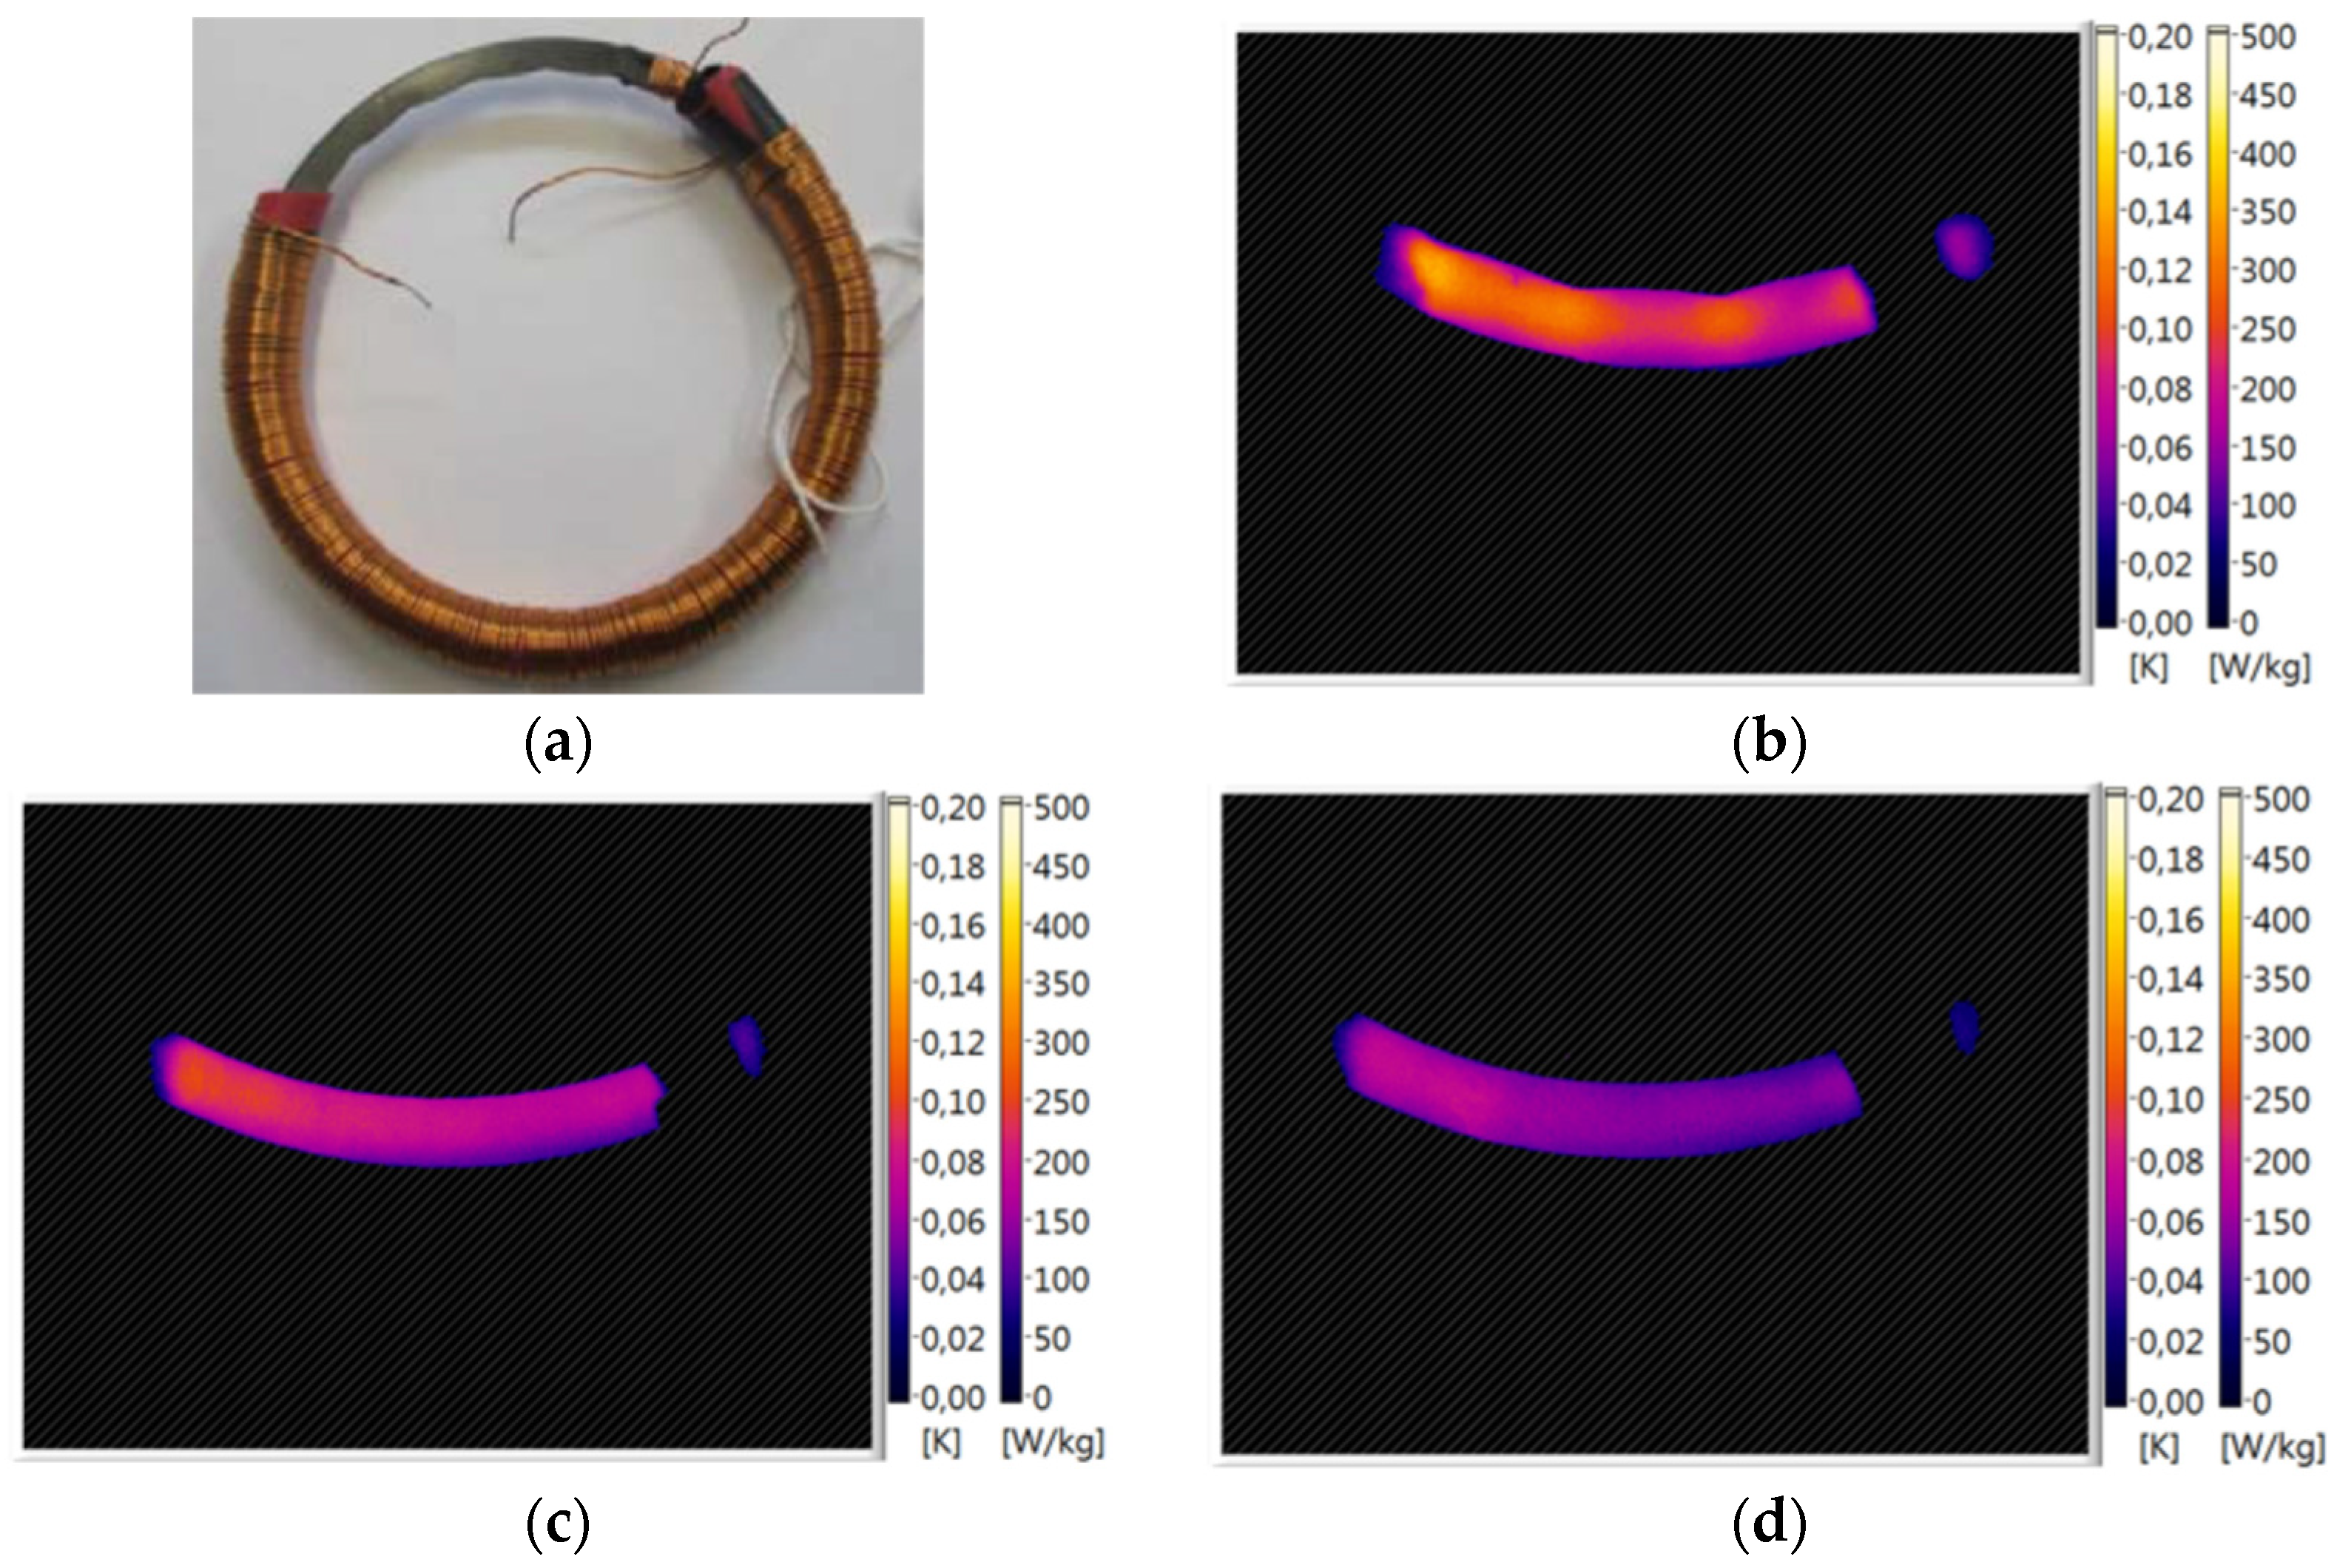
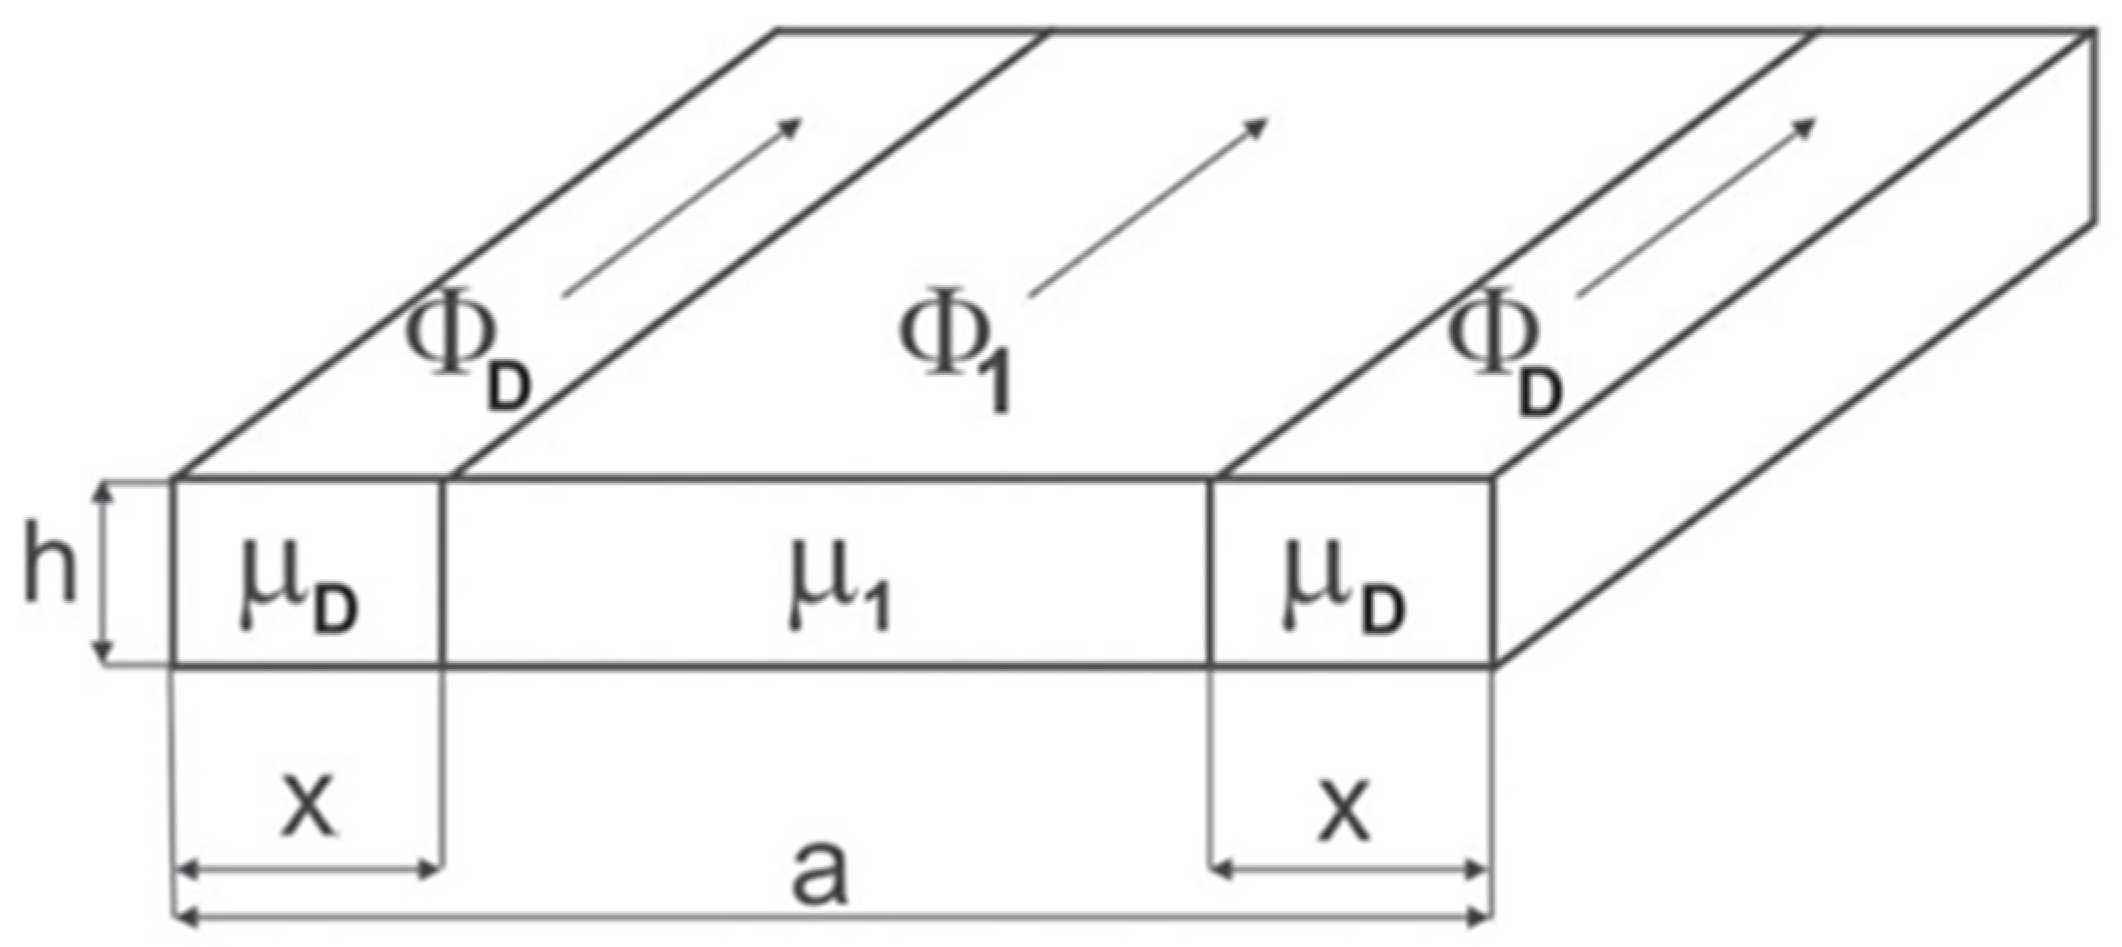
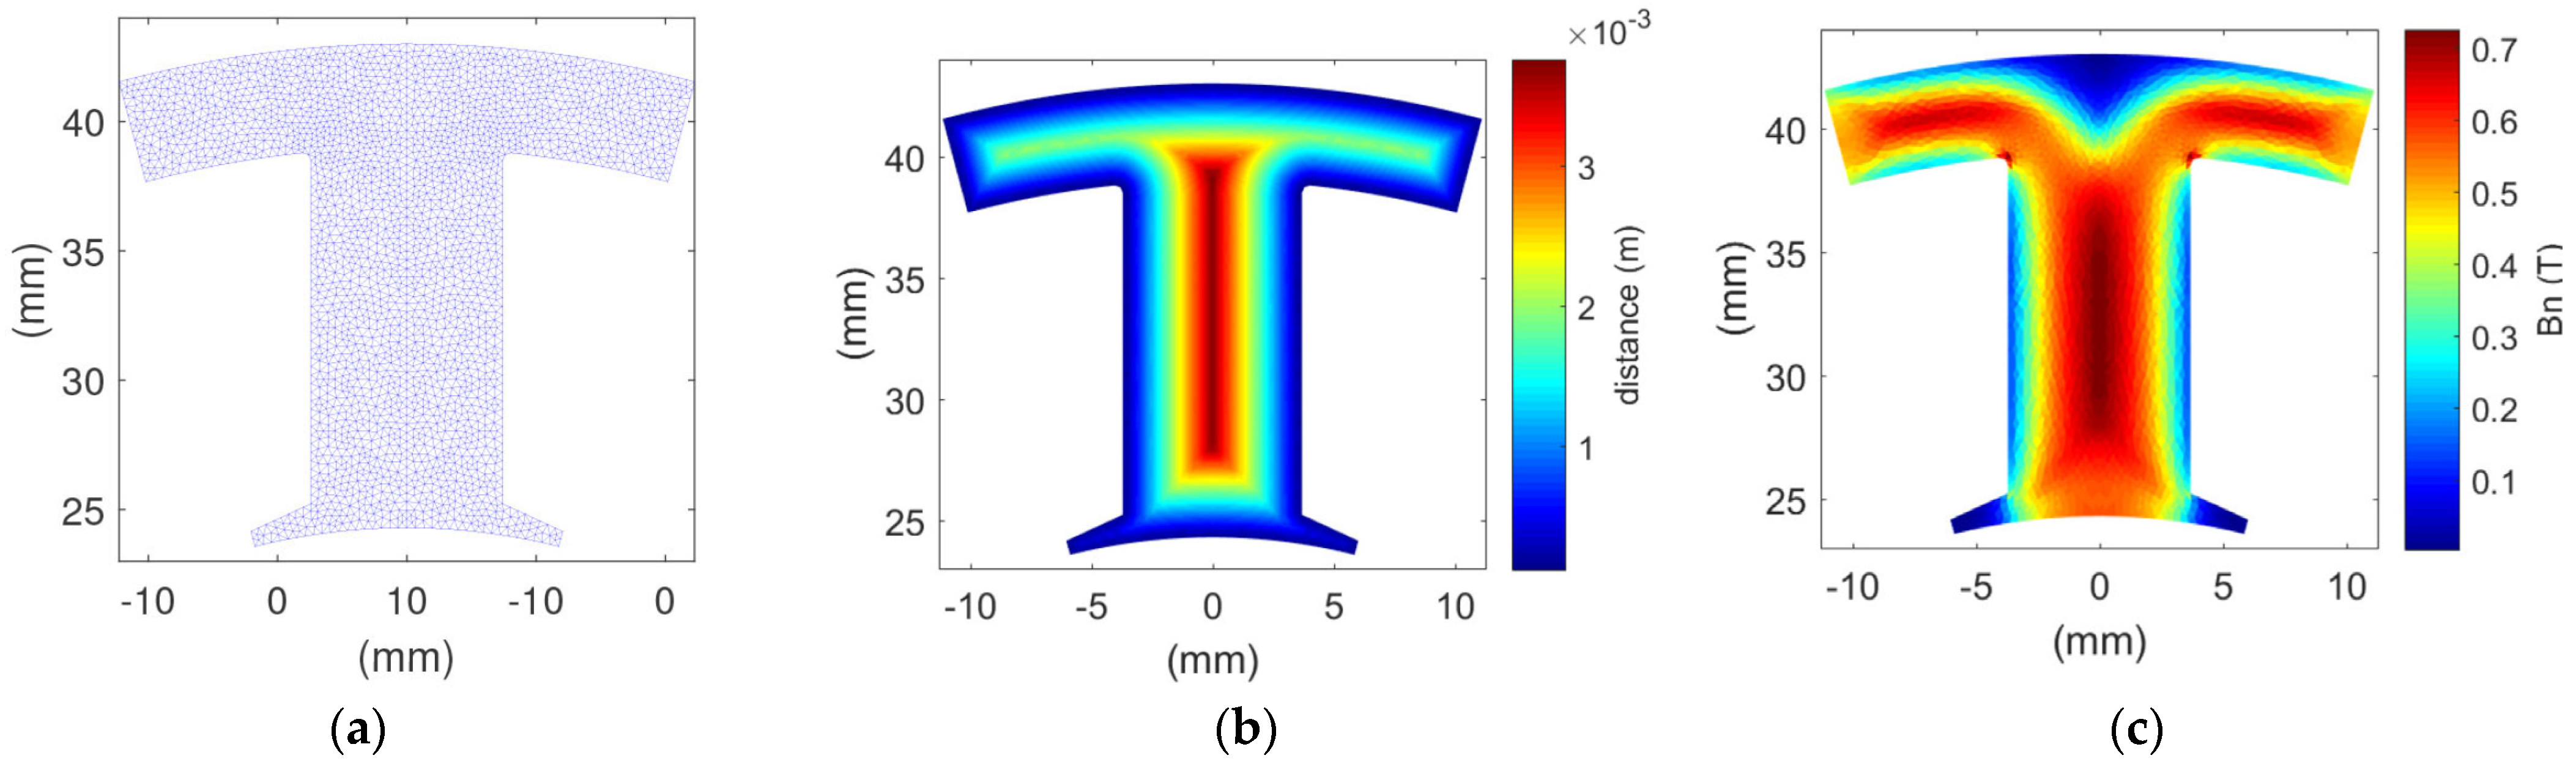
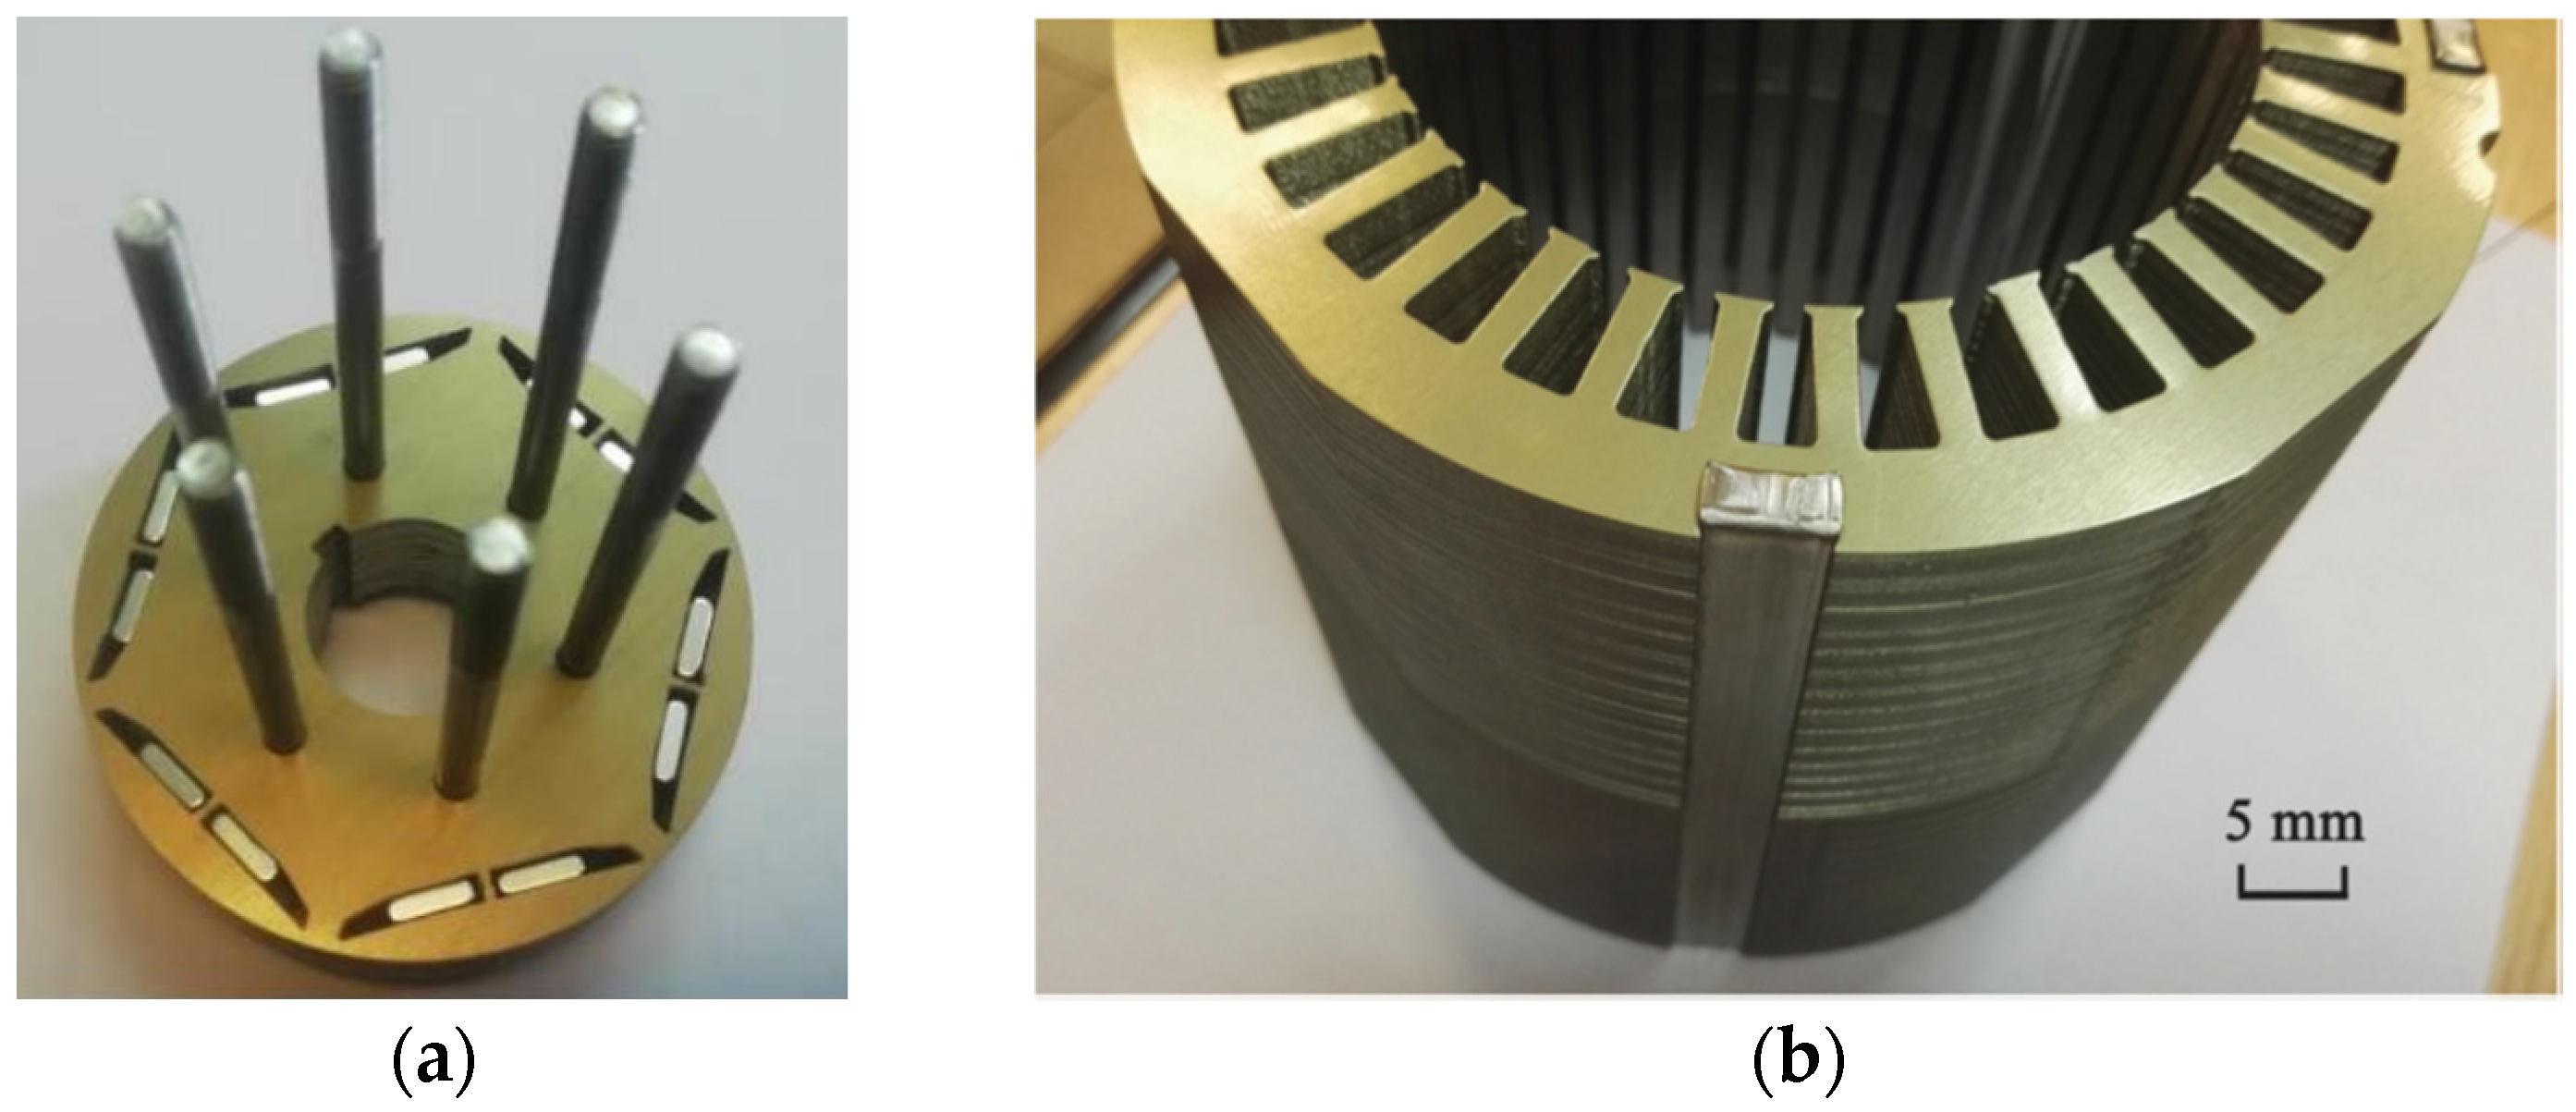
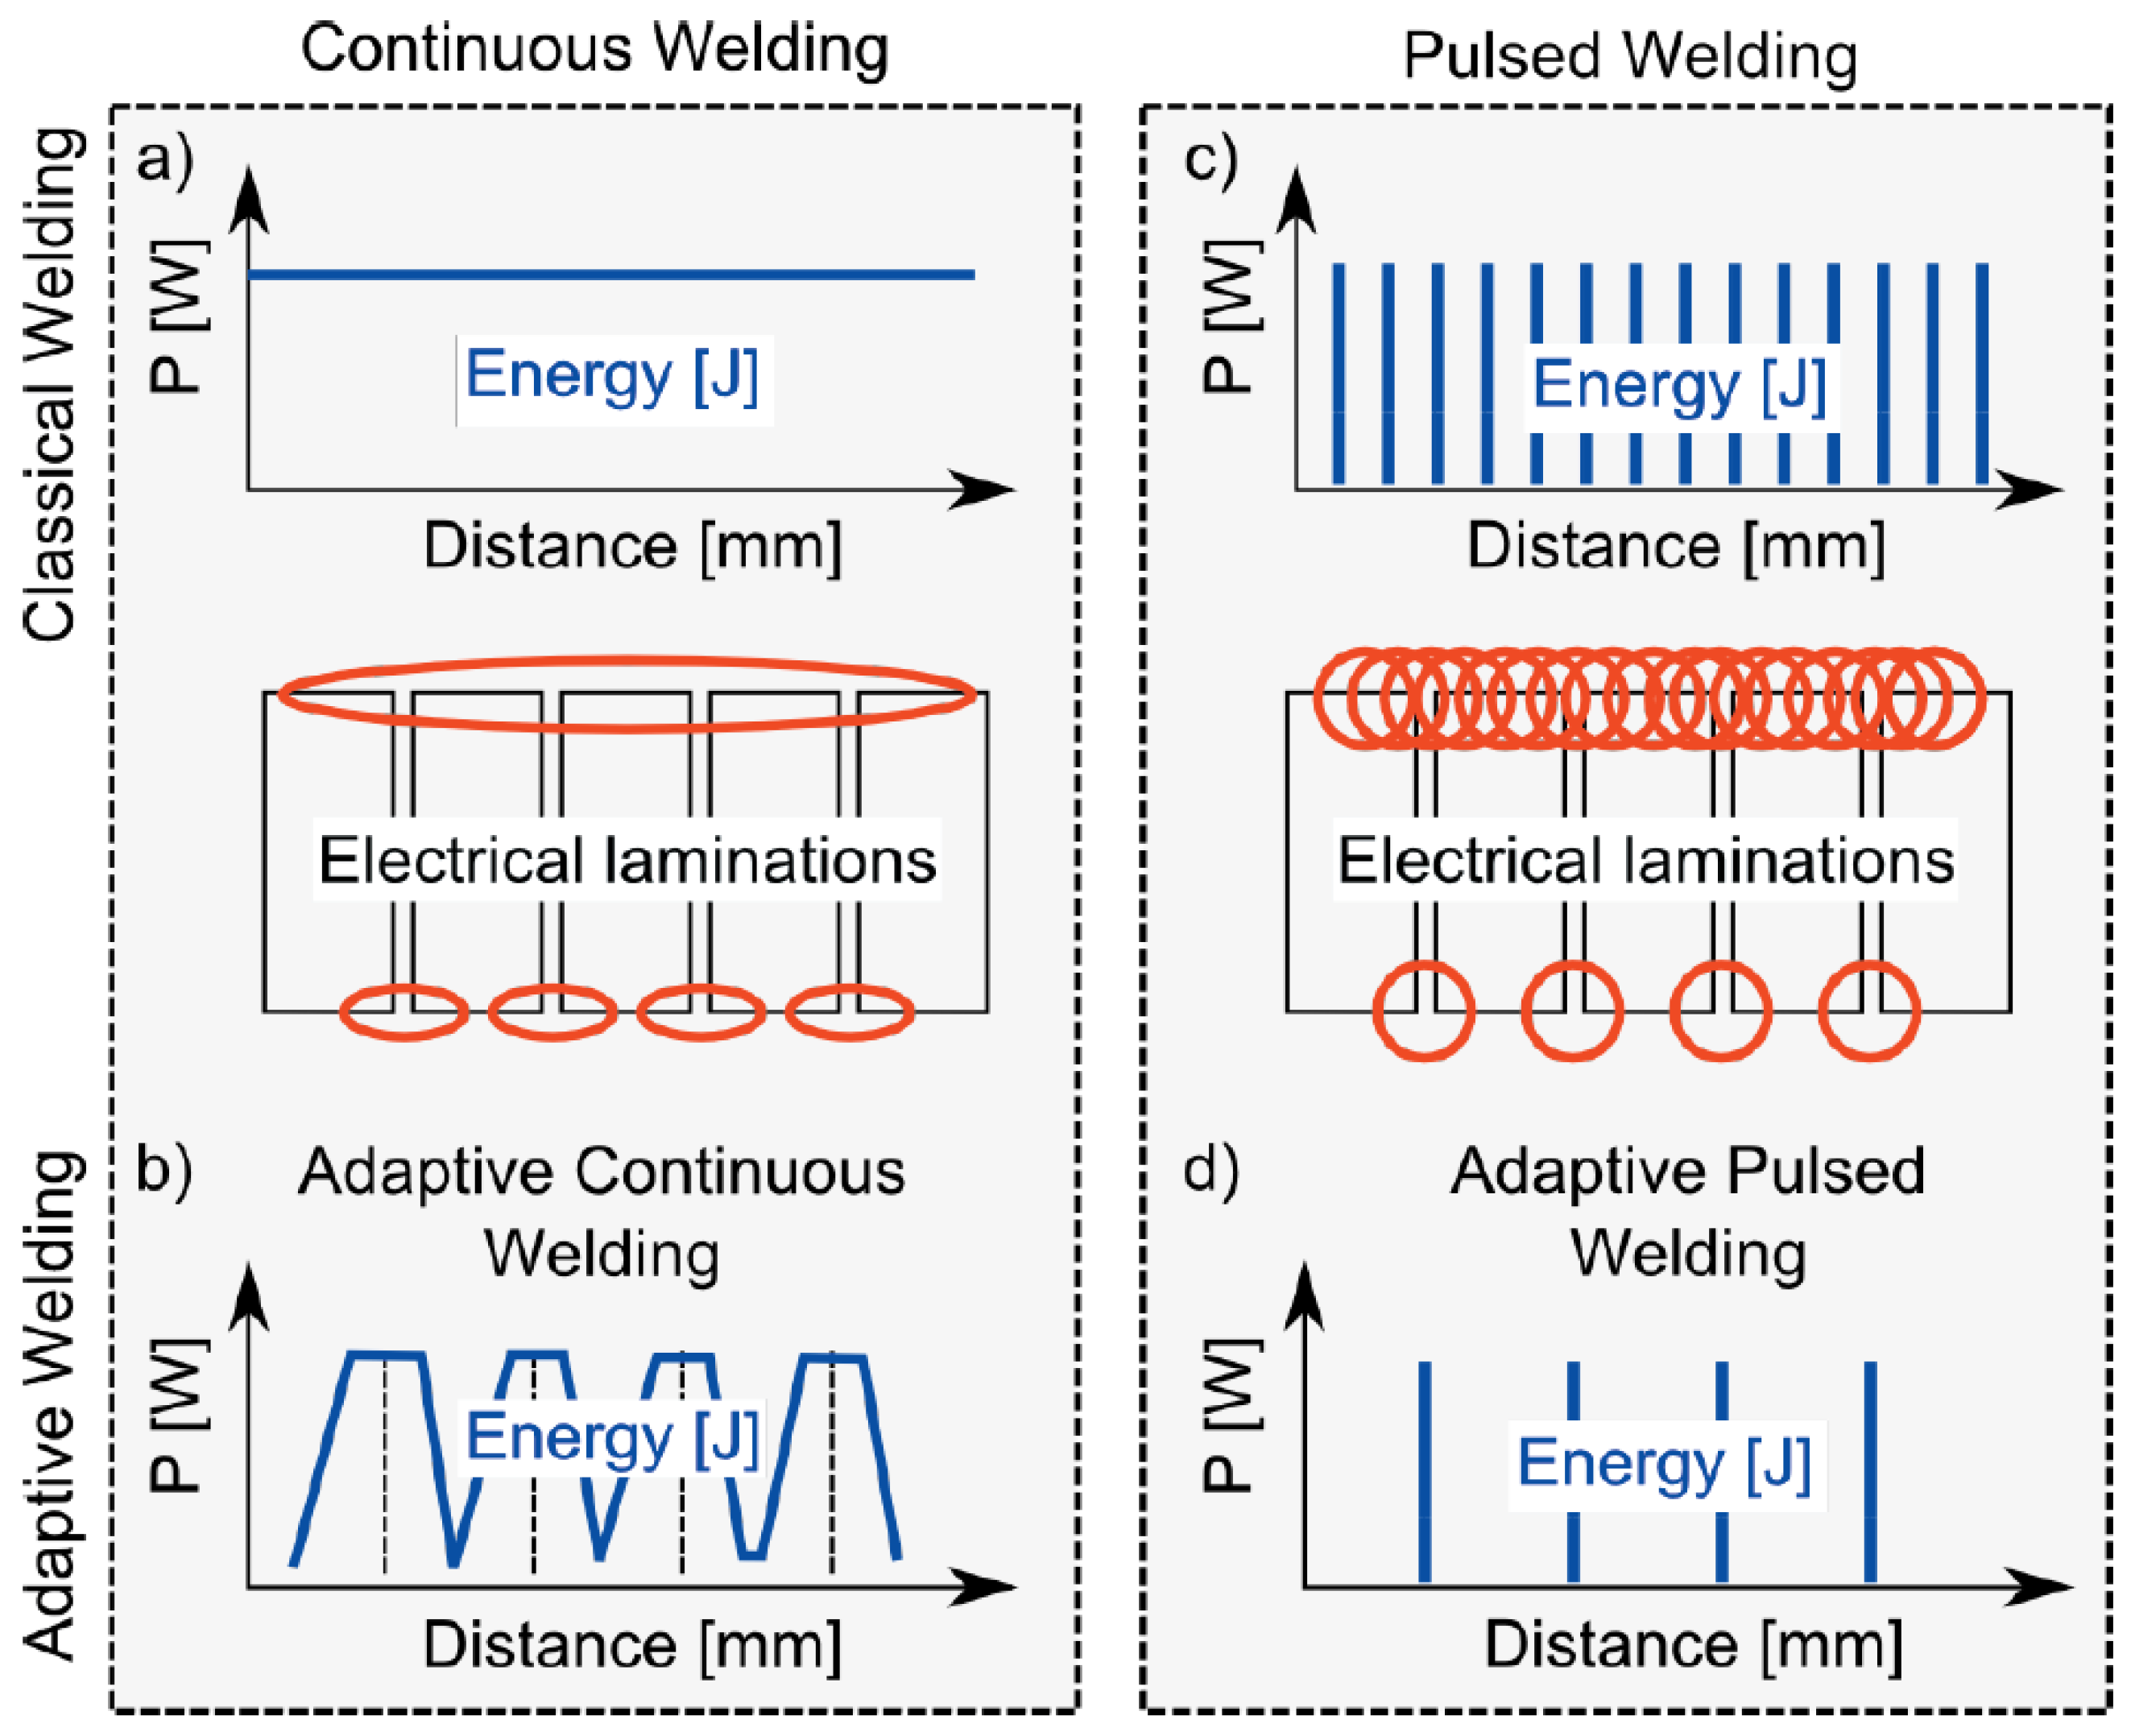
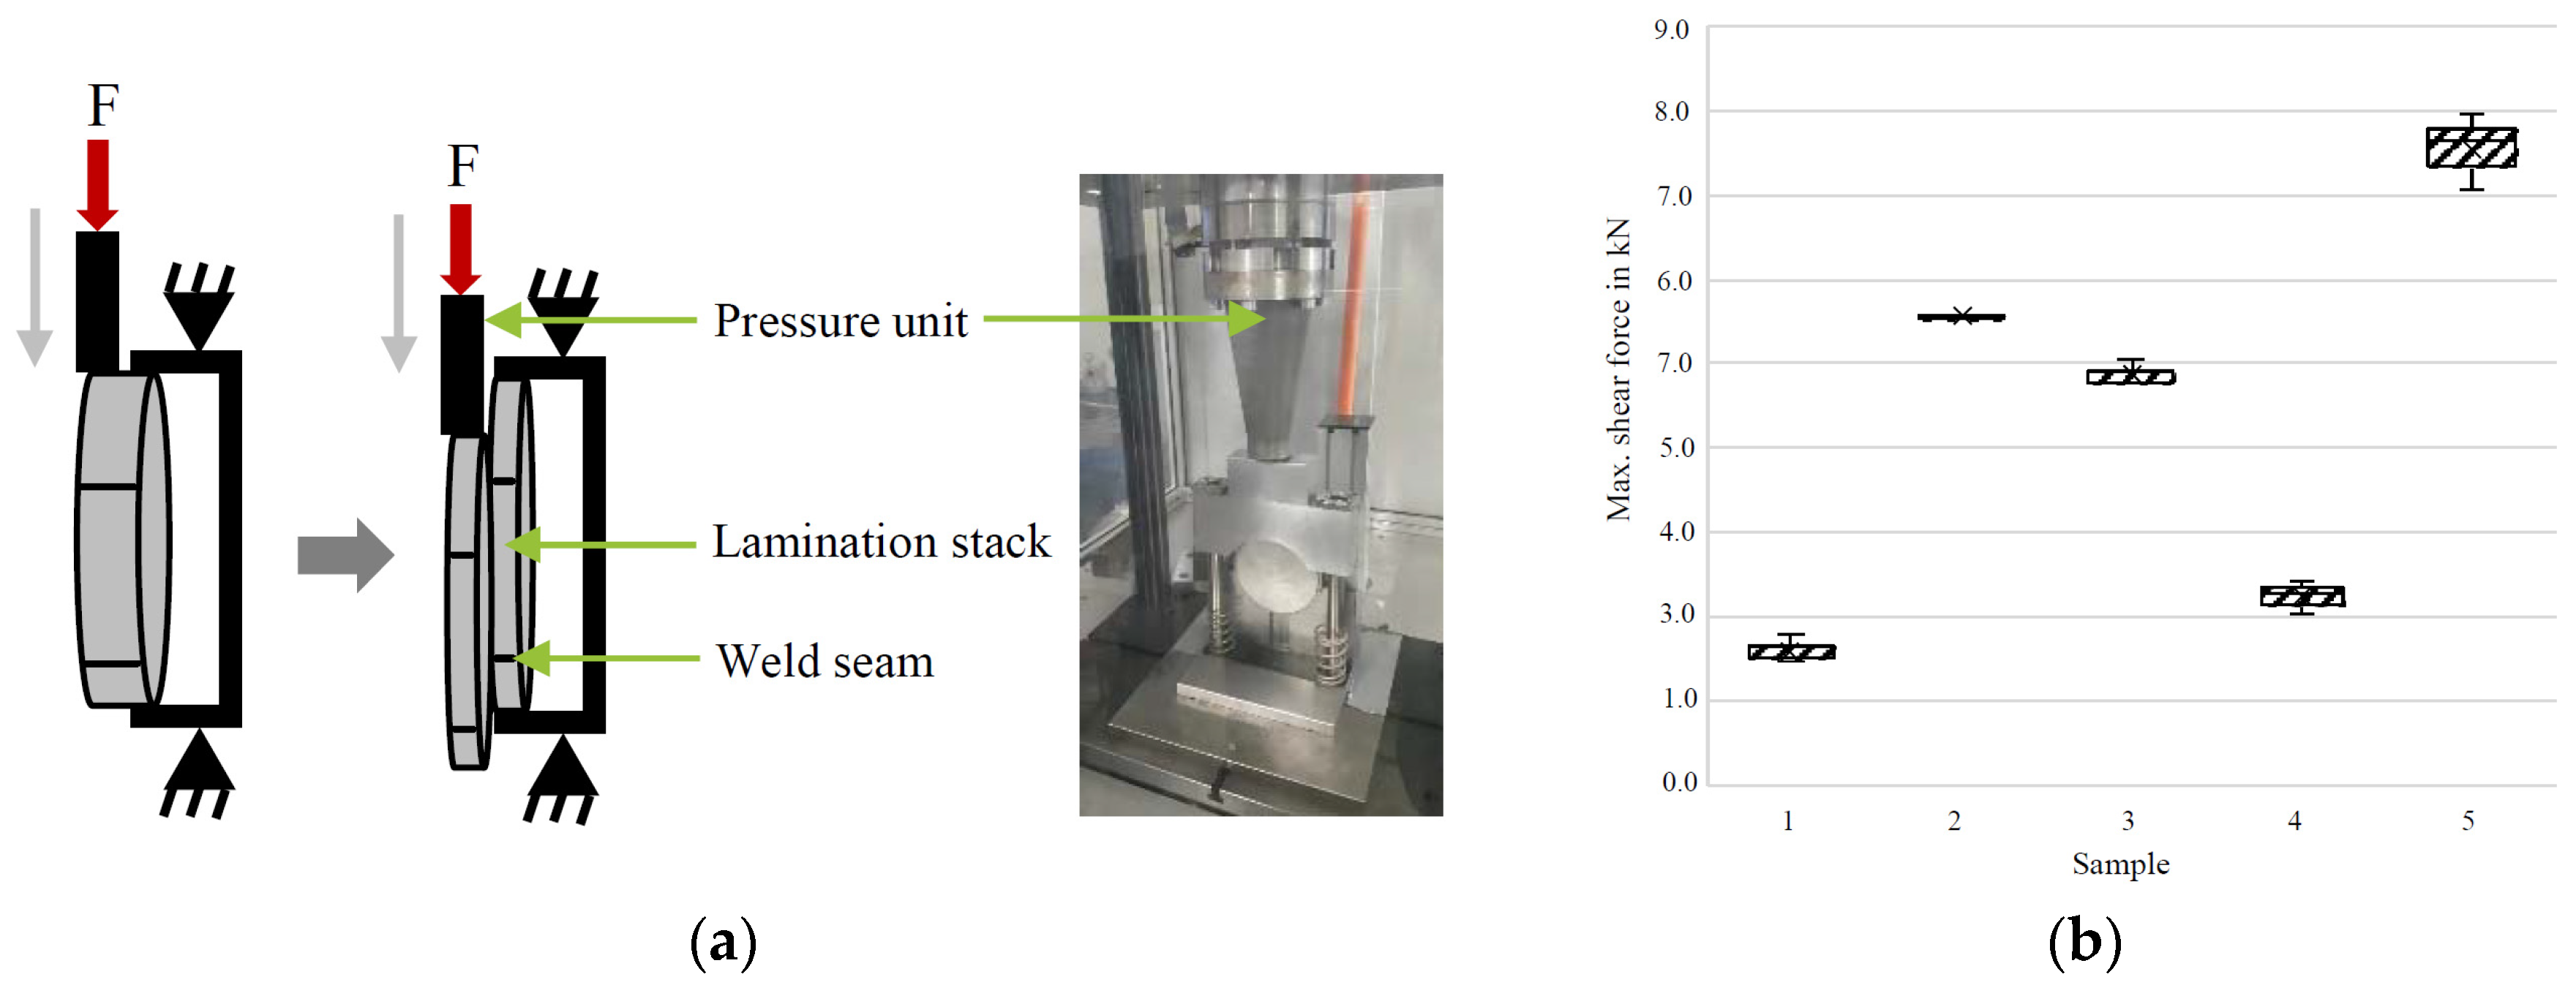
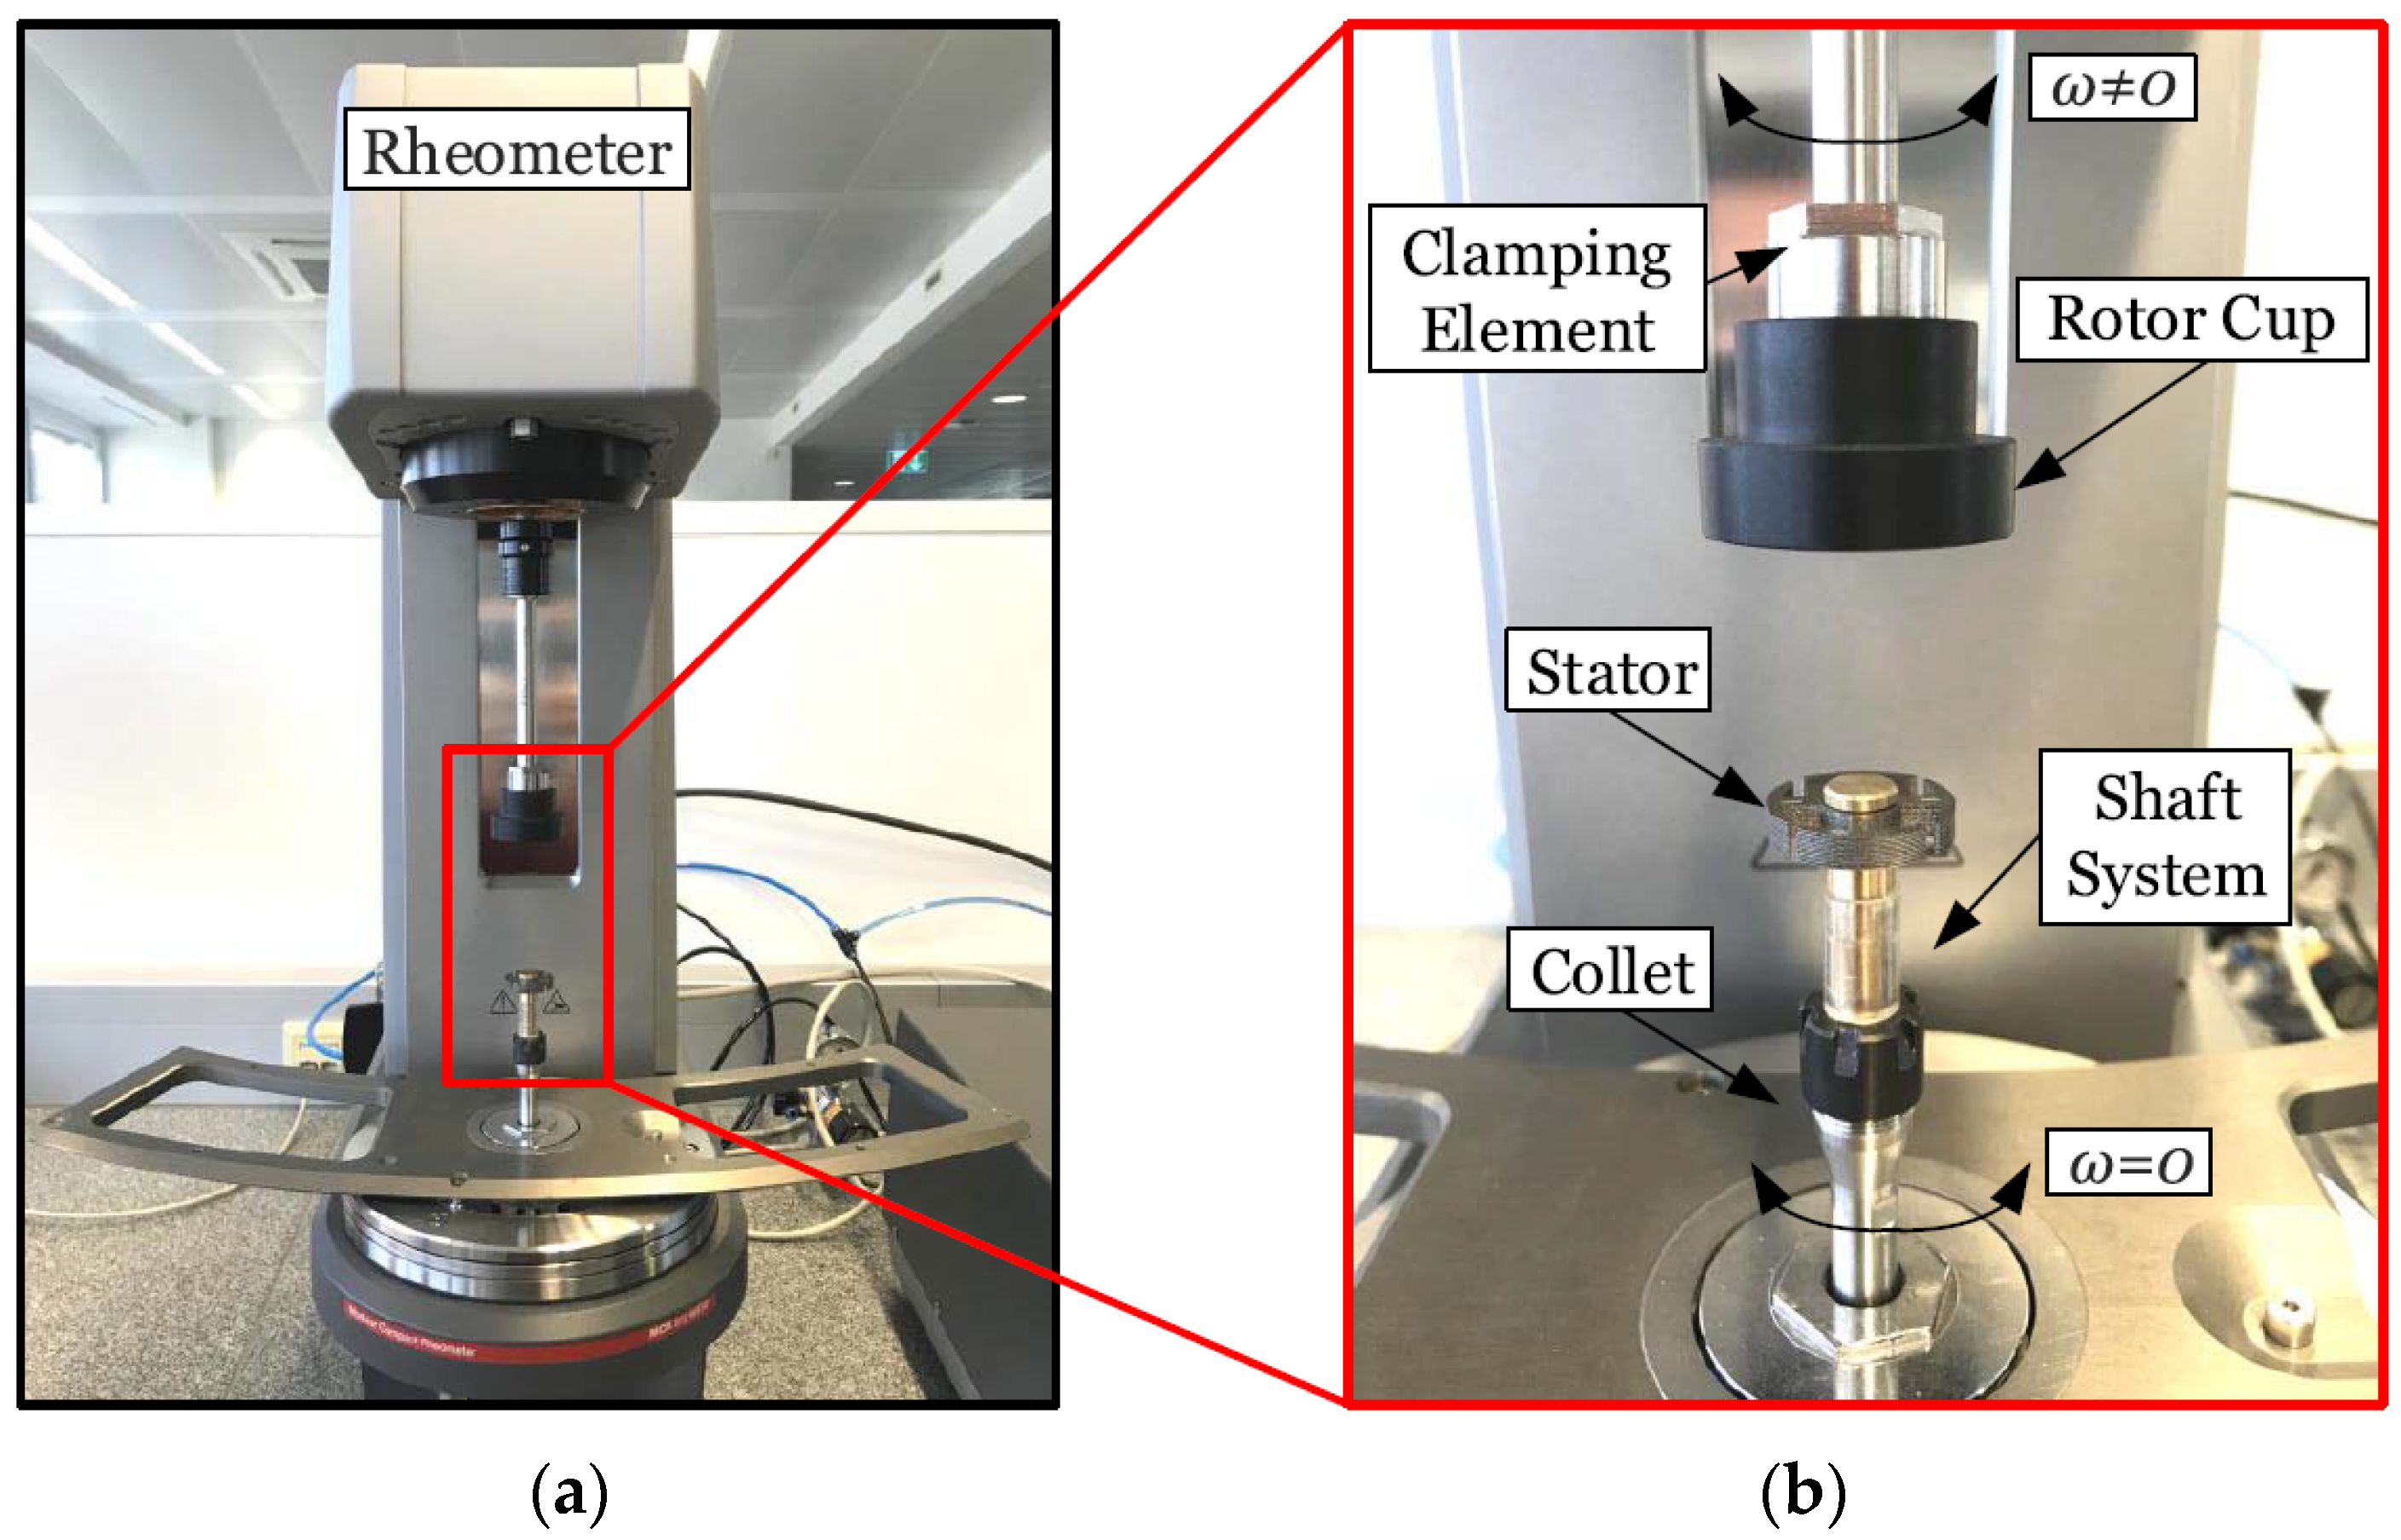
Table 1.
The comparison of measured core losses of the NO25 steel sheet using different measurement devices at conditions of 1.4 T.
Table 1.
The comparison of measured core losses of the NO25 steel sheet using different measurement devices at conditions of 1.4 T.
| Measuring Device | 50 Hz | 100 Hz | 200 Hz | 400 Hz |
|---|---|---|---|---|
| RC | 2.98 [W/kg] | 6.98 [W/kg] | 17.3 [W/kg] | 45.6 [W/kg] |
| EF | 2.19 [W/kg] | 5.09 [W/kg] | 13.2 [W/kg] | 34.2 [W/kg] |
| SST | 2.23 [W/kg] | 5.16 [W/kg] | 12.6 [W/kg] | [W/kg] |
Table 2.
The modified model for B-H curve and iron losses of the ESLs due to cutting techniques.
| REF | B-H Curve Formula | Core Losses Formula | Description |
|---|---|---|---|
| [49,50] | The authors assume that hysteresis losses are impacted by degradation. Similar assumptions were made about anomalous losses, whereas eddy current losses were thought to be unrelated to the cutting effect. | ||
| [51,52] | Data points (H, ), and (H, ) are calculated from the measured data of two samples with identical material and cutting technique but different widths, denoted by (H, ) and (H, ), where , , , and all correspond to the same magnetic field strength H. | ||
| [29] | The magnetic field strength, chemical composition, and grain size are all described by the parameters , and A. is half the width of the sample. | ||
| [53] | is degradation depth and it depends on the on the distance from the cut edge . The experimental data are used to determine the values of Both and . | ||
| [37] | - | The material parameters vary depending on the silicon content, grain size, magnetic flux density, and frequency. | |
| [15] | (Bi, Hi) is scaled to (Bi, Hi/γ(s)) | Degradation factor at the cut edge (, distance from the cut edge (s), and the depth where the effect of degradation was reduced to one third ( are depended on the experimental data.” | |
| [54] | An exponential change in permeability is assumed in the adapted model which its value decrease from the center of tooth toward the cutting line. | ||
| [55] | ---- | The degradation parameter ( must be determined through experimental data. Also, and denote the sample width and the sheet thickness, respectively. | |
| [13,14,56] | and are the distance from the cut edge and the width of the damaged zone, respectively. | ||
| [57,58,59] | and are determined by experimental data. | ||
| [9] | The term “exponential” is used to consider the physical principle that as the distance from the cut edge increases, the cutting effect should also decrease. The term with field intensity refers to limiting the punching effect to the area beneath and around the knee of the BH curve. | ||
| [60] | An exponential profile is used to describe the loss density in the compromised core. In contrast to other works, it assumes that both hysteresis and eddy current losses are impacted. | ||
| [61] | Magnetization saturation is assumed to exist regardless of cutting stress. is a material parameter that is affected by the initial susceptibility. The deteriorated susceptibility is represented by a cumulative Gumbel distribution that varies with distance to the cut edge d. With different cumulative Gumbel distributions, the loss coefficients , , , and depend on the distance to the cutting edge. |
Table 3.
Parameter setting of the investigated samples © [2023] IEEE. Reprinted, with permission, from [93].
Table 3.
Parameter setting of the investigated samples © [2023] IEEE. Reprinted, with permission, from [93].
| No. | Power | Speed | The width of Seam | Method |
|---|---|---|---|---|
| 1 | 200 (W) | 10 (mm/s) | - | Linear |
| 2 | 350 (W) | 8 (mm/s) | 0.5 (mm) | Wobbling 50 Hz |
| 3 | 750 (W) | 8 (mm/s) | 0.5 (mm) | Wobbling 50 Hz |
| 4 | 350 (W) | 8 (mm/s) | 1.5 (mm) | Wobbling 50 Hz |
| 5 | 350 (W) | 20 (mm/s) | 1.5 (mm) | Wobbling 50 Hz |
Table 4.
Varying welding parameters © [2023] IEEE. Reprinted, with permission, from [102].
Table 4.
Varying welding parameters © [2023] IEEE. Reprinted, with permission, from [102].
| Sample | Welding Strategy | Number of Seams | Power (W) | Speed (mm/s) | Contact Torque (N.m) |
|---|---|---|---|---|---|
| 1 | Linear | 8 | 600 | 50 | 40 |
| 2 | Wobbling | 8 | 600 | 12 | 120 |
| 3 | Wobbling | 8 | 600 | 12 | 40 |
| 4 | Wobbling | 4 | 600 | 12 | 40 |
| 5 | Wobbling | 8 | 650 | 10 | 40 |
Disclaimer/Publisher’s Note: The statements, opinions and data contained in all publications are solely those of the individual author(s) and contributor(s) and not of MDPI and/or the editor(s). MDPI and/or the editor(s) disclaim responsibility for any injury to people or property resulting from any ideas, methods, instructions or products referred to in the content. |
© 2023 by the authors. Licensee MDPI, Basel, Switzerland. This article is an open access article distributed under the terms and conditions of the Creative Commons Attribution (CC BY) license (https://creativecommons.org/licenses/by/4.0/).
Share and Cite
MDPI and ACS Style
Mahmouditabar, F.; Baker, N. A Review on the Effect of Electrical Steel Manufacturing Processes on the Performance of Electric Machines. Energies 2023, 16, 7954. https://doi.org/10.3390/en16247954
AMA Style
Mahmouditabar F, Baker N. A Review on the Effect of Electrical Steel Manufacturing Processes on the Performance of Electric Machines. Energies. 2023; 16(24):7954. https://doi.org/10.3390/en16247954
Chicago/Turabian StyleMahmouditabar, Farshid, and Nick Baker. 2023. "A Review on the Effect of Electrical Steel Manufacturing Processes on the Performance of Electric Machines" Energies 16, no. 24: 7954. https://doi.org/10.3390/en16247954
Note that from the first issue of 2016, this journal uses article numbers instead of page numbers. See further details here.