

An Effective Strategy for Monitoring Slagging Location and Severity on the Waterwall Surface in Operation Coal-Fired Boilers

1
Institute of Thermal Science and Power Systems, Zhejiang University, Hangzhou 310027, China
2
Department of Energy and Environment System Engineering, Zhejiang University of Science and Technology, Hangzhou 310023, China
3
State Key Laboratory of Clean Energy Utilization, Institute of Thermal Power Engineering, Zhejiang University, Hangzhou 310027, China
4
Zhejiang Province Energy Group Co., Ltd., Hangzhou 310007, China
*
Author to whom correspondence should be addressed.
†
These authors contributed equally to this work.
Energies 2023, 16(24), 7925; https://doi.org/10.3390/en16247925
Submission received: 1 November 2023
/
Revised: 27 November 2023
/
Accepted: 4 December 2023
/
Published: 5 December 2023
(This article belongs to the Special Issue Prospects in Power Boilers: Heat Transfer, Advanced Materials and Innovative Technologies)
Abstract
:It is of great importance to obtain the exact location and severity of slagging deposits on the waterwall surface of an operational boiler to avoid aimless soot-blowing and reduce steam consumption. In this paper, an effective waterwall surface temperature monitoring method is proposed to determine the slagging locations. It has been noted that the temperature difference of the waterwall surface before and after soot-blowing varied with the waterwall location, with more than 80 °C covered with slag and less than 20 °C found clean. According to this, a slagging temperature index was developed to describe the severity of slagging deposits on the waterwall surface. Results indicated that the process of slagging deposit growth included four stages, with the slagging temperature fluctuating in the range of about 90–110 °C in stage III, followed by a rapid drop below 60 °C in stage IV. Furthermore, a digital image monitoring system was used to validate the slag growth process and study the relationship between deposit thickness growth and area expansion. This novel approach provides automated and accurate guidance for each soot blower around the furnace, which reduces soot-blowing steam consumption and avoids serious slagging on the waterwall surface.
1. Introduction
As long as clean energy can only provide a power supply under base load and its intermittent characteristics pose significant challenges to the power grid [1], large pulverized coal boilers will still play an important role in China’s power supply. Especially with advancements in larger capacity, higher parameters, ultra-low emissions, and deep peak load cycling, large pulverized coal boilers exhibit high efficiency, low pollution, and a wide load cycling range [2]. In pulverized coal boilers, the pulverized coal enters the furnace from the burners with the primary air. Due to the aerodynamic field in the furnace, along with the local reducing atmosphere and particle size of pulverized coal [3], the incomplete burnt and massive coal ash particles can diffuse to the waterwall surface of the furnace through inertial impaction, diffusion, and thermal electrophoresis [4]. When the inertial force of coal ash particles colliding with the waterwall surface becomes lower than the adhesion force, the particles deposit and adhere, leading to slagging on the surface of the waterwall [5,6]. The slagging on the heating surface hampers heat exchange, causing higher flue gas temperatures at the furnace and boiler outlets. This, in turn, adversely affects the control of steam parameters and boiler efficiency. Under the influence of the local reducing atmosphere and high temperatures, the slagging area or thickness in a specific location may increase exponentially. The gradually formed large slag blocks will fall off when they reach a certain weight or are disturbed by the airflow in the furnace, which may damage the heating surface at the bottom of the furnace or cause abnormal changes in the negative pressure of the furnace. In serious cases, it may cause the boiler Main Fuel Trip (MFT) or other safety accidents [7,8].
The severity of slagging varies at different locations within the furnace during boiler operation. Due to the multitude of physical and chemical processes occurring in the growth of ash deposits and slagging, accurately obtaining the location and severity of slagging within the high temperature and dust environment of the furnace is challenging. Degereji et al. [9] used a numerical model to predict ash deposition rates in the burner region of a coal-fired furnace and derived a numerical slagging index. Fan et al. [10] developed a model to simulate deposit growth under slagging conditions and predicted the deposit growth behavior in a pulverized coal-fired boiler. Zhou et al. [11,12,13,14,15] developed a model of ash deposition growth that consists of a comprehensive combustion code to predict the deposition growth behavior and applied a digital image technique to monitor the slagging characteristics in a pilot-scale furnace. On the basis of Zhou et al.’s work, Liu et al. [16] established a unified model for predicting ash deposition behavior based on the Open Field Operation And Manipulation (OpenFOAM) open-source computing software and calculated the deposition process of slagging particles. However, these studies were based on theoretical calculations or laboratory conditions, and there was a lack of research on the slagging development process in the actual operation of coal-fired boilers.
Steam soot-blowing is the most common method to solve the problem of slagging on the heating surface in the furnace. The high-speed steam jets formed by high-pressure steam under the action of Venturi cause the slagging blocks to break into small pieces and fall off [17,18]. To provide more information about the slagging status of heating surfaces to boiler operators in real time, extensive studies have been performed by scholars regarding the methods for judging the location and severity of slagging on heating surfaces in furnaces. Many researchers [19,20,21,22,23] adopted a thermodynamic model and a neural network model to monitor the cleanliness factor (CF) of the heating surfaces and developed soot-blowing optimization systems for soot-blowing frequencies and duration optimization. However, the method is not applicable to the waterwall. Zhou et al. [24] determined the location and mass of the slag-off in the furnace by matrixing temperature measuring points arranged in the slag extractor, but it was only applied once the slag was falling off. Flue gas temperature and heat flux, which are widely used direct measurement techniques, serve as fundamental principles for several other methods. Scholars [25,26,27,28,29] installed infra-view thermometers or adopted acoustic pyrometry to monitor the flue gas temperature of the furnace exit or near the heat surface, indicate the extent of slagging, and manage the operation of the soot blower subgroups. Other scholars [23,30,31] installed heat flux meters distributed on the waterwall, predicted the slagging deposits and cleanliness evolution of the waterwall in coal-fired boilers, and developed advisory tools to recommend soot-blowing. However, the measurement of the flue gas temperature can only judge the overall slagging degree and fails to indicate the distribution of slagging. On the other hand, heat flux measurement, although capable of capturing heat transfer, gives rise to potential structural concerns as heat flow meters have to be welded to the waterwall tube. In addition, both approaches are hindered by limitations in installation numbers and maintenance difficulties for the measurement elements, not to mention the large measurement errors. Neither method seems satisfactory.
If the exact location and thickness of slagging on the heating surface in real-time cannot be determined, the operation of the steam soot-blowers is aimless. Reducing the soot-blowing frequency may cause a continuous evolution of the slagging process and deteriorate the heat transfer of the heating surface further. Frequent soot-blowing will certainly lead to the waste of steam and reduce the efficiency of the power plant [31]. Such a long-term situation may cause metal thinning of the heating surface, increasing the risk of pipe explosion. Thus, this work initially proposed an effective method for monitoring the local area’s slagging deposit growth by direct measurement of the waterwall temperature in the furnace. The quantitative characterization indexes of different slagging severity on the waterwall surface in the operation boiler were obtained by studying temperature variation trends between successive soot-blowing. The growth processes of slagging deposit growth were divided into four stages according to the variation trend of the quantitative characterization index, which can be used as the principle for soot-blowing operations. A slagging digital image monitoring method was used to validate the above results and study the relationship between thickness growth and area increase in the slagging deposit process. These methods have been successfully applied to coal-fired boilers to monitor the slagging location and severity of the waterwall surface and to optimize the soot-blowing strategy for each soot blower around the furnace.
2. Model and Methods
2.1. Mathematical Description of the Effect of Slagging on Waterwall Surface Temperature
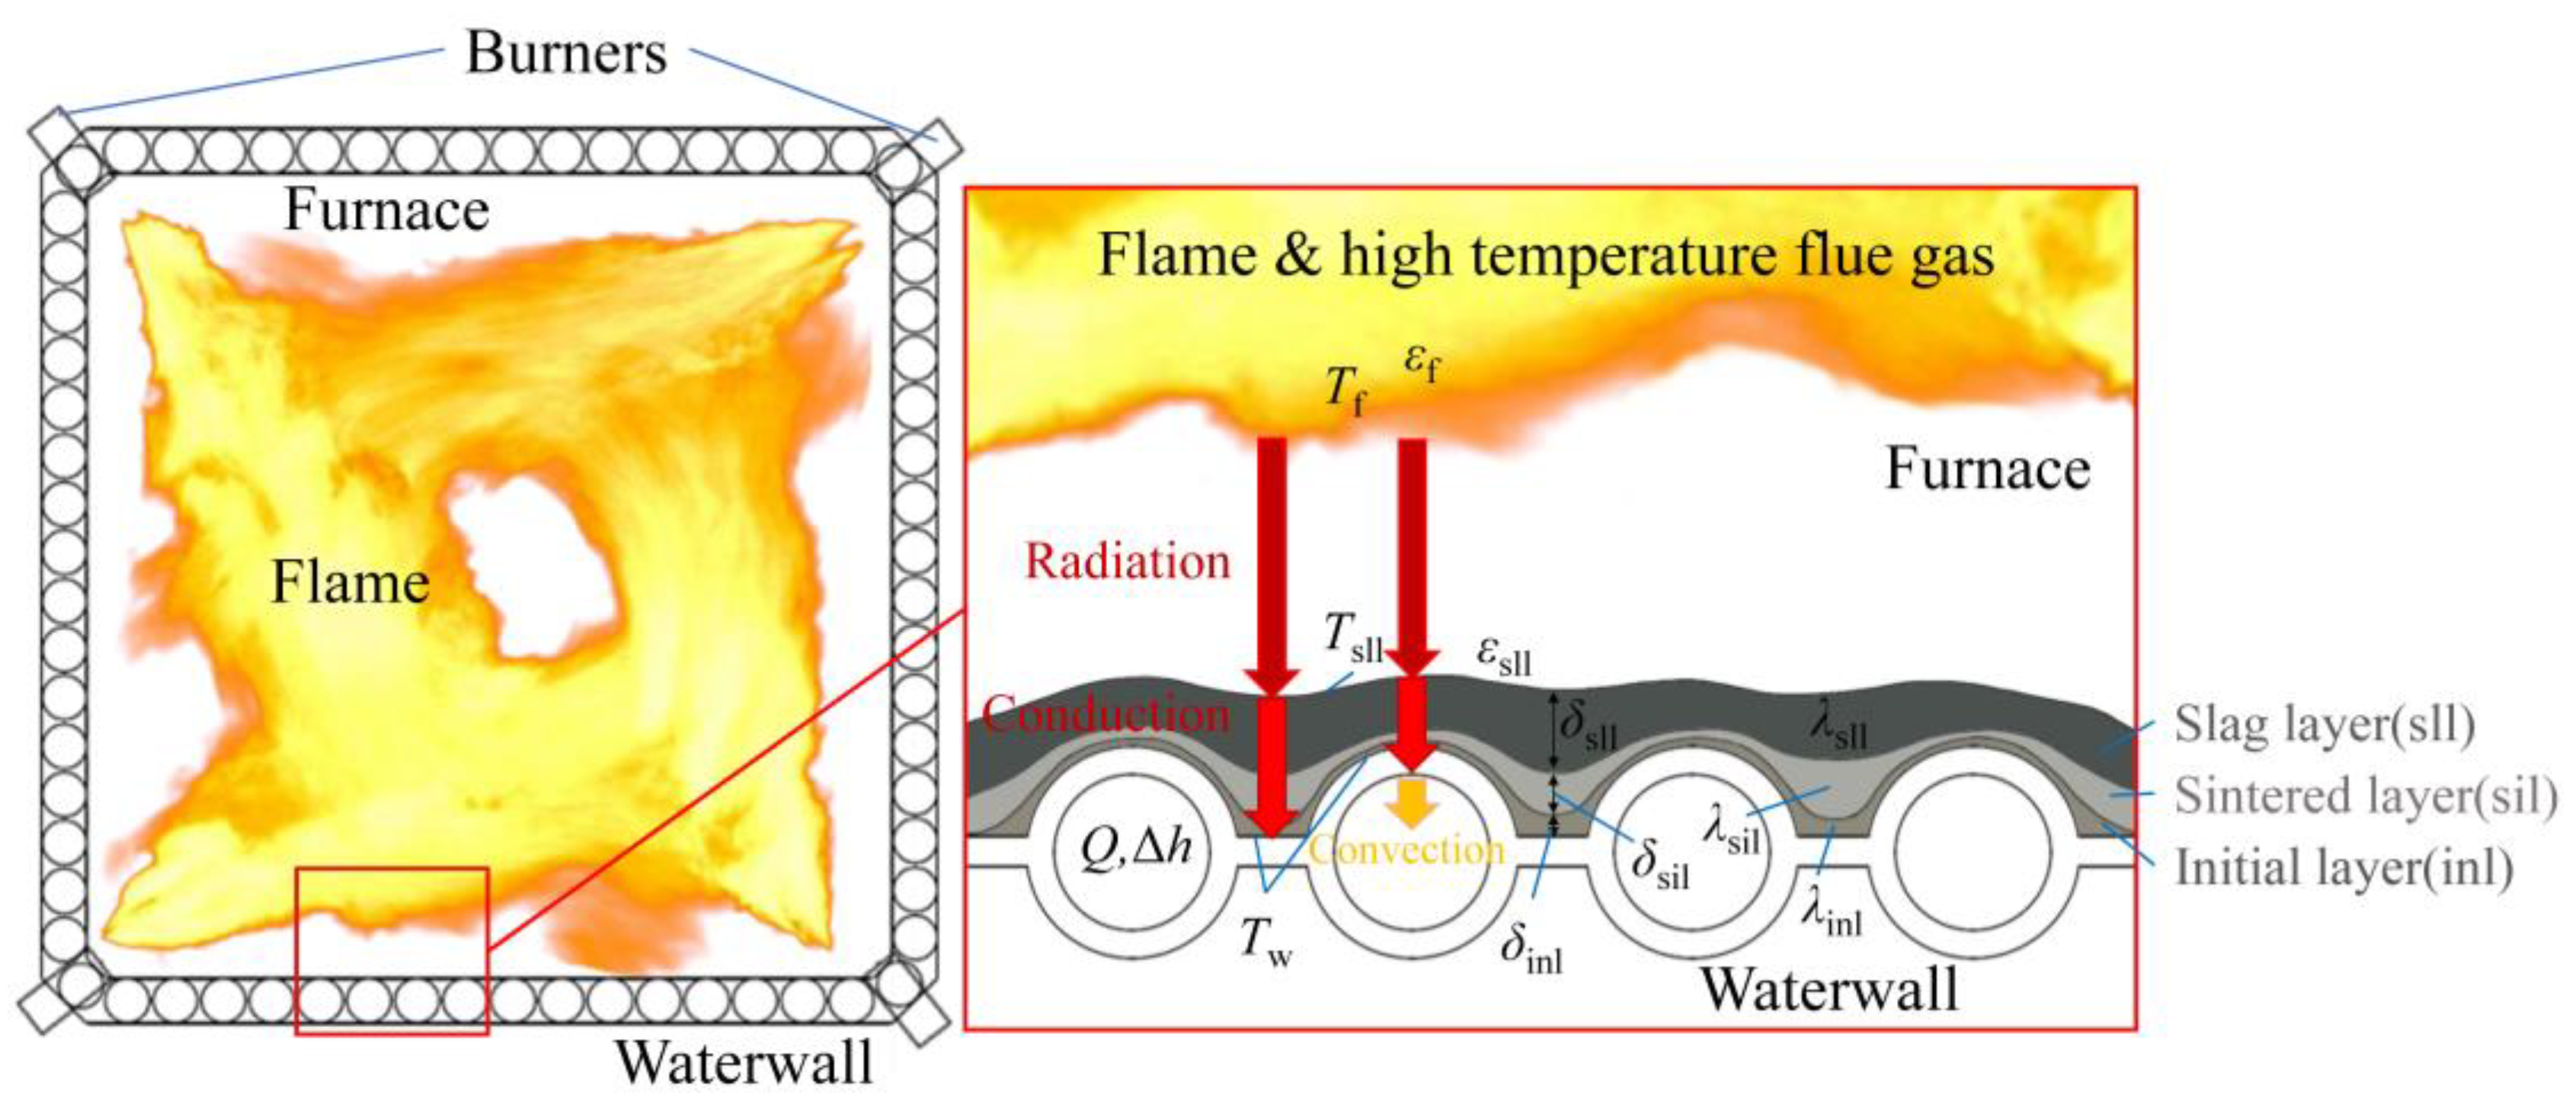
The slagging deposits on the heating surface can be divided into three layers according to different compositions, porosities, and microstructures. Along the slagging growth direction, there are the initial layer, the sintered layer, and the slag layer in sequence, as shown in Figure 1. Some scholars [12,13,14,15,32,33,34] had observed this phenomenon and studied the characteristics of the different deposit layers. However, due to the slag occurring in the furnace of the boiler, it was impossible to obtain the specific slag on the waterwall surface unless the slag had fallen off. Table 1 shows the chemical composition of the fallen-off slag in the coal-fired boiler as well as the fired coal in this study. Apparently, the slag contains a great quantity of Si and Ca elements, mainly in the form of quartz and anhydrite [35,36,37], which have a low thermal conductivity.
The flame temperature in the center of the furnace can reach more than 1500 °C during the coal-fired boiler operation. The radiation heat transfer of the triatomic gas of the high-temperature flue gas to the surface of the waterwall around the furnace is very strong, accounting for the majority of the heat transfer in the furnace. The effect of convective heat transfer can be ignored [38,39]. Based on the assumption of radiative heat transfer between two planes filled with a medium, the radiation intensity of the flame is weakened by the absorption and scattering of the medium in the furnace. The following equation can be used to describe the radiant heat transfer between the furnace flame and the waterwall surface, considering the absorption, self-radiation, and scattering of the medium [40]:
where σ is the blackbody radiation constant, with the value σ = 5.67 × 10⁻⁸ W/(m2·K4); Aw is the surface area of a specific area of the waterwall receiving flame radiation; Xf,w is the radiation angle coefficient of the flame to the surface of the waterwall; Tf and Tw are the temperature of the flame and waterwall surface, respectively; k is the attenuation coefficient; Rw is the equivalent radius of the radiation from the flame to the surface of the waterwall; and εf and εw are the emissivity of the flame and waterwall surface, respectively.
Once the slag is deposited on the surface of the waterwall, the radiation transfer from the furnace flame to the waterwall surface becomes its radiation transfer to the surface of the slag layer. Thus, Equation (1) can be described as follows:
where Asll is the surface area of the slagging layer on the surface of the specific area receiving flame radiation; Xf,sll is the radiation angle coefficient of the flame to the slagging layer; Rsll is the equivalent radius of the radiation from the flame to the slagging layer; and Tsll and εsll are the surface temperature and emissivity of the outer layer (the slag layer), respectively.
The thermal conductivity of the metal materials of the waterwall is high, so the temperature of the waterwall at different locations is a little different compared to the temperature difference between the flame and the waterwall. Considering the temperature difference between the flame and the waterwall surface was larger, the heat transfer in parallel to the waterwall surface in the slagging deposit layers was relatively small and could be ignored. The thermal conduction inside the slagging deposit layers can be regarded as thermal conduction only toward the surface of the waterwall. The thermal conduction quantity inside the slagging deposit layers can be described by approximating the plane heat transfer equation as follows:
where A is the thermal conduction area from the slagging layer to the waterwall surface; δsll, δsil, δinl, and λsll, λsil, λinl are the thickness and thermal conductivity of the slag layers, the sintered layer, and the initial layer, respectively.
Ignoring the heat transfer of the waterwall to the outer side of the furnace, the heat absorption accepted by the working medium in the waterwall tube in the specific local area is given by:
where n is the number of waterwall tubes in the specific local area; q is the mass flow of the working medium in the tube; and Δh is the enthalpy increments of the working medium in the specific local area.
With the principle of conservation of energy, for a specific local area of waterwall, the heat transfer process is:
For a specific local area of the waterwall surface:
According to Equations (1)–(8) and eliminating the Tsll, the waterwall surface temperature can be described as follows:
Apparently, the waterwall surface temperature decreases with the increase in the thickness or the decrease in the thermal conductivity of different slagging deposit layers; thus, it can directly and quickly reflect the location and severity of slagging on the surface of the waterwall in a furnace.
2.2. A Waterwall Surface Temperature Monitoring Method
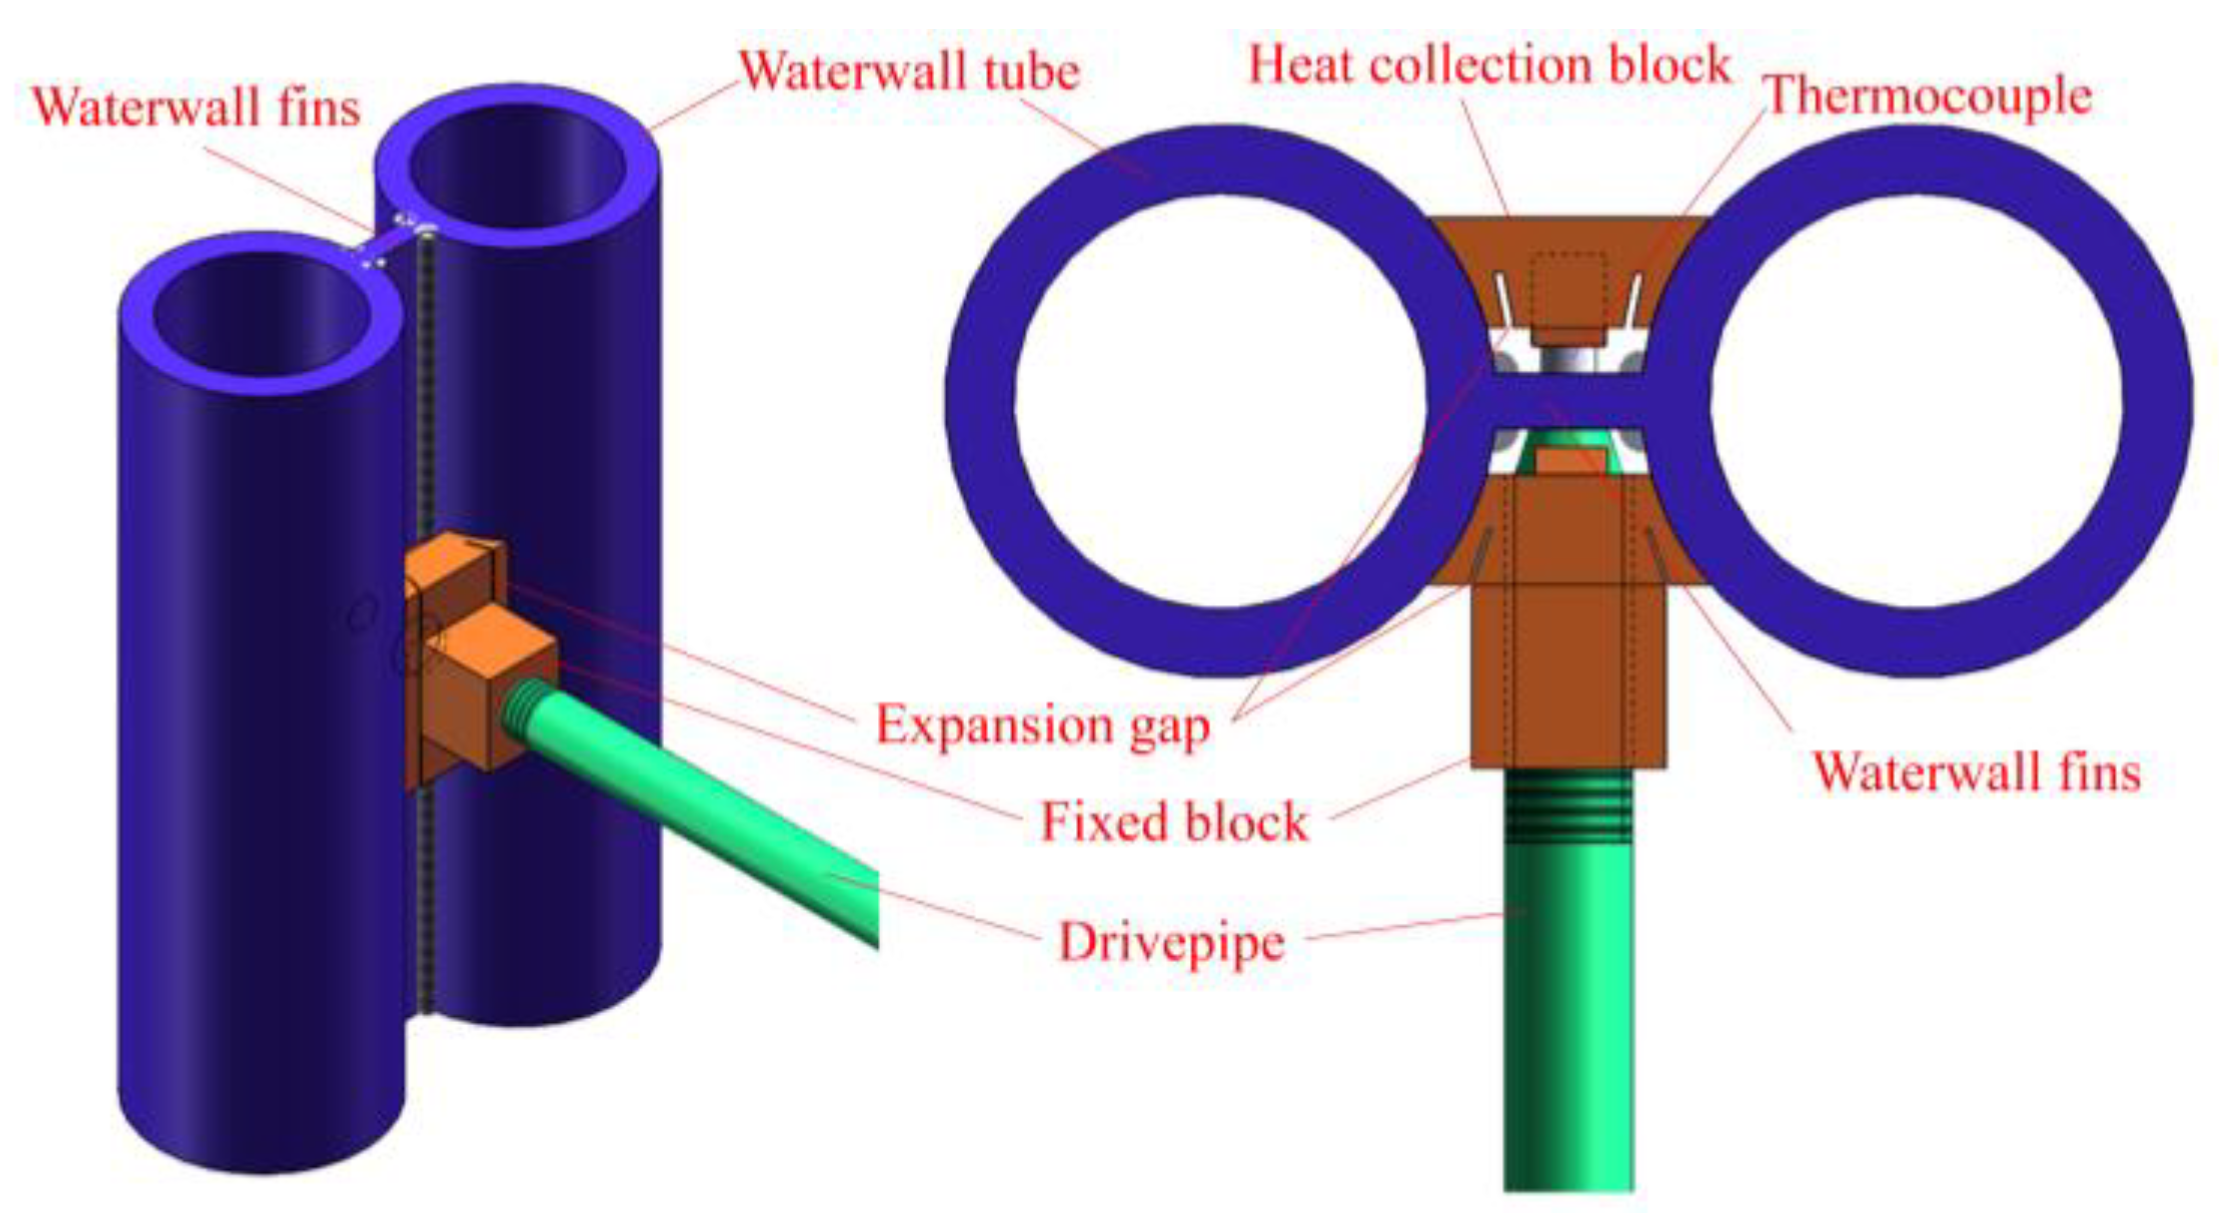
Under high temperatures and a dusty environment in a furnace, thermocouples are easily burned out or worn out, leading to a short service life. It is the main reason scholars used indirect measurement methods to monitor the slagging instead of direct measurement methods. As shown in Figure 2, in the proposed new method, a thin metallic heat collection block covers the fin in the middle of the two adjacent tubes of the waterwall in the furnace. The thermocouple passed through a perforation in the fin from the outside of the furnace and was inserted into the measuring hole in the heat collection block, which was protected from direct radiation and dust collisions in the furnace by the heat collection block. On the other side, the thermocouple is fixed and protected by a metallic fixing block and drivepipe outside the furnace. In this method, the heat collection blocks and the fixed blocks were made of the same material as the fins and only welded with the fins at the top and bottom sides of the blocks, avoiding the adverse influence of direct welding on the metal structure of the waterwall tubes.
Since the arc of the heat collection blocks is consistent with the surface of the waterwall tubes and the expansion gap was designed to enhance the contact area, the heat collection blocks and waterwall tubes can be considered to be in complete contact. The temperature of the heat collection blocks in the furnace can be effectively controlled by the heat dissipation of the working medium flowing in the waterwall tubes. Based on this, the service life of the sensors could be guaranteed, and almost all of the 173 sensors installed in different coal-fired boilers since 2020 are still working. Once slagging occurs on the surface of the waterwall in this local area, the temperature measured by the thermocouple will decrease due to the increase in thermal resistance caused by slagging. In addition, the change in slagging thickness and internal characteristics will also be reflected by the measured waterwall surface temperature.
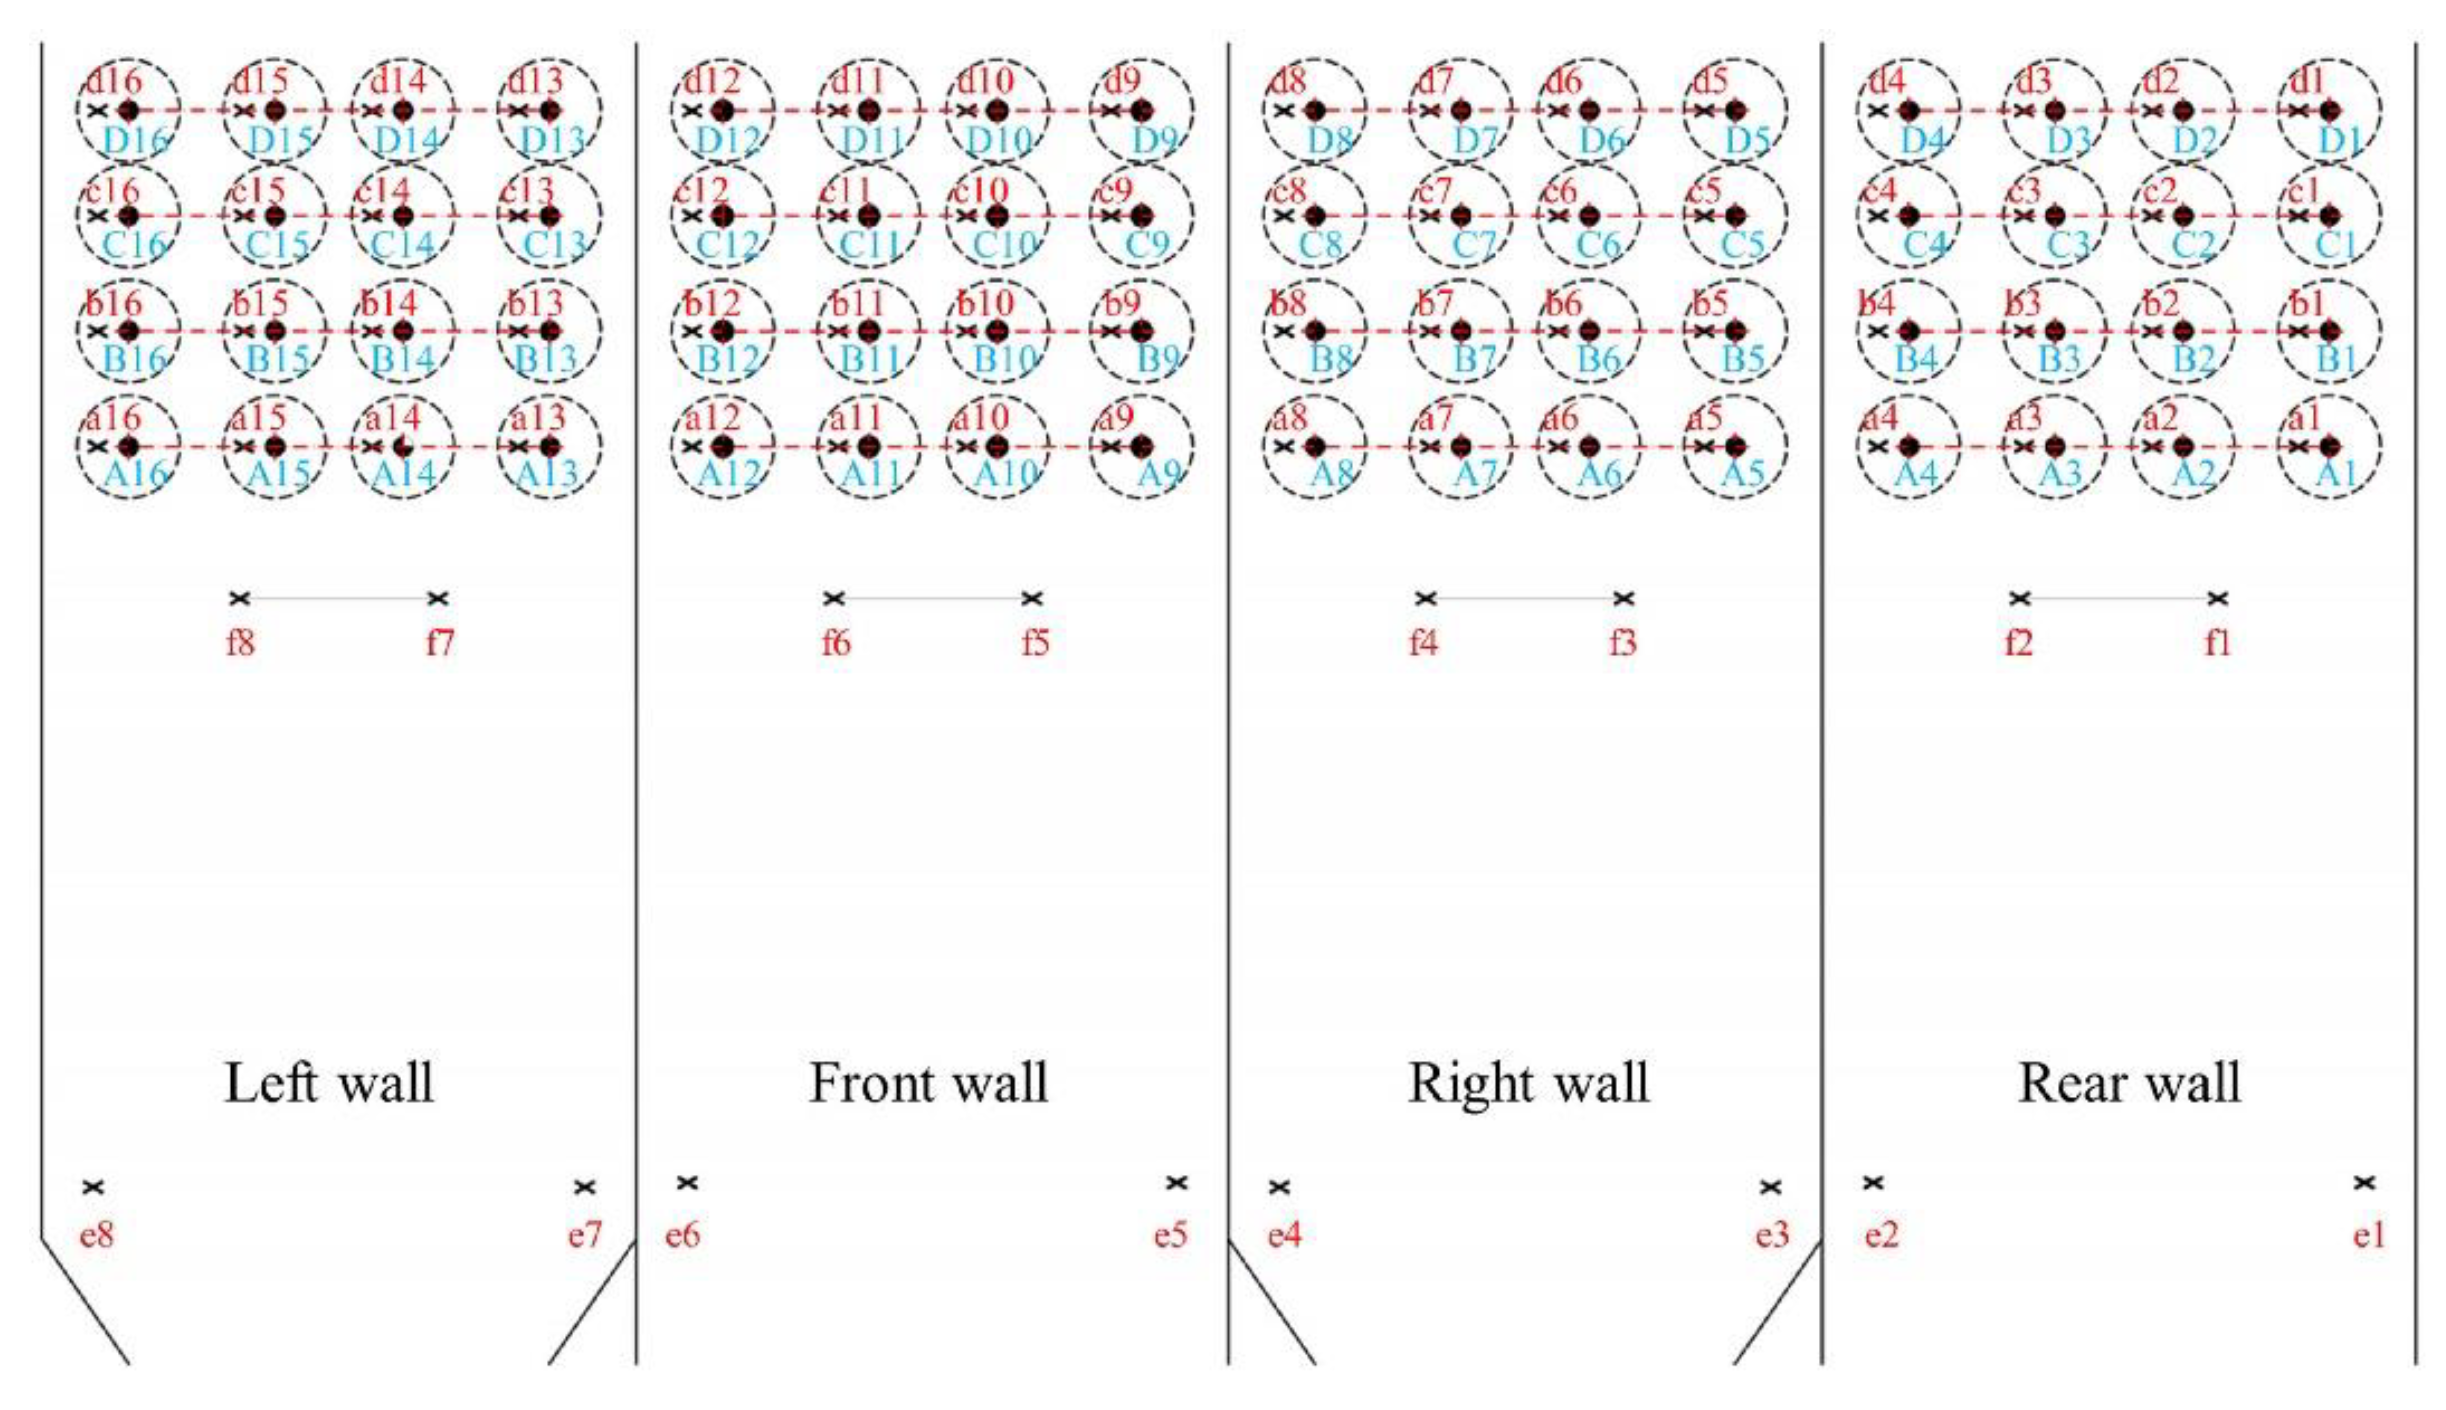
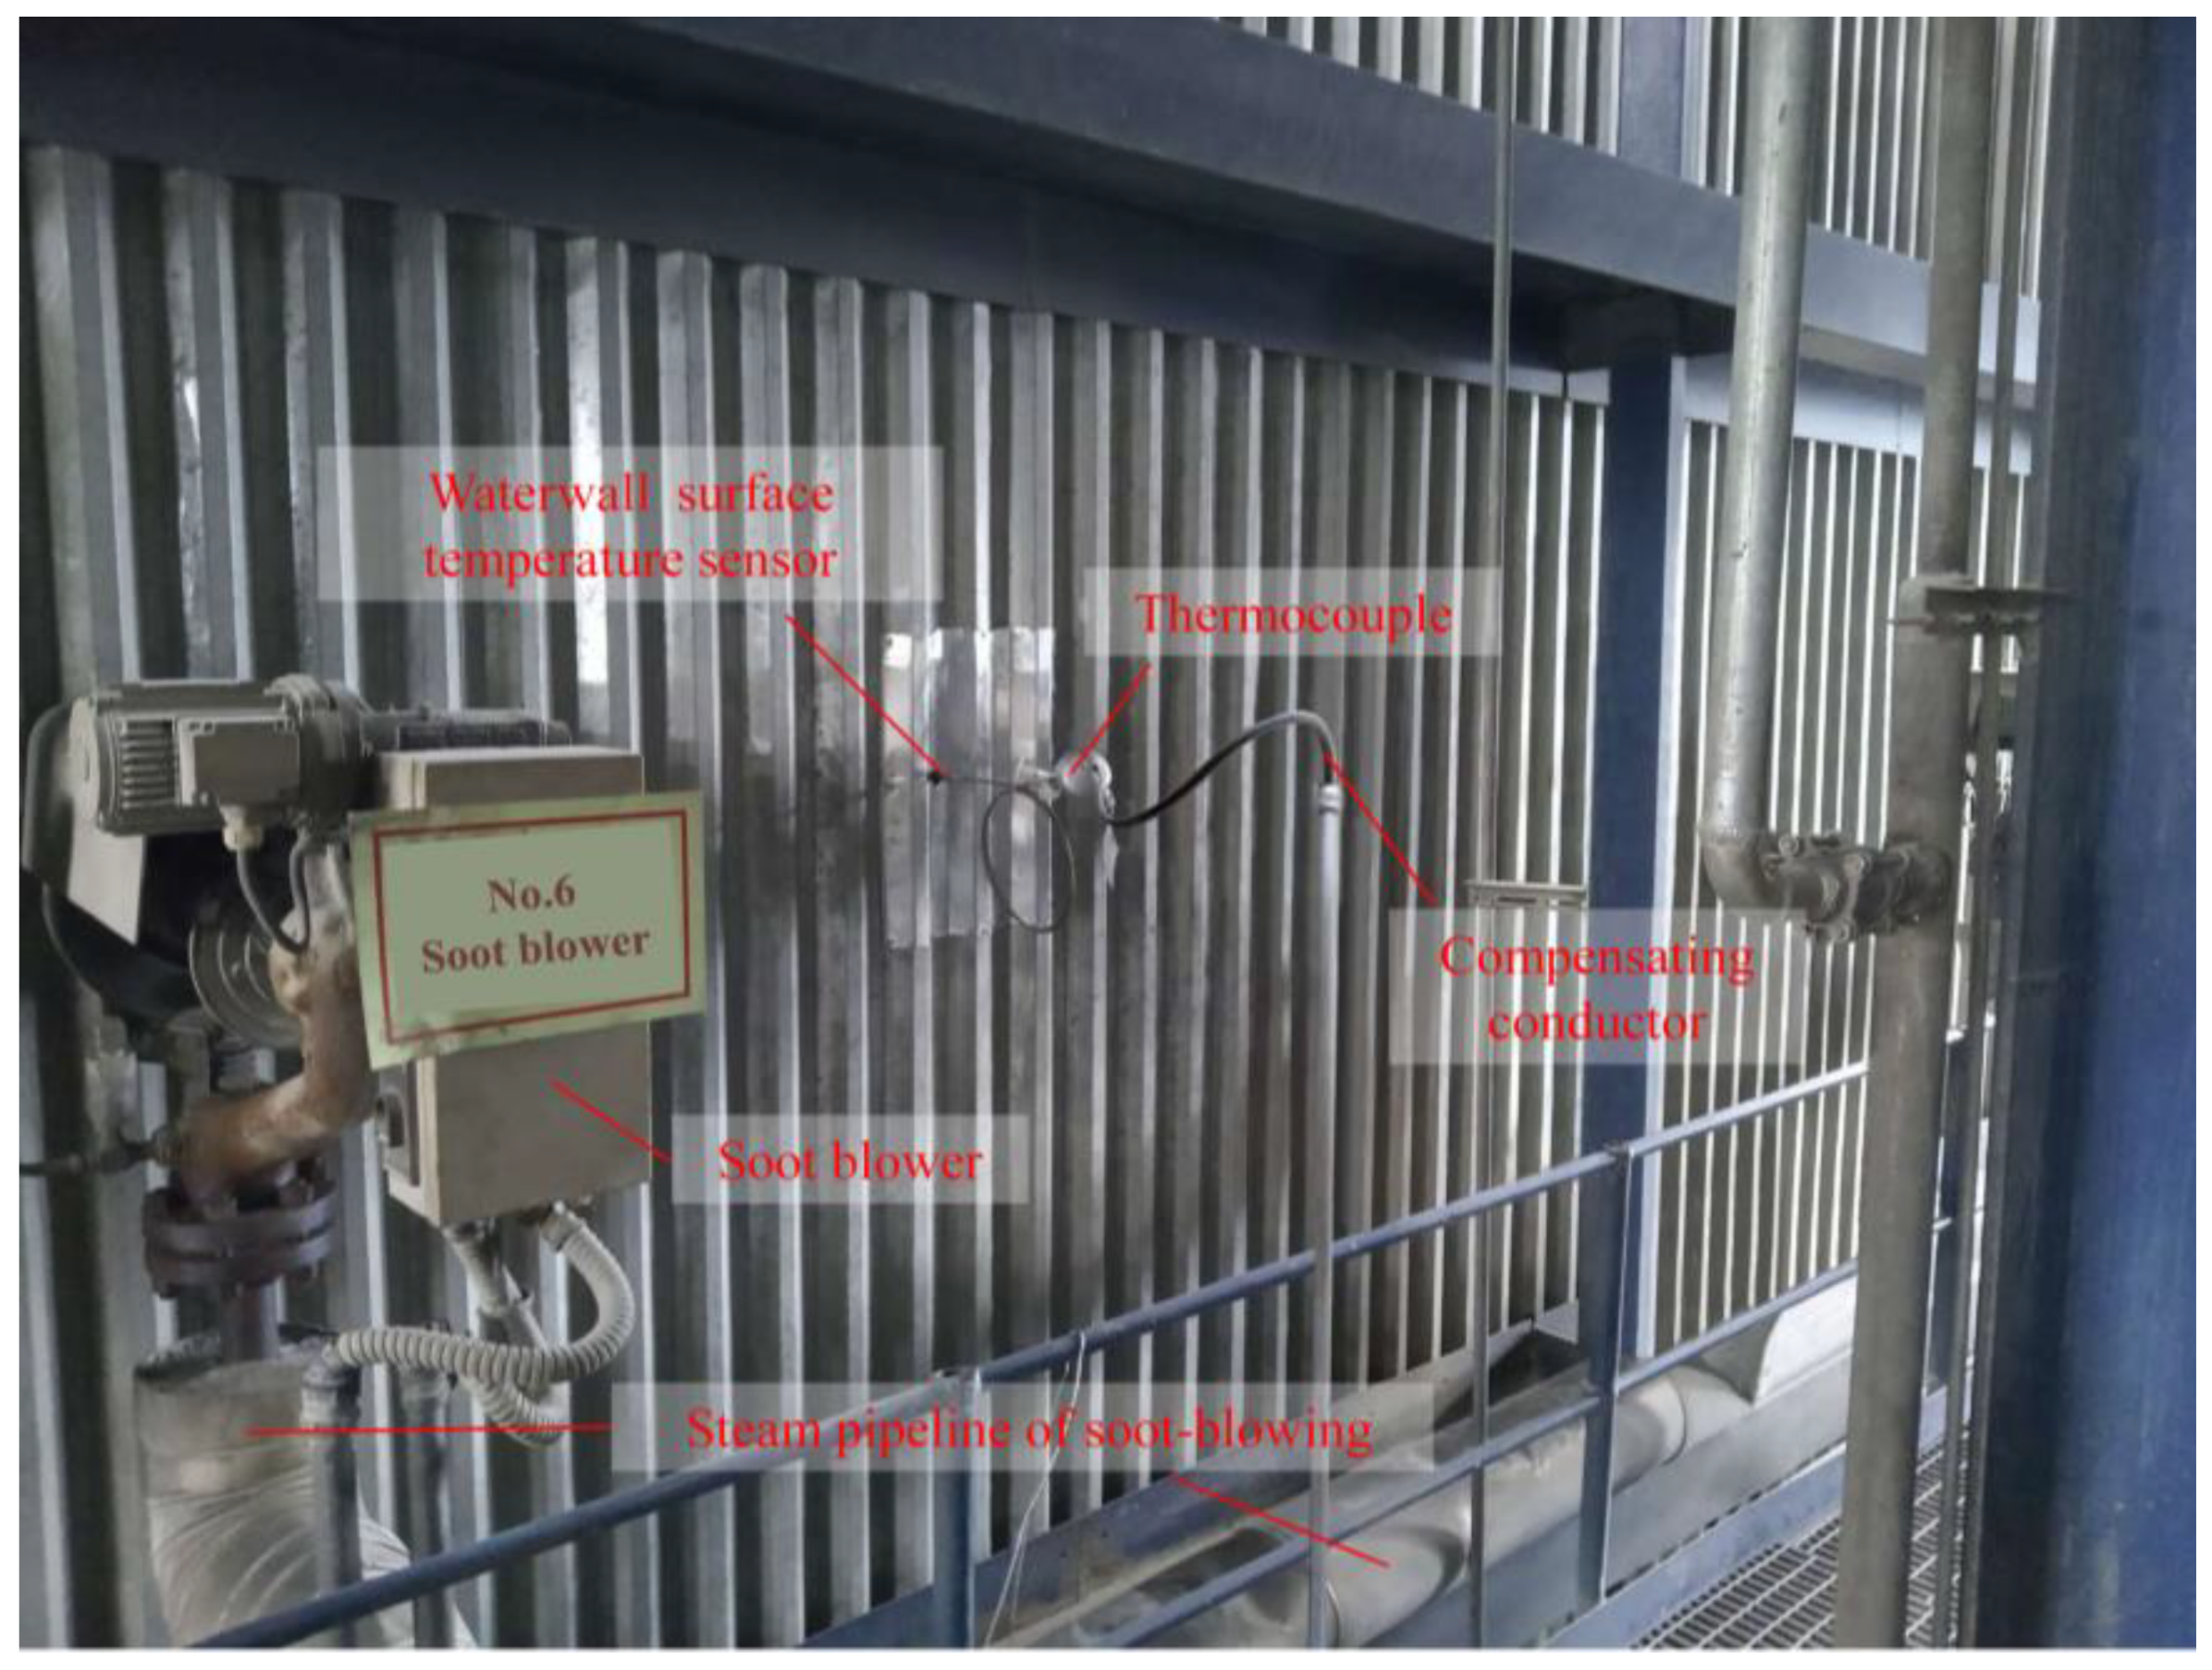
Using the traditional thermocouple temperature measurement principle, the cost of this method is low; thus, it can be widely installed in different locations of the waterwall of large coal-fired boilers. A total of 80 waterwall temperature sensors were distributed around the furnace of a 1000 MW ultra-supercritical boiler, with 64 soot-blowers around the furnace. As shown in Figure 3, at least one sensor was placed within the soot-blowing radius of each soot-blower. Figure 4 shows the installed waterwall surface temperature sensor. Signals from these sensors were introduced into the Distributed Control System (DCS) of the power plant to monitor the slagging severity at different locations in real-time and to achieve accurate operation of each soot blower on demand.
2.3. The Slagging Temperature Index
As mentioned previously, the severity of slagging at different locations is different. For our specific boiler, it was not difficult to find the location of no slagging on the surface of the waterwall, and the surface temperature sensor was installed. The temperature variation trend measured by the sensor without slagging can be regarded as the influence of the boiler operation parameters on the heat transfer on the surface of the sensor. It can also be used to describe the heat transfer influence of the boiler operation parameters on the surface slagging sensor at the same horizontal and nearby locations since the furnaces of boilers are basically symmetrical structures in the horizontal direction and the flame radiation intensity to the waterwall is mainly related to the height rather than the exact location at the same time. This is the assumed surface temperature of the sensor with slagging when it is assumed to be in a clean state. The temperature difference between the above assumed surface temperature and the actual measured surface temperature of the same sensor with slagging can be considered the slagging temperature index, which describes the quantitative characterization of slagging and was not affected by the change in boiler operating parameters but by the surface slagging state. The slagging temperature index equation is as follows:
where Tsi is the slagging temperature index; Twa and Twm are the assumed and measured surface temperatures of a waterwall surface temperature sensor, respectively.
2.4. Slagging Digital Image Monitoring System and Image Recognition Method
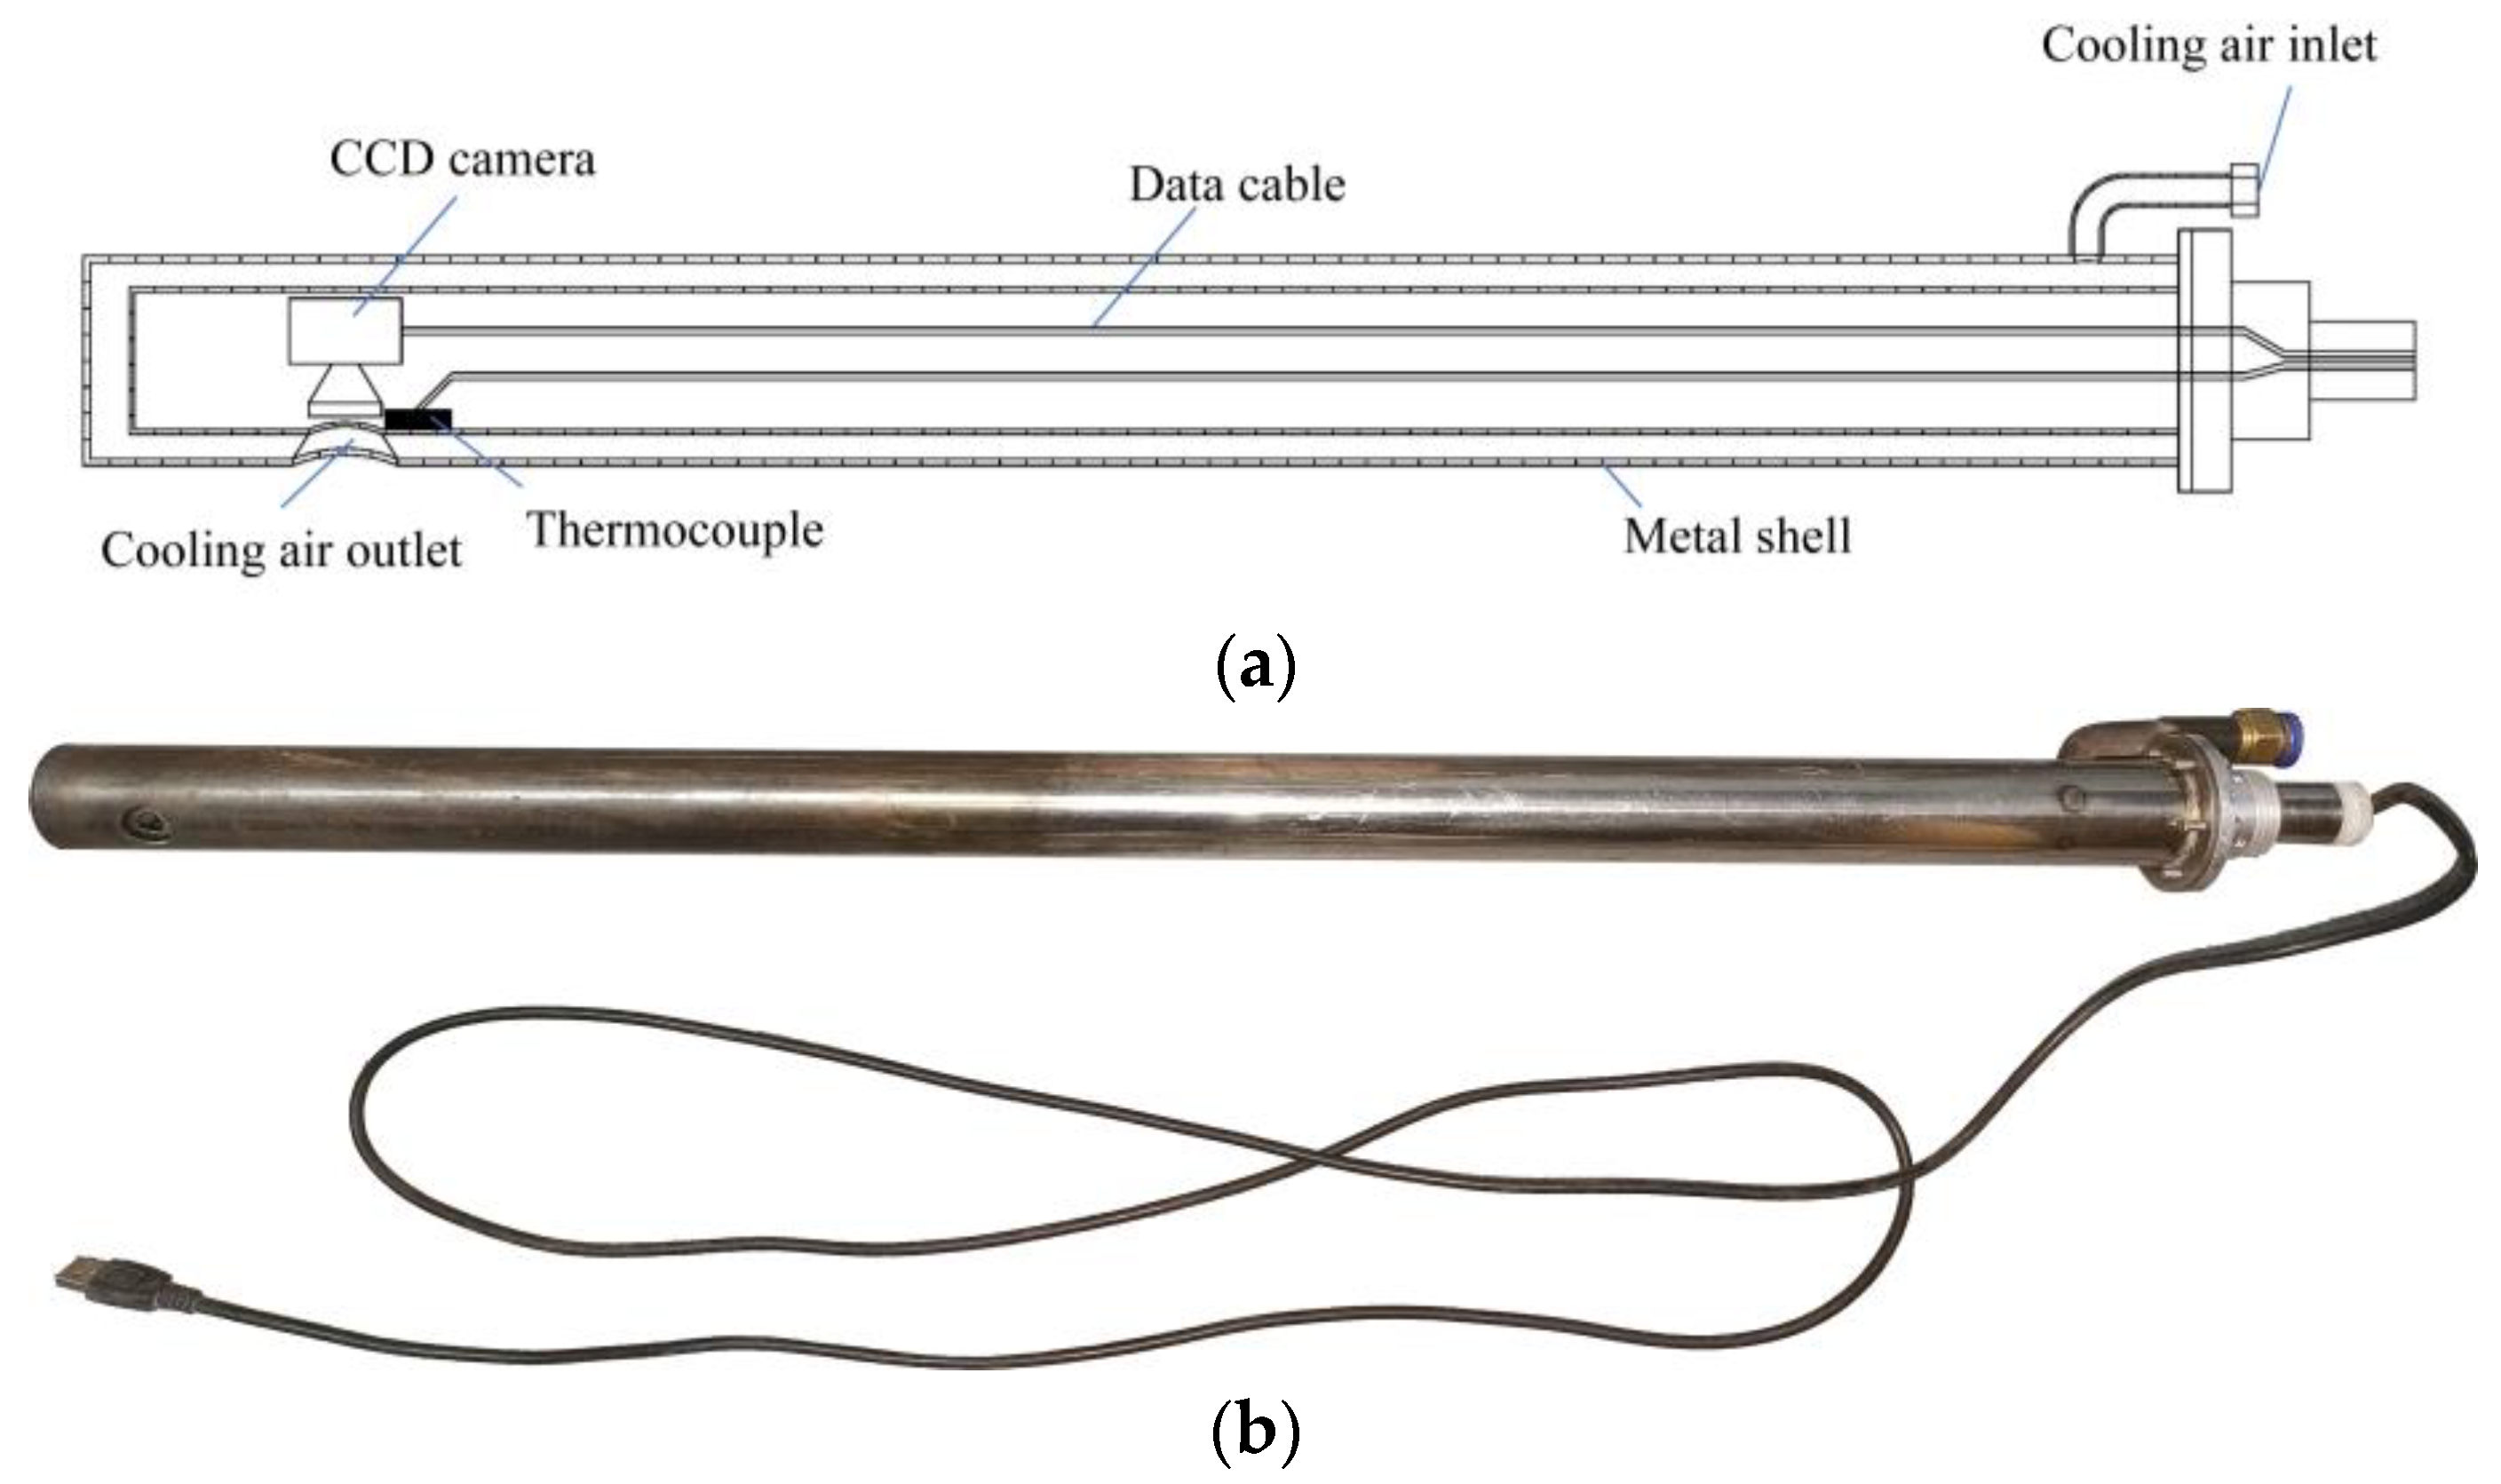
A heat-resistant slagging digital image monitoring system was used to obtain images of slagging on the waterwall surface and monitor the slagging development process in the operation boiler. Figure 5a shows the schematic diagram of this system, and Figure 5b illustrates the details. A Charge Coupled Device (CCD) camera was installed in the front of the monitoring system to generate images of the slagging on the waterwall surface. The resolution of the image was 1280 × 1024, and the images can be transmitted to the display device through the data cable in real-time. Pressurized cooling air enters through an inlet on the bottom side of the system, producing a gas film when released through the outlet in the forepart of the camera lens to prevent the fly ash from depositing and influencing the quality of the images. At the same time, cooling air isolates the high temperature in the furnace by flowing through a protection tube in the outmost layer of the monitoring system. A thermocouple was installed beside the CCD camera to monitor the operation temperature of the CCD camera and prevent the camera from being burned out.
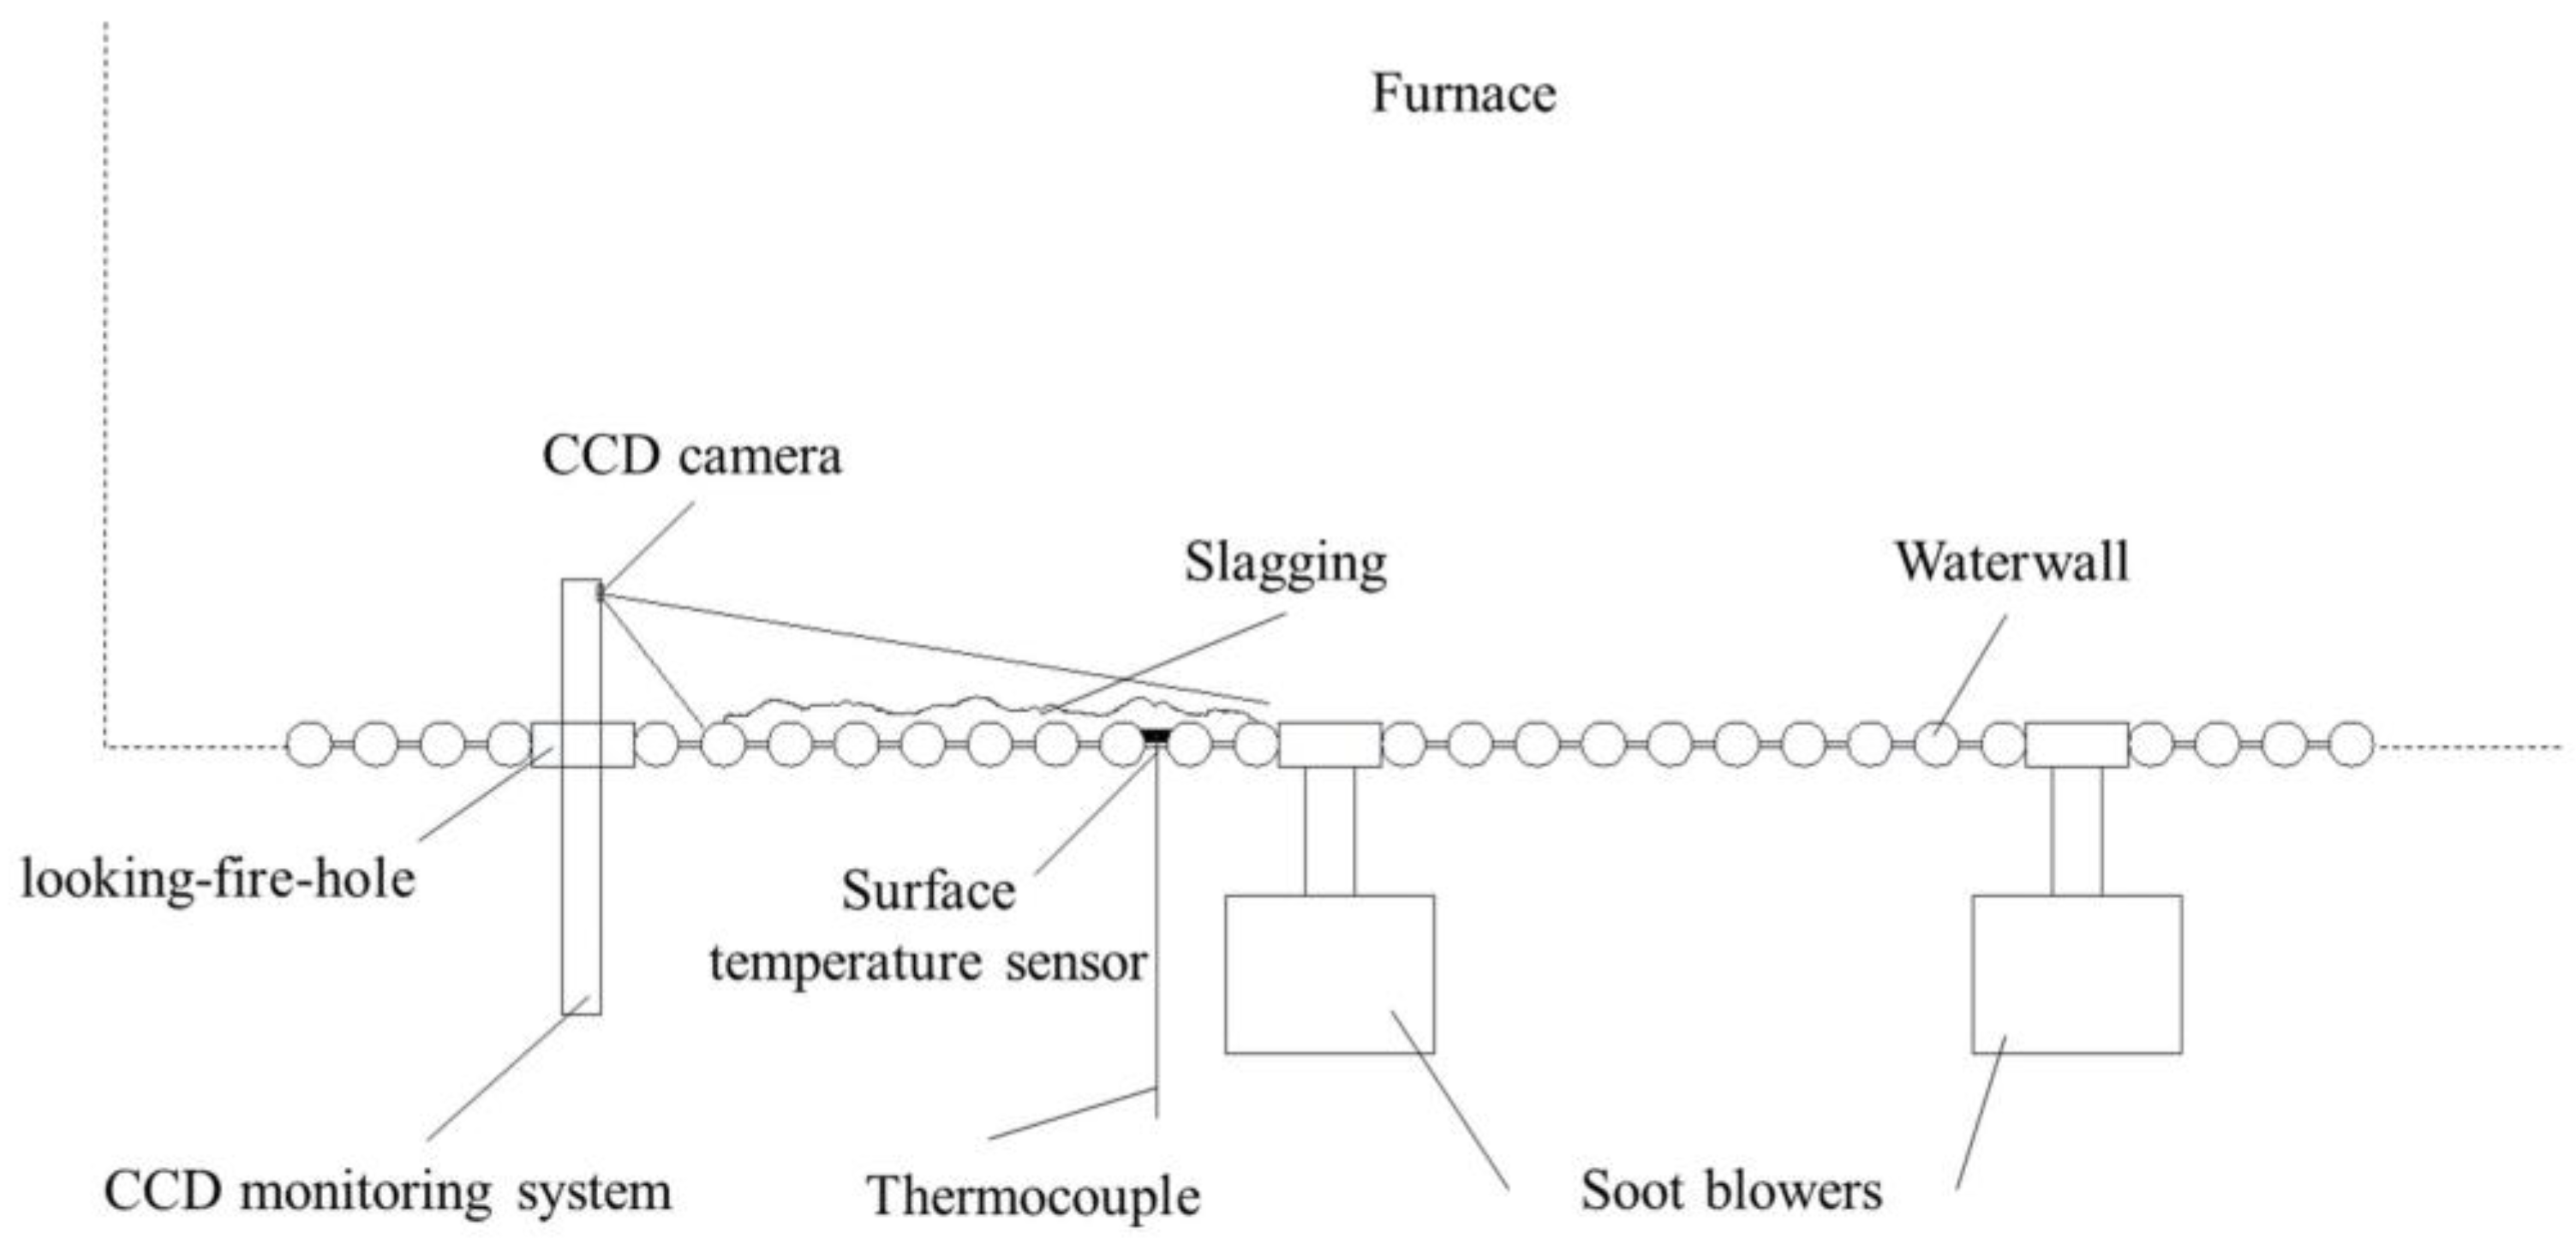
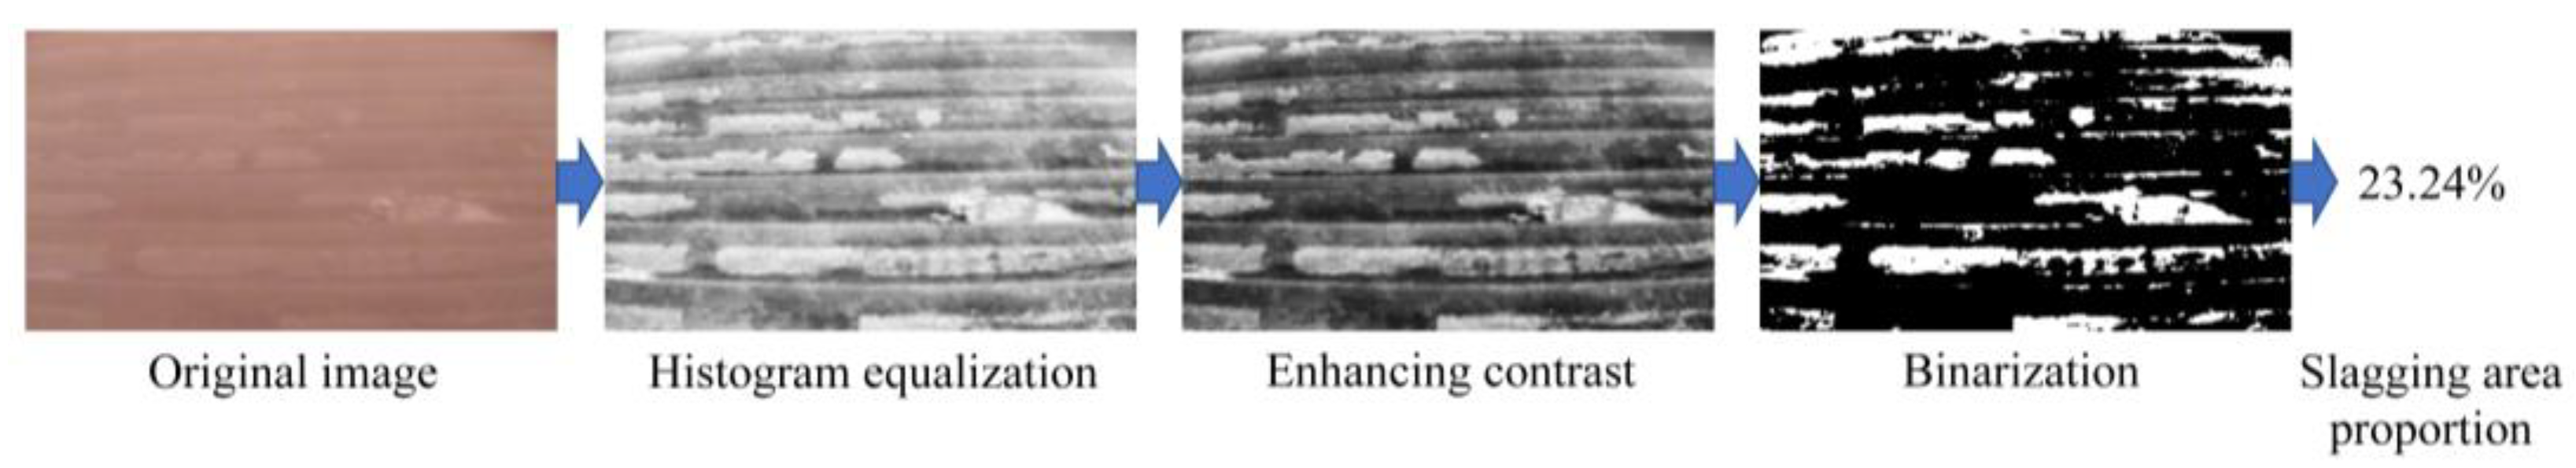
The slagging digital image monitoring system can obtain the slagging images on the surface of the waterwall by passing through the looking-fire-holes around the furnace and entering the furnace when the boiler is in operation, as shown in Figure 6. According to the obvious difference in RGB values between the surface of the waterwall and the surface of the slagging in the obtained images, the quantitative data of the slagging area proportion in the local area of the waterwall can be obtained by histogram equalization, enhancing contrast, binarization, and counting the pixels in sequence, as shown in Figure 7. With the program compiled on MATLAB R2016b, this method can be used to monitor the increase in slagging on the waterwall surface.
3. Results and Discussion
3.1. Waterwall Surface Temperature Variation Trends in Different Locations
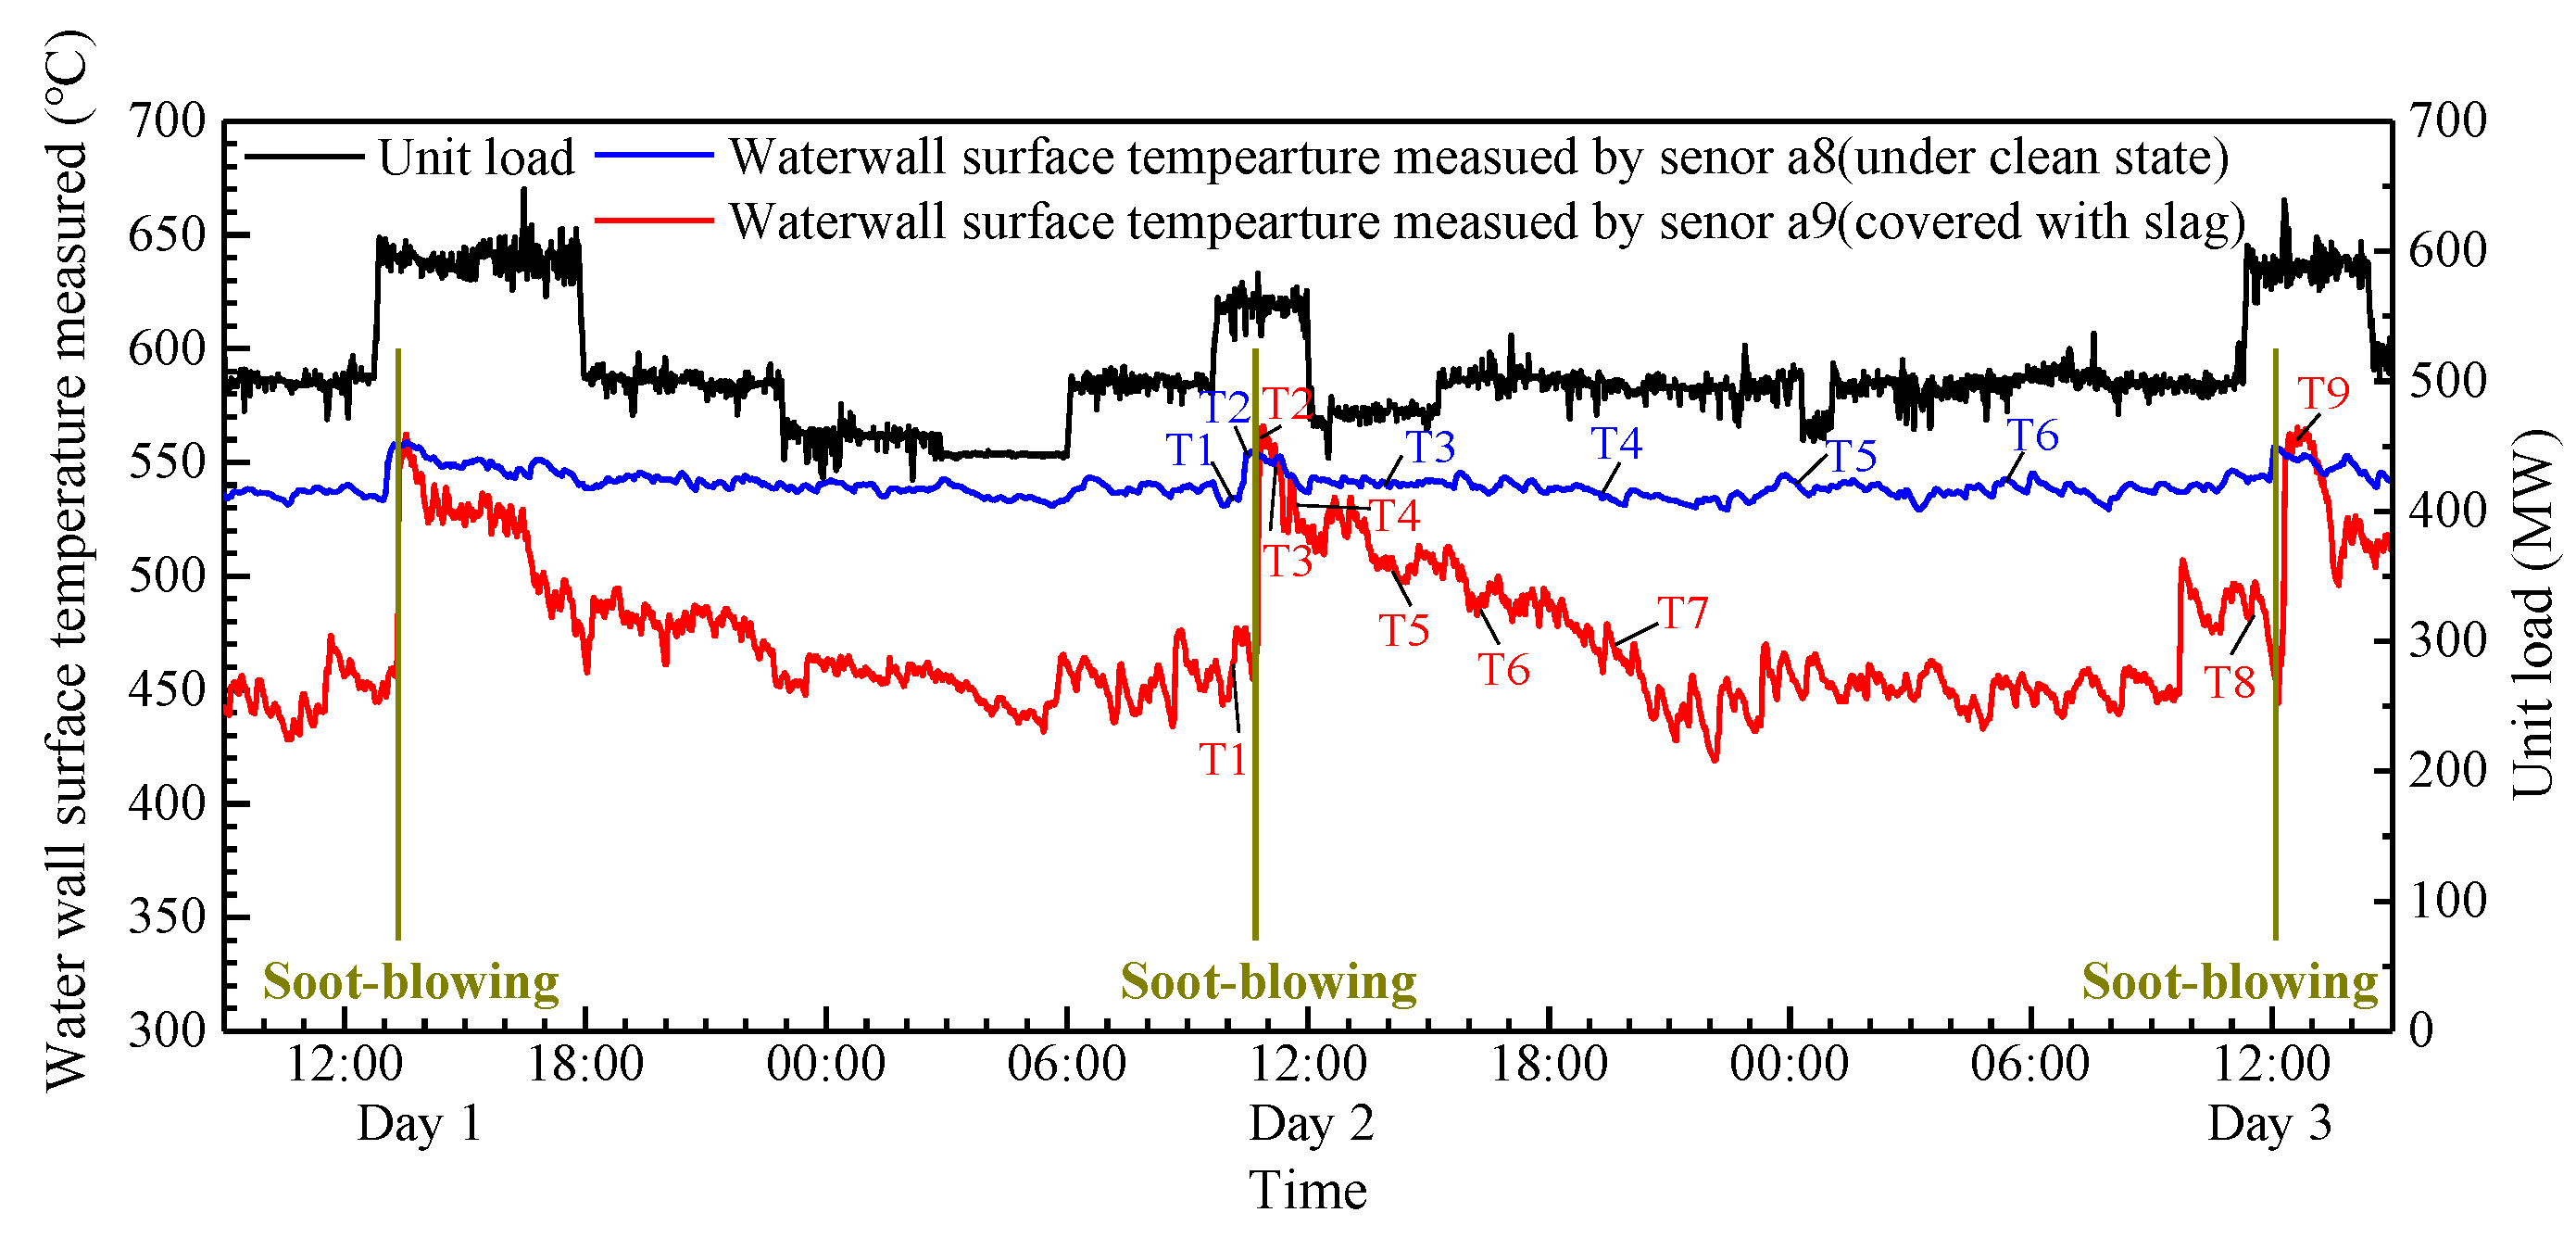
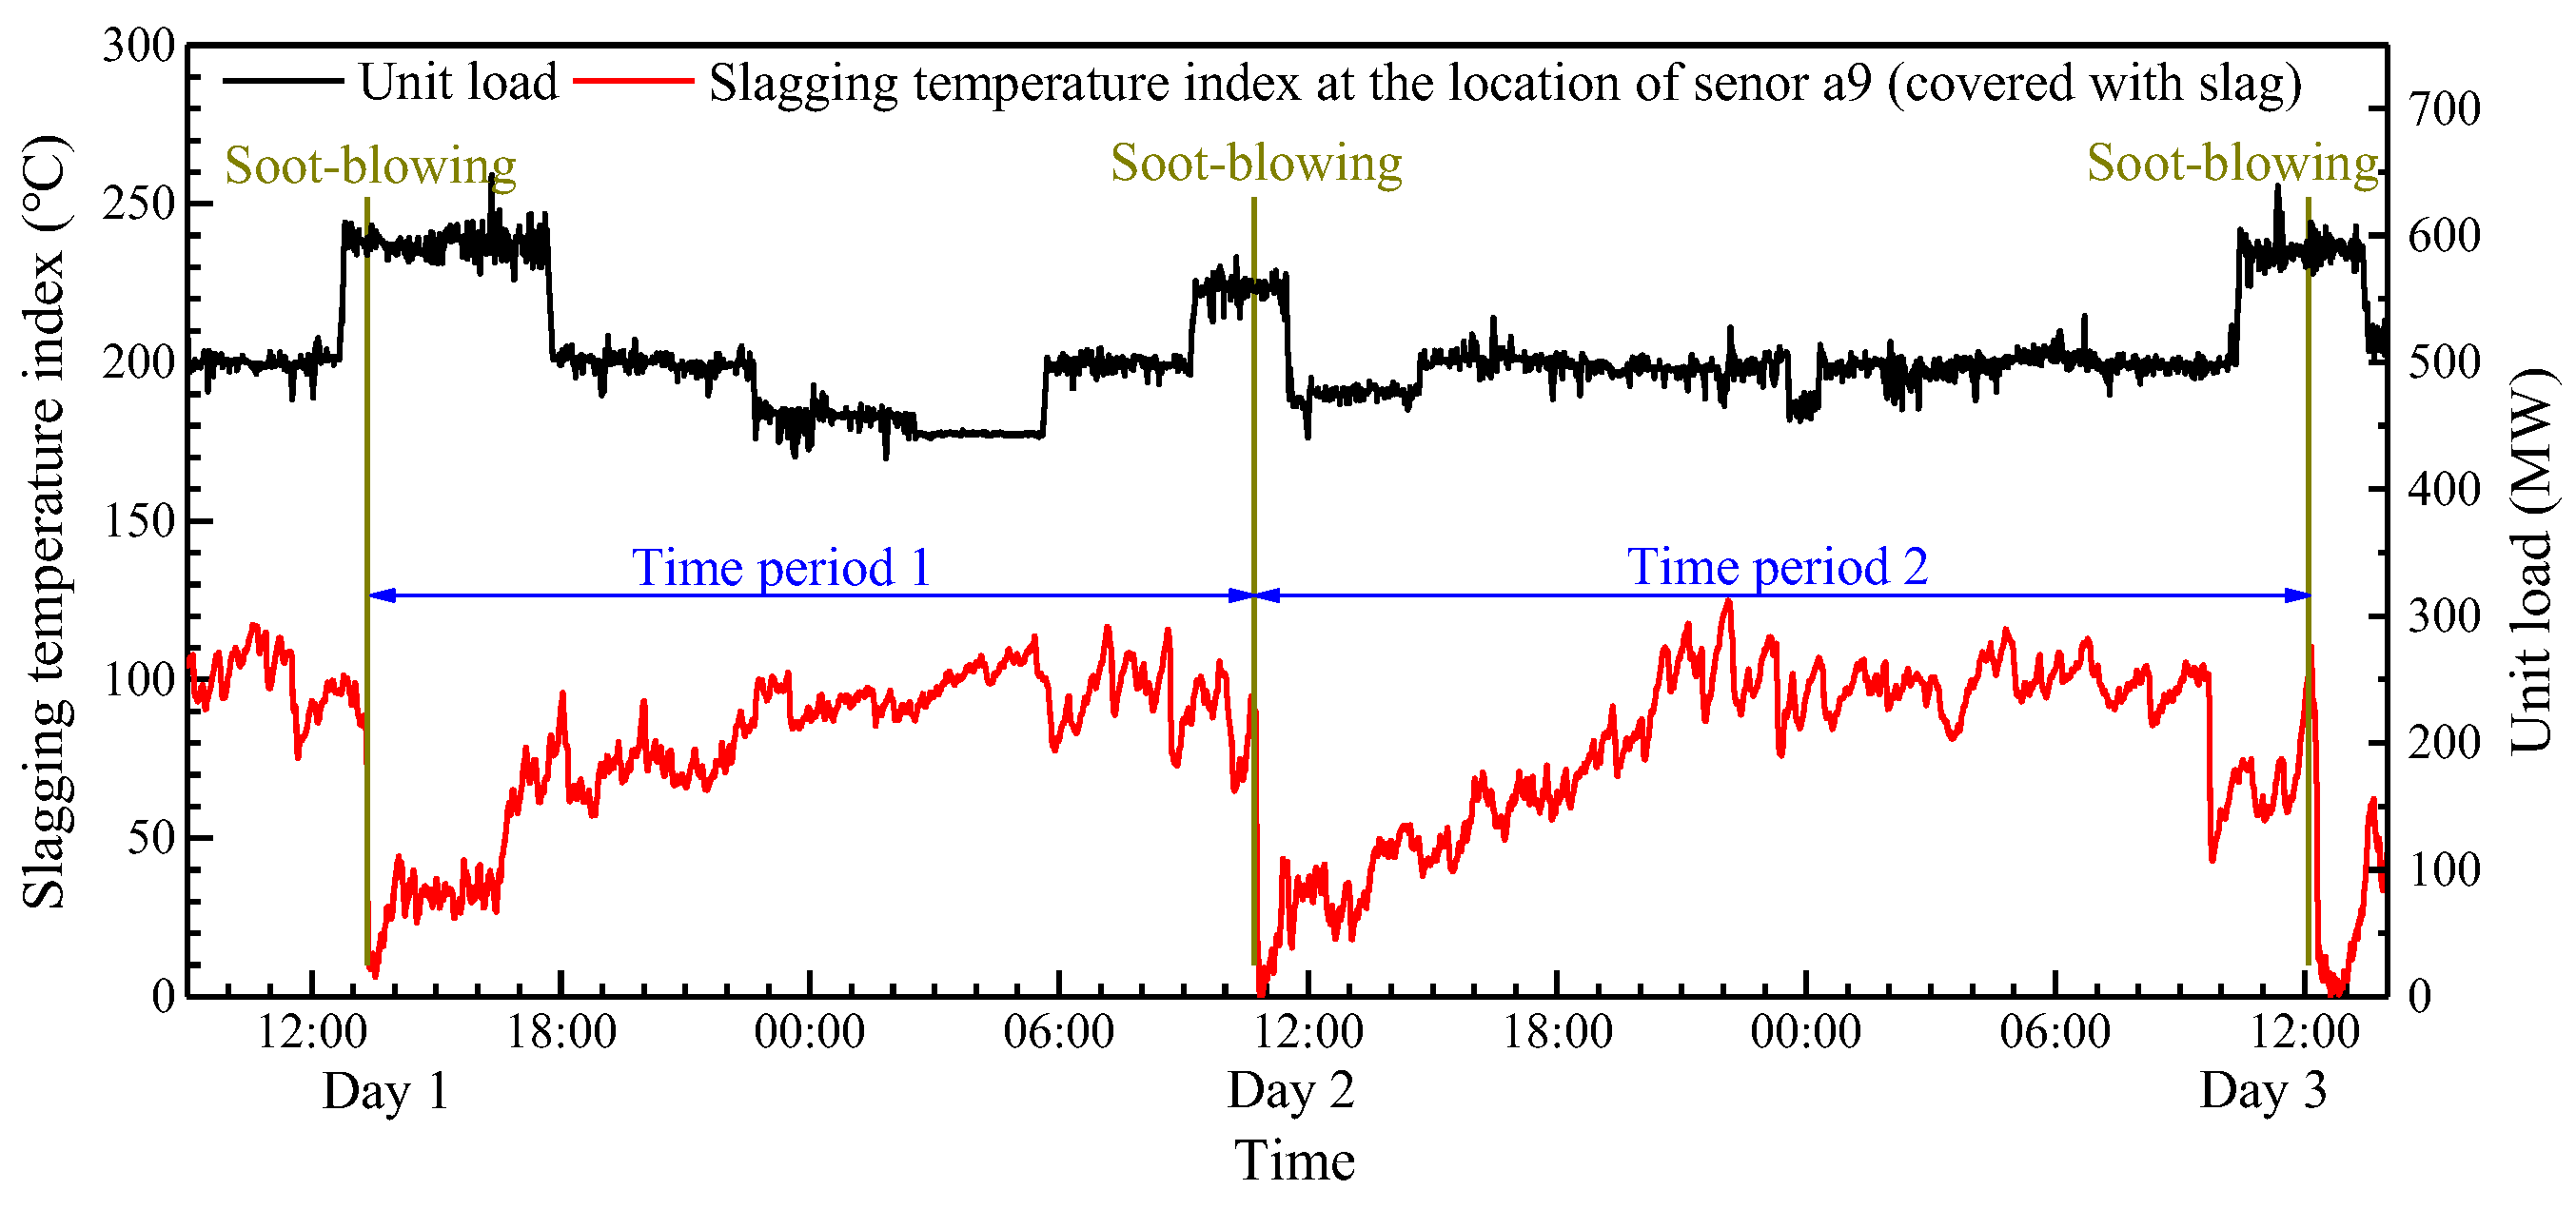
Figure 8 shows two typical variation trends of the waterwall surface temperature of the operation 1000 MW coal-fired boiler. These results were measured by the installed waterwall surface temperature sensors mentioned above. In this process, the unit load varied in the range of 500–600 MW, which was slight compared with the design capacity and the adjustable range of the unit load. The soot blowers were operated periodically by day, at around 12 AM. In this period, the waterwall surface temperature measured by sensor a9 changed significantly. Especially at the moment of soot-blowing, the waterwall surface temperature rose instantly by about 80–100 °C to about 550 °C, then decreased slowly back to about 450 °C after soot-blowing. In contrast, the waterwall temperature of sensor a8 changed little over the whole period and only rose about 10–20 °C at the moment of soot-blowing. It was obvious that the waterwall surface at the location around sensor a9 can be considered covered with slag, while the location around sensor a8 was almost clean. That is, as described by Equation (9), when the location around sensor a9 was continuously covered with slag, its waterwall surface temperature decreased, especially with the growth of the slagging thickness. For sensor a8, it might only have been covered with a little coal ash, and slag was no longer being deposited, so the waterwall surface temperature of the sensor decreased slightly. This phenomenon is similar to the changing furnace exit gas temperature of the whole waterwall [26] or the cleanliness factor of the convection heating surface versus soot-blowing [21,22]. However, the accurate measurement of the slagging state changing at different locations of the waterwall through the influence of soot-blowing has not yet been reported.
According to the temperature difference of the waterwall surface before and after soot-blowing, which varied with the waterwall location, the location with a temperature difference greater than 80 °C can be considered to be the location covered with slag, while the location with a temperature difference less than 20 °C was almost clean. With the widely installed sensors around the furnace, this approach can be used to determine the slagging location on the waterwall surface in the operation boiler.
3.2. Slagging Deposit Process in an Operation Boiler
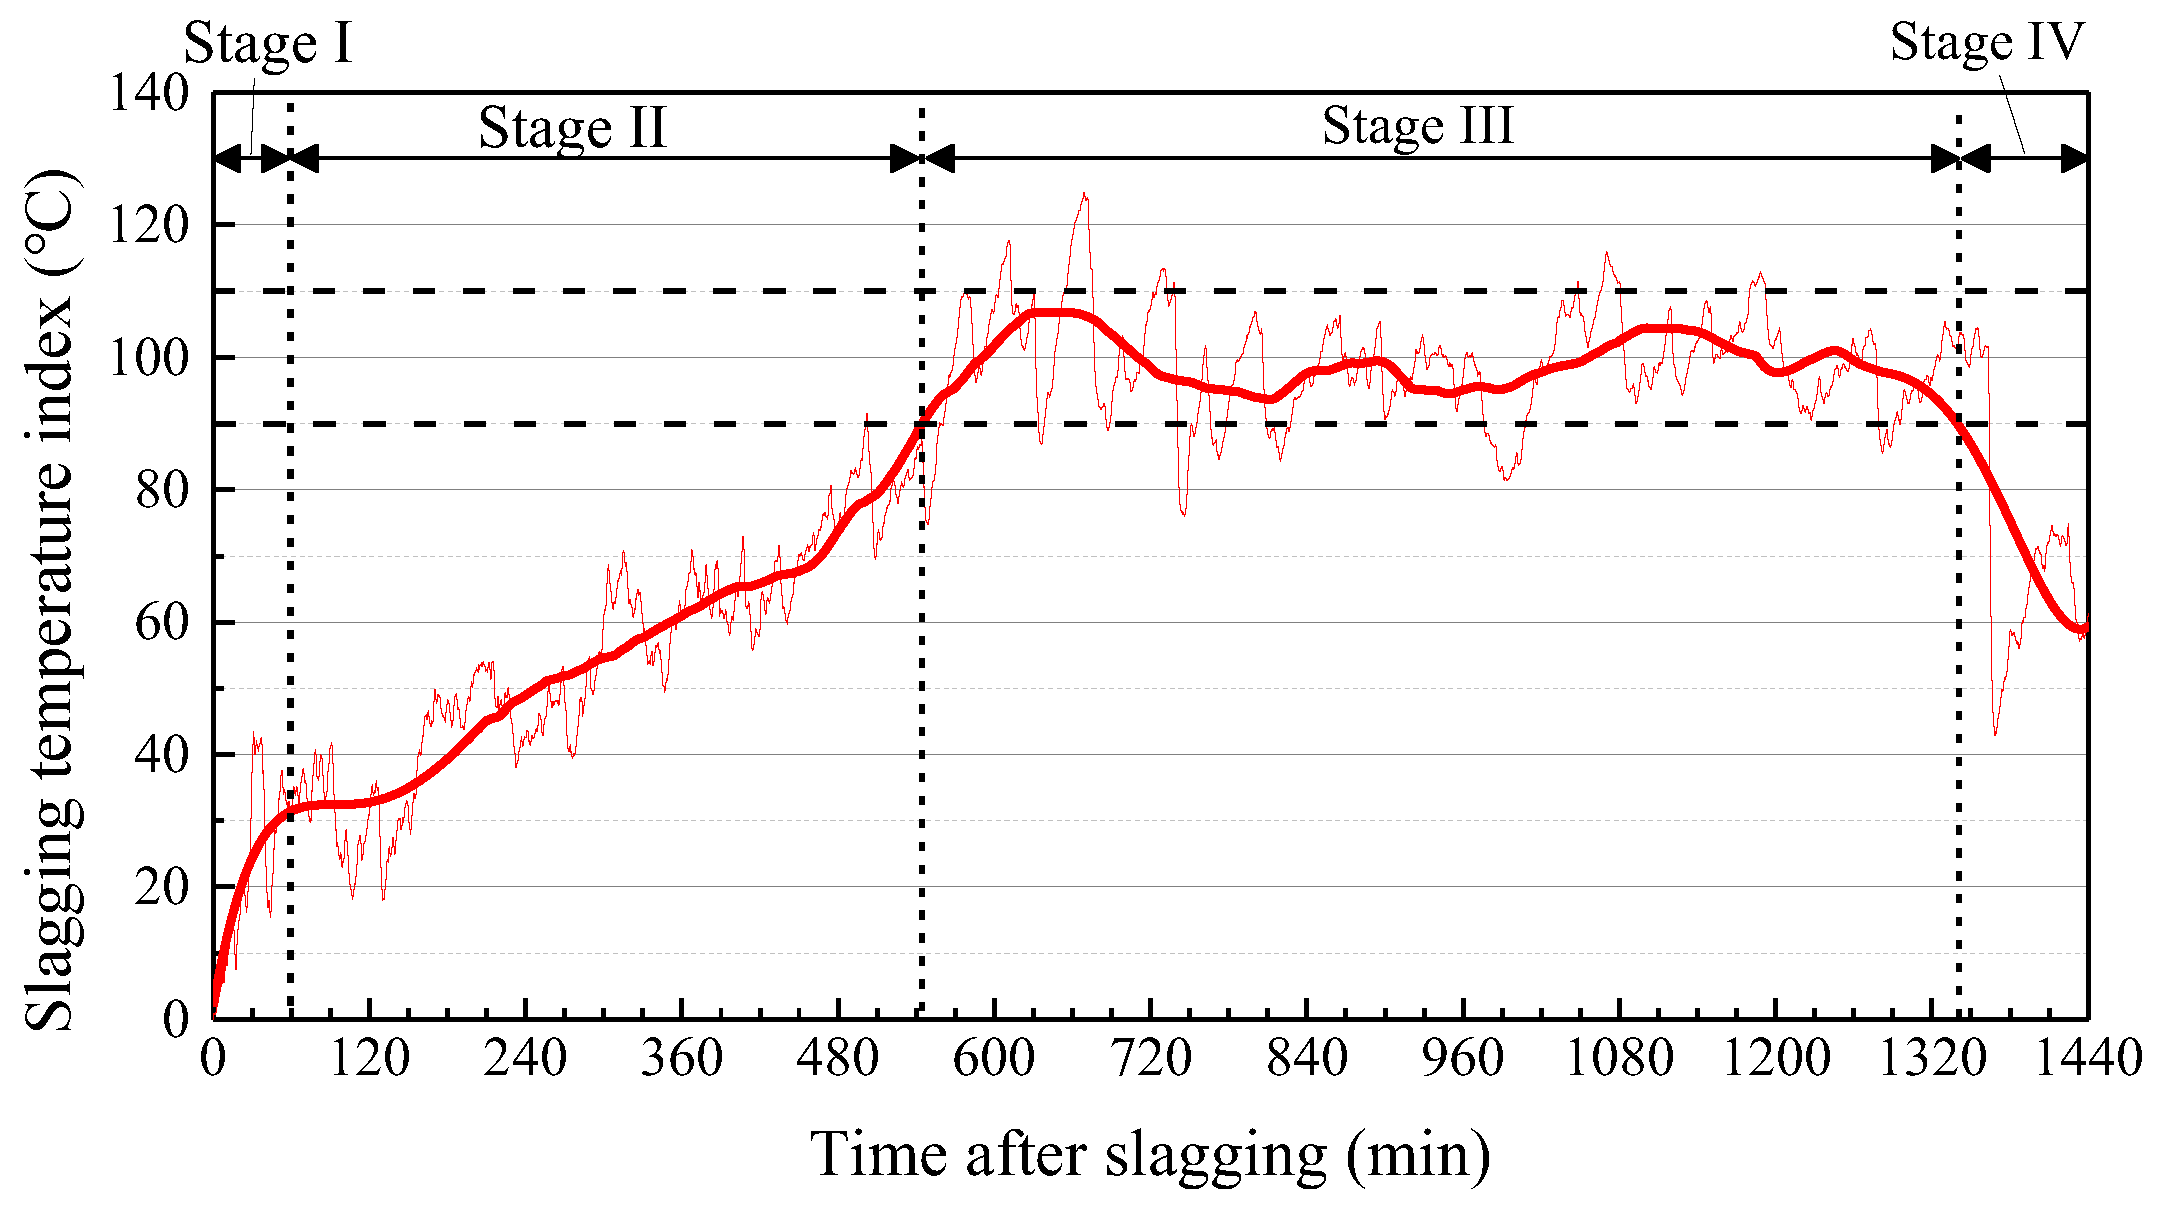
Figure 9 shows the slagging temperature index at the location of sensor a9 (covered with slag) calculated by the mentioned method and Equation (10). The variation trends of the slagging temperature index in two time periods were similar, which means that it had good repeatability. On this basis, the data for time period 2 with a longer duration is shown in Figure 9, and the result after averaging it by hours is shown in Figure 10. It reveals the process of slagging and the variation in slagging thickness on the surface of the waterwall around sensor a9. Four segments with different slopes of the slagging temperature index can be observed and used to divide the process of slagging deposit growth into four stages, marked as stage I–IV in Figure 10.
Stage I lasted for about 60 min. after soot-blowing, and the slagging temperature index increased from 0 °C to about 30 °C, with a rate of 0.524 °C/min. It seems the slag quickly deposited on the waterwall surface around the sensor and formed a thin initial layer. Due to the high temperature of the flame in the center of the furnace, the radiant thermal resistance of the flame to the waterwall surface was very small. Although the thickness δinl was small, the appearance of the initial layer generated a significant thermal conductivity resistance. That meant the λinl was quite small, which had a significant impact on the increase in total heat transfer resistance, resulting in the increase in the slagging temperature index.
When the slagging temperature index exceeded about 30 °C, the index growth rate slowed down to about 0.121 °C/min until about 90 °C. This can be considered stage II, which lasted about 485 min. This stage mainly focused on the sintered layer and the slagging layer’s growth. With the thickness of the slagging growth, the thermal conductivity resistance increased gradually. However, due to the microstructure of the slag changing and the deposit densification with deposit growth, as well as the concentrations of the metallic elements (Si, Al, Ca, Mg, and Fe) with high thermal conductivity increasing along the thickness of the slag from the initial layer to the slagging layer [34], the average effective heat conductivity of the deposits increased with the thickness growth [13]. This resulted in a gradual decline in the increase rate of thermal conductivity resistance. So, its influence on the heat transfer was not as obvious as that generated by the initial layer in stage I.
Then it entered stage III, in which the slagging temperature index fluctuated in the range of about 90–110 °C. This means the slagging deposits reached a basic stable stage, the thickness of the slagging stopped growing consistently, and the thermal conductivity changed slightly. This is probably due to the continuous development and rupture of bubble structures inside the slagging during the deposit sintering process [13]. The distribution of bubbles decreased the thermal conductivity, and the rupture of bubbles in turn caused the reduced thermal conductivity to disappear [33]. That is, the δ and the λ were almost stable, so the slagging temperature index changed little.
It is worth noting that, after lasting about 1884 min., the slagging temperature index broke out of the fluctuation range and instead rapidly dropped below 60 °C at a rate of 0.329 °C/min. Zhou et al. [12,13,14,15] observed the variation in thickness and the heat flux of the slagging growth in a pulverized coal combustion furnace under laboratory conditions. But this phenomenon has not been reported in these or any other references, which may be due to the fact that the previous studies on the slagging deposit growth were mainly based on laboratory conditions and the severity of the slagging was not as serious as that in a coal-fired boiler. That is also the reason why each stage of slagging in these references was shorter. The reasons for the index decline may be attributed to two aspects: the decline of the number or diameter of the irregular bubbles and the rupture of the bubble structures inside the slagging deposits, and the seriously sintered, dense structure of the sintered layer and slagging layer [13], which led to the decline of the heat transfer resistance of the slagging deposit. Thus, the λ increased rapidly while the δ remained almost constant, which led to the dramatic decline of the slagging temperature index. This feature can be used to determine the severity of slagging on the surface of the waterwall. By monitoring the variation trend of the slagging temperature index at each location, each soot-blower around the furnace can be operated when necessary, rather than a fixed-cycle operation.
3.3. Slagging Area Spread in the Slagging Deposit Process
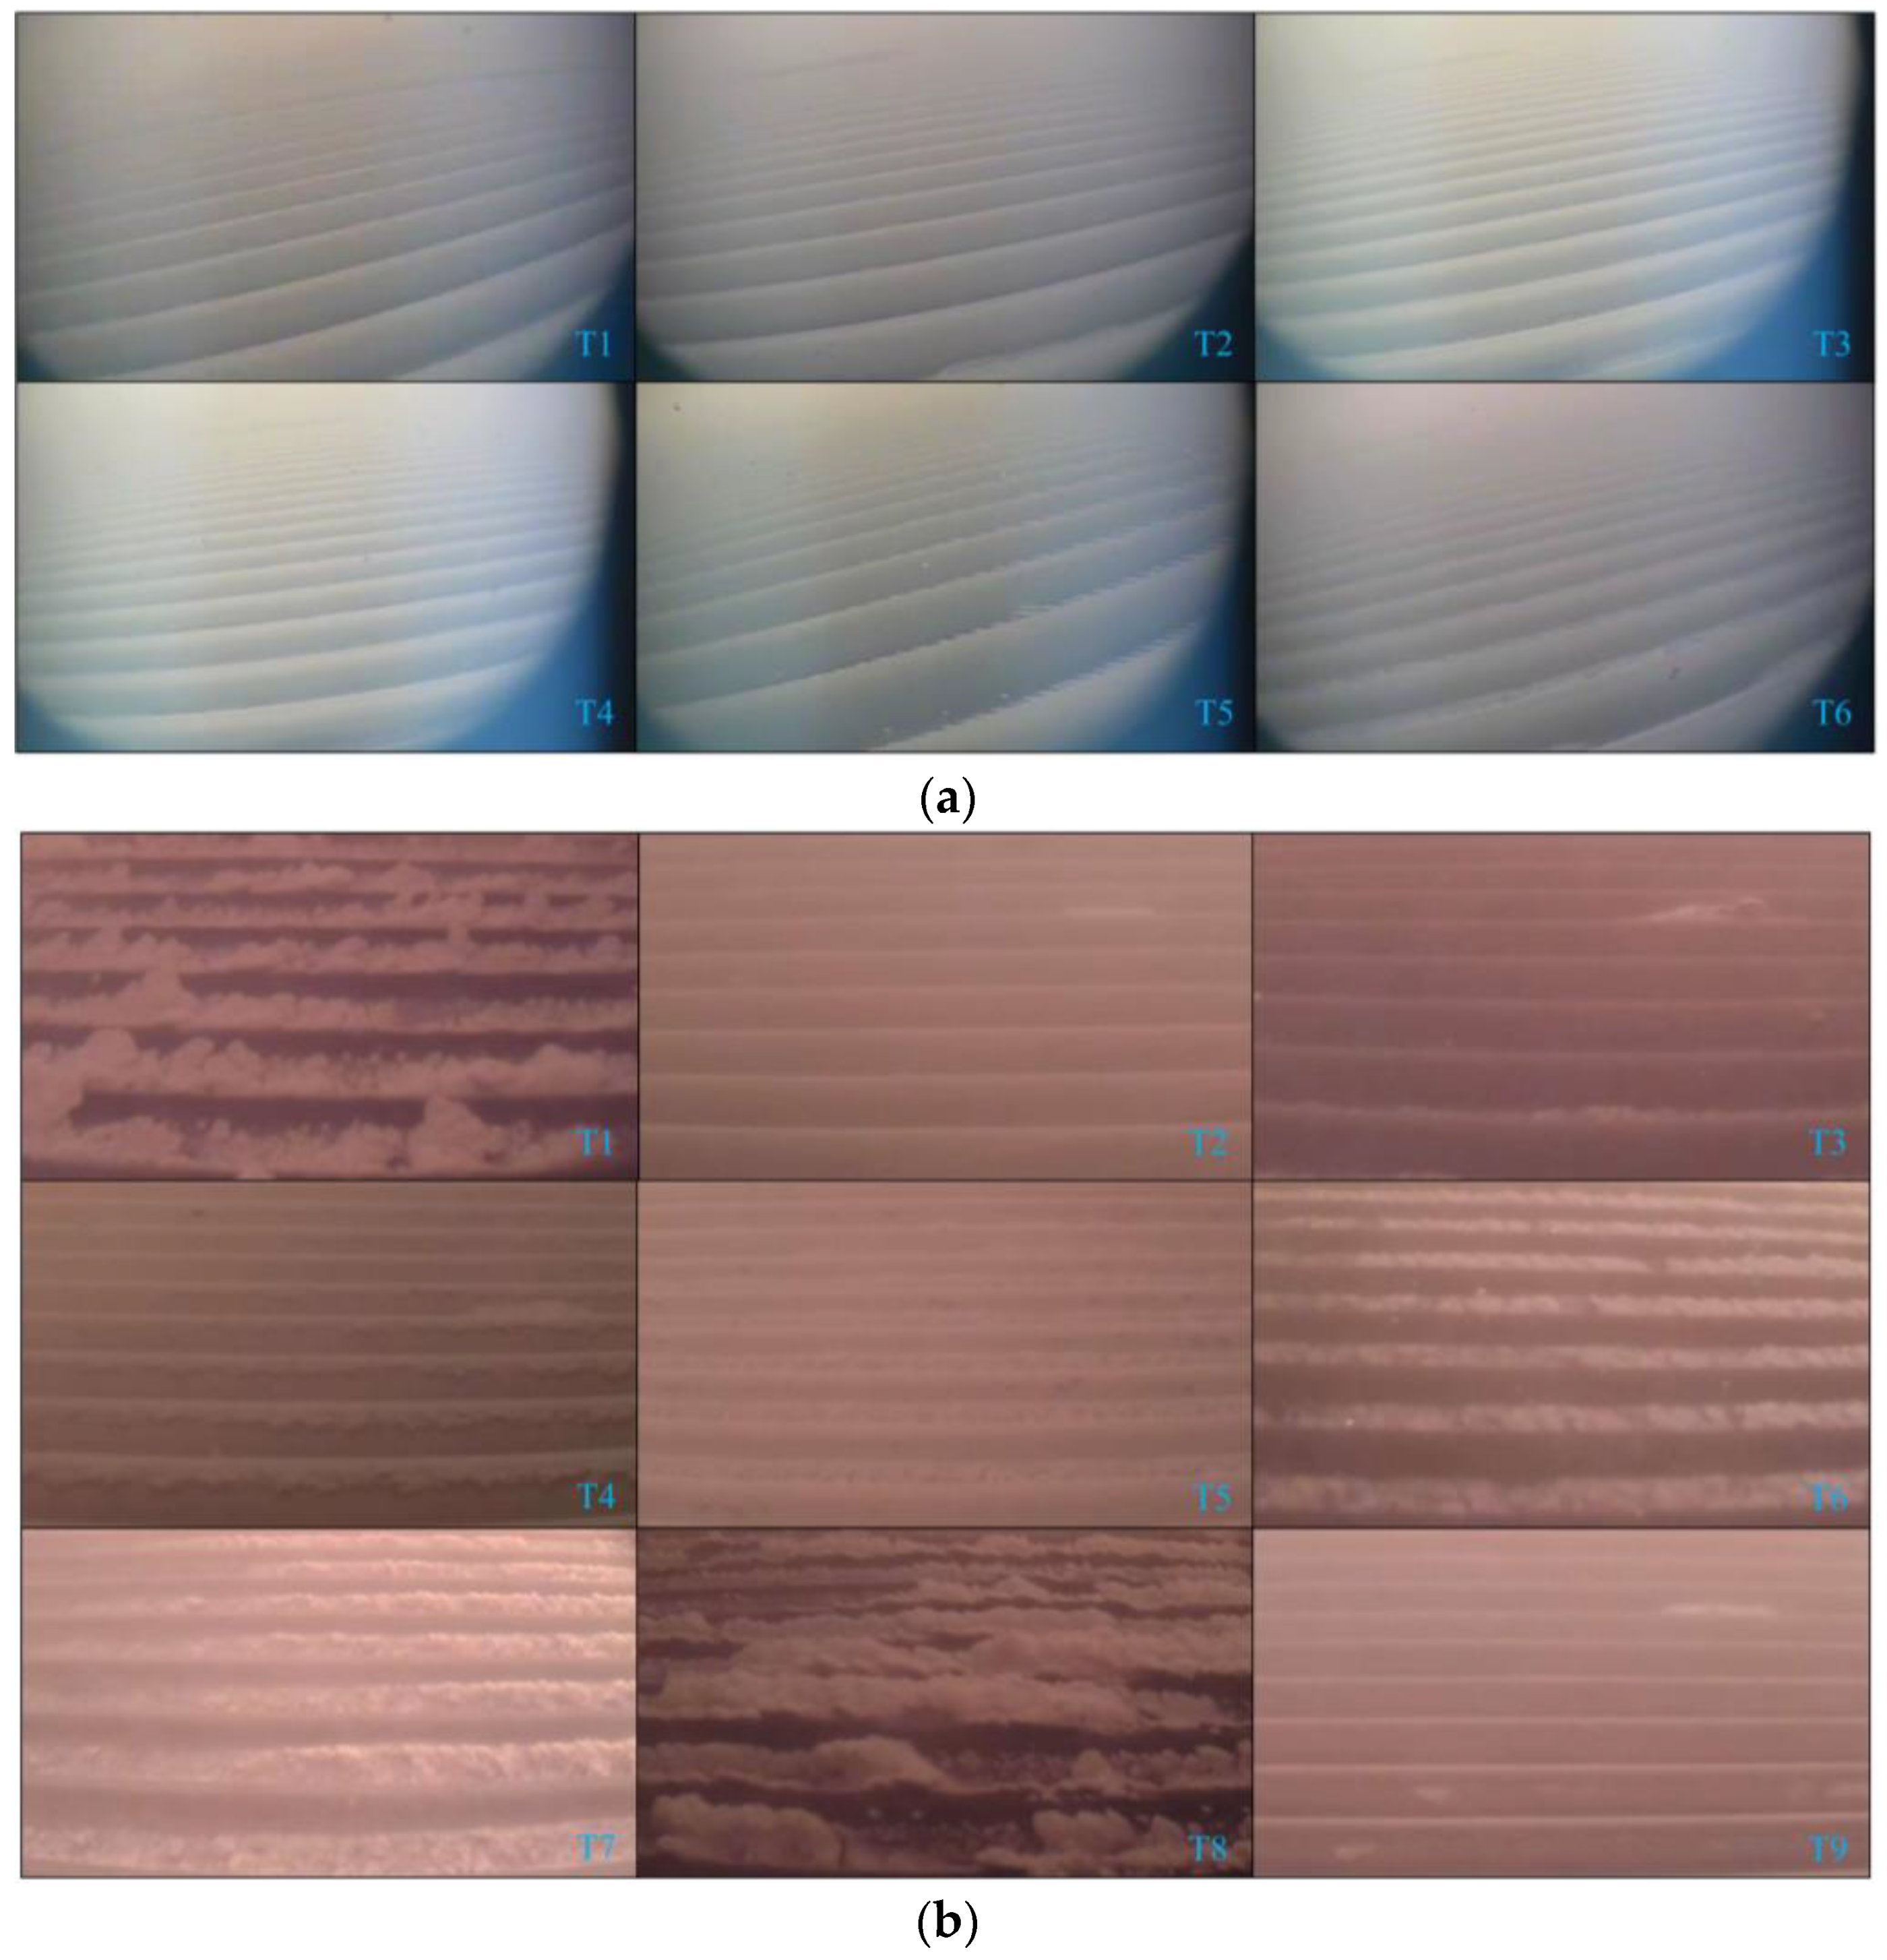
Figure 11a,b show the images of the waterwall surface of the local area around sensors a8 and a9 at different times, respectively. The moments for each image are marked in Figure 9. Among them, T1 was the moment before the soot-blowing, T2 was the moment just finished the soot-blowing, T3, T4 etc. were the different moments during two consecutive soot-blowing. Obviously, the waterwall surface around sensor a9 showed different slagging states in boiler operation, while around sensor a8, it showed a completely clean state at different times. Especially before and after soot-blowing, it can be seen that the slagging deposits on the surface of the local area around sensor a9 disappeared, and the surface returned to a clean state. Then, during the operation of the boiler, the slagging first appeared in a certain segment of one of the fins between the two adjacent waterwall tubes. This was mainly due to the higher temperature of the fins relative to the waterwall tube surface. Subsequently, the slagging deposits gradually grew along the same fins as well as on other nearby fins. With the adhesion of slag, the thickness growth of the slagging deposit layers gradually covered the surface of the waterwall tubes. With the next soot-blowing, the local area of the waterwall surface remained in an almost clean state again. The results of the image monitoring reflected the process of slagging deposits on the surface of the waterwall in the furnace and verified the waterwall surface temperature variation trend in Figure 9.
3.4. Relationship between Thickness Growth and Area Increase in the Slagging Deposit Process
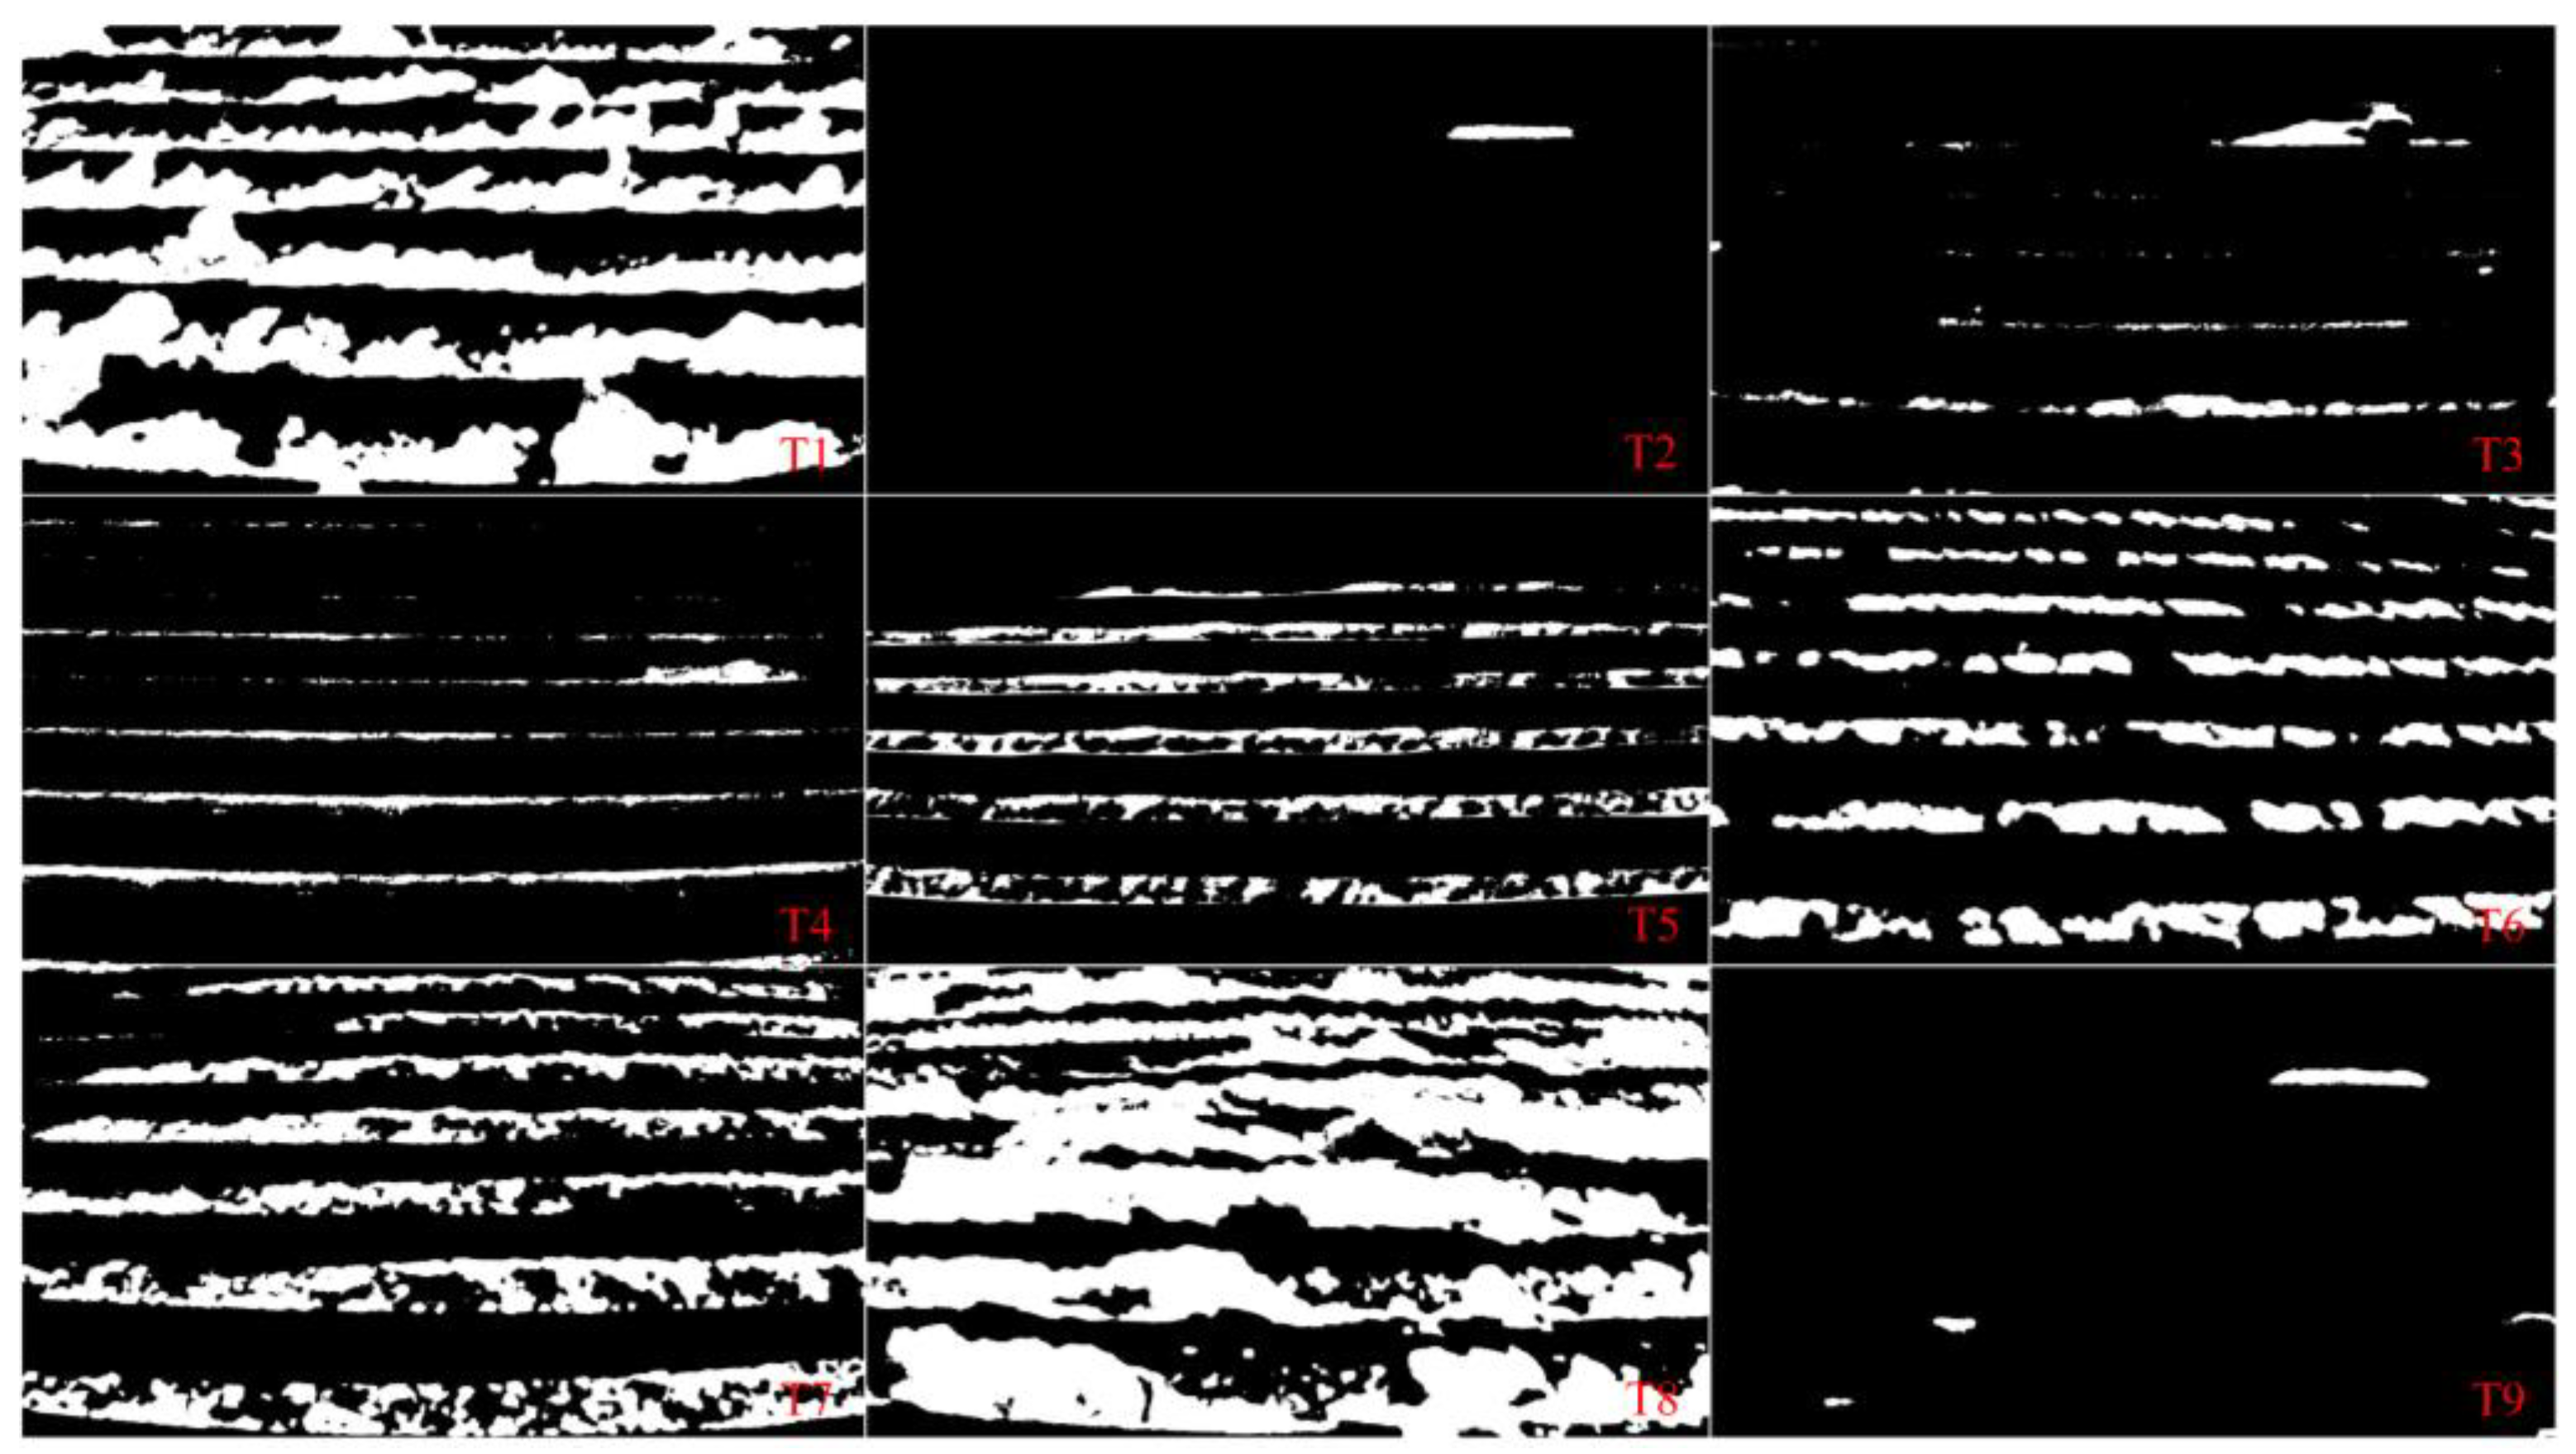
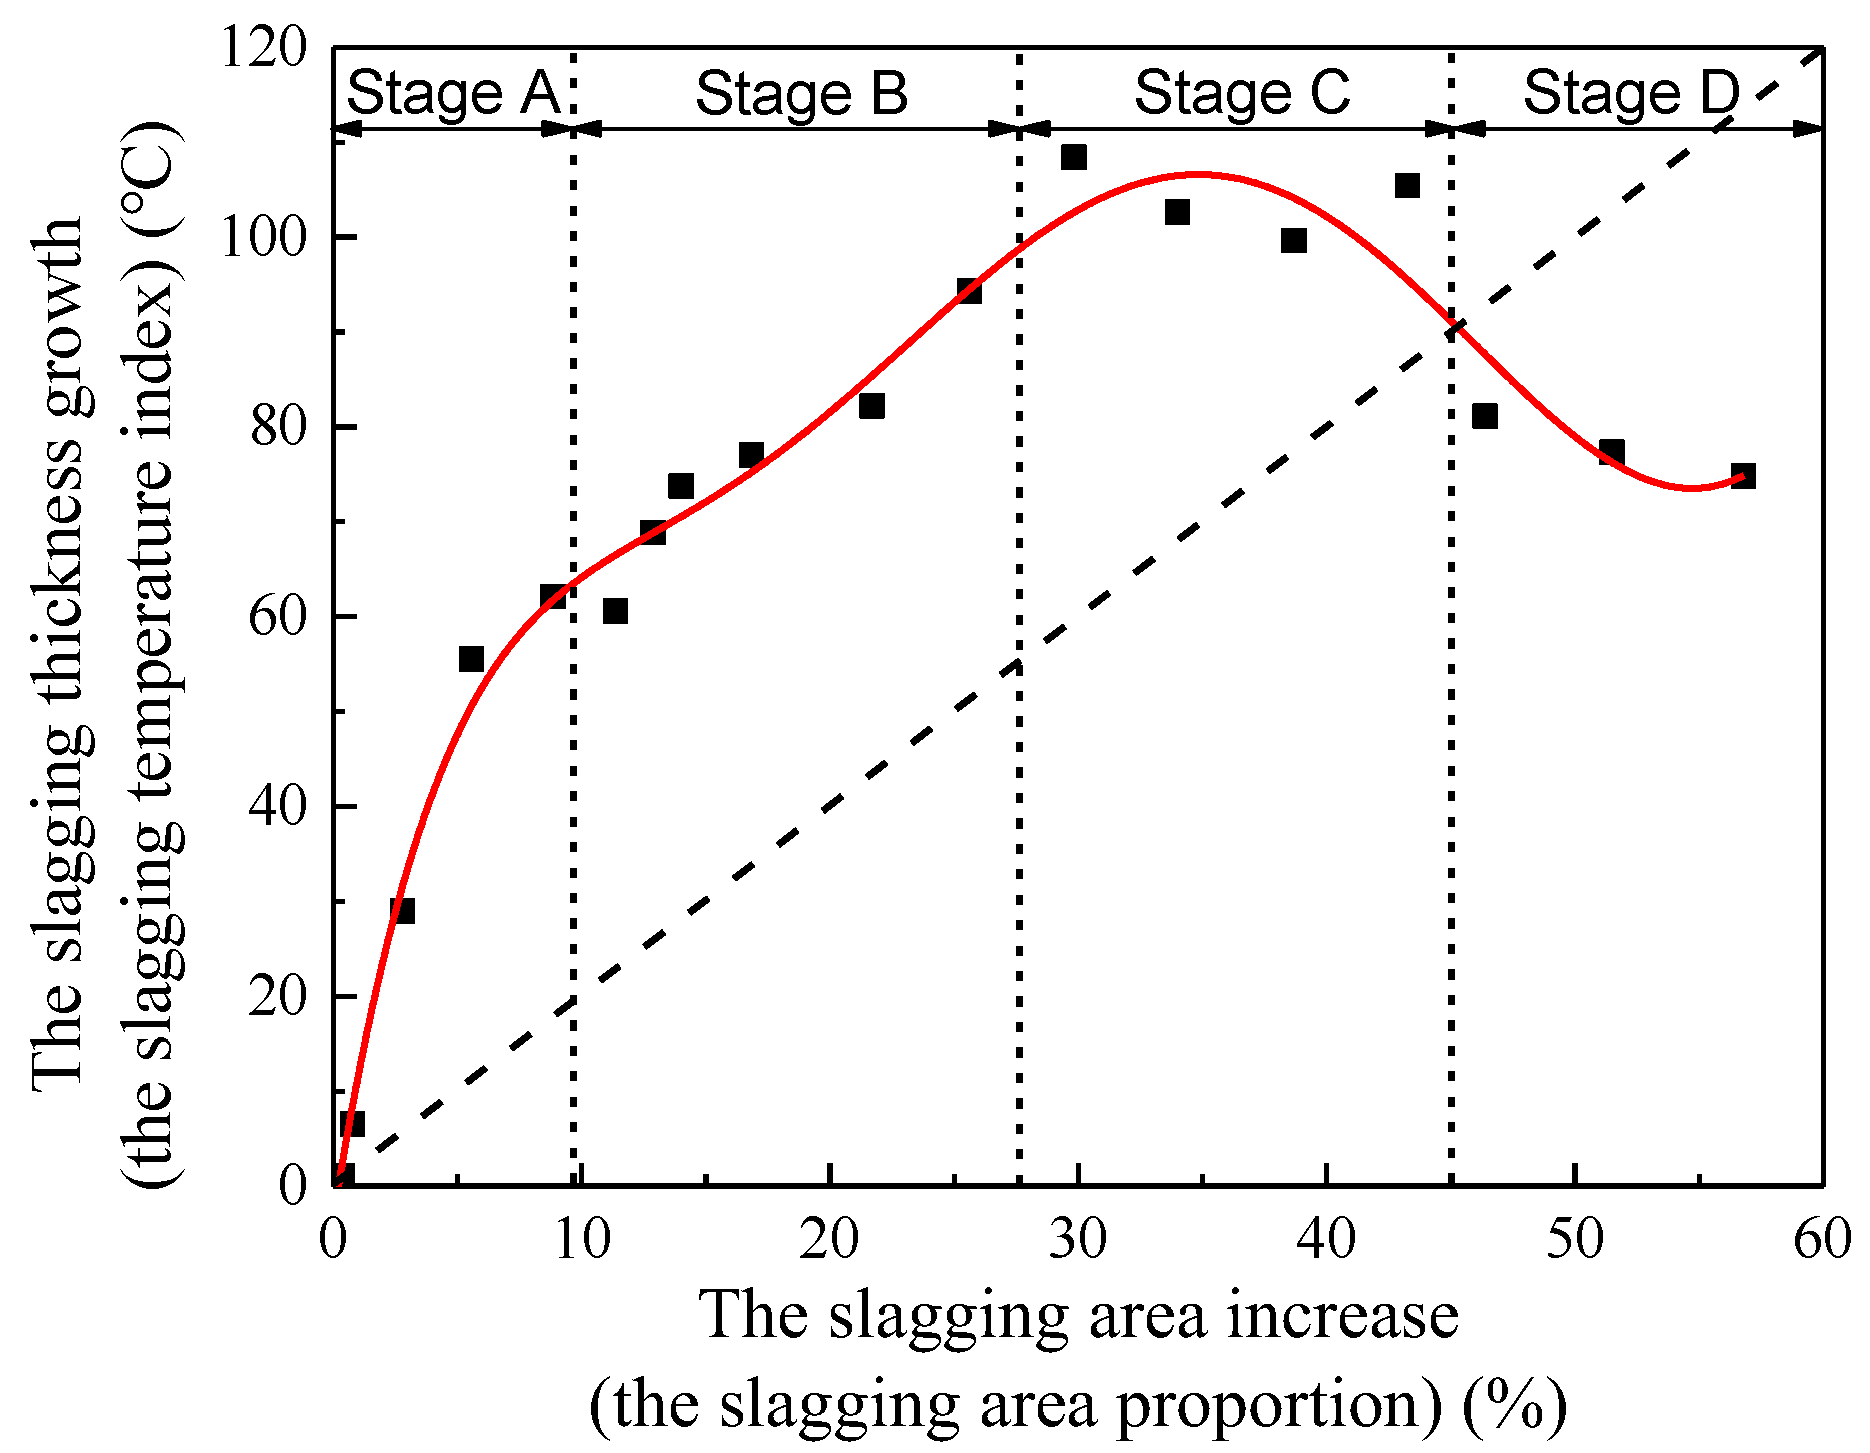
Figure 12 shows the images of the waterwall surface around sensor a9 at different times in Figure 11b after binarization, and Table 2 shows the quantitative data of the slagging area proportion obtained by the image recognition method. The relationship between the slagging temperature index and the slagging area proportion of the sensor a9 is shown in Figure 13. The slagging temperature can be regarded as the thickness of the slagging deposit, while the slagging area proportion represents the area of slagging. Both illustrate the slagging deposit process. It can be found that the curve consists of four segments with different slopes, and the velocity of slagging thickness growth and slagging area increase were almost unsynchronized except in stage B. In the initial stage A, the slagging deposits on the waterwall surface mainly focused on the thickness growth. Then the slagging thickness growth slowed down and the slagging area increased in stage B, in which the velocity of slagging thickness growth and area increased roughly equally. Stage C was obviously dominated by the slagging area increase, and the slagging thickness almost did not grow in this stage as in stage III in Figure 10. In the final stage D, the slagging area increased, mainly due to the slagging deposits that had covered the waterwall tube surface, not only the fin surface.
4. Conclusions
An effective waterwall surface temperature monitoring method was initially proposed to investigate the location and severity of slagging at the local area on the waterwall surface in the furnace of the operation boiler. The slagging temperature index was defined to describe the thickness growth and its effect on the heat transfer resistance from the flame in the furnace to the waterwall surface. Some conclusions are drawn as follows:
- (1)
- It was demonstrated that the measured waterwall surface temperature rose instantly, about 80–100 °C, at the location of waterwall surface slagging and only about 10–20 °C at the clean location at the moment of soot-blowing. The process of slagging deposit growth consisted of four stages. The slagging temperature index in stage III fluctuated in the range of about 90–110 °C as the slag deposit growth had stabilized. In stage IV, the temperature rapidly dropped below 60 °C due to a decline in the number and diameter of irregular pores inside the slag deposits, as well as the development of a densely sintered layer and slag layer. These findings, which have not been reported in other literature, can be used to determine the location and severity of slagging on the surface of the waterwall.
- (2)
- A digital image monitoring system was used to obtain the slagging images and gather quantitative data regarding the proportion of slagging in the local area of the waterwall surface at different times, effectively verifying the growth process of slagging deposits. It was found that the thickness growth and the area increase in slagging deposits were alternating in four stages. An intelligent soot-blowing strategy optimization system was developed based on the methods in this paper to guide the automatic and accurate operation of each soot blower around the furnace. It has been verified that the soot-blowing frequency and steam consumption can be reduced under the premise of avoiding serious slagging on the waterwall surface.
Author Contributions
Conceptualization, P.L.; methodology, P.L. and K.L.; software, K.L.; validation, K.L., Y.Z. and Z.S.; formal analysis, P.L.; investigation, P.L., K.L. and Y.Z.; resources, Y.Z. and Q.L.; data curation, P.L. and Z.S.; writing—original draft preparation, P.L.; writing—review and editing, K.L. and W.Z.; visualization, Z.S.; supervision, Q.L. and W.Z.; project administration, Y.Z.; funding acquisition, Y.Z. All authors have read and agreed to the published version of the manuscript.
Funding
The authors declare that this study received funding from the Science and Technology Programs “Development of Slagging Monitoring of Heating Surface Local Area and Closed-loop Control Technology for 1000 MW Ultra-Supercritical Boiler” of China Energy Investment Co., Ltd. and “Research and Application of Intelligent Soot-blowing for Large Coal-Fired Power Plant Boilers” of China Huadian Co., Ltd. The funders were not involved in the study design, collection, analysis, interpretation of data, the writing of this article or the decision to submit it for publication.
Data Availability Statement
Data is not available due to privacy or ethical restrictions.
Acknowledgments
The authors gratefully acknowledge China Energy Zhejiang Ninghai Power Generation Co., Ltd. and Huangshi Thermal Power Branch of Huadian Hubei Power Generation Co., Ltd. for the utilization of all the facilities and resources.
Conflicts of Interest
Author Qingyi Li was employed by the company Zhejiang Province Energy Group Co., Ltd. The remaining authors declare that the research was conducted in the absence of any commercial or financial relationships that could be construed as a potential conflict of interest.
Nomenclature
| Nomenclature | subscripts | ||
| A | heat exchange area, [m2] | cond | conduction |
| Δh | enthalpy increments, [kJ/kg] | conv | convection |
| k | attenuation coefficient | f | flame |
| n | number of waterwall tubes | f,sll | flame to slagging layer |
| Q | radiation heat transfer quantity, [W] | f,w | flame to waterwall |
| q | mass flow, [kg/s] | inl | initial layer |
| R | equivalent radius, [m] | rad | radiation |
| T | temperature, [°C] | si | slagging index |
| X | radiation angle coefficient | sil | sintered layer |
| Greek Symbol | sll | slagging layer | |
| δ | thickness, [m] | w | waterwall |
| ε | emissivity | superscripts | |
| λ | conductivity, [W/m·K] | a | assumed |
| σ | blackbody radiation constant, [W/(m2·K4] | m | measured |
References
- Borisova, A.; Popov, D. An option for the integration of solar photovoltaics into small nuclear power plant with thermal energy storage. Sustain. Energy Technol. Assess. 2016, 18, 119–126. [Google Scholar] [CrossRef]
- Gu, Y.; Xu, J.; Chen, D.; Wang, Z.; Li, Q. Overall review of peak shaving for coal-fired power units in China. Renew. Sust. Energy Rev. 2016, 54, 723–731. [Google Scholar] [CrossRef]
- Zhong, Y.; Wang, X.; Xu, G.; Ning, X.; Zhou, L.; Tang, W.; Wang, M.; Wang, T.; Xu, J.; Jiang, L.; et al. Investigation on slagging and high-temperature corrosion prevention and control of a 1000 MW ultra supercritical double tangentially fired boiler. Energy 2023, 275, 127455. [Google Scholar] [CrossRef]
- Laursen, K.; Frandsen, F.; Larsen, O. Ash deposition trials at three power stations in Denmark. Energy Fuels 1998, 12, 442–492. [Google Scholar] [CrossRef]
- Naganuma, H.; Ikeda, N.; Kawai, T.; Takuwa, T.; Ito, T.; Igarashi, Y.; Yoshiie, R.; Naruse, I. Control of ash deposition in pulverized coal fired boiler. Proc. Combust. Inst. 2009, 32, 2709–2716. [Google Scholar] [CrossRef]
- Tomeczek, J.; Wacławiak, K. Two-dimensional modelling of deposits formation on platen superheaters in pulverized coal boilers. Fuel 2009, 88, 1466–1471. [Google Scholar] [CrossRef]
- Peng, L.; Chen, H.; Li, H.; Xun, X. Innovative experimental study for slagging diagnosis based on vibration signal of the superheater tube panels in coal-fired boilers. J. Energy Inst. 2019, 92, 971–981. [Google Scholar] [CrossRef]
- Harding, N.S.; O’Connor, D.C. Ash deposition impacts in the power industry. Fuel Process. Technol. 2007, 88, 1082–1093. [Google Scholar] [CrossRef]
- Degereji, M.U.; Ingham, D.B.; Ma, L.; Pourkashanian, M.; Williams, A. Prediction of ash slagging propensity in a pulverized coal combustion furnace. Fuel 2012, 101, 171–178. [Google Scholar] [CrossRef]
- Fan, J.R.; Zha, X.D.; Sun, P.; Cen, K.F. Simulation of ash deposit in a pulverized coal-fired boiler. Fuel 2001, 80, 645–654. [Google Scholar] [CrossRef]
- Zhou, H.; Cen, K.; Sun, P. Prediction of ash deposition in ash hopper when tilting burners are used. Fuel Process. Technol. 2002, 79, 181–195. [Google Scholar] [CrossRef]
- Zhou, H.; Zhou, B.; Qu, H.; Lin, A.; Cen, K. Experimental Investigation of the Growth of Ash Deposits with and without Additives through a Digital Image Technique. Energy Fuels 2012, 26, 6824–6833. [Google Scholar] [CrossRef]
- Zhou, H.; Zhou, B.; Li, L.; Zhang, H. Experimental Measurement of the Effective Thermal Conductivity of Ash Deposit for High Sodium Coal (Zhun Dong Coal) in a 300 KW Test Furnace. Energy Fuels 2013, 27, 7008–7022. [Google Scholar] [CrossRef]
- Zhou, H.; Zhou, B.; Li, L.; Zhang, H. Investigation of the Influence of the Furnace Temperature on Slagging Deposit Characteristics Using a Digital Image Technique. Energy Fuels 2014, 28, 5756–5765. [Google Scholar] [CrossRef]
- Zhou, H.; Zhou, B.; Dong, K.; Ding, J.; Cen, K. Research on the slagging characteristics of easy to slagging coal in a pilot scale furnace. Fuel 2013, 109, 608–615. [Google Scholar] [CrossRef]
- Liu, X.; Xue, X.; Li, H.; Jin, K.; Zhang, L.; Zhou, H. A unified model of slagging particle deposition behavior with thermophoresis and dynamic mesh based on OpenFOAM. Fuel 2023, 347, 128360. [Google Scholar] [CrossRef]
- Zbogar, A.; Frandsen, F.; Jensen, P.A.; Glarborg, P. Shedding of ash deposits. Prog. Energy Combust. 2009, 35, 31–56. [Google Scholar] [CrossRef]
- Pophali, A.; Emami, B.; Bussmann, M.; Tran, H. Studies on sootblower jet dynamics and ash deposit removal in industrial boilers. Fuel Process. Technol. 2013, 105, 69–76. [Google Scholar] [CrossRef]
- Valero, A.; Cortes, C. Ash fouling in coal-fired utility boilers. Monitoring and optimization of on-load cleaning. Prog. Energy Combust. 1996, 22, 189–200. [Google Scholar] [CrossRef]
- Anitha Kumari, S.; Srinivasan, S. Ash fouling monitoring and soot-blow optimization for reheater in thermal power plant. Appl. Therm. Eng. 2019, 149, 62–72. [Google Scholar] [CrossRef]
- Shi, Y.; Wang, J.; Liu, Z. On-line monitoring of ash fouling and soot-blowing optimization for convective heat exchanger in coal-fired power plant boiler. Appl. Therm. Eng. 2015, 78, 39–50. [Google Scholar] [CrossRef]
- Pattanayak, L.; Ayyagari, S.P.K.; Sahu, J.N. Optimization of sootblowing frequency to improve boiler performance and reduce combustion pollution. Clean Techn. Environ. 2015, 17, 1897–1906. [Google Scholar] [CrossRef]
- Teruel, E.; Cortés, C.; Ignacio Díez, L.; Arauzo, I. Monitoring and prediction of fouling in coal-fired utility boilers using neural networks. Chem. Eng. Sci. 2005, 60, 5035–5048. [Google Scholar] [CrossRef]
- Zhou, Y.; Xue, Z.; Ping, J.; Li, P.; Wu, X. Experimental Investigation of the Scaling-off Location and the Slag Mass in Pulverized Coal-Fired Boiler with Water-Cooled Slag Removal. Energy Fuels 2017, 31, 6625–6636. [Google Scholar] [CrossRef]
- Afonso, R.F.; Dyas, B.E.; Johnson, S.A. Effects of coal quality on ash deposition and the use of advanced testing techniques. In Proceedings of the 3rd International Conference on the Effects of Coal Quality on Power Plants, San Diego, CA, USA, 25–27 August 1992. [Google Scholar]
- Bilirgen, H. Slagging in PC boilers and developing mitigation strategies. Fuel 2014, 115, 618–624. [Google Scholar] [CrossRef]
- Xu, L.; Huang, Y.; Yue, J.; Dong, L.; Liu, L.; Zha, J.; Yu, M.; Chen, B.; Zhu, Z.; Liu, H. Improvement of slagging monitoring and soot-blowing of waterwall in a 650MWe coal-fired utility boiler. J. Energy Inst. 2021, 96, 106–120. [Google Scholar] [CrossRef]
- Zhang, S.; Shen, G.; An, L.; Li, G. Ash fouling monitoring based on acoustic pyrometry in boiler furnaces. Appl. Therm. Eng. 2015, 84, 74–81. [Google Scholar] [CrossRef]
- Zhang, S.; Shen, G.; An, L.; Niu, Y.; Jiang, G. Monitoring ash fouling in power station boiler furnaces using acoustic pyrometry. Chem. Eng. Sci. 2015, 126, 216–223. [Google Scholar] [CrossRef]
- Peña, B.; Teruel, E.; Díez, L.I. Soft-computing models for soot-blowing optimization in coal-fired utility boilers. Appl. Soft Comput. 2011, 11, 1657–1668. [Google Scholar] [CrossRef]
- Peña, B.; Teruel, E.; Díez, L.I. Towards soot-blowing optimization in superheater. Appl. Therm. Eng. 2013, 61, 737–746. [Google Scholar] [CrossRef]
- Rushdi, A.; Sharma, A.; Gupta, R. An experimental study of the effect of coal blending on ash deposition. Fuel 2004, 83, 495–506. [Google Scholar] [CrossRef]
- Zhang, J.; Zhao, Y.; Wei, C.; Yao, B.; Zheng, C. Mineralogy and microstructure of ash deposits from the Zhuzhou coal-fired power plant in China. Int. J. Coal Geol. 2010, 81, 309–319. [Google Scholar] [CrossRef]
- Niu, Y.; Tan, H.; Ma, L.; Pourkashanian, M.; Liu, Z.; Liu, Y.; Wang, X.; Liu, H.; Xu, T. Slagging Characteristics on the Superheaters of a 12 MW Biomass-Fired Boiler. Energy Fuels 2010, 24, 5222–5227. [Google Scholar] [CrossRef]
- Yang, Y.; Huang, Q.; Ma, P.; Li, S. Mechanistic studies on the slagging propensity in low-rank coal combustion. Combust. Flame 2022, 238, 111956. [Google Scholar] [CrossRef]
- Ilyushechkin, A.Y.; Hla, S.S.; Chen, X.; Roberts, D.G. Effect of sodium in brown coal ash transformations and slagging behaviour under gasification conditions. Fuel Process Technol. 2018, 179, 86–98. [Google Scholar] [CrossRef]
- Wang, Y.; Jin, J.; Liu, D.; Yang, H.; Kou, X. Understanding ash deposition for Zhundong coal combustion in 330 MW utility boiler: Focusing on surface temperature effects. Fuel 2018, 216, 697–706. [Google Scholar] [CrossRef]
- Rousseau, P.; Laubscher, R. A thermofluid network-based model for heat transfer in membrane walls of pulverized coal boiler furnaces. Therm. Sci. Eng. Prog. 2020, 18, 100547. [Google Scholar] [CrossRef]
- Wang, H.; Zhang, C.; Liu, X. Heat transfer calculation methods in three-dimensional CFD model for pulverized coal-fired boilers. Appl. Therm. Eng. 2020, 166, 114633. [Google Scholar] [CrossRef]
- Zhou, T.; Zhou, K.; Leng, W.; Zhong, H. Boiler Principle, 3rd ed.; China Electric Power Press: Beijing, China, 2013; p. 168. (In Chinese) [Google Scholar]
Figure 1.
Schematic diagram of the slagging deposit layers on the surface of the waterwall in the furnace.
Figure 1.
Schematic diagram of the slagging deposit layers on the surface of the waterwall in the furnace.

Figure 2.
Schematic diagrams of a waterwall surface temperature sensor in a furnace.

Figure 3.
Location of waterwall surface temperature sensors (×) and soot blowers (●) around the furnace of a 1000 MW ultra-supercritical boiler.
Figure 3.
Location of waterwall surface temperature sensors (×) and soot blowers (●) around the furnace of a 1000 MW ultra-supercritical boiler.

Figure 4.
Installed waterwall surface temperature sensor.

Figure 5.
(a) Schematic diagram of the digital image monitoring system; (b) The digital image monitoring system in detail.
Figure 5.
(a) Schematic diagram of the digital image monitoring system; (b) The digital image monitoring system in detail.

Figure 6.
Schematic diagram of slagging image monitoring by the digital image monitoring system.

Figure 7.
A case diagram of the image recognition of a slagging area on the waterwall surface.

Figure 8.
Two typical waterwall surface temperature variation trends in an operation with a 1000 MW coal-fired boiler.
Figure 8.
Two typical waterwall surface temperature variation trends in an operation with a 1000 MW coal-fired boiler.

Figure 9.
The slagging temperature index at the location of sensor a9 (covered with slag).

Figure 10.
The slagging temperature index and the data averaging by hours in time period 2 of sensor a9 (covered with slag).
Figure 10.
The slagging temperature index and the data averaging by hours in time period 2 of sensor a9 (covered with slag).

Figure 11.
The images of the waterwall surface of the local area around sensor a8 (a) and sensor a9 (b) at different times.
Figure 11.
The images of the waterwall surface of the local area around sensor a8 (a) and sensor a9 (b) at different times.

Figure 12.
The images of the waterwall surface around sensor a9 (covered with slag) at different times after binarization and the lagging area proportion quantitative data.
Figure 12.
The images of the waterwall surface around sensor a9 (covered with slag) at different times after binarization and the lagging area proportion quantitative data.

Figure 13.
The relationship between the slagging temperature index and the slagging area proportion of sensor a9 (covered with slag).
Figure 13.
The relationship between the slagging temperature index and the slagging area proportion of sensor a9 (covered with slag).


Table 1.
The characteristics of the fallen-off slag and the boiler-fired coal.
| Parameters | Value | |
|---|---|---|
| Coal heating value (MJ/kg) | 22.34 | |
| Coal moisture (wt % ar) | 15.1 | |
| Proximate analysis of coal (wt %, ar) | Ash | 10.38 |
| Volatile matter | 27.48 | |
| Fixed carbon | 47.04 | |
| Ultimate analysis of coal (wt %, ar) | C | 60.46 |
| H | 3.60 | |
| O | 9.28 | |
| N | 0.85 | |
| S | 0.30 | |
| Ash fusion temperature (°C) | DT | 1200 |
| ST | 1240 | |
| HT | 1250 | |
| FT | 1270 | |
| Slag composition (wt %) | Na | 2.32 |
| Mg | 2.46 | |
| Al | 6.08 | |
| Si | 25.07 | |
| K | 1.40 | |
| Ca | 44.63 | |
| Ti | 0.22 | |
| Fe | 17.82 | |
Table 2.
The quantitative data of the slagging area proportion for images of sensor a9 (covered with slag) at different times.
Table 2.
The quantitative data of the slagging area proportion for images of sensor a9 (covered with slag) at different times.
| Parameter | T1 | T2 | T3 | T4 | T5 | T6 | T7 | T8 | T9 |
|---|---|---|---|---|---|---|---|---|---|
| Slagging area proportion (%) | 46.38 | 0.37 | 2.80 | 5.57 | 11.38 | 19.52 | 25.63 | 56.79 | 0.78 |
Disclaimer/Publisher’s Note: The statements, opinions and data contained in all publications are solely those of the individual author(s) and contributor(s) and not of MDPI and/or the editor(s). MDPI and/or the editor(s) disclaim responsibility for any injury to people or property resulting from any ideas, methods, instructions or products referred to in the content. |
© 2023 by the authors. Licensee MDPI, Basel, Switzerland. This article is an open access article distributed under the terms and conditions of the Creative Commons Attribution (CC BY) license (https://creativecommons.org/licenses/by/4.0/).
Share and Cite
MDPI and ACS Style
Li, P.; Li, K.; Zhou, Y.; Li, Q.; Shi, Z.; Zhong, W. An Effective Strategy for Monitoring Slagging Location and Severity on the Waterwall Surface in Operation Coal-Fired Boilers. Energies 2023, 16, 7925. https://doi.org/10.3390/en16247925
AMA Style
Li P, Li K, Zhou Y, Li Q, Shi Z, Zhong W. An Effective Strategy for Monitoring Slagging Location and Severity on the Waterwall Surface in Operation Coal-Fired Boilers. Energies. 2023; 16(24):7925. https://doi.org/10.3390/en16247925
Chicago/Turabian StyleLi, Pei, Ke Li, Yonggang Zhou, Qingyi Li, Zifu Shi, and Wei Zhong. 2023. "An Effective Strategy for Monitoring Slagging Location and Severity on the Waterwall Surface in Operation Coal-Fired Boilers" Energies 16, no. 24: 7925. https://doi.org/10.3390/en16247925
Note that from the first issue of 2016, this journal uses article numbers instead of page numbers. See further details here.