Article

The Influence of Ink Formulation and Preparation on the Performance of Proton-Exchange Membrane Fuel Cell

1
LEMTA, Université de Lorraine, CNRS, F-54000 Nancy, France
2
Electrochemistry Laboratory, Paul Scherrer Institute, 5232 Villigen PSI, Switzerland
3
IJL, Université de Lorraine, CNRS, 88000 Épinal, France
*
Author to whom correspondence should be addressed.
Energies 2023, 16(22), 7519; https://doi.org/10.3390/en16227519
Submission received: 15 October 2023 / Revised: 31 October 2023 / Accepted: 3 November 2023 / Published: 10 November 2023
(This article belongs to the Section A5: Hydrogen Energy)

Abstract

:
The fabrication step of the catalyst layer (CL) is important to master in order to achieve good performance in fuel cells. Nevertheless, the final structure of a CL depends on many factors, such as the ink composition and preparation, as well as the order of its preparation steps. However, it is not easy for neophytes to understand the relationship between the composition of the ink with the obtained structure of the catalyst layer and its performance in fuel cells. In this work, a systemic experimental study was carried out in order to qualitatively correlate the performance of the PEMFC with the structure of the catalyst layer by playing on different parameters such as the composition and preparation of the ink and the operating conditions. All of the prepared samples were characterized by electron microscopy and profilometry, as well as by electrochemical tests at a single-cell level. The main results show that (i) the chosen ratio and ingredients result in a catalyst layer structure that can affect the PEMFC performance in different ways, and (ii) the reproducibility of the results requires particular care in the choice of catalyst and carbon support.

1. Introduction

Since the era of industrialization, global emissions of greenhouse gases (particularly CO2) have increased, leading to the global warming we are experiencing today. In view of this alarming situation, we must develop and use CO2-free power devices. Among the possible CO2-free electrical devices, proton-exchange membrane fuel cells (PEMFCs) can be considered as a mature technology using hydrogen as an energy vector [1]. They can be described as an electrochemical converter, consuming H2 and O2 to produce electricity and water as a byproduct. The core of a PEMFC is called a membrane electrode assembly (MEA), which consists of a proton-exchange membrane sandwiched by two electrodes. The well-known membrane used in PEMFCs is the popular Nafion® membrane, which has a perfluorinated backbone and sulfonated groups as proton carriers. At each electrode, a specific electrochemical reaction occurs, such as the hydrogen oxidation reaction (HOR) or the oxygen reduction reaction (ORR) at the anode and cathode, respectively [2,3,4]. The electrodes or catalyst layers (CLs) are not only the site of electrochemical reactions but also of electron, proton, and gas transport. For this reason, CLs typically contain (i) carbon to transport electrons, (ii) a catalyst to perform an electrochemical reaction, and (iii) an ionomer to bind the carbon and catalyst together and transport protons.
In addition, a catalyst layer (CL) is usually obtained from a catalyst ink dispersion, which is composed of the three components (i)–(iii) mentioned above, and one or more solvents as the dispersion medium. The catalyst ink is first deposited on a support using a coating device and, after evaporation of the solvent(s), a CL is thus deposited on the chosen support. Therefore, solvents are generally considered sacrificial ingredients since they are removed via evaporation during the coating step. If the chosen support is a membrane, then a catalyst-coated membrane (CCM) is prepared, and the resulting MEA is called a CCM-based MEA. If the chosen support is a gas diffusion layer (GDL), then a gas diffusion electrode (GDE) is prepared, and the resulting MEA is called a GDE-based MEA. Generally, CCM-based MEAs are preferred over GDE-based MEAs due to better interface contact between the membrane and CL [3,5,6,7,8,9], leading to a better performance in PEMFCs. Furthermore, to ensure proper electron, proton, and gas transport, CLs must have a porous structure to transport gases and water, as well as a homogeneous triple phase boundary (TPB), i.e., carbon, ionomer, and catalyst have to be well connected to each other [10,11,12,13,14,15,16].
However, it is not easy to fabricate a catalyst layer that meets all the specifications required above to achieve the best performance at the single-cell scale. Usually, the fabrication of optimal CLs is kept secret because it is the added value of researchers in academic or private settings. Paradoxically, the literature contains numerous studies on the composition and preparation of catalyst inks and coatings [17,18,19,20,21,22,23,24,25,26,27,28,29,30,31,32,33]. Concerning catalyst ink composition, there are different optimal amounts of the Nafion® ionomer ranging from 15–50 wt.% in the literature [18,19,20,21,22,23], due to the choice of coating techniques, current density, Pt weight (%), and loading, among others. With respect to the weight fraction of Pt in the catalyst inks, we have the choice of a different wt.% of Pt in the fuel cell market. Some researchers found that increasing the ratio of the Pt weight to carbon can directly improve the performance of the MEA [26,27]. However, Wuttikid et al. [19] found that the optimal Nafion® content depends on the weight of platinum: the larger it is in the catalyst, the less Nafion® ionomer is needed to optimize the electrochemical reaction. In addition, the nature and ratio of solvents used in the preparation of catalyst inks and also the way to prepare catalyst inks also have an impact on the structure and performance of the catalyst layer [28,29,30,31,32,33,34,35]. Although the literature is useful and necessary to learn and get started in the field of catalyst coatings and ink preparation, it seems for us that the literature does not tell us how to concretely adjust the ratio of ingredients to improve the performance of PEMFC catalyst layers nor the reasons behind each change in parameters.
In order to study new types of materials for fuel cell application, such as catalysts or ionomers, we must become familiar with the field of coatings and ink preparation. As newcomers to the field of ink coatings, we firstly began to investigate the influence of spray-coating parameters (such as spray patterns, mask thickness, and nozzle height) on the performance of CCM-based MEAs for a given ink composition and preparation. In our previous work [36], our results revealed that homogeneous coated layers give a better performance than heterogeneous coatings for a given catalyst ink. However, a uniform coating does not mean good performance in an operating PEMFC when comparing the origin and batch of Pt/C catalysts while keeping the same recipe and ink preparation method. Indeed, we compared several batches and suppliers of Pt/C catalysts. Even for the same product reference, we did not obtain the same results in terms of fuel cell performance, even with the same ink preparation, formulation, and deposition steps. Although our previous results can be explained by a difference in the Pt and carbon particle size in the different product batches, it is necessary to learn how to manufacture CLs with a similar performance even if the catalyst batches change. To this end, we need to understand (i) how the catalyst powder, ionomer, and solvents interact in the catalyst ink, (ii) how to prepare a good catalyst ink, and (iii) how to correctly analyze the performance of the resulting catalyst layers for given ingredients and ink preparation.
Because the literature can be very confusing regarding the optimal ink composition for PEMFCs, a systemic study of the composition and preparation of catalyst ink was performed with the aim of qualitatively understanding the relationship between the catalyst layer structure and performance in PEMFCs. For that, we prepared different CCM-based MEAs by varying the ink compositions such as the Nafion® ionomer content, Pt wt.% on carbon, ratio of water to isopropanol, and the way to prepare the catalyst ink. All deposited catalyst layers were obtained using an ultrasonic spray-coating bench, with the optimal configuration reported in our previous paper [36]. Then, they were characterized by SEM and profilometry techniques to check their morphology and coating thickness, respectively. In addition, the prepared samples were tested on a PEMFC bench via polarization curve measurements to correlate the performance with the structure of the catalyst layer. In this work, we tried to investigate some parameters that can have an impact on the performance of the PEMFC, starting with (i) the operating conditions for a given MEA, (ii) the number of coating layers during the preparation of the CCMs by an ultrasonic spray-coating bench, (iii) the ink composition, i.e., the amount of Nafion® ionomer, the ratio of water to isopropanol, the weight percent of Pt, and (iv) the preparation of the ink with and without the use of a disperser. The objective is firstly to qualitatively correlate the final structure of the CL with the deduced mass and charge-transfer limitations, and thus apprehend the performance of the PEMFC and secondly, to show how difficult it is to obtain good CLs, even with knowledge of CL composition and preparation. We hope that the results gathered in this paper can potentially help those new to ink preparation to understand the importance of ink composition and preparation in PEMFC performance.

2. Materials and Methods

2.1. Materials

Alcohol-based Nafion® dispersion 1100 EW at 20 wt.% (D2021), 40 wt.% Pt/C powders, named FCS 40% Pt/C-Vulcan XC-72R (2019), FCS 40% Pt/C-Vulcan XC-72R (2021), and FCS 40% Pt/C-Black (2020), as well as 20 wt.% Pt/C powders, named FCS 20% Pt/C-Vulcan XC-72R (2019) and FCS 20% Pt/C-Black (2020), were purchased from Fuel Cell Store. The 40 wt.% Pt/C powders from Alfa Aesar, called AA 40% Pt/C (2020) and AA 40% Pt/C (2021), were also purchased for comparison. Here, the numbers in brackets after the catalyst names refer to the year of purchase. Additionally, Sigracet® GDLs 28BC with a microporous layer and PTFE (5 wt.%) were also purchased from Fuel Cell Store. Isopropanol with a purity of 99.8% was purchased from Carlo Erba. In this work, high-purity demineralized water (18 MΩ cm) was used. The Nafion® 212 membrane was purchased from Ion Power.
All coating layers were prepared with an automatic ultrasonic spray bench (ExactaCoat) from Sono-Tek Corp. (Milton, MA, USA). In this work, an ACCUMIST nozzle (120 kHz) was used. A 1 mm thick polycarbonate (PC) mask was used during coating.
UltraTurrax, a high-shear disperser (IKA® T 10), was used for specific inks (see below).
A Dektak XT tactile profilometer (Bruker) was used to measure the thickness of the deposited layers. The size of the profilometer probe was 2 µm and the measurement error was approximately 10 nm. The measurement step varied depending on the time required to perform the measurement. The maximum sample length that the device could measure was 4 cm.
Scanning electron microscopy (SEM) images were taken with a Gemini SEM 500 device from Zeiss.

2.2. Preparation of Catalyst Inks

In order to study the relationship between the ink properties and the performance of CCMs in PEMFCs, several inks were prepared with different formulations and preparation modes.
The first preparation mode, referred to as the general catalyst ink preparation (or later in the text, as the general method), has been used in a previous work [36]. Unless otherwise stated, this mode of ink preparation was kept regardless of the ionomer ratio, solvent ratio, and Pt/C powders. All the prepared inks were composed of 0.4 g of Pt/C in a mixture of water and isopropanol (total mass of solvents = 24 g). The ratio of Nafion® ionomer ( R N a f i o n   i o n o m e r ) in the dispersion was calculated according to Equation (1).
R N a f i o n   i o n o m e r = m N a f i o n s o l i d   i o n o m e r m N a f i o n s o l i d   i o n o m e r + m c a t a l y s t   p o w d e r                        
where  m N a f i o n s o l i d   i o n o m e r  is the mass of the Nafion® ionomer in solid form and  m c a t a l y s t   p o w d e r  is the mass of the catalyst powder in the dispersion.
Typically, each ink was prepared in a 100 ml vial with a screw cap to prevent isopropanol evaporation. A stirring bar was used to mix the dispersion. The first step was to introduce the desired amount of Pt/C powder and water to avoid the ignition of Pt upon encountering isopropanol. Then, the isopropanol and Nafion® ionomer were poured inside the vial. At each intermediate step, an ultrasonic bath was used for at least 1 h to spread the particles in the dispersion. Furthermore, the final step of ink preparation was obtained after one night in an ultrasonic bath (Elmasonic S10, 37 kHz, 30 W). The prepared ink was used within 3 days to prevent ink sedimentation and solvent evaporation. When the prepared ink was not used for coating, it was placed under magnetic stirring. Before reuse, the prepared and stirred ink was introduced into an ultrasonic bath for at least 1 h. Once the suspension was ready, a large amount of ink was pumped into the syringe of the coating machine.
The second preparation method is referred to as the mixed catalyst ink preparation method (or later in the text as the mixed method), due to the high-shear disperser step (IKA® T10 Ultra Turrax). The latter is used after the addition of isopropanol, but either before or after the addition of the Nafion® ionomer in the description of the general catalyst ink preparation mode. The step lasts 30 min at a speed of about 16.000 rpm.
For clarity, the ink compositions studied are reported below and summarized in Table 1.
The first batch of inks consisted of 0.4 g of 40 wt.% Pt/C in a 1:2 mixture of water and isopropanol. The Nafion® ionomer ratios were set at 13, 23, or 33 wt.%.
The second batch of inks was composed of 0.4 g of 40 wt.% Pt/C, with a Nafion® ionomer wt. ratio of 33%, in a 1:2 or 2:1 mixture of water and isopropanol.
The third batch of inks consisted of 33 wt.% of Nafion® ionomer ratio, in a 1:2 mixture of water and isopropanol, and 0.4 g of 20 or 40 wt.% of Pt in the Pt/C powders.
The fourth batch of inks compared 40 wt.% of Pt/C from 2 different suppliers, prepared using the general or mixed catalyst ink preparation methods. The prepared inks contained 33 wt.% Nafion® ionomer in a 1:2 mixture of water and isopropanol.

2.3. Preparation of CCMs

All studied CCM samples were prepared with a Nafion® 212 membrane and an ultrasonic spray bench (ExactaCoat, from Sono-Tek Corp.), at a nozzle height of 60 mm, with a spray pattern consisting of 2 vertical and 2 horizontal serpentine layers (configuration C mentioned in [36]) and a 1 mm thick polycarbonate mask, as also described in [36]. Depending on the desired Pt loading, the spray pattern can be repeated two or three times, resulting in 8 or 12 CCM layers, respectively.
Unless otherwise stated, 12 CCM layers were prepared with a Pt loading of approximately 0.3 mg cm−2 for both electrodes with an active area of 7.22 cm2 (1.9 cm × 3.8 cm). The Pt loading (LPt) of each catalyst layer (CL) was obtained by multiple passes of the ultrasonic nozzle over a piece of aluminum foil and was estimated by weight difference via Equations (2)–(5).
R C a t a l y s t   p o w d e r = 1 R N a f i o n   i o n o m e r
m d e p o s i t e d = m f m i
where  R C a t a l y s t   p o w d e r  is the weight ratio of the catalyst powder in the dispersion,  m f  is the mass at the end of the coating of the aluminum foil piece, and  m i  is the mass of the pristine aluminum foil piece.
m P t = m d e p o s i t e d × R C a t a l y s t   p o w d e r × R P t   w t
where  R P t   w t  is the ratio of Pt in the catalyst powder. For instance, it is 0.4 for 40 wt.% Pt.
L P t = m P t S A  
where  S A  is the active surface area (7.22 cm2 in our work). Of course, the estimate of  L P t  is only valid if we assume that the ink dispersion is homogeneous during the spray-coating steps.

2.4. Thickness and Porosity of Coated Samples

The thickness and homogeneity of the deposited layers were characterized by a Dektak XT tactile profilometer (Bruker). Due to the constraints of this technique, specific samples deposited on glass substrates were prepared, as shown in Figure 1. The shape and thickness of the deposited layer were characterized according to the guidelines in Figure 1.
The measured thickness of the deposited catalyst layers was used to estimate the porosity of the catalyst layers through Equation (6).
ϕ = S A × L C L x i o n o m e r × m C L ρ i o n o m e r x P t / C   × m C L ρ P t / C S A × L C L
where  L C L  is the measured thickness of the deposited catalyst layers,  x i o n o m e r  and  x P t / C    are the mass fraction of the ionomer and catalyst powder, respectively, and  m C L  is the mass of the deposited catalyst layer.  ρ    are the densities of the Nafion ionomer ( ρ i o n o m e r  = 2.1 g cm−3) and Pt/C powders ( ρ P t / C ) , which were calculated with the mass fraction of Carbon Vulcan XC-72R (0.09611 g cm−3) or carbon black (1.95 ± 0.15 g cm−3) and platinum black (21.45 g cm−3). Typically, for 40% wt. of Pt,  ρ P t / C _ V u l c a n  is estimated to 8.64 g cm−3 and  ρ P t / C _ B l a c k  is estimated to 9.75 (±0.045) g cm−3.

2.5. Electrochemical Measurements

The prepared CCMs were tested on a lab-made fuel cell test bench to evaluate their performance via electrochemical characterizations, such as (i) polarization curve, (ii) cyclic voltammetry to evaluate the electrochemical active surface area (ECSA) of the catalyst, and (iii) electrochemical impedance spectroscopy to estimate the charge-transfer resistance of the catalyst layer. The fuel cell was mounted in counterflow mode with two 28BC GDLs and two PTFE gaskets (150 µm).
Before any fuel cell bench test, a conditioning step is needed to ensure membrane hydration and catalyst activation. Conditioning was carried out as in the literature [37,38]. This step consists of cycling the voltage between OCV (open-circuit voltage), 0.3 V, and 0.6 V every 30 s for at least 6 h. The flow rates were automatically calculated on the previously measured currents.
The operating temperature was 70 °C, and the relative humidity (RH) was chosen at 60 and 80% for both air and hydrogen (H2). However, the H2/air stoichiometry was maintained at 1.5/5 for both RHs (see below). All experiments were carried out under atmospheric pressure.
After this step, electrochemical characterizations were performed. All characterizations were performed automatically using lab-made LabVIEW programs. Whenever necessary, the cell was flipped over to characterize both sides of the cell and test the homogeneity of the prepared CCM, as described in [36]. For convenience, the cell configuration scheme is shown in Figure S1 (see Supplementary Information). It was assumed that if the two sides of a prepared CCM are similar, then they should give a similar performance in the PEMFC regardless of the cell configuration (Face 1 or Face 2 (Figure S1)). This method also allows us to check the stability of the ink during the coating process. Therefore, both cell configurations were tested and their performances in the PEMFC were compared via polarization curves.

2.5.1. Polarization Curves

After the conditioning step, polarization curves were performed with air and H2 stoichiometries of 5 and 1.5, respectively. The other working conditions remained the same as for the conditioning step at a given RH. Each polarization curve resulted in an average of two measurements of voltage versus current. The first measurement started at 0 A (OCV) and the current gradually increased until the measured voltage reached 0.3 V. The second measurement started at the last point of the first measurement. The current was progressively decreased until it reached 0 A. Each current step took 60 s and the average of the measured voltage was calculated.

2.5.2. Cyclic Voltammetry (ECSA Determination)

Cyclic voltammetry tests were performed to evaluate the ECSA of the prepared CCMs. The fuel cell was operated in the H2/N2 mode (anode and cathode, respectively). The voltage sweep rate was 50 mV s−1 and the voltage range was between 0.1 and 0.7 V. The operating temperature was set at 70 °C, and the relative humidity of the two gases was either 60 or 80%. Cyclic voltammetry measurements were repeated at least three times for each sample. Then, the average hydrogen adsorption/desorption charge, QH, was defined in Equation (7), and was determined by integrating the two hydrogen adsorption/desorption peaks from the obtained cyclic voltammetry curves.
Subsequently, the ECSA was calculated by Equation (8).
Q H = Q o x Q r e d 2
E C S A = Q H C p t .   L p t = m 2 g p t
where QH (in C cm−2) is the charge density obtained from the cyclic voltammetry curve, Cpt (=210 µC cm−2Pt) is the charge needed to reduce a monolayer of protons on Pt, and Lpt is the platinum load in mg cm−2.

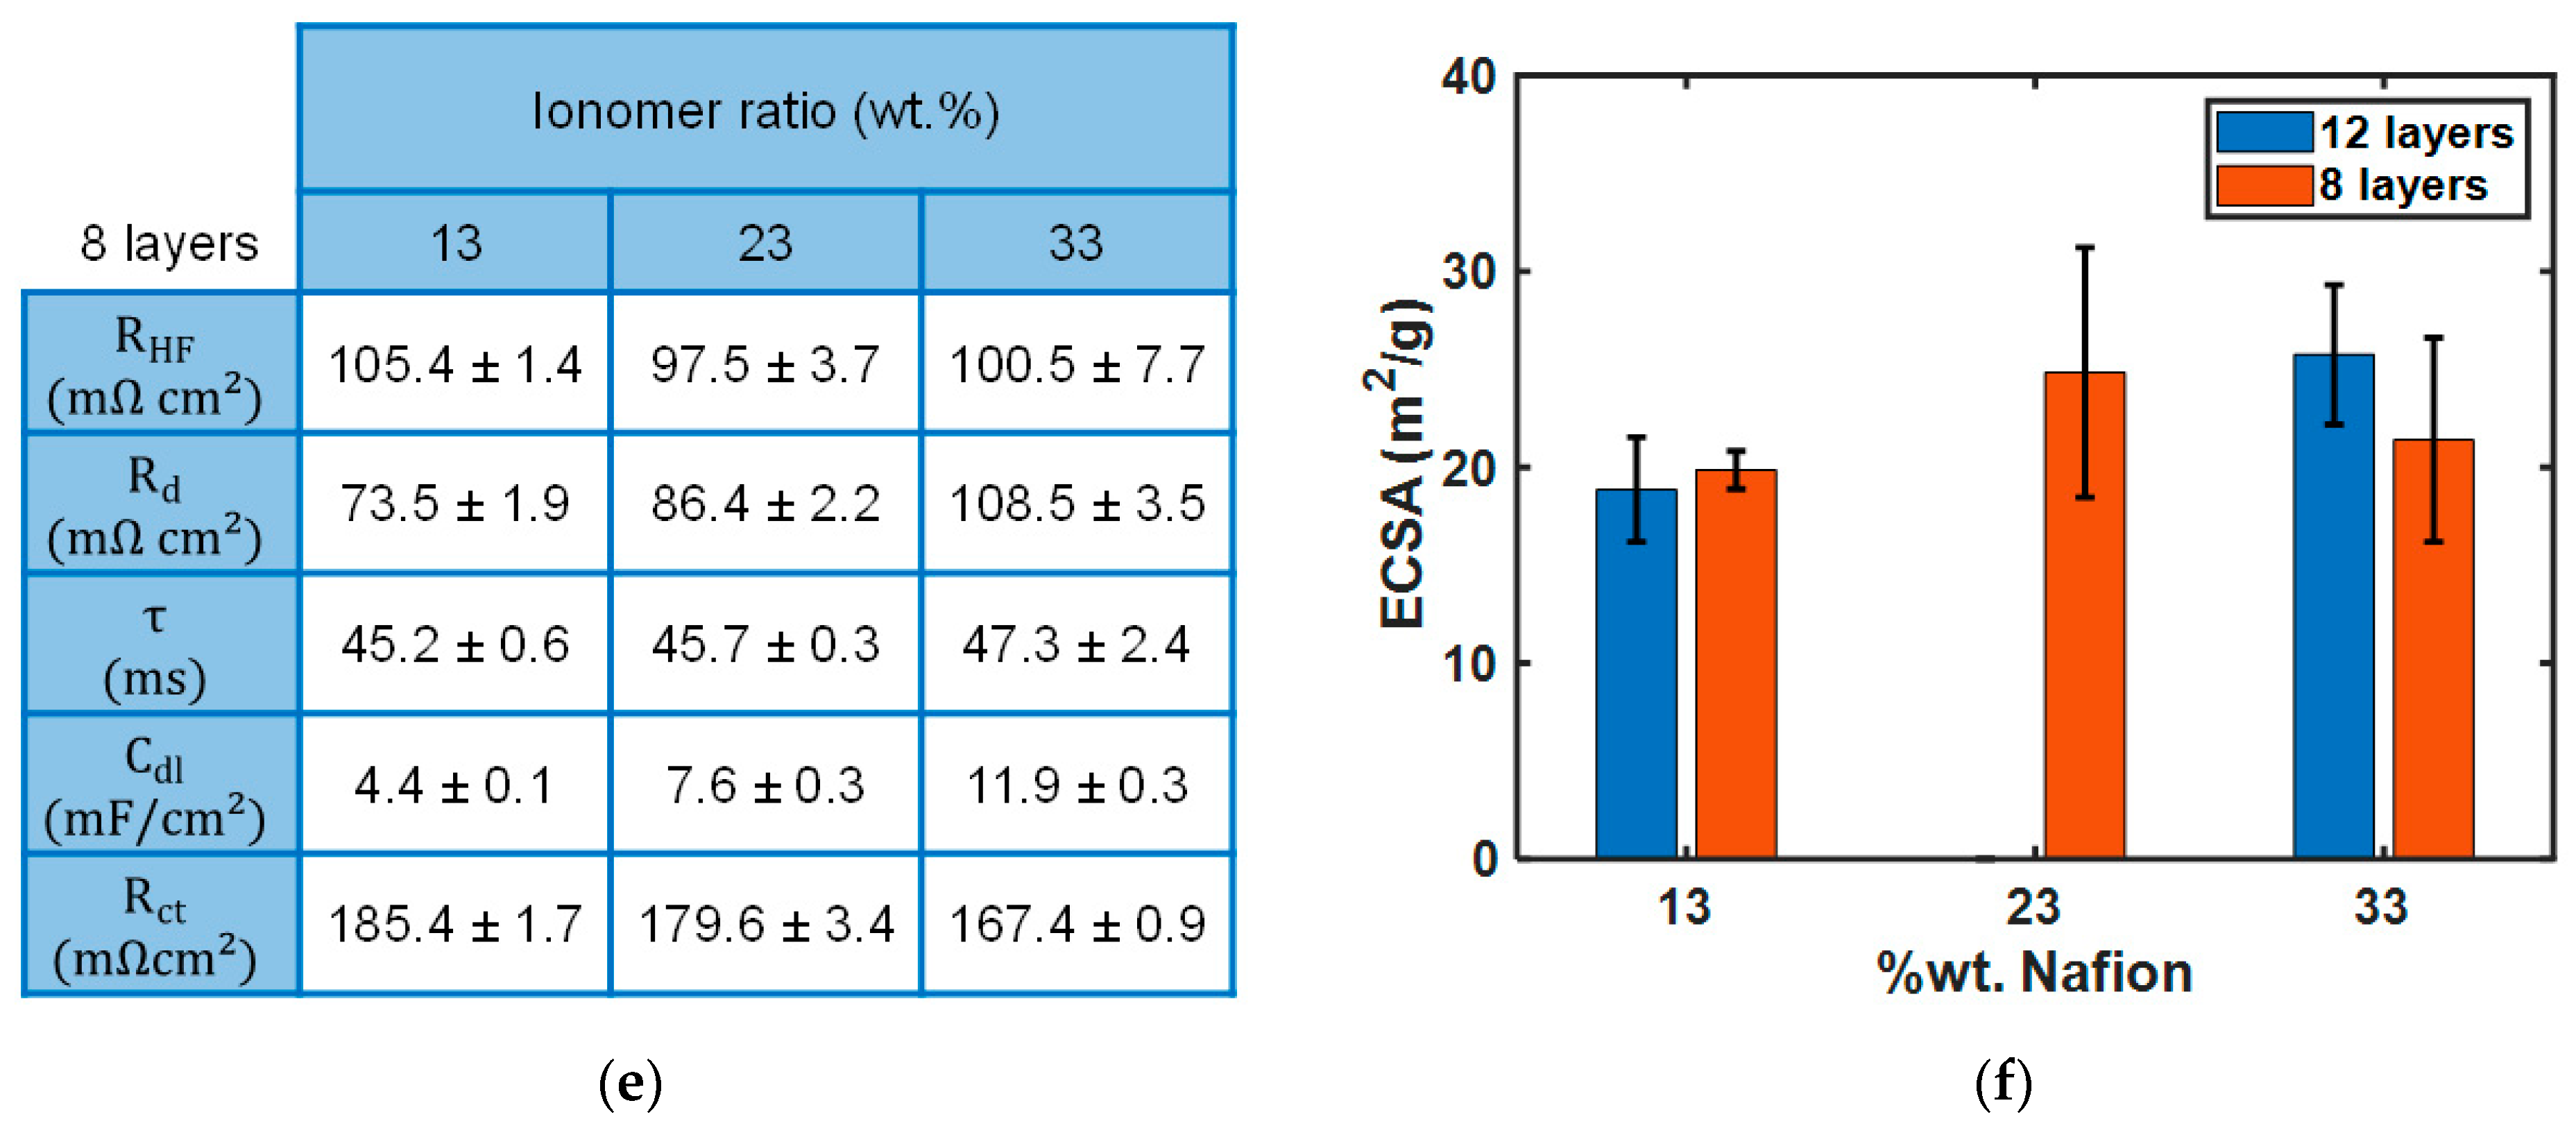
2.5.3. Electrochemical Impedance Spectroscopy (EIS)

Electrochemical impedance spectroscopy (EIS) measurements were performed to identify the properties of the different cell components. During the EIS measurements, the cell temperature was set at 70 °C and relative humidity was either 60 or 80% (depending on operating conditions). Impedance spectra were recorded in galvanostatic mode for the hydrogen and air configuration at 0.5 A with a perturbation amplitude limited to 50 mA (peak to peak), with a frequency range of 10 kHz to 20 mHz, as mentioned in [39]. The measurement was repeated every 6 hours and at least three times for all MEAs studied.
The cell impedance ( Z c e l l ) was recorded for each frequency using small perturbation currents. Its variation was analyzed and interpreted by the Warburg model (WRRG), as expressed in Equations (9) and (10). To evaluate the WRRG parameters, a MatLAB program using the least squares method was applied to minimize the difference between the model and the experiment.
Z c e l l w = R H F + 1 R c t + Z w w + i w C d l 1
with
Z w w = R d i w τ t a n h i w τ
where  R H F  is a high-frequency resistance, which results from the protonic resistance of the membrane and electronic bulk/contact resistances of/between the MEA components.  R c t  is a charge-transfer resistance, which characterizes the difficulty of an electron to move from one atom or compound to another atom or compound.  R d  is a mass diffusion resistance and  C d l  is a double-layer capacitance, which is associated with charge separation in the electrode, such as protons in the ionomer and electrons in carbon or platinum. Finally,  τ  is a diffusion time constant, and  Z w  is the finite Warburg impedance, which characterizes the contribution of oxygen transport to voltage losses.

3. Results

3.1. Operating Conditions for a Given Ink Composition

In order to increase the performance of fuel cells, one can first try to optimize the operating conditions for a given MEA by changing one parameter each time such as the cell temperature, gas stoichiometry, or relative humidity (RH). Here, an attempt was made to change the relative humidity at both electrodes (i.e., 60 vs. 80% RH), while maintaining the cell temperature at 70 °C. The operating conditions were chosen to compare with our previous data. By choosing these operating conditions, we can see that the polarization curves at 60 and 80% of the RH at both electrodes behave differently depending on the gas stoichiometry (Figure 2). When operating at 60% RH at both electrodes, the polarization curves remain similar regardless of the flow rate or gas stoichiometry. This means that the oxygen transfer is not limited by the electrode structure at 60% RH, regardless of the air stoichiometry. In contrast, increasing the relative humidity to 80% can lead to a high sensitivity to air stoichiometry. Indeed, a higher concentration of water vapor in the channels also means a lower concentration of oxygen. In addition, the higher the humidity, the greater the possibility of liquid water in the GDLs and, therefore, the lower the gaseous diffusion of oxygen. When the gases are well humidified, there is no risk of drying out, but only a risk of flooding if too much water in the MEA prevents gas transport. For this reason, the performance increases with the stoichiometry at 80% RH.
Another way of modifying the performance of a CCM-based MEA is (i) to vary the thickness of the catalyst layers for a given composition, or (ii) to change the catalyst ink composition and/or preparation. For (i), we can adjust the number of layers coated during the fabrication of the CCMs with a spray-coating machine, for a given ink. However, the Pt loading of the prepared CCMs is no longer kept constant since it is calculated as a function of the number of layers coated. Here, we assume that the thickness of the deposited layer is a function of the number of coatings. For this purpose, CCM-based MEAs were prepared with 8 or 12 layers of spray coating (see Table 2 for their Pt loading). The comparison of the polarization curves obtained with H2/air at stoichiometry 1.5/5 shows that the 8-layer CCM performs slightly better than the 12-layer CCM (Figure 3 (left)), while the Pt mass activity is much better with the 8-layer CCM than the 12-layer CCM (Figure 3 (right)). This result indicates that a thinner catalyst layer provides a better water and oxygen transfer, regardless of the Pt loading of the catalyst layers. Although the ECSA and Pt loading of the 12-layer CCM are higher than those of the 8-layer CCM (Figure 4f), the water and gas transport seems to be more affected by the thickness of the catalyst layer. In fact, the ECSA allows us to estimate all Pt sites in the catalyst layer that are capable of electrochemically adsorbing/desorbing H+ from the Nafion® membrane in an inert atmosphere. In other words, the ECSA gives us an overview of the distribution or concentration of the Nafion® ionomer on Pt (supported on carbon). In contrast, the performance of the electrode is strongly related to the quality of the construction of the triple phase boundary, i.e., the CL must have not only a good distribution between the Nafion® ionomer and Pt/C, but also a good transport of reactive gas through its thickness and also its porosity. As a result, water and gas management based on the electrode structure is very important. To understand the relationship between the ink properties and electrode structure, we attempted a systematic study by varying the amount of the Nafion® ionomer, solvent ratio, and Pt weight in the formulation of the catalytic inks (see below).

3.2. Optimization of the Composition of Catalyst Inks

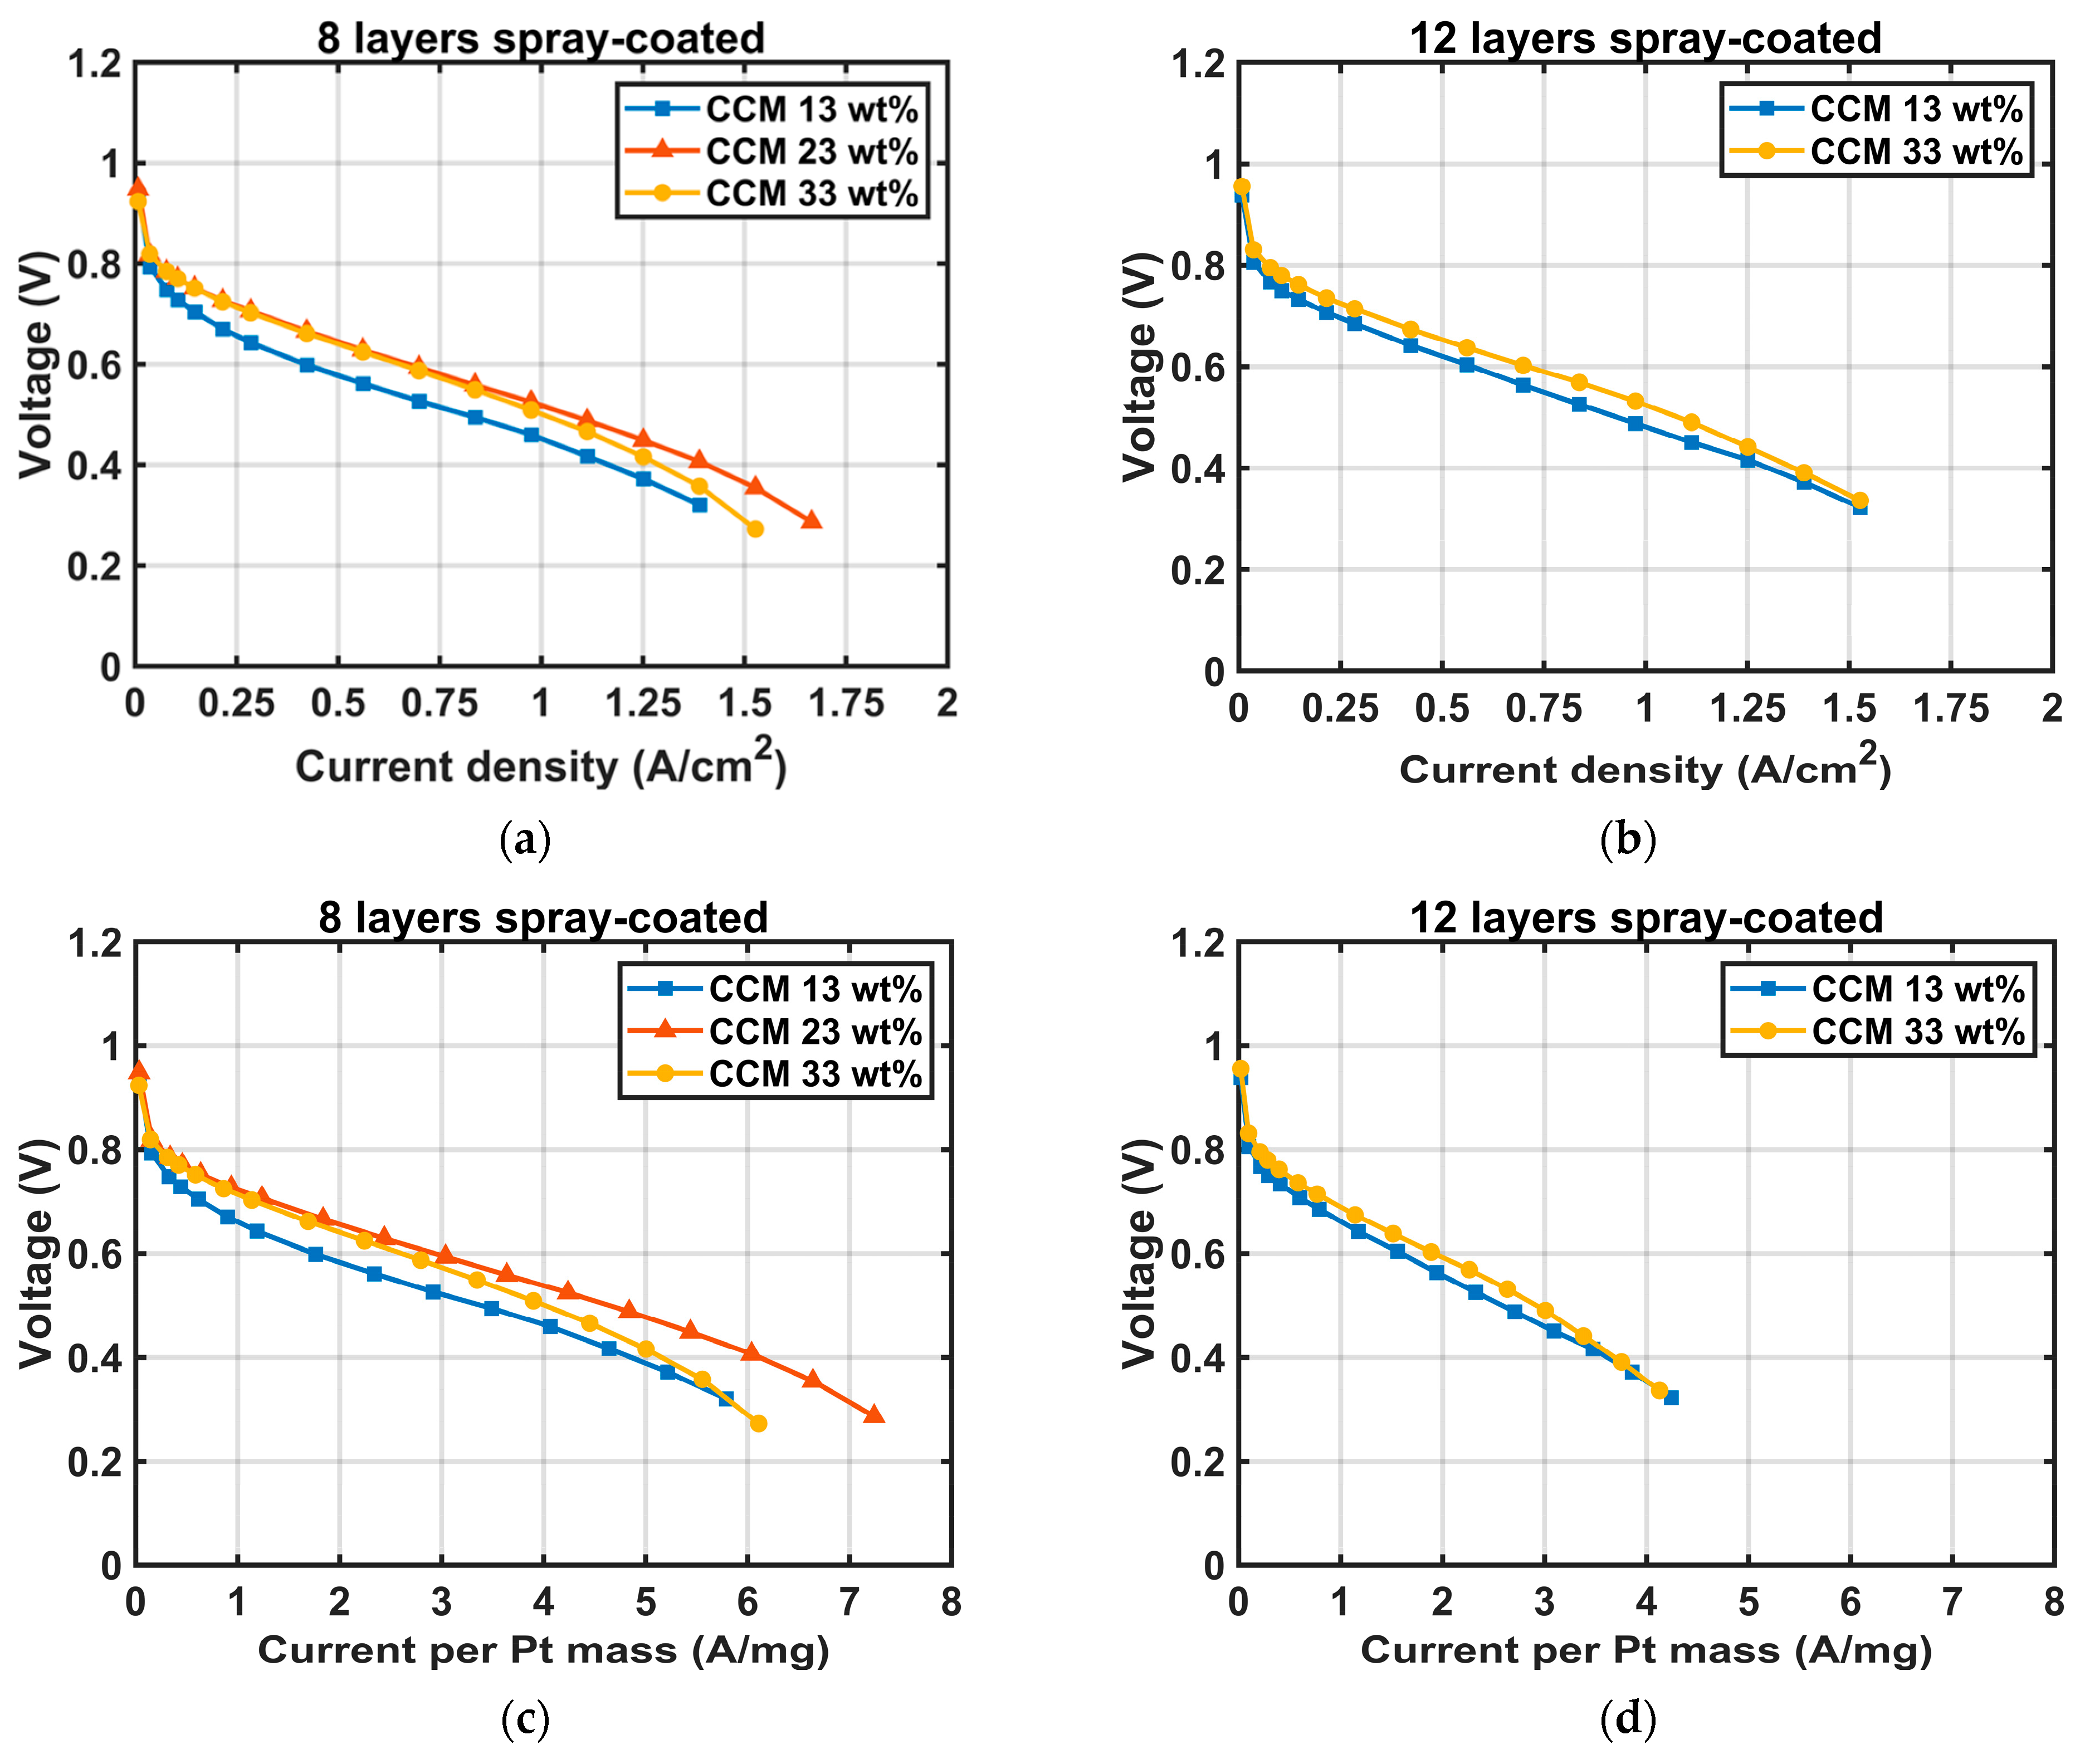
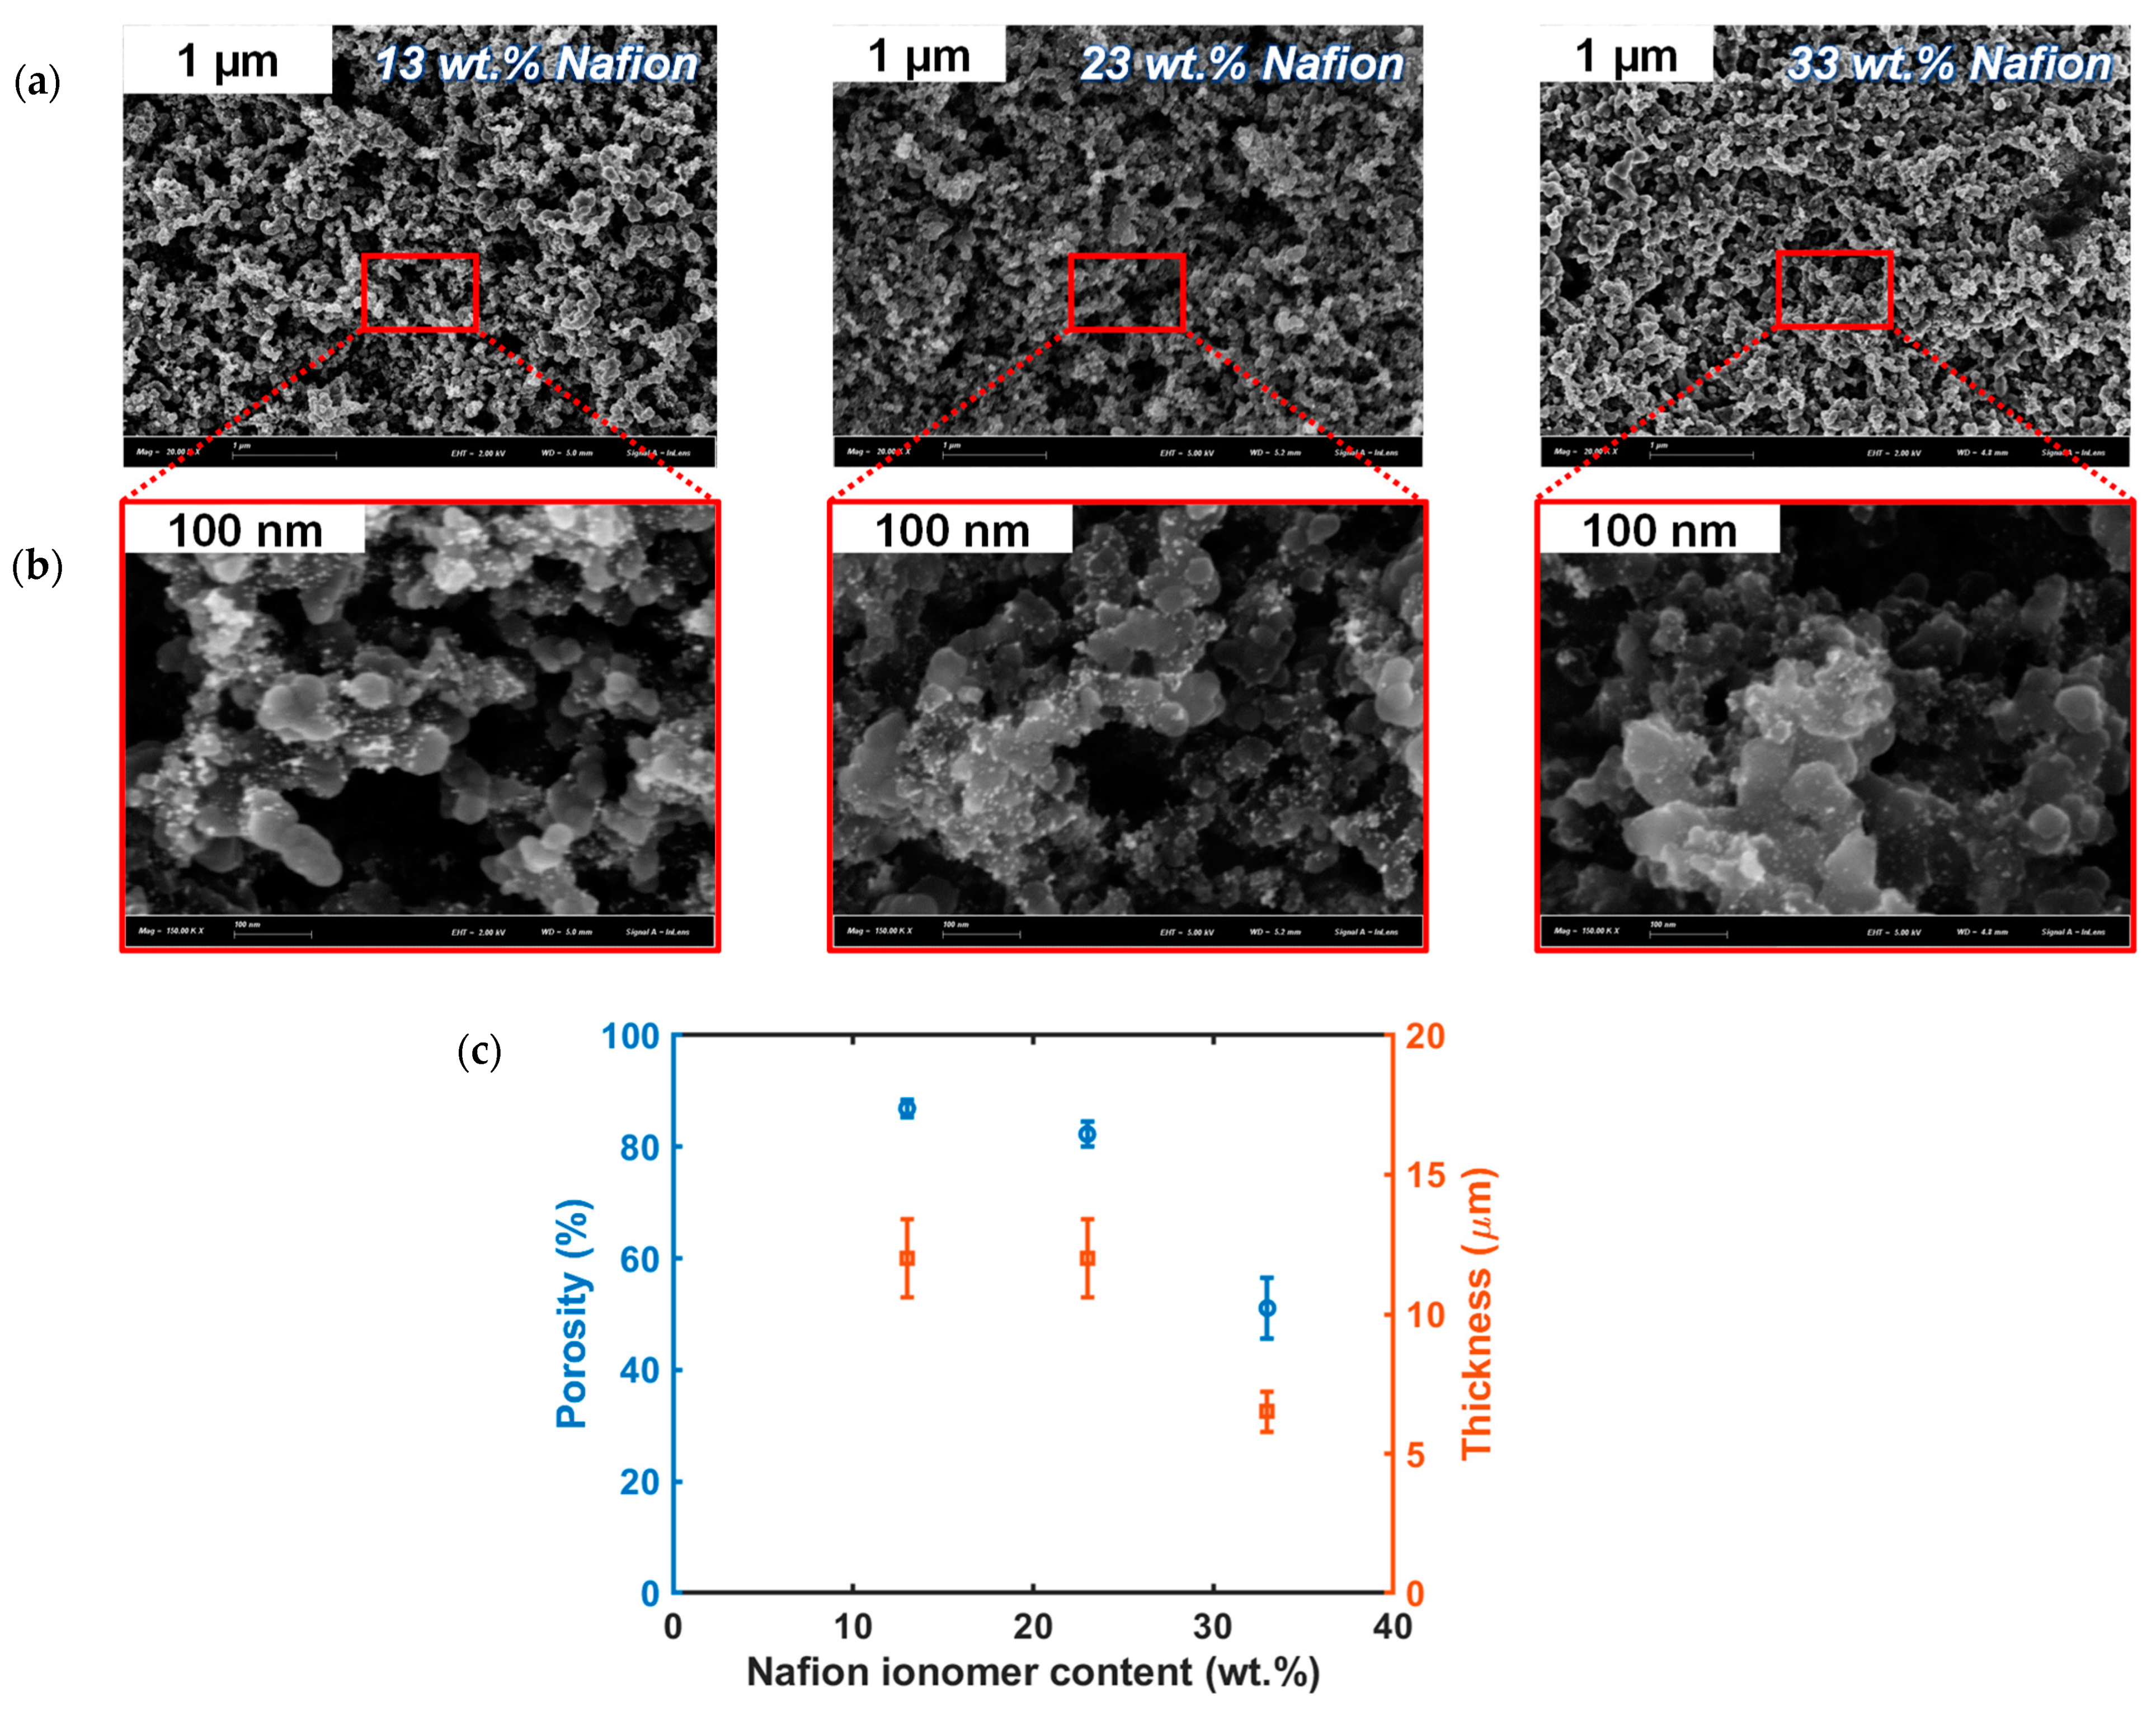
3.2.1. Nafion® Ionomer Content

In this part, the first batch of inks was prepared using the general ink preparation method. The inks were composed of a mixture of water and isopropanol in the ratio of 1:2 and catalyst AA 40% Pt/C (2020). Three inks with ionomer ratios of 13, 23, and 33 wt.% were prepared and used for the fabrication of the corresponding CCMs. For each prepared ink, 8 layers of CCM were prepared and compared with 12 layers (except 23%), in reference to a previous work [36]. The Pt loading (LPt) for each prepared CCM was estimated by Equations (2)–(5) and reported in Table 2. We can see that all prepared samples have similar Pt loadings for a given number of coating layers, but approximately 0.3 mg cm−2.
As the number of coating layers affects the performance of the PEMFC, the impact of the amount of ionomer in the CCM-based MEAs is studied for a given number of coating layers. When comparing the eight-layer samples in Figure 4a, the sample prepared with the lowest amount of ionomer content (13%) in the ink shows the poorest performance in the PEMFC. In contrast, the samples prepared with the 23 and 33 wt.% ionomer content in the ink have similar polarization curves up to the mass transport region. The observed behavior for the three samples is also confirmed with the Pt mass activity trend in Figure 4c, with the lowest Pt mass activity for the sample prepared with the 13 wt.% ionomer content in the ink (near 1.7 A mg−1 at 0.6 V). Although the 23% to 33% range of ionomer content is within the optimal range for catalyst inks according to data from the literature [25,40,41], the difference in behavior in the mass transport of the two samples (23 and 33 wt.%) in Figure 4a,c may be due to a reduction in the porosity for a higher ionomer loading that prevents gas diffusion through the electrode thickness, or to a higher thickness of the ionomer surrounding the Pt/C agglomerates, which reduces the diffusion of adsorbed oxygen through the electrode. In addition, more water is produced at higher current densities and this amount of water must be removed through the catalyst layer before passing into the GDL and the gas channel at the cathode side. Assuming that the Nafion ionomer behaves like a Nafion membrane, increasing the water content can lead to the Nafion ionomer swelling in the catalyst layer and, consequently, a reduction in the pore size (void between particles). This effect should be more pronounced with an ionomer-rich electrode (33 wt. % ionomer content), due to a high coverage of the Nafion ionomer on carbon and Pt. On the other hand, the high-frequency resistance (RHF), which is related to the membrane resistance in the PEMFC, does not seem to vary significantly with the ionomer loading (Figure 4e). Perhaps it decreases slightly as the loading increases, indicating either greater difficulty in evacuating water vapor, or better ionic contact between the membrane and the electrodes. It should be noted that using the WRRG model, we can extract the RHF (see Figure S2) and also other parameters, such as Rd, Rct, and Cdl, from Equations (8) and (9) [38]. The double-layer capacitance (Cdl) clearly increases with the ionomer loading because the interface between the ionic and electronic conductors is an increasing function of the loading. The charge-transfer resistance (Rct) for a volumetric electrode is not intrinsic to the catalytic activity as for a flat electrode. It depends on the electrode thickness and protonic conductivity. Perhaps this is why it decreases as a function of the ionomer loading. Finally, there is no clear trend in the oxygen diffusion resistance, but this may be due to the very simple model used here to estimate the parameters.
Concerning the 12-layer samples (Figure 4b), the polarization curves of the samples prepared with the 13 and 33 wt.% ionomer content in the ink are rather close, although the sample prepared with the lowest amount of ionomer content (13%) shows the lowest performance, as expected. However, the performance of the CCM-13% with 12 layers is better than with 8 layers. Furthermore, the difference observed for the 8-layer samples, prepared with the 13 and 33 wt.% ionomer in the ink, is greater than 0.25 A cm−2 at 0.6 V, whereas this difference is less than 0.12 A cm−2 at 0.6 V for the 12-layer samples. This difference in behavior can be explained by the difference in the Pt mass activity of the 8- and 12-layer samples (Figure 4c,d). In contrast to the 8-layer samples, the difference in the Pt mass activity is rather similar, showing that the 12-layer electrode is less sensitive to the ionomer loading, because of a possible reduction in the porosity. According to the literature [42], the porosity of the catalyst layer decreases with the number of catalyst layers deposited by the ultrasonic spray. This is because when an additional layer is applied, some of the ink can penetrate the porosity of the previous layer. Consequently, this effect can play a slightly favorable or unfavorable role, depending on the ionomer ratio, on the CCM performance in the PEMFC.
Now comparing the ECSA of the studied samples (Figure 4f), the measured values seem to be consistent with the behavior of the polarization curves of all the studied samples, independently of the coating layers. With an ionomer content of 13 wt.% in the ink, the Pt particles cannot be well covered by the amount of ionomer, resulting in a poor TPB and also a low ECSA, regardless of the number of coating layers. Increasing the ionomer content by 10 or 20% leads to an increase in the ECSA, but this is not as great as expected: 19 vs. 26 m2 g−1 for the 13 and 33% of ionomer content, respectively, regardless of the number of layers coated.
For a better understanding of the results, physicochemical characterizations were performed to deepen the analysis. For this purpose, special 12-layer samples with the three amounts of the Nafion® ionomer content were prepared for scanning electron microscopy (SEM) and profilometer measurement. The thickness and homogeneity of the deposited layers were analyzed by a profilometer following the red guideline in Figure 1. The surface morphology of the prepared samples visualized by SEM is shown in Figure 5a,b, at different magnifications. It seems to us that the sample prepared with the 13 wt.% of Nafion® ionomer ratio is slightly more porous than the one prepared with the 33 wt.% Nafion® ionomer content, due to less coverage of Pt/C with the 13 wt.% ionomer content in the ink composition. However, it is rather tricky to assess the porosity of these samples using only SEM. That is why we estimate this parameter from the thickness measured by profilometry.
Figure 5c shows the measured thickness and estimated porosity of the samples. The results reveal that the sample prepared with the 33 wt.% ionomer content is the thinnest sample, with a thickness of about 6 µm and an estimated porosity of 50%. In contrast, the thickness of the samples prepared with the 13 or 23 wt.% ionomer content is similar but thicker and reaches almost 12 µm, i.e., twice that of the first sample, and an estimated porosity higher than 80%. When crossing the data, it appears to us that the 33 wt.% ionomer content in the ink favors a denser and thinner electrode, with a reduction in the porosity not only due to more ionomer filling the pores, but to smaller pores.
This kind of dense structure yields a high ECSA because of the high interfacial area between the ionic and electronic conducting phases, but the presence of small pores with a high concentration of Nafion ionomer can lead to oxygen transfer issues at the scale of the electrode thickness in the gas phase, as well as at the scale of the ionomer layer thickness in the adsorbed phase. For lower ionomer contents (<23 wt.%), all the resulting coated layers are thicker, improving gas transport and reducing proton conduction.

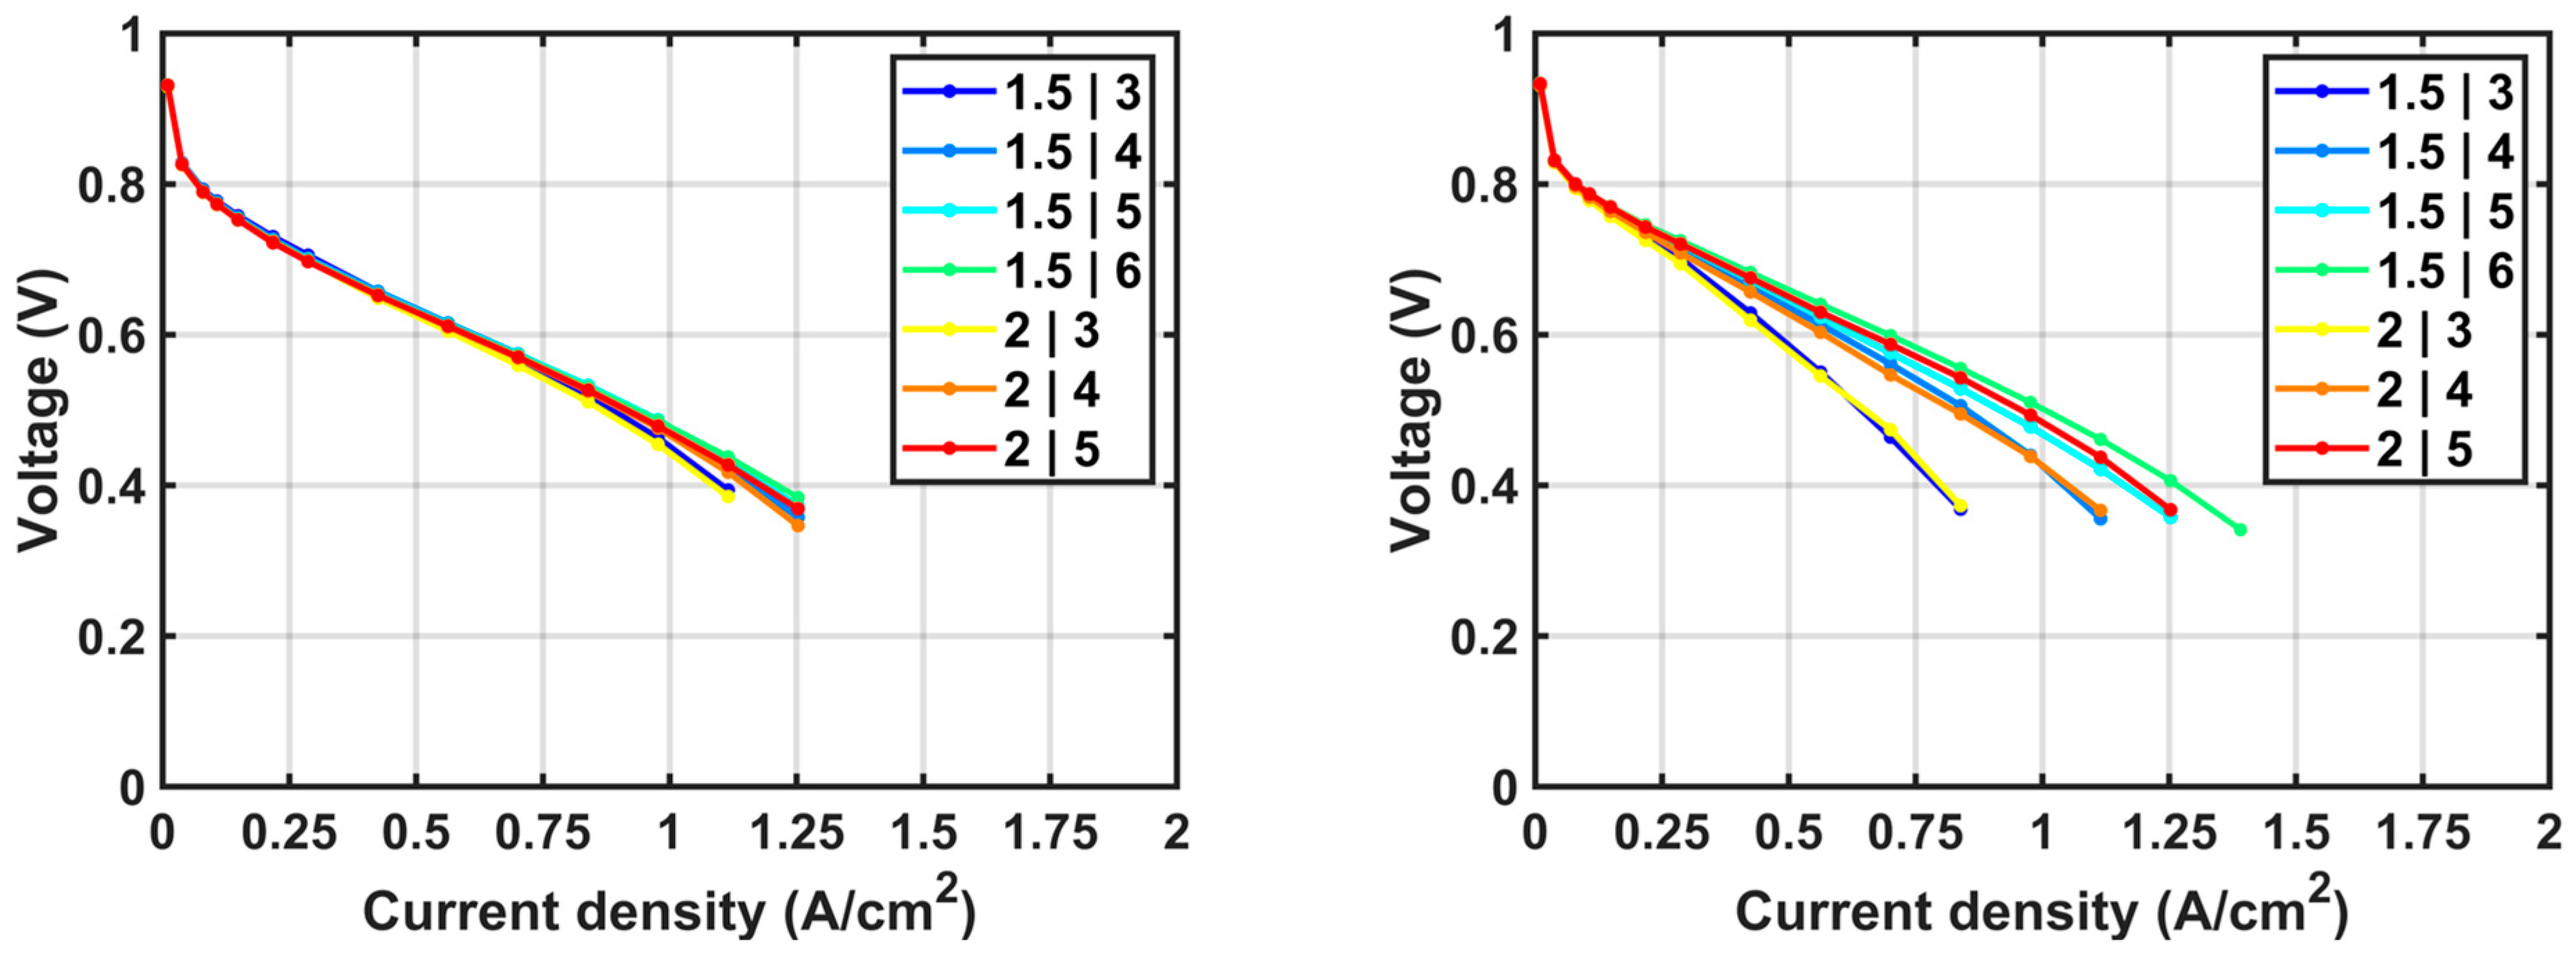
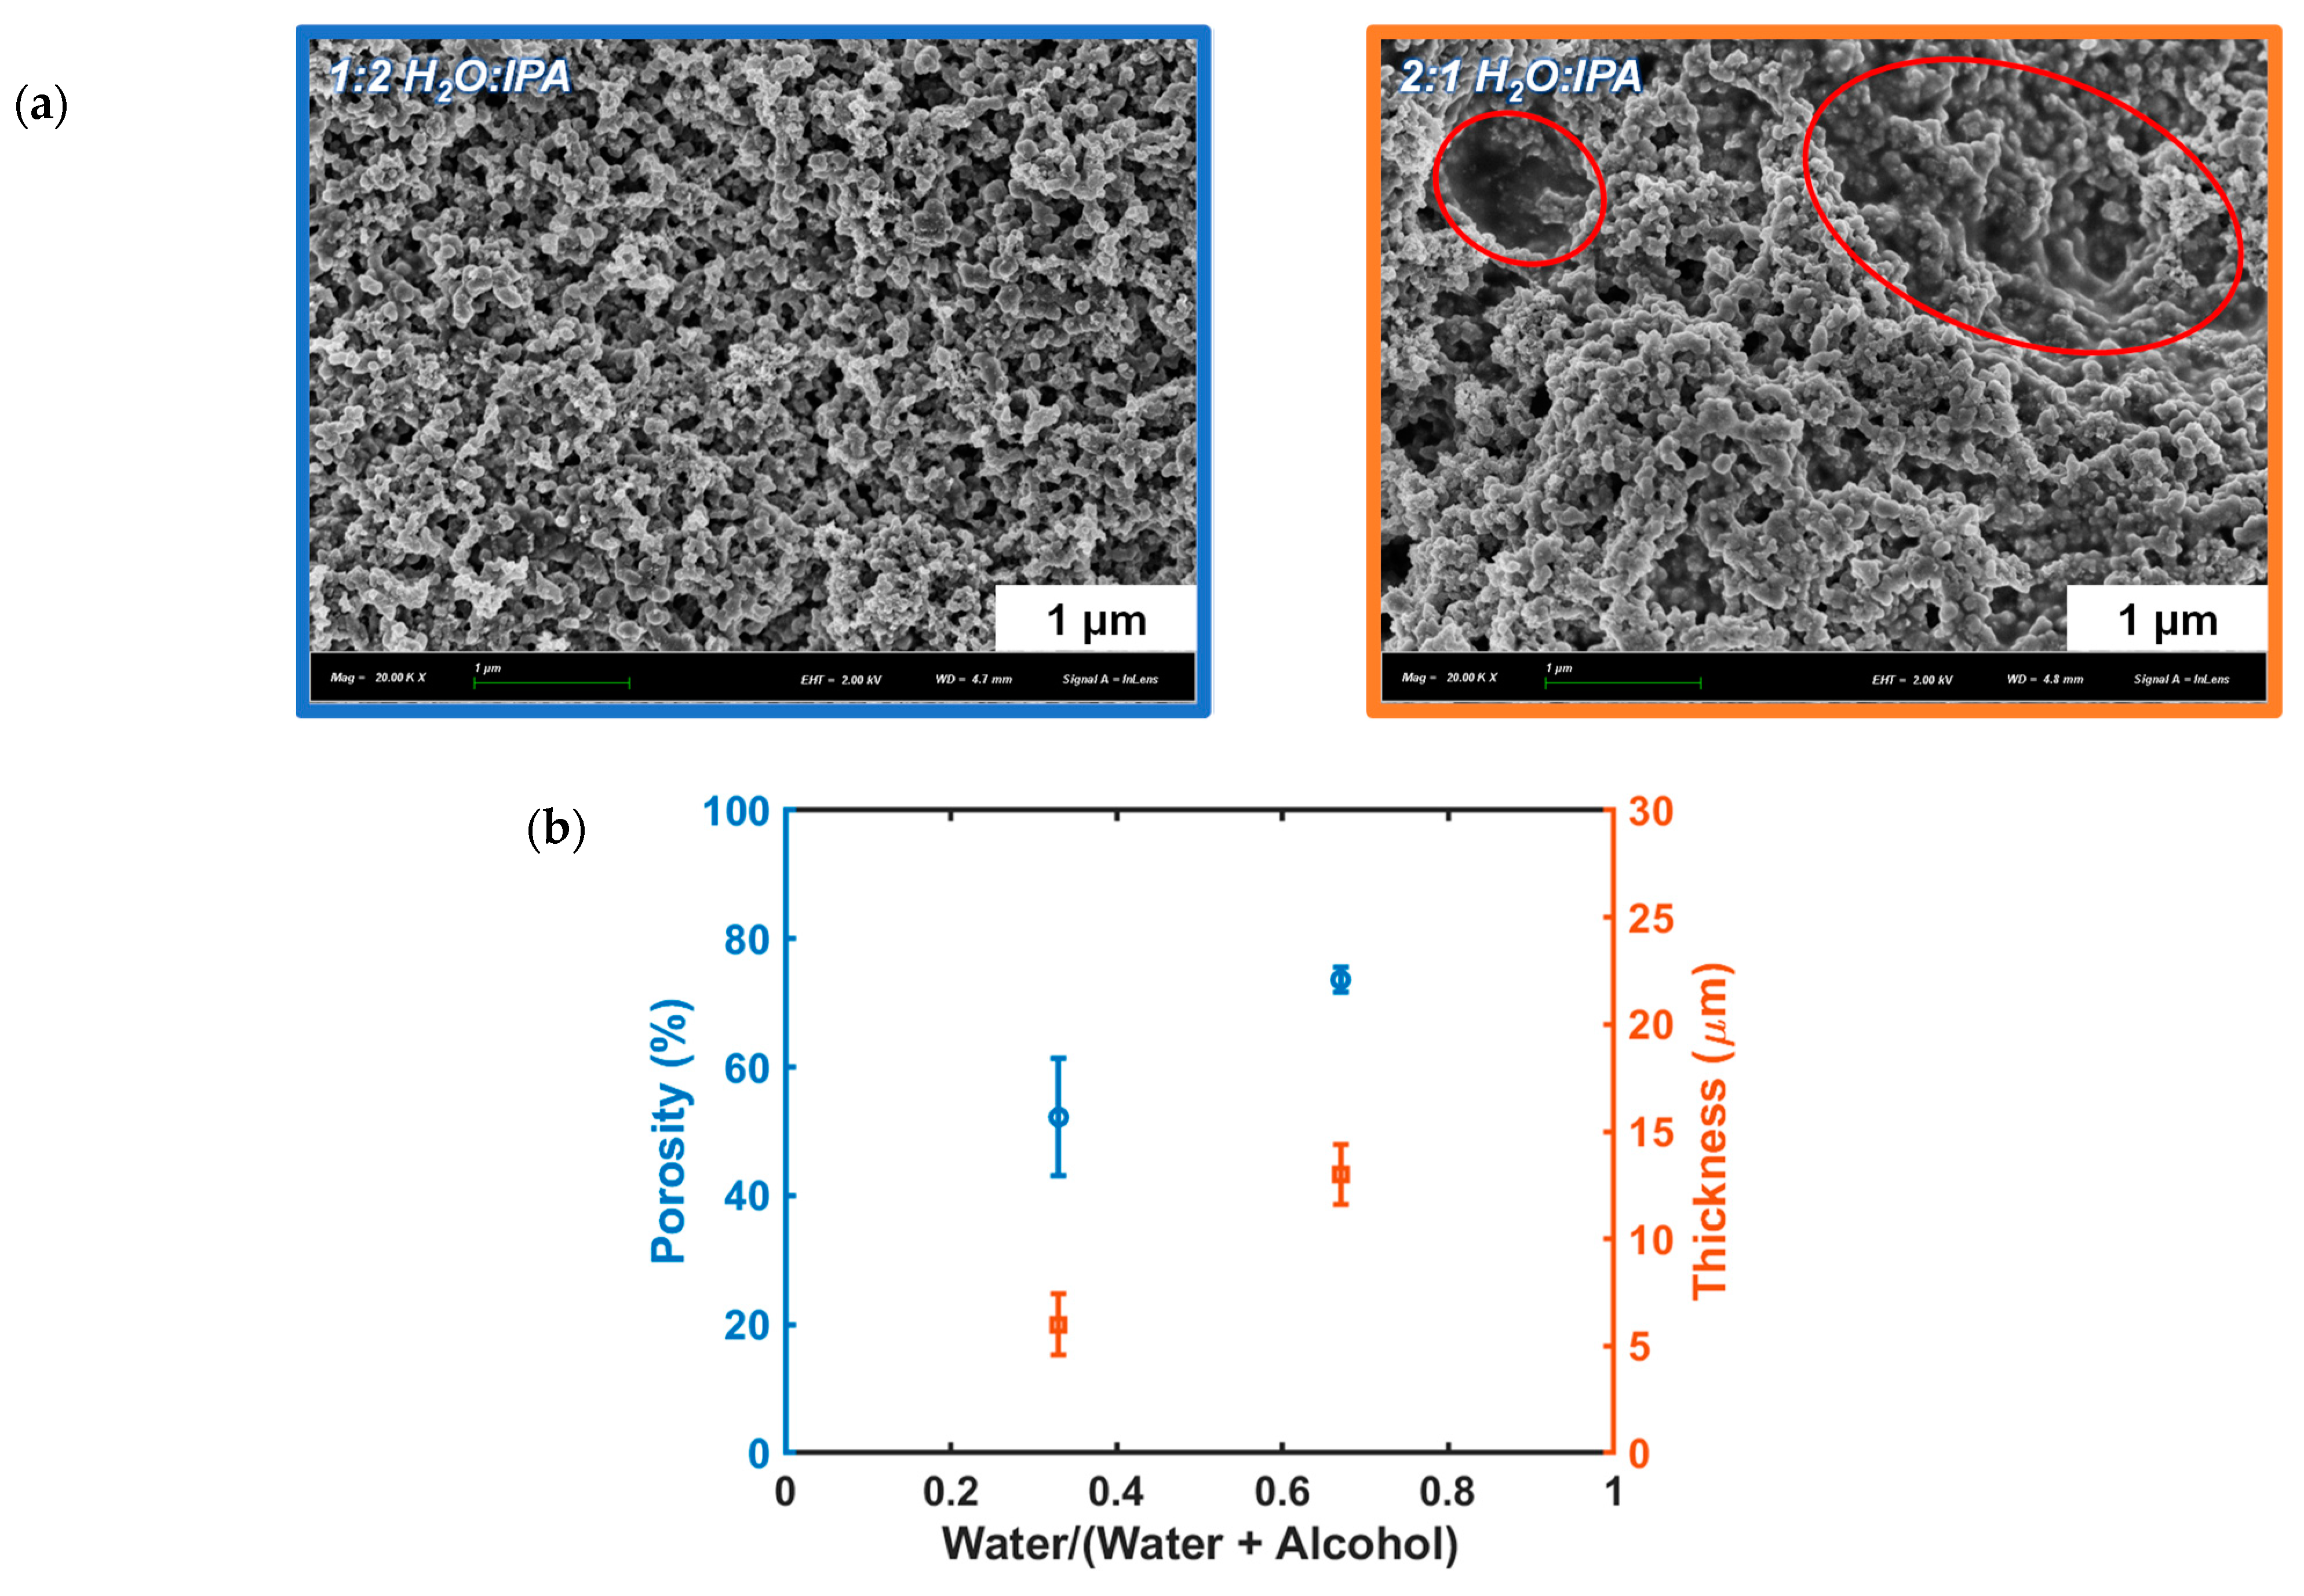
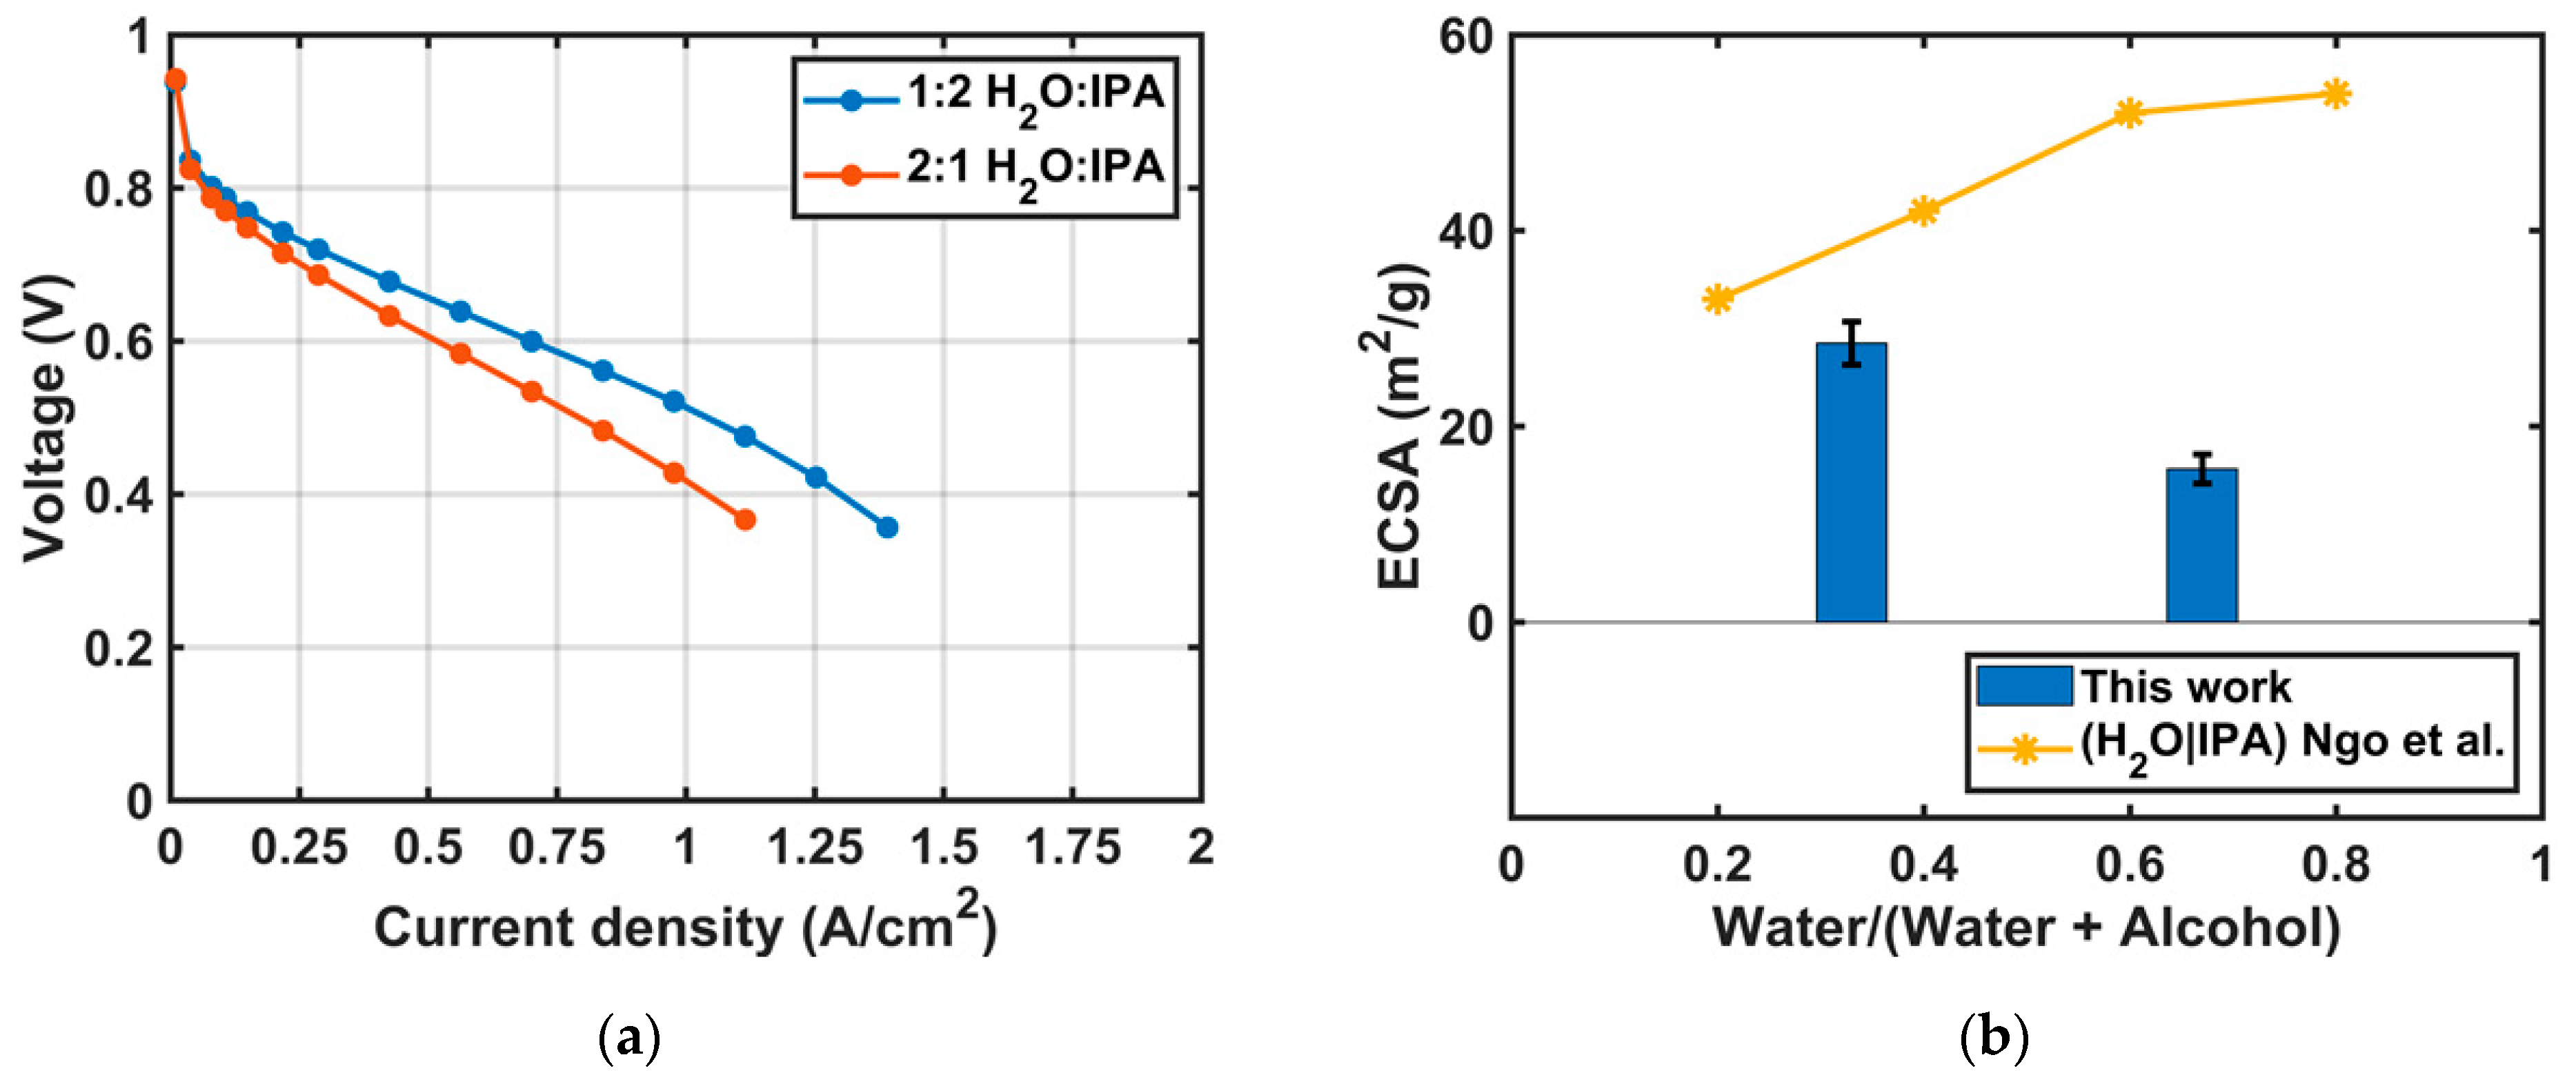
3.2.2. Solvent Ratios (1:2 vs. 2:1 H2O/IPA)

To check the impact of the solvent ratio in the catalyst layers, a study was carried out on the ratio of water (H2O) and isopropanol (IPA) in the solvent mixture. In this work, the second batch of inks was prepared with an FCS 40% Pt/C-Vulcan XC-72R (2021) catalyst and 33 wt.% Nafion® ionomer content. Following the general catalyst ink preparation method, two inks, called (2:1) and (1:2), were prepared in a mixture of water and isopropanol in the ratio of 2:1 and 1:2, respectively. The 12-layer CCM-based MEAs were prepared from the as-described inks, using an ultrasonic spray bench. During the CCM fabrication process, we noticed that the two inks behaved differently, including the difference in the Pt loading for the same number of coating layers. The samples prepared with the ink containing more water (ratio 2:1) were always heavier than the samples prepared with the ink with less water (ratio 1:2): 0.39 vs. 0.32 mg cm−2, respectively.
The prepared samples were then characterized by SEM and profilometry. The SEM images in Figure 6a reveal that the microstructure of the obtained catalyst layers is different with the two solvent ratios. Indeed, the sample prepared with ink (1:2) has a compact electrode shape with small pores, as previously observed. In contrast, the one prepared with ink (2:1) has a more porous structure with larger holes on the surface.
This change in morphology can be explained by the state of the Nafion® ionomer depending on the amount of water in the solution. Due to the duality between the hydrophilic and hydrophobic chains in the Nafion® structure [43,44,45], the Nafion® electrolyte can adopt several forms depending on the water amount. At a high water content, the hydrophilic chains containing the sulfonic sites are surrounded by water molecules and can swell and form highways to transport protons. On the other hand, at a low water content, the Nafion® shrinks with an inverted micellar structure and a severe decrease in ionic conductivity. In the presence of a more water-rich mixture (2:1), the Nafion® ionomer expands and can form large aggregates, which can lead to phase segregation between the Pt/C powder (more hydrophobic) and the ionomer. As the solvents evaporate during the coating process, the large aggregates become voids. In contrast, a less water-rich mixture solution shrinks the Nafion® ionomer with an inverted micellar structure, resulting in a more homogeneous dispersion between the Pt/C powder and the ionomer, but with small pores. These results are in good agreement with the work of Takahashi et al. [33] and Ngo [45]. Additionally, the results of the profilometry and also the estimated porosity in Figure 6b are also consistent with the SEM images. Indeed, an almost 3-fold increase in thickness is measured with the sample prepared with the ink (2:1), proving its very porous structure.
Turning now to the electrochemical performance, the prepared CCM-based MEAs were tested in a lab-made fuel cell bench. The polarization curves, illustrated in Figure 7a, reveal a lower performance with the sample prepared with the ink (2:1). At first sight, these results can be explained by a thicker catalyst layer with larger pores, which can affect proton conduction. The ECSA of this sample is also the lowest one, as shown in Figure 7b. From the obtained data, it seems that the TPB is poorly developed as a result of either phase separation or an insufficient amount of ionomer for this higher porosity. The higher the porosity, the more ionomer is needed to line the pores and cover the agglomerates. In the end, the optimal ionomer loading should rather be expressed in a volumetric way (e.g., in mg of ionomer per cm3 of electrode) than in the usual mass ratio (mg of ionomer per mg of catalyst). However, our results about the evolution of the ECSA (in Figure 7b) seem to go in the opposite direction to those reported by Ngo et al. [45], but actually the method, operating conditions, and set parameters were very different. Indeed, the authors [45] measured the ECSA using a three-electrode system in a solution of 0.5 M H2SO4. With a porous catalyst layer, the acidic liquid electrolyte can diffuse easily through the electrode (more exchange surface), facilitating H+ adsorption on Pt and the electrochemical reaction. In contrast, a dense structure is less permeable to the liquid electrolyte, resulting in low H+ adsorption on Pt. Moreover, the concentration of the Nafion ionomer in a denser structure is higher than that in a porous structure, since the amount of catalyst and ionomer is constant. In our case, the ECSA was measured directly on the fuel cell bench, with H2 on the anode side and N2 on the cathode side. The H+ produced at the anode must cross the membrane before being adsorbed by Pt. In our case, a thinner electrode with a high concentration of Nafion favors the diffusion of H+ and its adsorption on Pt. For this reason, the trend of our ECSA is opposite to that of the work by Ngo et al. [45].
These comparisons show that the ratio of ink solvents plays an important role in the final structure of the catalyst layer. A water-rich ink produces a more porous catalyst layer in comparison to a water-poor electrode. Depending on the fuel cell operating parameters chosen by the authors, the trend of the ECSA and the polarization curves can vary in opposite directions depending on the amount of water contained in the catalyst ink.

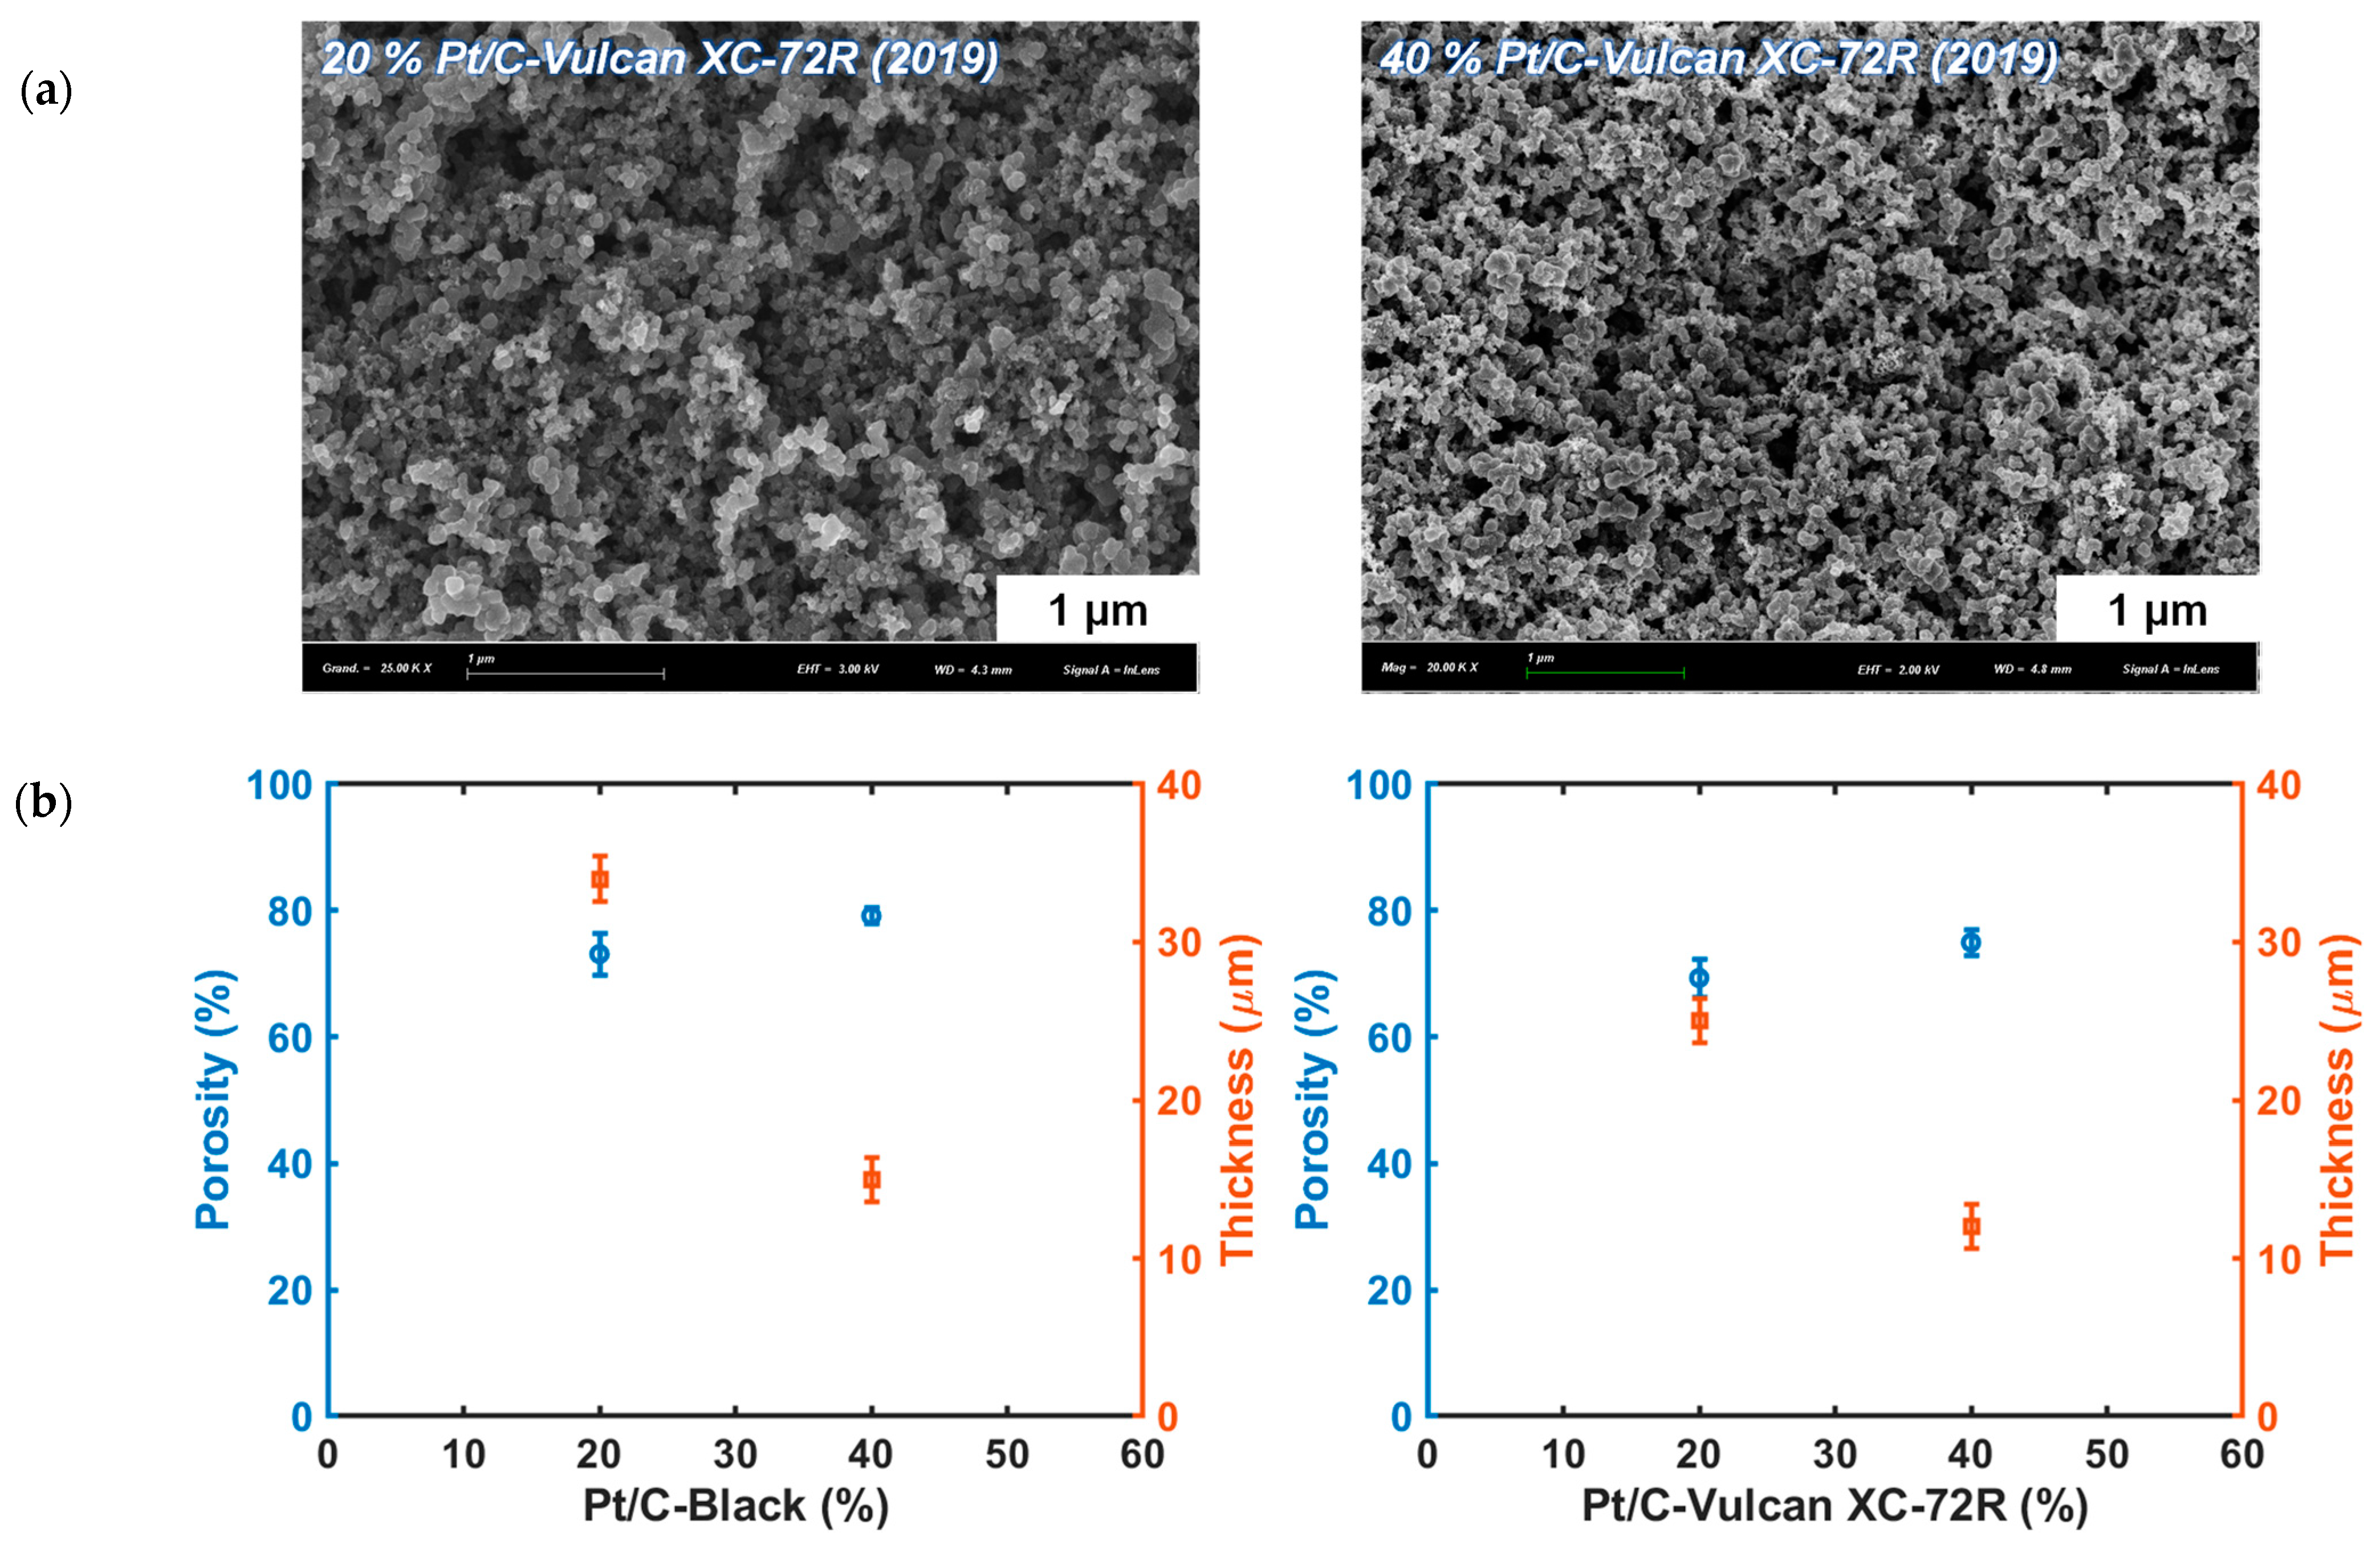
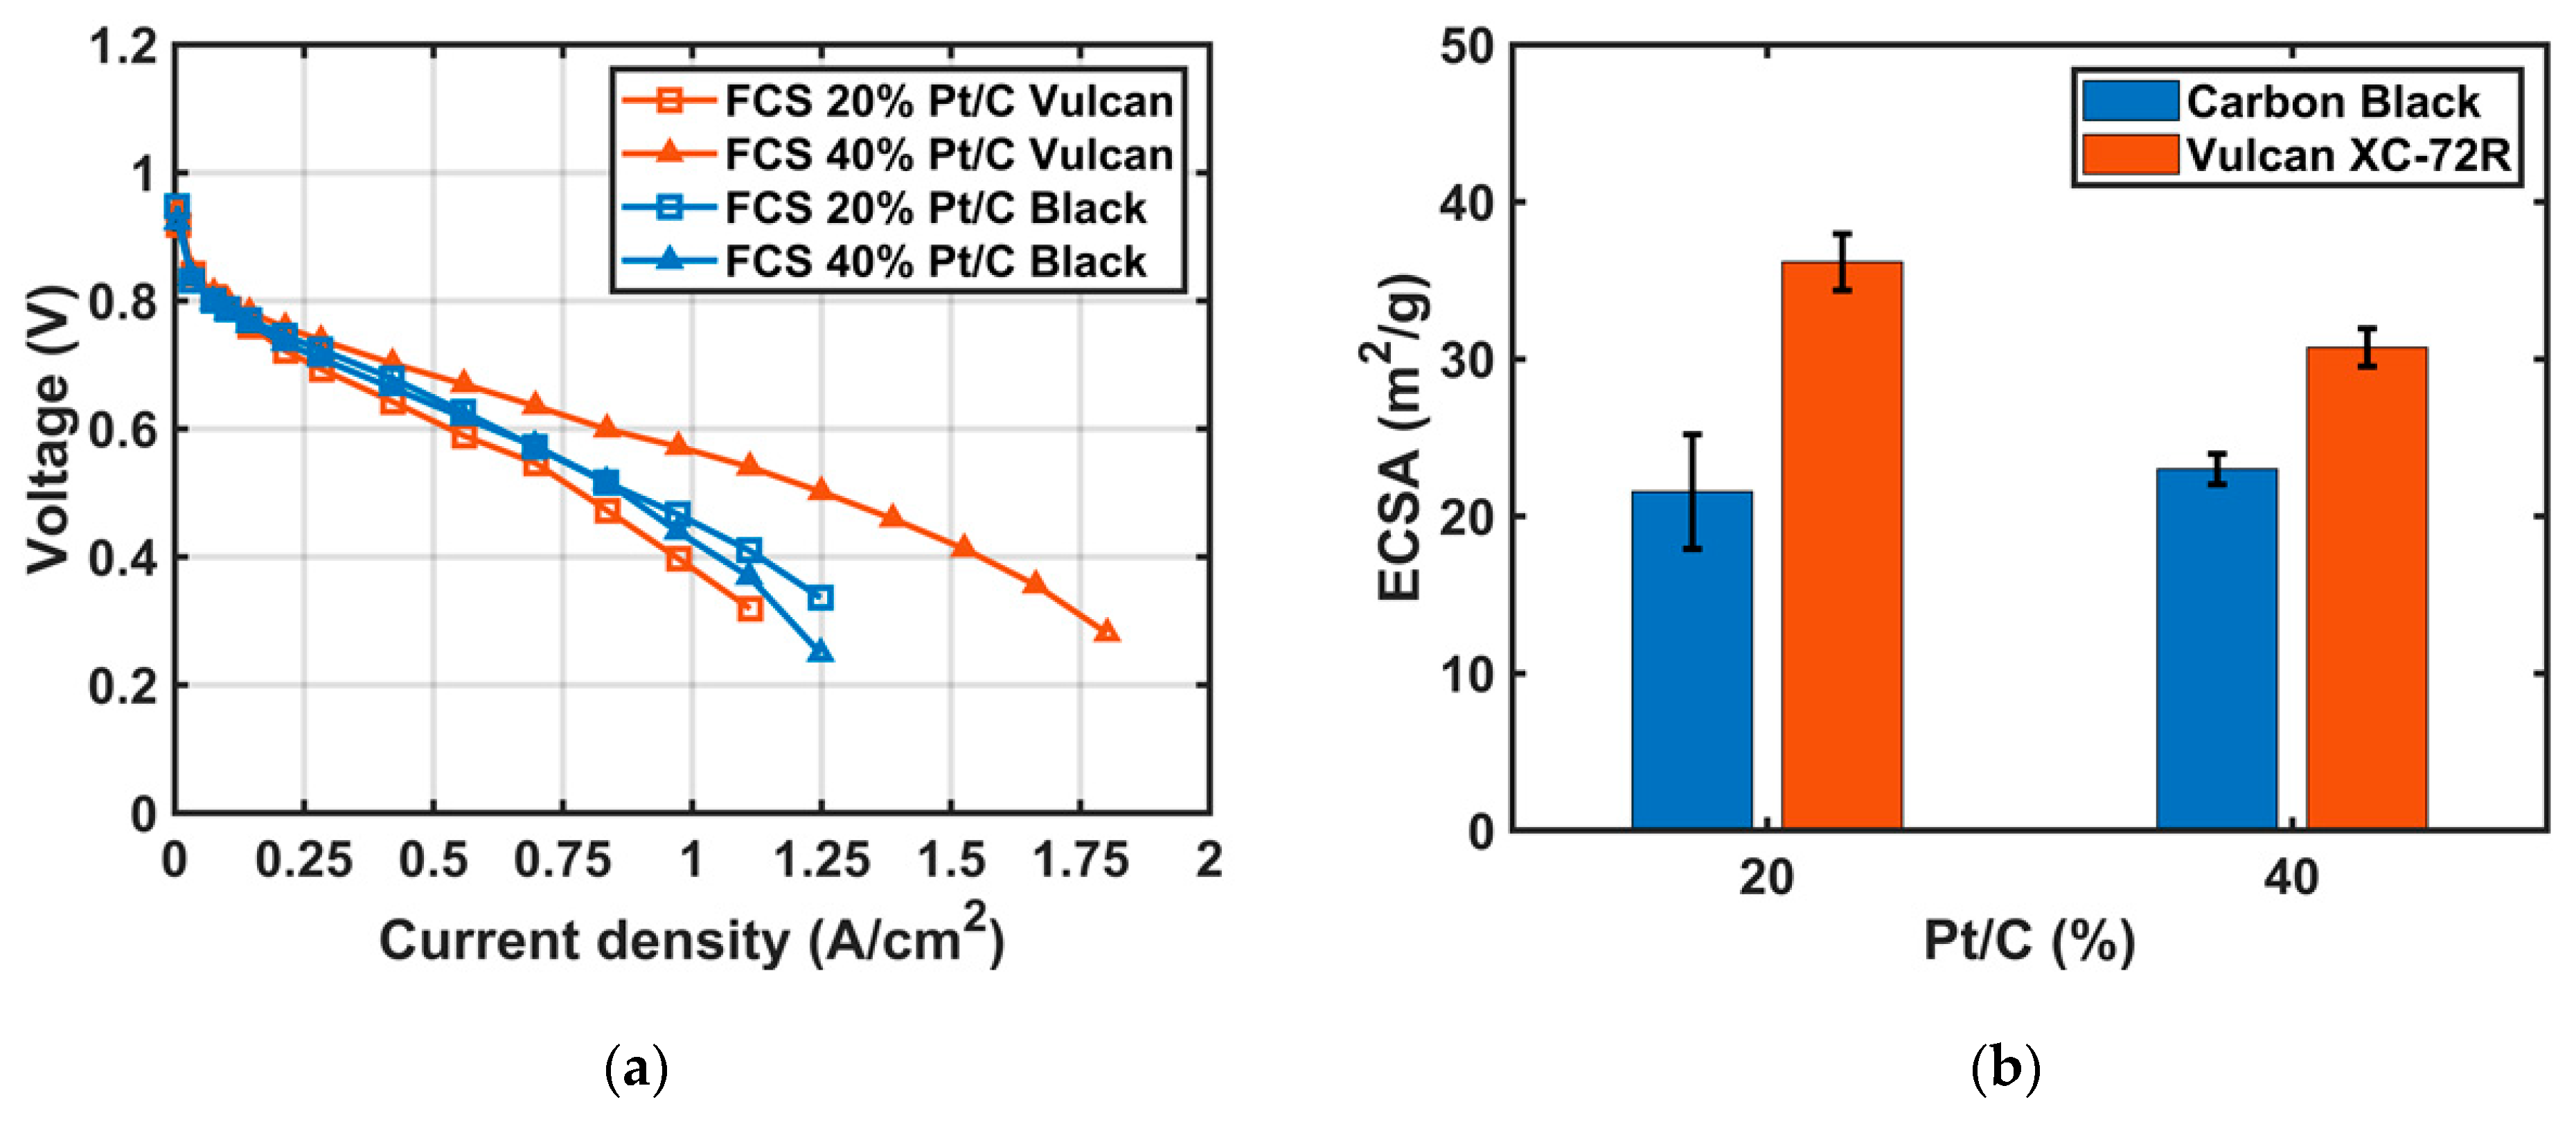
3.2.3. Pt Weights and Carbon Types

In order to check the impact of the Pt weight and carbon types in the catalyst layer structure, the third batch of inks was prepared with the four Pt/C catalysts indicated below, in a 1:2 ratio of water and isopropanol mixture and a 33 wt.% Nafion® ionomer content. All four inks were prepared according to the general catalyst ink preparation method.
  • FCS 20% Pt/C-Vulcan XC-72R (2019)
  • FCS 40% Pt/C-Vulcan XC-72R (2019)
  • FCS 20% Pt/C-Black (2020)
  • FCS 40% Pt/C-Black (2020).
In order to achieve a Pt loading of 0.3 mg cm−2 for all samples prepared with the four inks, 12-layer CCMs were prepared with a 40 wt.% Pt, whereas 24-layer CCMs were prepared with a 20 wt.% Pt. The mass loadings of the prepared samples are summarized in Table 3, which reveals that only the sample prepared with the FCS 20% Pt/C-Black (2020) catalyst has a heavier Pt loading than the desired Pt loading (0.45 vs. 0.3 mg cm−2). This observation suggests a possible change in the structure of the ink prepared with the FCS 20% Pt/C-Black (2020) catalyst, due to a possible change in the material structure. Moreover, it should be noted that the amount of carbon (or carbon loading) is nearly three times higher with a 20 wt.% Pt than with a 40 wt.% Pt, for a similar Pt loading. The difference in carbon loading may have an impact on the rate of ionomer embedding on Pt/C in the inks, since the same amount of ionomer was introduced for all prepared inks.
For this purpose, SEM and profilometry characterizations were performed and the results are gathered in Figure 8. As expected, the difference in carbon loading affects the morphology of the resulting catalyst layers prepared with a 20 and 40 wt.% Pt (Figure 8a). From the SEM images, it is seen that the sample prepared with a 20 wt.% Pt has more pore sizes than that prepared with a 40 wt.% Pt. However, to obtain the same catalyst loading, the number of layers has been doubled; hence, the porosity decreased which was also remarked from the calculations of the porosity (Figure 8b). Nevertheless, the difference in the porosity between the samples is minor due to a major difference in carbon loading.
Now concerning the thickness of the prepared samples, all the samples prepared with a 40 wt.% Pt are thinner than those prepared with a 20 wt.% Pt, regardless of the carbon nature (Figure 8b). Additionally, the thickness of the sample prepared with the FCS 20% Pt/C-Black (2020) catalyst is almost double that prepared with the FCS 40% Pt/C-Black (2020) catalyst, as shown in Figure 8b (left): 34 ± 1 μm vs. 15 ± 1 μm, respectively. Here, the thickness of the sample prepared with FCS 20% Pt/C-Vulcan XC-72R (2019) was estimated by doubling the value of the thickness of the FCS 40% Pt/C-Vulcan XC-72R (2019) sample in Figure 8b (right). For this, we assumed that (i) particle-size distributions of 20 and 40 wt.% Pt/C-Vulcan XC-72R (2019) are close, (ii) the difference in the embedding state of the Nafion® ionomer on Pt/C can be neglected, and (iii) the thickness of the deposited layer should be proportional to the number of coating layers.
Considering assumptions (i) and (ii), we can easily understand the electrochemical performances of the samples prepared with the 20 and 40 wt.% Pt/C-Vulcan XC-72R (2019), as illustrated in Figure 9a (orange curves). The CCM prepared with the 40 wt.% Pt/C-Vulcan XC-72R (2019) provides the best performance compared to that prepared with the 20 wt.% Pt/C-Vulcan XC-72R (2019), due to a lower CL thickness that promotes oxygen transfer and proton conduction. There is a difference of 0.3 A cm−2 between the two samples at 0.6 V. Now comparing the two samples prepared with the 40 wt.% Pt (Figure 9a), the performance of the sample prepared with the unnamed carbon black (FCS 40% Pt/C-Black (2020)) is poorer than the one prepared with the Vulcan carbon (40 wt.% Pt/C-Vulcan XC-72R (2019)). Although both samples prepared with the 40 wt.% Pt have a close coating thickness, there is almost a difference of 0.25 A cm−2 between the two samples at 0.6 V. Furthermore, the ECSA values reported in Figure 9b are consistent with the behavior of the polarization curves. The illustrated results highlight the fact that the nature or type of carbon support has a great importance on the performance of the PEMFC. It could be that the Vulcan XC-72R carbon structure allows for better contact with the Pt and Nafion® ionomer to favor a good TPB.
Regarding the two samples prepared with the 20 and 40 wt.% Pt/C-Black (2020) in Figure 9a, surprisingly, they have similar polarization curves and an ECSA. The results obtained are rather unexpected considering the difference in thickness of the coating layers. Based on the difference in the Pt loading of the two catalysts in Table 3, one can assume that the two catalysts are different in terms of the particle size and properties. But further analysis is required to better understand the results. It seems to us that three out of four inks gave the expected Pt loading when preparing CCMs with four different catalysts. For this reason, caution should be exercised when comparing data with Pt/C catalysts, even with the same Pt weight. Indeed, when comparing all the thickness values gathered in Figure 5, Figure 6 and Figure 8 for the 40 wt.% Pt/C, using the same recipe and preparation method, the thickness of the 12-layer samples varies according to the catalyst batch. Thus, characterization and verification are still necessary for each catalyst used.
Thus, the optimization study of catalytic ink formulations provides a better understanding of the interactions between each ink component and its impact on the performance of the PEMFC. For instance, the porosity and thickness of the catalyst layers can be tuned by varying (i) the amount of ionomer, (ii) the water/isopropanol ratio, and (iii) the Pt wt.% in Pt/C. The search for the optimal amount of each component for a given catalyst is essential, since Pt/C catalysts are not equivalent in terms of properties (carbon support, Pt quality, and Pt/C particle size and distribution). Therefore, morphological characterizations are still needed to better understand the PEMFC performance. Concerning the Pt/C particle size, our way of preparing the inks does not allow for controlling this parameter, as the ultrasonic bath and the magnetic stirrer may not be powerful enough. Using a disperser can be a solution when preparing the ink. Therefore, the next section is focused on ink preparation depending on the origin of the Pt/C.

3.3. Ink Preparation Procedure According to Pt/C Origin

In this section, the fourth batch of inks was prepared with the two catalysts, FCS 40% Pt/C-Vulcan XC-72R (2021) and AA 40% Pt/C (2021). All inks prepared contained a 33 wt.% of Nafion® ionomer content in a 1:2 mixture of water and isopropanol. Two ways of ink preparation will be discussed with or without the use of a high-performance dispersing device (from IKA®, T10 Ultra Turrax). The 12-layer CCM-based MEAs were prepared from the inks obtained, using an ultrasonic spray bench at a nozzle height of 60 mm, and two vertical and two horizontal serpentine layers of spray. PEMFC tests were performed with the two configurations of the cell, Face 1 and Face 2 (as described in [36]), in order to check the stability and repeatability of the prepared catalyst inks according to the Pt/C origin.

3.3.1. Setting Up the Method for Preparing Mixed Catalyst Inks

Before finalizing the method of preparation of mixed catalyst inks, a test was performed with an ink prepared with an AA 40% Pt/C (2021) catalyst, 33 wt.% Nafion® ionomer content, and in a 1:2 water/isopropanol mixture solution. Two catalyst inks were prepared using the ultra-Turrax®, either (i) after or (ii) before adding the Nafion® ionomer. The as-prepared inks were used to fabricate CCM-based MEAs, which were then tested in a PEMFC bench with the two configurations, Face 1 and Face 2. We assume that if the prepared inks were stable during the coating procedure, then the two catalyst layers of a CCM for a given ink should behave similarly and give similar polarization curves in the PEMFC.
Figure 10, on the left, shows the polarization curves of the CCM prepared with the two inks described and with the two configurations, Face 1 and Face 2. Figure 10, on the right, shows the results of the electrochemical impedance spectroscopy of the corresponding CCMs with the Face 1 configuration. In the case of adding the Nafion® ionomer before using a disperser, not only the polarization curves of Face 1 and Face 2 are not identical, but also the performance is low and the activation part and membrane ionic conduction areas are lower and different compared to the previous polarization curves reported in Figure 9, for instance. In contrast, the polarization curves of Face 1 and Face 2 are comparable and repeatable with the CCM prepared with the catalyst ink dispersed before adding the Nafion® ionomer (Figure 10b).
For a better understanding of the results obtained, electrochemical impedance spectroscopy (EIS) measurements were performed in situ with the CCM in a running PEMFC, and the resulting spectrum was fitted by the WRRG model, as shown in Figure 10 (right). The latter informs us that the chosen model does not fit the as-measured spectrum well at low Re(Z), but allows us to extract RHF, which corresponds to the ionic resistance of the Nafion® membrane. As shown in Figure 10a (right), the value of RHF is rather high, suggesting a poor ionic conductivity, which is consistent with the polarization curves. Furthermore, the presence of a 45° slope (see inset in Figure 10a (right)) at the lower values of Re(Z) indicates a loss of ionic conductivity in the catalyst layer, which means a degradation of the ionomer via the use of a high-performance dispersion device. Interestingly, the use of disperser before adding the Nafion® ionomer can avoid this problem, which leads to retaining this method in the following works.

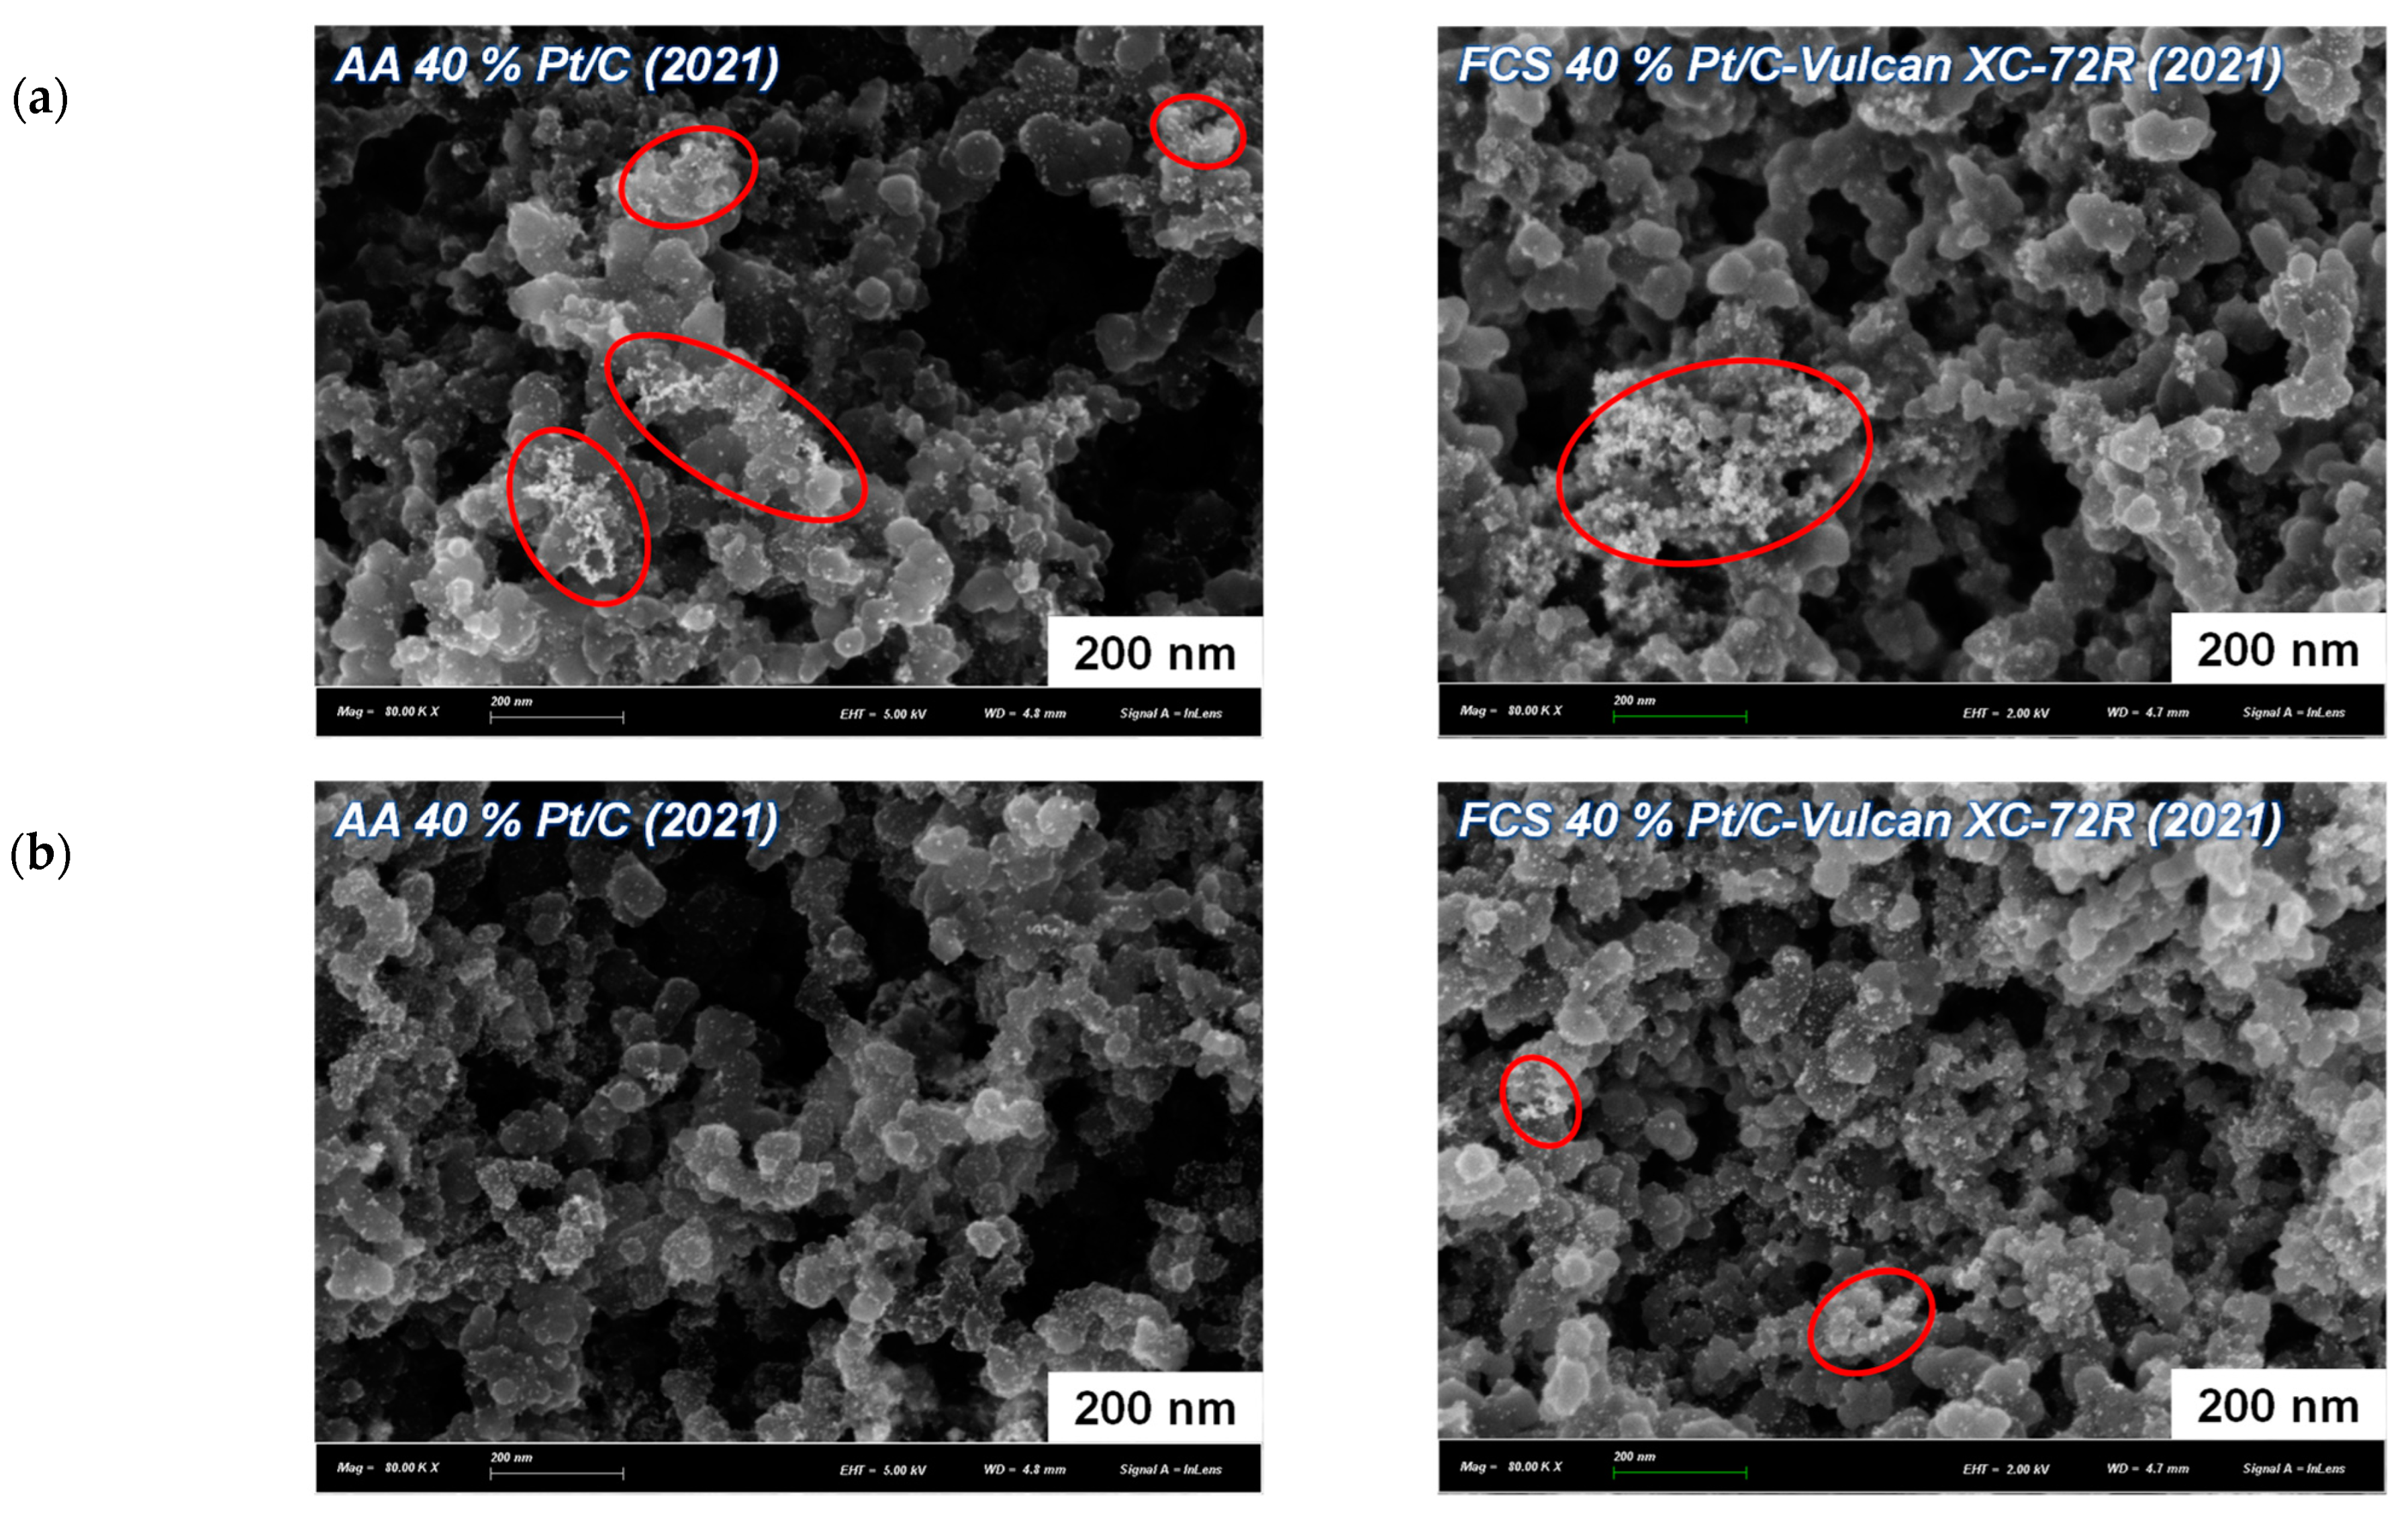
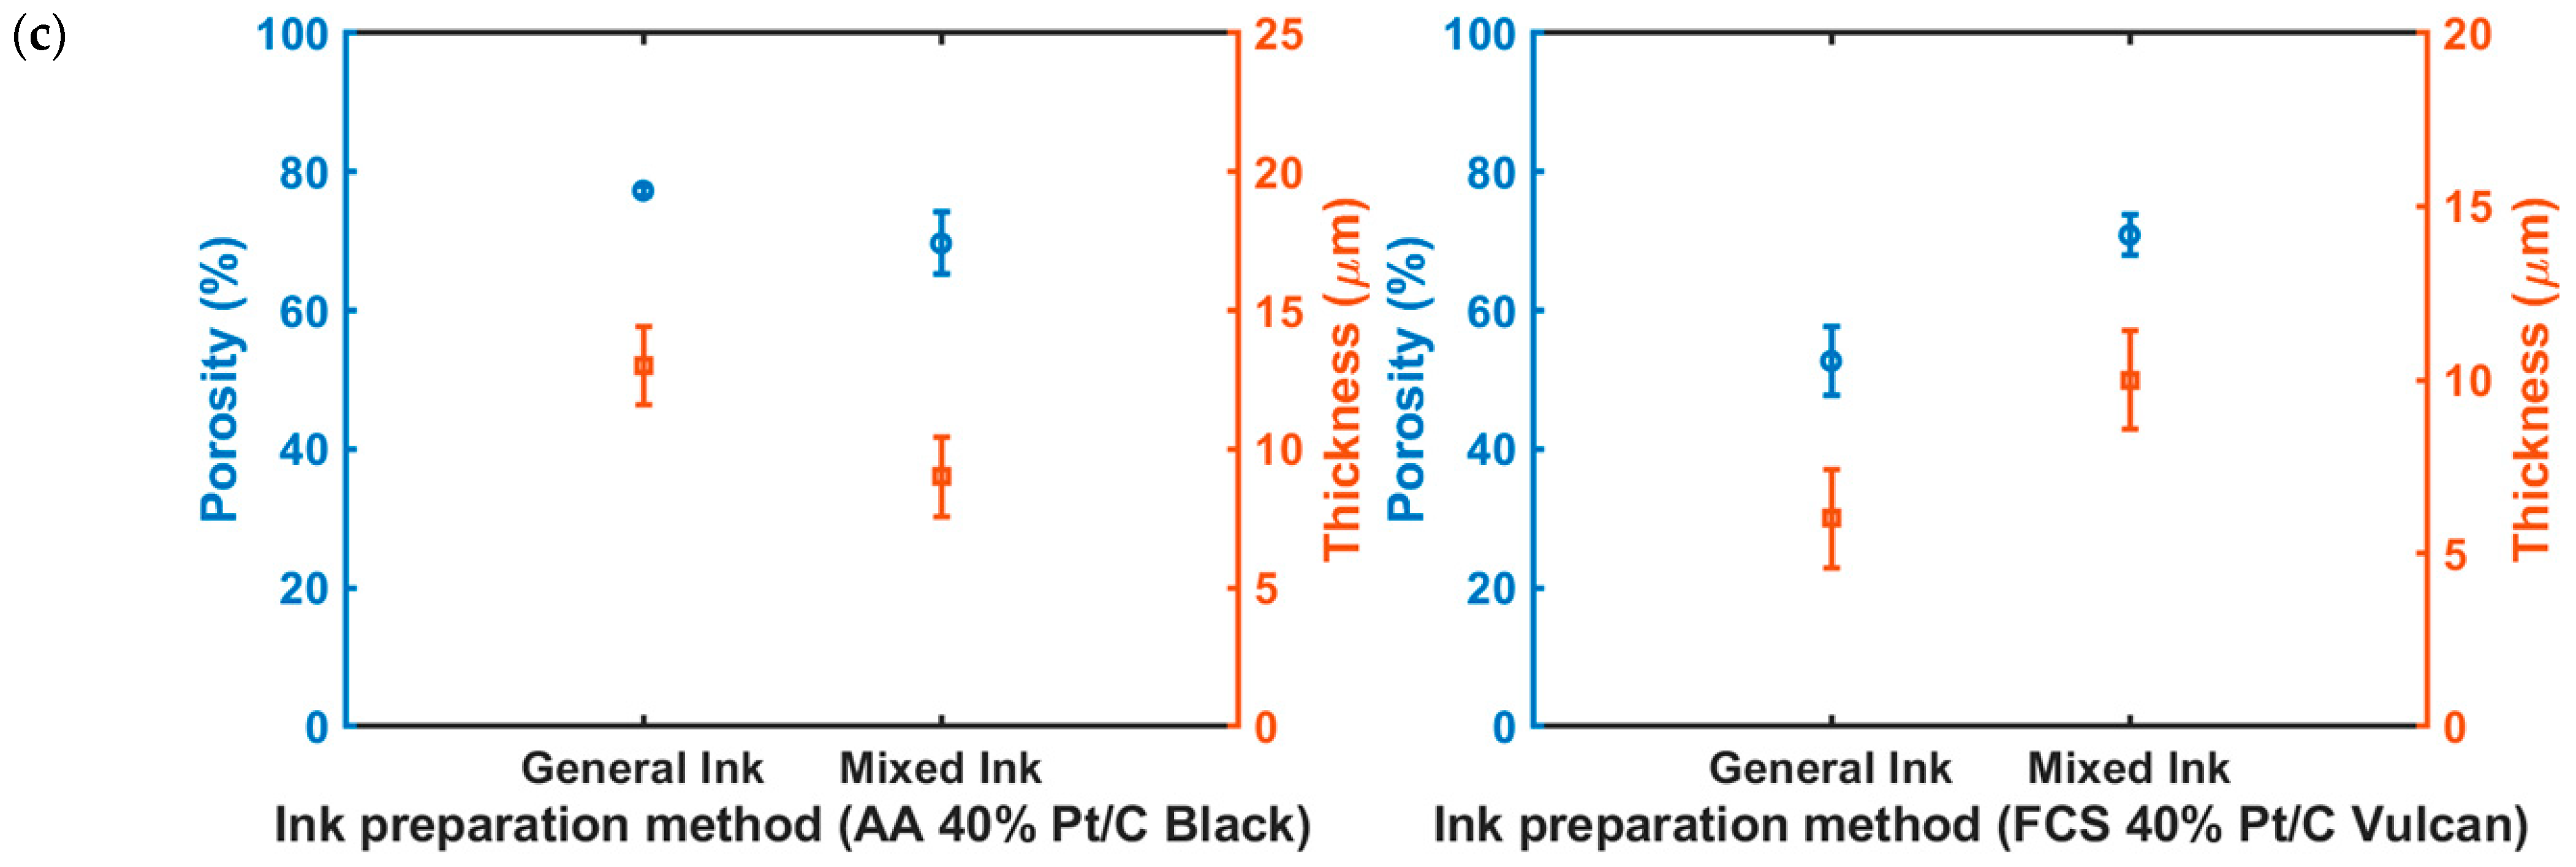
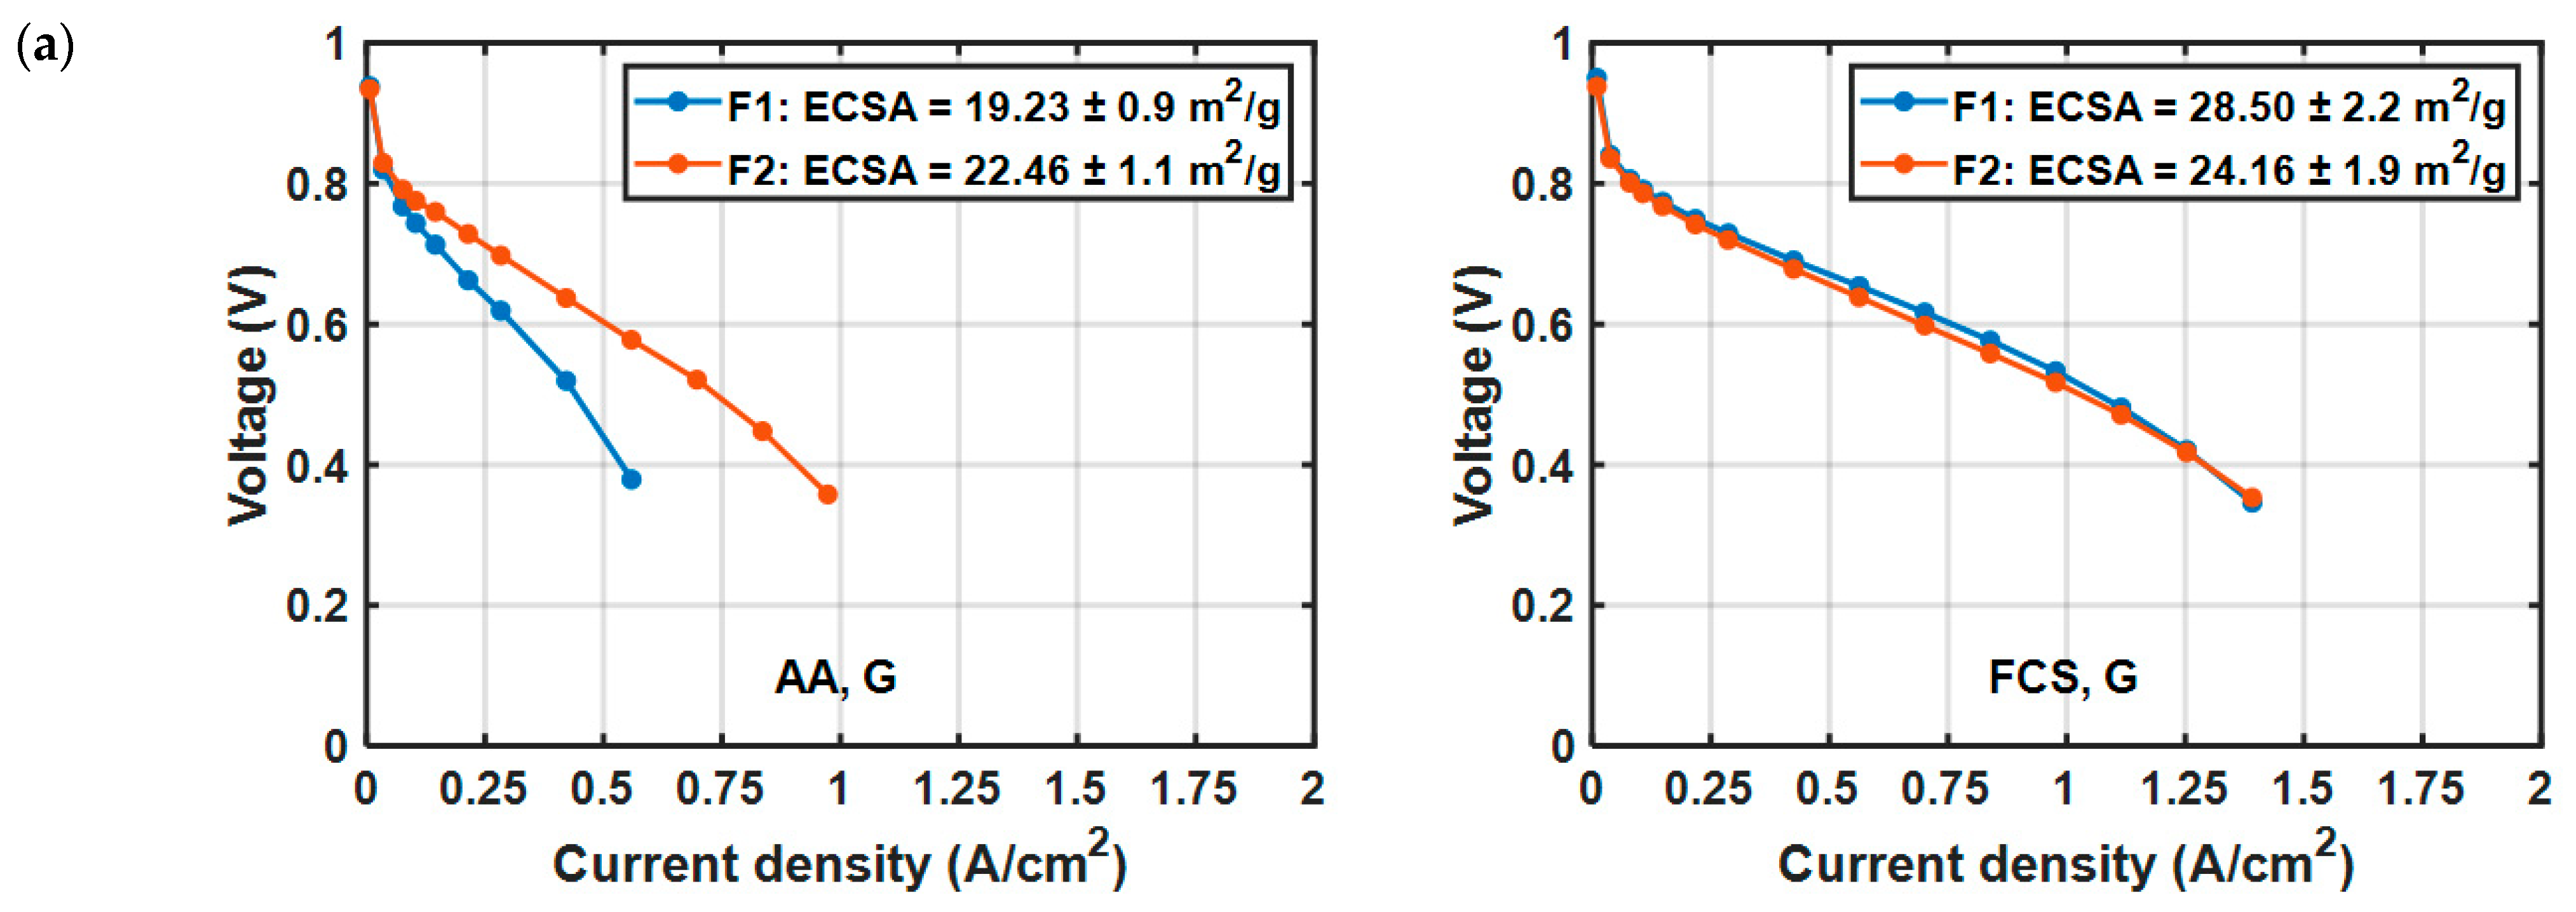
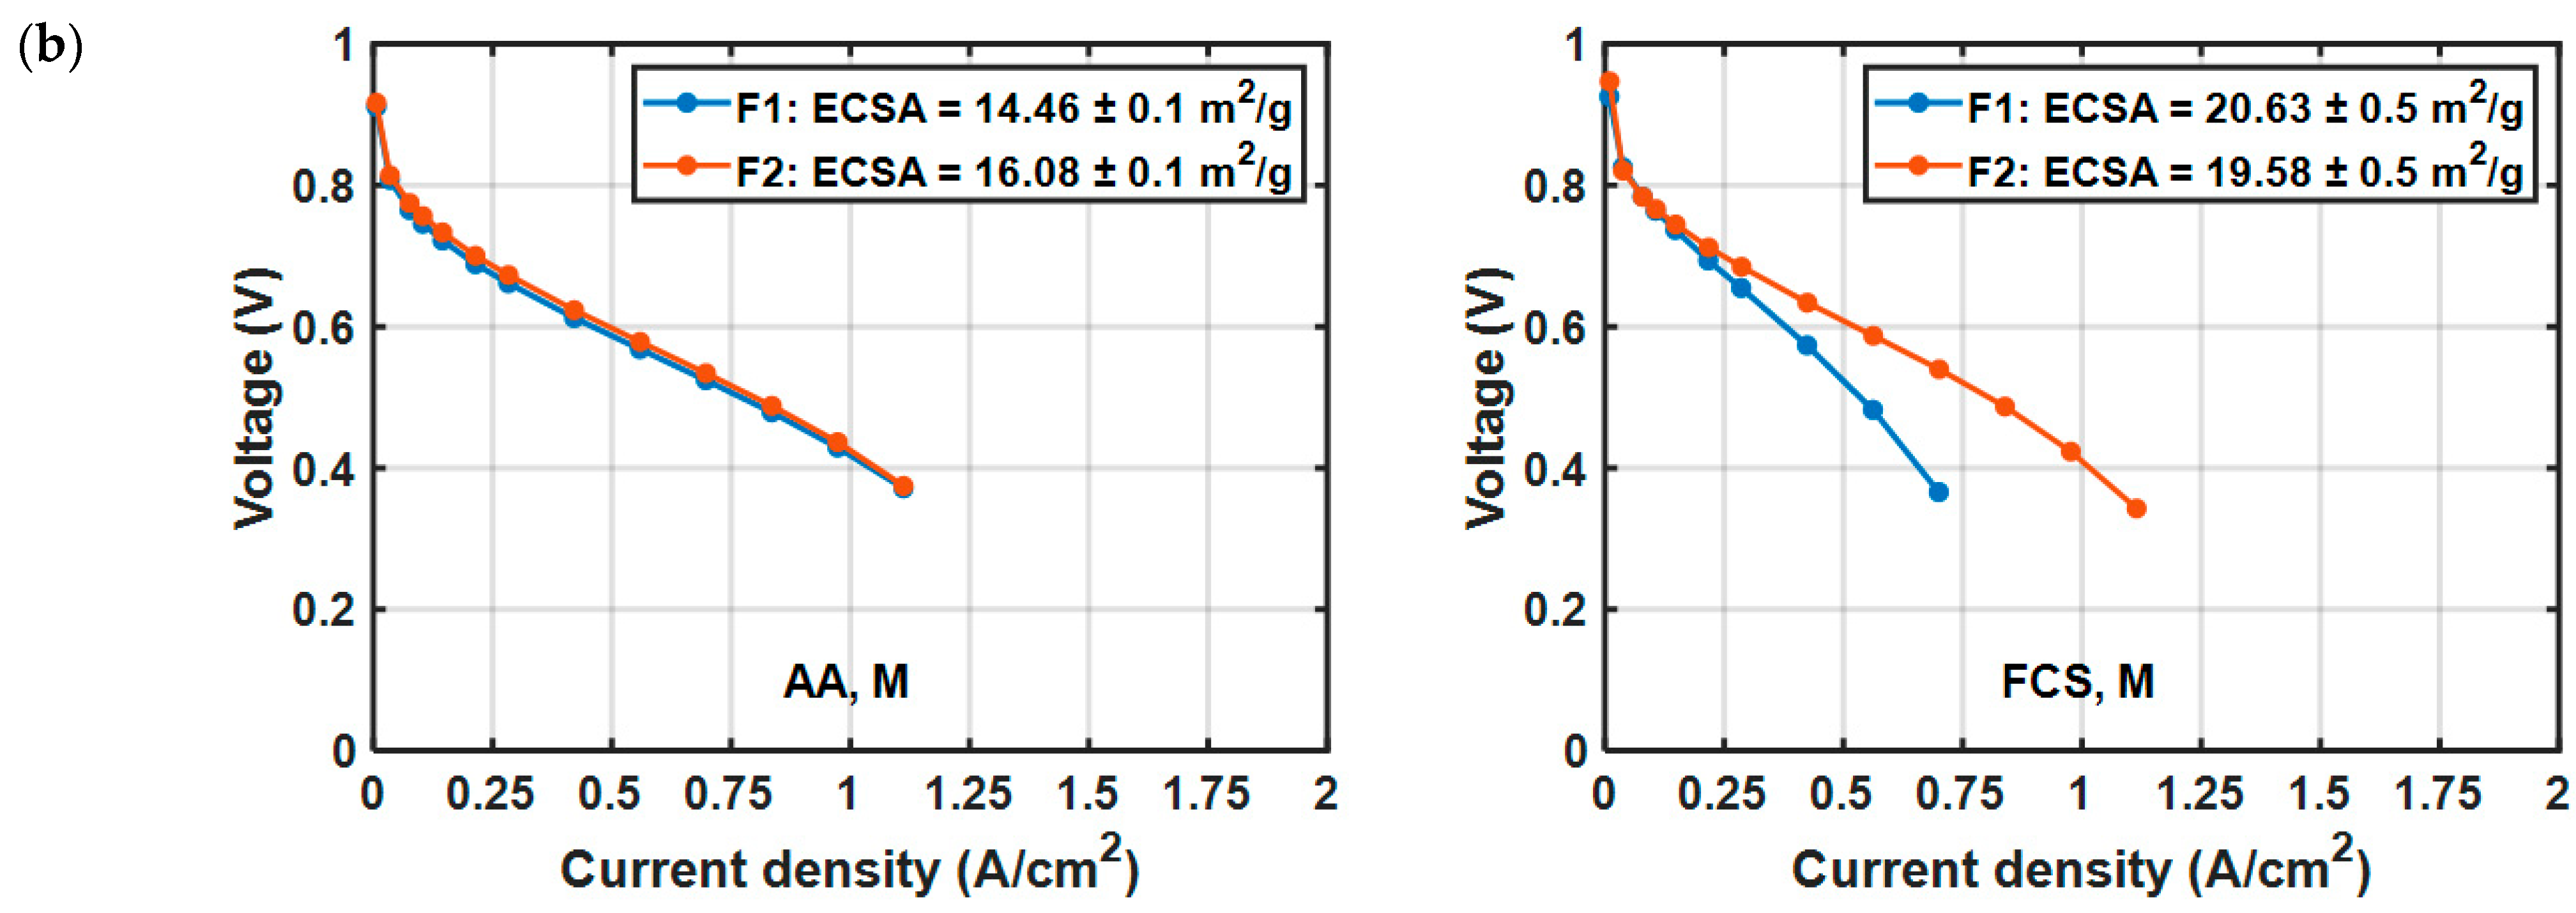
3.3.2. Comparison of the General and Mixed Methods According to the Pt/C Origin

A total of four catalyst inks were prepared using the general and mixed methods, and with the two catalysts, FCS 40% Pt/C-Vulcan XC-72R (2021) and AA 40% Pt/C (2021). CCMs were then manufactured with the four prepared inks. The Pt loadings of the deposited layers prepared with the four inks are reported in Table 4. The latter reveals that the mass of the deposited layers is more stable and repeatable with the inks prepared using the mixed method than those prepared using the general method. Indeed, the mass error of the prepared samples is lower with the mixed method than with the general method. This result indicates that the use of a dispersion tool improves the dispersion state of the particles in the prepared ink and thus results in a similar deposited mass for all prepared coating layers (with lower error uncertainty).
Then, the samples fabricated with the as-described inks were examined by scanning electron microscopy (SEM) and tactile profilometry. The results are shown in Figure 11. Some agglomeration of Pt particles is observed in the SEM images of the samples prepared using the general method (Figure 11a). In contrast, no agglomeration of particles is visible, and a rather smaller but disordered structure is obtained using the mixed method (Figure 11b).
Now comparing the thickness of the coated samples in Figure 11c, the measured results show an inversion of behavior depending on the ink preparation methods, which cannot be neglected. The sample prepared with the AA 40% Pt/C (2021) catalyst becomes thinner using the mixed method, almost a half-thickness decrease compared to the sample prepared using the general method. In contrast, the sample prepared with the FCS 40% Pt/C-Vulcan XC-72R (2021) catalyst becomes thicker than the sample prepared using the general method. The observed results can be rationalized by a difference in the carbon structure and its composition, which may be altered during the dispersing step. In fact, the dispersion tool should only make the already agglomerated particles smaller. If this were the case, we should simply observe a decrease in the thickness of the deposited layer. If the thickness of the deposited layer increases, it means that the properties of the Pt/C have changed after being dispersed with a high-performance dispersion tool.
The CCMs prepared with the four inks were investigated on a PEMFC bench, using the two configurations, Face 1 and Face 2. Polarization curves and ECSA measurements were performed, and the results are gathered in Figure 12. Concerning the samples prepared with the AA 40% Pt/C (2021) catalyst, the results suggest that the dispersion step seems to have a positive effect on the obtained ink, resulting in a better and homogeneous performance with both configurations (Figure 12b (left)). In contrast, a different and lower performance is obtained with the ink containing the FCS 40% Pt/C-Vulcan XC-72R (2021) catalyst, prepared using the mixed method. The change in performance between the two samples can be explained by a change in the thickness of the CLs (Figure 11c), and thus its porosity. In addition, the samples prepared using the mixed method all have a decrease in the ECSA that can be explained by a detachment of some platinum particles or/and a change in the structure of CLs. In the case of the FCS 40% Pt/C-Vulcan XC-72R (2021) sample, the increase in the CL thickness can lead to a larger pore size and thus decrease the concentration of the Nafion® ionomer around the Pt and consequently ECSA. In the case of the AA 40% Pt/C (2021) sample, decreasing the CL thickness increases the concentration of the Nafion® ionomer around the Pt, leading to a smaller pore size and affecting the electronic conduction of carbon.
Based on the results collected, it seems to us that the dispersion step should be used with caution, since it affects the tested Pt/C (Vulcan XC-72R and carbon black) differently. The arrangement of the Pt/C structure after the dispersion step may be a key parameter for a better understanding of the ink and coating quality. Of course, further investigation is needed in order to optimize and apprehend the dispersion step, such as the duration of the step, the rotation speed of the dispersion tool, and the particle size and distribution. Indeed, according to the literature [35], the way the ink is prepared and the type of disperser can have an effect on the particle size and distribution, and consequently on the performance of the PEMFC.

4. Conclusions

Optimizing the composition and preparation of inks for PEMFCs can be more time-consuming and challenging than it seems. In this work, we attempted to understand the performance of CCM-based MEAs by first varying the operating conditions for a given ink composition and then modifying the ink composition and preparation, such as (i) the proportion of ink components such as ionomer content, water to isopropanol ratio, and the Pt weight in the Pt/C catalysts and (ii) the ink preparation methods. All deposited layers were characterized by SEM and profilometry techniques, as well as by electrochemical tests on the PEMFC bench. The results obtained allow us to draw the following conclusions.
For a given ink composition, it is possible to improve the performance of the prepared CCM-based MEAs by playing with (i) the operating conditions (e.g., relative humidity) and (ii) the number of coating layers, which affects the thickness of the catalyst layers and Pt mass activity by at least 25%.
Changing the ink composition for a given way of preparation leads to a change in the structure of the catalyst layer, which can have a different impact on performance such as:
-
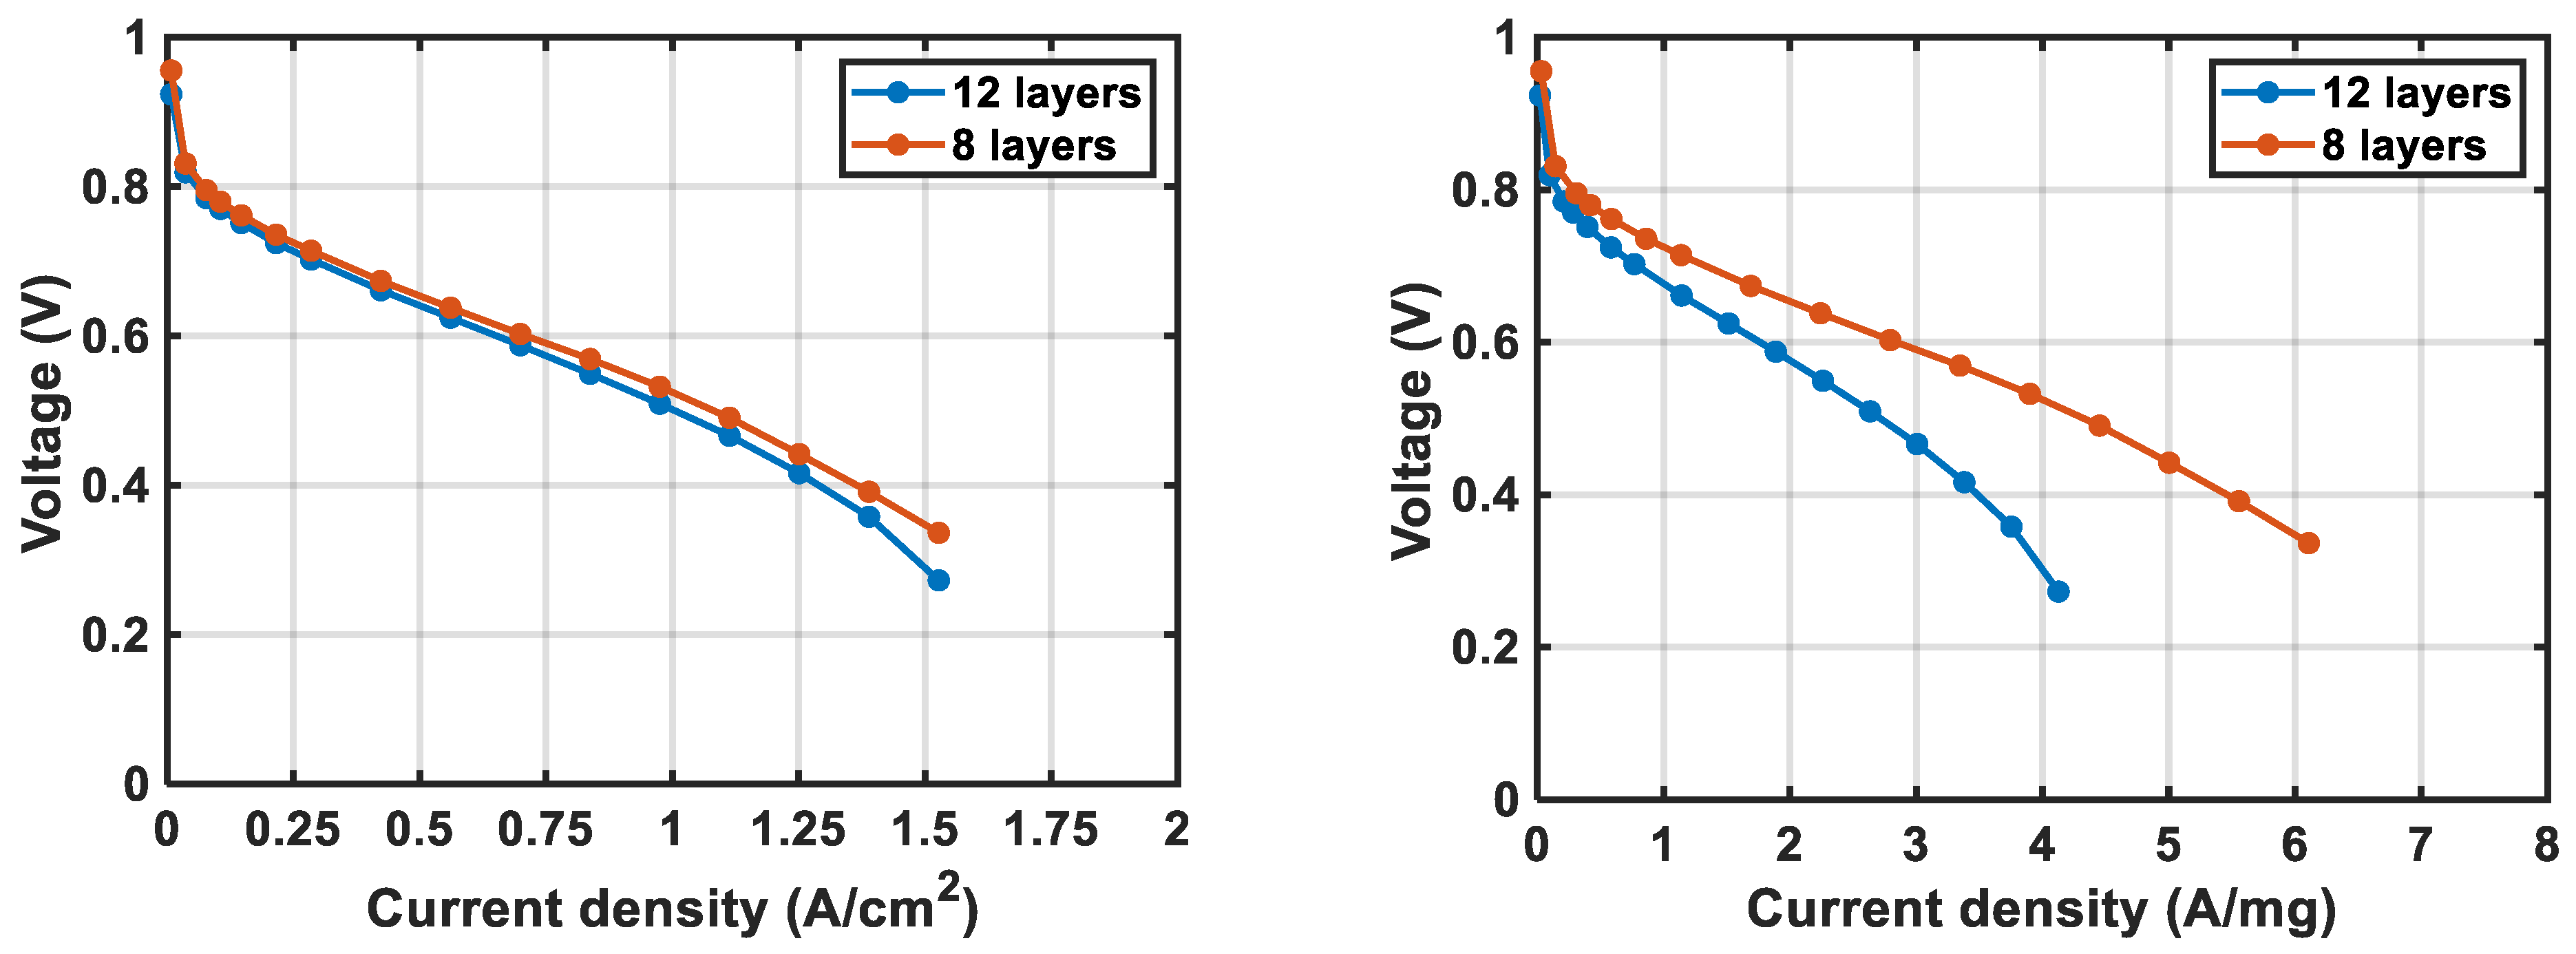
The increase in the ionomer content in the catalyst ink increases the ionomer concentration on the Pt/C. With eight coating layers, CCM-23% offers the best performance with a high Pt mass activity. However, the CCMs prepared with 12 layers of coating are less sensitive to the ionomer content: CCM-13 and 33% show a similar performance and Pt mass activity.
-
The change in the ratio of water to isopropanol in the catalyst ink leads to a change in the porosity of the catalyst layer. Water-rich inks produce large pores in the catalyst layer, reducing the PEMFC performance.
-
The increase in Pt in the Pt/C catalyst powder leads to a thinner catalyst layer for a similar Pt loading. However, the performance in the PEMFC depends greatly on the nature of carbon.
-
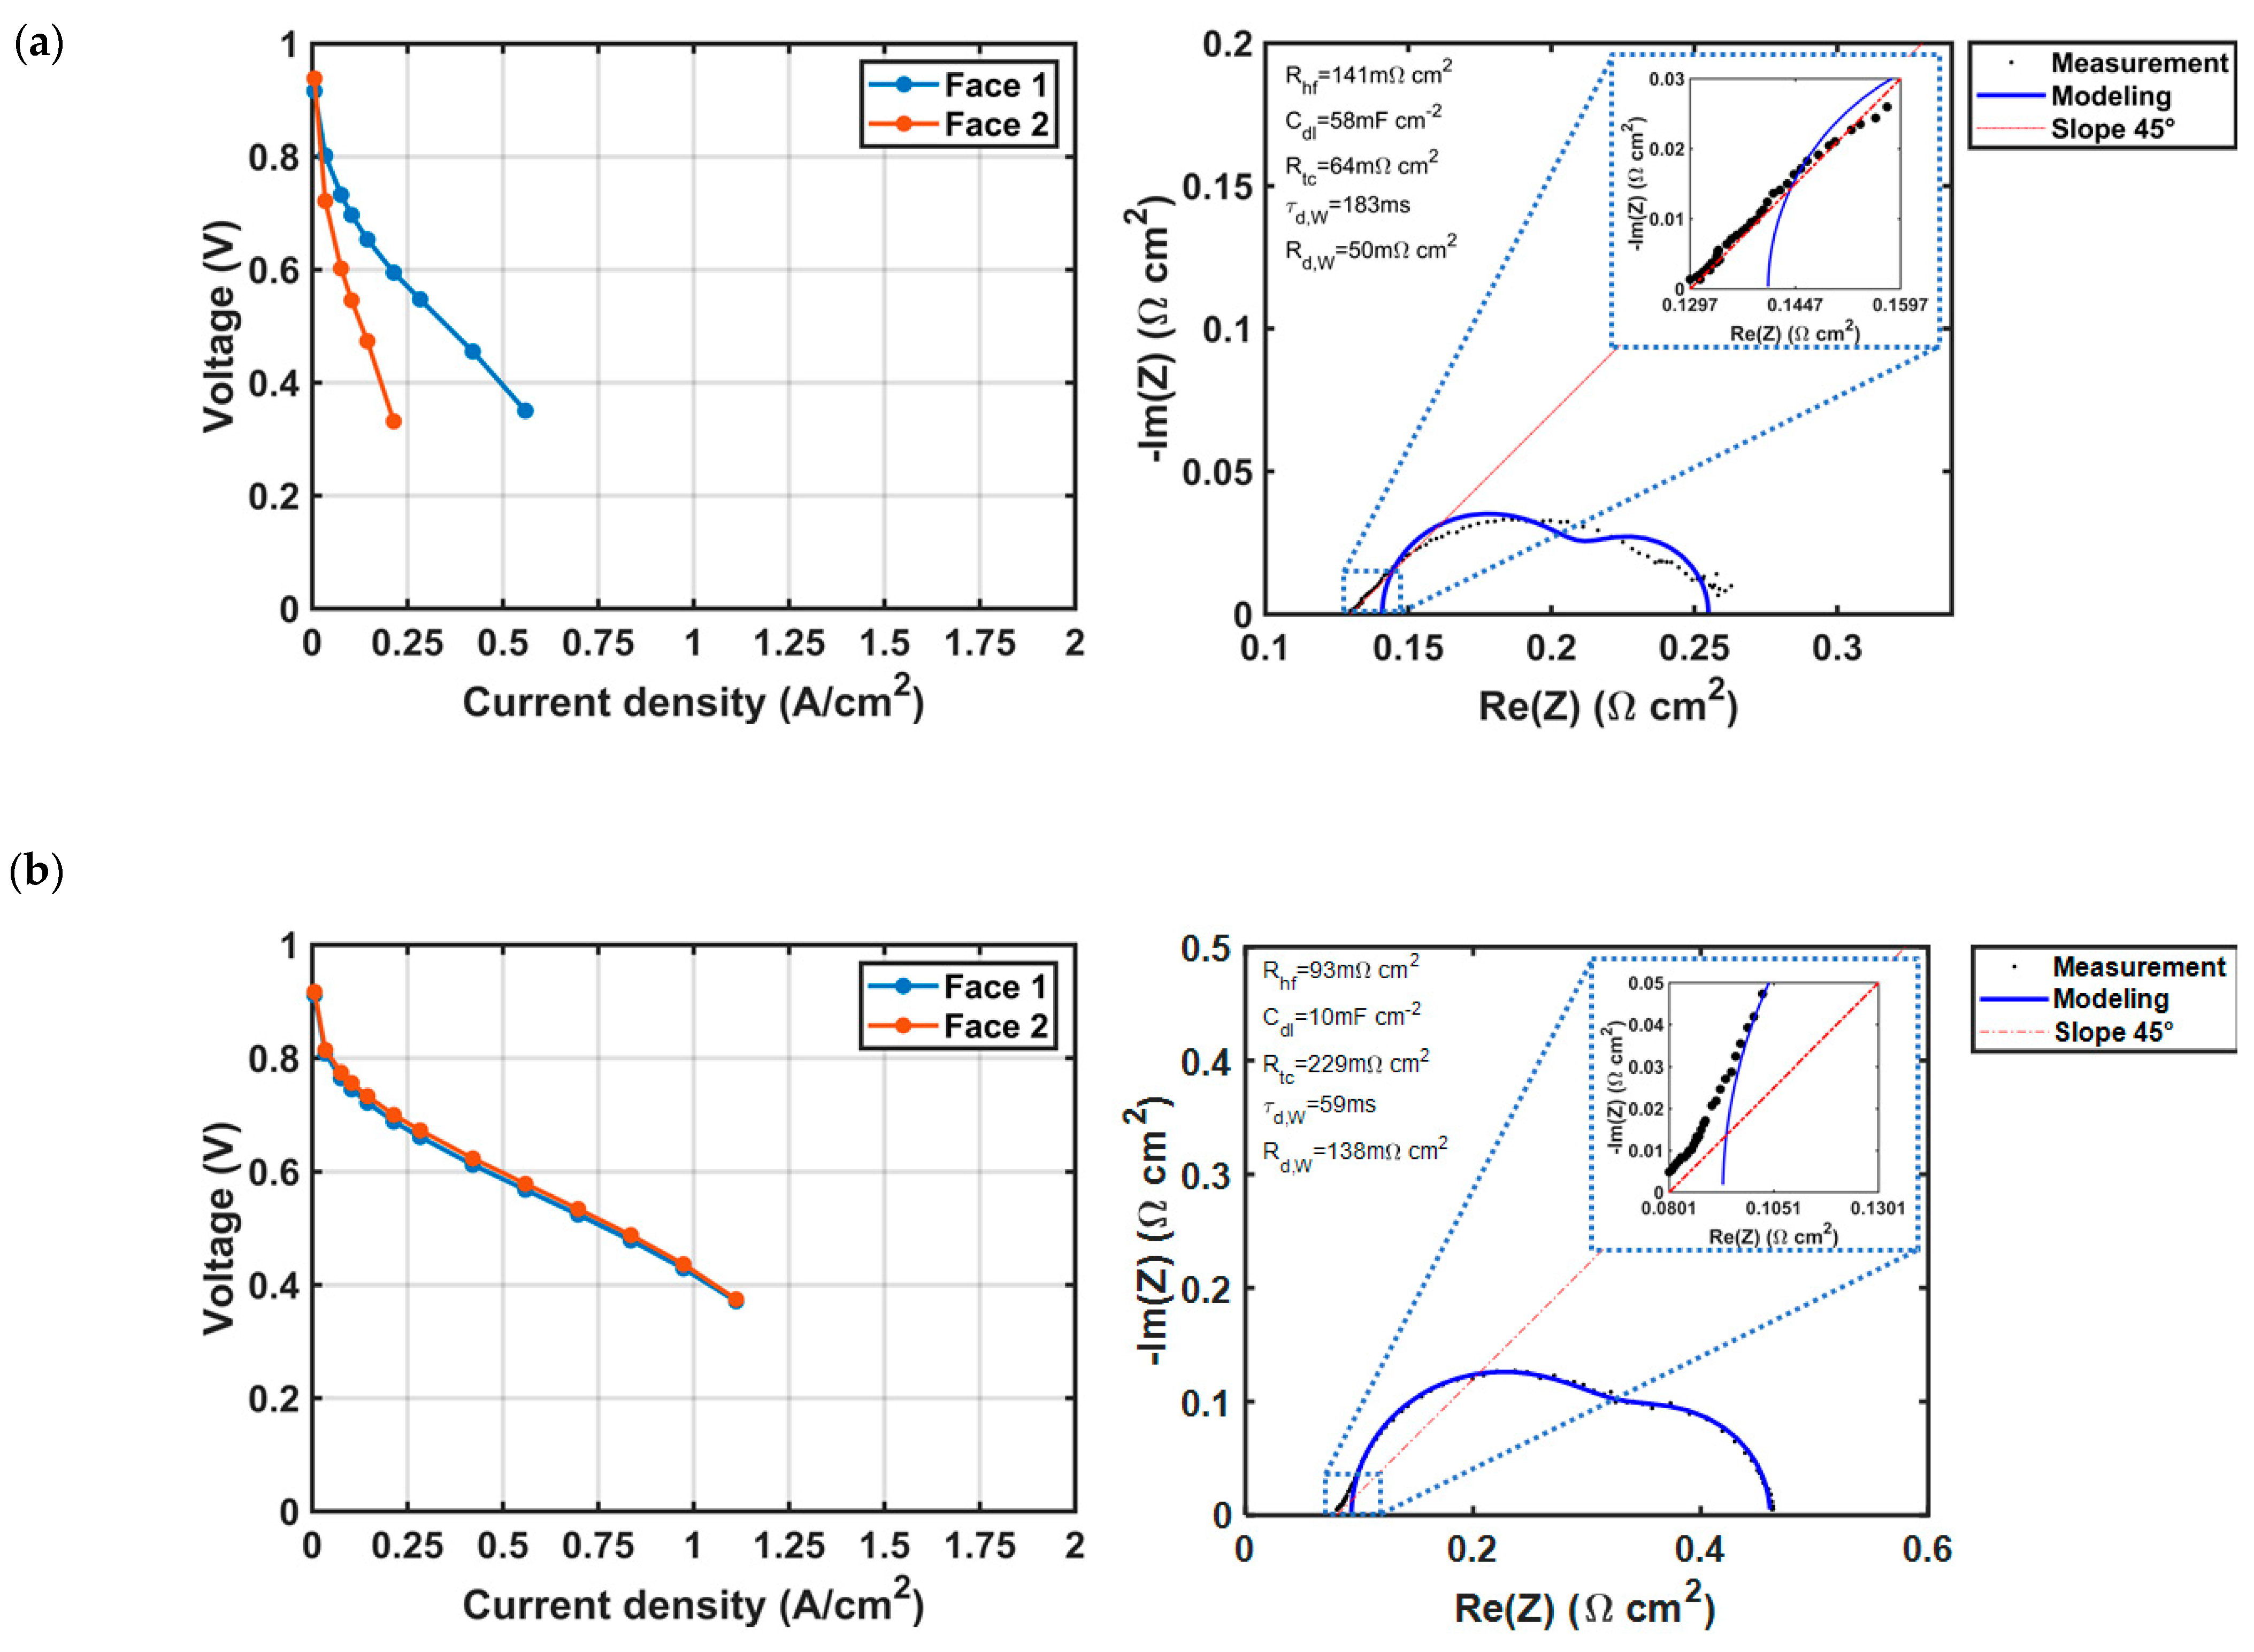
The way in which a given ink is prepared also leads to a change in the structure of the catalyst layer, which can have a considerable impact on performance. For example:
-
The use of Ultra-Turrax can damage the ionomer properties, so it is preferable to add the ionomer after the mixing step with Ultra-Turrax.
-
Depending on the carbon nature, the use of Ultra-Turrax can improve or reduce the performance.
Overall, any change in the ink composition, ink preparation, and Pt/C quality will automatically result in a change in the electrode structure and thus a change in the PEMFC performance. Therefore, we need to systematically adapt the ink composition in order to control the thickness and porosity of the catalyst layer, as well as the ink preparation for a better distribution of the catalyst particles and size. However, without a set of characterization methods and especially a unique Pt/C powder, it is really tricky to produce a repeatable and reproducible catalyst layer.

Supplementary Materials

The following supporting information can be downloaded at: https://www.mdpi.com/article/10.3390/en16227519/s1, Figure S1: Face 1 and Face 2 configurations, where the anode side is on top and the cathode side on the bottom of each configuration; Figure S2: in situ impedance spectroscopy spectra measured at a current of 3.6 A.

Author Contributions

Methodology, F.X. and Z.T.; Software, J.D. and K.M.; Validation, G.M. and F.X.; Investigation, F.X. and Z.T.; Data curation, Z.T., J.D. and K.M.; Writing—original draft, F.X. and Z.T.; Writing—review & editing, F.X., G.M. and A.C.; Visualization, Z.T., R.P. and A.C.; Supervision, F.X. and G.M. All authors have read and agreed to the published version of the manuscript.

Funding

This work was supported (i) partly by the French PIA project «Lorraine Université d’Excellence», reference ANR-15-IDEX-04-LUE, and (ii) by the “Abai-Verne” scholarship of the French Ministry for Europe and Foreign Affairs and the Ministry of Science and Higher Education of the Republic of Kazakhstan.

Data Availability Statement

Data available on authors’ request.

Acknowledgments

The authors acknowledge the support of the Ministry of Science and Higher Education of the Republic of Kazakhstan under the grant agreement AP09260105.

Conflicts of Interest

The authors declare no conflict of interest.

References

  1. Staffell, I.; Scamman, D.; Velazquez Abad, A.; Balcombe, P.; Dodds, P.E.; Ekins, P.; Shah, N.; Ward, K.R. The role of hydrogen and fuel cells in the global energy system. Energy Environ. Sci. 2019, 12, 463–491. [Google Scholar] [CrossRef]
  2. Liu, Q.; Lan, F.; Chen, J.; Zeng, C.; Wang, J. A review of proton exchange membrane fuel cell water management: Membrane electrode assembly. J. Power Sources 2022, 517, 230723. [Google Scholar] [CrossRef]
  3. Liu, C.-Y.; Sung, C.-C. A review of the performance and analysis of proton exchange membrane fuel cell membrane electrode assemblies. J. Power Sources 2012, 220, 348–353. [Google Scholar] [CrossRef]
  4. Nondudule, Z.; Chamier, J.; Chowdhury, M. Effect of Stratification of Cathode Catalyst Layers on Durability of Proton Exchange Membrane Fuel Cells. Energies 2021, 14, 2975. [Google Scholar] [CrossRef]
  5. Tang, H.; Wang, S.; Jiang, S.P.; Pan, M. A comparative study of CCM and hot-pressed MEAs for PEM fuel cells. J. Power Sources 2007, 170, 140–144. [Google Scholar] [CrossRef]
  6. Umap, V.M.; Ugwekar, R.P. Performance analysis of gas diffusion electrode with varying platinum loading under different oxidant condition. Renew. Energy 2020, 155, 1339–1346. [Google Scholar] [CrossRef]
  7. Shukla, S.; Domican, K.; Karan, K.; Bhattacharjee, S.; Secanell, M. Analysis of Low Platinum Loading Thin Polymer Electrolyte Fuel Cell Electrodes Prepared by Inkjet Printing. Electrochim. Acta 2015, 156, 289–300. [Google Scholar] [CrossRef]
  8. Moghaddam, R.B.; Easton, E.B. The interplay between impedance parameters, structure, and performance of fuel cell catalyst layers. Chem. Eng. Sci. 2020, 224, 115792. [Google Scholar] [CrossRef]
  9. Shahgaldi, S.; Alaefour, I.; Li, X. Impact of manufacturing processes on proton exchange membrane fuel cell performance. Appl. Energy 2018, 225, 1022–1032. [Google Scholar] [CrossRef]
  10. Lee, M.-R.; Lee, H.-Y.; Yim, S.-D.; Kim, C.-S.; Shul, Y.-G.; Kucernak, A.; Shin, D. Effects of Ionomer Carbon Ratio and Ionomer Dispersity on the Performance and Durability of MEAs. Fuel Cells 2018, 18, 129–136. [Google Scholar] [CrossRef]
  11. Fouzaï, I.; Gentil, S.; Bassetto, V.C.; Silva, W.O.; Maher, R.; Girault, H.H. Catalytic layer-membrane electrode assembly methods for optimum triple phase boundaries and fuel cell performances. J. Mater. Chem. A 2021, 9, 11096–11123. [Google Scholar] [CrossRef]
  12. Van Dao, D.; Adilbish, G.; Le, T.D.; Lee, I.-H.; Yu, Y.-T. Triple phase boundary and power density enhancement in PEMFCs of a Pt/C electrode with double catalyst layers. RSC Adv. 2019, 9, 15635–15641. [Google Scholar] [CrossRef]
  13. Suter, T.A.M.; Smith, K.; Hack, J.; Rasha, L.; Rana, Z.; Angel, G.M.A.; Shearing, P.R.; Miller, T.S.; Brett, D.J.L. Engineering Catalyst Layers for Next-Generation Polymer Electrolyte Fuel Cells: A Review of Design, Materials, and Methods. Adv. Energy Mater. 2021, 11, 2101025. [Google Scholar] [CrossRef]
  14. Rohendi, D.; Majlan, E.H.; Mohamad, A.B.; Wan Daud, W.R.; Hassan Kadhum, A.A.; Shyuan, L.K. Characterization of electrodes and performance tests on MEAs with varying platinum content and under various operational conditions. Int. J. Hydrogen Energy 2013, 38, 9431–9437. [Google Scholar] [CrossRef]
  15. Xie, M.; Chu, T.; Wang, T.; Wan, K.; Yang, D.; Li, B.; Ming, P.; Zhang, C. Preparation, Performance and Challenges of Catalyst Layer for Proton Exchange Membrane Fuel Cell. Membranes 2021, 11, 879. [Google Scholar] [CrossRef]
  16. Liu, H.; Ney, L.; Zamel, N.; Li, X. Effect of Catalyst Ink and Formation Process on the Multiscale Structure of Catalyst Layers in PEM Fuel Cells. Appl. Sci. 2022, 12, 3776. [Google Scholar] [CrossRef]
  17. Guo, Y.; Pan, F.; Chen, W.; Ding, Z.; Yang, D.; Li, B.; Ming, P.; Zhang, C. The Controllable Design of Catalyst Inks to Enhance PEMFC Performance: A Review. Electrochem. Energy Rev. 2021, 4, 67–100. [Google Scholar] [CrossRef]
  18. Chen, Y.; Zhong, Q.; Li, G.; Tian, T.; Tan, J.; Pan, M. Electrochemical study of temperature and Nafion effects on interface property for oxygen reduction reaction. Ionics 2018, 24, 3905–3914. [Google Scholar] [CrossRef]
  19. Wuttikid, K.; Shimpalee, S.; Weidner, J.W.; Punyawudho, K. Evaluation of Nafion with Various Pt–C Concentrations in Membrane Electrode Assemblies for PEMFCs. Fuel Cells 2017, 17, 643–651. [Google Scholar] [CrossRef]
  20. Huang, B.; He, Y.; Huang, Y.; Zhu, Y.; Zhang, Y.; Wang, Z. Effects of Nafion content in membrane electrode assembly on electrochemical Bunsen reaction in high electrolyte acidity. Int. J. Hydrogen Energy 2019, 44, 11646–11654. [Google Scholar] [CrossRef]
  21. Chen, G.-Y.; Wang, C.; Lei, Y.-J.; Zhang, J.; Mao, Z.; Mao, Z.-Q.; Guo, J.-W.; Li, J.; Ouyang, M. Gradient design of Pt/C ratio and Nafion content in cathode catalyst layer of PEMFCs. Int. J. Hydrogen Energy 2017, 42, 29960–29965. [Google Scholar] [CrossRef]
  22. Kim, K.-H.; Lee, K.-Y.; Kim, H.-J.; Cho, E.; Lee, S.-Y.; Lim, T.-H.; Yoon, S.P.; Hwang, I.C.; Jang, J.H. The effects of Nafion® ionomer content in PEMFC MEAs prepared by a catalyst-coated membrane (CCM) spraying method. Int. J. Hydrogen Energy 2010, 35, 2119–2126. [Google Scholar] [CrossRef]
  23. Sun, L.; Ran, R.; Wang, G.; Shao, Z. Fabrication and performance test of a catalyst-coated membrane from direct spray deposition. Solid State Ionics 2008, 179, 960–965. [Google Scholar] [CrossRef]
  24. Passos, R.R.; Paganin, V.A.; Ticianelli, E.A. Studies of the performance of PEM fuel cell cathodes with the catalyst layer directly applied on Nafion membranes. Electrochim. Acta 2006, 51, 5239–5245. [Google Scholar] [CrossRef]
  25. Huang, T.-H.; Shen, H.-L.; Jao, T.-C.; Weng, F.-B.; Su, A. Ultra-low Pt loading for proton exchange membrane fuel cells by catalyst coating technique with ultrasonic spray coating machine. Int. J. Hydrogen Energy 2012, 37, 13872–13879. [Google Scholar] [CrossRef]
  26. Qi, Z.; Kaufman, A. Low Pt loading high performance cathodes for PEM fuel cells. J. Power Sources 2003, 113, 37–43. [Google Scholar] [CrossRef]
  27. Cho, Y.-H.; Park, H.-S.; Cho, Y.-H.; Jung, D.-S.; Park, H.-Y.; Sung, Y.-E. Effect of platinum amount in carbon supported platinum catalyst on performance of polymer electrolyte membrane fuel cell. J. Power Sources 2007, 172, 89–93. [Google Scholar] [CrossRef]
  28. Kim, D.S.; Welch, C.; Hjelm, R.P.; Kim, Y.S.; Guiver, M.D. Polymers in Membrane Electrode Assemblies. Polym. Sci. A Compr. Ref. 2012, 10, 691–720. [Google Scholar] [CrossRef]
  29. Ngo, T.T.; Yu, T.L.; Lin, H.-L. Influence of the composition of isopropyl alcohol/water mixture solvents in catalyst ink solutions on proton exchange membrane fuel cell performance. J. Power Sources 2013, 225, 293–303. [Google Scholar] [CrossRef]
  30. Song, C.H.; Park, J.S. Effect of dispersion solvents in catalyst inks on the performance and durability of catalyst layers in proton exchange membrane fuel cells. Energies 2019, 12, 549. [Google Scholar] [CrossRef]
  31. Lei, C.; Yang, F.; Macauley, N.; Spinetta, M.; Purdy, G.; Jankovic, J.; Cullen, D.A.; More, K.L.; Kim, Y.S.; Xu, H. Impact of Catalyst Ink Dispersing Solvent on PEM Fuel Cell Performance and Durability. J. Electrochem. Soc. 2021, 168, 044517. [Google Scholar] [CrossRef]
  32. Kim, T.H.; Yi, J.Y.; Jung, C.Y.; Jeong, E.; Yi, S.C. Solvent effect on the Nafion agglomerate morphology in the catalyst layer of the proton exchange membrane fuel cells. Int. J. Hydrogen Energy 2017, 42, 478–485. [Google Scholar] [CrossRef]
  33. Takahashi, S.; Mashio, T.; Horibe, N.; Akizuki, K.; Ohma, A. Analysis of the Microstructure Formation Process and Its Influence on the Performance of Polymer Electrolyte Fuel-Cell Catalyst Layers. ChemElectroChem 2015, 2, 1560–1567. [Google Scholar] [CrossRef]
  34. Wang, M.; Park, J.H.; Kabir, S.; Neyerlin, K.C.; Kariuki, N.N.; Lv, H.; Stamenkovic, V.R.; Myers, D.J.; Ulsh, M.; Mauger, S.A. Impact of Catalyst Ink Dispersing Methodology on Fuel Cell Performance Using in-Situ X-ray Scattering. ACS Appl. Energy Mater. 2019, 2, 6417–6427. [Google Scholar] [CrossRef]
  35. Yang, D.; Guo, Y.; Tang, H.; Wang, Y.; Yang, D.; Ming, P.; Zhang, C.; Li, B.; Zhu, S. Influence of the dispersion state of ionomer on the dispersion of catalyst ink and the construction of catalyst layer. Int. J. Hydrogen Energy 2021, 46, 33300–33313. [Google Scholar] [CrossRef]
  36. Turtayeva, Z.; Xu, F.; Dillet, J.; Mozet, K.; Peignier, R.; Celzard, A.; Maranzana, G. Manufacturing catalyst-coated membranes by ultrasonic spray deposition for PEMFC: Identification of key parameters and their impact on PEMFC performance. Int. J. Hydrogen Energy 2022, 47, 16165–16178. [Google Scholar] [CrossRef]
  37. Dillet, J.; Spernjak, D.; Lamibrac, A.; Maranzana, G.; Mukundan, R.; Fairweather, J.; Didierjean, S.; Borup, R.L.; Lottin, O. Impact of flow rates and electrode specifications on degradations during repeated startups and shutdowns in polymer-electrolyte membrane fuel cells. J. Power Sources 2014, 250, 68–79. [Google Scholar] [CrossRef]
  38. Lamibrac, A. Study of the Degradations Induced by Start-Up/Shut-Down Operations in PEMFC. Ph.D. Thesis, Université de Lorraine, Nancy, France, 2013. [Google Scholar]
  39. Touhami, S.; Mainka, J.; Dillet, J.; Taleb, S.A.H.; Lottin, O. Transmission Line Impedance Models Considering Oxygen Transport Limitations in Polymer Electrolyte Membrane Fuel Cells. J. Electrochem. Soc. 2019, 166, F1209–F1217. [Google Scholar] [CrossRef]
  40. Xue, Q.; Yang, D.-J.; Wang, J.; Li, B.; Ming, P.-W.; Zhang, C.-M. Enhanced mass transfer and proton conduction of cathode catalyst layer for proton exchange membrane fuel cell through filling polyhedral oligomeric silsesquioxane. J. Power Sources 2021, 487, 229413. [Google Scholar] [CrossRef]
  41. Xue, Q.; Zhang, R.; Yang, D.; Li, B.; Ming, P.; Zhang, C. Effect of ionomer content on cathode catalyst layer for PEMFC via molecular dynamics simulations and experiments. Int. J. Hydrog. Energy 2022, 47, 23335–23347. [Google Scholar] [CrossRef]
  42. Sassin, M.B.; Garsany, Y.; Atkinson, R.W.; Hjelm, R.M.E.; Swider-Lyons, K.E. Understanding the interplay between cathode catalyst layer porosity and thickness on transport limitations en route to high-performance PEMFCs. Int. J. Hydrogen Energy 2019, 44, 16944–16955. [Google Scholar] [CrossRef]
  43. Mauritz, K.A.; Moore, R.B. State of understanding of Nafion. Chem. Rev. 2004, 104, 4535–4585. [Google Scholar] [CrossRef]
  44. Kusoglu, A.; Weber, A.Z. New Insights into Perfluorinated Sulfonic-Acid Ionomers. Chem. Rev. 2017, 117, 987–1104. [Google Scholar] [CrossRef] [PubMed]
  45. Ngo, T.T.; Yu, T.L.; Lin, H.L. Nafion-based membrane electrode assemblies prepared from catalyst inks containing alcohol/water solvent mixtures. J. Power Sources 2013, 238, 1–10. [Google Scholar] [CrossRef]
Figure 1. Original samples for profilometry, with guidelines (yellow or red arrow) as a reference for the characterization analysis.
Energies 16 07519 g001
Figure 2. Polarization curves according to different H2/air stoichiometries (in the caption) obtained with a Nafion® 212 based-MEA (prepared with an ink containing Pt/C 40% wt, 33% of ionomer content, in a water/isopropanol solution (1:2)), containing the FCS 40% Pt/C-Vulcan XC-72R (2021) catalyst, and measured at 70 °C and 60% RH (left) or 80% RH (right).
Energies 16 07519 g002
Figure 3. Polarization curve of CCM-based MEAs coated with 8 and 12 layers of ultrasonic spray (0.25 and 0.37 mg cm−2 Pt loading, respectively, from ink composed of 33 wt.% Nafion®, AA 40% Pt/C (2020), ratio (water:isopropanol) of 1:2), performed in H2/air at stoichiometry 1.5/5, at 70 °C and 60% RH for both gases, expressed in (left) current density and (right) Pt mass activity (current per Pt mass).
Energies 16 07519 g003
Figure 4. Polarization curve of (a) 8 and (b) 12 layers, and Pt mass activity (current per Pt mass) of (c) 8 and (d) 12 layers of CCM-based MEAs prepared with the 3 inks containing 13, 23, and 33 wt.% Nafion® contents, respectively, performed in H2/air at stoichiometry 1.5/5, at 70 °C and 60% RH for both gases; (e) parameters extracted using the WRRG model from in situ impedance spectroscopy spectra measured at 3.6 A current; and (f) ECSA value of these MEAs.
Energies 16 07519 g004aEnergies 16 07519 g004b
Figure 5. Morphological measurements: SEM images of the catalyst layer prepared with AA 40% Pt/C (2020) and different Nafion® ionomer contents of 13, 23, and 33 wt.%; images with magnification of (a) 20,000× (scale bars 1 µm) and (b) 150,000× (scale bars 100 nm); (c) thickness measured from profilometry and estimated porosity of CLs prepared with different Nafion® ionomer contents: 33 wt.% (yellow), 23 wt.% (orange), and 13 wt.% (blue), 12 layers of deposition.
Energies 16 07519 g005
Figure 6. Morphological measurements of CLs prepared with ink (1:2) in blue and ink (2:1) in orange: (a) SEM images at 20,000× magnification (scale bars 1 µm) and (b) profilometry measurements and porosity results.
Energies 16 07519 g006
Figure 7. Electrochemical measurements: (a) polarization curves and (b) ECSA values depending on the water ratio in the water and isopropanol mixture and compared with the literature data from [29,33]. All results were obtained in H2/air at stoichiometry 1.5/5, at 70 °C and 60% RH for both gases.
Energies 16 07519 g007
Figure 8. Morphological measurements: (a) SEM images of CLs prepared with the catalyst ink with (left) FCS 20% (calculated) and (right) 40% Pt/C-Vulcan XC-72R (2019) with a 20,000× magnification (scale bar 1 µm); (b) profilometry measurements and porosity results of CLs prepared with the catalysts (left) 20 and 40% Pt/C-Black (2020), and (right) 40% Pt/C-Vulcan XC-72R (2019).
Energies 16 07519 g008
Figure 9. (a) polarization curves and (b) ECSA of CCM-based MEAs prepared with the 4 inks as described above. All results were obtained in H2/air at stoichiometry 1.5/5, at 70 °C and 80% RH for both gases.
Energies 16 07519 g009
Figure 10. (Left) polarization curves and (right) electrochemical impedance spectroscopy results of MEAs prepared with catalyst inks dispersed after (a) and before (b) adding the Nafion® ionomer. All results were obtained in H2/air at stoichiometry 1.5/5, at 70 °C and 60% RH for both gases.
Energies 16 07519 g010
Figure 11. Morphological measurements: SEM images of the CCM catalyst layer with (a) general catalyst ink and (b) mixed catalyst ink, at 80,000× magnification (scale bars 200 nm); (c) profilometry measurements of CL deposition with general (orange) and mixed (blue) catalyst inks with (left) AA 40% Pt/C (2021) and (right) FCS 40% Pt/C-Vulcan XC-72R (2021).
Energies 16 07519 g011aEnergies 16 07519 g011b
Figure 12. Polarization curves of CCMs prepared using (a) general and (b) mixed methods and catalysts: (left) AA 40% Pt/C (2021) and (right) FCS 40% Pt/C-Vulcan XC-72R (2021). All results were obtained in H2/air at stoichiometry 1.5/5, at 70 °C and 60% RH for both gases.
Energies 16 07519 g012aEnergies 16 07519 g012b
Table 1. Composition and preparation of the catalyst inks.
Ionomer (wt.%)Pt wt. (%) in Pt/CSolvent (H2O:IPA)Preparation Mode
113401:2General
23
33
233401:2General
2:1
333201:2General
40
43340 (FCS)1:2General
Mixed
40 (AA)General
Mixed
Table 2. Estimated Pt loading of 8 and 12 spray-coating layers at different Nafion® ionomer contents.
Nafion® Ionomer (wt.%)LPt (mg cm−2)
8 Layers12 Layers
13 wt.%0.24 ± 0.010.36 ± 0.01
23 wt.%0.23 ± 0.01-
33 wt.%0.25 ± 0.020.37 ± 0.02
Table 3. Pt and carbon mass loading according to the four prepared inks with the four catalysts.
20% Pt/C40% Pt/C
Number of Coating Layers2412
Name of catalystFCS 20% Pt/C-Vulcan XC-72R (2019)FCS 20% Pt/C-Black (2020)FCS 40% Pt/C-Vulcan XC-72R (2019)FCS 40% Pt/C-Black (2020)
mPt (mg cm−2)0.33 ± 0.020.45 ± 0.030.34 ± 0.010.37 ± 0.01
mC (mg cm−2)1.32 ± 0.021.8 ± 0.030.51 ± 0.010.55 ± 0.01
Table 4. Pt mass loadings for different ink preparations and catalysts.
Ink Preparation MethodPt Loading (mg cm−2)
AA 40% Pt/C (2021)FCS 40% Pt/C-Vulcan XC-72R (2021)
General0.35 ± 0.020.32 ± 0.03
Mixed0.32 ± 0.0030.33 ± 0.01
Disclaimer/Publisher’s Note: The statements, opinions and data contained in all publications are solely those of the individual author(s) and contributor(s) and not of MDPI and/or the editor(s). MDPI and/or the editor(s) disclaim responsibility for any injury to people or property resulting from any ideas, methods, instructions or products referred to in the content.

