
Economic Analysis of Large-Scale Renewable Energy (RE) Source Investment Incorporating Power System Transmission Costs
School of Electrical Engineering, Anam Campus, Korea University, 145 Anam-ro, Seongbuk-gu, Seoul 02841, Republic of Korea
*
Author to whom correspondence should be addressed.
Energies 2023, 16(21), 7407; https://doi.org/10.3390/en16217407
Submission received: 10 October 2023
/
Revised: 24 October 2023
/
Accepted: 31 October 2023
/
Published: 2 November 2023
(This article belongs to the Collection Renewable and Sustainable Energy)
Abstract
:Recently, the proportion of renewable energy (RE) sources in a power system has been increasing worldwide to reduce carbon emissions. To effectively accommodate renewable energy, there is a growing need to develop integrated planning strategies for both renewable energy sources and transmission lines in a power system, taking into account the location-specific characteristics of renewable energy. Economically viable and rapid system expansion plans are required to resolve the problem of delayed integration of renewable energy into existing power system, which arises due to inadequate transmission facilities. To address these problems, this paper presents an integrated economic evaluation method that considers the inherently uncertain output characteristics of renewable energy, contingent on location, the costs associated with installing transmission lines, and environmental benefits. The case study is conducted using a modified power system in Korea. In the case study, it is assumed that by integrating solar power generators in a low-demand area and wind power generators in a high-demand area, wind power plants have higher construction costs than solar power generators. However, the transmission costs for wind power plants are lower than those for solar power generators due to the regional characteristics of the power grid in the installation areas because renewable energy in high-demand areas typically requires less additional power infrastructure than in low-demand areas. The results of this study show that the net benefit for the wind power plant is estimated at USD 225.4 M, while the solar power plant yields a net benefit of USD 22.9 M in the example system. These results demonstrate the effectiveness of the proposed method, underscoring its potential to mitigate the challenges faced in the practical implementation of renewable energy projects.
1. Introduction
In recent years, there has been a global trend towards increasing the integration of renewable energy into power systems as a means to mitigate carbon emissions [1,2,3,4]. In line with this trend, numerous efforts are in progress across various countries to promote renewable energy sources [5,6]. This transition to sustainable energy is also a significant development in South Korea [7].
Korea has introduced a set of energy transition policies [8,9], including the “Renewable Energy 3020 Implementation Plan” and “Nationally Determined Contribution”, which reflect the country’s commitment to embracing renewable energy sources. A significant plan in this endeavor is the “10th Basic Plan for Power Supply”, which aims to achieve, by 2036, a total renewable energy capacity of 108.3 GW. This capacity includes 65.7 GW from solar photovoltaic (PV) generators and 34.1 GW from wind power generators [10].
However, the seamless integration of renewable energy into existing power systems depends on the expansion of transmission and substation facilities [11]. However, meeting this requirement faces a unique challenge: the scarcity of suitable locations for renewable energy plants, complicated by the weather-dependent and variable nature of renewable energy generation [2,3,12].
To address this multifaceted challenge, many countries have adopted integrated system planning techniques [13,14]. These techniques consider both renewable energy and the necessary transmission facilities for formulating long-term power supply and demand plans. To effectively integrates renewable energy into Korea’s power system, it is imperative to establish a unified power generation and transmission plan that considers the country’s geographical characteristics.
The current approach adopted in Korea is to follow a sequential method in which long-term transmission and substation expansion plans are developed after developing long-term power-generation expansion plans [15]. This dual-system approach, while efficient in certain aspects, poses challenges in terms of the coordination and consistency between power generation and transmission plans. This lack of alignment hinders the incorporation of the geographical characteristics of renewable energy sources. Additionally, the reliability and cost-effectiveness of power systems are compromised owing to the intermittent and unpredictable nature of renewable energy output. To address these issues, the geographical attributes of renewable energy must be considered along with the requirements for transmission and substation facilities during the power system planning phase.
Furthermore, the construction periods for renewable energy generation facilities typically range from several months to 1–3 years [16]. By contrast, the construction of a power-transmission facility requires approximately 5 to 10 years or more [17]. Therefore, a strategic approach is vital for expediting the economic expansion of power systems. Delaying the integration of renewable energy owing to a lack of power transmission facilities can have far-reaching consequences [18,19,20]. Notably, a delay in the construction of transmission lines can significantly increase the system operation costs and negatively affect the profitability of renewable energy investors. To advance the energy transition paradigm successfully, studies must prioritize developing an economic evaluation methodology that thoroughly considers the geographical attributes of renewable energy.
In previous studies, the economic evaluation of transmission networks has been actively conducted [21,22]. Recently, research on the economic evaluation of renewable energy has become active, but the economics of renewable energy were often evaluated without considering regional characteristics [23,24,25,26]. Even when the regional attributes were considered, transmission expansion plans were frequently omitted from the assessment of the renewable energy economy, owing to a lack of proper attention to the power system [27,28,29,30]. This paper emphasizes that geographical attributes of renewable energy sources, the additional transmission costs of the power system, and environmental benefits need to be simultaneously considered for the economic evaluation of renewable energy sources.
Transmission line overload is a frequently faced issue in large-scale renewable energy projects. This occurs when the capacity of the existing transmission infrastructure is insufficient to handle the increased power flow generated by renewable energy sources. Transmission line overload not only jeopardizes the reliability of the power supply but also leads to inefficient energy use and increased costs owing to system congestion.
Therefore, this paper aims to provide a comprehensive economic analysis of large-scale renewable energy investments, considering the need for additional investments in transmission infrastructure to mitigate transmission line overload. This methodology simultaneously considers the geographical attributes of renewable energy sources and transmission cost of the power system. This paper addresses several critical aspects, including the following:
- (1)
- Economic viability: assessing the economic feasibility of renewable energy projects, considering initial investment costs, maintenance expenses, and potential revenue generated from energy sales.
- (2)
- Transmission infrastructure: analyzing the need for upgrading or expanding transmission lines to accommodate increased renewable energy generation and estimating the associated costs.
- (3)
- Environmental benefits: measuring environmental benefits, such as carbon emission reductions, resulting from the use of renewable energy.
Even though the economic evaluation method proposed in this paper is tested with the Korean power system, the proposed method is a generic systematic approach that can be further extended for application in power systems in other countries. Economic evaluations of renewable energy sources often overlook the regional characteristics of renewable energy sources and associated power system transmission costs. This paper emphasizes that geographical attributes of renewable energy sources, the additional transmission costs of the power system, and environmental benefits need to be simultaneously considered for the economic evaluation of renewable energy sources.
This integrated economic analysis offers insights into the overall cost-effectiveness and sustainability of large-scale renewable energy projects. It also provides recommendations for policymakers and investors to form informed decisions regarding the allocation of resources for renewable energy projects and transmission infrastructure development. The analysis results can contribute to a more comprehensive understanding of the challenges and opportunities associated with the global transition to renewable energy resources.
While this study is designed to use DC-based power flow analysis to evaluate the integration of renewable energy into power systems, future studies need to be directed toward incorporating environmental and economic dispatch in AC/DC networks [31]. Such an approach is vital for achieving a more comprehensive and holistic understanding of the system dynamics, especially when optimizing both cost and environmental considerations [32,33]. Furthermore, as power systems become more complex with increasing interconnections and meshed configurations, the role of voltage source converter stations becomes increasingly important [34]. Future research developments are required to focus on the implementation and impact of voltage source converter stations in meshed power systems to facilitate the integration of various renewable energy sources.
The remainder of this paper provides a detailed explanation of the study’s structure. Section 2 focuses on the regional characteristics of renewable energy outputs across different regions in Korea. It provides analysis results of Korea’s load proportion and the regional output features of renewable energy. This section introduces a systematic economic evaluation method for assessing the benefits and costs of large-scale renewable energy projects. It subsequently provides an overview of the proposed method for evaluating the integrated planning for renewable energy and transmission. In Section 3, the proposed economic evaluation method is tested with the Korean power system to demonstrate its effectiveness. Section 4 summarizes the findings, provides the practical and theoretical implications, and proposes future research directions.
2. Problem Description
2.1. Regional Characteristics of Renewable Energy in Korea
Renewable energy resources such as solar and wind power play a crucial role in the Korean power system. However, the output characteristics of these sources can significantly vary depending on the region. This section examines the distinctive regional attributes of solar and wind power generation, elucidating the regional disparities in energy output.
2.1.1. Solar PV Generation
Korea receives varying levels of solar irradiance owing to its geographical diversity. Coastal regions, such as the southern and western regions, experience higher annual solar exposure, rendering them favorable locations for solar power generation. By contrast, the eastern mountainous regions receive comparatively less solar energy throughout the year. Analyzing the regional differences in solar PV output provides valuable insights into the potential of solar PV installations in different parts of the country. Table 1 lists the average load proportion in 2021, and the solar capacity factors of various regions in South Korea by season. Table 1 and Table 2 are reconstructed based on raw data from the Open Government Data Portal of Korea [35].
First of all, approximately 39% of the electricity load is concentrated in the metropolitan area of Seoul, the capital of Korea, followed by the Gyeongnam area, where large cities such as Busan and Ulsan are gathered, at 17.1%. Gangwon, characterized by its mountainous terrain, shows the lowest load at 3.2%.
No noticeable differences in PV capacity factor are observed between regions; however, the southern regions, particularly Jeonbuk and Jeonnam, exhibit a significantly higher capacity factor. However, considerable seasonal variations are observed. Both the maximum and average capacity factors are the highest in spring, and the values noticeably decrease in winter. Jeonnam exhibits both the highest maximum and average capacity factors of 88.83 and 18.74%, respectively, during spring.
2.1.2. Wind Power Generation
Similar to solar PV systems, wind conditions across Korea exhibit considerable regional disparities. Coastal and high-altitude regions tend to have more favorable wind conditions, leading to higher wind energy potential. By contrast, inland areas often experience less consistent wind, which affects the profitability of wind power projects. This paper explored the regional variations in wind power output to better understand the dynamics of wind power generation in different parts of Korea. Table 2 lists the regional and seasonal capacity factors for wind power in Korea [35]. The number of wind power generators in Chungbuk and Chungnam is very small; hence, Chungbuk and Chungnam are excluded from the list.

Table 2.
Regional capacity factor of wind power in Korea (2021).
| Region | Spring | Summer | Autumn | Winter | ||||
|---|---|---|---|---|---|---|---|---|
| Max | Avg. | Max | Avg. | Max | Avg. | Max | Avg. | |
| Metropolitan | 50.66% | 6.87% | 61.43% | 4.12% | 77.70% | 10.95% | 76.45% | 15.82% |
| Gangwon | 72.79% | 24.49% | 73.54% | 11.72% | 71.78% | 22.33% | 74.76% | 35.62% |
| Jeonbuk | 77.49% | 20.34% | 88.43% | 11.88% | 92.30% | 21.52% | 90.45% | 30.28% |
| Jeonnam | 84.83% | 19.32% | 76.87% | 9.23% | 79.98% | 17.05% | 86.62% | 25.73% |
| Gyeongbuk | 81.63% | 24.78% | 64.99% | 10.83% | 86.99% | 23.29% | 83.38% | 40.90% |
| Gyeongnam | 62.62% | 15.31% | 52.88% | 9.09% | 63.88% | 15.62% | 60.43% | 20.53% |
Unlike solar power, wind power shows considerable variations not only by season but also by region. First, the metropolitan area exhibits an extremely small average capacity factor because it has poorer wind conditions than other areas. Conversely, Gangwon, Jeonbuk, and Gyeongbuk exhibit considerably large capacity factors, as they have good wind conditions owing to their relatively extensive mountainous terrain.
Evidently, the coastal or mountainous regions provide a better renewable energy resource environment than the metropolitan areas. However, Korea’s electricity demand is concentrated in the metropolitan areas, and rural regions currently lack the capacity to access renewable energy. Therefore, if additional renewable energy plants are constructed in a region with a better renewable-resource environment, additional costs such as transmission-line reinforcement costs will be incurred. Additionally, the cost of line loss will also increase because electricity must be transmitted from a relatively distant area to a demand-intensive area. The business feasibility and economic viability of renewable energy projects should be evaluated considering these costs.
2.2. Economic Evaluation Method for Large-Scale Renewable Resources Considering Power System Constraints
When assessing the economic feasibility of renewable energy projects, it is vital to strike a balance between the benefits and costs involved. On the benefits side, renewable energy offers two significant advantages: energy savings through the substitution of traditional fossil fuel-based generators and substantial reductions in greenhouse gas emissions. However, on the other side of the equation, there are inherent costs, typically encompassing both the construction and maintenance of renewable energy projects. One of the challenges in the transition to renewable energy is the potential for significant costs associated with integrating such energy into power systems, particularly those linked to expanding or upgrading transmission lines. Considering these complexities, this paper presents an integrated economic evaluation method designed to simultaneously consider both the generation investment costs and the additional costs associated with new transmission infrastructure due to the integration of renewable energy into power systems, as expressed by Equation (1):
where NB, TBG, TBE, TCC, TCM, and TCT denote the net benefit, total benefit from power generation cost reduction, total environmental benefit, total construction cost of renewable energy plants, total maintenance cost, and total transmission cost, respectively. renew and rg represent the renewable energy candidate and region of renewable resources, respectively.
Both the construction cost of renewable energy plants and the cost of expanding the transmission grid should be considered while calculating the total cost. Through this integrated approach, this paper provides a comprehensive perspective on the economic evaluation of renewable energy integration into power systems.
The annual energy generation cost benefits from renewable energy generators can be calculated from the reduction in the cost of power generation owing to the integration of renewable energy. This is expressed by Equation (2):
where and are the annual generation cost benefits arising from the integration of renewable resources and the total generation cost of the power system, respectively. t represents the year of analysis.
The total benefit of renewable energy generation is calculated as follows:
where n and r denote the lifetime of renewable resource and the discount rate, respectively.
The environmental benefits can be calculated in the same manner as the power generation cost benefits, using Equations (4) and (5):
where and denote the annual environmental benefits arising from the integration of renewable resources and the total environmental cost of power generation, respectively. With the integration of renewable energy into the system, it displaces power generation from thermal sources, thus reducing greenhouse gas emissions. The total environmental cost is calculated by multiplying the environmental cost unit price of the greenhouse gas by the emission coefficient of the thermal generator.
And, for an integrated economic evaluation of a renewable energy project, the capacity credit level of the renewable energy source must be set to consider the system constraints. The reflection of the total installation capacity of renewable energy facilities in power generation constraints can cause excessive reliance on the facilities and lead to inefficiencies. Therefore, appropriate capacity credit levels must be established for renewable energy sources. The average annual capacity factor can be used as the capacity credit, or the maximum capacity factor can be used throughout the year. An effective load-carrying capability methodology can also be used [36]. The system operator or planner can use their discretion to determine a suitable capacity credit. Based on the capacity credit, the constraints incurred by the integration of renewable energy into the power system (i.e., the cost of building additional transmission lines) should be evaluated. To calculate the cost of expanding the transmission grid owing to the integration of renewable energy, a power flow analysis should be performed to calculate the required capacity of the additional transmission lines using transmission constraints. The real power flow equation is given by Equation (6).
where denotes the power injected at bus k. N is the total number of buses. and denote the magnitudes of the voltages at buses k and j, respectively. and are the conductance and susceptance between the buses, respectively, and denote the phase angle difference between the buses. Assuming to be negligible, Equation (6) can be modified as follows.
As the resistance component is assumed to be zero, has a reciprocal negative reactance value. Assuming that the difference between and is insignificant, sin() converges to ; hence, the above equation can be written as
and typically have values between 0.95 and 1.05 per unit. Hence, their values can be approximated to 1 per unit. Based on this assumption, Equation (8) can be modified as shown below.
The DC-based power flow between buses k and j can be obtained using the following equation.
The following equation can be used to determine whether the power flow exceeds the transmission limits.
where and represent the required capacity of the additional transmission lines and power flow in the transmission line under contingency N, respectively; represents the transmission capacity limit, and is a parameter that allows for overload in the event of a contingency.
The total transmission cost (TCT) can be obtained by multiplying the required capacity of the additional transmission lines by the construction cost per transmission line as follows:
where represents the construction cost per unit of transmission line capacity.
The total construction cost of renewable energy (TCC) and the total maintenance cost (TCM) are obtained from external sources for each renewable energy project. It can be expressed as follows:
where represents the installed capacity of renewable energy in the region; refers to the construction cost per unit of transmission line capacity; and refers to the coefficient of TCM for TCC.
In general, in evaluating the economic feasibility of renewable energy projects, TCM is assumed to be about 1 to 2% of TCC.
2.3. Overview of the Proposed Method
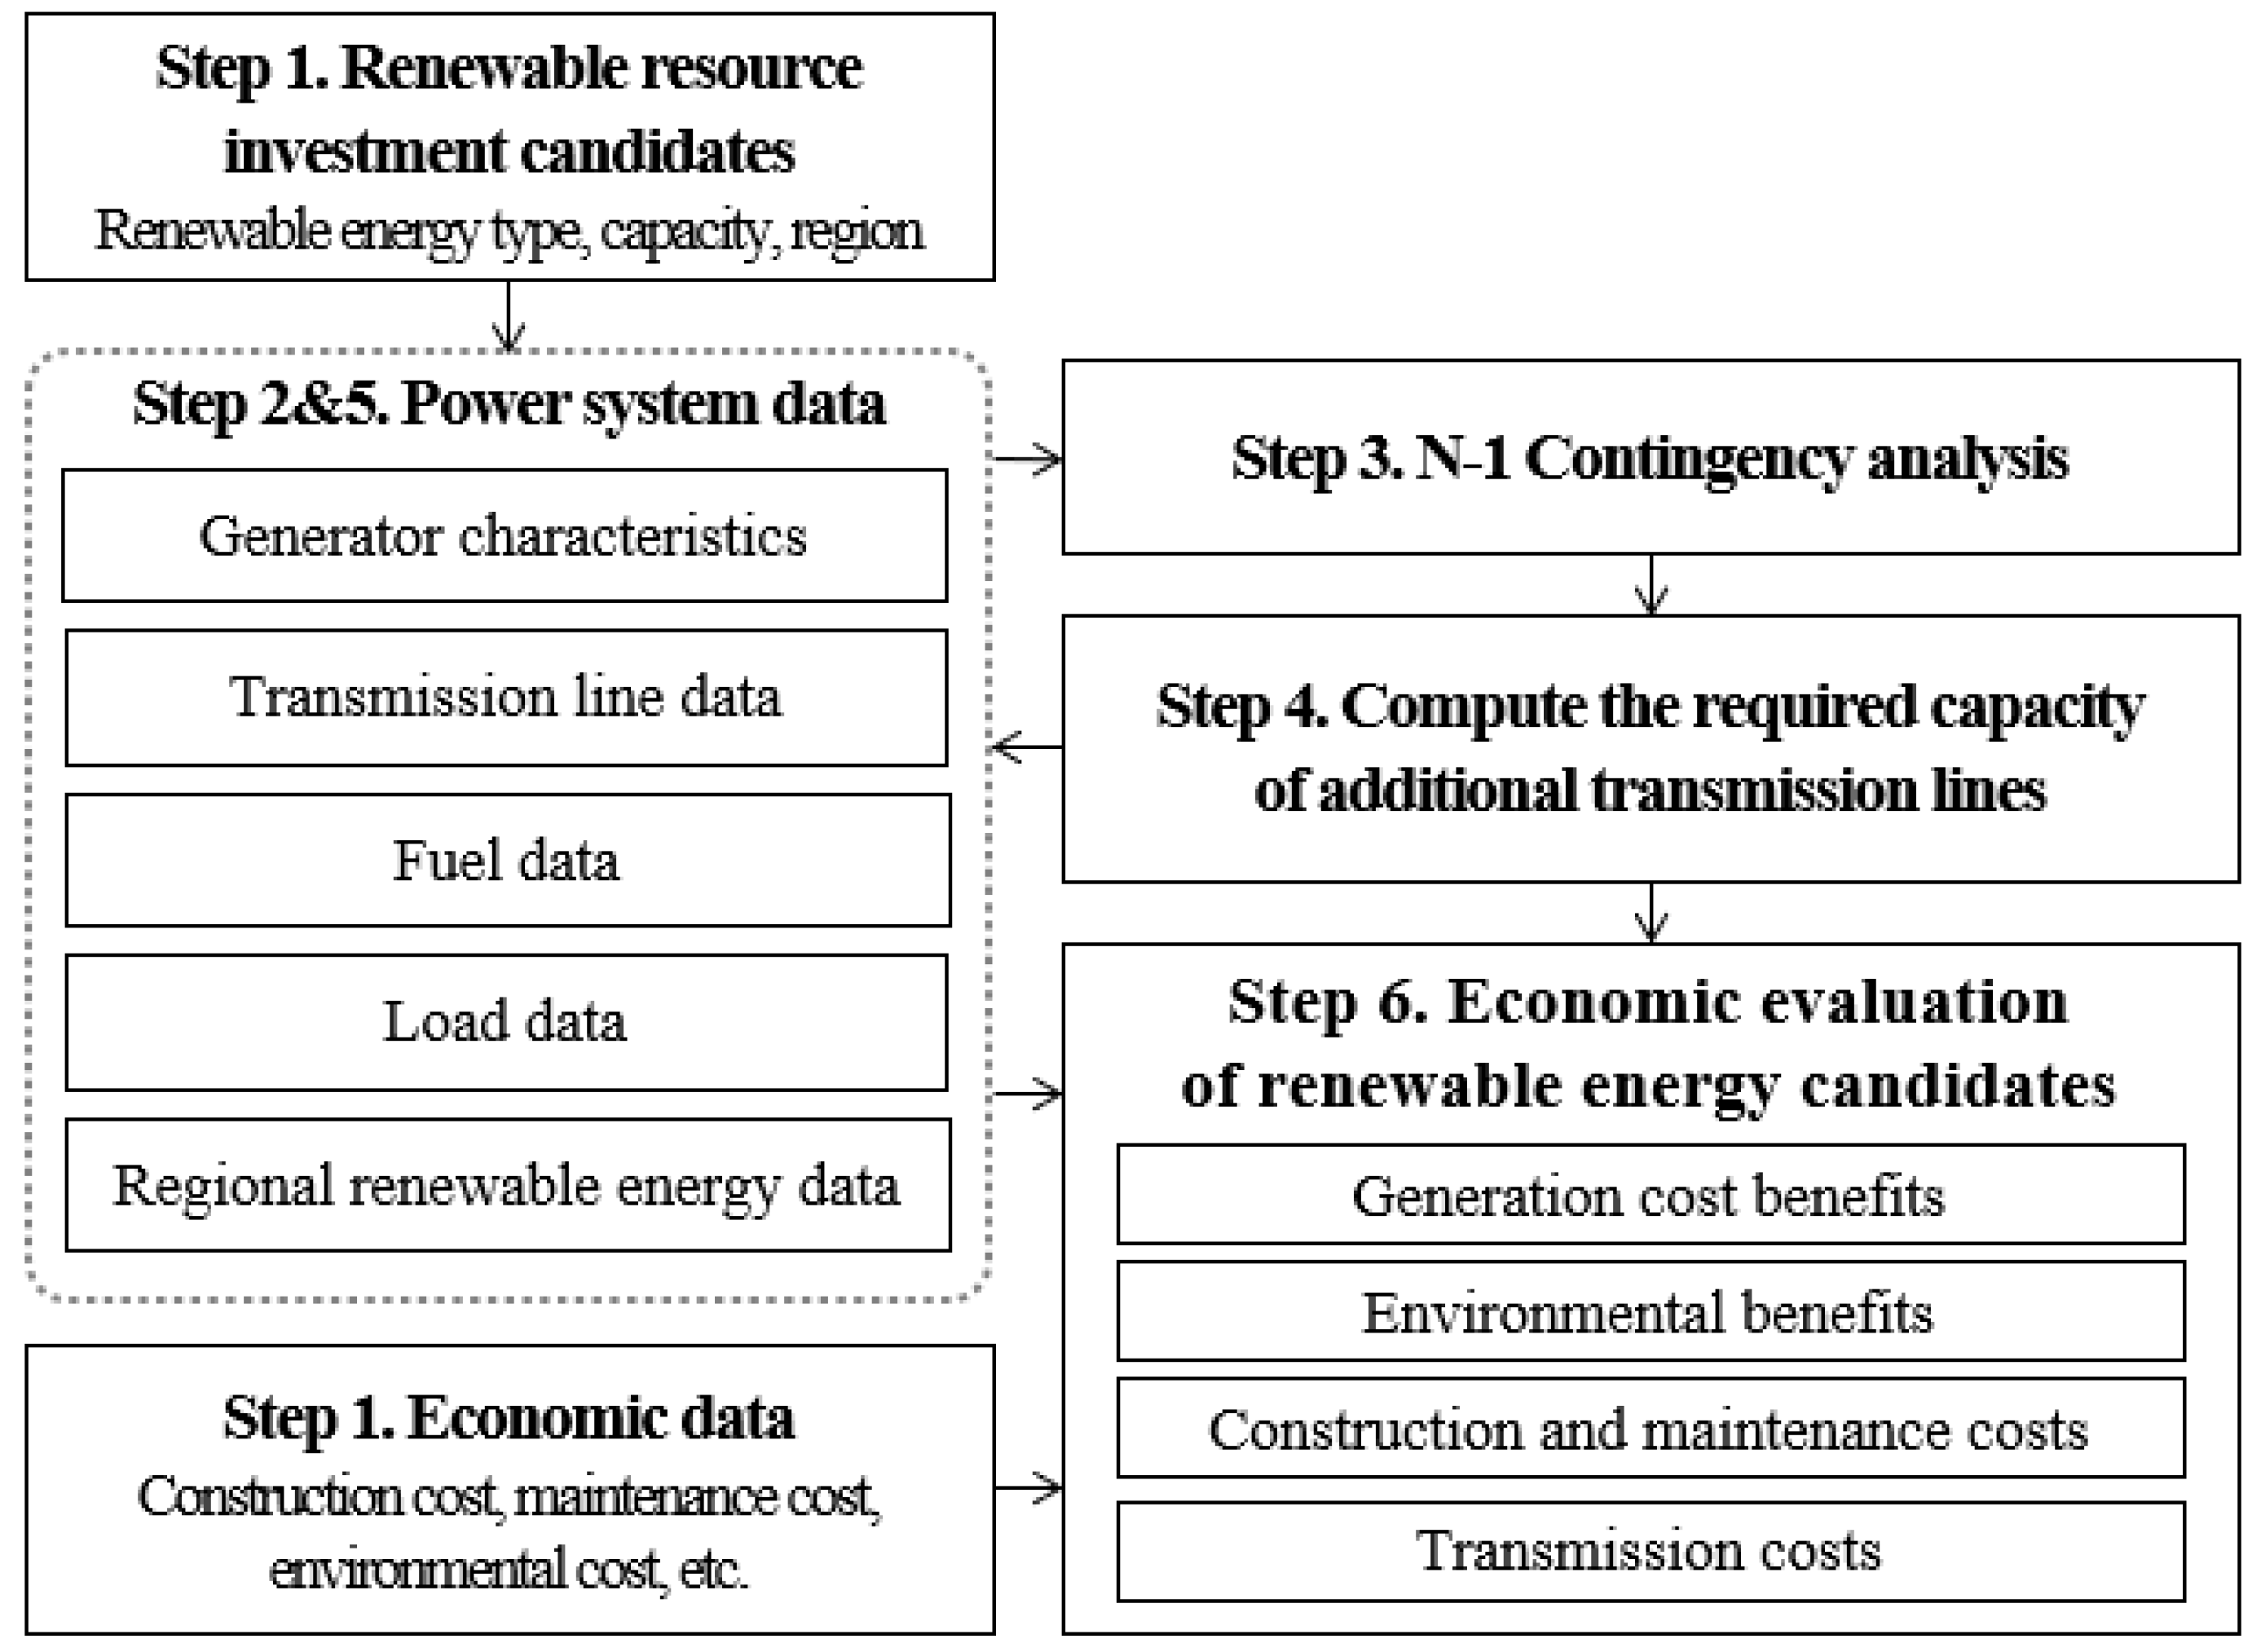
Figure 1 provides an overview of the proposed method in this study.
Step 1: The process starts with identifying potential renewable energy investment candidates. For each of these candidates, technical and economic information, including the specific type of renewable energy source (solar PV or wind power), installed capacity, installation area, and economic data such as construction and maintenance costs are collected. The collected data then undergo a preprocessing stage to ensure accuracy, completeness, and data relevance. Any inconsistencies or missing data points are handled during this phase.
Step 2: After obtaining the technical and economic information for each candidate, a detailed power system model is prepared. This model serves as the basis for conducting a power flow analysis, taking into account the data from the identified candidate groups.
Step 3: Using the constructed power system model, a steady-state power flow analysis is conducted under N-1 contingency scenarios and the base case scenario without any failures.
Step 4: In this step, the necessary capacity for additional transmission lines is determined. This capacity is determined by analyzing line overloads using power flow with contingencies. When potential transmission line overloads are identified, the need for transmission upgrades or expansions is assessed.
Step 5: The total benefits of integrating the renewable energy options are assessed. This is achieved by calculating the difference between power generation costs and environmental costs both before and after the integration of renewable energy sources. This step includes electricity market simulation.
Step 6: This step involves a comprehensive economic assessment that takes into account initial investment costs, maintenance expenses, potential revenue from energy sales, and the expenses related to the addition of transmission infrastructure. The economic assessment covers various factors, including construction costs, economic advantages associated with power generation, environmental benefits, and any costs or requirements associated with the addition of transmission lines. The economic feasibility of each renewable energy option is determined based on the computed net benefit.
The significance of this methodology extends beyond its immediate scope and transcends national boundaries. By adopting this integrative approach, there is potential to refine prevailing planning systems not just in Korea, but across various global power networks. This methodology proactively addresses challenges tied to transmission-line construction delays, thereby minimizing resource wastage. Notably, it can act as a catalyst for renewable energy power generation entities to channel their investments into regions with pronounced potential for renewable energy expansion. Furthermore, the proposed method stands to contribute immensely to the formulation of a balanced, long-term plan for generation and transmission integration across diverse power grids. Given the increasing imperative to seamlessly integrate renewable energy into power systems, coupled with the challenges of ensuring efficient transmission lines, the evolution of a cogent power generation and transmission integration strategy tailored for renewable energy becomes paramount on a global scale.
3. Numerical Results
This section presents the test results of the proposed method using a modified eight-bus system representing the Korean power system. The structure and components of the test system are described. A DC power flow analysis is initially conducted using PSSE under normal conditions. Following that, a DC power flow analysis is performed with N-1 contingency scenarios involving both generators and lines. Then, the economic feasibility of integrating renewable energy sources into the system, specifically large-scale solar and wind power, is evaluated, and the required transmission addition is determined. Finally, an electricity market simulation is conducted to assess the total generation cost for the renewable energy candidates.
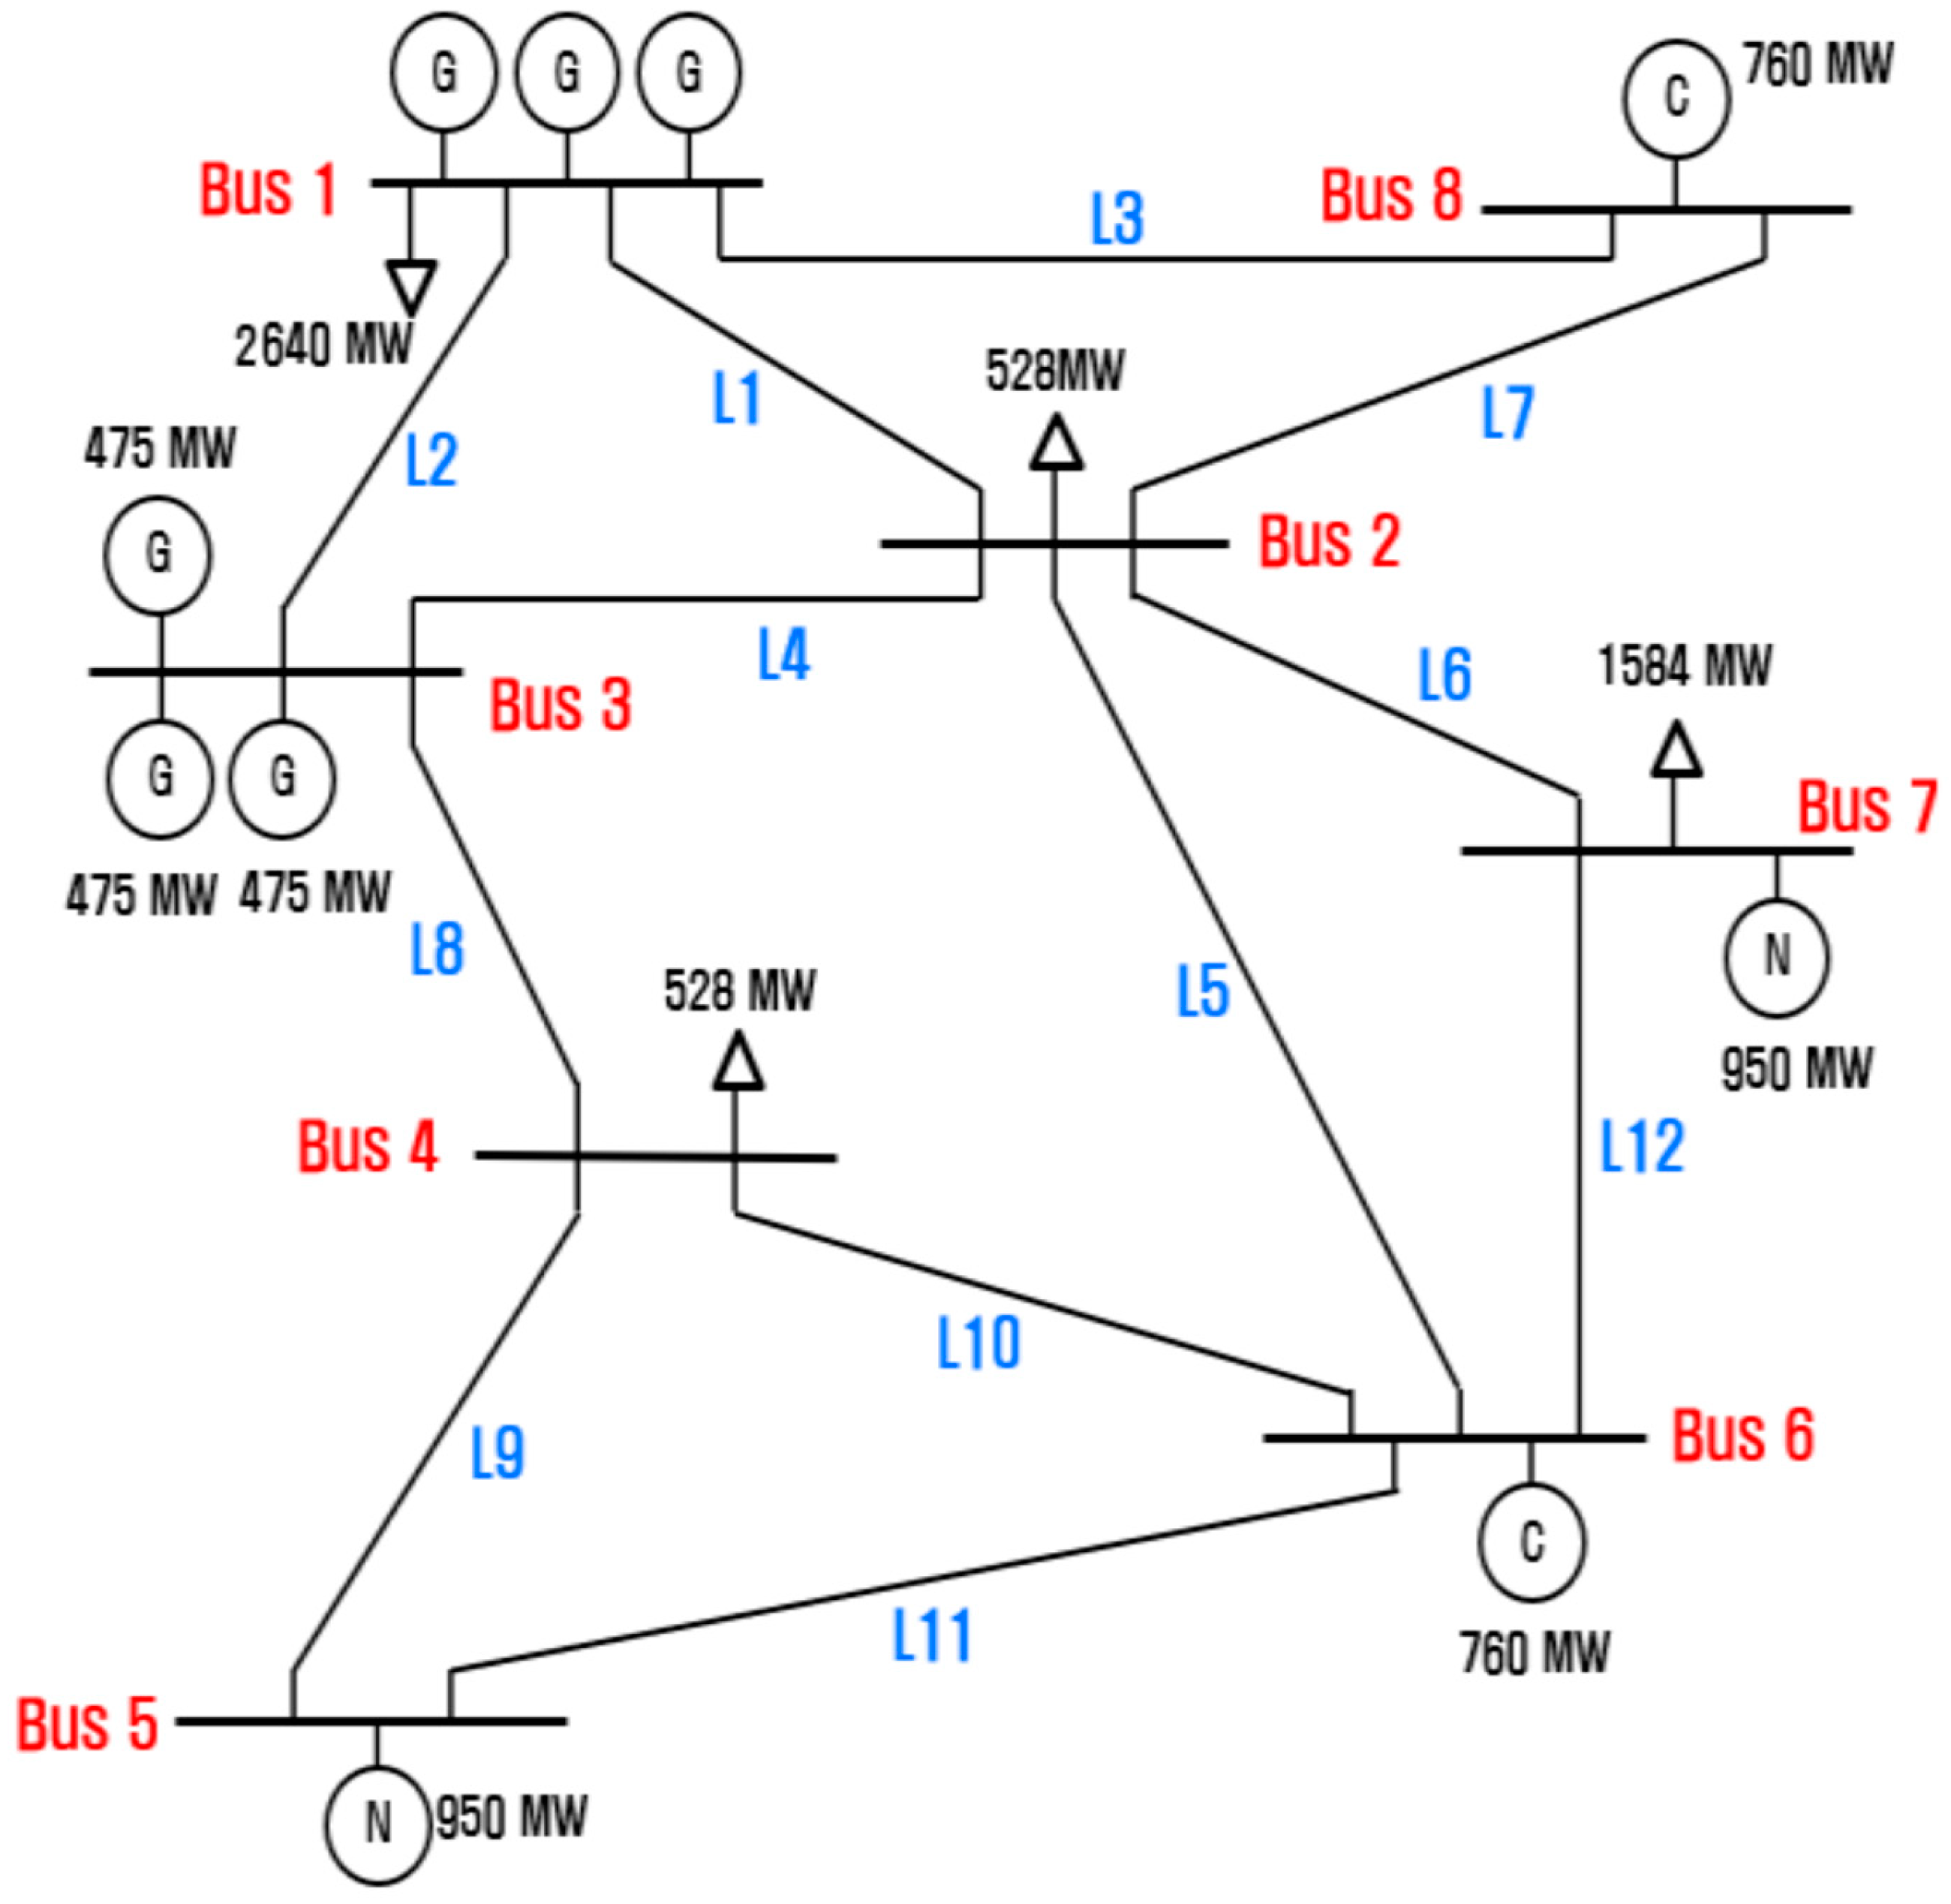
The system map is shown in Figure 2. G, C, and N denote gas, coal, and nuclear power generators, respectively.
Table 3 provides information about the buses in the test system. Buses 1 to 8 represent each region, and the load proportion for each region is shown in the table. The peak load is assumed to be 5280 MW and base voltages are assumed to be 345 kV for all buses.
Table 4 shows information about the lines in the test system, including details about connected buses, line reactance, and maximum power flow capacity for Lines 1 to 12.
Table 5 provides the information for generators in the modified power system, including two nuclear generators, two coal generators, and six gas turbine generators, with the location of each generator indicated in Figure 2.
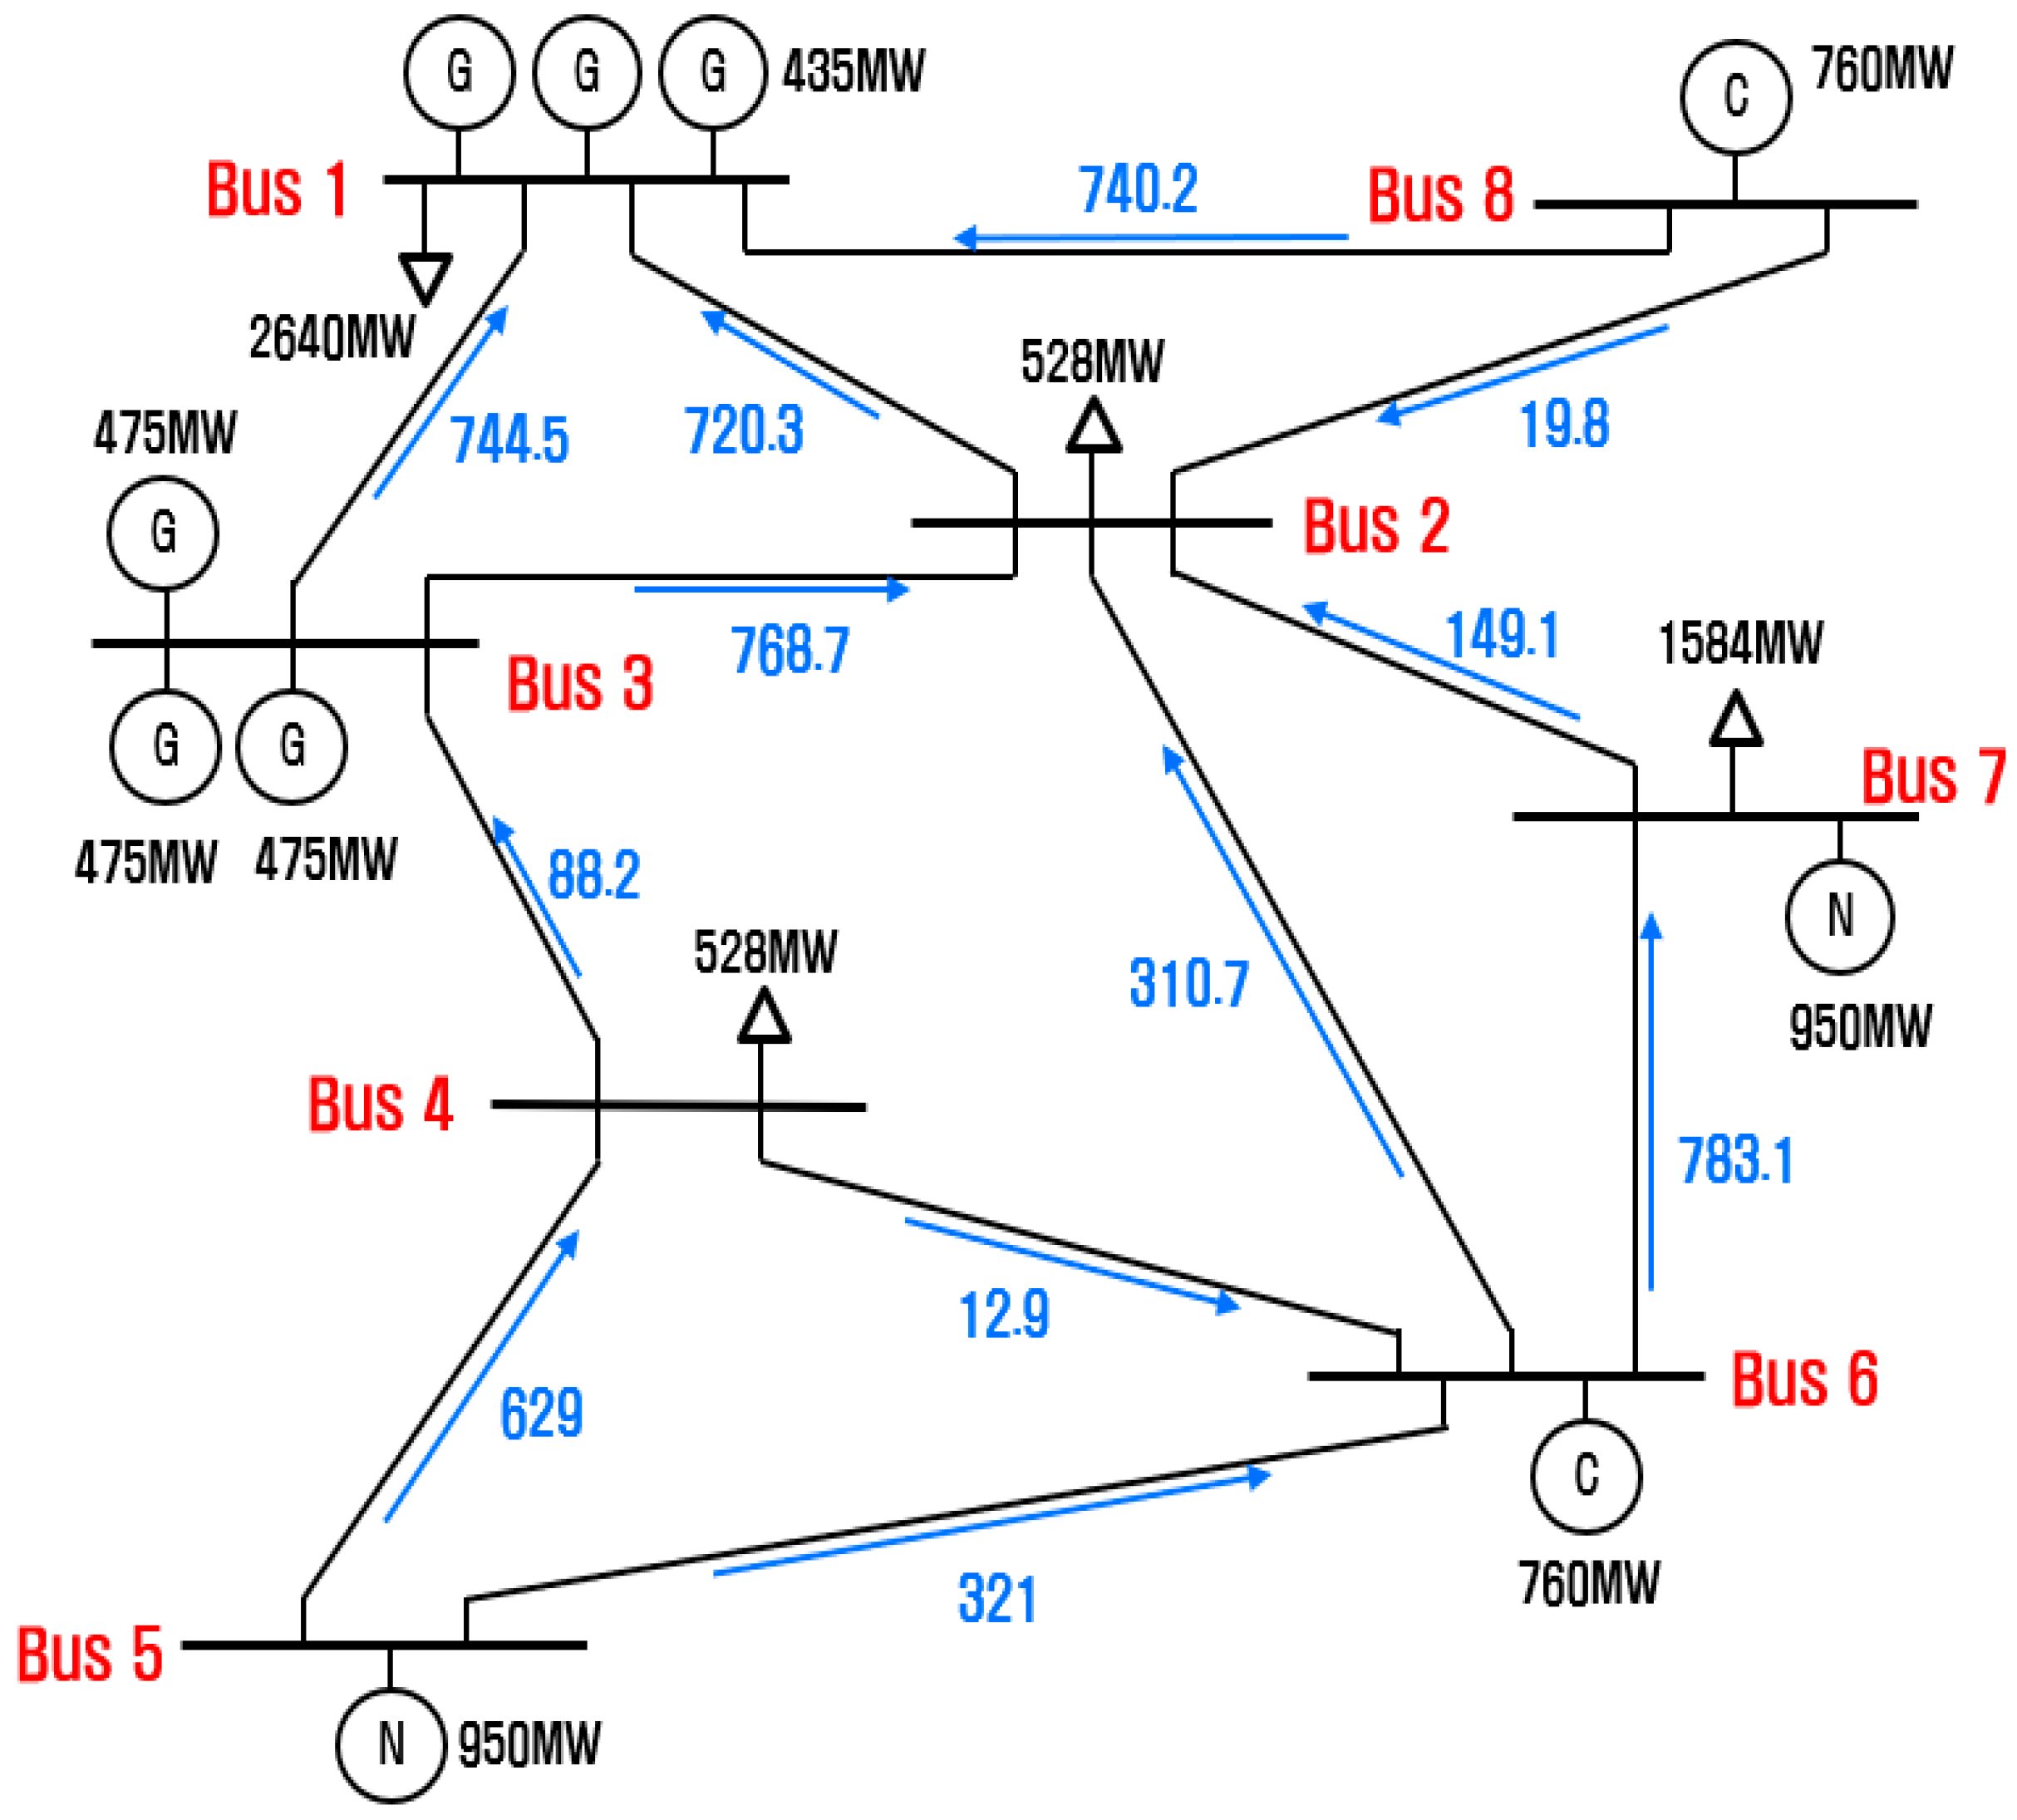
The DC power flow analysis results for the base case (without failures) for the above system are shown in Figure 3 and Table 6.
It can be seen from the analysis results that no overloads occur on any of the lines, with the highest loading rate of 93% observed on Line 3, as shown in Table 6.
Next, a power flow analysis is performed, assuming N−1 contingency for each generator and lines. However, for generator failure, only the nuclear generator with the largest capacity is assumed to fail. Table 7 presents the results of the N−1 contingency analysis.
Based on the results in Table 7, the loading rate for each line is shown in Table 8. It can be observed from the analysis results that line 5 has the highest loading rate, and the loading rate for all lines remained below 150%.
To evaluate the economic feasibility of the renewable energy candidates, an entry scenario for each renewable energy candidate is assumed in the simplified eight-bus system. In this simulation, candidates 1 and 2 are assumed to be the construction of a large-scale solar power generation facility with a rated capacity of 500 MW in Jeonbuk (bus 4) and a large wind power generation facility with a rated capacity of 500 MW in Gyeongbuk (bus 7), respectively. In addition, the average capacity factors corresponding to candidates 1 and 2 are approximately 19.79% and 23.89%, respectively. According to the output characteristics, candidates 1 and 2 are assigned a capacity credit of 98.95 MW and 119.45 MW, respectively.
A power flow analysis is performed after assuming an N-1 contingency for generators and facilities in each case. Generator failures are assumed to be failures of nuclear power generators, as in the base cases. Table 9 presents the largest line flows and line load rates for each candidate.
Based on the results of the power flow analysis for each renewable energy candidate, the line load rate for each candidate and the required capacity for a new transmission line are calculated. For the required capacity, the construction of parallel lines in units of 10 MW is assumed for capacities with a line load rate exceeding 150% in the case of the N-1 contingency. The required capacity of the new transmission lines for each candidate is listed in Table 10.
Next, a benefit analysis is performed for each renewable energy candidate. A power market simulation is performed to calculate the total power generation cost. The lifetimes of PV and wind power are assumed to be 15 years, and the discount rate is 4.5%. The total power generation costs for the base case and each renewable energy candidate entry are listed in Table 11.
In this simulation, the construction costs of solar and wind power are assumed to be 628 USD/kW and 1325 USD/kW, respectively [37], and the annual maintenance cost is assumed to be 1% of the construction cost. The environmental cost per unit price of a traditional thermal generator is assumed to be approximately 38 USD/MWh, and the construction cost of the transmission line is assumed to be approximately 1600 USD/kW [38]. The net benefits of each renewable energy candidate are listed in Table 12.
The power market simulation reveals that the installation of a wind power generator in Gyeongbuk (bus 7) offers net benefit of approximately USD 225.4 M, while the installation of the PV generator in Jeonbuk (bus 4) offer a net benefit of approximately USD 22.9 M.
These results show the economic advantages of installing wind power generators in Gyeongbuk compared to PV generators in Jeonbuk. This study involves a power flow analysis using the N-1 contingency criterion to assess line overloading. However, it is important to note that these findings are obtained under the predefined operating conditions of the test system. It can be observed from the results that installing renewable energy sources in areas with higher demand leads to reduced costs for additional transmission line construction compared to areas with lower demand. Moreover, it can be seen from the results that in certain scenarios, it would be more cost-effective to install new renewable energy sources in regions with higher energy demand. These findings offer policymakers insights and guidelines for potential strategies related to renewable energy sources. For example, it is possible to incentivize renewable energy projects in areas with higher demand, thereby enhancing the cost efficiency of renewable energy integration. Furthermore, there is a growing need to conduct more comprehensive analyses in the fields of energy storage, electric vehicles, and various sustainable energy sources, employing AC-based power flow analysis in the future. Ultimately, these findings show the importance of an integrated economic evaluation approach that simultaneously considers the characteristics of regional renewable energy sources, the transmission costs of the power system, and environmental benefits while achieving the overall objectives of a sustainable energy environment.
4. Conclusions
This paper highlights the urgent need for an integrated approach for evaluating the economic feasibility of renewable energy resources, particularly when considering the transmission costs of the power system. As the global transition accelerates toward increasing dependence on renewable energy in electrical systems, it is increasingly clear that taking full advantage of the potential of renewable energy requires a comprehensive plan tailored to the characteristics of each region.
The efficient and rapid integration of renewable energy sources is crucial. Delays in establishing power system connections for renewable energy, often due to insufficient transmission infrastructure, can act as a barrier to advancements in achieving sustainable energy systems. These delays not only affect the energy transition goals but also place a significant financial burden on investors and stakeholders due to missed opportunities and wasted resources for cleaner energy generation. Therefore, the results of this study show the urgent need for efficient power system expansion planning that can proactively resolve these issues.
The proposed approach is based on a systematic method for assessing the economic feasibility of renewable energy projects from a comprehensive perspective. The proposed economic evaluation method is designed to simultaneously consider the geographical attributes of renewable energy sources, the additional transmission costs of the power system, and environmental benefits. The integrated economic evaluation approach attempts to study the trade-off between the regional attributes of renewable energy and the power system integration costs, such as transmission costs. Through a case study conducted using a Korean test system, the proposed method not only demonstrates the theoretical importance of the integrated economic evaluation method but also provides valuable insights into the implementation of practical renewable energy projects.
In this study, a DC power flow analysis is employed due to its preference in long-term planning for its computational time efficiency. However, this approach inherently does not account for reactive power, potentially impacting accuracy. While DC load flow analysis offers computational advantages, it also has limitations related to reactive power and line losses. In future studies, it would be valuable to extend the proposed methods to incorporate AC power flow analysis and address environmental and economic dispatch in AC/DC networks.
In emphasizing an integrated approach to generation and transmission planning, it is crucial for future studies to consider various elements, including energy storage, electric vehicles, and sustainable energy sources. These comprehensive methods play a vital role in enhancing power system stability and efficiency. The guidelines from this study offer insights for both theoretical and real-world applications. It is hoped that upcoming research will explore the relationship between energy storage and transmission, the broader impacts of electric vehicles, the potential of smart energy systems in today’s evolving energy scene, and the intricacies of policies related to renewable energy integration.
Author Contributions
Conceptualization, D.L. and S.-K.J.; methodology, D.L. and S.-K.J.; formal analysis, D.L.; writing—original draft preparation, D.L.; writing—review and editing, D.L. and S.-K.J.; project administration, S.-K.J. All authors have read and agreed to the published version of the manuscript.
Funding
This research received no external funding.
Data Availability Statement
Not applicable.
Acknowledgments
This work was supported by the Human Resources Program in Energy Technology of the Korea Institute of Energy Technology Evaluation and Planning (KETEP) and the Ministry of Trade, Industry & Energy (MOTIE) of the Republic of Korea (No. 20204010600220). This work supported by Korea Power Exchange (KPX).
Conflicts of Interest
The authors declare no conflict of interest.
References
- IEA. Global Energy Review: CO2 Emissions in 2021; IEA: Paris, France, 2022. [Google Scholar]
- Md, S.; Shakir, D.A.; Fahad, A.A.-S. Grid Integration Challenges and Solution Strategies for Solar PV Systems: A Review. IEEE Access 2022, 10, 52233–52257. [Google Scholar] [CrossRef]
- Shakir, D.A.; Fahad, S.M.A.-I.; Md, S.; Fahad, A.A.-S.; Ibrahim, M.E.-A. Grid Integration Challenges of Wind Energy: A Review. IEEE Access 2020, 8, 10857–10878. [Google Scholar] [CrossRef]
- Zhao, X.; Wang, W.; Wang, J. The policy effects of demand-pull and technology-push on the diffusion of wind power: A scenario analysis based on system dynamics approach. Energy 2022, 261, 125224. [Google Scholar]
- Chomać-Pierzecka, E.; Sobczak, A.; Urbańczyk, E. RES Market Development and Public Awareness of the Economic and Environmental Dimension of the Energy Transformation in Poland and Lithuania. Energies 2022, 15, 5461. [Google Scholar] [CrossRef]
- Woźniak, M.; Badora, A.; Kud, K.; Woźniak, L. Renewable Energy Sources as the Future of the Energy Sector and Climate in Poland—Truth or Myth in the Opinion of the Society. Energies 2022, 15, 45. [Google Scholar] [CrossRef]
- Ministry of Trade, Industry and Energy. Third Energy Master Plan; Ministry of Trade, Industry and Energy: Sejong, Republic of Korea, 2019. [Google Scholar]
- Ministry of Trade, Industry and Energy. Renewable Energy 3020 Implementation Plan; Ministry of Trade, Industry and Energy: Sejong, Republic of Korea, 2017. [Google Scholar]
- Ministry of Environment. Updated Nationally Determined Contribution; Ministry of Environment: Sejong, Republic of Korea, 2021. [Google Scholar]
- Ministry of Trade, Industry and Energy. The 10th Basic Plan of Long-Term Electricity Supply and Demand; Ministry of Trade, Industry and Energy: Sejong, Republic of Korea, 2023. [Google Scholar]
- Hossein, R.; Mostafa, K.; Nima, A.; Hamidreza, Z.; Seyed, H.H. Maximizing the utilization of existing grids for renewable energy integration. Renew. Energy 2022, 189, 618–629. [Google Scholar]
- Kepa, S.; Emilio, C. Climate change impacts on renewable energy generation. A review of quantitative projections. Renew. Sustain. Energy Rev. 2019, 116, 109415. [Google Scholar]
- Australian Energy Market Operator (AEMO). Integrated System Plan(ISP). Available online: https://aemo.com.au/energy-systems/major-publications/integrated-system-plan-isp (accessed on 4 October 2023).
- Independent Electricity System Operator (IESO). Formalizing the Integrated Bulk Power System Planning Process; IESO: Toronto, ON, Canada, 2021. [Google Scholar]
- Korea Electric Power Corporation (KEPCO). The 10th Long-Term Transmission & Substation Plan; KEPCO: Naju, Republic of Korea, 2023. [Google Scholar]
- Moreira, J.M.L.; Bruno, G.; Pedro, C. Construction time of PWRs. Energy Policy 2013, 55, 531–542. [Google Scholar] [CrossRef]
- Medina, C.; Gonzalez, G. Transmission grids to foster high penetration of large-scale variable renewable energy sources—A review of challenges, problems, and solutions. Int. J. Renew. Energy Res. 2022, 12, 146–169. [Google Scholar]
- Semich, I.; Secil, V.N.; Bülent, O. Challenges of renewable energy Penetration on power system flexibility: A survey. Energy Strategy Rev. 2020, 31, 100539. [Google Scholar]
- Carvallo, J.P.; Hidalgo-Gonzalez, P.; Kammen, D.M.; Maxwell, A.; Sims, D.; Finat, C. Envisioning a Sustainable Chile; Renewable and Appropriate Energy Laboratory at the University of California: Berkeley, CA, USA, 2014. [Google Scholar]
- Kishore, T.S.; Singal, S.K. Analysis of Investment Issues and Transmission Schemes for Grid Integration of Remote Renewable Energy Sources. Int. J. Renew. Energy Res. 2015, 5, 483–490. [Google Scholar]
- Robert, F.; Joo, S.-K. Economic Evaluation of Transmission Expansion for Investment Incentives in a Competitive Electricity Market. Int. J. Control. Autom. Syst. 2008, 6, 627–638. [Google Scholar]
- Liu, H.; Shen, Y.; Zabinsky, Z.; Liu, C.-C.; Courts, A.; Joo, S.-K. Social Welfare Maximization in Transmission Enhancement Considering Network Congestion. IEEE Trans. Power Syst. 2008, 23, 1105–1114. [Google Scholar]
- Khatib, H.; Difiglio, C. Economics of nuclear and renewables. Energy Policy 2016, 96, 740–750. [Google Scholar] [CrossRef]
- Jan, A.; Sebastian, R.; Clemens, S. The economics of renewable energy support. J. Public Econ. 2019, 176, 94–117. [Google Scholar]
- Jamin, K.; Kyungtae, P.; Dongil, S.; En, S.Y. Economic evaluation of renewable energy systems under varying scenarios and its implications to Korea’s renewable energy plan. Appl. Energy 2011, 88, 2254–2260. [Google Scholar]
- Imam, A.A.; Al-Turki, Y.A.; R., S.K. Techno-Economic Feasibility Assessment of Grid-Connected PV Systems for Residential Buildings in Saudi Arabia—A Case Study. Sustainability 2020, 12, 262. [Google Scholar] [CrossRef]
- Mariia, K.; Mikael, C. Renewable energy investment attractiveness: Enabling multi-criteria cross-regional analysis from the investors’ perspective. Renew. Energy 2020, 150, 382–400. [Google Scholar]
- Andrew, A.; Christopher, W.Z. An optimization model for regional renewable energy development. Renew. Sustain. Energy Rev. 2012, 16, 4606–4615. [Google Scholar]
- Chung, M.; Shin, K.-Y.; Jeoune, D.-S.; Park, S.-Y.; Lee, W.-J.; Im, Y.-H. Economic Evaluation of Renewable Energy Systems for the Optimal Planning and Design in Korea—A Case Study. J. Sustain. Dev. Energy Water Environ. Syst. 2018, 6, 725–741. [Google Scholar] [CrossRef]
- Gulaliyev, M.G.; Mustafayev, E.R.; Mehdiyeva, G.Y. Assessment of Solar Energy Potential and Its Ecological-Economic Efficiency: Azerbaijan Case. Sustainability 2020, 12, 1116. [Google Scholar] [CrossRef]
- Mosleh, A.; Sherif, G.; Abdallah, E.; Ragab, E.-S.; Abdullah, S.; Ahmed, G. A Multi-Objective Marine Predator Optimizer for Optimal Techno-Economic Operation of AC/DC Grids. Stud. Inform. Control 2021, 30, 89–99. [Google Scholar] [CrossRef]
- Nourianfar, H.; Abdi, H. Environmental/Economic Dispatch Using a New Hybridizing Algorithm Integrated with an Effective Constraint Handling Technique. Sustainability 2022, 14, 3173. [Google Scholar] [CrossRef]
- Abdallah, M.S.; Abdallah, M.E.; Ragab, A.E.-S. Optimal Economic–Environmental Operation for AC-MTDC Grids by Improved Crow Search Algorithm. IEEE Syst. J. 2022, 16, 1270–1277. [Google Scholar]
- Ehab, E.E.; Abdallah, M.S.; Abdallah, M.E.; Ragab, A.E.-S. Optimal Power Flow with Emerged Technologies of Voltage Source Converter Stations in Meshed Power Systems. IEEE Access 2020, 8, 166963–166979. [Google Scholar] [CrossRef]
- Open Government Data Portal of Korea. Available online: https://www.data.go.kr/en/data/15065269/fileData.do (accessed on 5 October 2023).
- Paik, C. Analysis of Capacity Factors and Capacity Credits for Wind Turbines Installed in Korea. J. Korean Sol. Energy Soc. 2019, 39, 79–91. [Google Scholar]
- Lucas, S.; Ulf, N.; Martin, K. Capital expenditure and levelized cost of electricity of photovoltaic plants and wind turbines—Development by 2050. Renew. Energy 2022, 185, 525–537. [Google Scholar]
- Juan, A.; Ross, B. Estimation of Transmission Costs for New Generation; The University of Texas at Austin: Austin, TX, USA, 2017. [Google Scholar]
Figure 1.
Overview of the proposed economic evaluation method for large-scale renewable energy projects.
Figure 1.
Overview of the proposed economic evaluation method for large-scale renewable energy projects.

Figure 2.
A simply modified 8-bus system representing the Korean power system.

Figure 3.
DC power flow analysis results under no failures (base case).

Table 1.
Load proportion and regional capacity factor of solar PV plants in Korea (2021).
| Region | Load Proportion | Spring | Summer | Autumn | Winter | ||||
|---|---|---|---|---|---|---|---|---|---|
| Max | Avg. | Max | Avg. | Max | Avg. | Max | Avg. | ||
| Metropolitan | 39.0% | 83.89% | 16.97% | 76.11% | 16.07% | 74.46% | 12.63% | 76.02% | 11.06% |
| Gangwon | 3.2% | 86.58% | 17.39% | 80.01% | 16.29% | 74.71% | 12.33% | 76.45% | 11.43% |
| Chungbuk | 5.4% | 83.26% | 16.75% | 75.46% | 16.04% | 74.03% | 12.30% | 74.67% | 11.11% |
| Chungnam | 11.9% | 85.19% | 17.60% | 79.34% | 16.70% | 78.98% | 13.61% | 78.47% | 10.87% |
| Jeonbuk | 4.1% | 85.64% | 17.71% | 79.29% | 16.76% | 72.99% | 12.50% | 76.94% | 10.46% |
| Jeonnam | 8.0% | 88.83% | 18.74% | 80.43% | 17.00% | 82.36% | 13.84% | 82.04% | 11.40% |
| Gyeongbuk | 11.3% | 85.05% | 17.23% | 76.01% | 15.82% | 74.44% | 12.77% | 78.18% | 13.20% |
| Gyeongnam | 17.1% | 84.57% | 17.72% | 72.58% | 15.63% | 75.53% | 13.06% | 79.29% | 13.47% |
Table 3.
Regional classification and load of the test system in Korea.
| Bus | Area | Load Proportion | Active Load [MW] |
|---|---|---|---|
| Bus 1 | Metropolitan | 0.5 | 2640 |
| Bus 2 | Chungbuk | 0.1 | 528 |
| Bus 3 | Chungnam | - | - |
| Bus 4 | Jeonbuk | 0.1 | 528 |
| Bus 5 | Jeonnam | - | - |
| Bus 6 | Gyeongnam | - | - |
| Bus 7 | Gyeongbuk | 0.3 | 1584 |
| Bus 8 | Gangwon | - | - |
Table 4.
Transmission line data and line flow limits.
| Line | From–To | Reactance (p.u) | Capacity [MW] |
|---|---|---|---|
| Line 1 | 1–2 | 0.011 | 1000 |
| Line 2 | 1–3 | 0.023 | 1000 |
| Line 3 | 1–8 | 0.011 | 800 |
| Line 4 | 2–3 | 0.011 | 1000 |
| Line 5 | 2–6 | 0.034 | 500 |
| Line 6 | 2–7 | 0.011 | 500 |
| Line 7 | 2–8 | 0.011 | 800 |
| Line 8 | 3–4 | 0.023 | 330 |
| Line 9 | 4–5 | 0.011 | 800 |
| Line 10 | 4–6 | 0.011 | 500 |
| Line 11 | 5–6 | 0.023 | 800 |
| Line 12 | 6–7 | 0.011 | 1000 |
Table 5.
Generator details in the modified power system.
| Generator | Pmax | Pmin | Numbers |
|---|---|---|---|
| Nuclear | 1000 MW | 800 MW | 2 |
| Coal-fired | 800 MW | 400 MW | 2 |
| Gas turbine | 500 MW | 200 MW | 6 |
Table 6.
Line load under no failures (base case).
| Line | From–To | Line Load |
|---|---|---|
| Line 1 | 1–2 | 72% |
| Line 2 | 1–3 | 74% |
| Line 3 | 1–8 | 93% |
| Line 4 | 2–3 | 77% |
| Line 5 | 2–6 | 62% |
| Line 6 | 2–7 | 30% |
| Line 7 | 2–8 | 2% |
| Line 8 | 3–4 | 27% |
| Line 9 | 4–5 | 79% |
| Line 10 | 4–6 | 3% |
| Line 11 | 5–6 | 40% |
| Line 12 | 6–7 | 78% |
Table 7.
Results of power flow analysis under N−1 contingency (base case).
| Failure | Power Flow [MW] | |||||||||||
|---|---|---|---|---|---|---|---|---|---|---|---|---|
| Line1 | Line2 | Line3 | Line4 | Line5 | Line6 | Line7 | Line8 | Line9 | Line10 | Line11 | Line12 | |
| No failure | −720.3 | −744.5 | −740.2 | −768.7 | −310.7 | −149.1 | −19.8 | −88.2 | −629 | 12.9 | 321 | 783.1 |
| nuclear1 | −231 | −528.5 | −495.5 | −825.9 | −184.2 | 515.6 | −264.5 | 70.6 | −589.3 | 132 | 360.7 | 1068.4 |
| nuclear2 | −271.6 | −467.5 | −515.8 | −663.4 | −83.6 | 191.6 | −244.2 | 294 | −58.5 | −175.5 | −58.5 | 442.4 |
| Line 1 | 0 | −1044.8 | −1160.2 | −529.1 | −286.5 | −112.7 | 400.2 | −148.8 | −644.2 | −32.6 | 305.8 | 746.7 |
| Line 2 | −1216.7 | 0 | −988.3 | −1362.8 | −370.9 | −239.3 | 228.3 | 62.2 | −591.4 | 125.7 | 358.6 | 873.3 |
| Line 3 | −1265.6 | −939.4 | 0 | −613.2 | −295 | −125.5 | −760 | −127.6 | −638.9 | −16.7 | 311.1 | 759.5 |
| Line 4 | −414.4 | −1203.4 | −587.2 | 0 | −434.6 | −335 | −172.8 | 221.6 | −551.6 | 245.2 | 398.4 | 969 |
| Line 5 | −699.7 | −775.4 | −729.9 | −851.2 | 0 | −346.4 | −30.1 | −201.6 | −657.4 | −72.2 | 292.6 | 980.4 |
| Line 6 | −707.8 | −763.3 | −733.9 | −818.9 | −390.8 | 0 | −26.1 | −157.2 | −646.3 | −38.9 | 303.7 | 634 |
| Line 7 | −705.7 | −739.3 | −760 | −772.8 | −311.1 | −149.7 | 0 | −87.1 | −628.8 | 13.7 | 321.2 | 783.7 |
| Line 8 | −736.4 | −720.5 | −748.2 | −704.5 | −346 | −202 | −11.8 | 0 | −607 | 79 | 343 | 836 |
| Line 9 | −743.5 | −709.7 | −751.8 | −675.8 | −361.8 | −225.7 | −8.2 | 39.5 | 0 | −488.5 | 950 | 859.7 |
| Line 10 | −719.3 | −746 | −739.7 | −772.7 | −308.5 | −145.7 | −20.3 | −93.8 | −621.8 | 0 | 328.2 | 779.7 |
| Line 11 | −708.5 | −762.3 | −734.2 | −816.1 | −284.7 | −110 | −25.8 | −153.3 | −950 | 268.7 | 0 | 744 |
| Line 12 | −654.4 | −843.4 | −707.2 | −1032.5 | −731.1 | 634 | −52.8 | −450.9 | −719.7 | −259.2 | 230.3 | 0 |
Table 8.
Maximum line load under N−1 contingency (base case).
| Line | From–To | Line Load |
|---|---|---|
| Line 1 | 1–2 | 126% |
| Line 2 | 1–3 | 120% |
| Line 3 | 1–8 | 145% |
| Line 4 | 2–3 | 136% |
| Line 5 | 2–6 | 146% |
| Line 6 | 2–7 | 127% |
| Line 7 | 2–8 | 95% |
| Line 8 | 3–4 | 137% |
| Line 9 | 4–5 | 119% |
| Line 10 | 4–6 | 98% |
| Line 11 | 5–6 | 119% |
| Line 12 | 6–7 | 107% |
Table 9.
Results of the line overload considering a contingency with renewable energy candidate entry.
Table 9.
Results of the line overload considering a contingency with renewable energy candidate entry.
| Line | Flow Limit [MW] | Maximum Line Flow [MW] | Line Load [%] | ||||
|---|---|---|---|---|---|---|---|
| Base Case | PV (Bus 4) | Wind (Bus 7) | Base Case | PV (Bus 4) | Wind (Bus 7) | ||
| Line 1 | 1000 | 1265.6 | 1328.2 | 1349.8 | 126.56% | 132.82% | 134.98% |
| Line 2 | 1000 | 1203.4 | 1242.5 | 1226.3 | 120.34% | 124.25% | 122.63% |
| Line 3 | 800 | 1160.2 | 1209.8 | 1226.9 | 145.03% | 151.23% | 153.36% |
| Line 4 | 1000 | 1362.8 | 1401.8 | 1377.3 | 136.28% | 140.18% | 137.73% |
| Line 5 | 500 | 731.1 | 770 | 727.8 | 146.22% | 154.00% | 145.56% |
| Line 6 | 500 | 634 | 634 | 514.6 | 126.80% | 126.80% | 102.92% |
| Line 7 | 800 | 760 | 760 | 760 | 95.00% | 95.00% | 95.00% |
| Line 8 | 330 | 450.9 | 510.9 | 454.2 | 136.64% | 154.82% | 137.64% |
| Line 9 | 800 | 950 | 950 | 950 | 118.75% | 118.75% | 118.75% |
| Line 10 | 500 | 488.5 | 437.4 | 507.5 | 97.70% | 87.48% | 101.50% |
| Line 11 | 800 | 950 | 950 | 950 | 118.75% | 118.75% | 118.75% |
| Line 12 | 1000 | 1068.4 | 1100.7 | 1032.5 | 106.84% | 110.07% | 103.25% |
Table 10.
The required capacity of additional transmission lines.
| Line | Flow Limit [MW] | Power Flow Exceeding 150% [MW] | The Required Capacity of Transmission Line Addition [MW] | ||
|---|---|---|---|---|---|
| PV (Bus 4) | Wind (Bus 7) | PV (Bus 4) | Wind (Bus 7) | ||
| Line 1 | 1000 | - | - | - | - |
| Line 2 | 1000 | - | - | - | - |
| Line 3 | 800 | 9.8 | 26.9 | 10 | 30 |
| Line 4 | 1000 | - | - | - | - |
| Line 5 | 500 | 20.0 | - | 20 | - |
| Line 6 | 500 | - | - | - | - |
| Line 7 | 800 | - | - | - | - |
| Line 8 | 330 | 15.9 | - | 20 | - |
| Line 9 | 800 | - | - | - | - |
| Line 10 | 500 | - | - | - | - |
| Line 11 | 800 | - | - | - | - |
| Line 12 | 1000 | - | - | - | - |
Table 11.
Generation cost benefits based on the difference in total power generation costs (kUSD).
| Year | Base Case | PV (Bus 4) | Wind (Bus 7) | PV Benefits (kUSD) | Wind Benefits (kUSD) |
|---|---|---|---|---|---|
| 1 | 933,003 | 924,374 | 881,320 | 8629 | 51,684 |
| 2 | 892,826 | 884,569 | 843,368 | 8258 | 49,458 |
| 3 | 854,379 | 846,477 | 807,051 | 7902 | 47,329 |
| 4 | 817,588 | 810,026 | 772,297 | 7562 | 45,290 |
| 5 | 782,381 | 775,144 | 739,040 | 7236 | 43,340 |
| 6 | 748,690 | 741,765 | 707,216 | 6925 | 41,474 |
| 7 | 716,449 | 709,823 | 676,762 | 6626 | 39,688 |
| 8 | 685,598 | 679,256 | 647,619 | 6341 | 37,979 |
| 9 | 656,074 | 650,006 | 619,731 | 6068 | 36,343 |
| 10 | 627,822 | 622,015 | 593,044 | 5807 | 34,778 |
| 11 | 600,787 | 595,230 | 567,506 | 5557 | 33,281 |
| 12 | 574,916 | 569,598 | 543,068 | 5317 | 31,848 |
| 13 | 550,158 | 545,070 | 519,682 | 5088 | 30,476 |
| 14 | 526,467 | 521,598 | 497,304 | 4869 | 29,164 |
| 15 | 503,797 | 499,137 | 475,889 | 4660 | 27,908 |
| The gross | 10,470,935 | 10,374,089 | 9,890,895 | 96,846 | 580,040 |
Table 12.
Net benefits for each renewable-resources candidate (kUSD).
| Benefits and Costs | PV (Bus 4) | Wind (Bus 7) |
|---|---|---|
| Benefits | 450,585 | 1,007,077 |
| Costs | 427,722 | 781,649 |
| Net benefits | 22,863 | 225,427 |
Disclaimer/Publisher’s Note: The statements, opinions and data contained in all publications are solely those of the individual author(s) and contributor(s) and not of MDPI and/or the editor(s). MDPI and/or the editor(s) disclaim responsibility for any injury to people or property resulting from any ideas, methods, instructions or products referred to in the content. |
© 2023 by the authors. Licensee MDPI, Basel, Switzerland. This article is an open access article distributed under the terms and conditions of the Creative Commons Attribution (CC BY) license (https://creativecommons.org/licenses/by/4.0/).
Share and Cite
MDPI and ACS Style
Lee, D.; Joo, S.-K. Economic Analysis of Large-Scale Renewable Energy (RE) Source Investment Incorporating Power System Transmission Costs. Energies 2023, 16, 7407. https://doi.org/10.3390/en16217407
AMA Style
Lee D, Joo S-K. Economic Analysis of Large-Scale Renewable Energy (RE) Source Investment Incorporating Power System Transmission Costs. Energies. 2023; 16(21):7407. https://doi.org/10.3390/en16217407
Chicago/Turabian StyleLee, Deukyoung, and Sung-Kwan Joo. 2023. "Economic Analysis of Large-Scale Renewable Energy (RE) Source Investment Incorporating Power System Transmission Costs" Energies 16, no. 21: 7407. https://doi.org/10.3390/en16217407
Note that from the first issue of 2016, this journal uses article numbers instead of page numbers. See further details here.