Article

Laboratory-Scale Airborne Wind Energy Conversion Emulator Using OPAL-RT Real-Time Simulator

by
Pankaj Kumar
1,
Yashwant Kashyap
1,*,
Roystan Vijay Castelino
1,
Anabalagan Karthikeyan
1,
Manjunatha Sharma K.
1,
Debabrata Karmakar
2 and
Panagiotis Kosmopoulos
3,*
1
Department of Electrical & Electronics Engineering, National Institute of Technology Karnataka, Surathkal, Mangalore 575025, India
2
Department of Water Resources and Ocean Engineering National Institute of Technology Karnataka, Surathkal, Mangalore 575025, India
3
Institute for Environmental Research and Sustainable Development, National Observatory of Athens (IERSD/NOA), 15236 Athens, Greece
*
Authors to whom correspondence should be addressed.
Energies 2023, 16(19), 6804; https://doi.org/10.3390/en16196804
Submission received: 11 July 2023 / Revised: 6 September 2023 / Accepted: 21 September 2023 / Published: 25 September 2023
(This article belongs to the Section A3: Wind, Wave and Tidal Energy)

Abstract

:
Airborne wind energy systems (AWES) are more efficient than traditional wind turbines because they can capture higher wind speeds at higher altitudes using connected kite generators. Securing a real wind turbine or a site with favorable wind conditions is not always an assured opportunity for conducting research. Hence, the Research and Development of the Laboratory Scale Airborne Wind Energy Conversion System (LAWECS) require a better understanding of airborne wind turbine dynamics and emulation. Therefore, an airborne wind turbine emulation system was designed, implemented, simulated, and experimentally tested with ground data for the real time simulation. The speed and torque of a permanent magnet synchronous motor (PMSM) connected to a kite are regulated to maximize wind energy harvesting. A field-oriented control technique is then used to control the PMSM’s torque, while a three-phase power inverter is utilized to drive the PMSM with PI controllers in a closed loop. The proposed framework was tested, and the emulated airborne wind energy conversion system results were proven experimentally for different wind speeds and generator loads. Further, the LAWECS emulator simulated a 2 kW, 20 kW, and 60 kW designed with a projected kite area of 5, 25, and 70 square meters, respectively. This system was simulated using the Matlab/Simulink software and tested with the experimental data. Furthermore, the evaluation of the proposed framework is validated using a real-time hardware-in-the-loop environment, which uses the FPGA-based OPAL-RT Simulator.

1. Introduction

In recent years, renewable energies have captured the attention of a significant portion of the energy business and community. Due to their environmental and economic benefits, renewable energy sources have emerged as viable replacements for fossil fuels [1]. Wind power is one of the most rapidly growing renewable power sectors because of its high efficiency and minimal operating costs, and has almost no greenhouse gas emissions. Wind energy has the potential to supply 20% of the global power supply demands by 2030 [2]. As of December 2021, the worldwide offshore pipeline wind energy expansion ability was determined to be greater than 369 GW [3]. Various wind turbines, each with their fundamental components for transforming wind into power, have been built specifically for this purpose [4,5]. Despite its rapid and astounding expansion, the cost of wind-generated electricity remains expensive [6]. This encouraged investigators to explore ways to reduce the costs of wind power generation systems by enhancing turbine subsystems such as the blades, gearbox, and converter to increase the amount of power generated.
The past few years have observed much interest in AWE technology as a practical approach to increasing the amount of electricity produced by wind. Several businesses and research organisations are now considering AWES. Various aspects of this technology, including mechanical, control and electrical engineering are fascinating. Because powerful and consistent winds may be obtained at higher altitudes, an increase in the traditional wind turbine (TWT) height is advantageous. However, this is more costly and requires more mechanical capabilities. AWE turbines may operate at higher altitudes with fewer technological and economic constraints than TWT. AWES can assess winds between 0.1 and 2 km in altitude [7,8]. Due to the absence of turbines and towers in their design, airborne wind turbines are also portable wind energy systems due to their minimal weight [9]. To harness the power of the wind, its kinetic energy must be transformed into electrical energy, and the AWES attaches a ground station to a tethered glider, kite, or horizontally flying turbine [10]. Loyd’s research demonstrated that a tethered wing with dimensions comparable to those of a C-5A aircraft has the capability to produce 6.7 MW of electrical power when subjected to wind speeds of 10 m/s. The energy produced is three times that of a TWT [11]. The characteristics of existing AWE technological solutions are presented in [12], with an emphasis on the hardware architecture of crosswind systems. The comprehensive assessment of AWE technology to collect wind energy from greater heights may be found in [7]. The aero-structural deformation of a leading-edge inflatable kite for capturing AWE was presented in [13]. A multi-element air foil of a fixed-wing system operated in pumping cycles is proposed in [14] to power a ground-based drum-generator module. In order to allow the theoretical framework, different power theories and models have been proposed and implemented in AWES for analysis, such as wind data, the control system for kites, tether force, torque, and power [15,16,17,18].
The economic viability of AWES technology is made possible by its increased availability, stability, and decreased cost [19]. Take-off and flying a tethered aircraft autonomously validate the feasibility of the proposed take-off method, paving the way for the cheap regional deployment of this AWES technology [20]. A lot of studies are being conducted at the moment to improve kite-direction control by employing different control mechanisms, such as predictive control [21,22,23,24]. Many studies have been conducted on the wind turbine emulator [25,26]. For instance, an investigation of meteorological data from five Irish geographical locations revealed an increase from 30% to 40% in wind velocity between 100 and 750 m in height [27]. Additionally, it was found that the capacity coefficient of high-altitude wind turbines in these areas is around 52%, compared to 29% for conventional turbines in Ireland [28]. Hence, a small increase in the wind power system’s operational height may cause an appreciable increase in generated power.
In the literature, most wind turbine generators today use permanent magnet synchronous machines (PMSM), induction motors, and DC machines. However, PMSMs are a superior choice for direct-drive AWES compared to Doubly Fed and Squirrel Cage Induction machines. This preference stems from the PMSMs’ gear-less operation and their versatile capability to function in dual modes [29]. In addition to these benefits, a PMSM has greater power density and efficiency, and it provides a quicker dynamic performance than an induction motor. Moreover, its velocity and rotor angle may keep track more accurately. Because of these merits, PMSM is an excellent choice for several uses [30,31,32]. Three-phase IGBT inverters are commonly used to drive PMSM because they are more efficient than two-level converters in reducing the total harmonic distortion. This converter can also balance the voltage of capacitors and lower switching losses [33,34]. The PMSM uses the field-oriented control technique in the wind turbine simulation to more accurately follow the performance curve of the wind turbine [33,35].
Researchers recently focused on developing real-time (RT) simulation models, which offer advantages over offline simulations. A key feature of RT simulations is including hardware systems in the simulation loop. This integration enhances simulation fidelity by enabling real-time interactions between the simulated model and physical devices, leading to more accurate and realistic results. An illustrative example of a real-time Opal-RT simulation for parameter estimation and precise current control for a six-phase induction machine is studied in the literature [36]. The real-time HIL modelling of rotor-side converter control for Induction machines using OPAL-RT is studied in [37]. The wind turbine system uses doubly-fed induction machines to produce electricity. The OPAL-RT simulator results demonstrated that the system’s performance improved [38]. New utility equipment and power system control must be tested before deployment to the power grid. Real-time digital emulators such as the real-time digital system and OPAL-RT may link to the actual environment and establish an HIL emulation to help with testing [39]. A wind turbine power generator device is used as a model for an experiment with the help of the OPAL-RT real-time model, and the design of the wind energy conversion system was carried out [40]. The innovative optimal recommended technique is tested and deployed on OPAL-RT in the HIL to merge physical simulation fidelity with numerical adaptability to simulations [41]. An experimental setup was developed to replicate a wind turbine-generator system, aiming to emulate its behavior and characteristics. The configuration of the wind energy conversion system is extensively explained utilizing the OPAL-RT real-time simulator [42].
The literature by [43] investigated the simulation aspects, which include no-load and on-load test simulation at the generator terminal. This literature has yet to demonstrate real-time validation using OPAL-RT. Moreover, the simulation results in the above literature do not present the kite dynamics parameters such as tether force, drum speed, drum torque, and drum power. Motivated by the above gaps, we presented the complete analysis of kite dynamics, no-load and on-load test at the generator terminal. We validated with satellite wind data, experimental ground test wind data, and validation with a real-time simulator using FPGA processor-based OPAL-RT. Moreover, this includes the analytical comparison for different evolution phases, parametrization, and the different power capacity of kite emulator, which is indicated in Table 1.
This paper is organized as follows: The introduction is provided in Section 1. The AWE system is explained in Section 2. Section 3 describes the mathematical modelling of the kite system, PMSM, Simulation, Emulator, and real-time model. The simulation results, real-time experimental results, and the discussions are presented in Section 4, which includes the analysis of kite dynamics; further, we have presented the no-load and on-load tests, as well as the field data test analysis, using experimental simulations of ground-level data and real-time results. Finally, this paper concludes with a summary of the research findings and future scope in Section 5.

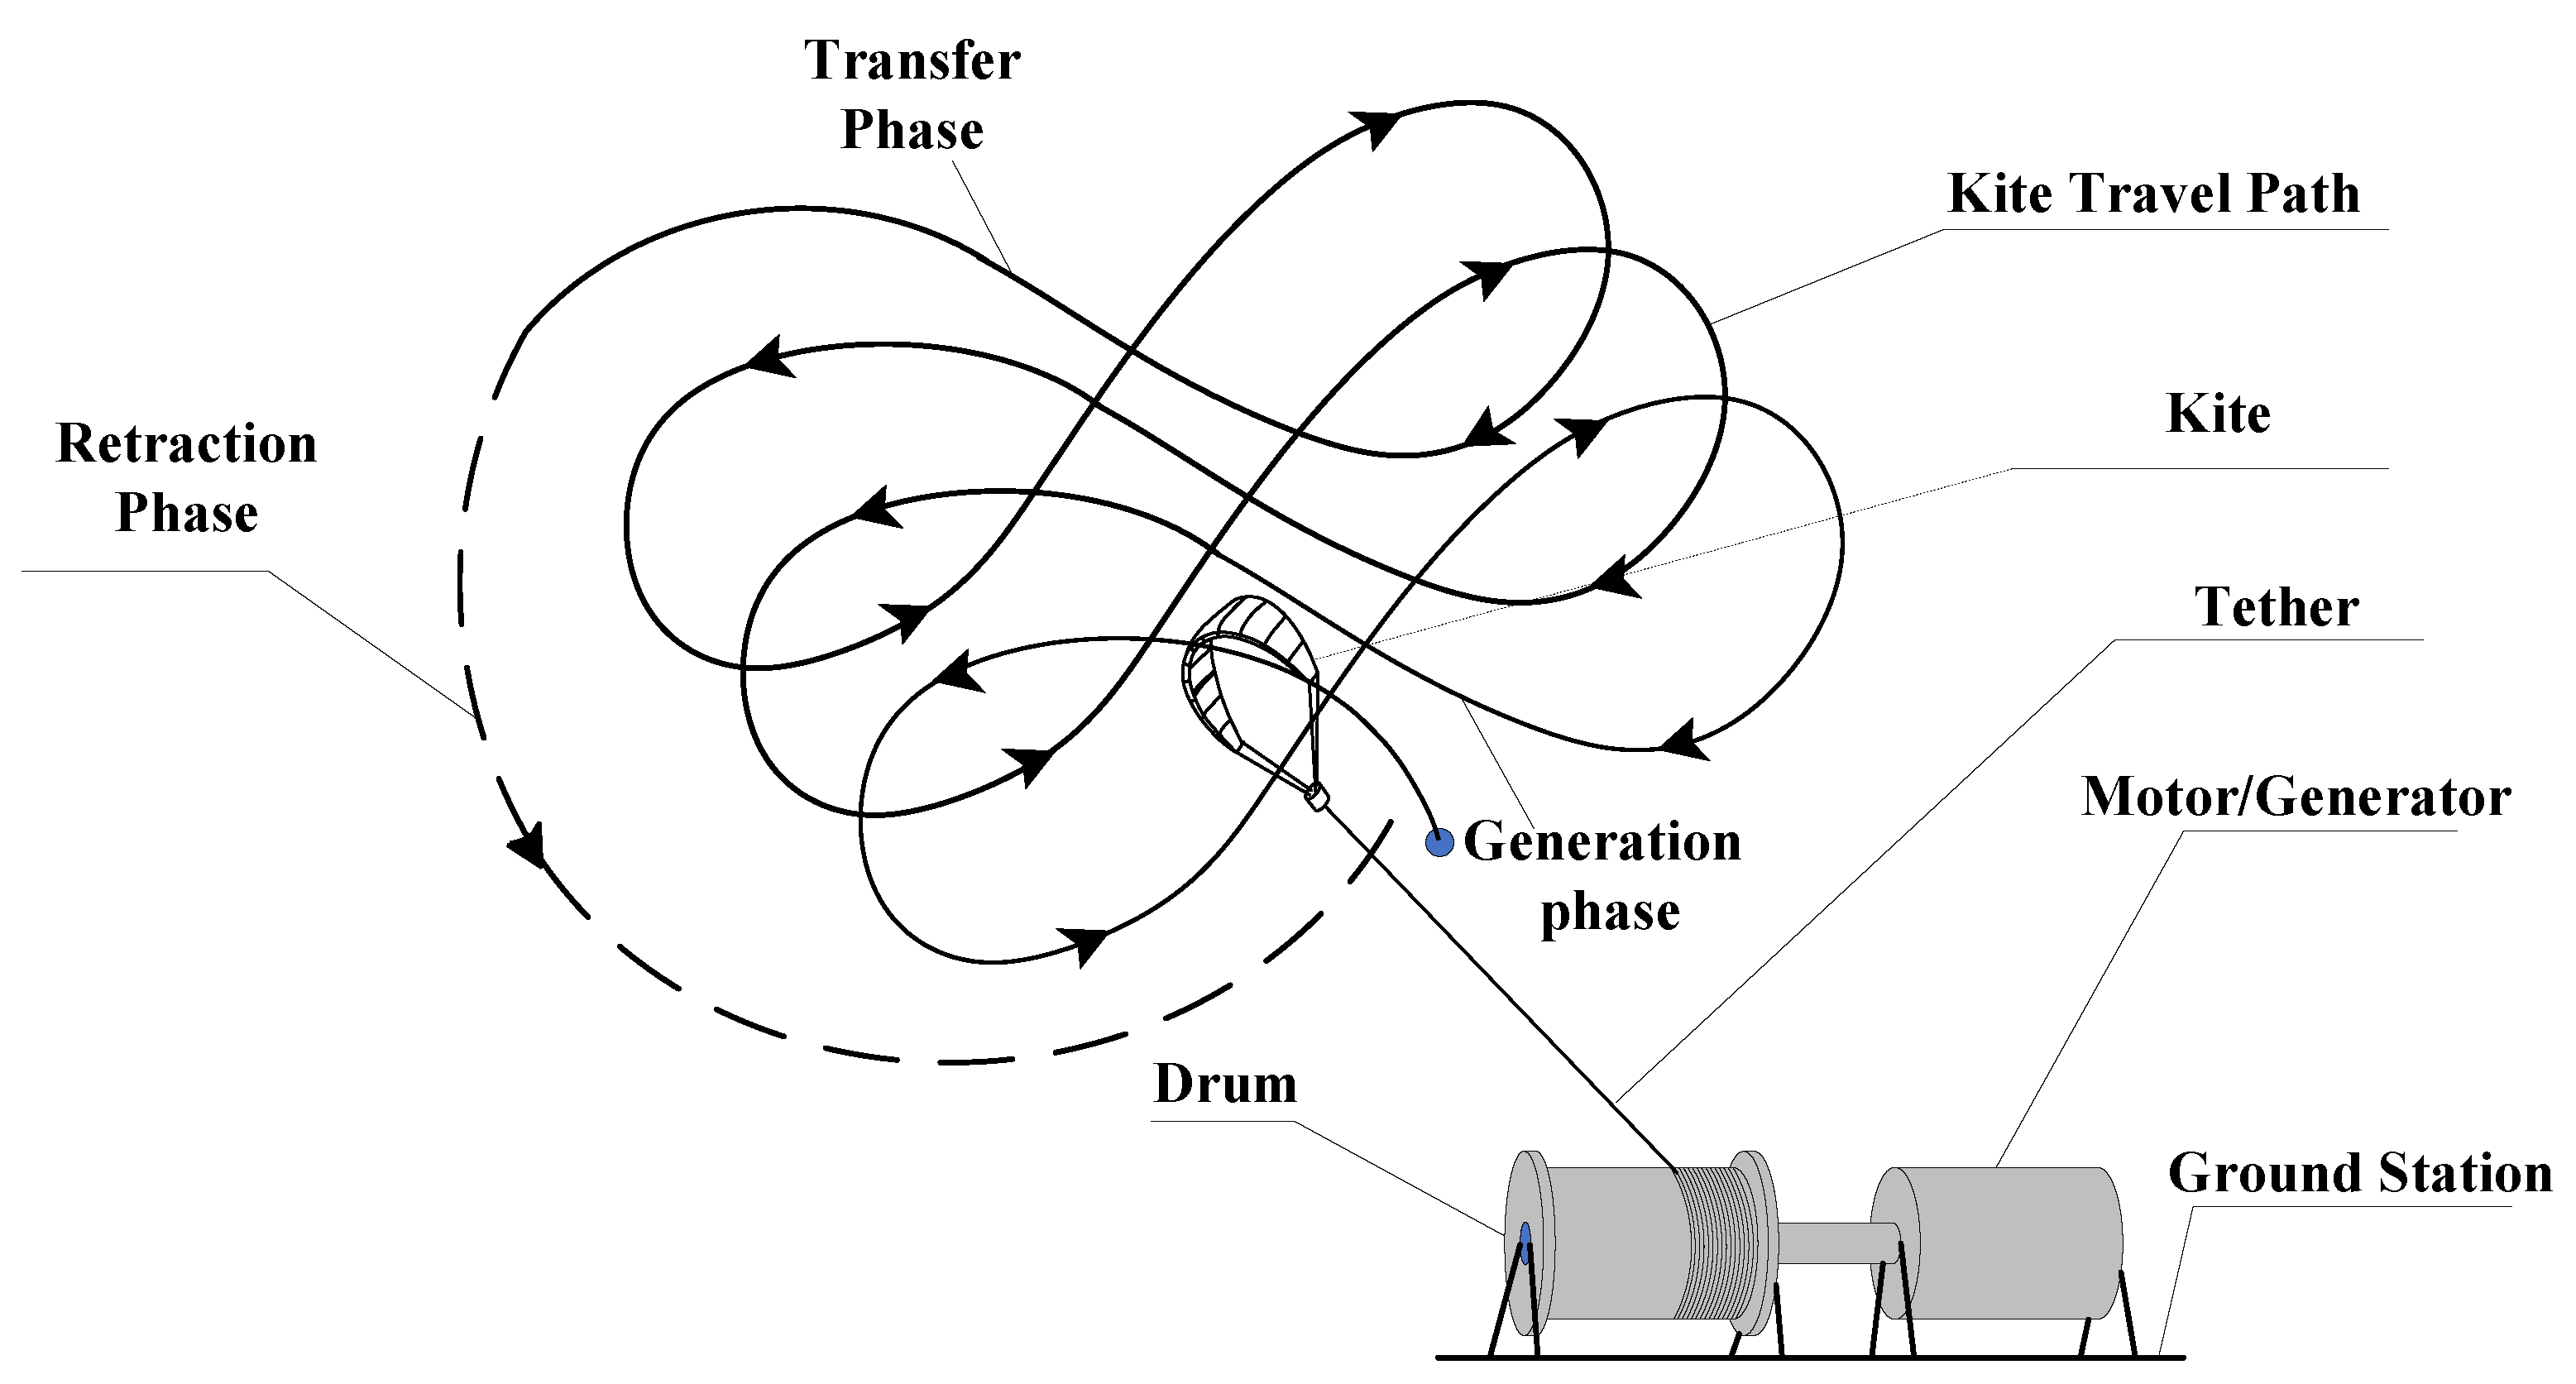
2. Airborne Wind Energy System

Ground-based AWE is an opportunity to capture winds at high altitudes. Figure 1 shows the simplified structure of the kite-based AWE system. The ground station comprises a drum that is connected to a generator for the purpose of electrical power generation. There are two stages of operation that make up a whole cycle: the traction stage and the re-traction stage. During the generation stage, when the kite flies almost crosswind, the lift force spins a tether drum and generator to generate electricity. When the wing reaches the maximum tether length, the AWES begins the re-traction stage. During this stage, the power is utilised so that the tether can be returned to its initial length. Figure 2 shows how much energy is produced and consumed during the traction and re-traction stages, respectively. During the re-traction stage, the generator is employed as a motor [44].
The kite is capable of manoeuvring with a high crosswind velocity to capture power from a higher altitude. Because of this, a strong tether force develops, which turns the generator on to generate electricity. A PMSM is located on the ground and receives torque from the kite’s traction force [45]. Motor-side converters aim to regulate speed, manage power and torque, and reduce switching frequency using PMSM. In this paper, the focus is on a ground-based AWE systems emulator. A ground-based AWE system is a viable method for harnessing high-altitude wind energy. It is highly challenging to obtain suitable wind conditions or field locations for carrying out research on an actual AWES [33]. Hence, it is expedient to develop dynamics models for AWE turbines, as well as emulations of such turbines, to facilitate research and experimentation. Thus, we have proposed a Laboratory-scale Airborne Wind Energy Conversion System (LAWECS), as depicted in Figure 3.
There are various TWT emulations developed based on PMSM drives [26,33]; however, limited literature has been implemented in LAWECS emulators. The literature discusses the PMSM simulation of power generation but not the drum-side mechanical power generation [23], which is crucial for AWES. The kite model system generates the output in the form of a torque and reel-out velocity, and this output is then translated into mechanical power. The proposed block diagram of LAWECS emulators involves a kite model, motor-generator set, drum, variable load, and control system. The kite model system generates the output, which is subsequently converted into mechanical power in terms of torque and reel-out velocity. The second block illustrates the automatic power regulation of the kite emulation system. It consists of a controller, a DC/AC converter, and a PMSM, referred to as a drum, and connects it mechanically to the PMSG in order to generate electricity from mechanical energy.
The key contribution and novelty of this proposed research study is listed as:
  • A new approach to wind energy that involves creating a laboratory-scale kite-based emulator that can be tested in real-time using various kite parameters to determine its effectiveness for different capacity-building purposes.
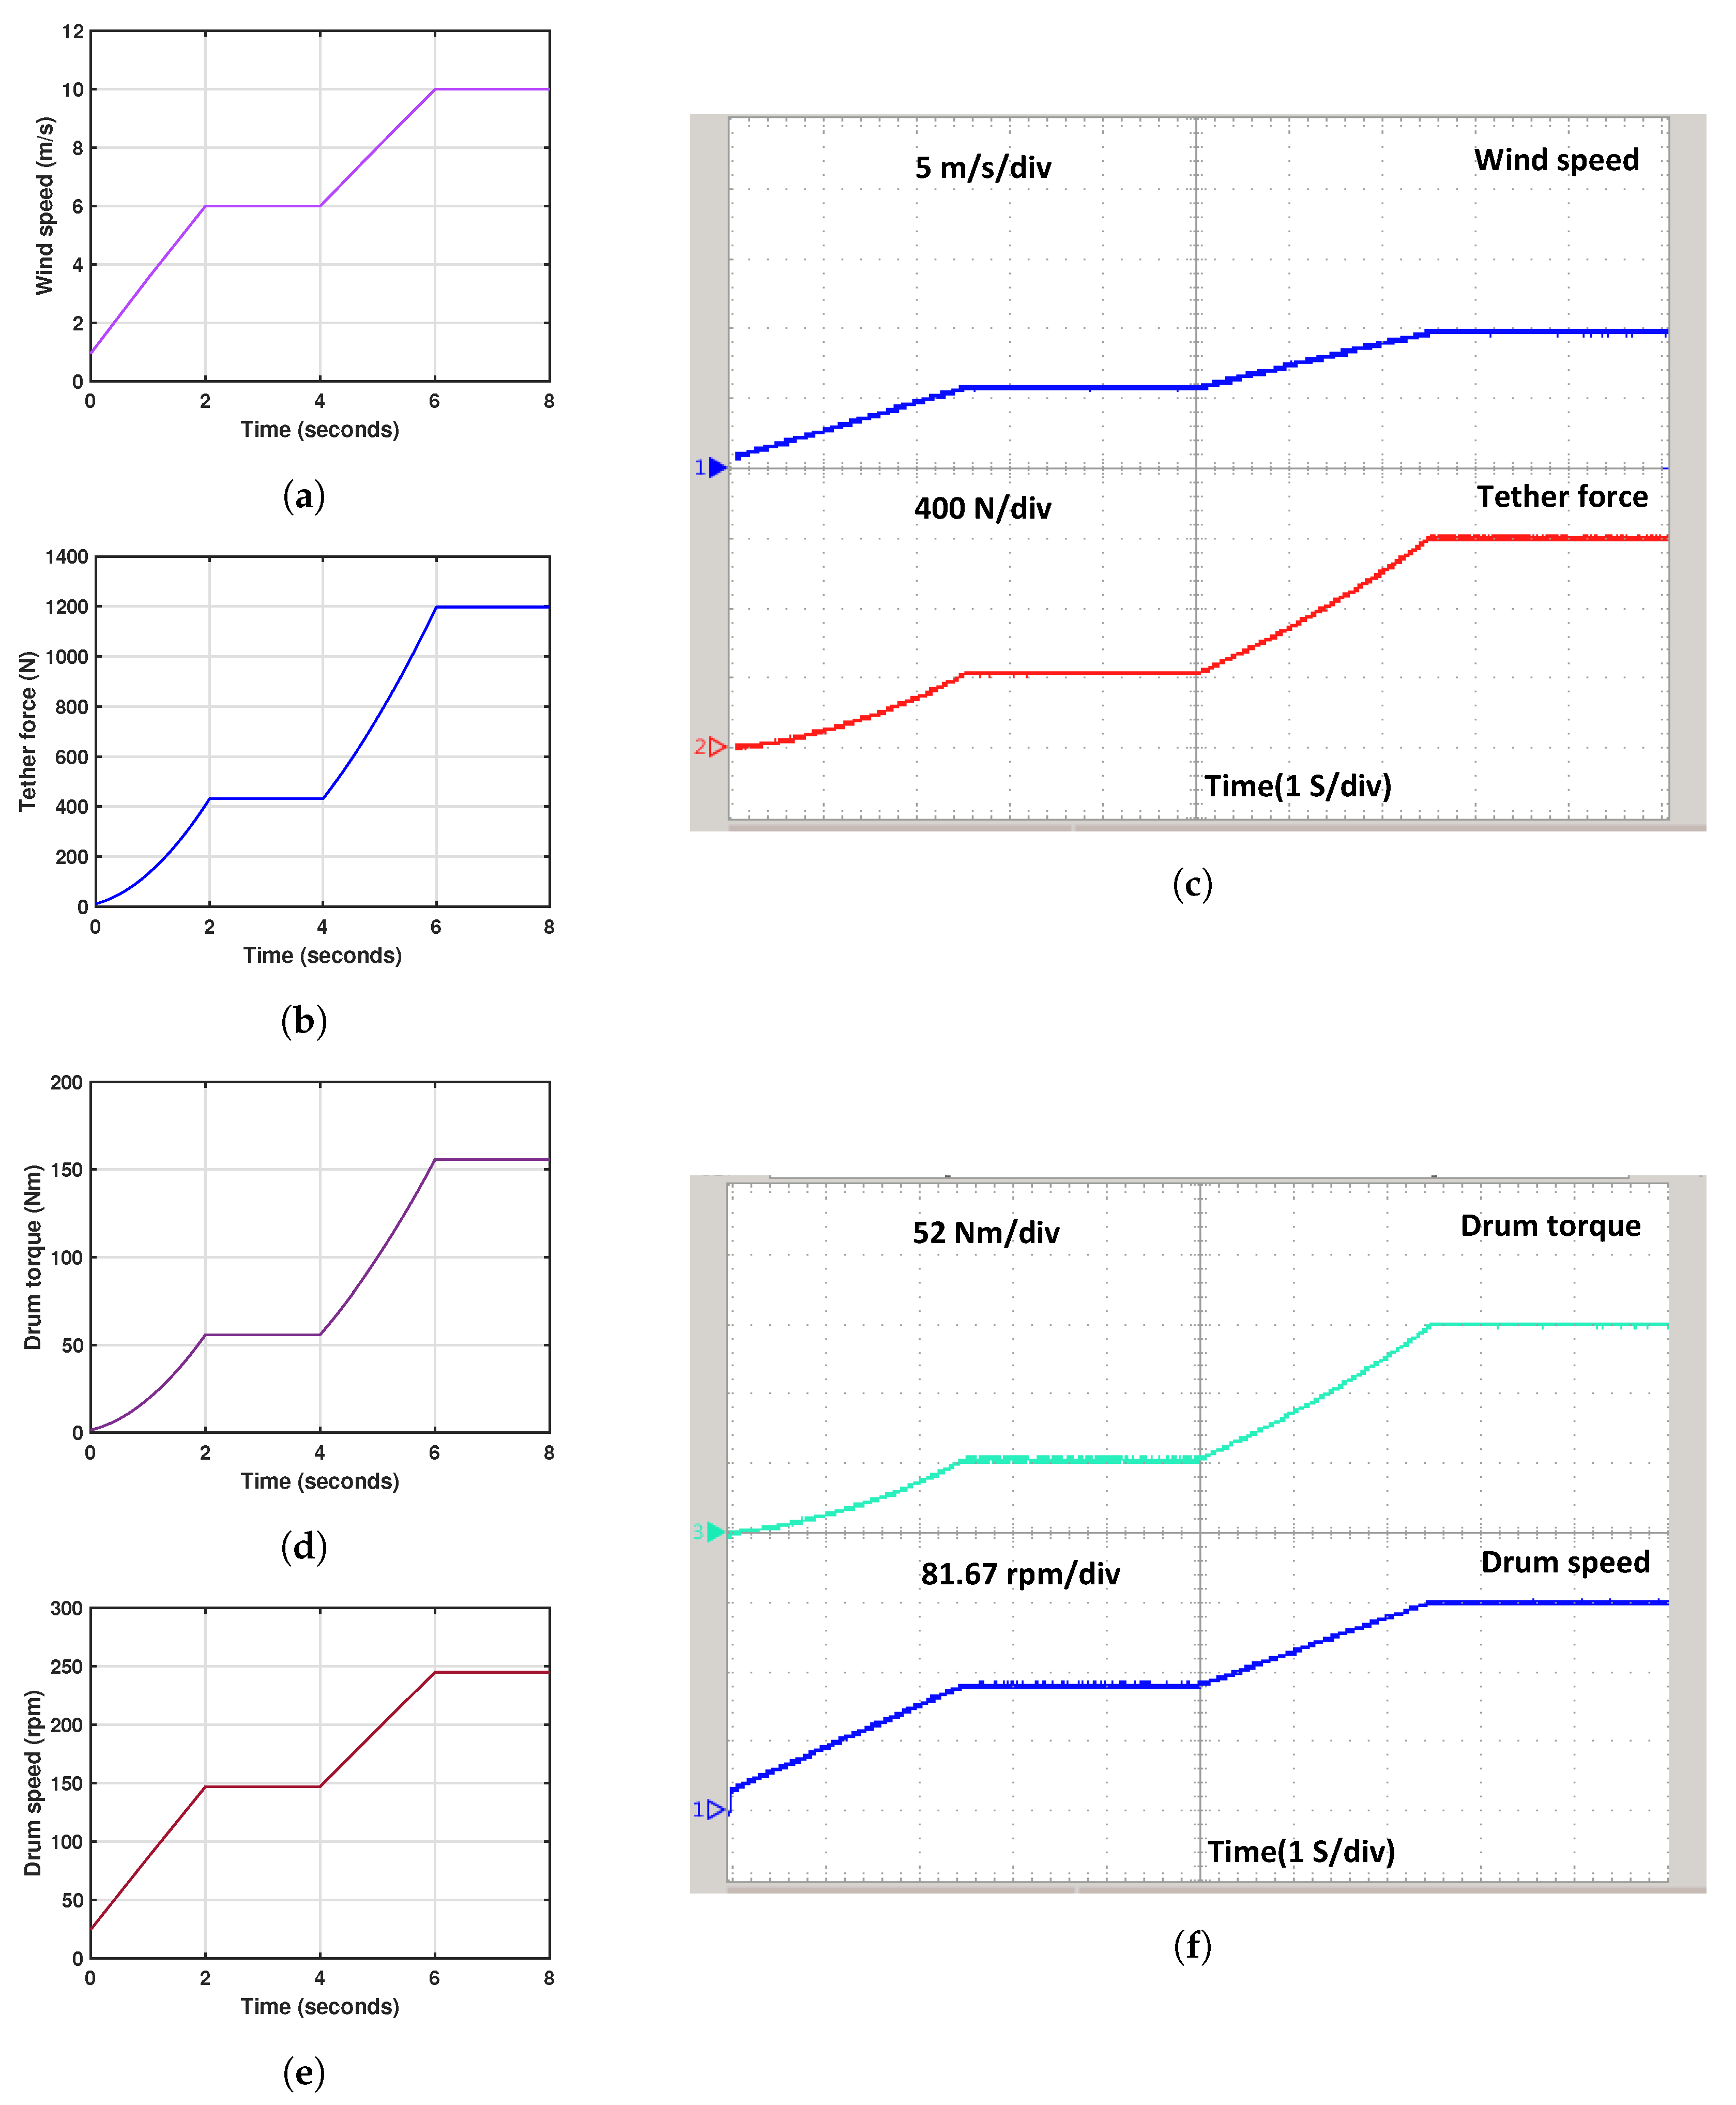
  • The literature above needs to provide information on specific parameters of kite dynamics, such as tether force, drum speed, drum torque, and drum power, in the simulation results.
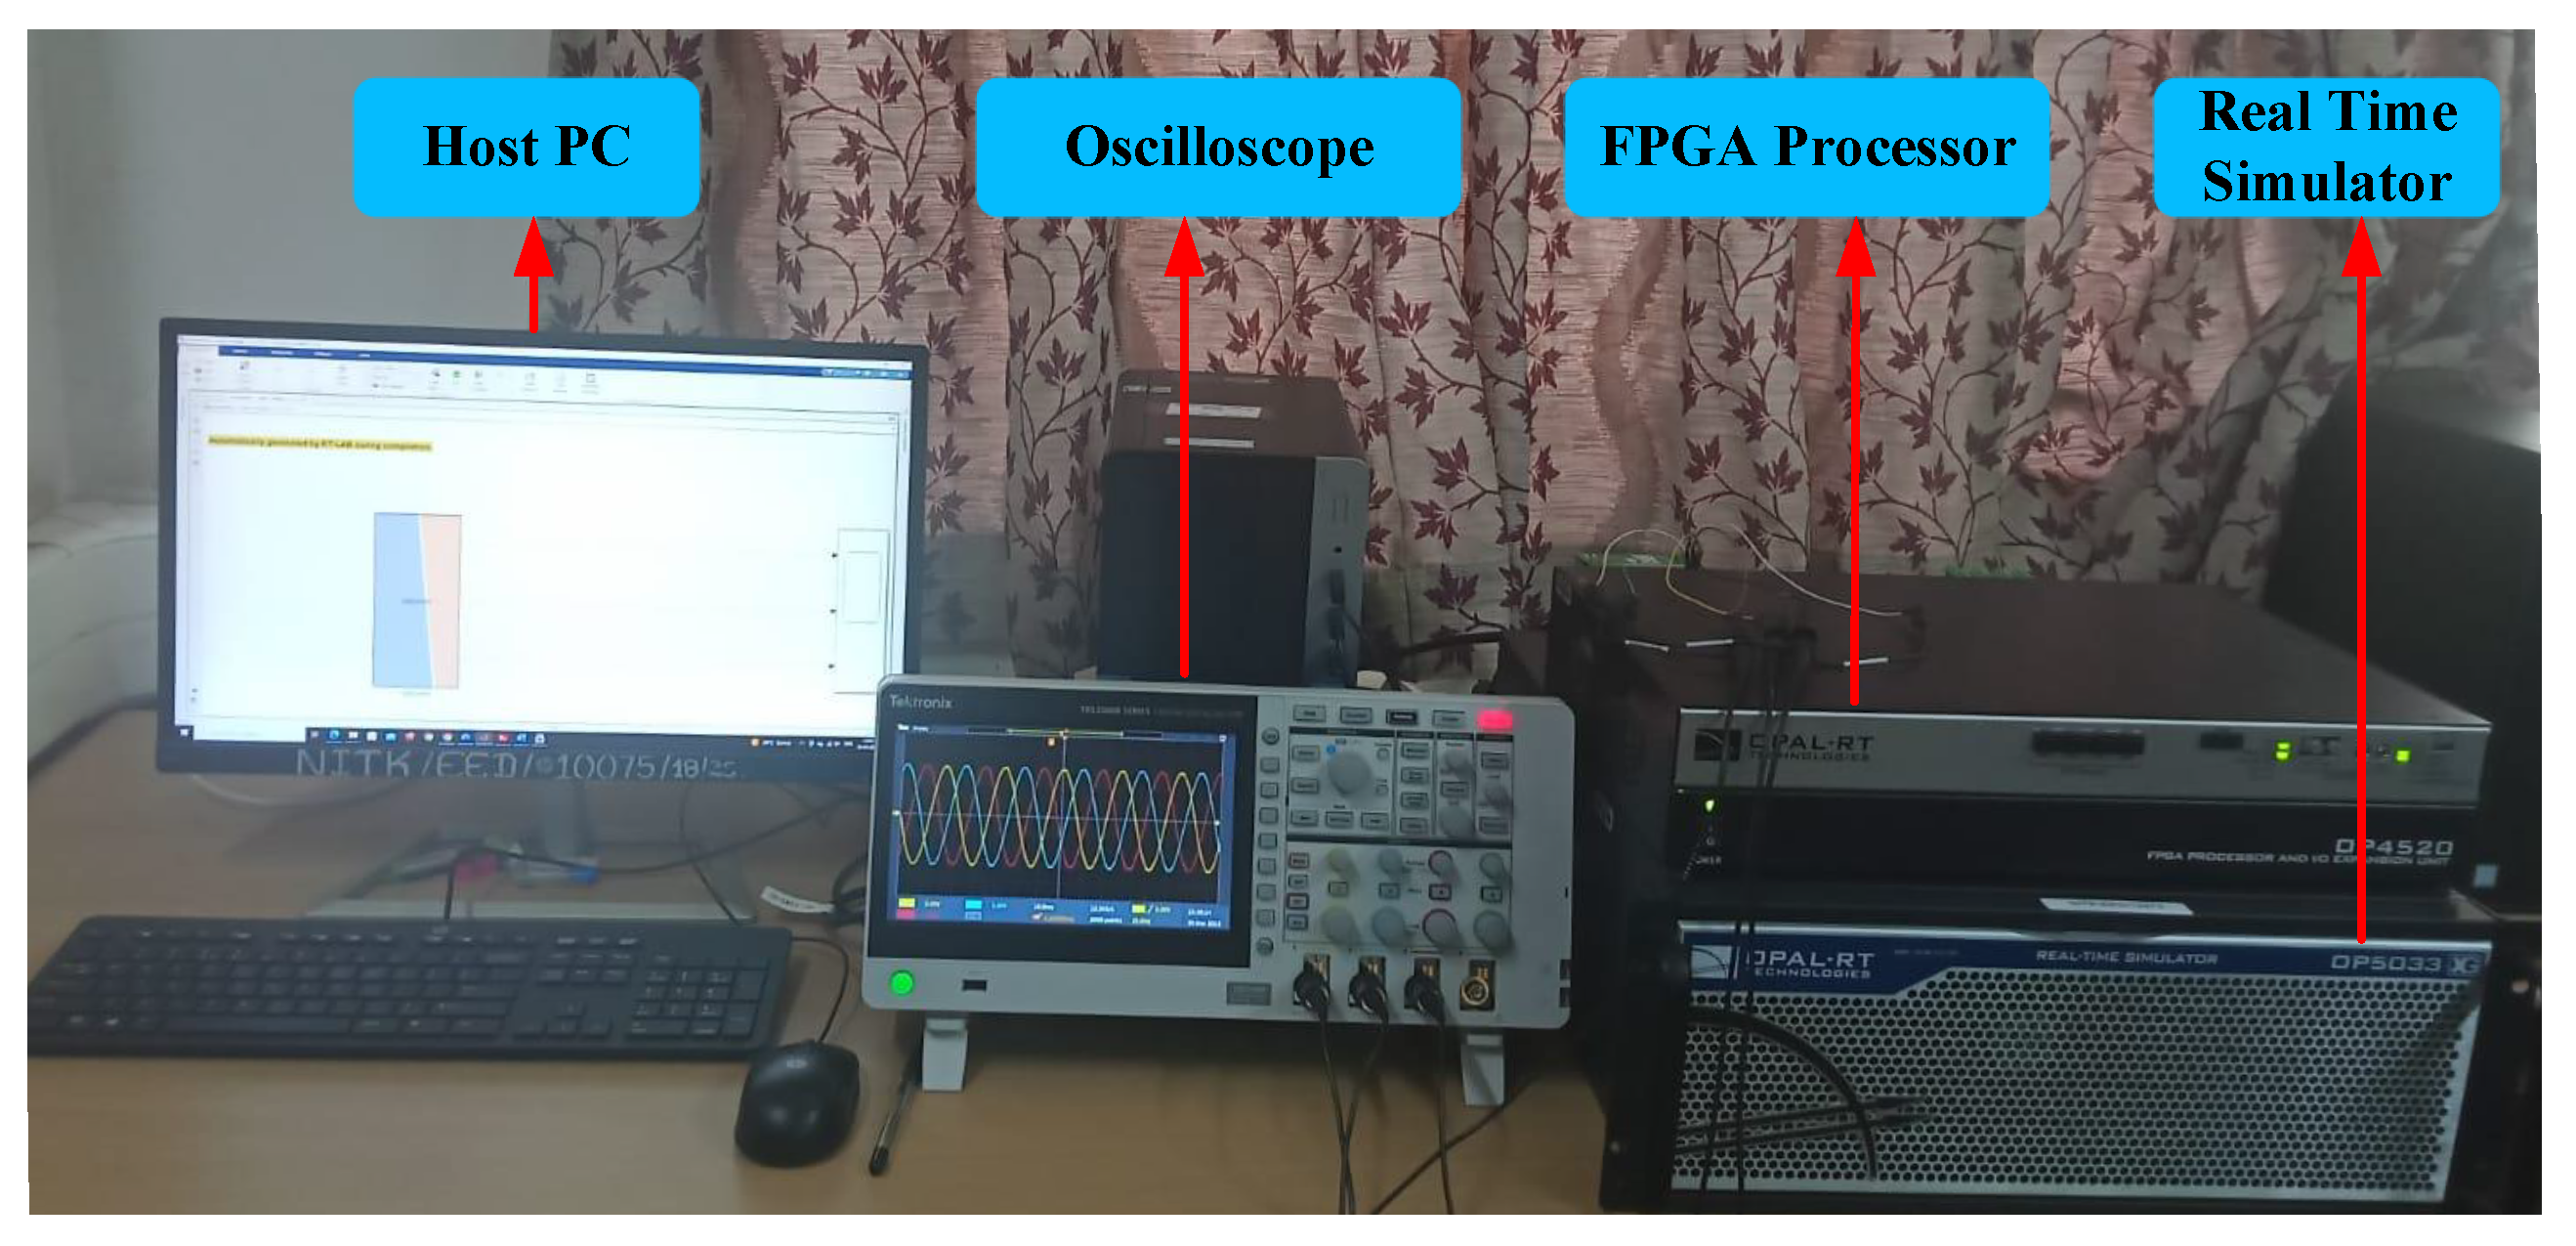
  • The simulated findings are validated in real-time using the OPAL-RT simulator, based on Hardware in Loop (HIL) technology.
  • The Laboratory-Scale Airborne Wind Energy Conversion System’s dynamic characteristics are demonstrated, and its accuracy is confirmed through real-time OPAL-RT simulation.

3. Mathematical Modelling of LAWECS Emulator
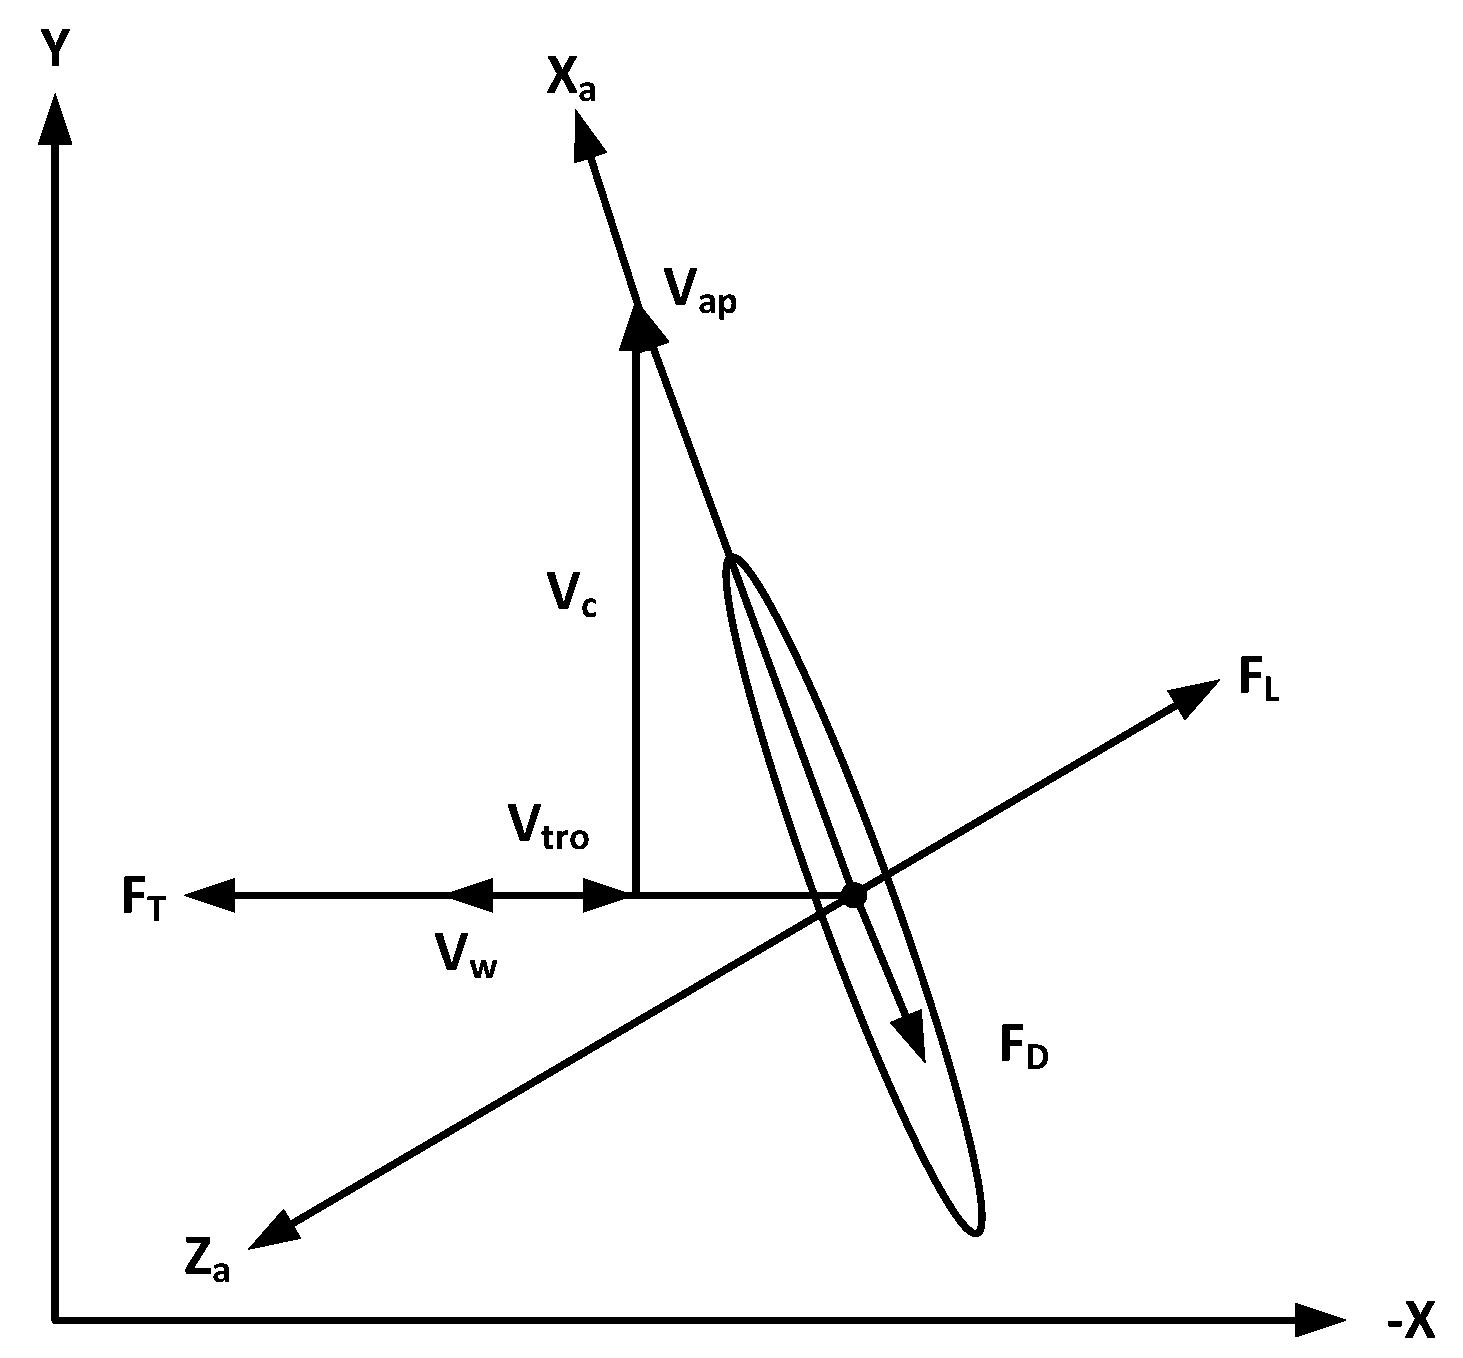
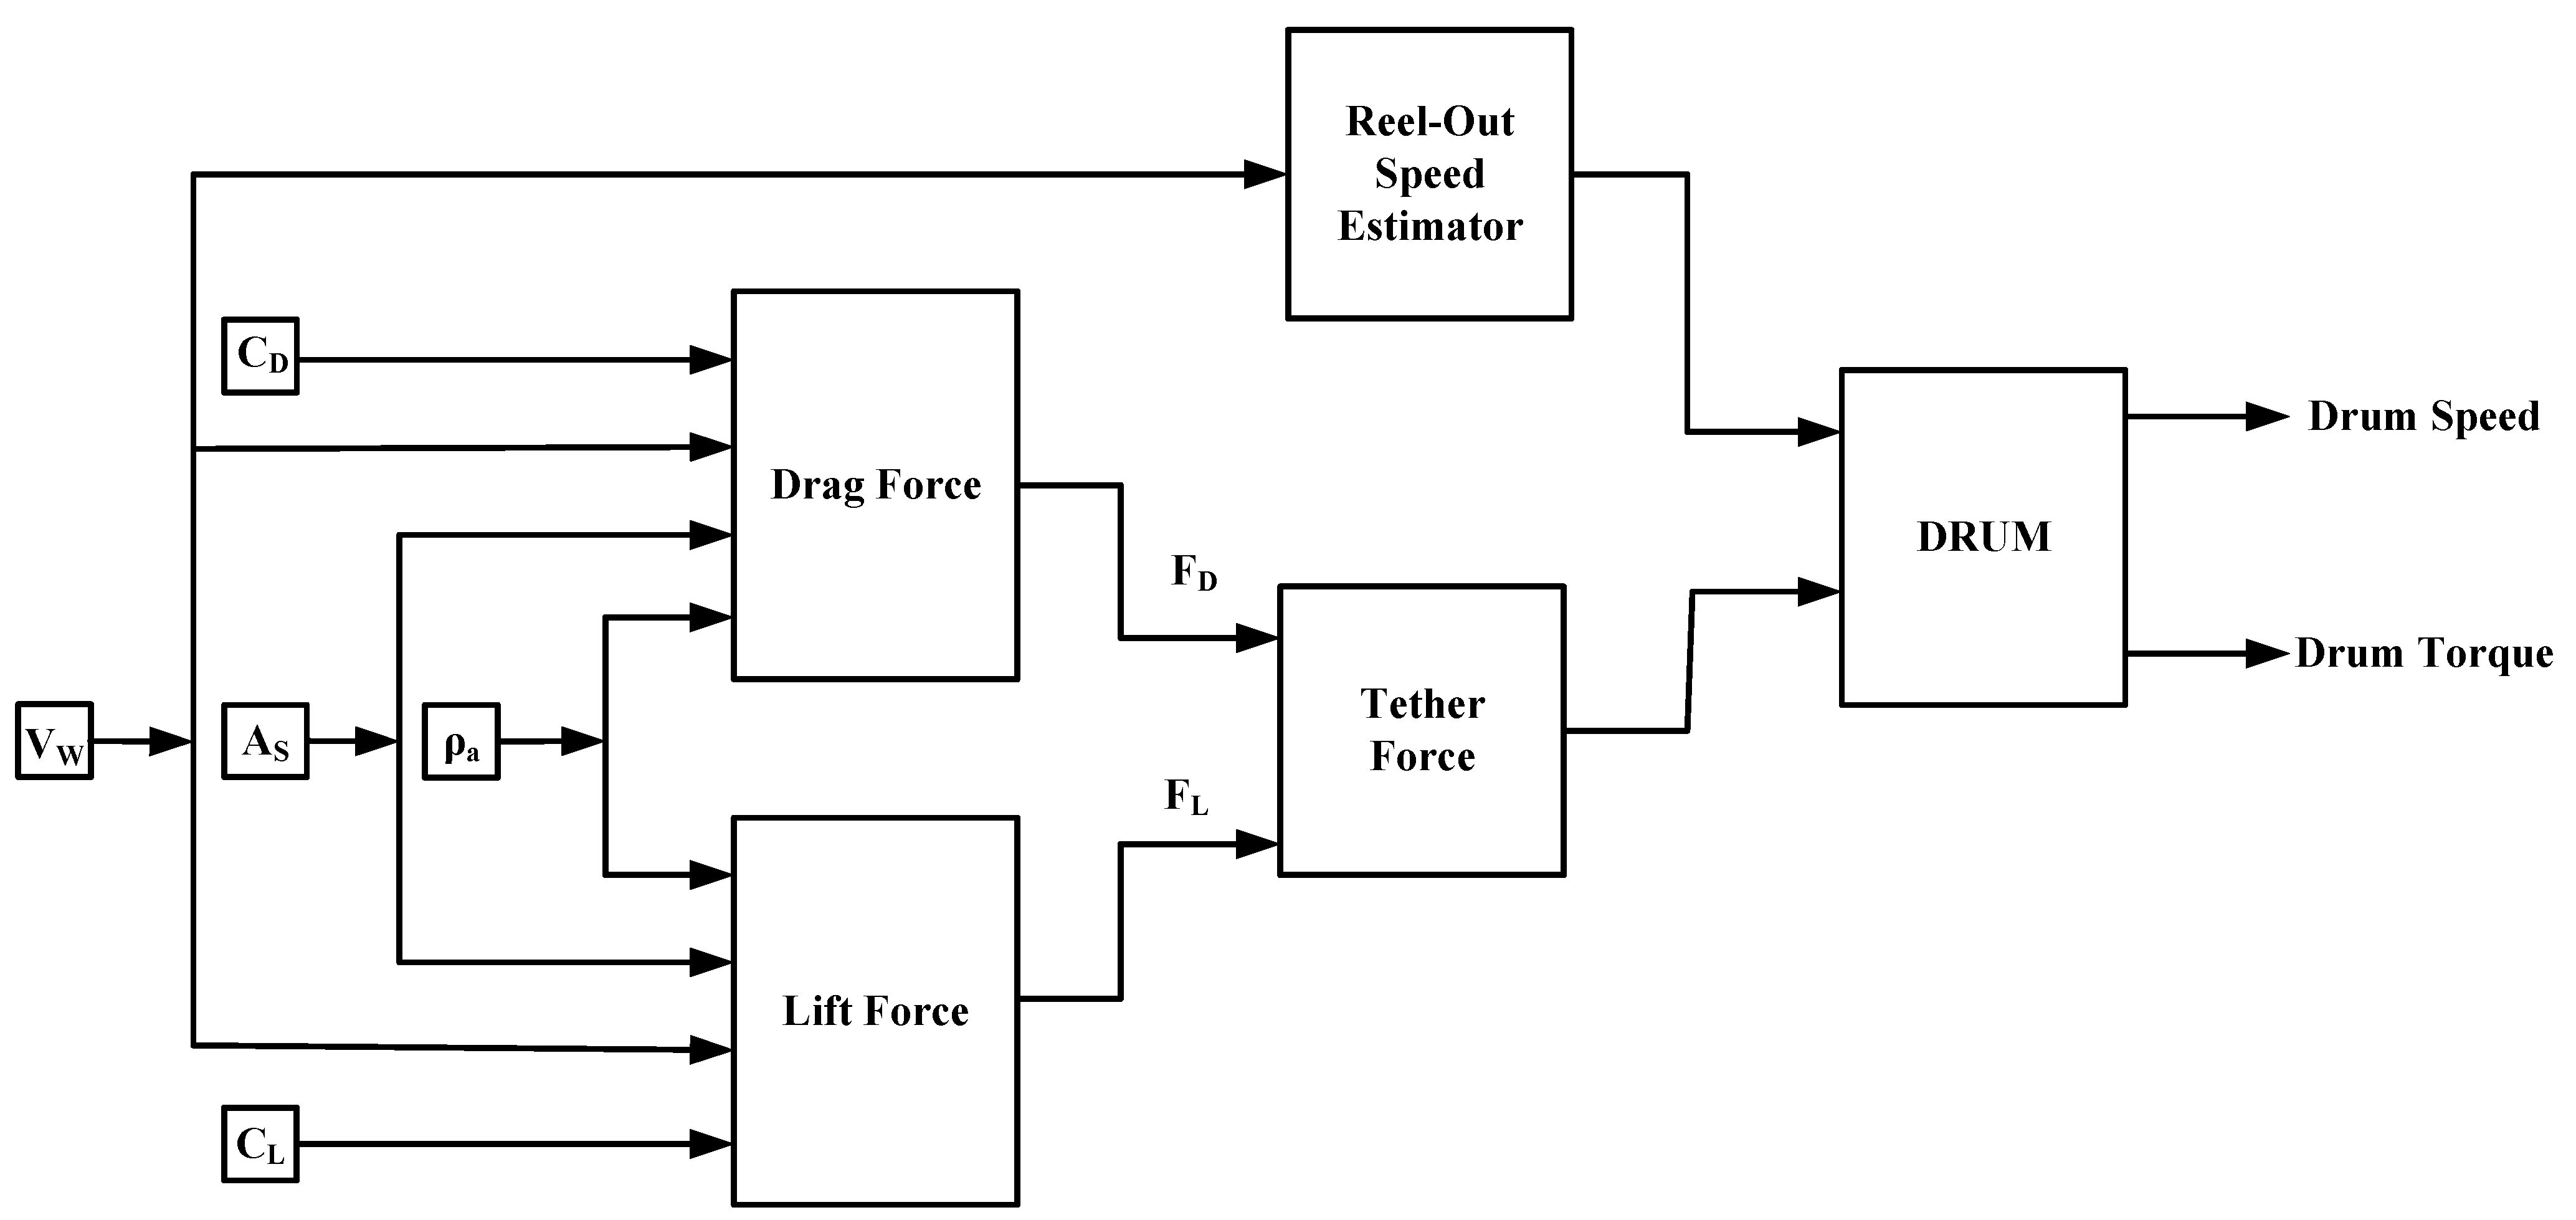
3.1. Kite Modelling

Figure 4 illustrates the force and speed vectors exerted on a flying body during a crosswind flight in a 2D model. The lifting force ( F L ) and drag force ( F D ) are represented, while the wind speed ( V W ), tether reel-out speed ( V t r o ), and crosswind speed ( V C ) demonstrate how the combined vectors contribute to the apparent wind speed ( V a p ). This two-dimensional model is formulated based on specific assumptions and incorporates additional factors. One such factor is the modification of perceived speed due to the unreeling of the tether, which is observed in pumping kite systems. As the tether is unreeled to generate power on the ground, the lifting body in this model drifts in the direction of the wind. It is important to note that this drift is not solely dependent on the AWE system itself. This model is based on four key assumptions, which are as follows:
  • Massless point model for the lifting body.
  • Massless tether connected to the ground with zero drag.
  • Constant and uniform wind in the direction opposite to the flight path.
  • Steady flight of the lifting body.
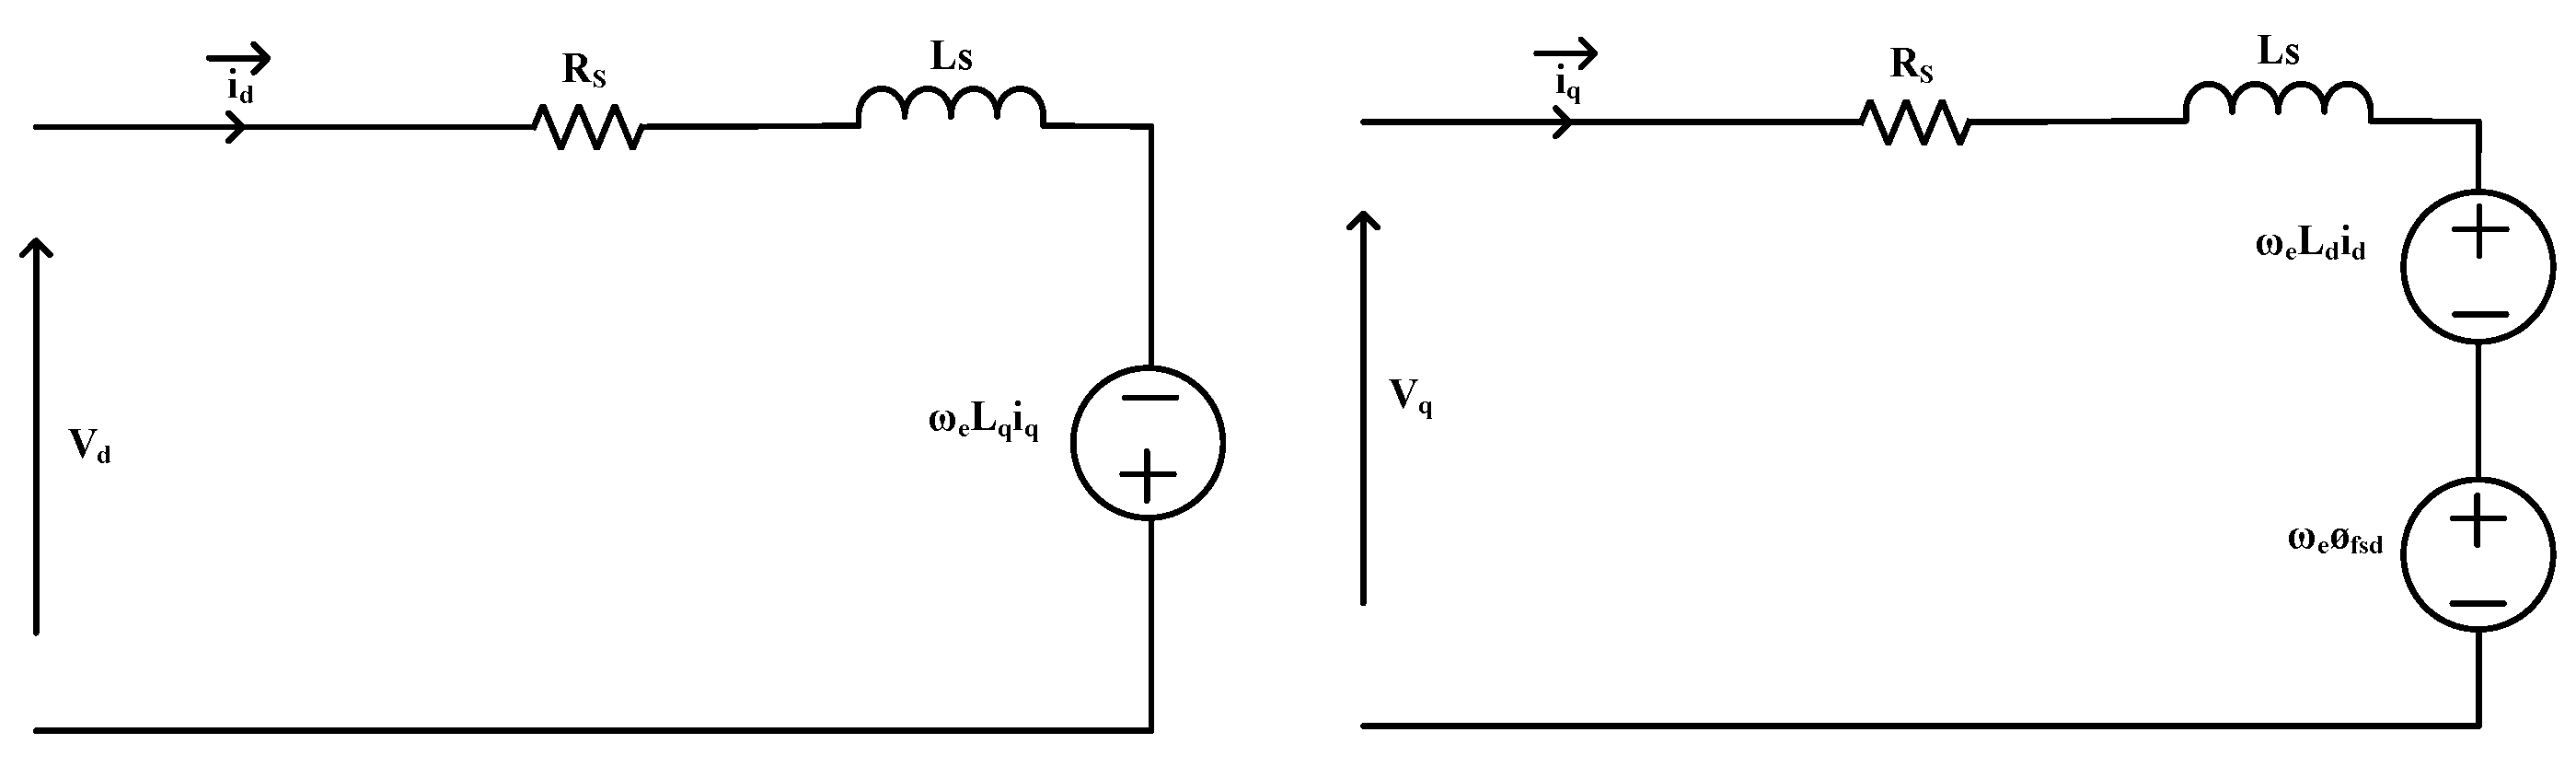
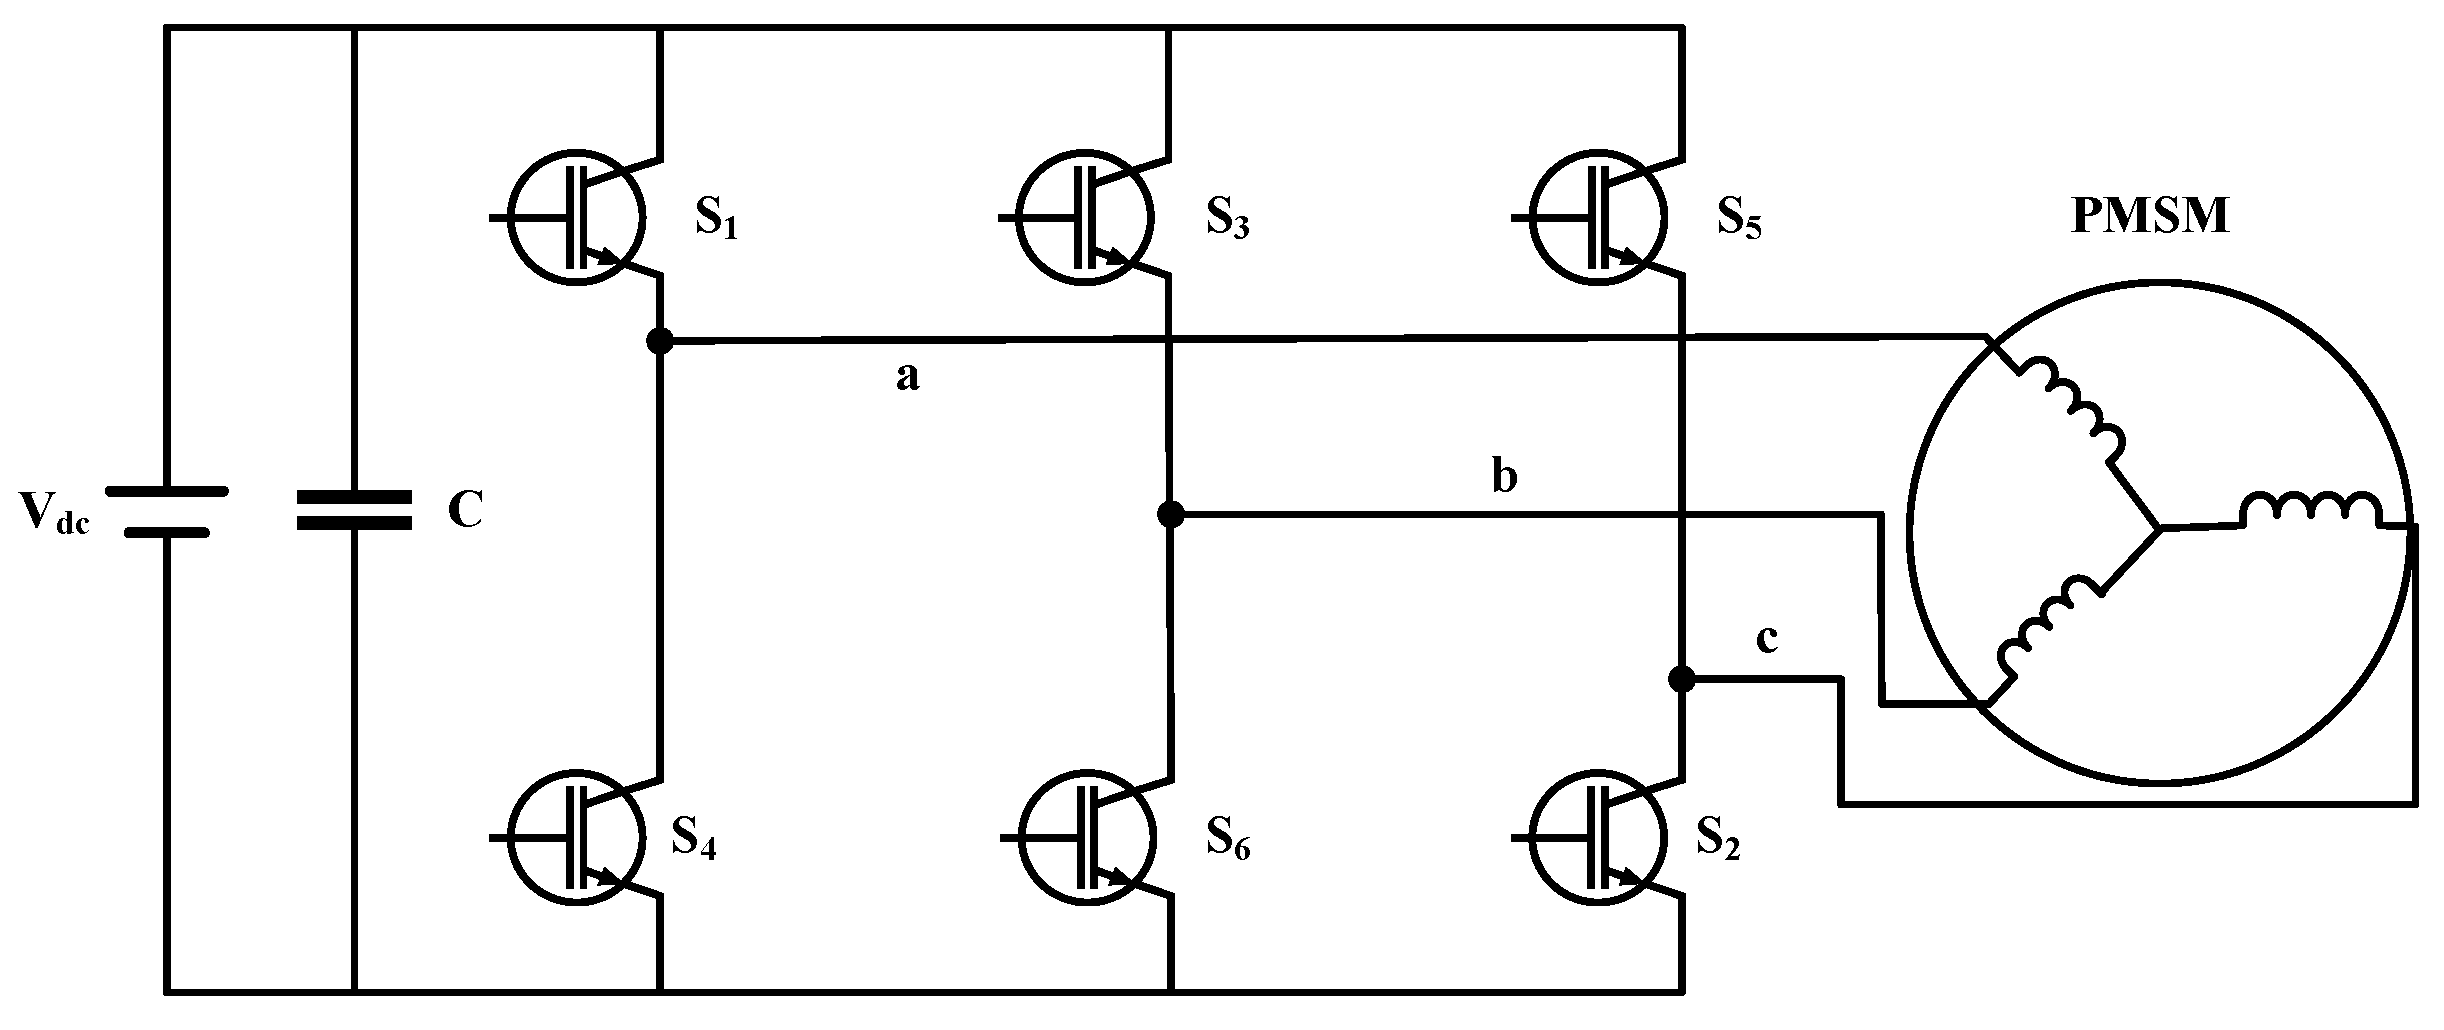
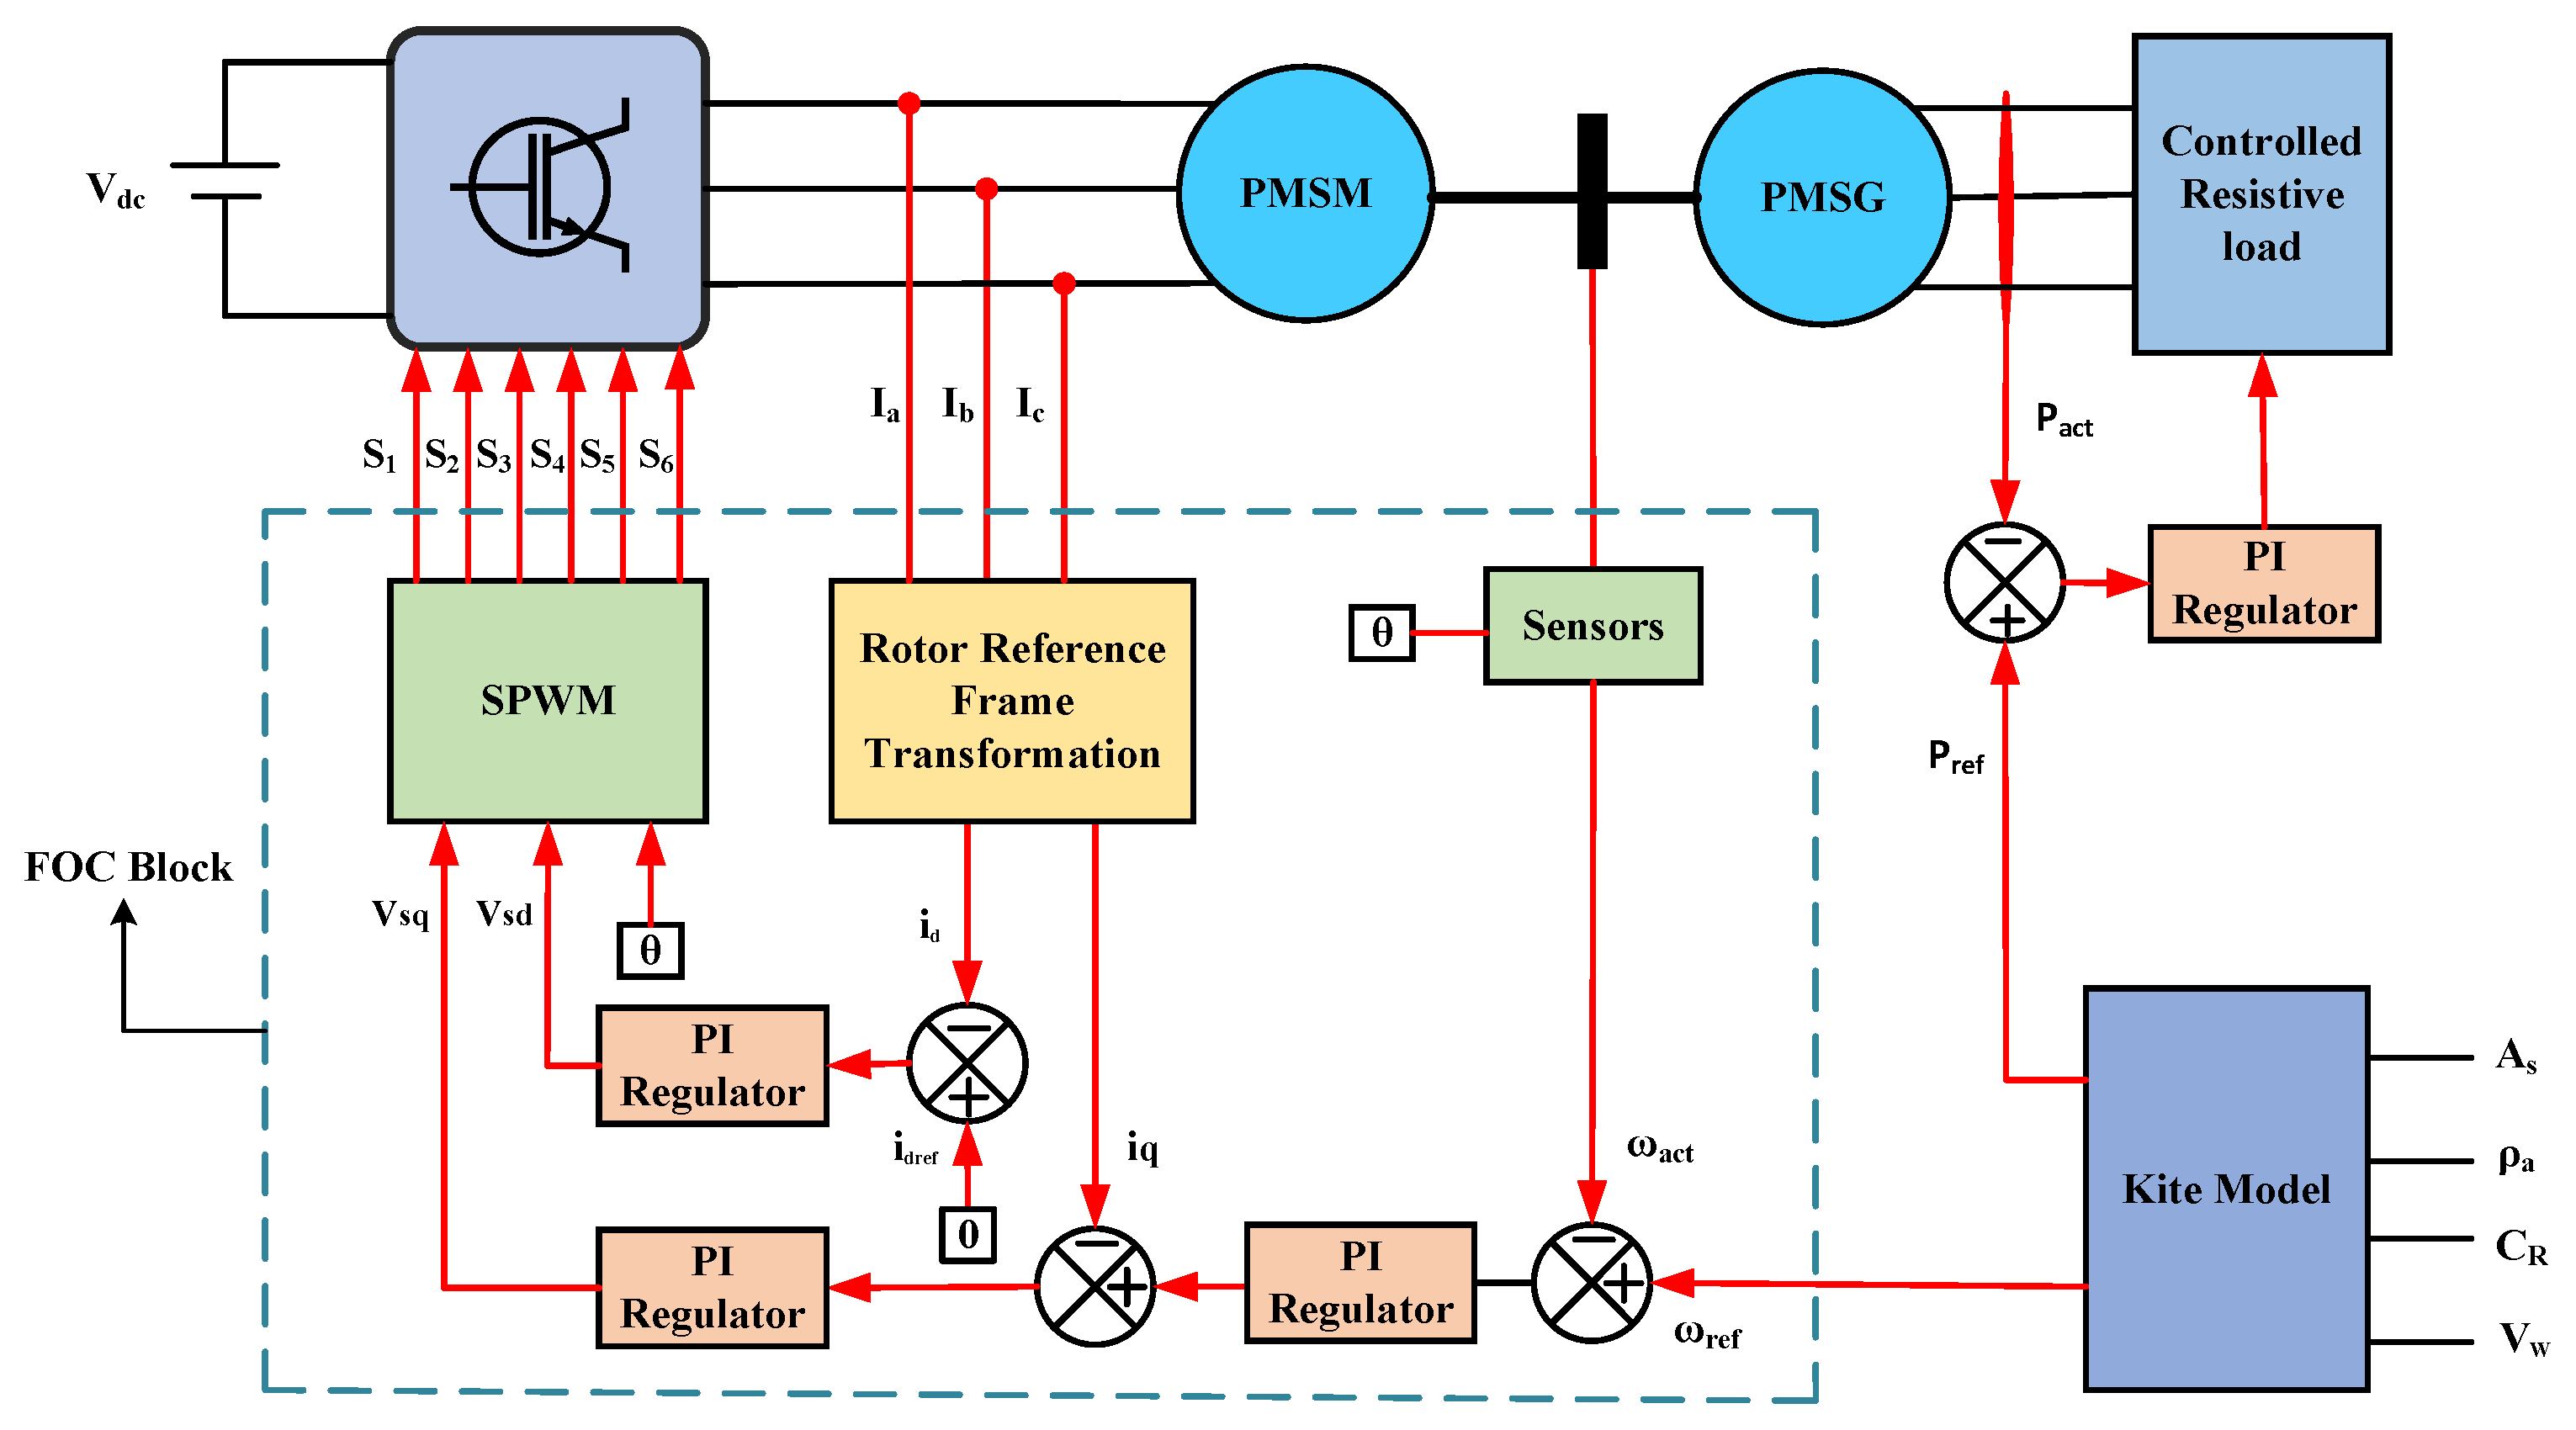
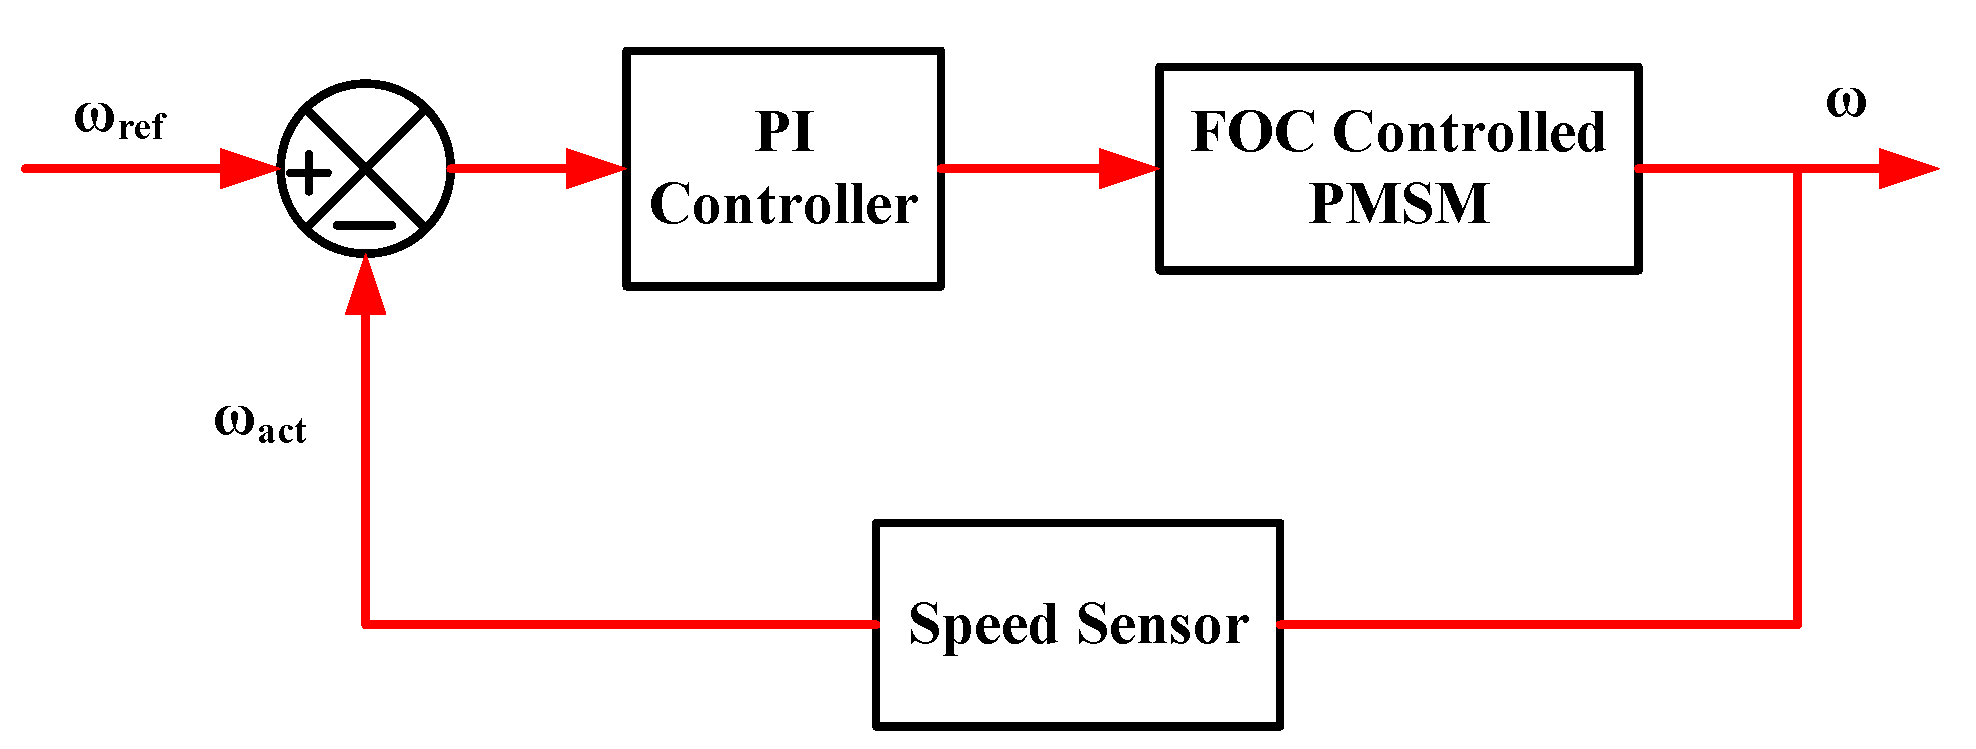
These assumptions are made to simplify the analysis and may not fully capture all real-world complexities.
To accurately determine the apparent wind speed, it is necessary to consider both the actual wind velocity ( V w ) and the tether reel-out velocity ( V t r o ). Consequently, the formula for calculating the apparent wind speed is as follows:
V a p = V C 2 + ( V W V t r o ) 2
V C = C L C D ( V W V t r o )
we can also write the apparent wind speed from Equations (1) and (2) as shown below
V a p = C L C D 2 + 1 ( V W V t r o ) 2
The lift force and drag force are determined by the apparent wind speed ( V a p ), the lift coefficient, and drag coefficient, and expressed as
F L = 1 2 ρ a C L V a p 2 A s
F D = 1 2 ρ a C D V a p 2 A s
F T = F L + F D
The kite surface area is A s in m 2 , the apparent wind velocity is V a p in m/s, the air density is ρ a in kg/m 3 , and the lift and drag coefficients are C L and C D . The tether force is the combined effect of the lift force ( F L ) and drag force ( F D ) acting on the lifting body. The square-root component represents the sum of these forces in the equation.
F T = F L 1 + 1 C L C D 2
The power generation at the ground station is achieved by reeling the tether from a drum, and is represented by the following equation.
P = F T × V t r o
Presently, putting the F T in Equation (8), the power can be written as
P = 1 2 ρ a C L A s V t r o C L C D 2 + 1 ( V W V t r o ) 2 1 + 1 C L C D 2
For maximum mechanical power extraction, the tether reel-out velocity equals one-third of the wind velocity [11], which is written as
V t r o = 1 3 × V w
Then, we rewrite Equation (9)
P = 2 27 ρ a C L A s V w 3 C L C D 2 + 1 1 + 1 C L C D 2
The drum torque ( T D ) in Nm is calculated by multiplying the tether force ( F T ) by the drum radius.
T D = F T × r
By incorporating the diameter of the drum as an additional input, we estimated the optimal speed of the drum using the given equation, below:
N D = V t r o 2 π r × 60
where the drum radius is r in meters, and the drum speed is N D in rpm.

3.2. PMSM Model

The equivalent electrical circuit of the PMSM, as depicted in Figure 5, includes the resistance in Ohms and inductance in Henry. This circuit can be utilized to represent the phase of each machine, assuming that the stator phase inductance ( L s ), quadrature-axis inductance ( L q ), and direct-axis inductance ( L d ) are equal. This analysis assumes that the magnetic circuit has linear properties with negligible saturation, a constant air gap, and the sinusoidal behaviour of a current.
The variable vector display shows all three stages at the same time. It is shown in park coordinates (d,q) by
V q = R s i q + L s d i q d t + ω L s i d + w ϕ f s d
V d = R s i d + L s d i d d t ω L s i q
In the given equation, V s represents the voltage at the stator, which is expressed as
V s = V d + j · V q
The vector is a representation of the current that is flowing through the stator.
i s = i d + j · i q
ϕ s d = L s i d + ϕ f s d
ϕ s q = L s i q
The flux generated by PMSM, which can be written as
Φ f s = ϕ f s d + ϕ f s q
The torque developed by PMSM, which can be written as
T e = p ϕ f s d i q
The circuit depicted in Figure 6 is a DC/AC power converter that operates from a supply voltage of V d c and consists of six IGBT switches. The AC voltage frequency can be kept constant or altered based on the application’s requirements. The current controllers generate reference voltages, which are reversed with the FOC method’s help using Clarke’s and Park’s transform.
The switching pulses for the DC/AC converter are generated by a sinusoidal pulse width modulation generator, which receives its input from the reference voltage. The DC input voltage is supplied to the DC/AC converter, which produces an AC output voltage to drive the machines [47]. The Park and Clarke transform converts the three-phase (abc) representation to a two-phase (dq) representation, which is given by the following equation.
V s q = 2 3 V a cos θ + V b cos ( θ 2 π 3 ) + V c cos ( θ + 2 π 3 )
V s d = 2 3 V a sin θ + V b sin ( θ 2 π 3 ) + V c sin ( θ + 2 π 3 )
Moreover, the inverse Park and Clarke transform convert two phases to three phases, which can be described as
V a = V q cos θ V d sin θ
V b = V q cos ( θ 2 π 3 ) V d sin ( θ 2 π 3 )
V c = V q cos ( θ + 2 π 3 ) V d sin ( θ + 2 π 3 )
The generator’s three-phase electrical output power is described as follows:
P e = 3 · V · I · cos Φ
The voltage and current of the generator are denoted by V and I, respectively. Consider the power factor, cos ϕ . The kite power calculated with Equation (8) and the generator’s electrical power calculated with Equation (27) are identical.

3.3. Simulation Modelling of Kite System

The MATLAB SIMULINK environment was used to simulate the reel-out velocity, tether force, drum speed, and drum torque, as shown in Figure 7. Kite model parameters were the same as those described in Section 3.1. There were two different blocks utilized to calculate the lift and drag forces. These blocks were determined using Equations (4) and Equations (5). The third block computes and displays the results of the aerodynamic force, which is equivalent to the tether force, as per Equation (7). The fourth block shows the reel-out speed estimator, which is estimated using Equations (10). The final block is the drum, which generates the drum torque and speed using Equations (12) and (13), respectively.
The relationship between tether force and drum speed can be established using the following equation, which represents drum speed ( ω d ) in [rad/s] as a function of tether force:
ω d = F T r P d A s · ρ a
Here, P d represents the power of the drum in watts, F T represents the tether force, r is the drum radius, ρ a is the air density, and A s is the kite surface area.
Figure 8 provides an overview of the methodology employed in this study through a flow chart.
The block first represents the input parameter ( A s , C L , C D , ρ a , and V w ) for the kite dynamic system. This block employs Equation (8) to generate mechanical kite power. The next block is the dram dynamic, which uses Equations (12) and (13) to estimate the torque and speed, respectively. In the subsequent phase, the torque and speed of the machine are regulated utilizing the FOC technique. Subsequently, a torque and speed sensor is employed to measure the speed and torque of machines, which are compared with the reference speed and torque. If any error is detected, the control is subsequently transferred to the controller, which then corrects the error. Further, a step permanent magnet synchronous generator (PMSG) transforms the mechanical energy into electrical energy. At last, a load controller links the PMSG to a managed resistive load.

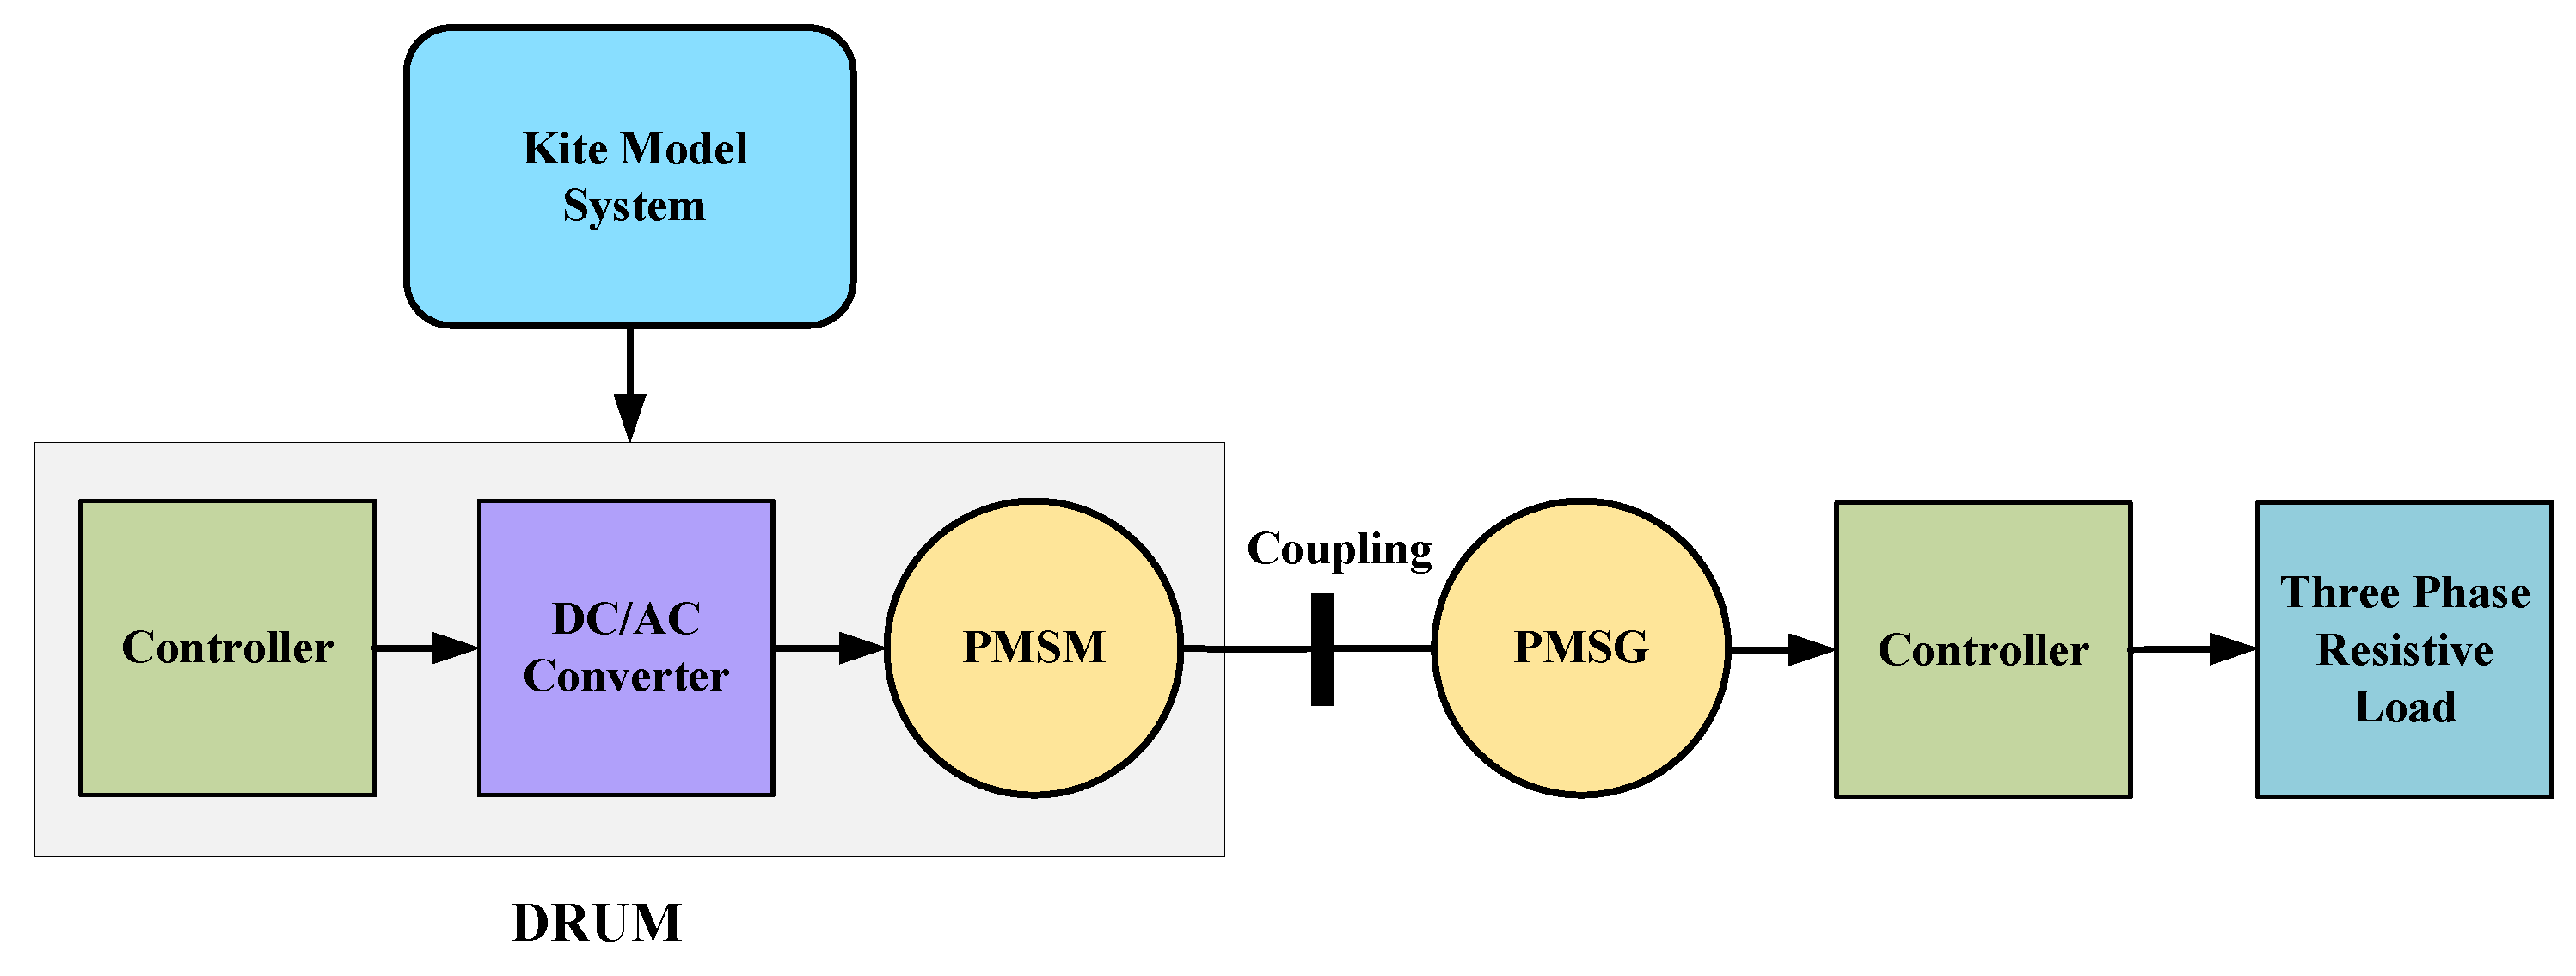
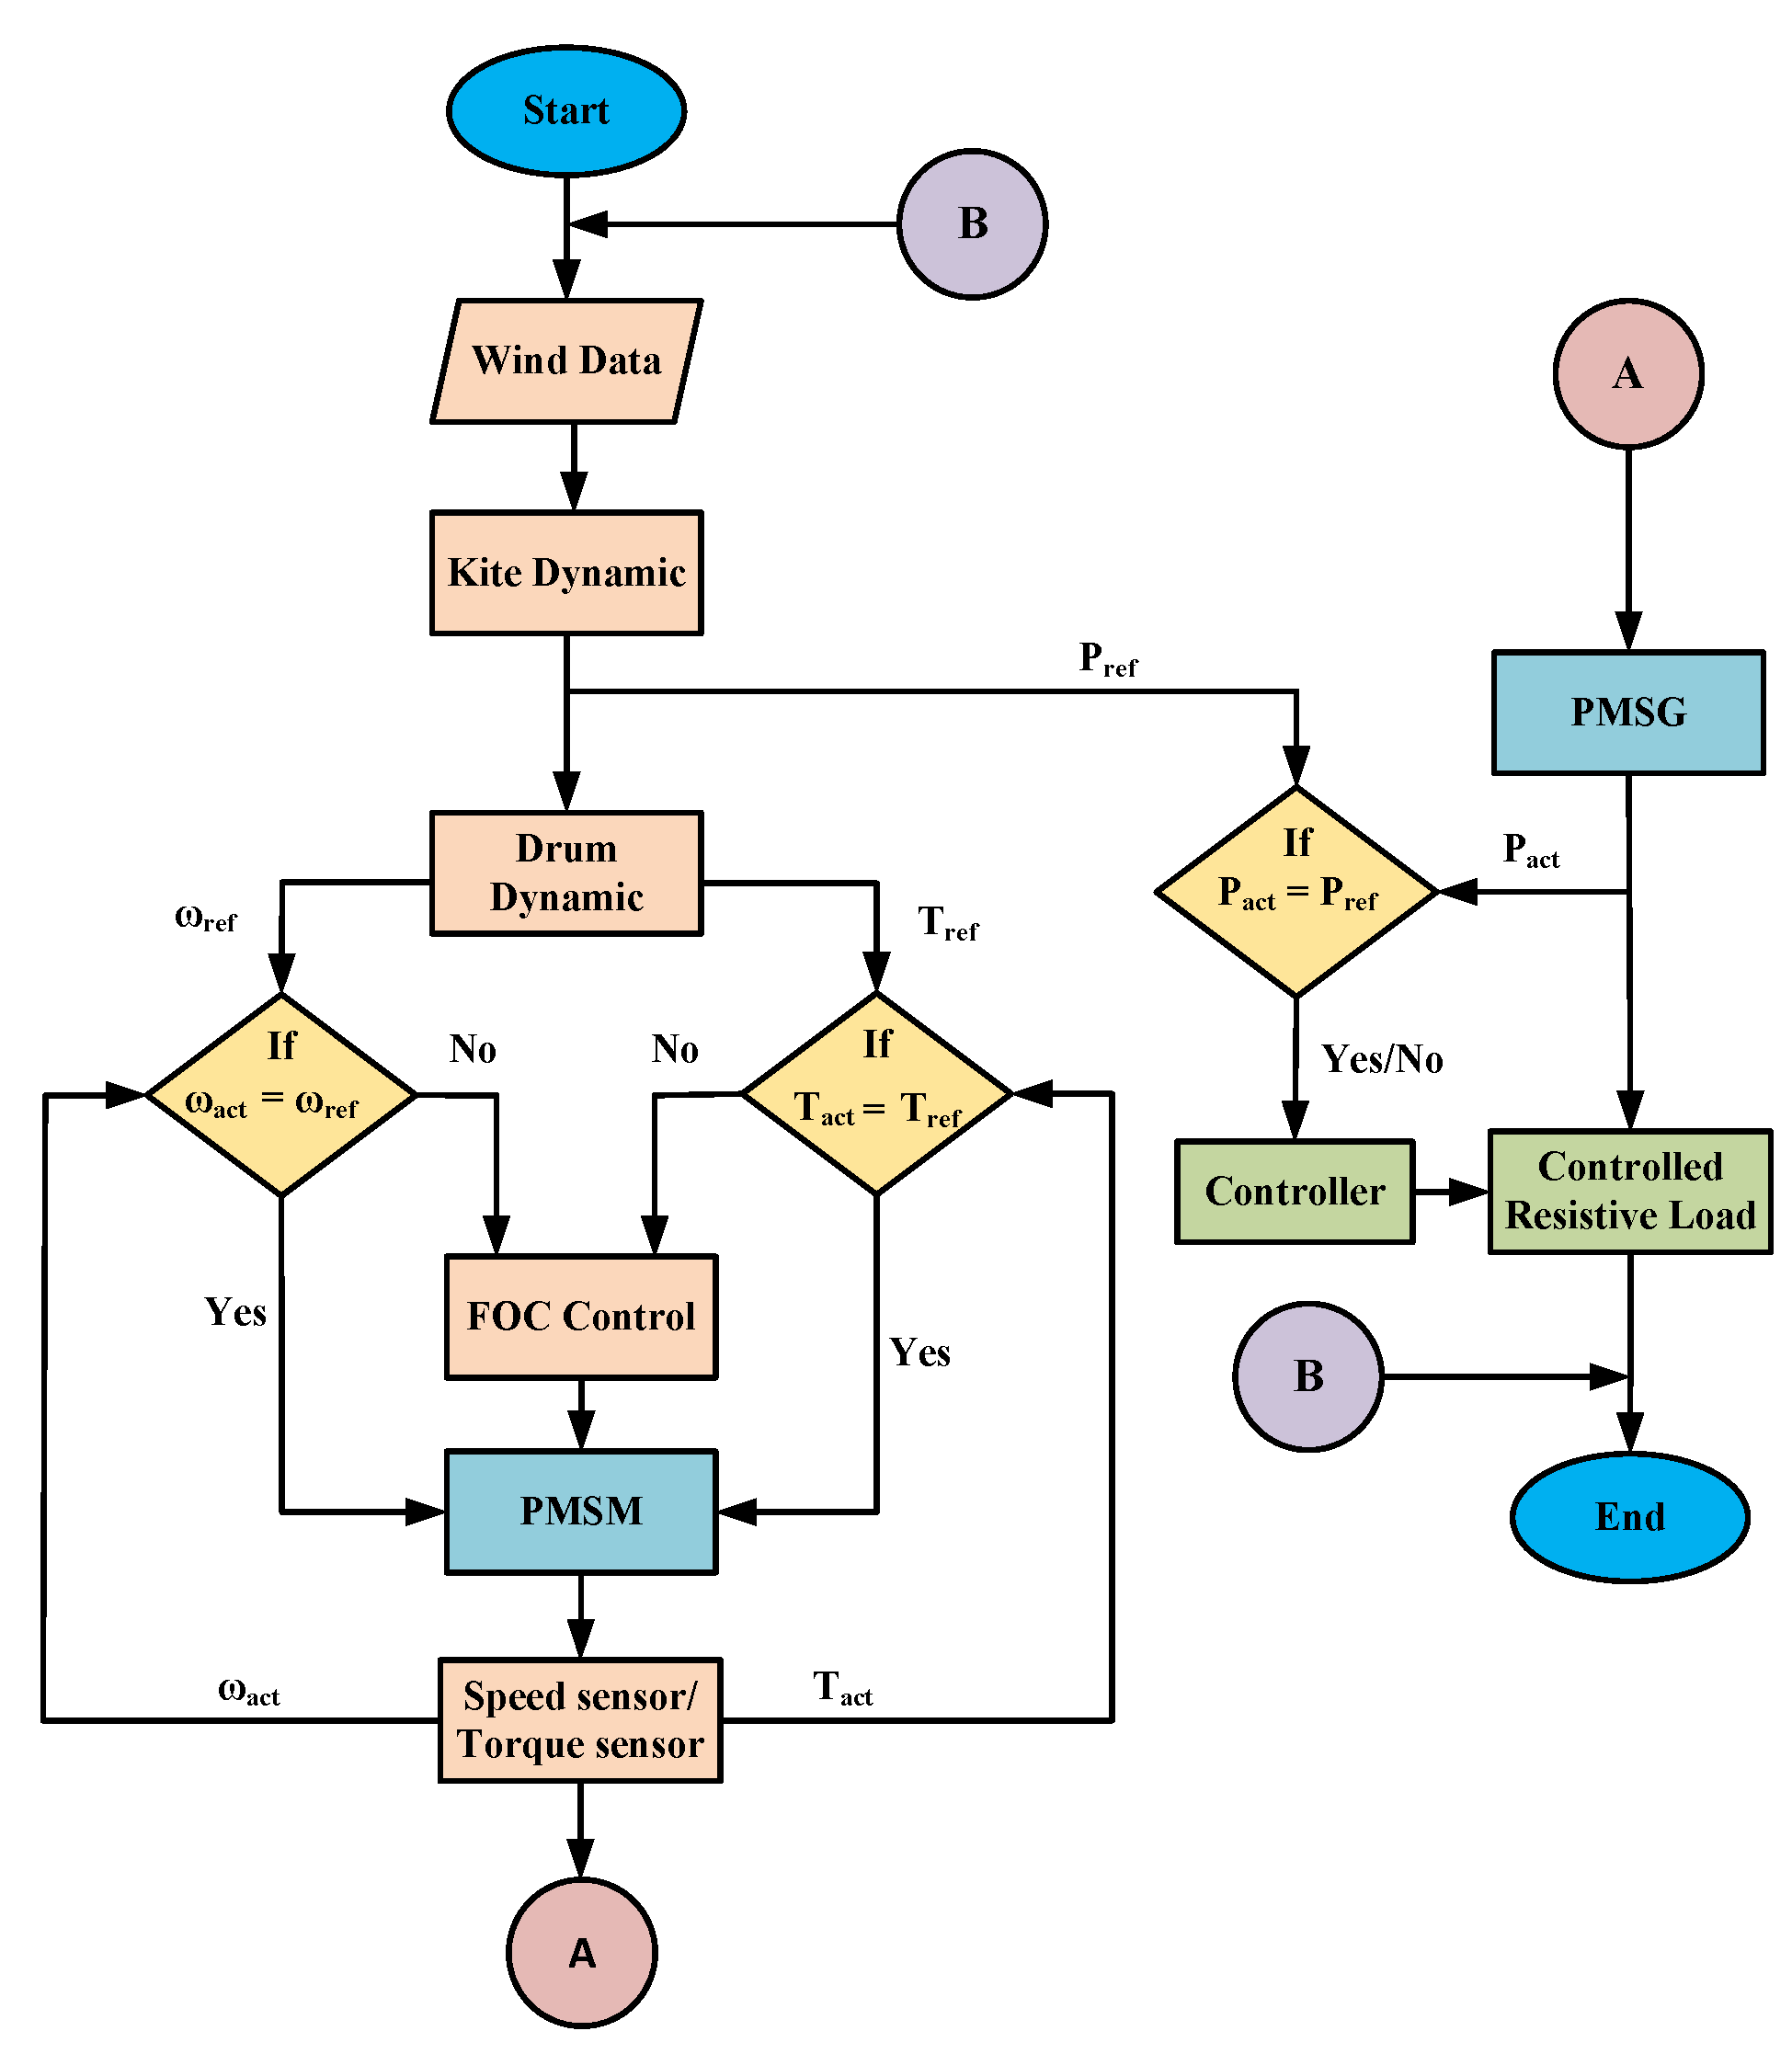
3.4. LAWECS Emulator Model

The LAWECS emulator system comprises a kite model system, two PMSM, a three-phase power inverter, and four controllers. A PMSM is utilized to emulate the characteristics of a LAWECS. The PMSM is controlled by tracking the torque command of the kite-based AWE turbine for a given set of inputs. The PMSM achieves a precise torque using the FOC technique, ensuring a high-performance operation. The overall control mechanism of the developed PMSM-based LAWECS system is illustrated in Figure 9. The DC/AC Converter used the pulse width modulation technique in order to provide the motor with three-phase power. Determining the rotor angle is achieved by employing a sensing component integrated into the PMSM. This integration enables the mapping and measuring of the phase currents of the PMSM with a rotor reference frame. The current of PMSM is controlled by maintaining the direct-axis current at zero and ensuring that the quadrature-axis current is sufficiently high to generate the desired reference torque at any speed equal to or below the motor speed. The emulator is coupled with a PMSM serving as the generator. The load controller controls the three-phase resistive load. In the outer speed control loop, the reference speed ( ω r e f ) is a comparison with the real speed ( ω a c t ) to determine the speed error. The speed deviation is amplified in the current feedback loop with proportional and integral gains prior to being represented as the q-axis current. The torque generated by the PMSM is determined by the magnitude and polarity of the reference current. The PMSM’s output torque gradually increases the rotating speed until it reaches the set point. The torque along the quadrature axis may be controlled independently by setting the d-axis current controller’s reference to zero.
Figure 10 illustrates the speed control loop that is part of the FOC approach. The calculation of the error in the measured speed involves a comparison between the reference speed ( ω r e f ) and the actual speed ( ω a c t ). The speed error undergoes proportional and integral amplification and is performed before the q-axis current enters into a current feedback loop.
The power output control loop is illustrated in Figure 11, where a comparison is made between the reference kite power ( P r e f ) and the generator output power ( P a c t ).
This comparison allows for the determination of the error in the generator’s output power. After adjusting the output power using proportional and integral gain, it is then fed into the power-feedback loop and referred to as the load power.
Table 2: System simulation parameters for laboratory-scale airborne wind energy conversion system, as shown in the table below:

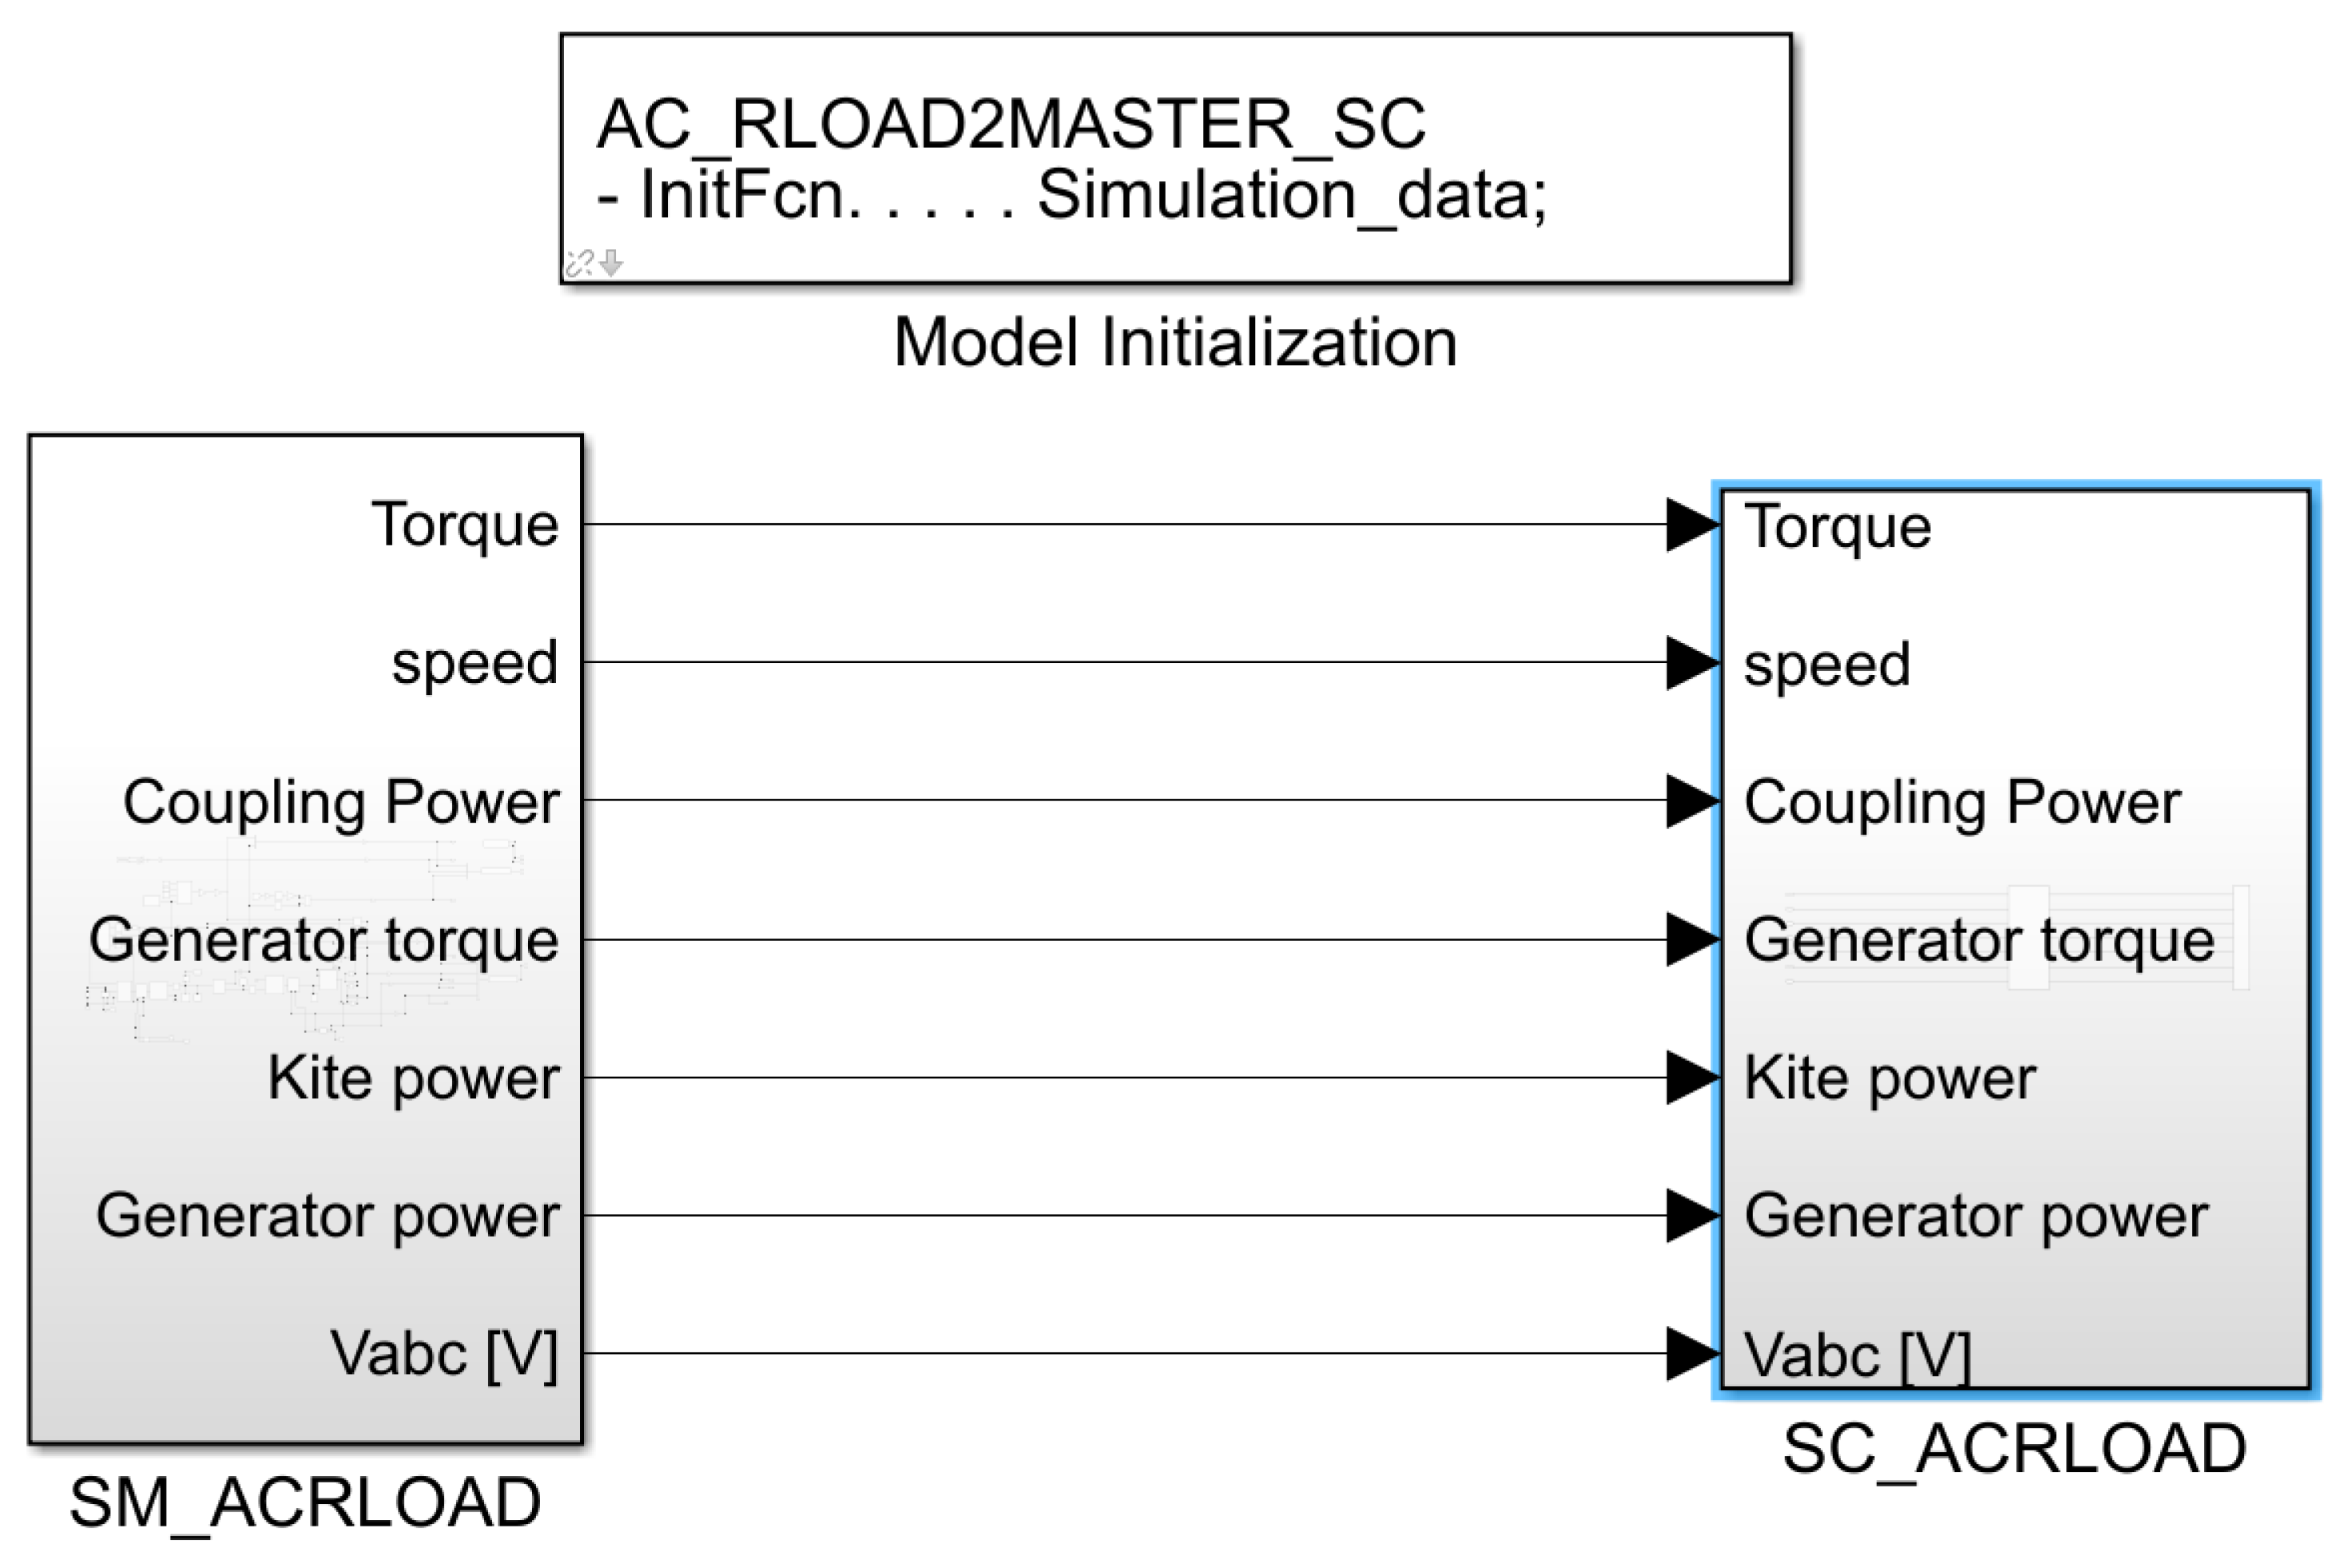
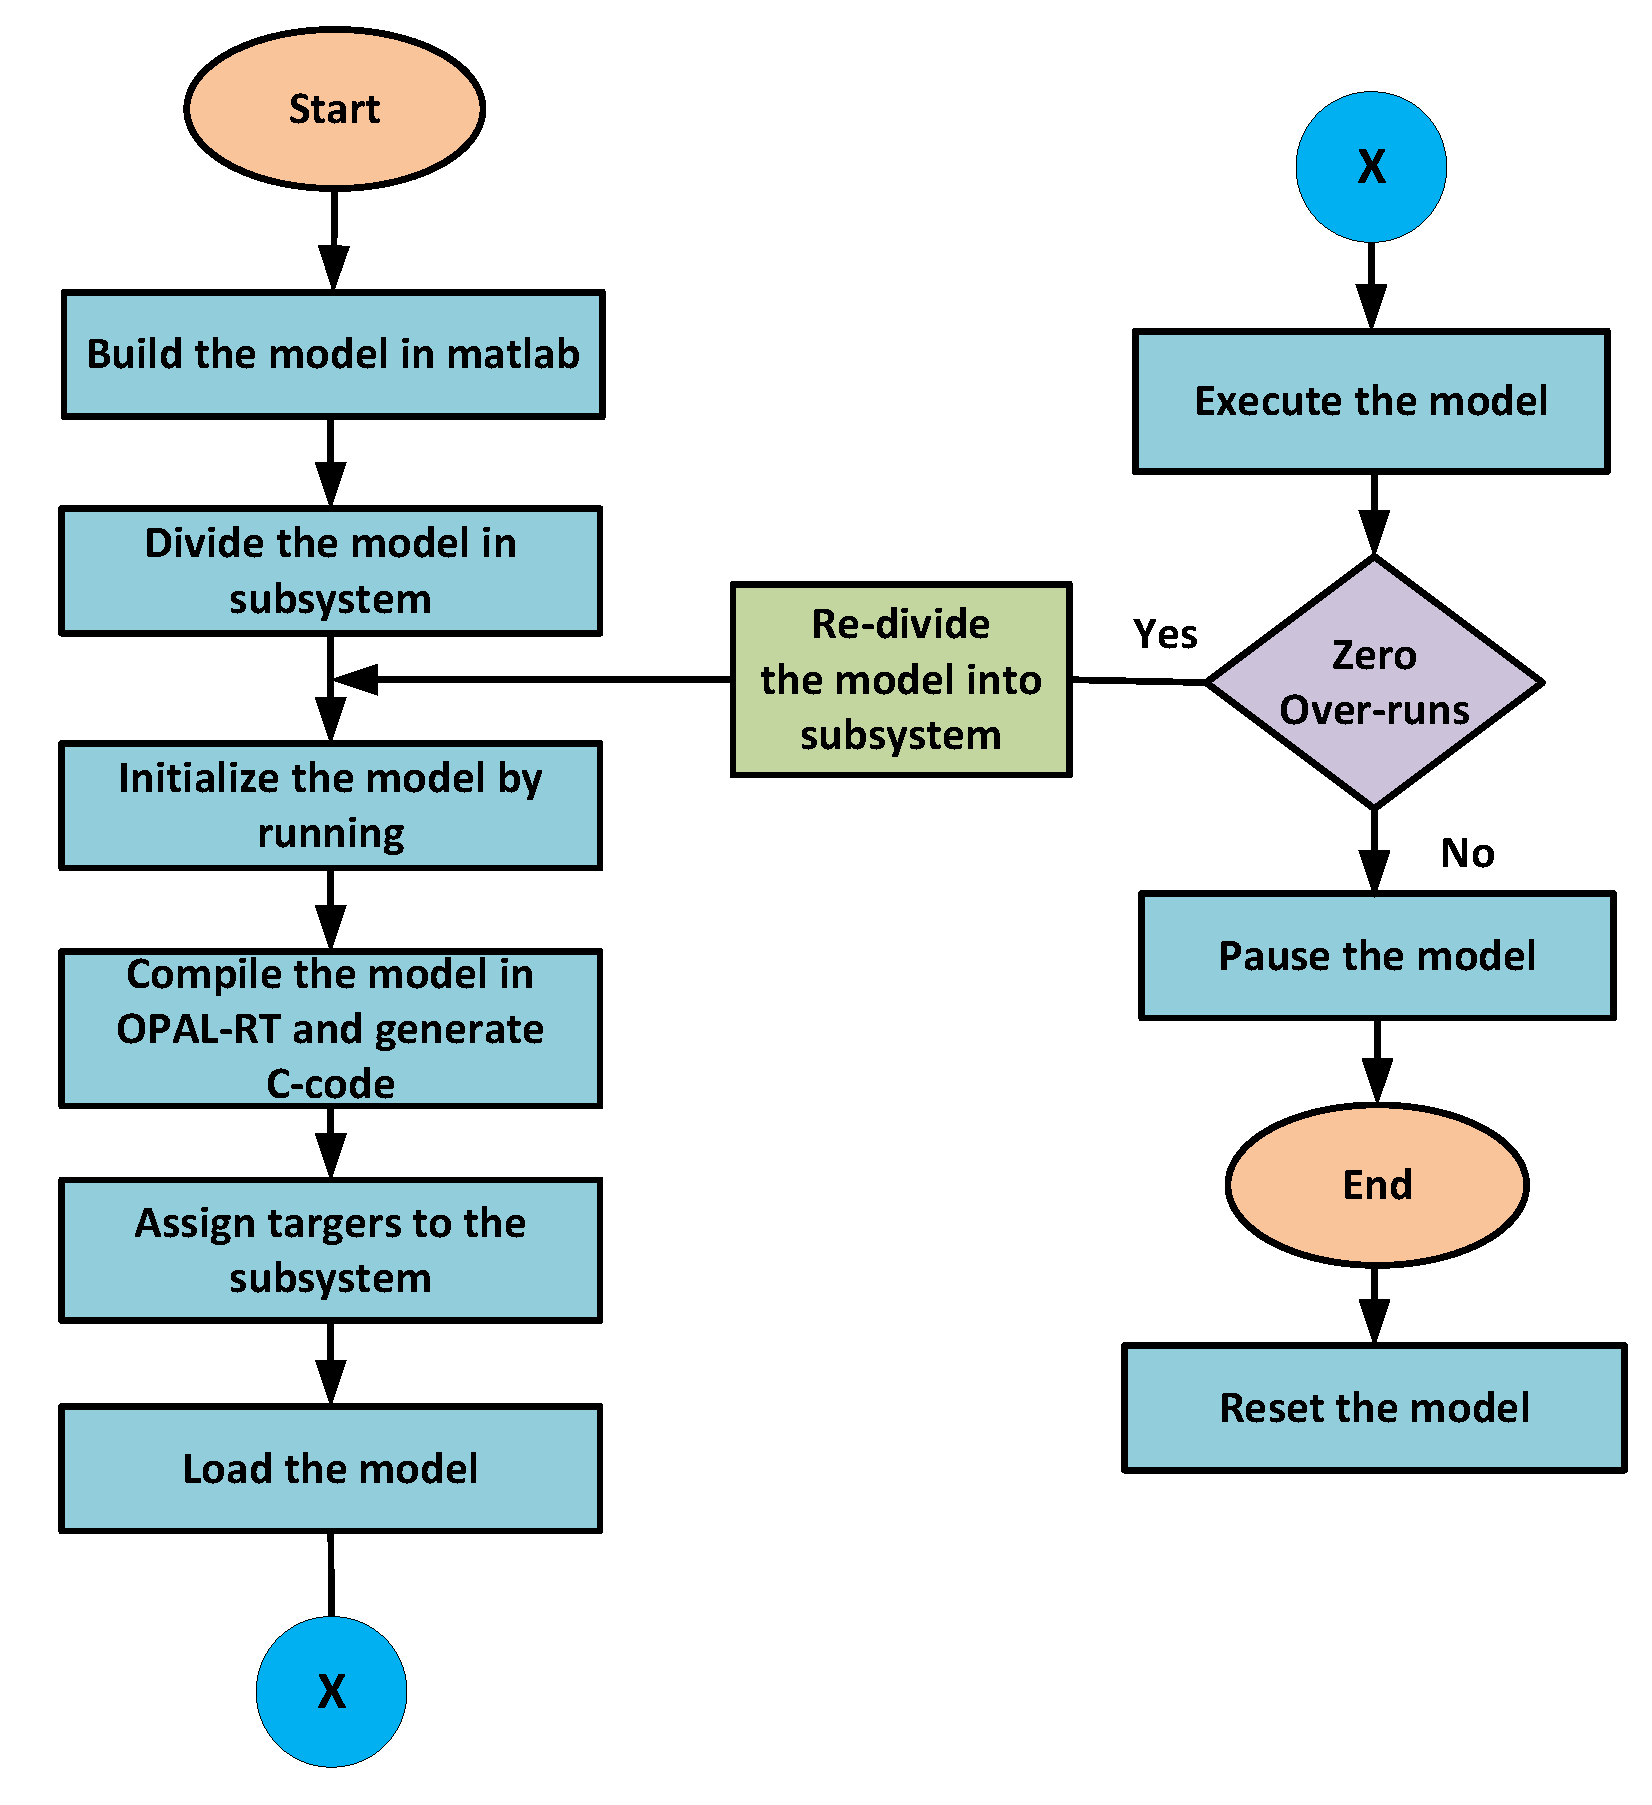
3.5. Depiction of LAWECS Model for Real-Time Simulation

OPAL-RT provides a platform for designers to demonstrate their work in a realistic environment. As shown in Figure 12, the model is divided into two subsystems. The first subsystem is referred to as the master subsystem (SM).
The SM Model subsystem, which includes all counting squares, operates continuously on the target processor with a consistent supporting framework. On the other hand, the console subsystem, named SC Model, contains everything required to display and control a specific set of indicators and runs in the background on the host PC. The summon station backs the comfort subsystem of OPAL-RT and communicates with the LAWECS framework. Most of the insights in the display squares are transmitted through I/O channels for monitoring and recording by a Digital Storage Oscilloscope (DSO). A real-time simulator enables the creation of a computer model based on a real physical system, which can be executed on a computer in synchronization with real-time operations. RT-LAB is a comprehensive platform designed for the real-time simulation of block diagram models. It offers fast and automated implementation. RT-LAB is an open, fully integrated real-time simulation software environment that has revolutionized model-based design. It seamlessly integrates with MATLAB/Simulink, providing flexibility and scalability for various simulation and control system applications. With the ability to add computing power as needed, RT-LAB enhances simulations and offers a versatile platform for efficient and comprehensive model-based design. After using Matlab/Simulink for LAWECS modelling and testing, this model is used to automatically create the code, which is compiled and sent to RT-LAB. When the code is made, it must be sent to OPAL-RT to be used in RTDS.
Comparing MATLAB simulations with RTDS (Real-Time Digital Simulator) simulations can indeed provide several advantages, despite both being simulation tools.
  • Validation: RTDS simulations are used to validate MATLAB models. The real-time simulation results can be considered as a reference or ground truth against which MATLAB simulations are compared for validation purposes.
  • Accuracy and Fidelity: MATLAB may not accurately simulate system behaviour. RTDS, on the other hand, is developed for real-time power system simulation, and results are typically more accurate.
  • Real-time response: RTDS is designed to run simulations in real time, making it suitable for testing and validating control systems and protection schemes. MATLAB simulations might not provide real-time responses, which can be crucial for assessing the performance of control algorithms and devices in real-world scenarios.
The laboratory setup is depicted in Figure 13 and shows the real-time experimental results’ validation of the presented LAWECS emulator. To examine the suggested LAWECS emulator, a small-scale prototype was constructed. Further, a real-time OPAL-RT simulator was utilized to validate Matlab simulink results.
The model execution in RT-LAB follows a flow chart, which outlines the sequence of steps involved. The steps to simulate the system in RT-LAB are depicted in Figure 14.

4. Simulation Result and Discussion

In this section, the results of the LAWECS emulator are presented and discussed. The emulator is connected to another permanent magnet-synchronous machine functioning as a generator. The generator is loaded with a controlled variable resistance. The LAWECS illustrated in Figure 9 was built and simulated using the Matlab/Simulink software 2022b. The same model was also implemented in the RT-LAB simulator, as shown in Figure 12. The results of the simulations were obtained considering variable wind speeds. The purpose of both the software and OPAL-RT simulations is to compute the power by taking in the parameters, and those parameters are listed in Table 2. The system simulation is performed using the Simulink programming environment of MATLAB 2022b and OPAL-RT operating system Linux 3.4.1, chassis type OP5033-XG with OP4520. We used a 20 µs step size for this simulation, using the Ode4 solver.

4.1. Kite Property Analysis

The reference [23] focused on optimizing kite parameters for power generation, achieving a 400 W power output at a wind speed of 5 m/s. However, our simulated findings indicate that, under similar wind conditions of 5 m/s, the model generates 800 W of power and extends beyond this point, demonstrating the scalability of our model up to 60 kW with a kite area of 70 m 2 when operating at a wind speed of 10 m/s.
The dynamic behaviour of LAWECS was studied using MATLAB SIMULINK and validated through a real-time OPAL-RT simulation. We have taken a signal builder block from the simulink library browser and set the wind speed to be from 1 m/s to 10 m/s. The impact of wind speed on various parameters such as tether force, kite power, drum speed, and drum torque is depicted dynamically in Figure 15 and Figure 16. The same parameters as those discussed in Section 3.1 were used for the kite and presented in Section 3.3 were used for the kite simulation model. Figure 15a,b shows the simulation results of wind speed and tether force, which are validated using the real-time simulation in OPAL-RT, as depicted in Figure 15c. The wind speed varies from 1 to 10 m/s in 8 s, and the tether force is directly proportional to the square of the wind speed. With this preset condition, the our proposed model yielded force measurements spanning from 24 N to 1.2 kN for a kite area of 10 m 2 . A similar study [48] was conducted for the AWE system using a 6 m² kite prototype with wind speeds ranged from 5 m/s to 7 m/s, resulting in measured forces generated between 1 kN to 2.5 kN. Figure 15d show the drum torque, which changes according to the wind speed. The drum torque generated at 1 m/s is 6 Nm, whereas at 10 m/s, it is 160 Nm. Figure 15e illustrates that the drum speed increases as the wind speed increases. At a wind speed of 1 m/s, the minimum drum speed generated is 30 rpm, while at 10 m/s, the maximum drum speed generated is 240 rpm. Figure 15f shows the real-time drum torque and speed simulation, with each division representing between 52 Nm and 81.67 rpm, respectively.
Figure 16a displays the drum power, and Figure 16b shows the reference (kite) power, which is a significant aspect of the electrical power generation from the kites. It varies from 10 W to 4 kW. Figure 16c illustrates the real-time simulation, with each division in the figure representing 1.36 kW. Figure 16d,e exhibit the reference speed and torque of the PMSM, respectively, using a six-gear ratio. It depends on wind speed; if wind speed increases, then the reference speed of the motor increases, and the reference torque decreases. From 1 m/s to 10 m/s, the speed varies from 230 rpm to 1500 rpm, while the torque ranges from 1.2 Nm to 26 Nm. Figure 16f illustrates the real-time simulation of the reference torque and speed, with each division representing 8.56 Nm and 500 rpm, respectively. These figures provide comprehensive visualizations of the respective parameters and their interrelationships in the study context.

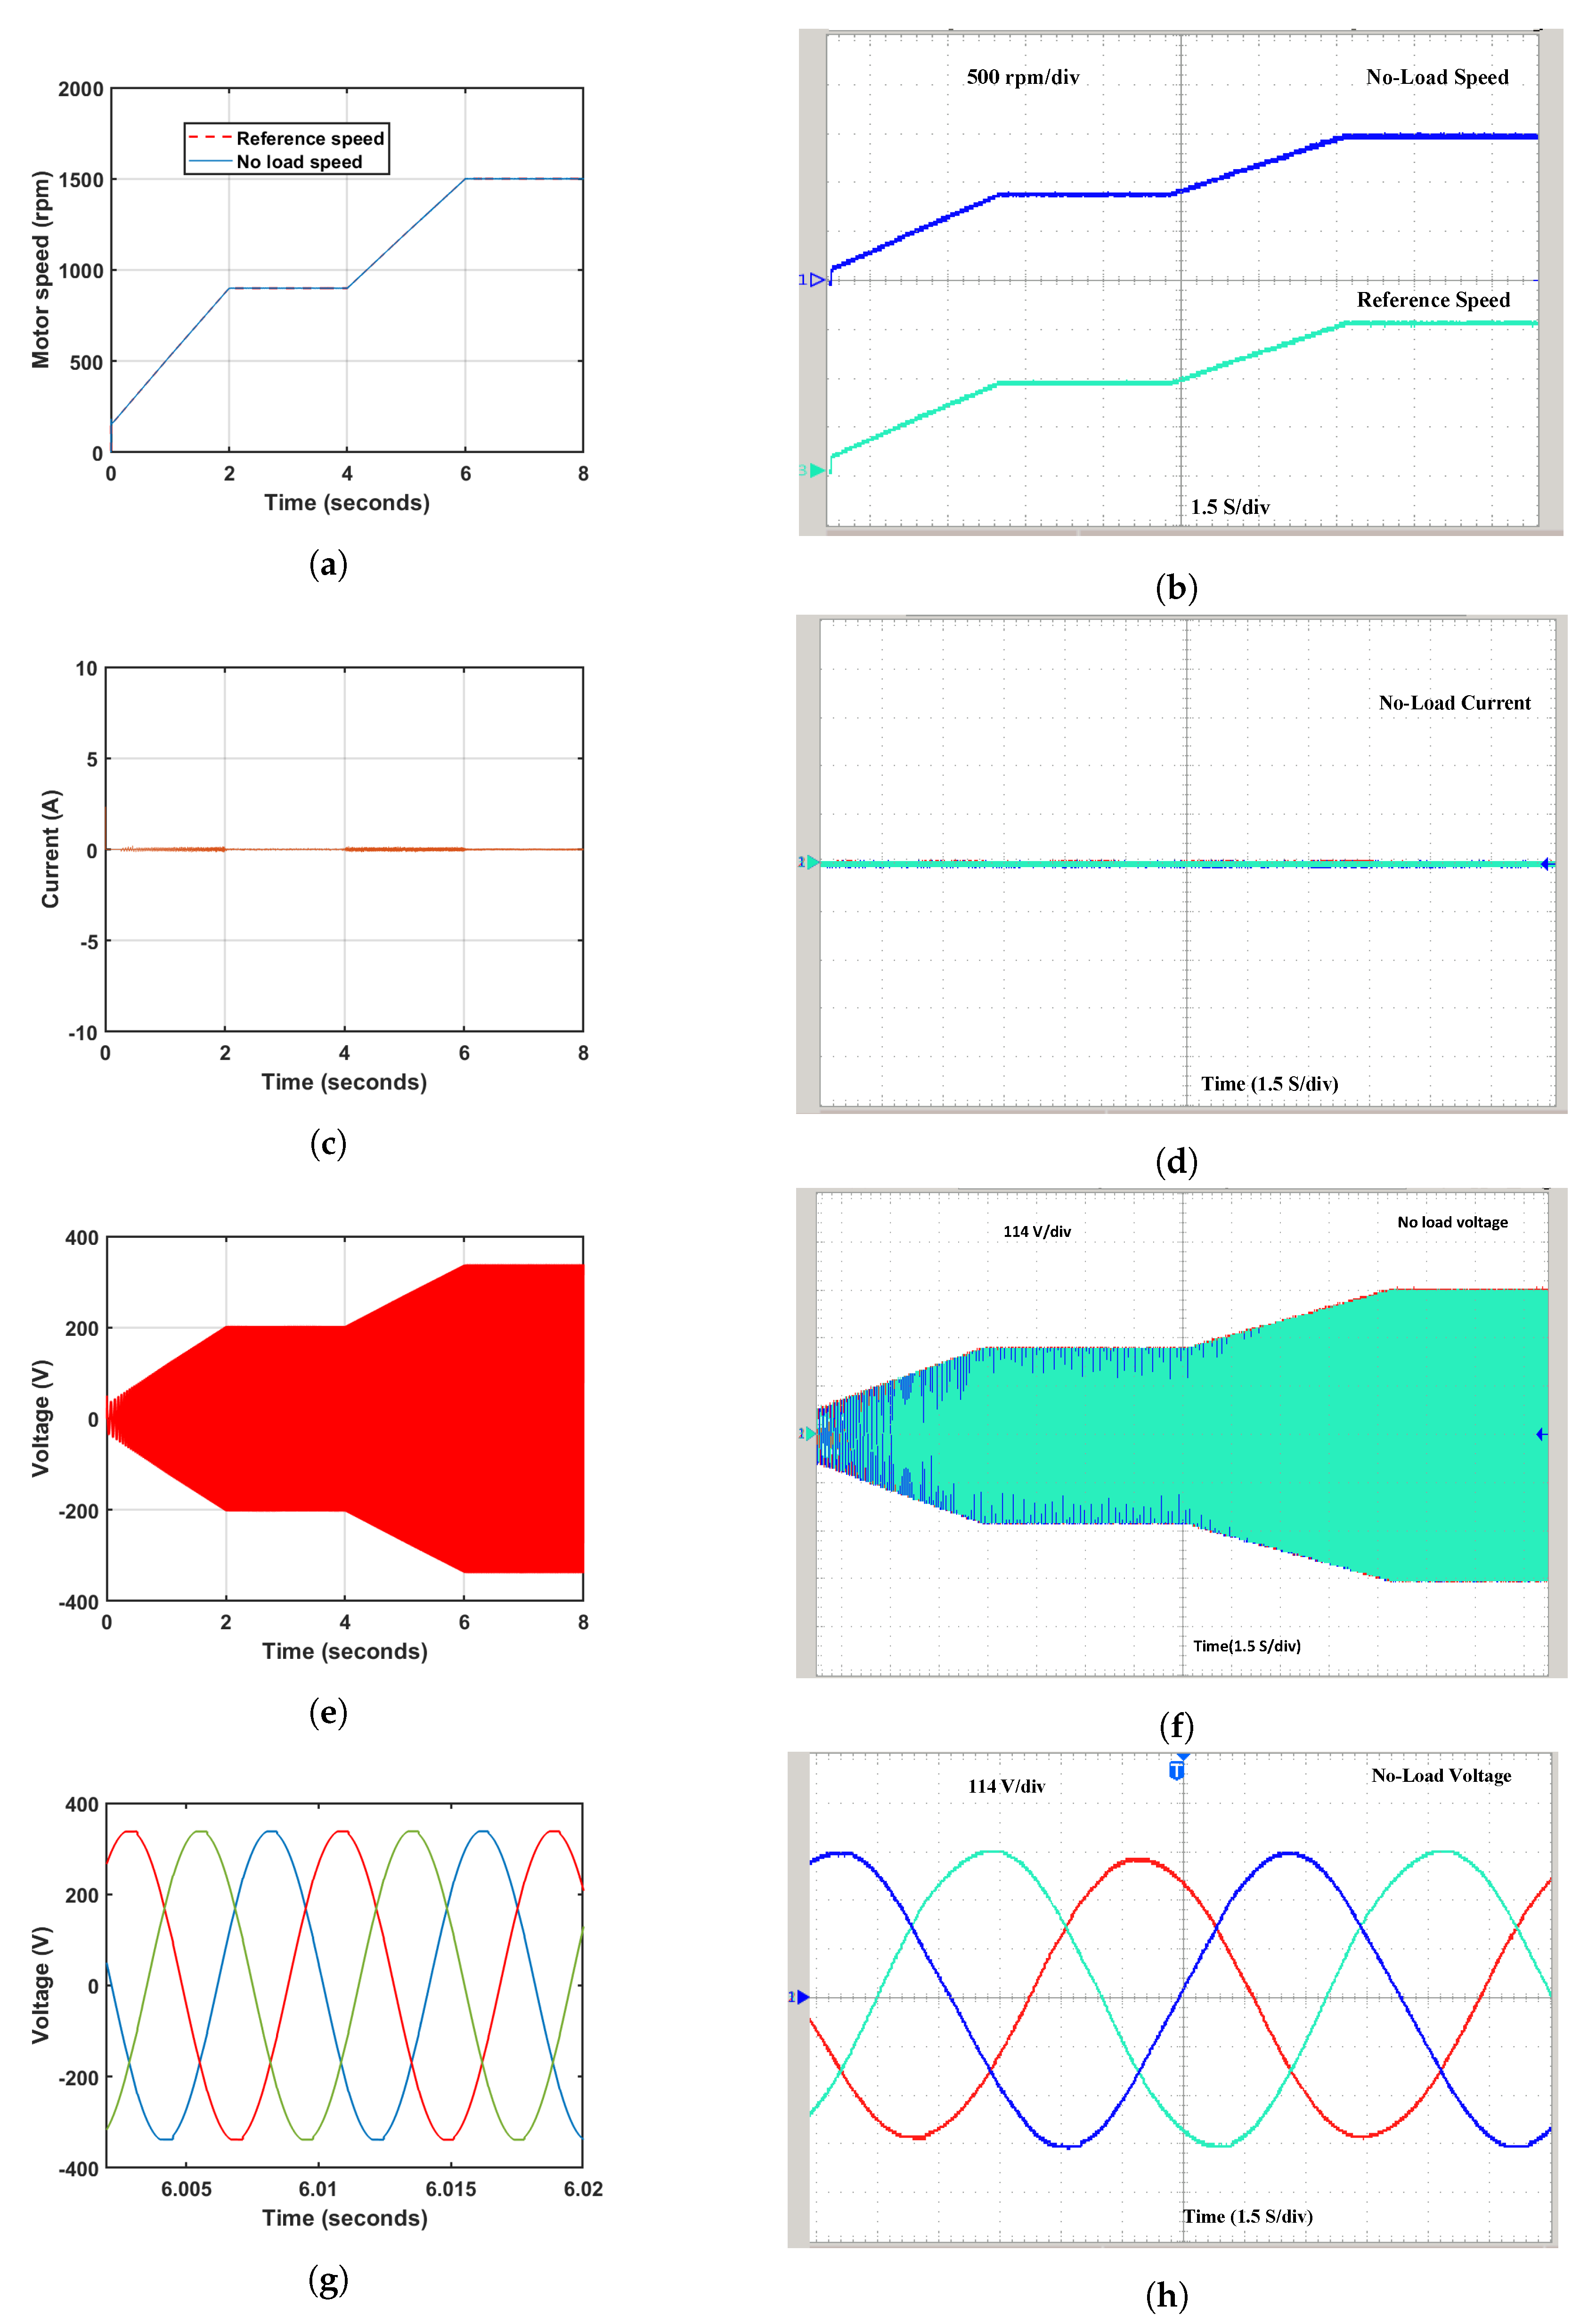
4.2. No-Load Test Analysis

Figure 17 shows the MATLAB simulink and real-time simulation results of LAWECS under a no-load test. Figure 17a depicts the machine’s speed at no load, which is equal to the rated speed of the devices. It varies from 230 rpm to 1500 rpm, the speeds of the motor, which is the same as the reference speed of the machine. Figure 17b depicts the real-time simulation of no load and reference speed, with each division in the figure representing 500 rpm, which is the same as the simulation results. Figure 17c,d illustrate the no-load current and the real-time no-load current, respectively. The results from both cases are matched, indicating that the no-load current is zero in both scenarios. Figure 17e shows the no-load generator voltage, which varies from 50 V to 375 V in 0 to 8 s at the corresponding wind speed, while Figure 17f depicts the three-phase zoom voltage of the generator. The simulation results for the no-load analysis are validated using a real-time OPAL-RT simulator, as shown in Figure 17g,h displaying the no-load voltage, which changes from 50 to 375 Volts, with each division representing 114 Volts.

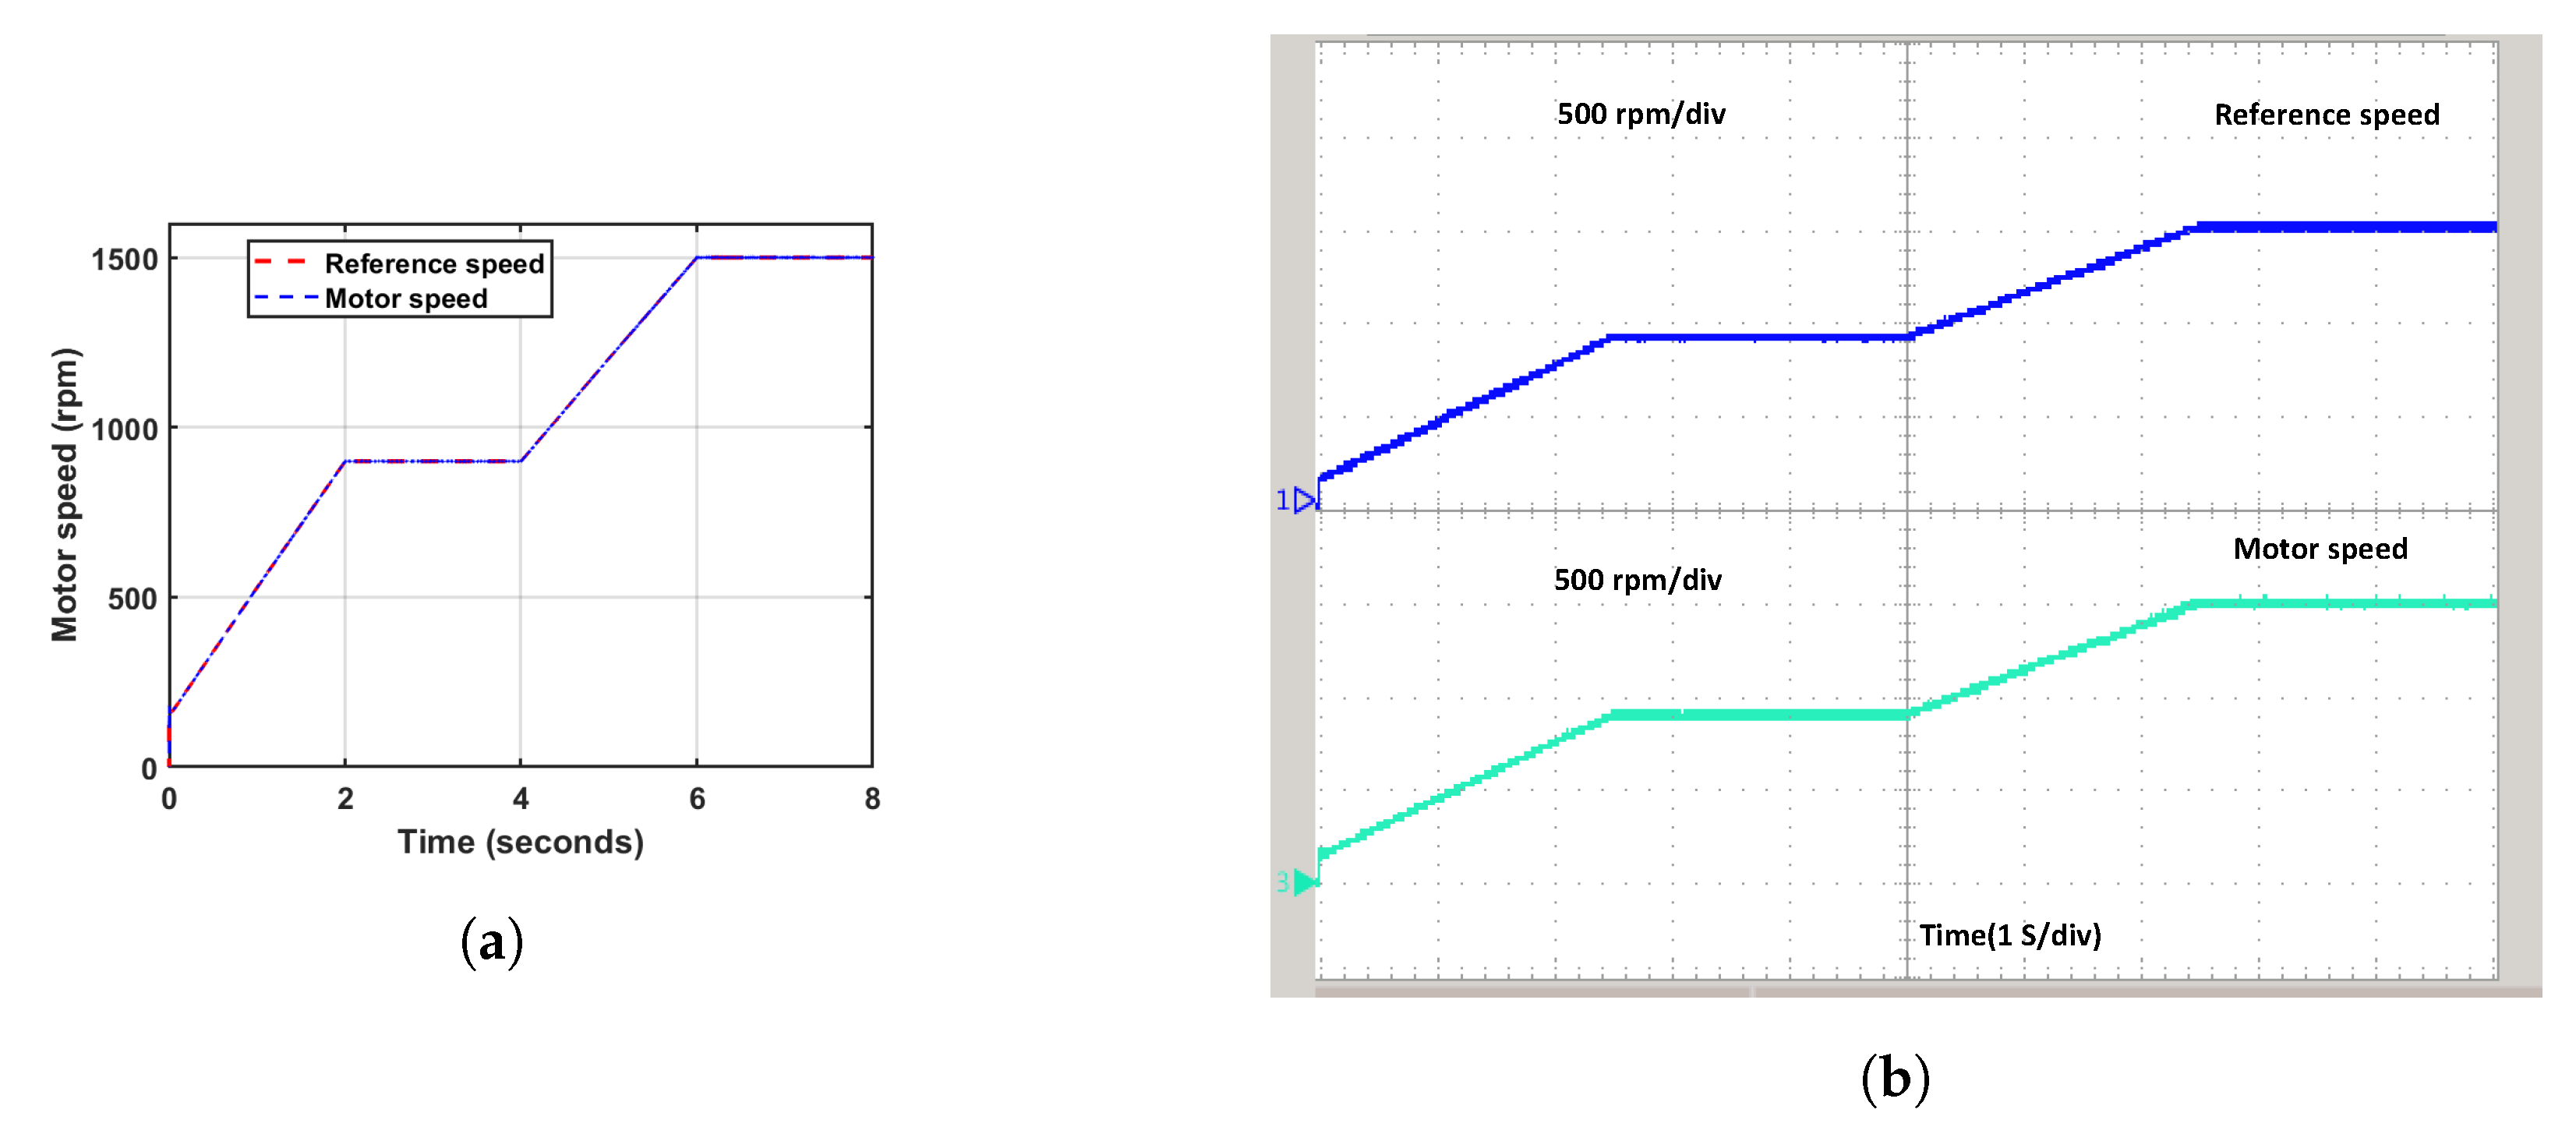
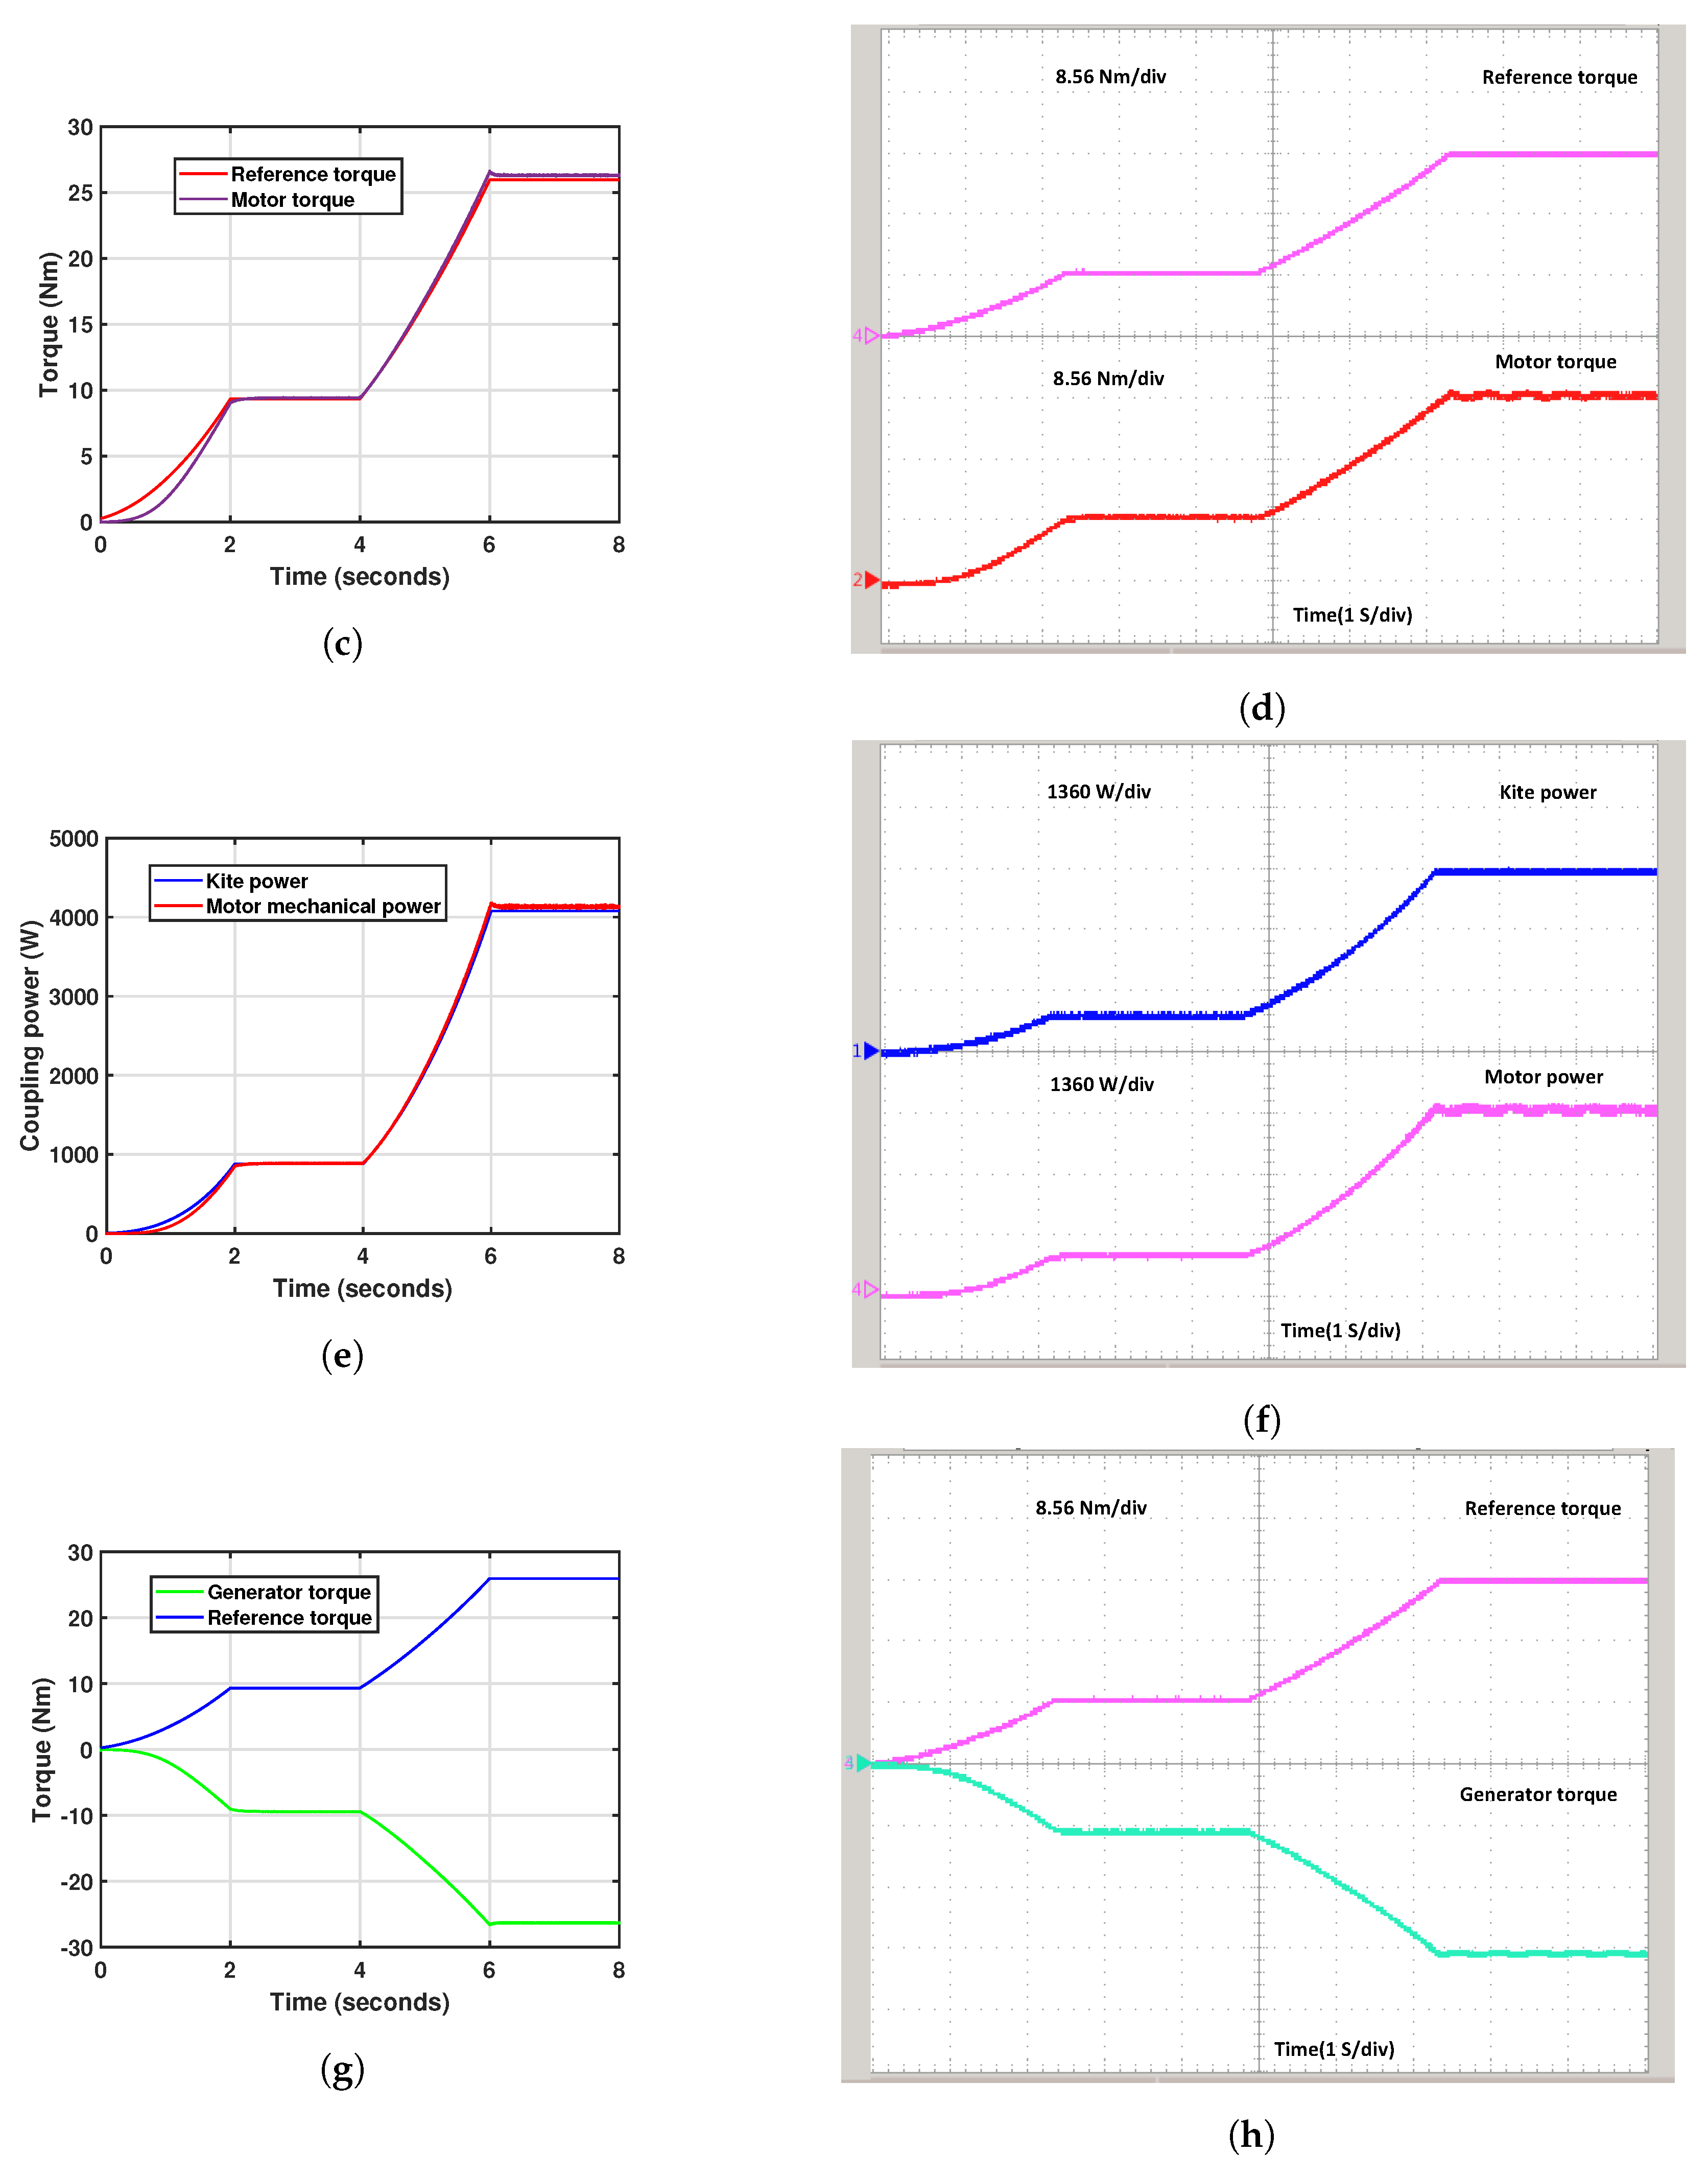
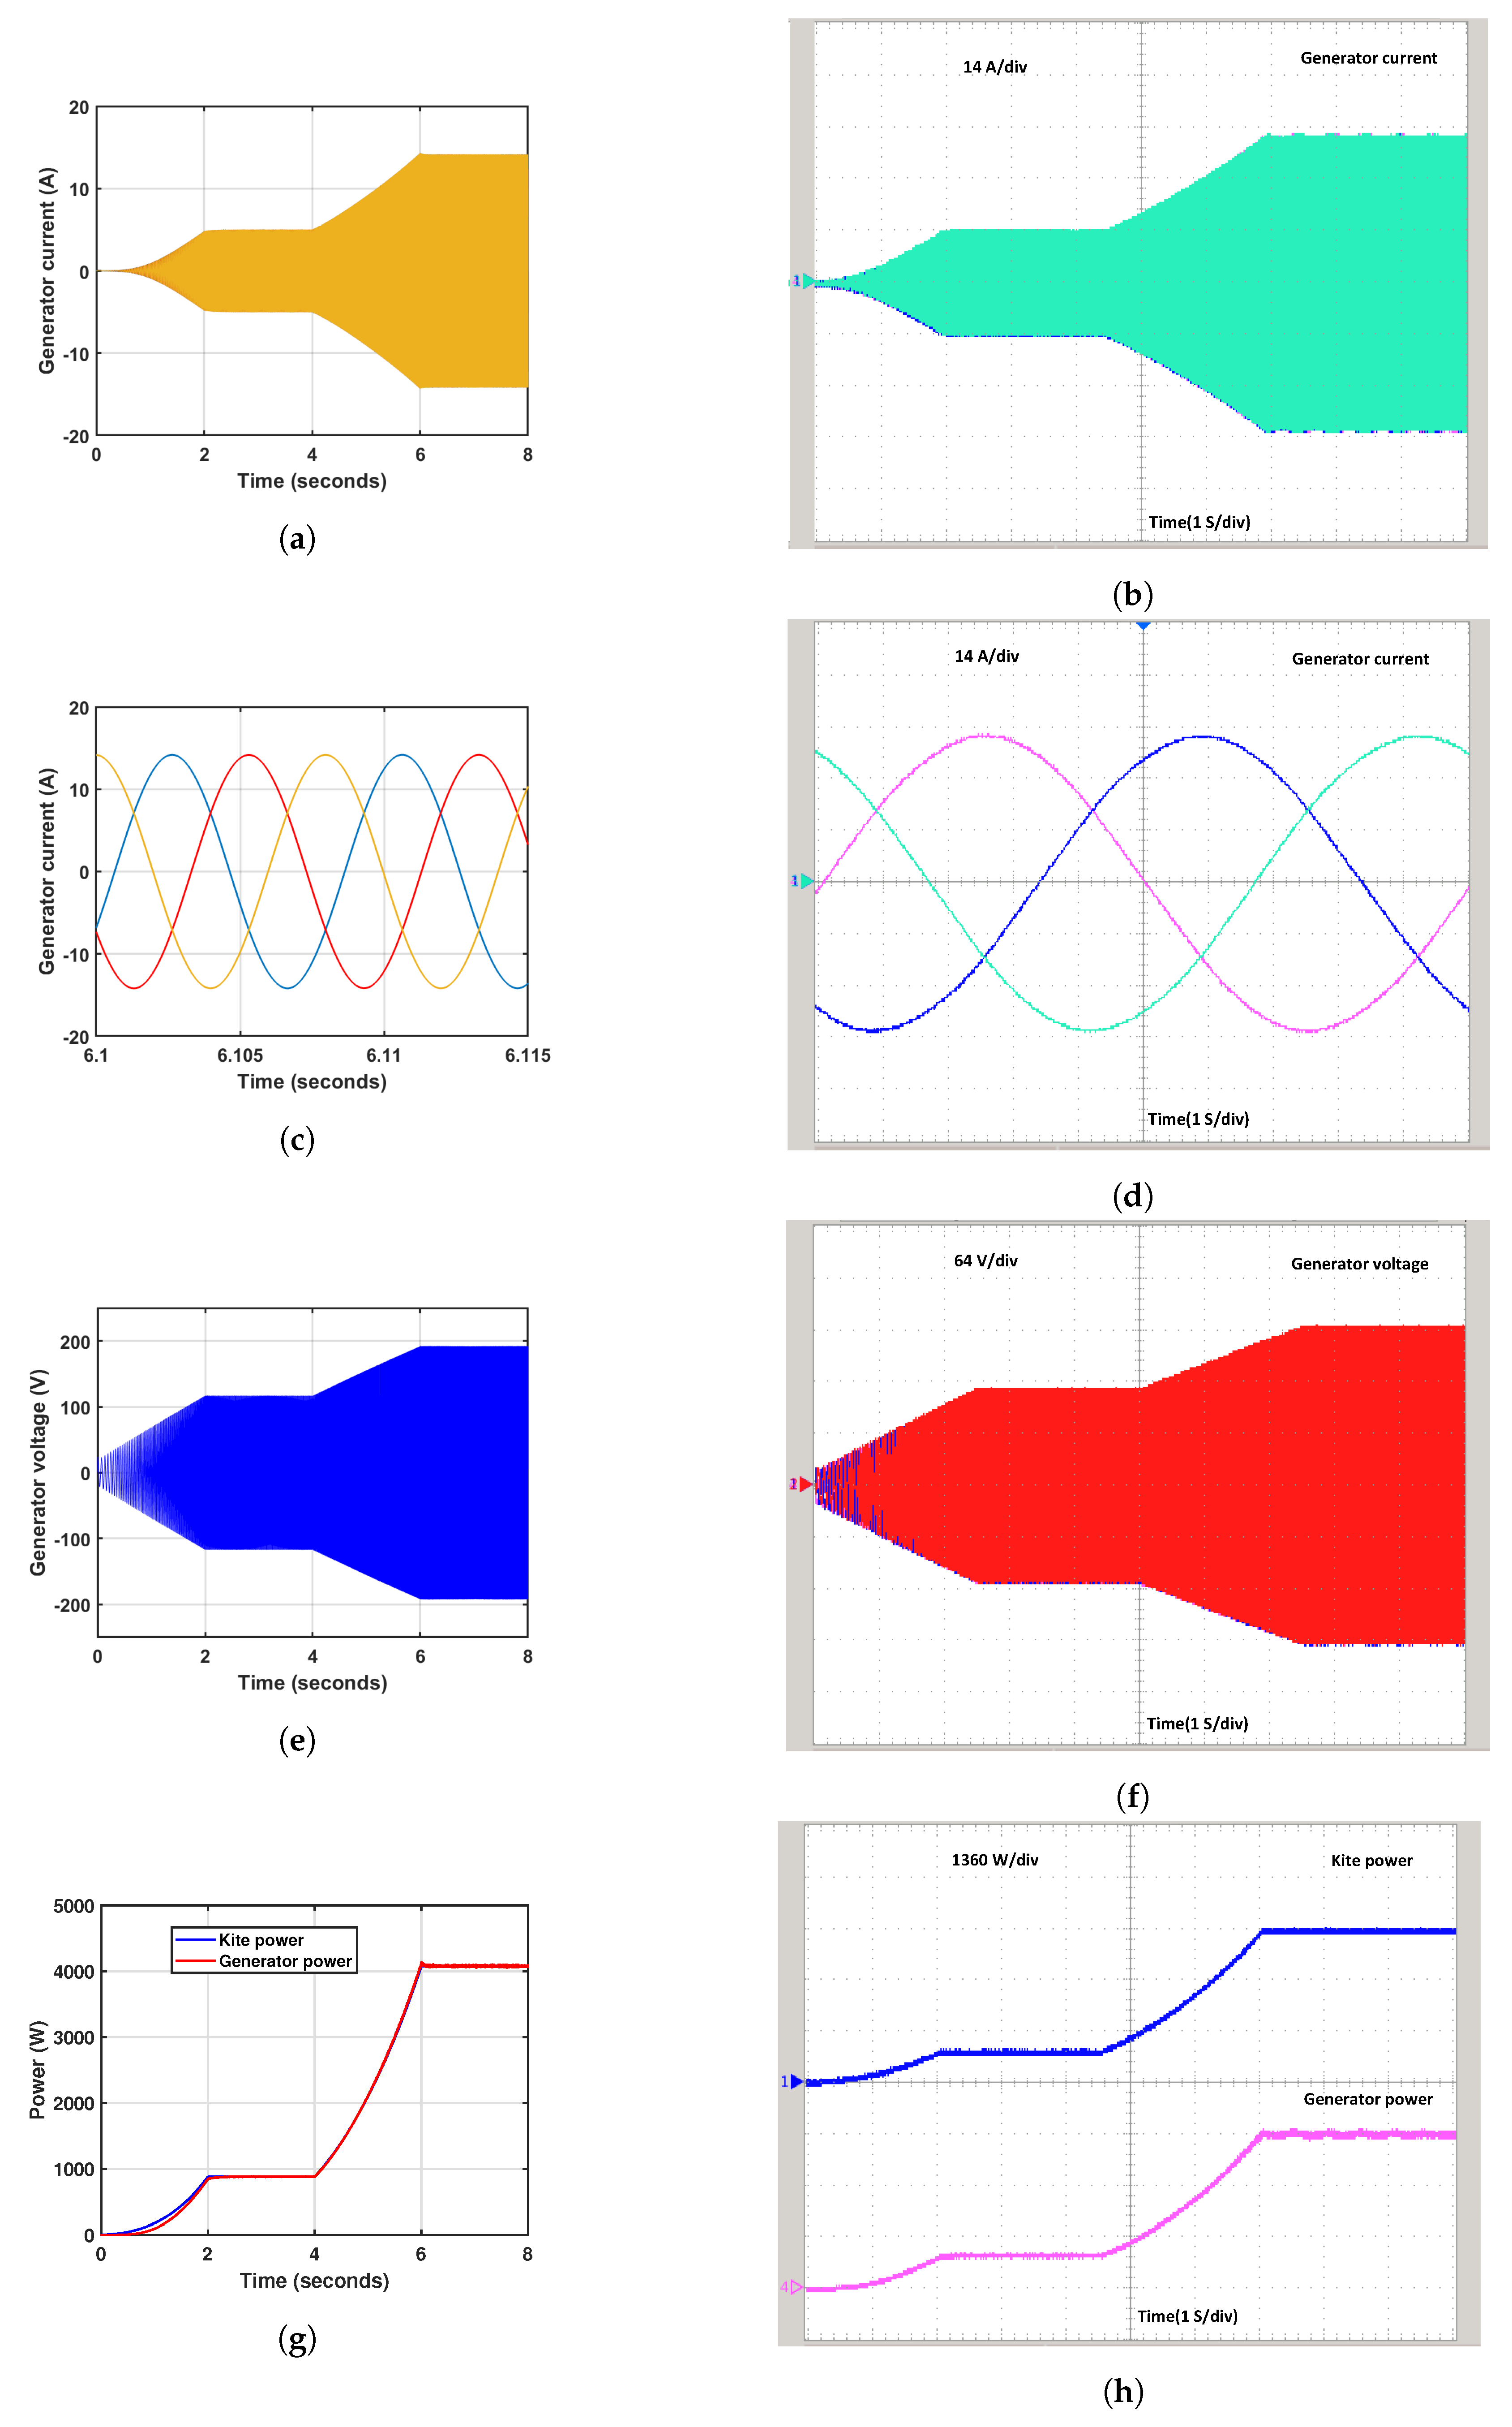
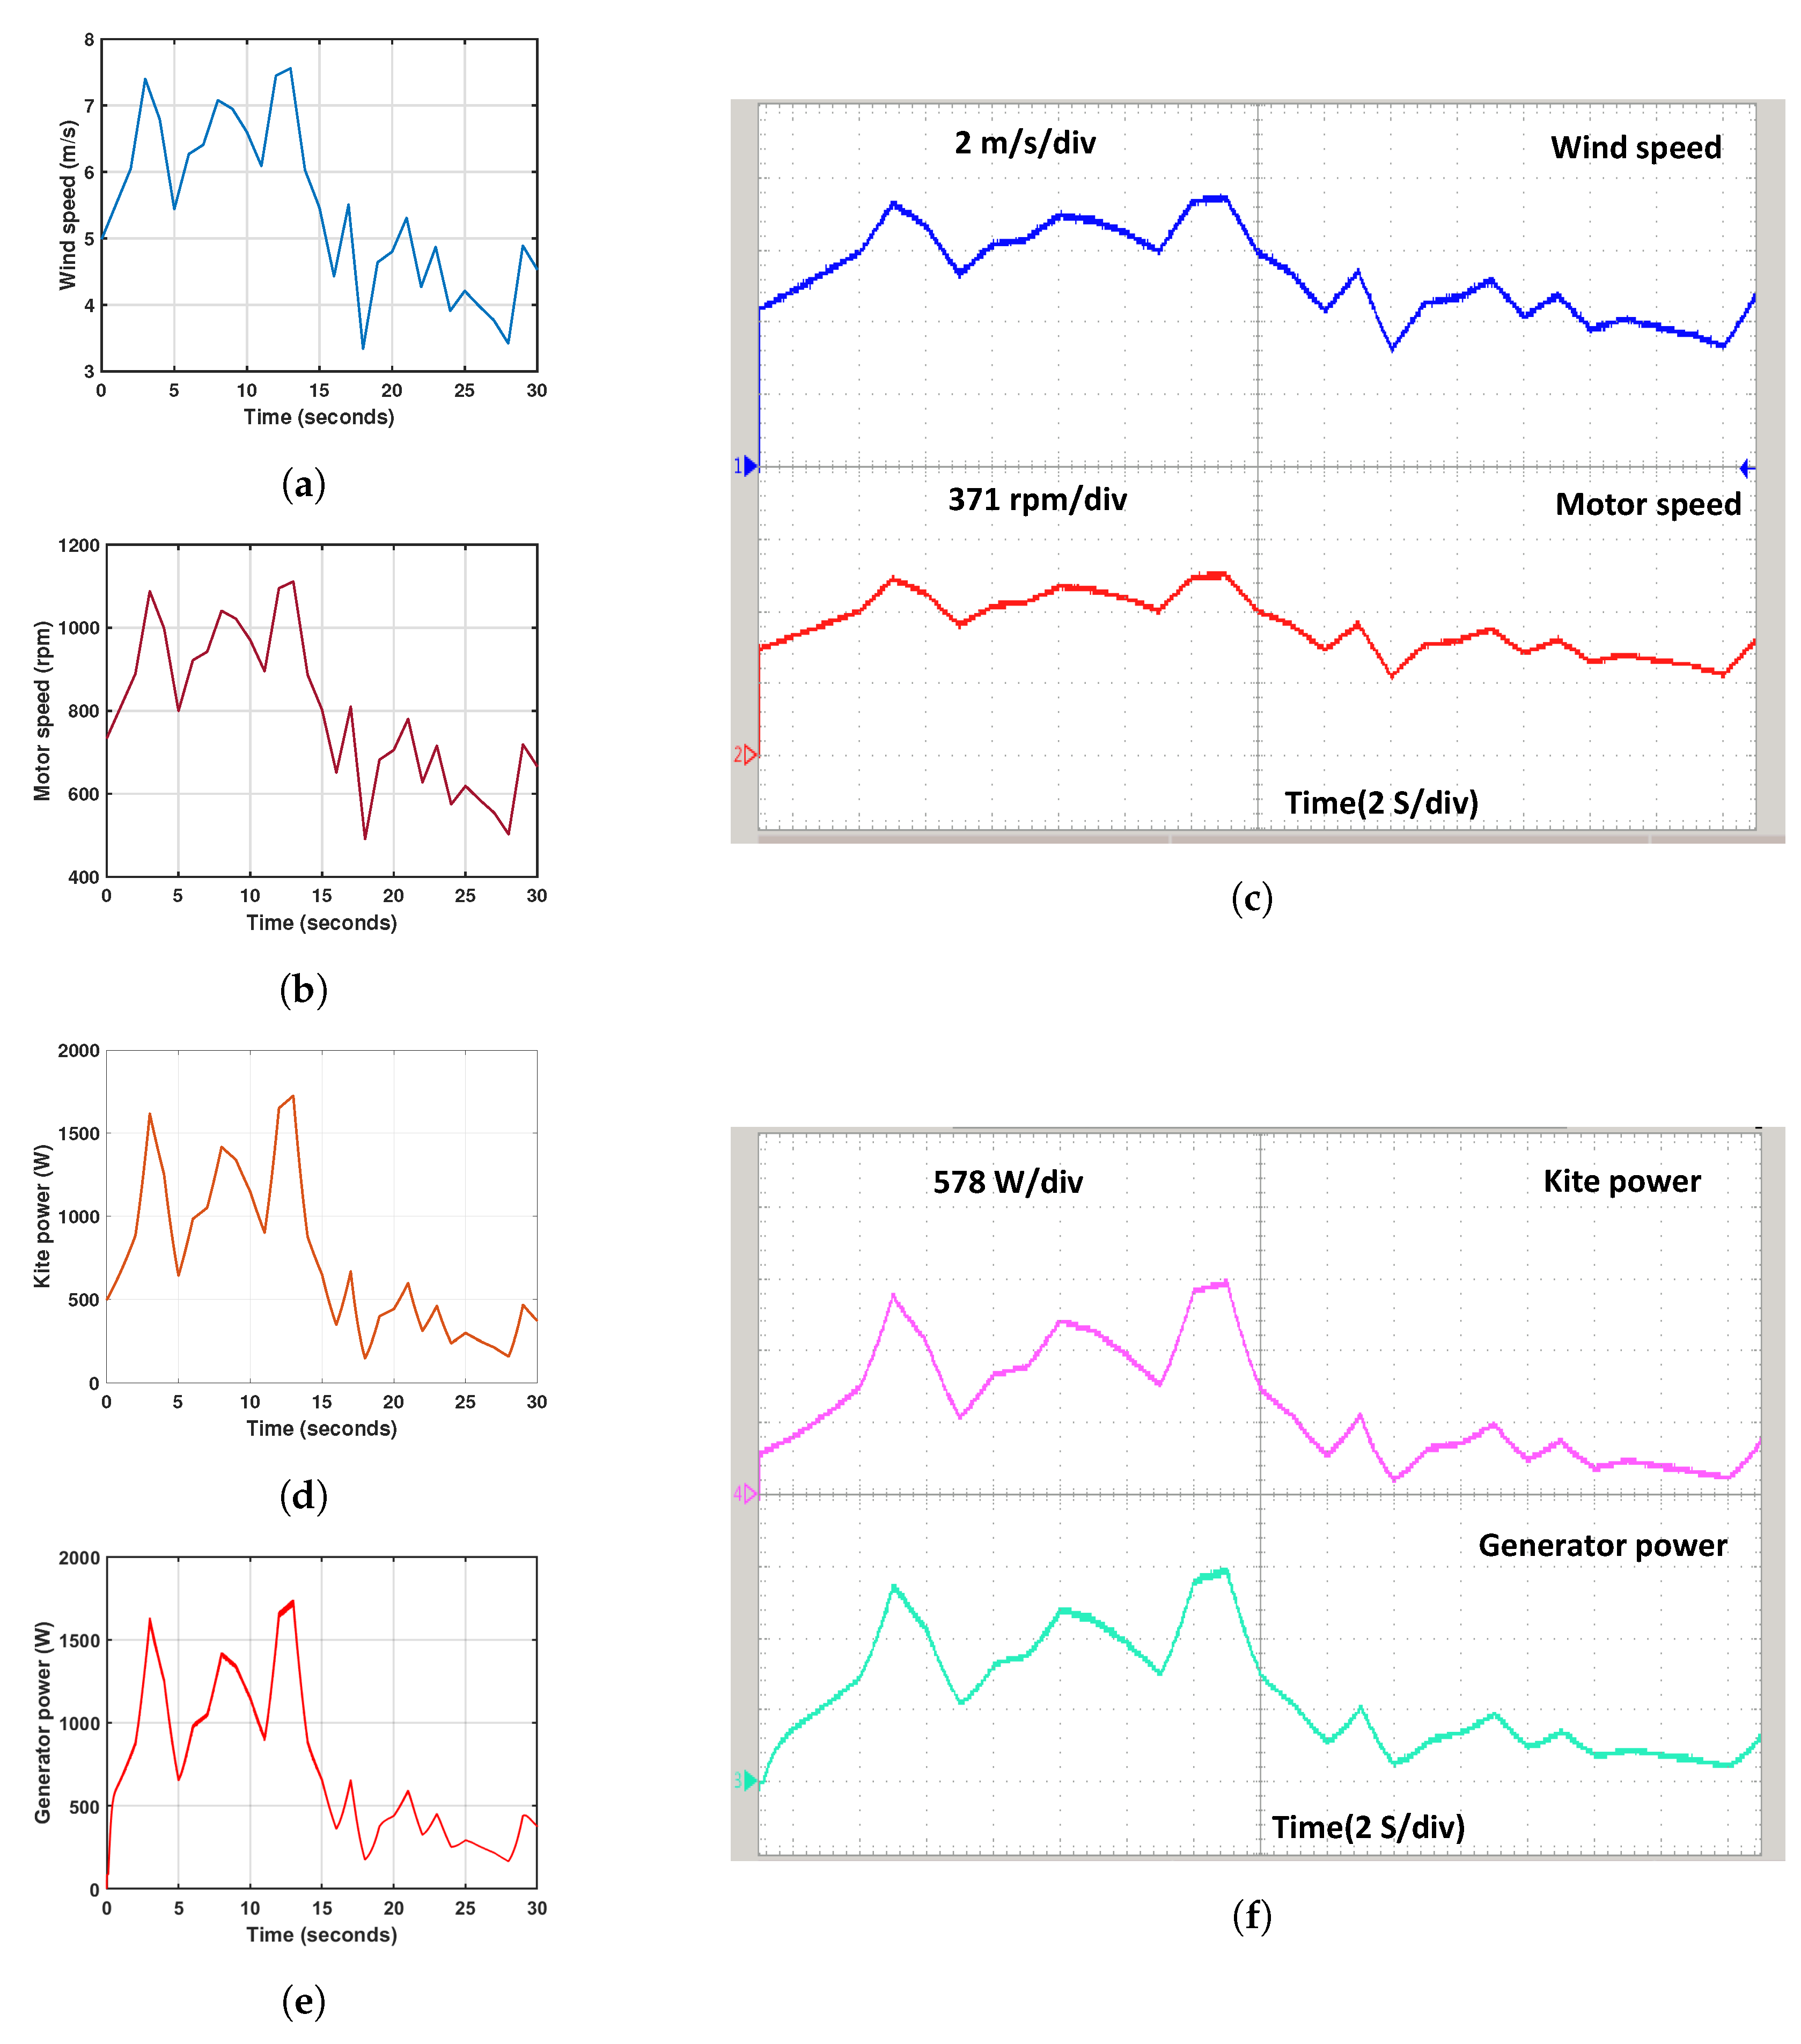
4.3. On-Load Test Analysis

Figure 18 and Figure 19 depict the on-load test analysis at the PMSG terminal. Figure 18a presents the variation in the coupled motor speed. The red waveform shows the reference speed, and the blue waveform shows the speed of the PMSM. At a wind velocity from 1 m/s to 10 m/s, the motor speed changes from 230 rpm to 1500 rpm within 0 to 8 s, which tracks the motor reference speed. Figure 18c illustrates the coupling torque between the motor and the generator. It varies from 1 N to 26 N when the wind speed varies from 1 m/s to 10 m/s, accurately tracking the kite’s reference torque. Figure 18e depicts the coupling power between the motor and the generator, varying from 25 W to 4000 W when the wind speed increases from 1 m/s to 10 m/s, and it precisely tracks the reference kite power. As observed in Figure 18e, the generator torque is the opposite of the motor torque. When the wind speed varies from 1 m/s to 10 m/s, the value differs from −1 Nm to −26 Nm. The current flowing through the generator is observed in Figure 19a; it ranges from 0 A to 14 A at wind speeds from 1 m/s to 10 m/s. The AC voltage of the generator, shown in Figure 19e, ranges from 30 V to 195 V as the wind speed increases from 1 m/s to 10 m/s. Figure 19g shows the generator’s electrical output, which accurately follows the kite power.
The simulation results for the on-load analysis were successfully validated using a real-time OPAL-RT simulator. Figure 18b presents the reference and motor speed. The no load and reference speed varies from 230 to 1500 rpm, with each division representing 500 rpm, while Figure 18d displays the reference and motor torque. The reference and motor torque changes from 1.2 to 26 Nm, with each division in the figure representing 8.56 Nm. Figure 18f illustrates the variations in kite and motor power. The motor and kite power varies from 10 W to 4 kW, with each division in the figure representing 1.36 kW, and Figure 18h depicts the reference and generator torque. The reference and generator torque changes from −1 Nm to −26 Nm, with each division in the figure representing −8.56 Nm. Additionally, Figure 19b exhibits the generator current, which changes from 0 A to 14 A, with each division in the figure representing 4.67 A. Figure 19f depicts the generating voltage, which varies from 30 V to 195 V, with each division in the figure representing 64 Volts, and Figure 19h represents the kite and generator power, which vary from 10 W to 4 kW, with each division in the figure representing 1.36 kW. The effectiveness of the proposed PMSM-based emulator is demonstrated under varying load requirements using the output of the kite model speed and torque reference values in a load test analysis of the LAWECS emulator system.

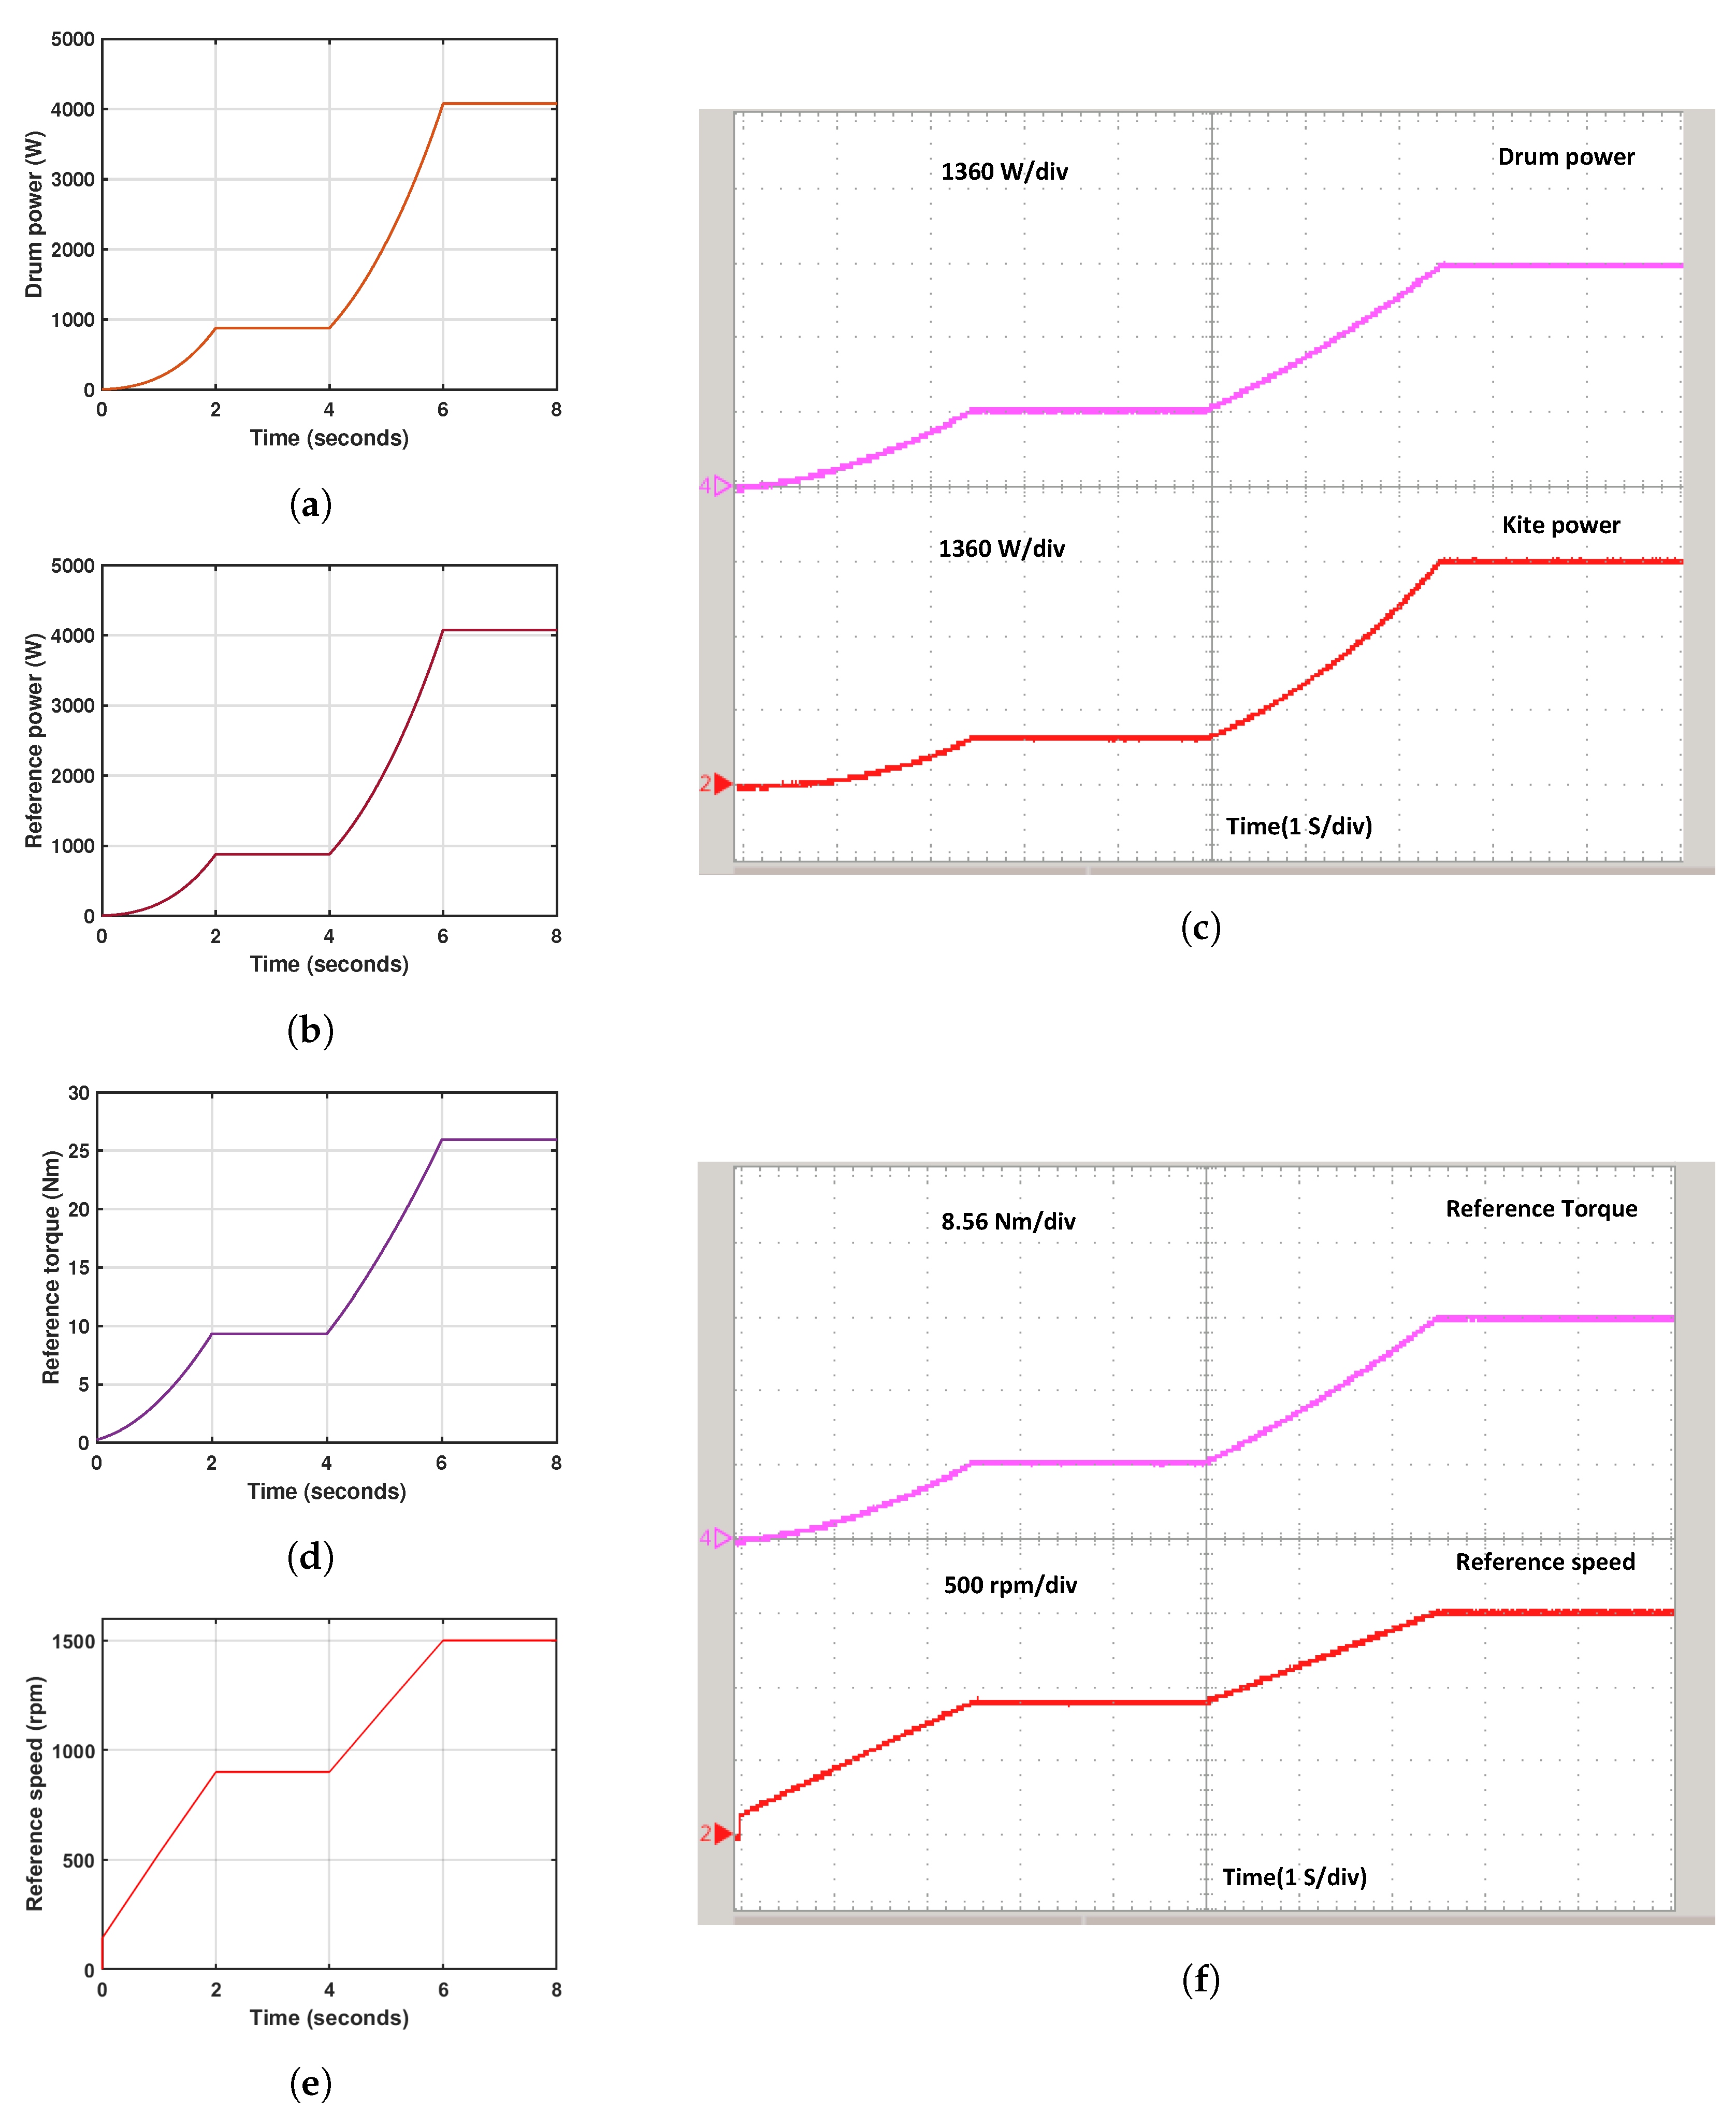
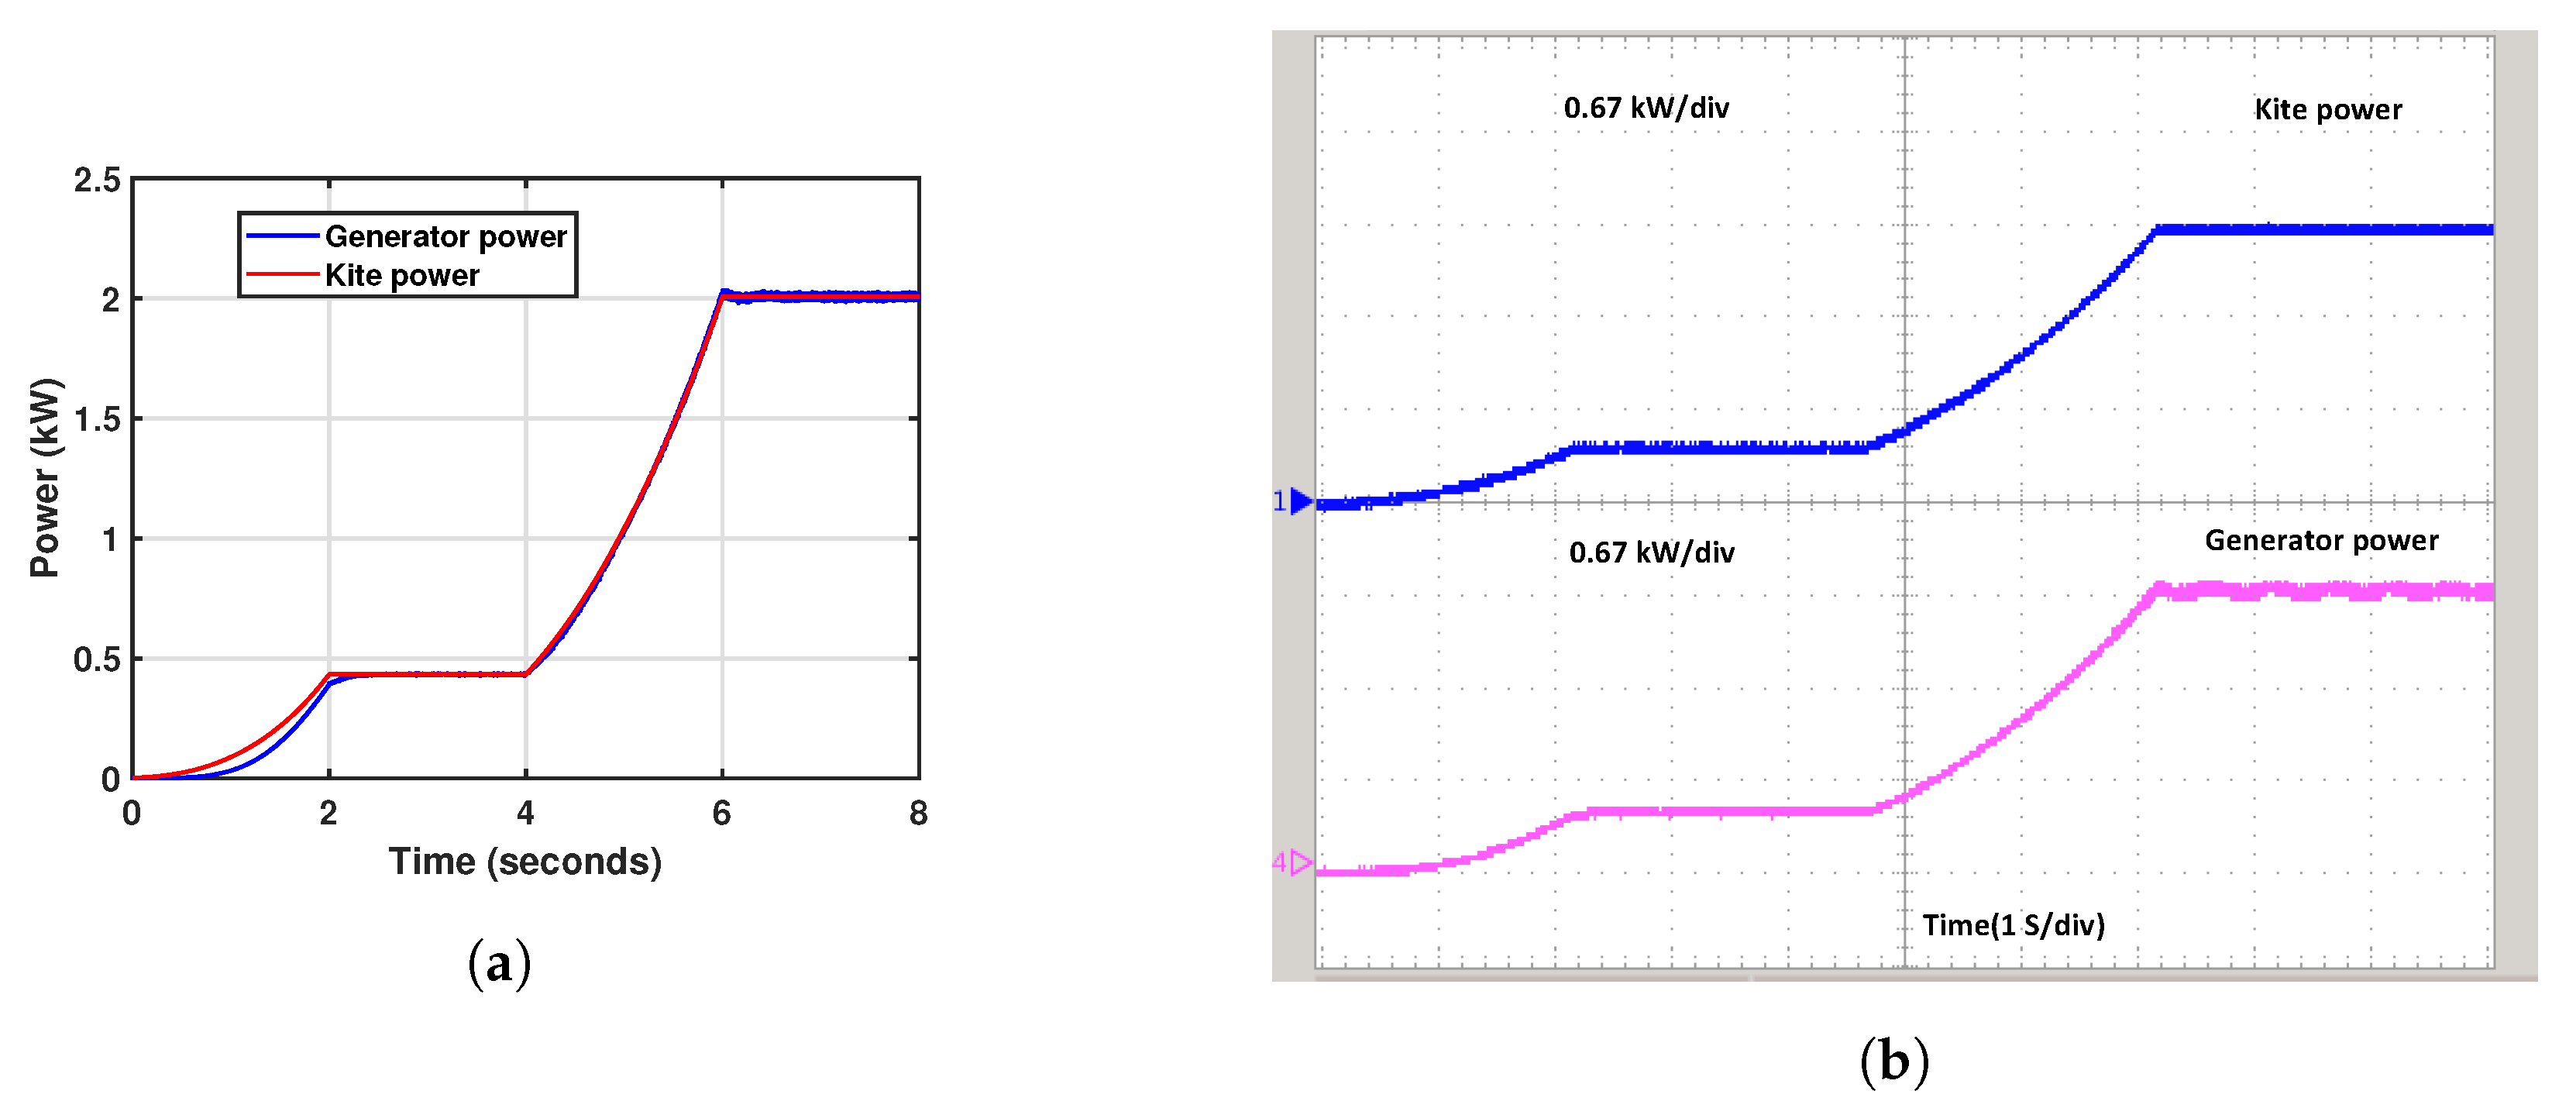
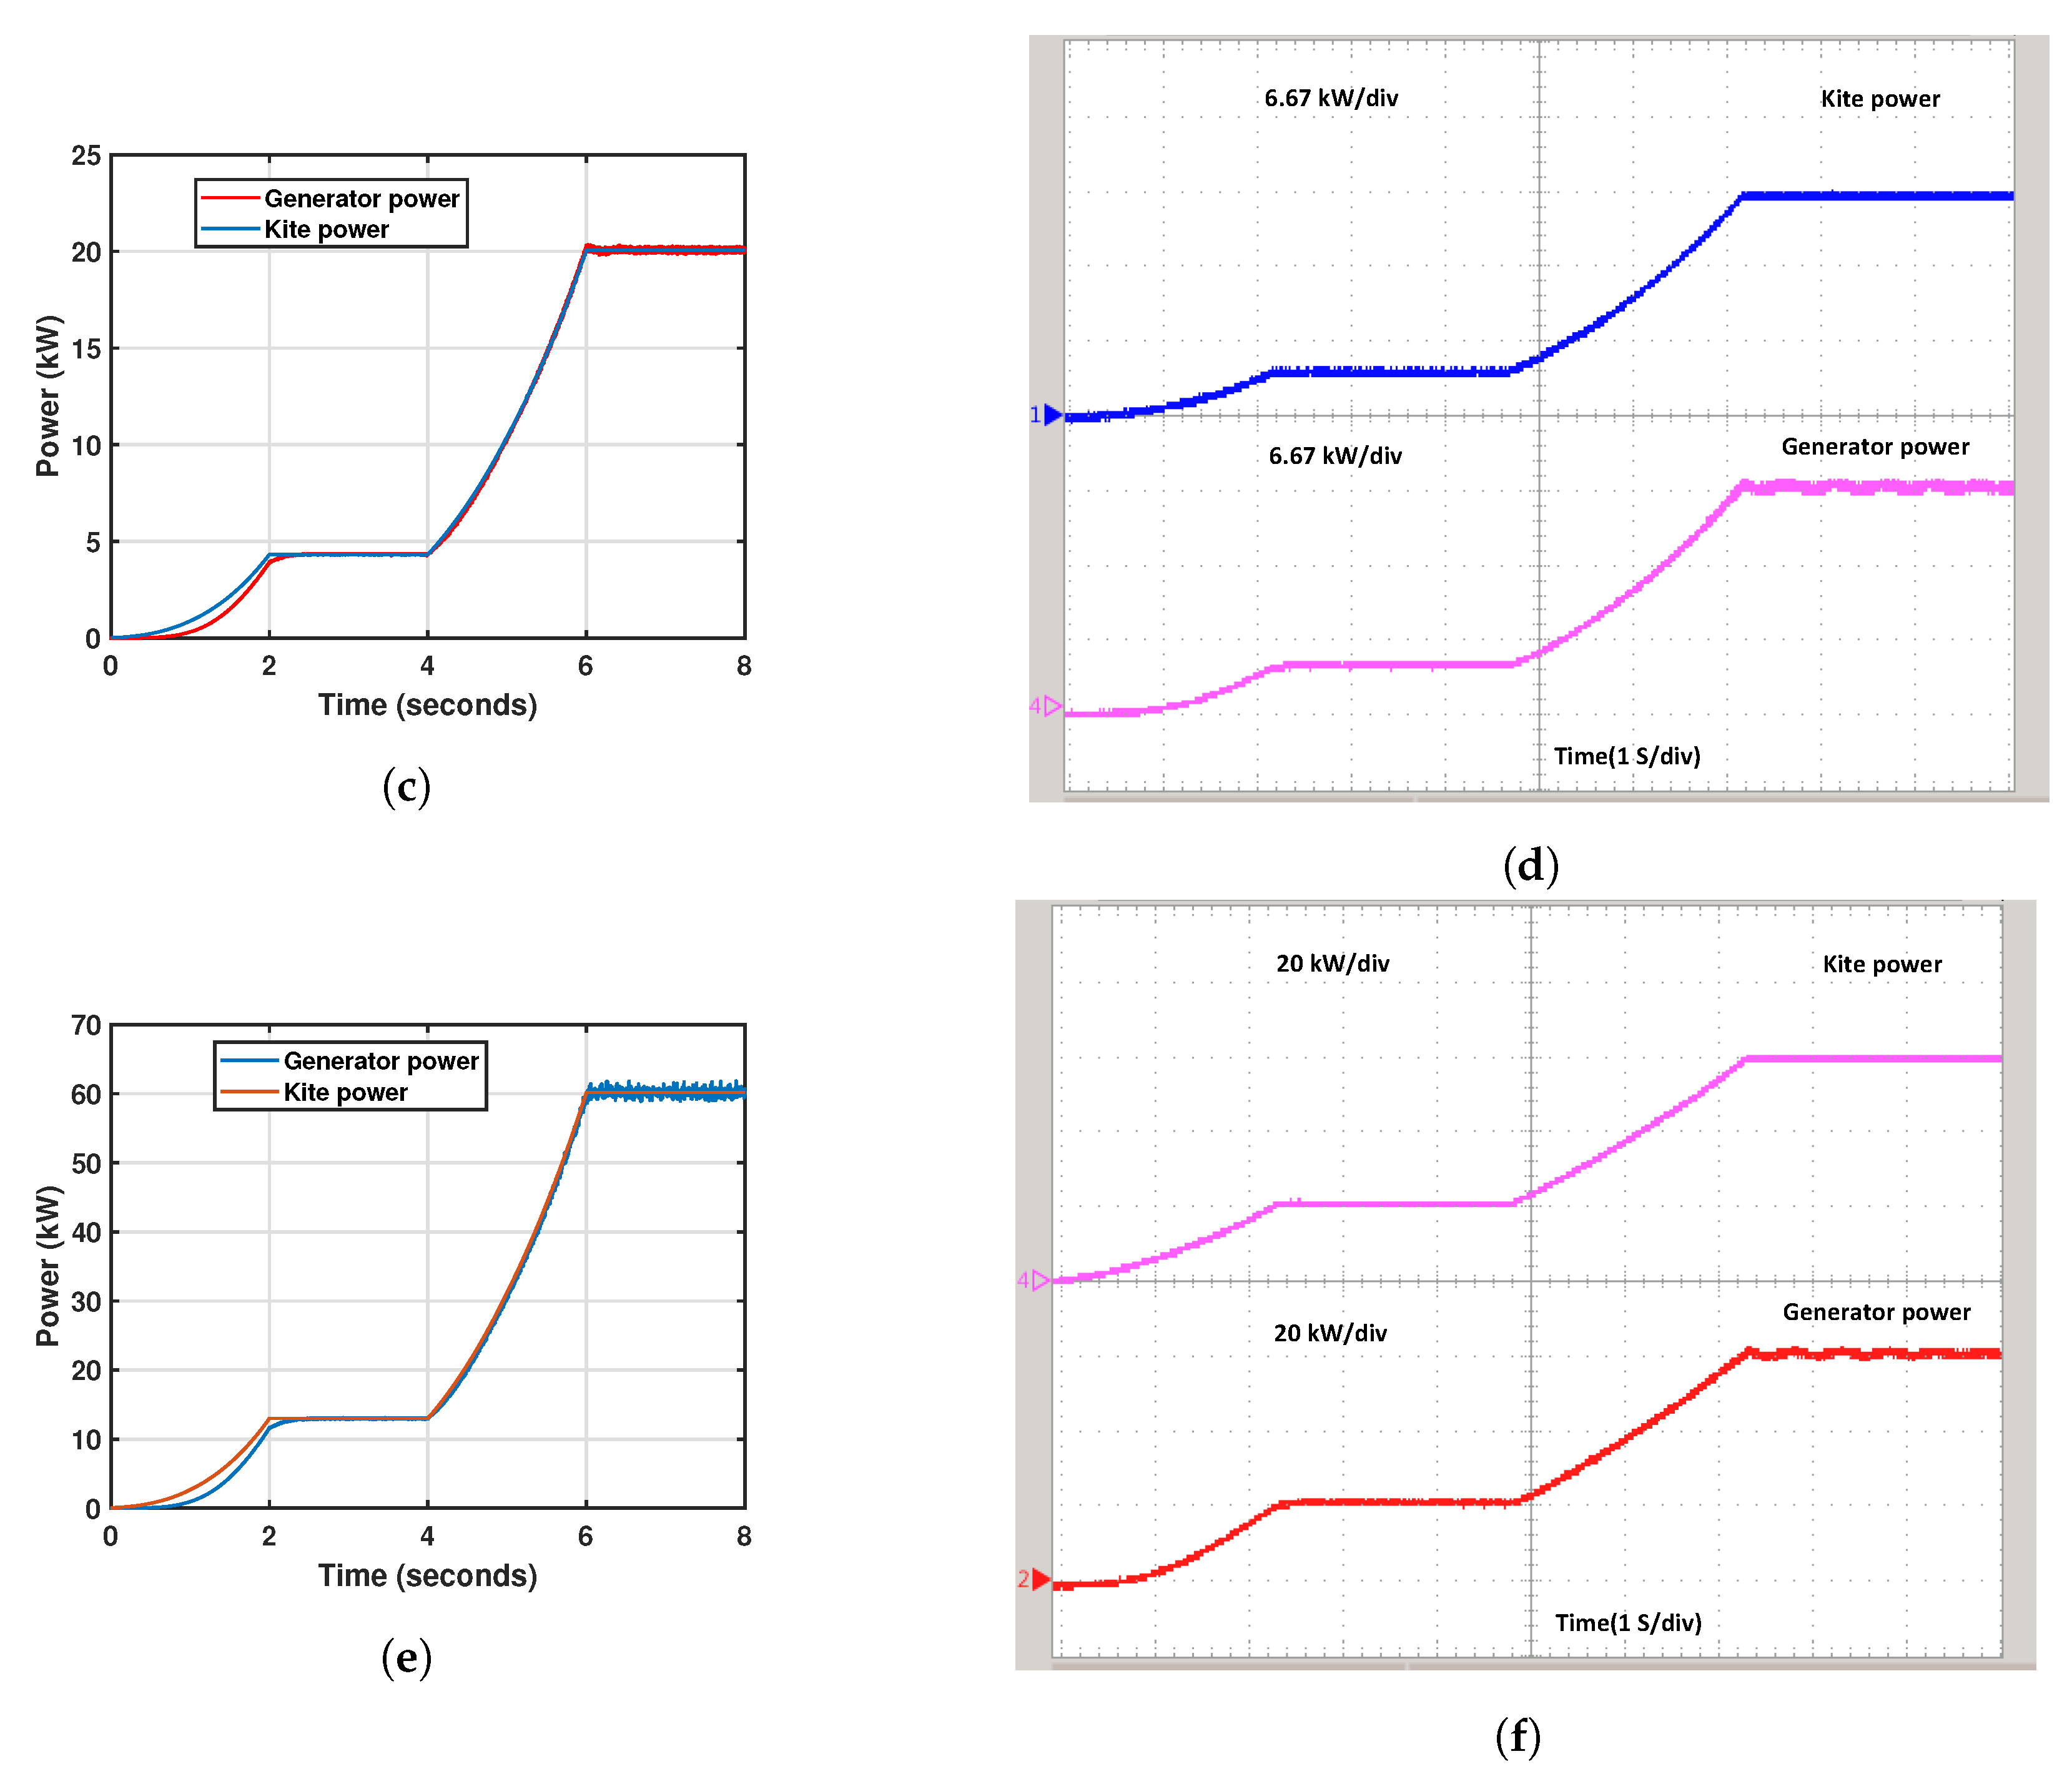
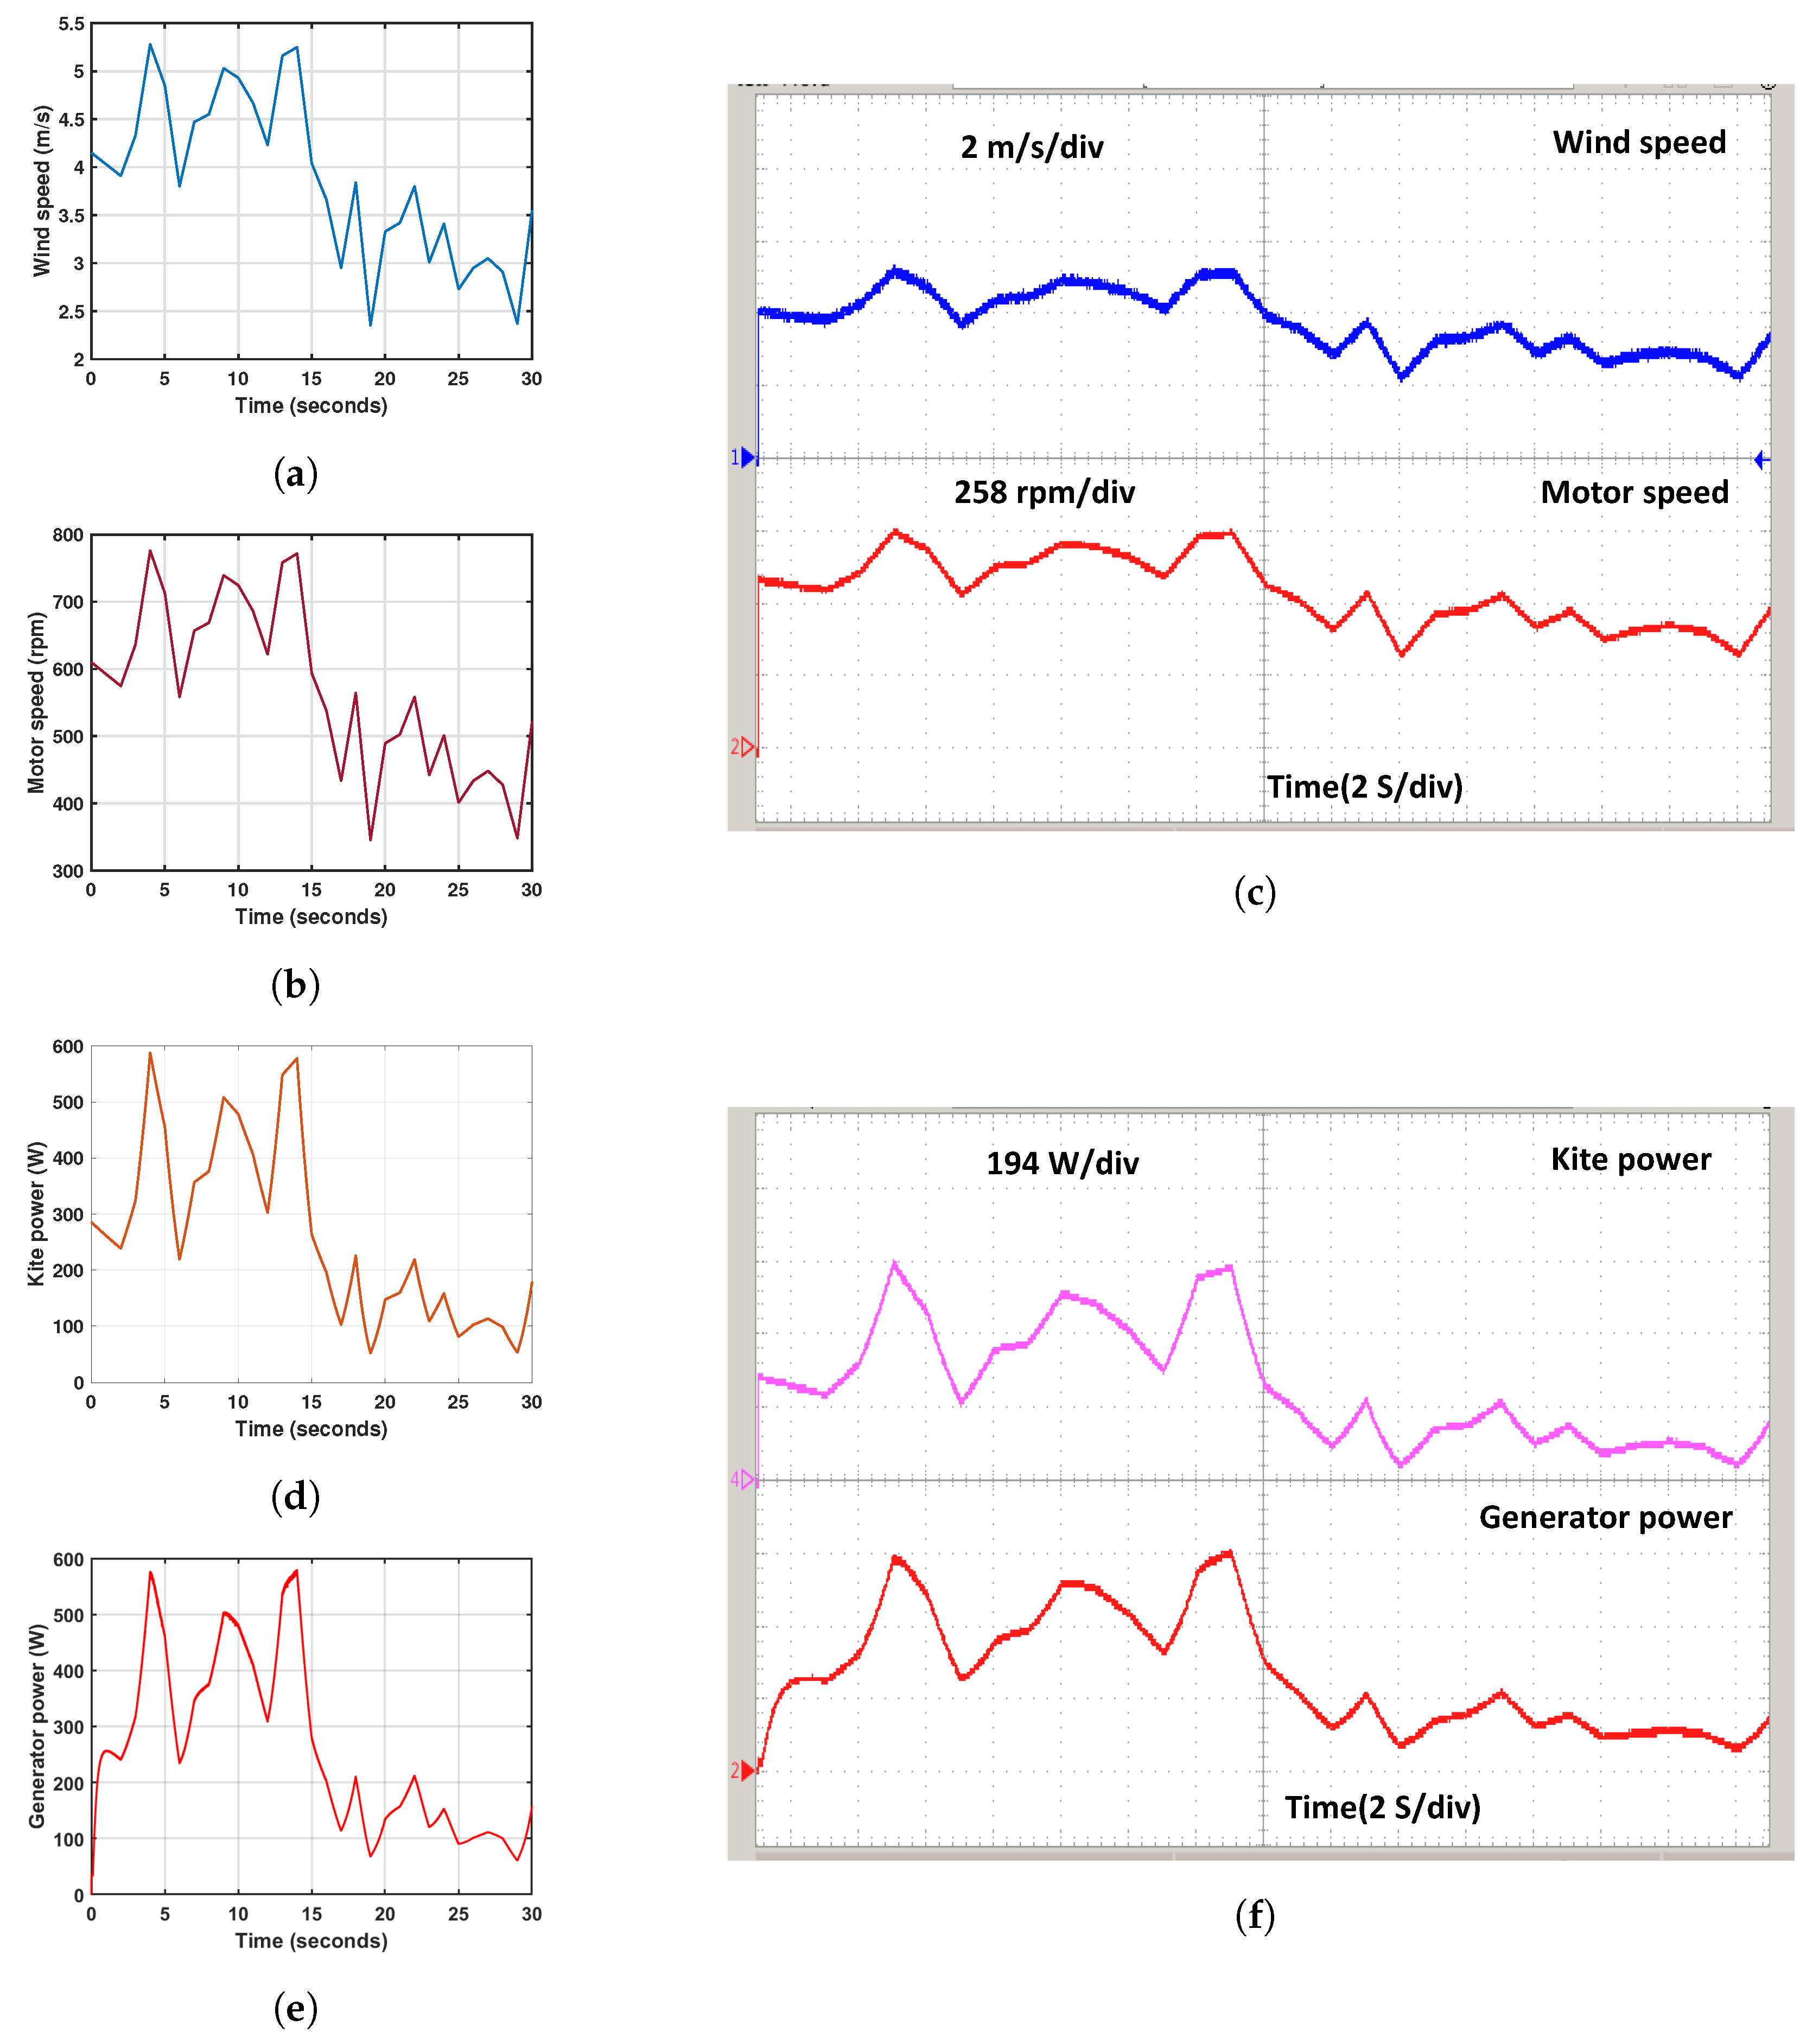
4.4. Three Different Power Rating Adaptabilities at Generator Terminal

In their study, he authors of [49] include a quasi-steady modelling framework for a pumping kite power system and experimental validation. The experimental data estimates the mechanical power production based on wind, system design, and operational characteristics. The validation reference data comes from two technology demonstration tests that generated 20 kW of nominal traction power with 14 and 25 m 2 kites. However, our study demonstrates using three different kite areas, 5, 25, and 70 m 2 , to generate 2, 20, and 60 kW of power. The further developed power is validated with OPAL-RT in the real-time discrete simulator.
We conducted simulations for three distinct power ratings, specifically 2 kW, 20 kW, and 60 kW, at the generator terminal, considering corresponding aerodynamic coefficients of 1.965, 3.826, and 4.235.
Figure 20 presents the results of these simulations, providing a visual representation of the performance and characteristics associated with each power rating. In Figure 20a, the maximum power output of 2 kW is observed when the kite’s surface area is 5 m 2 , and the wind speed reaches 10 m/s. Figure 20c illustrates the simulation results for a kite surface area of 25 m 2 , indicating a maximum power output of 20 kW at a wind velocity of 10 m/s. Figure 20e presents the simulation results for a kite surface area of 70 m 2 , demonstrating a maximum power output of 60 kW when the wind speed reaches 10 m/s. The simulation results for the three different power ratings were successfully validated using a real-time OPAL-RT simulator. Figure 20b presents the maximum generator power of 2 kW, with each division in the figure representing 0.67 kW. Figure 20d shows the maximum generator power of 20 kW, with each division in the figure representing 6.67 kW. Figure 20f presents the maximum generator power of 60 kW, with each division in the figure representing 20 kW. The investigation of different power levels demonstrates that the LAWECS emulator is crucial for testing the system’s scaled-up version under various load scenarios. It is essential to evaluate its performance before developing the actual design system.

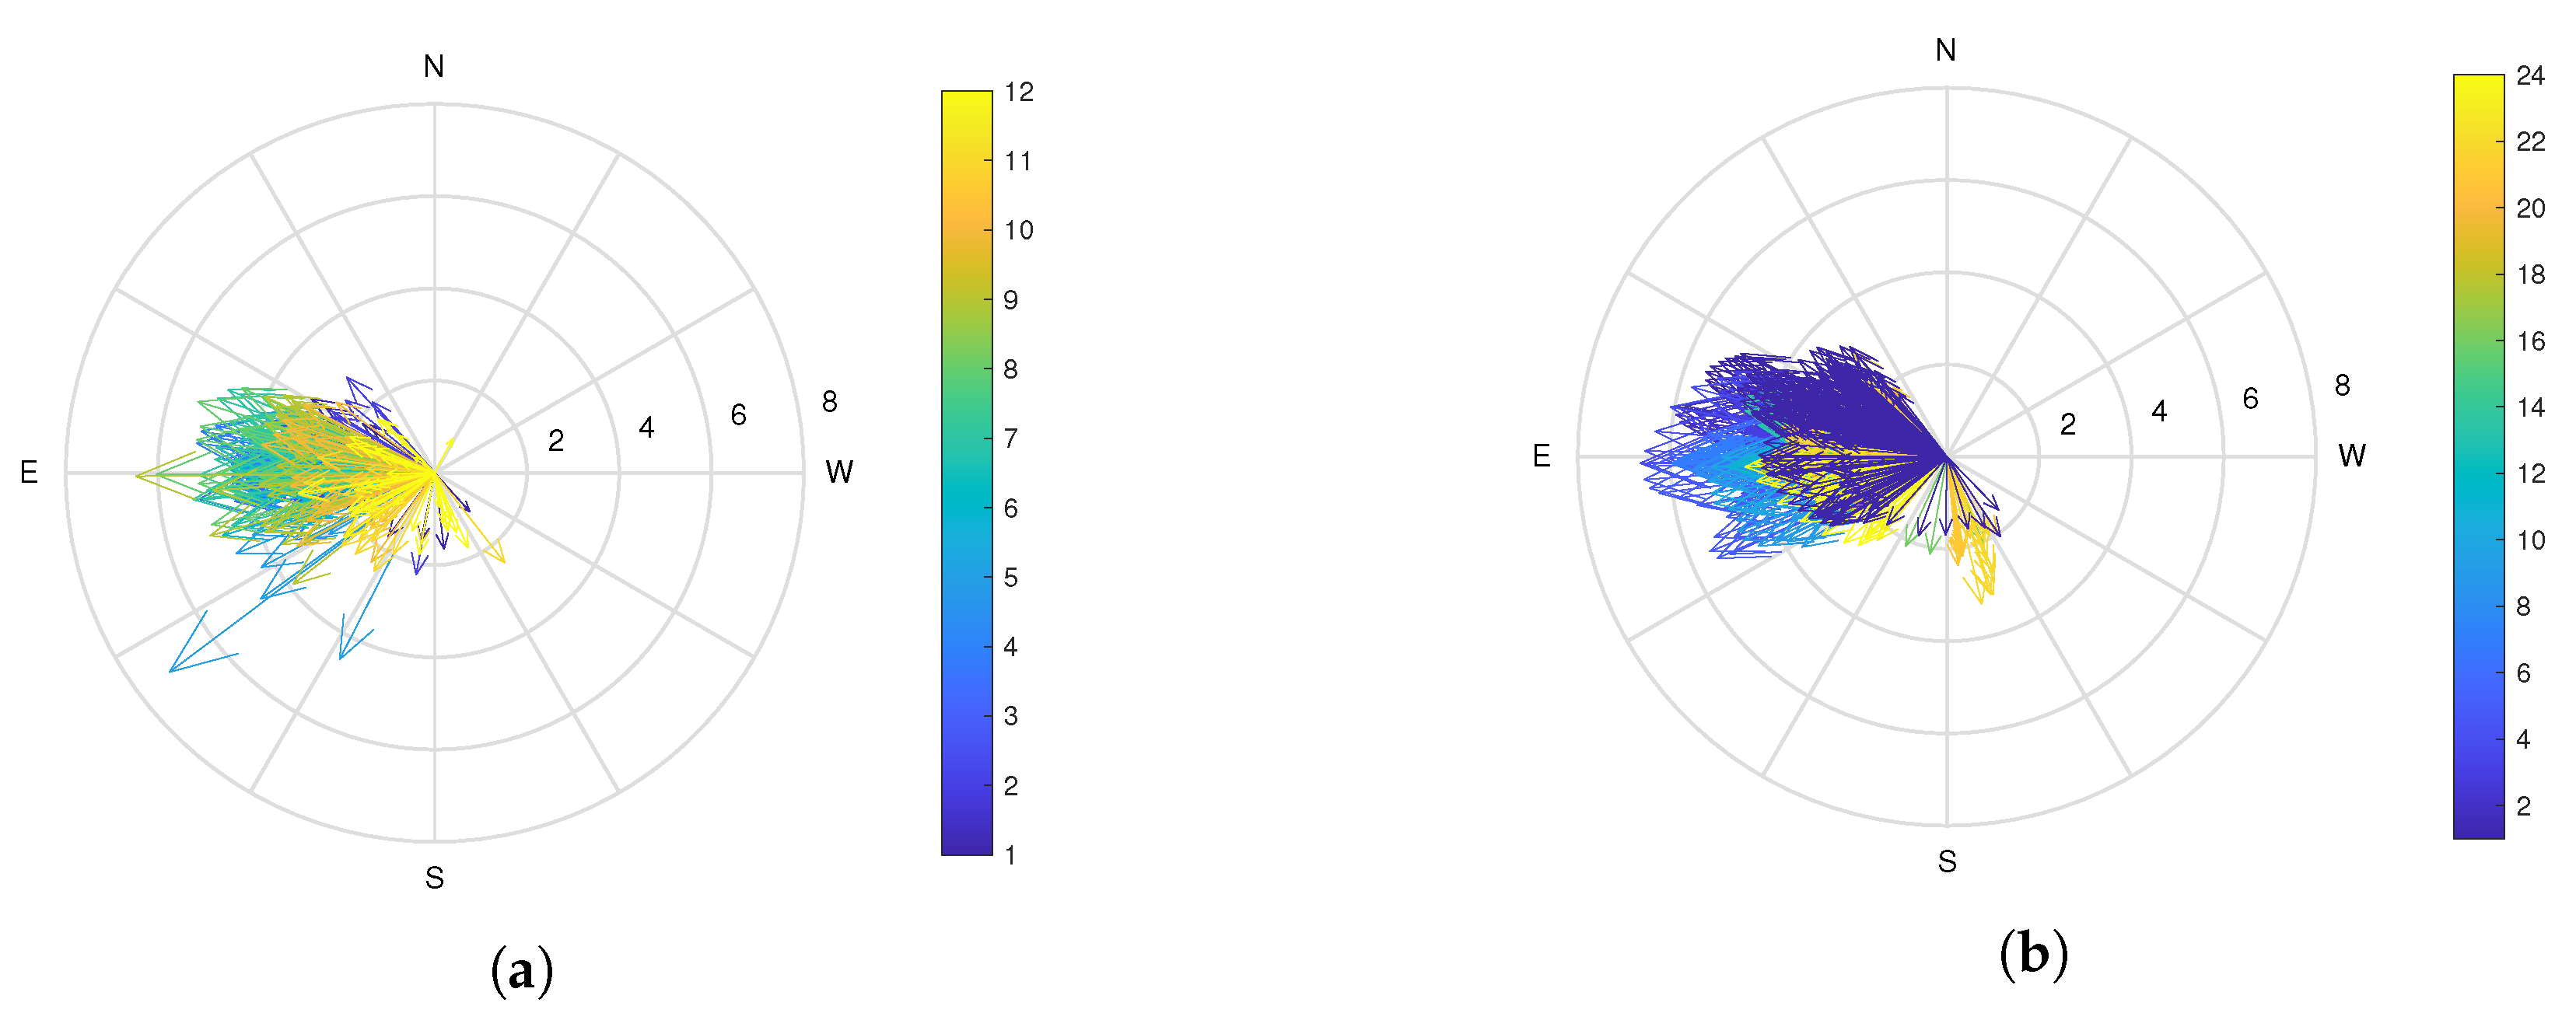
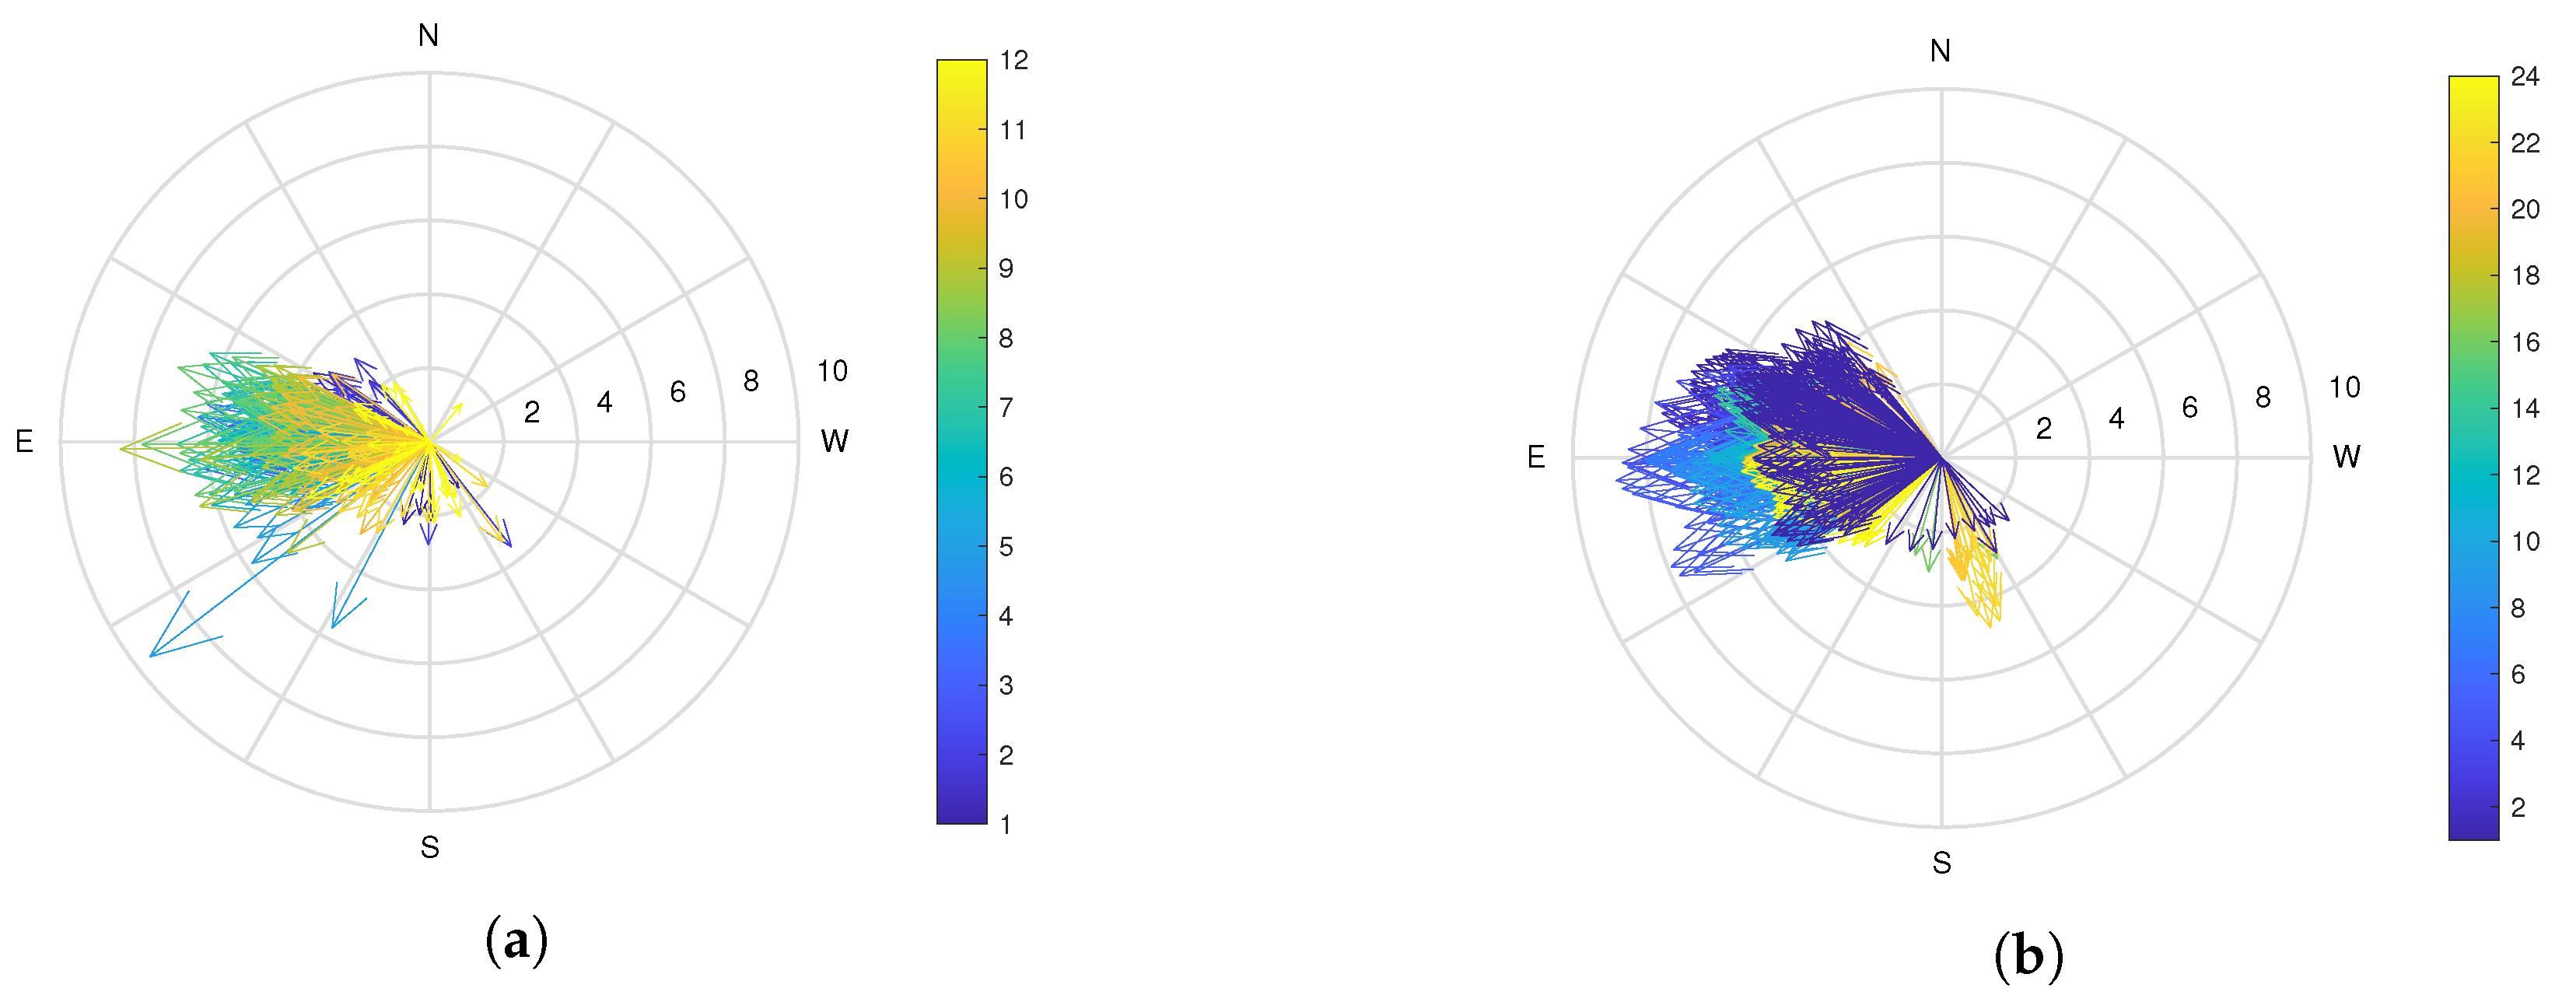
4.5. Field Test Wind Data Analysis

The estimation of force is derived from the data that were gathered during the field test. Multiple experiments were performed to record the trajectory data of the tether and kite force in a figure-eight pattern. Table 3 displays the raw data gathered during the field testing, which includes information on the orientation of kite (Pitch, Yaw, and Roll), altitude in meters, load cell measurements (analogous values) of the force, wind speed, and wind direction. Typically, wind directions are reported considering the easterly axis.
The equations representing the coefficients of lift ( C L ) and drag ( C D ) can be formulated in the following manner.
C L 2 π ( θ ˙ β )
C D 1.28 × ( c o s ( 90 θ ˙ ) + c o s ( β ) + s i n ( 90 ϕ ) )
The angle between the kite and the direction of the wind is denoted by β , and it is determined as the absolute value | χ ψ | [50]. χ represents the angle between the wind direction vector and the eastward direction vector, while ψ represents the angle between the kite and the eastward direction vector.

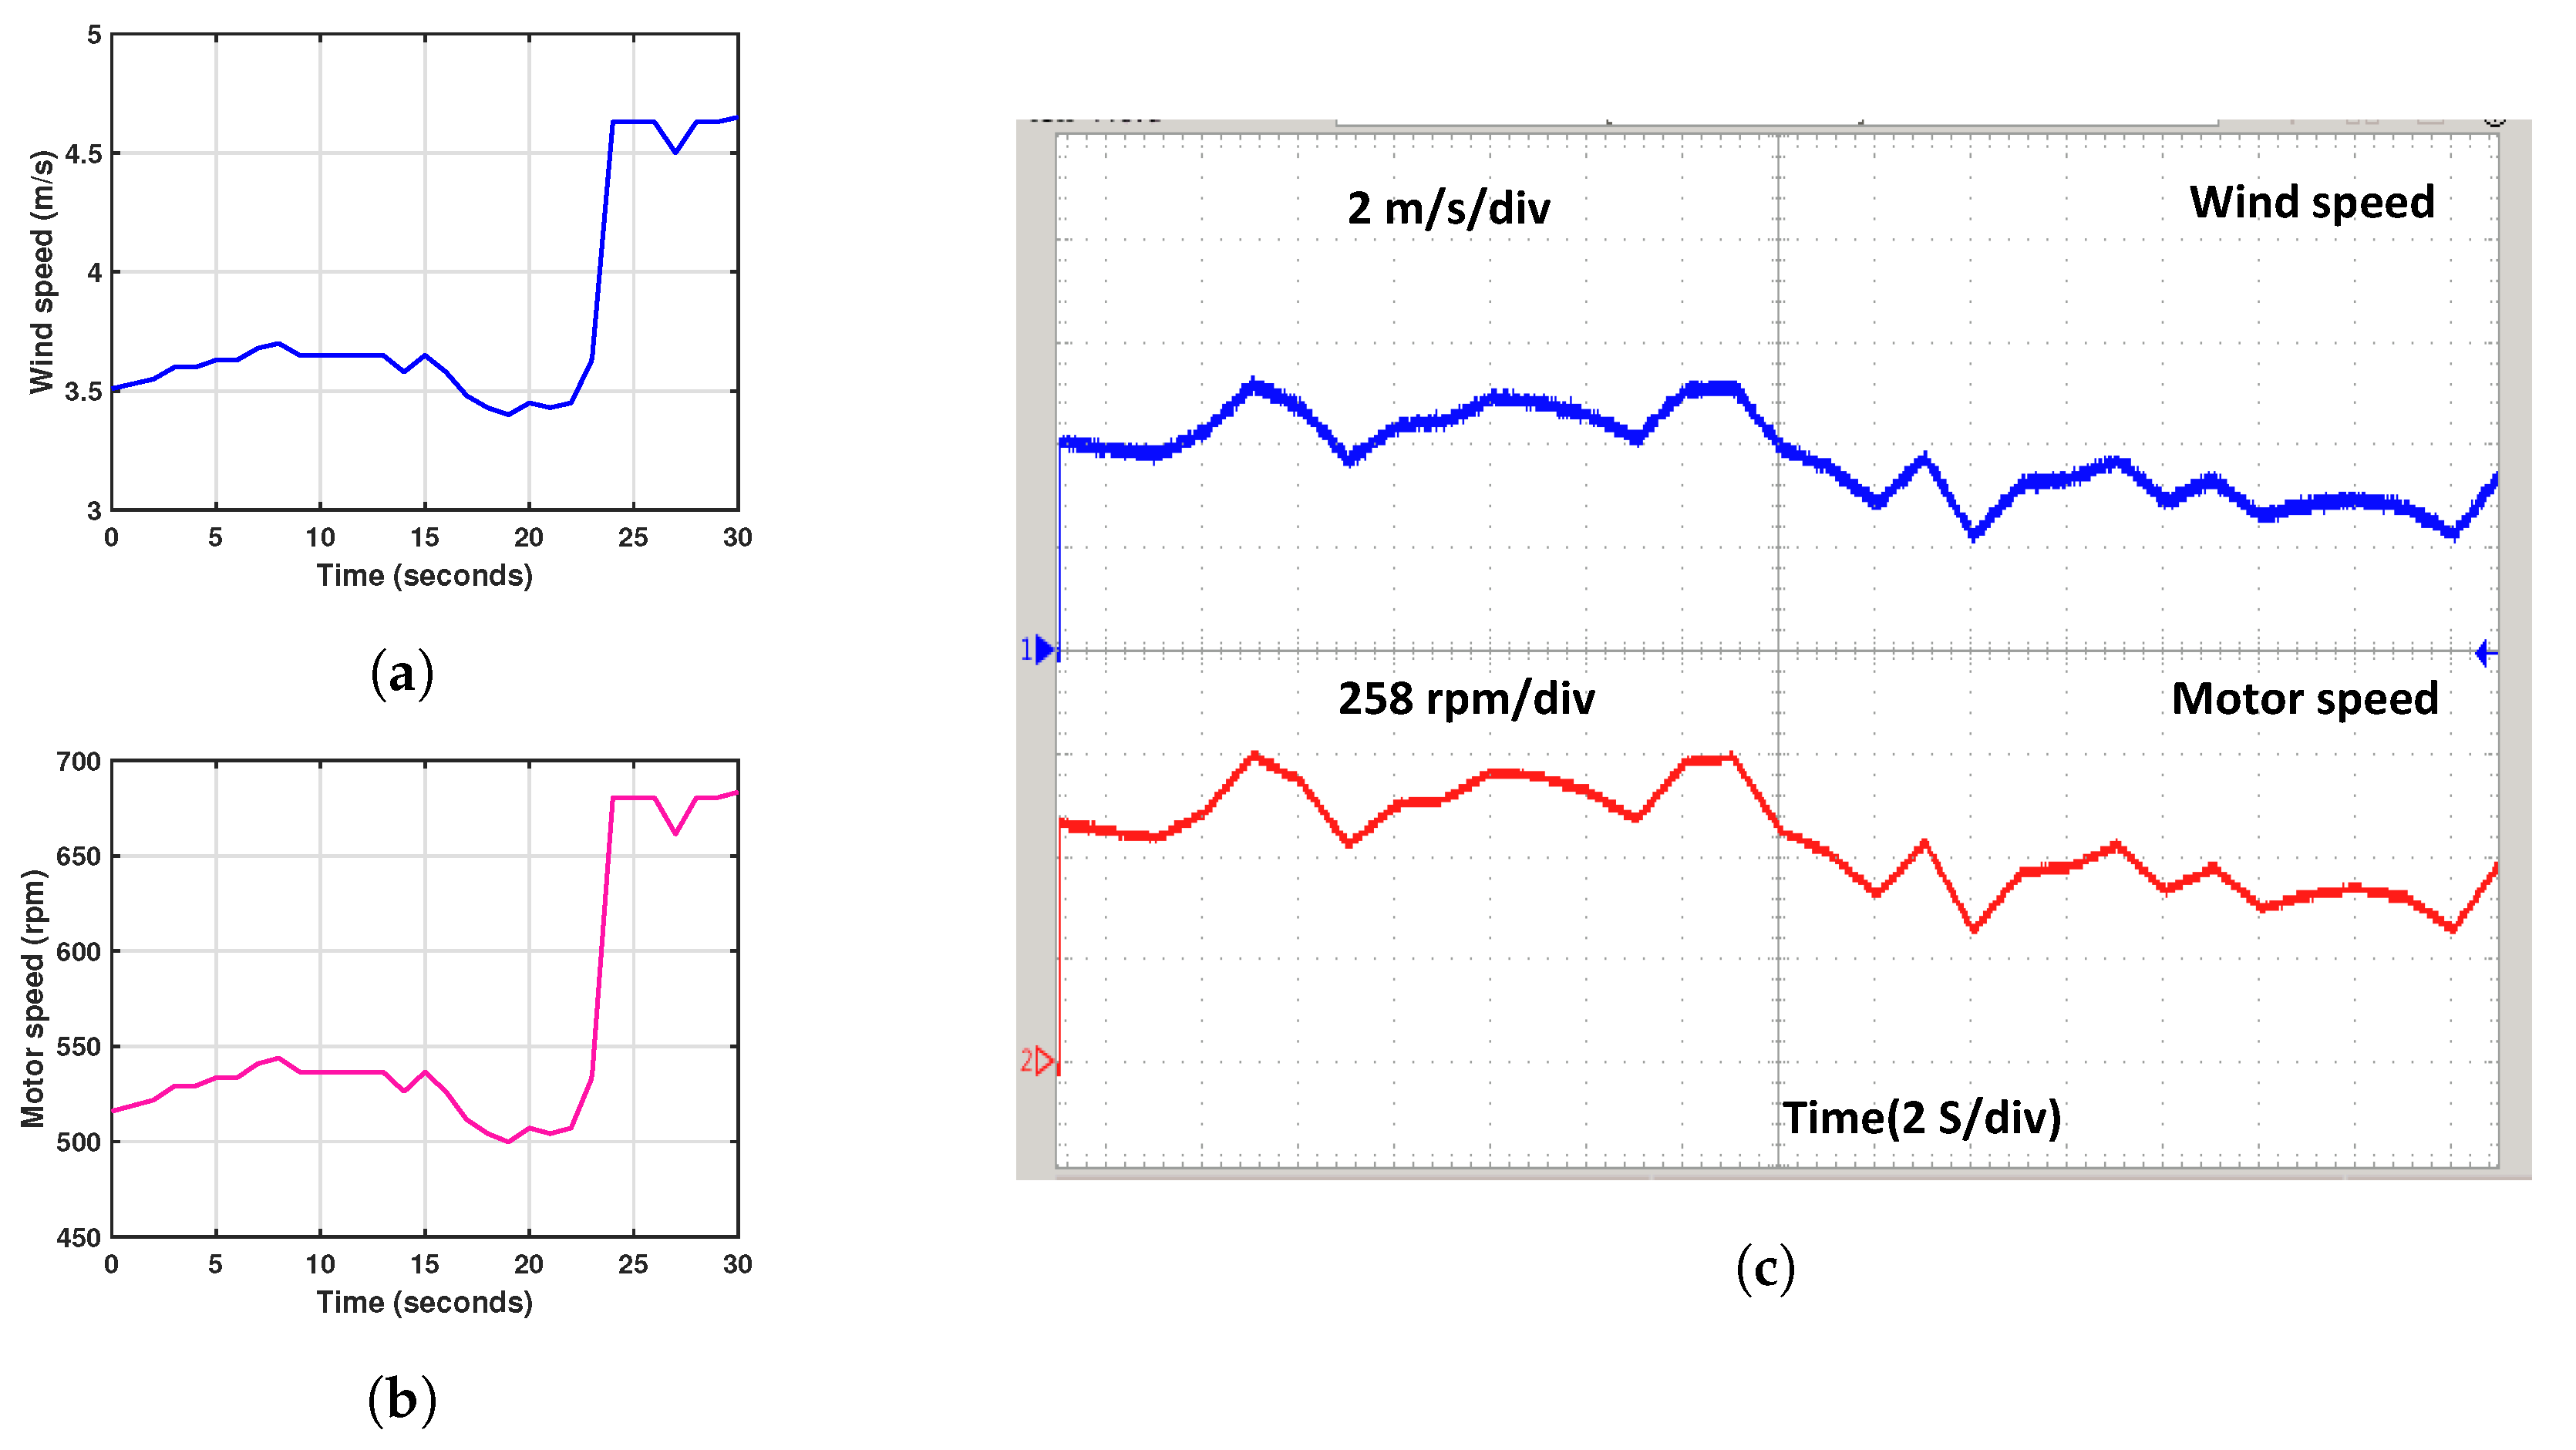
4.5.1. Validation Using Satellite Wind Data

Figure 21 shows a graphical depiction of wind data gathered from satellites specifically for the NITK beach location in the Dakshina Kannada district of the Indian state of Karnataka. This figure provides a pictorial depiction of the analyzed 3D wind data, offering insights into the wind patterns and characteristics at the NITK beach location. The aforementioned satellite wind data analysis shows two hubs between 10 m and 50 m in height. Figure 21a,b show the velocity and direction of the wind data for 12 months of 2022. Whereas, Figure 22a,b show the velocity and direction of the wind data on one day in July. Lastly, the plot indicated predominant southeastward changes in wind speed and direction.
Hourly satellite wind data for electricity generating 50 m above the ground for July 2022 is displayed in Figure 23. The results are shown in figures below to simulate these data in a LAWECS model. Figure 23a illustrates the wind speed variation, which ranges from 3.34 to 7.56 m per second. Figure 23b depicts the speed of machines, which changes from 495 rpm to 1112 rpm. The kite power generated, which ranges from 155 Watts to 1735 Watts, is displayed in Figure 23d. Similarly, Figure 23e shows the generator power, which changes from 165 W to 1730 W and is the same as the kite-developed power. The power generation plot in Figure 24 displays the hourly power generation results for a one-month wind data sample in July 2022, determined using satellite wind data collected 10 metres above ground level. The LAWECS model was used to simulate the wind speed, motor speed, kite power, and generator power, which are shown in Figure 24a,b,d,e, respectively. The wind speed ranged from 2.39 m/s to 5.26 m/s, while the motor speed varied between 346 rpm and 775 rpm. The kite power output varied from 55 W to 588 W, and the generator power output ranged from 65 W to 580 W, which was consistent with the kite-generated power.
The satellite wind data simulation results are validated using a real-time OPAL-RT simulator. The validation process is demonstrated in Figure 23c,f and Figure 24c,f, showcasing the dynamic behaviour of the kite at a 50 m and 10 m height using the satellite wind data in real-time simulation results, respectively. Figure 23c depicts the variations in wind speed and motor speed. The wind speed changes from 3.34 m/s to 7.56 m/s. Each division in the figure represents 2 m/s, and the motor speed varies from 495 rpm to 1112 rpm, with each division in the figure representing 371 rpm. Figure 23f shows the kite power and Generator power at a 50 m height from the ground. The kite and generator power changes from 165 to 1730 Watts, with each division in the figure representing 578 Watts. Figure 24c illustrates the wind and motor speeds. The wind speed changes from 2.39 m/s to 5.26 m/s, with each division in the figure representing 2 m/s, and the motor speed varies from 346 rpm to 775 rpm, with each division representing 258 rpm. Lastly, Figure 24f displays the kite and generator power at a 10 m height from the ground. The kite power and generator change from 55 to 588 Watts, with each division in the figure representing 194 Watts.

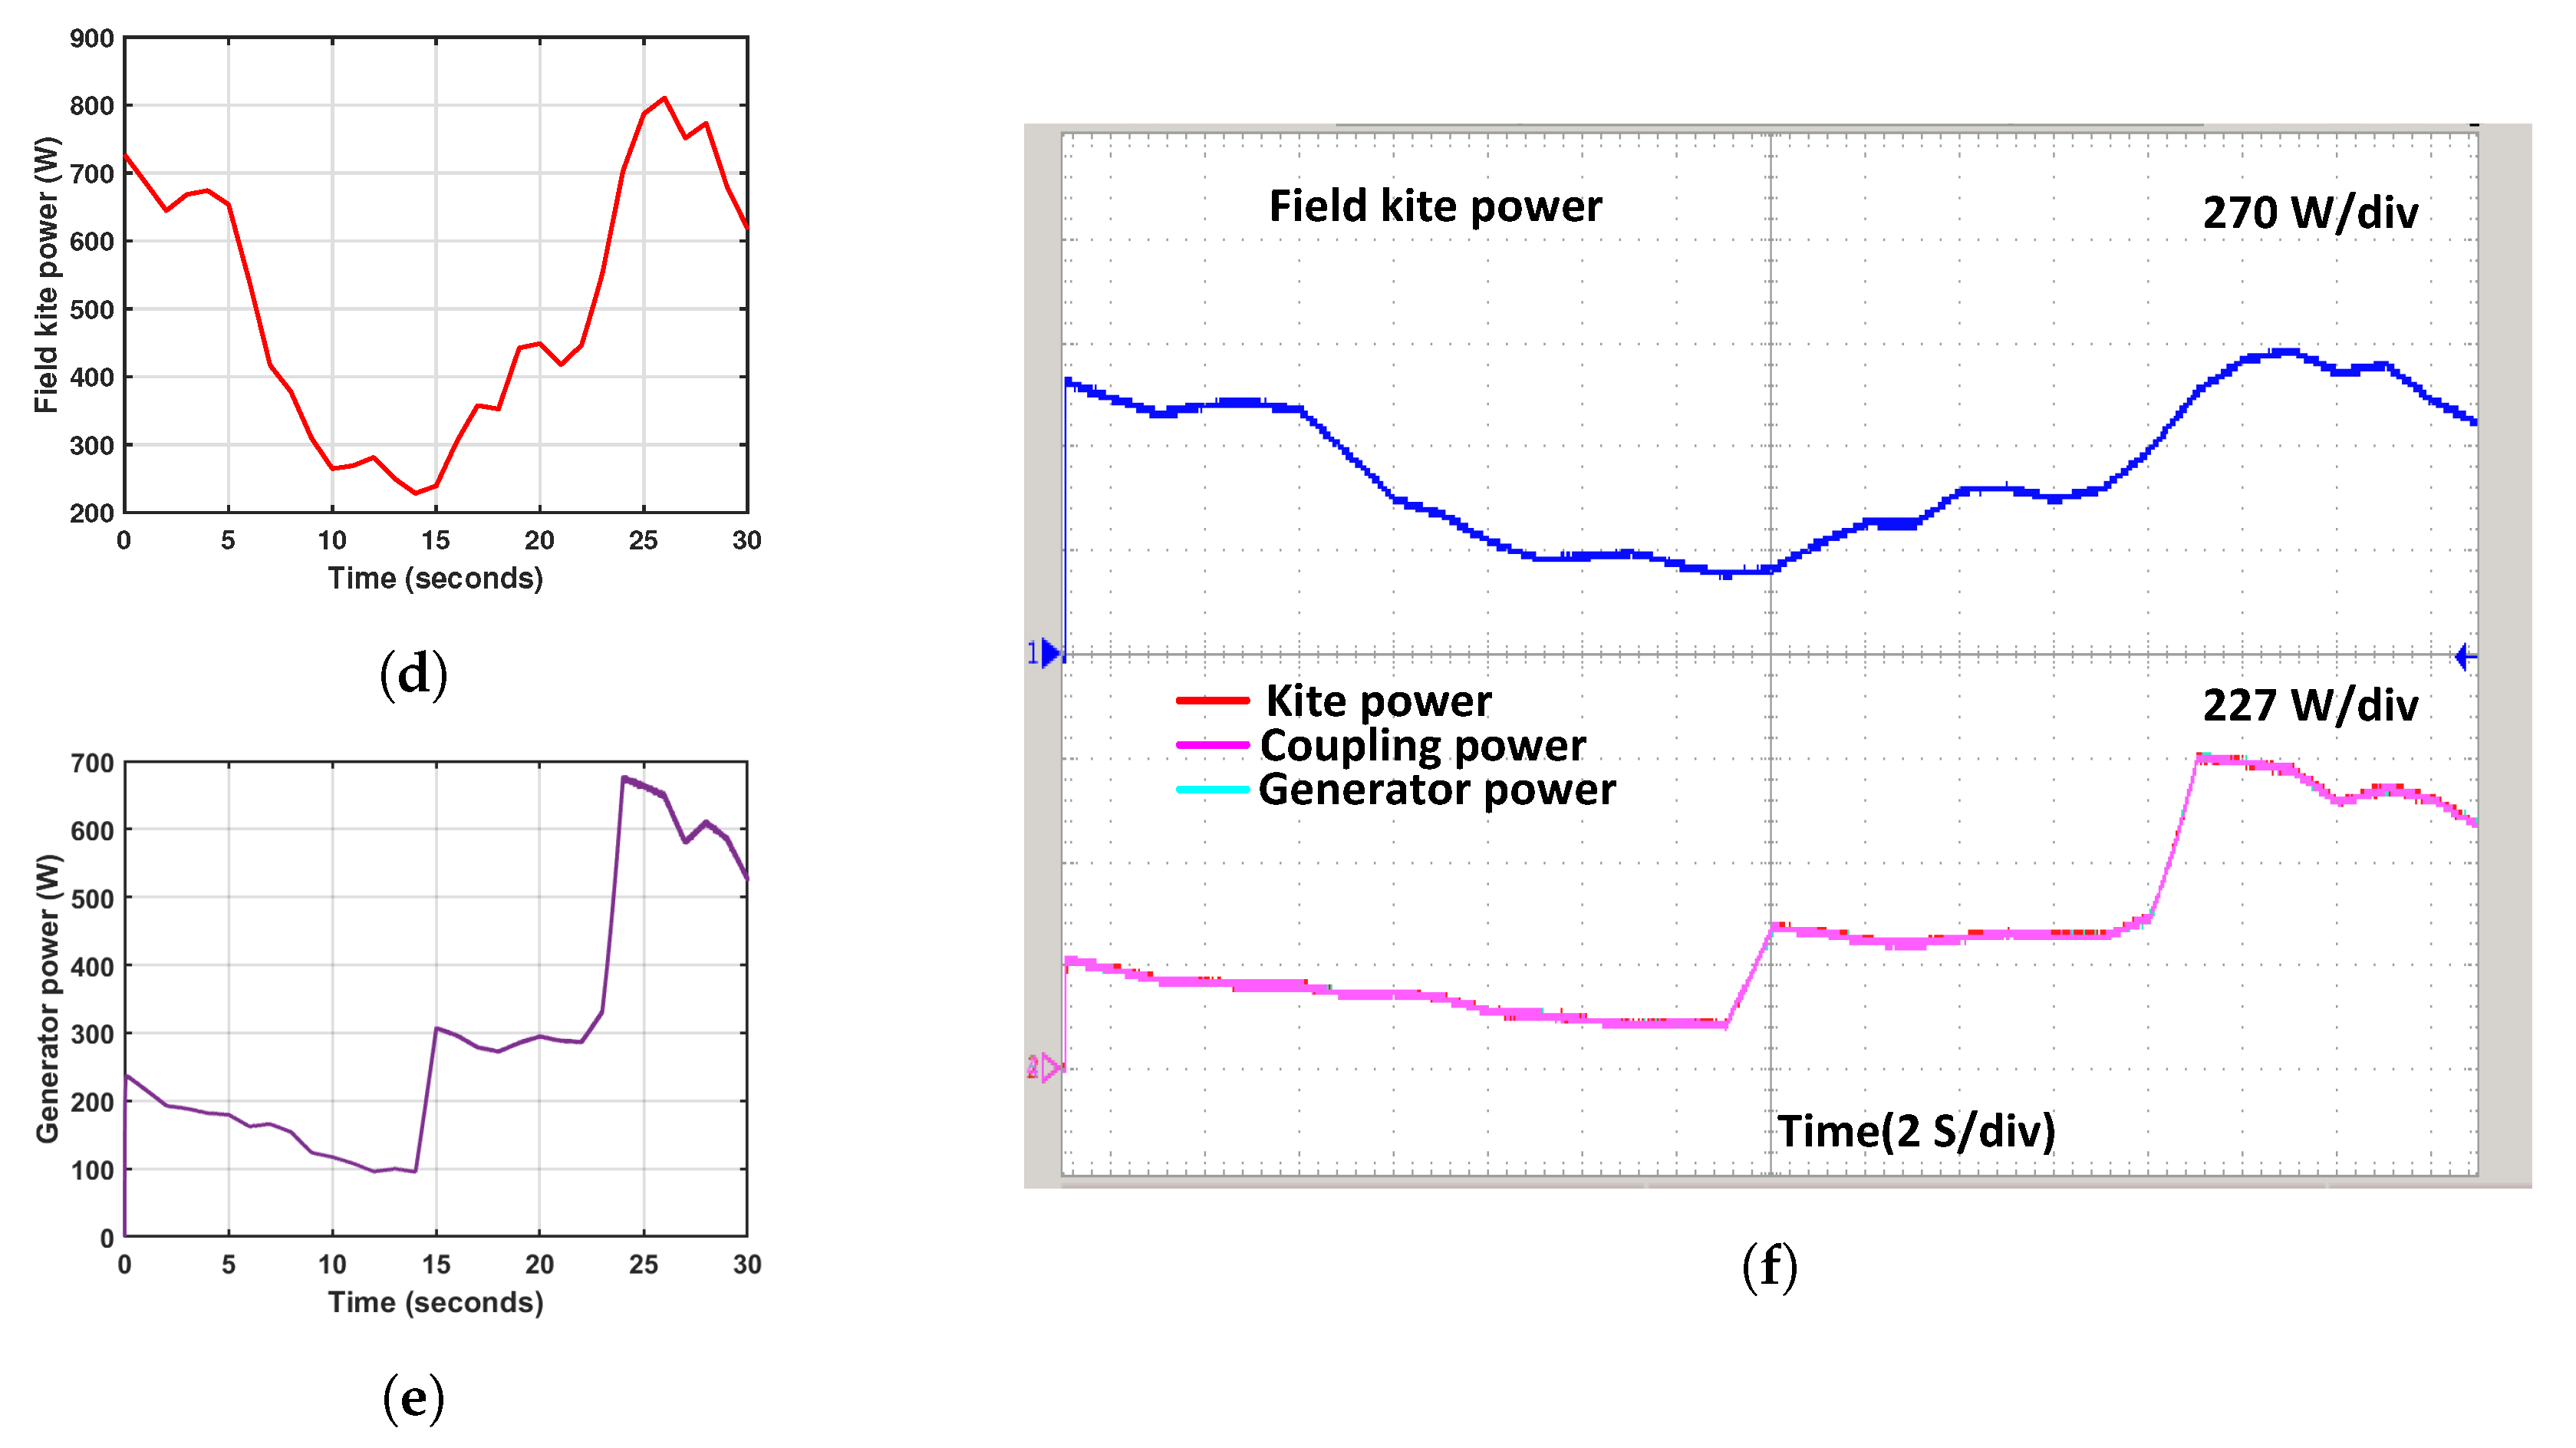
4.5.2. Validation Using Experimental Ground Wind Data

The results of the ground data simulation are presented in Figure 25. These results encompass various parameters, including the motor speed, kite power measured during field tests, kite power estimated using the physical model, coupling power, and generator output power. Experiments were conducted to record from the figure-eight path of the kite, such as the wind speed and tether force. These data served as valuable input for estimating the power generated by the system. Those data are presented in Table 3. Figure 25a depicts the experimental wind speed, showcasing a minimum value of 3.4 m/s and a maximum value of 4.65 m/s. Figure 25b illustrates the machine reference speed with a six-gear ratio, showing a range from 500 rpm to 685 rpm. The recorded kite power during the field test exhibits a range of values, with the lowest recorded power being 230 Watts and the highest recorded power being 810 Watts, as illustrated in Figure 25d, with sampling durations of 14 s and 26 s, respectively. As observed in Figure 25e, the electrical power of the emulator varies at a minimum of 100 W with a time of 13 s and a maximum of 675 W for a time of 24 s at the PMSG terminal. Consistent with the physical model’s projected kite power, it is a perfect match.
The simulation results of experimental ground wind data, as shown in Figure 25c,f, are validated using a real-time OPAL-RT simulator. Figure 25c depicts the variations in wind speed and motor speed. The wind speed varies from 3.4 to 4.65 m/s, with each division in the figure representing 2 m/s, and motor speed varies from 500 rpm to 685 rpm, with each division representing 227 rpm. Figure 25f displays the field kite power, kite power, coupling, and generator power. The kite, coupling, and generator power changes from 100 to 675 watts, with each division representing 227 watts, and the field kite power varies from 230 to 810 watts, with each division representing 270 watts. This matches perfectly with the calculated kite power based on the physical model.

5. Conclusions

This paper’s research significantly contributes to the booming field of alternative energy generation, which is currently experiencing worldwide growth. A LAWECS emulator was built and deployed to simulate an actual airborne wind turbine’s drive train in a controlled testing environment. This study explores a kite-based AWES emulator, incorporating a field-oriented control technique to drive a PMSM. A DC/AC converter employs a closed-loop current-based PI regulator to drive the motor. The proposed system validated the MATLAB SIMULINK results with the experimental ground data measured during a field test. Further, the proposed systems are verified with the real-time simulator environment using OPAL-RT (OP5033), and it has been proved that the system’s dynamics with OPAL-RT and MATLAB SIMULINK software showed the same responses. The main findings of this paper are listed below:
  • The LAWECS emulator provides researchers with a cost-effective solution by offering a different range of kite sizes and adjustable wind speed.
  • The proposed emulator was successfully applied to simulate three power ratings of 2 kW, 20 kW, and 60 kW at the generator terminal with kite surface areas of 5 m 2 , 25 m 2 , and 70 m 2 , respectively.
  • The emulator system based on PMSM demonstrates promising results in emulating the LAWECS with different wind speeds and kite areas.
  • The wind velocity exhibited a range from 1 m/s to 10 m/s during both no-load and on-load-rated scenarios. The LAWECS was verified using experimental ground test data to evaluate the dynamic behaviour exhibited by the generator when subjected to on-load conditions.
  • The proposed systems were validated in a real-time simulator environment using FPGA processor-based OPAL-RT. The system dynamics were compared between OPAL-RT and MATLAB SIMULINK, and it was observed that both exhibited identical responses.
Furthermore, the analysis demonstrates that the kite power obtained from the mathematical model is consistent with the power developed by the emulator system. As the kite’s tether force varies along its flight trajectory, the generator shaft speed must be precisely managed. The PMSM-based emulation system shows promise for modelling LAWECS with a wide range of kite sizes and wind conditions. The design and development of an experimental prototype, intended for the purpose of validating the proposed kite-based system design and thoroughly assessing the performance of the emulator itself, will be addressed in our future study.

Author Contributions

P.K. (Pankaj Kumar), Conceptualization, Methodology, Software, Validation, Writing—original draft, and Writing—review editing; Y.K., Conceptualization, Supervision, Investigation, Visualization, and Writing—review and editing; R.V.C., Data analysis; A.K., Writing—review and editing; M.S.K., Writing—review and editing; D.K., Writing—review; P.K. (Panagiotis Kosmopoulos), Writing—review and editing. All of the authors have given approval for the manuscript to be published. All authors have read and agreed to the published version of the manuscript.

Funding

DST-SERB India provided funding for this research project under the Core research grant. Funding Order Number CRG/2021/007655.

Data Availability Statement

Not applicable.

Acknowledgments

The authors would like to acknowledge the financial support provided for the project through the core research grant (CRG) by the Science and Engineering Research Board of India.

Conflicts of Interest

The authors do not have any conflict of interest.

References

  1. Savino, M.M.; Manzini, R.; Della Selva, V.; Accorsi, R. A new model for environmental and economic evaluation of renewable energy systems: The case of wind turbines. Appl. Energy 2017, 189, 739–752. [Google Scholar] [CrossRef]
  2. de Graaf, T. International energy agency. In Handbook of Governance and Security; Edward Elgar Publishing: Cheltenham, UK, 2014; pp. 489–503. [Google Scholar]
  3. Musial, W.; Spitsen, P.; Beiter, P.; Duffy, P.; Marquis, M.; Cooperman, A.; Hammond, R.; Shields, M. Offshore Wind Market Report: 2021 Edition; Department of Energy: Washington, DC, USA, 2021. [Google Scholar]
  4. Ghosh, A.; Biswas, A.; Sharma, K.K.; Gupta, R. Computational analysis of flow physics of a combined three bladed Darrieus Savonius wind rotor. J. Energy Inst. 2015, 88, 425–437. [Google Scholar] [CrossRef]
  5. Ackermann, T.; Söder, L. Wind energy technology and current status: A review. Renew. Sustain. Energy Rev. 2000, 4, 315–374. [Google Scholar] [CrossRef]
  6. World Energy Outlook 2021; Technical Report. 2021. Available online: https://www.iea.org/reports/world-energy-outlook-2021 (accessed on 5 July 2023).
  7. Cherubini, A.; Papini, A.; Vertechy, R.; Fontana, M. Airborne Wind Energy Systems: A review of the technologies. Renew. Sustain. Energy Rev. 2015, 51, 1461–1476. [Google Scholar] [CrossRef]
  8. Salari, M.E.; Coleman, J.; Toal, D. Airborne Wind Energy—A Review. In Proceedings of the 3rd International Congress on Energy Efficiency and Energy Related Materials (ENEFM2015), Oludeniz, Turkey, 19–23 October 2015; p. 81. [Google Scholar]
  9. Cherubini, A.; Vertechy, R.; Fontana, M. Simplified model of offshore airborne wind energy converters. Renew. Energy 2016, 88, 465–473. [Google Scholar] [CrossRef]
  10. Kolar, J.W.; Friedli, T.; Krismer, F.; Looser, A.; Schweizer, M.; Friedemann, R.A.; Steimer, P.K.; Bevirt, J.B. Conceptualization and multiobjective optimization of the electric system of an airborne wind turbine. IEEE J. Emerg. Sel. Top. Power Electron. 2013, 1, 73–103. [Google Scholar] [CrossRef]
  11. Loyd, M.L. Crosswind kite power for large-scale wind power production. Energy 1980, 4, 106–111. [Google Scholar] [CrossRef]
  12. Pereira, A.F.; Sousa, J.M. A Review on Crosswind Airborne Wind Energy Systems: Key Factors for a Design Choice. Energies 2022, 16, 351. [Google Scholar] [CrossRef]
  13. Poland, J.A.; Schmehl, R. Modelling Aero-Structural Deformation of Flexible Membrane Kites. Energies 2023, 16, 5264. [Google Scholar] [CrossRef]
  14. Porta Ko, A.; Smidt, S.; Schmehl, R.; Mandru, M. Optimisation of a Multi-Element Airfoil for a Fixed-Wing Airborne Wind Energy System. Energies 2023, 16, 3521. [Google Scholar] [CrossRef]
  15. Todeschini, D.; Fagiano, L.; Micheli, C.; Cattano, A. Control of a rigid wing pumping airborne wind energy system in all operational phases. Control. Eng. Pract. 2021, 111, 104794. [Google Scholar] [CrossRef]
  16. Ali, Q.S.; Kim, M.H. Power conversion performance of airborne wind turbine under unsteady loads. Renew. Sustain. Energy Rev. 2022, 153, 111798. [Google Scholar] [CrossRef]
  17. Salari, M.E.; Coleman, J.; O’Donnell, C.; Toal, D. Experimental rig investigation of a direct interconnection technique for airborne wind energy systems. Int. J. Electr. Power Energy Syst. 2020, 123, 106300. [Google Scholar] [CrossRef]
  18. Licitra, G.; Koenemann, J.; Bürger, A.; Williams, P.; Ruiterkamp, R.; Diehl, M. Performance assessment of a rigid wing Airborne Wind Energy pumping system. Energy 2019, 173, 569–585. [Google Scholar] [CrossRef]
  19. Zillmann, U.; Bechtle, P. Emergence and economic dimension of airborne wind energy. In Airborne Wind Energy: Advances in Technology Development and Research; Springer: Berlin/Heidelberg, Germany, 2018; pp. 1–25. [Google Scholar]
  20. Fagiano, L.; Nguyen-Van, E.; Rager, F.; Schnez, S.; Ohler, C. Autonomous takeoff and flight of a tethered aircraft for airborne wind energy. IEEE Trans. Control. Syst. Technol. 2017, 26, 151–166. [Google Scholar] [CrossRef]
  21. Costello, S.; Franois, G.; Bonvin, D. Crosswind kite control—A benchmark problem for advanced control and dynamic optimization. Eur. J. Control. 2017, 35, 1–10. [Google Scholar] [CrossRef]
  22. Costello, S.; François, G.; Bonvin, D. Real-time optimizing control of an experimental crosswind power kite. IEEE Trans. Control. Syst. Technol. 2017, 26, 507–522. [Google Scholar] [CrossRef]
  23. Ahmed, M.S.; Hably, A.; Bacha, S. Kite generator system modeling and grid integration. IEEE Trans. Sustain. Energy 2013, 4, 968–976. [Google Scholar] [CrossRef]
  24. Erhard, M.; Strauch, H. Flight control of tethered kites in autonomous pumping cycles for airborne wind energy. Control. Eng. Pract. 2015, 40, 13–26. [Google Scholar] [CrossRef]
  25. Tammaruckwattana, S.; Ohyama, K.; Yue, C. Experimental assessment with wind turbine emulator of variable-speed wind power generation system using boost chopper circuit of permanent magnet synchronous generator. J. Power Electron. 2015, 15, 246–255. [Google Scholar] [CrossRef]
  26. Martinez, F.; Herrero, L.C.; de Pablo, S. Open loop wind turbine emulator. Renew. Energy 2014, 63, 212–221. [Google Scholar] [CrossRef]
  27. O’Gairbhith, C. Assessing the Viability of High Altitude Wind Resources in Ireland; Loughborough University: Loughborough, UK, 2009; Available online: http://carbontracking.com/reports/ (accessed on 6 July 2023).
  28. Boccard, N. Capacity factor of wind power realized values vs. estimates. Energy Policy 2009, 37, 2679–2688. [Google Scholar] [CrossRef]
  29. Kumar, R.; Zhu, Z.Q.; Duke, A.; Thomas, A.; Clark, R.; Azar, Z.; Wu, Z.Y. A review on transverse flux permanent magnet machines for wind power applications. IEEE Access 2020, 8, 216543–216565. [Google Scholar] [CrossRef]
  30. Bao, G.; Qi, W.; He, T. Direct torque control of PMSM with modified finite set model predictive control. Energies 2020, 13, 234. [Google Scholar] [CrossRef]
  31. Saberi, S.; Rezaie, B. Direct model predictive speed control strategy for a PMSM fed by a three-level NPC converter. J. Energy Manag. Technol. 2021, 5, 1–7. [Google Scholar]
  32. Vijayapriya, R.; Raja, P.; Selvan, M.P. Enhanced method of rotor speed and position estimation of permanent magnet synchronous Machine based on stator SRF-PLL. Eng. Sci. Technol. Int. J. 2017, 20, 1450–1459. [Google Scholar] [CrossRef]
  33. Abdallah, M.E.; Arafa, O.M.; Shaltot, A.; Aziz, G.A.A. Wind turbine emulation using permanent magnet synchronous motor. J. Electr. Syst. Inf. Technol. 2018, 5, 121–134. [Google Scholar] [CrossRef]
  34. Blaabjerg, F.; Ma, K. Future on power electronics for wind turbine systems. IEEE J. Emerg. Sel. Top. Power Electron. 2013, 1, 139–152. [Google Scholar] [CrossRef]
  35. Chen, J.; Chen, J.; Gong, C.; Wang, H. Design and analysis of dynamic wind turbine simulator for wind energy conversion system. In Proceedings of the IECON 2012—38th Annual Conference on IEEE Industrial Electronics Society, Montreal, QC, Canada, 25–28 October 2012; pp. 971–977. [Google Scholar]
  36. Kali, Y.; Saad, M.; Bouchama, A.; Dehbozorgi, R.; Paquin, J.N.; Gregoire, L.A.; Bélanger, J.; Rodas, J. HIL simulation of on-line parameters estimation and current control of a six-phase induction machine using OPAL-RT technologies. In Proceedings of the 2020 IEEE Power & Energy Society General Meeting (PESGM), Montreal, QC, Canada, 2–6 August 2020; pp. 1–5. [Google Scholar]
  37. Nath, S.R.; Bose, K.; Purkait, P. Real Time Hardware in Loop (HIL) Implementation and Control of Wind Generator. In Proceedings of the 2022 IEEE 6th International Conference on Condition Assessment Techniques in Electrical Systems (CATCON), Durgapur, India, 17–19 December 2022; pp. 171–176. [Google Scholar]
  38. Khan, M.J.; Mathew, L. Comparative analysis of maximum power point tracking controller for wind energy system. Int. J. Electron. 2018, 105, 1535–1550. [Google Scholar] [CrossRef]
  39. Tolbert, L.M.; Wang, F.; Tomsovic, K.; Sun, K.; Wang, J.; Ma, Y.; Liu, Y. Reconfigurable Real-Time Power Grid Emulator for Systems with High Penetration of Renewables. IEEE Open Access J. Power Energy 2020, 7, 489–500. [Google Scholar] [CrossRef]
  40. Texas A & M University at Qatar; Exxon Mobil Corporation; Institute of Electrical and Electronics Engineers. In Proceedings of the 2014 26th International Conference on Microelectronics (ICM), Doha, Qatar, 14–17 December 2014; p. 243. Available online: https://www.qatar.tamu.edu/news-and-events/news/Texas-A-M-University-at-Qatar-hosts-26th-International-Conference-on-Microelectronics-ICM-2014 (accessed on 5 July 2023).
  41. Gheisarnejad, M.; Khooban, M.H. Secondary load frequency control for multi-microgrids: HiL real-time simulation. Soft Comput. 2019, 23, 5785–5798. [Google Scholar] [CrossRef]
  42. Merabet, A.; Tawfique, K.A.; Islam, M.A.; Enebeli, S.; Beguenane, R. Wind turbine emulator using OPAL-RT real-time HIL/RCP laboratory. In Proceedings of the 2014 26th International Conference on Microelectronics (ICM), Doha, Qatar, 14–17 December 2014; pp. 192–195. [Google Scholar]
  43. Castelino, R.V.; Kumar, P.; Kashyap, Y.; Karthikeyan, A.; Sharma, K.M.; Karmakar, D.; Kosmopoulos, P. Exploring the Potential of Kite-Based Wind Power Generation: An Emulation-Based Approach. Energies 2023, 16, 5213. [Google Scholar] [CrossRef]
  44. Coleman, J.; Ahmad, H.; Pican, E.; Toal, D. Non-reversing generators in a novel design for pumping mode airbornewind energy farm. Airborne Wind. Energy 2013, 587–597. [Google Scholar]
  45. Ahmed, M.; Hably, A.; Bacha, S.; Ovalle, A. Kite generator system: Grid integration and validation. In Proceedings of the IECON 2014—40th Annual Conference of the IEEE Industrial Electronics Society, Dallas, TX, USA, 29 October–1 November 2014; pp. 2139–2145. [Google Scholar]
  46. Doe, M. Niche Strategy Selection for Kite-Based Airborne Wind Energy Technologies. 2014. Available online: https://repository.tudelft.nl/islandora/object/uuid:bc413359-67f3-4872-a514-9dedd825ec9d (accessed on 5 July 2023).
  47. Suman, K.; Mathew, A.T. Speed control of permanent magnet synchronous motor drive system using PI, PID, SMC and SMC plus PID controller. In Proceedings of the 2018 International Conference on Advances in Computing, Communications and Informatics (ICACCI), Bangalore, India, 19–22 September 2018; pp. 543–549. [Google Scholar]
  48. Schmidt, E.; de Oliveira, M.D.L.C.; da Silva, R.S.; Fagiano, L.; Neto, A.T. In-flight estimation of the aerodynamics of tethered wings for airborne wind energy. IEEE Trans. Control. Syst. Technol. 2019, 28, 1309–1322. [Google Scholar] [CrossRef]
  49. van der Vlugt, R.; Bley, A.; Noom, M.; Schmehl, R. Quasi-steady model of a pumping kite power system. Renew. Energy 2019, 131, 83–99. [Google Scholar] [CrossRef]
  50. Castelino, R.V.; Kashyap, Y.; Kosmopoulos, P. Airborne Kite Tether Force Estimation and Experimental Validation Using Analytical and Machine Learning Models for Coastal Regions. Remote Sens. 2022, 14, 6111. [Google Scholar] [CrossRef]
Figure 1. Technique for producing electricity by kite flight: In order to generate electricity, a kite flies in a figure-eight pattern, which pulls a tether looped around a drum.
Energies 16 06804 g001
Figure 2. Kite-based electricity generation: a power profile.
Energies 16 06804 g002
Figure 3. Schematic Representation of a LAWECS.
Energies 16 06804 g003
Figure 4. The 2D force diagram depicts the lifting body during crosswind flight. Adapted from [46].
Energies 16 06804 g004
Figure 5. Equivalent electrical circuit diagram of PMSM.
Energies 16 06804 g005
Figure 6. DC/AC converter with PMSM.
Energies 16 06804 g006
Figure 7. Matlab simulink Block diagram for wind speed to drum power conversion process.
Energies 16 06804 g007
Figure 8. Emulator flow chart for the LAWECS System.
Energies 16 06804 g008
Figure 9. Proposed Control Mechanism for the LAWECS Emulator System.
Energies 16 06804 g009
Figure 10. Speed Regulator Loop of the PMSM.
Energies 16 06804 g010
Figure 11. Load Power Regulator Loop.
Energies 16 06804 g011
Figure 12. Implementation of LAWECS in RT-LAB.
Energies 16 06804 g012
Figure 13. The real-time experimental setup.
Energies 16 06804 g013
Figure 14. Flow Chart of model execution in RT-LAB .
Energies 16 06804 g014
Figure 15. Kite Dynamic Properties: (a) Wind speed, (b) Tether force, (c) RT-Wind speed and tether force, (d) Drum torque, (e) Drum speed, and (f) RT-drum torque and speed.
Energies 16 06804 g015
Figure 16. Kite Dynamic Properties: (a) Drum power, (b) Kite power, (c) RT-Drum and kite power, (d) Reference torque of motor (e) Reference speed of the motor and (f) RT-Reference torque and speed of the motor.
Energies 16 06804 g016
Figure 17. No-Load Real-Time Simulation Results: (a) Speed of coupled machines, (b) RT Speed of coupled machines, (c) Generator current, (d) RT generator current, (e) Generator voltage, (f) RT Generator voltage, (g) Generator voltage (zoom), and (h) RT Generator voltage (zoom).
Energies 16 06804 g017
Figure 18. Real-Time simulation result: (a) Couplings speed, (b) RT Couplings speed, (c) Couplings torque, (d) RT coupling torque, (e) Couplings power, (f) RT Couplings power, (g) Generator torque, and (h) RT Generator torque.
Energies 16 06804 g018aEnergies 16 06804 g018b
Figure 19. Real-Time simulation result: (a) Generator current, (b) RT Generator current, (c) Generator current(zoom), (d) RT Generator current(zoom), (e) Generator voltage, (f) RT Generator voltage, (g) Generator output power, and (h) RT Generator output power.
Energies 16 06804 g019
Figure 20. Real-Time Simulation of output power in three distinct tests at the generator terminal: (a) 2 kW, (b) RT 2 kW, (c) 20 kW, (d) RT 20 kW, (e) 60 kW, (f) RT 60 kW, and (f) RT 60 kW.
Energies 16 06804 g020aEnergies 16 06804 g020b
Figure 21. Satellite wind data: (a) Yearly profile of winds at 10 m above ground, and (b) Daily profile of winds throughout the month of July.
Energies 16 06804 g021
Figure 22. Satellite Wind data: (a) a yearly profile of winds at 50 m above ground, and (b) a daily profile of winds throughout the month of July.
Energies 16 06804 g022
Figure 23. Simulation hourly satellite wind data at 50 m height: (a) Wind speed (b) Motor speed, (c) RT Wind and motor speed, (d) Estimated kite power from physical model (PM), (e) Generator power, and (f) RT Kite and generator power.
Energies 16 06804 g023
Figure 24. Simulation hourly satellite wind data at 50 m height: (a) Wind speed (b) Motor Speed, (c) RT Wind and Motor Speed, (d) Estimated Kite Power of PM, (e) Generator Power, and (f) RT Kite and Generator Power.
Energies 16 06804 g024
Figure 25. Experimental ground data simulation results: (a) Wind Speed (b) Motor Speed (c) RT Wind and Motor speed, (d) Measured Kite Power of Field Test, (e) Generator electrical power, and (f) RT Measured Field kite, estimated kite of PM and generator output power.
Energies 16 06804 g025aEnergies 16 06804 g025b
Table 1. Analytical comparison of kite emulator is presented in the table below.
ParameterCastelino, R.V. et al., 2023 [43]Proposed Work
Kite surface area2.5 m 2 , 14 m 2 , & 60 m 2 5 m 2 , 25 m 2 & 70 m 2
Aerodynamic coefficient1.125, 2.875 & 3.8251.965, 3.8265 & 4.235
Wind speed2 m/s to 12.25 m/s1 m/s to 10 m/s
Different power ratings1 kW, 10 kW & 100 kW2 kW, 20 kW & 60 kW
Gear ratio56
Satellite wind dataMonth of AugustMonth of July
Table 2. Three test cases’ parameters for the LAWECS emulator.
Parameter2 kW20 kW60 kW
Kite area5 m 2 25 m 2 70 m 2
Aerodynamic coefficient1.9653.82654.235
Wind speed1–10 m/s1–10 m/s1–10 m/s
Air density1.225 kg/m 3 1.225 kg/m 3 1.225 kg/m 3
Gear ratio666
Rated voltage of machines375 V375 V375 V
Rated speed of machines1500 rpm1500 rpm1500 rpm
Pole pairs of machines444
Maximum torque of machines12 Nm127 Nm382 Nm
Table 3. A set of 10 data points, sampled from the field test data, were used in the simulation.
Data PointYaw
(Degrees)
Pitch
(Degrees)
Roll
(Degrees)
Altitude
(m)
Tether Force
(N)
Wind Speed
(m/s)
Wind Direction (Degrees)
150.67−132.1647.982.20491.793.6018
248.36−136.1151.893.10494.613.5515
345.95−144.1053.985.80462.713.5710
447.20−148.2155.086.50473.033.629
548.22−150.1945.788.30471.853.6312
652.35−152.2036.569.20461.113.6414
754.91−154.9930.1411.10382.053.647
856.08−155.9926.2311.50292.123.707
954.81−159.9826.1613.30264.333.7216
1053.57−165.8928.3714.10222.233.6913
Disclaimer/Publisher’s Note: The statements, opinions and data contained in all publications are solely those of the individual author(s) and contributor(s) and not of MDPI and/or the editor(s). MDPI and/or the editor(s) disclaim responsibility for any injury to people or property resulting from any ideas, methods, instructions or products referred to in the content.

