


A Fuzzy Logic Approach to Health Index Determination for a Gas-Insulated Switchgear


1
Electrical and Software Systems Engineering, The Sirindhorn International Thai-German Graduate School of Engineering (TGGS), King Mongkut’s University of Technology North Bangkok, Bangkok 10800, Thailand
2
Department of Electrical and Computer Engineering, Faculty of Engineering, King Mongkut’s University of Technology North Bangkok, Bangkok 10800, Thailand
*
Author to whom correspondence should be addressed.
Energies 2023, 16(18), 6605; https://doi.org/10.3390/en16186605
Submission received: 13 August 2023
/
Revised: 11 September 2023
/
Accepted: 11 September 2023
/
Published: 13 September 2023
(This article belongs to the Topic Condition Monitoring and Diagnostic Methods for Power Equipment in New Energy Power Systems)
Abstract
:This paper presents a fuzzy logic approach, a simplified and adaptable method, to determine the health index of gas-insulated switchgear (GIS) bay and their compartments. Since the traditional weighting and scoring method (WSM) is a subjective method, the fuzzy logic approach has been applied to enhance the accuracy of the health index (HI) determination by evaluating the detectable degradation and the incorporated conditional factor (CF) considering actual operating conditions and invisible ageing. The input data are first obtained from routine inspection and time-based testing and then converted to numerical values as the fuzzy logic model input to compute the component HI. The bay HI values are further calculated by applying the WSM using the obtained component of the HI. Then, the accuracy of the obtained HI of the bay has been improved by multiplying with the CF to obtain the overall bay HI values. The proposed methodology was implemented in an independent power producer in a large industrial estate in Thailand to evaluate 175 GIS bays with actual data. The results were compared against other HI evaluation techniques with a satisfactory outcome. Finally, the overall bay HI is used to prioritize maintenance activity, to effectively allocate human resources, to prevent unplanned outages, and to achieve cost-effective, condition-based maintenance.
1. Introduction
A gas-insulated switchgear (GIS) can be described as a compact, multicomponent assembly, enclosed in a grounded metallic housing filled with insulating gas, usually SF6, which makes it ideal for deployment in limited areas and harsh environments [1]. It serves as a crucial component in the electrical system to provide efficient and secure operation as well as safety to humans working with it. In a GIS module, its primary components can be divided into several compartments including the power circuit breaker (CB), earthing switch (ES), disconnecting switch (DS), high-speed earthing switch (HS), current transformer (CT), voltage transformer (VT), gas compartment (COMPT), and local control cabinet (LCC). Even though GIS equipment possesses an exceptional level of reliability and requires minimal maintenance, it may deteriorate over time due to various factors, such as environmental conditions, usage stresses, and aging [2,3]. Hence, it should be regularly maintained and inspected in accordance with the predetermined time interval recommended by the manufacturer. According to Cigre’s survey [4], GIS bays with distribution line function have the highest number of major failures, mainly due to malfunctions in response to commands, whereas in minor failure mode, small SF6 leakage occupies the highest percentage. Since the failure consequences caused by such major failures could probably lead to area-wide power outages and a high penalty in cost due to energy not supplied (ENS), preventive maintenance of a GIS should be thoroughly conducted to identify potential defects early and to take corrective action to prevent unplanned outages. In accordance with the schedule maintenance of a GIS, comprehensive inspections, testing, and various diagnostic methods are applied to access the health of the GIS components [5,6,7,8,9].
The obtained data from routine inspections and preventive maintenance can be subsequently processed to determine the actual condition of GIS components. Various methods have been proposed for condition evaluation of high-voltage equipment such as the analytic hierarchy process (AHP) [10,11,12,13,14], weighting and scoring method (WSM) [10,12,13,14,15,16], fuzzy logic approach [17,18,19,20], artificial neural networks (ANN) [21,22,23], statistical approaches [16,24,25,26,27,28], and diagnostic methods of condition monitoring [27,29,30,31,32,33,34]. However, a few studies have proposed evaluating the condition of the GIS in terms of a health index. The WSM with the aid of the AHP technique has been presented as a method to assess the condition of GISs and high-voltage (HV) equipment by processing the field testing results to determine the HI of the GIS and HV equipment [11,13]. A procedure for GIS health assessment using the WSM and the pair-wise comparison of the AHP technique to determine the weighting value was proposed in [12] to effectively plan the maintenance tasks. Subsequently, a conditional factor and dynamic health index were proposed in [14] to enhance the HI accuracy determined from the traditional WSM and AHP methods. Then, an HI with risk assessment model for GISs in a tropical region based on norms and weighting factors was presented in [16]. However, the WSM for HI determination is subjective, because its result depends significantly on the assigned weighting value and it does not consider the dependence among input parameters, which could lead to inconsistent results. Then, the fuzzy logic approach, as an adaptable methodology via the fuzzy rule-based system (FRBS) and setup criteria, could be applied to correlate the relationship among input data as presented in [18] as an example of the application of the fuzzy logic approach to the prioritization of a maintenance schedule for the SF6 circuit breakers in transmission systems based on reliability performance. Moreover, other techniques proposed to assess the condition of a GIS such as the statistical approach and an ANN still have some limitations in the practical assessment because they require data interpretation for specific models and lack failure information [6,35]. Therefore, to avoid bias in the WSM and to obtain realistic HI results, a combination of an analytical approach with a fuzzy logic system is proposed in this work.
Therefore, this paper aims to present a health index determination of a GIS using the fuzzy logic approach, which is a simplified and adaptable method for evaluating the condition of a GIS in terms of the component HI and conditional factor. In this study, the fuzzy logic model is developed for GIS health index determination and validated with the conventional WSM and the HI dominant score techniques. Afterward, the proposed procedure is implemented to evaluate the condition of 175 GIS bays in 115 kV and 230 kV networks of an independent power producer. Then, the HI and condition assessment results of those GIS bays are compared with their actual condition to ensure a trustworthy result. As a consequence, the HI results could be used to effectively plan the GIS utilization and to properly prioritize the required maintenance tasks based on the actual health of each GIS compartment and the available resources. Finally, the preventive maintenance could be gradually shifted to condition-based maintenance.
The rest of the paper is organized as follows: Section 2 describes the field diagnostic testing and maintenance data as input of the fuzzy logic model. Section 3 explains the condition assessment methodology. The condition assessment result and its validation with other methods, as well as the result discussion, are described in Section 4. Finally, Section 5 presents the conclusion drawn from this research.
2. Field Diagnostics Testing and Maintenance Data
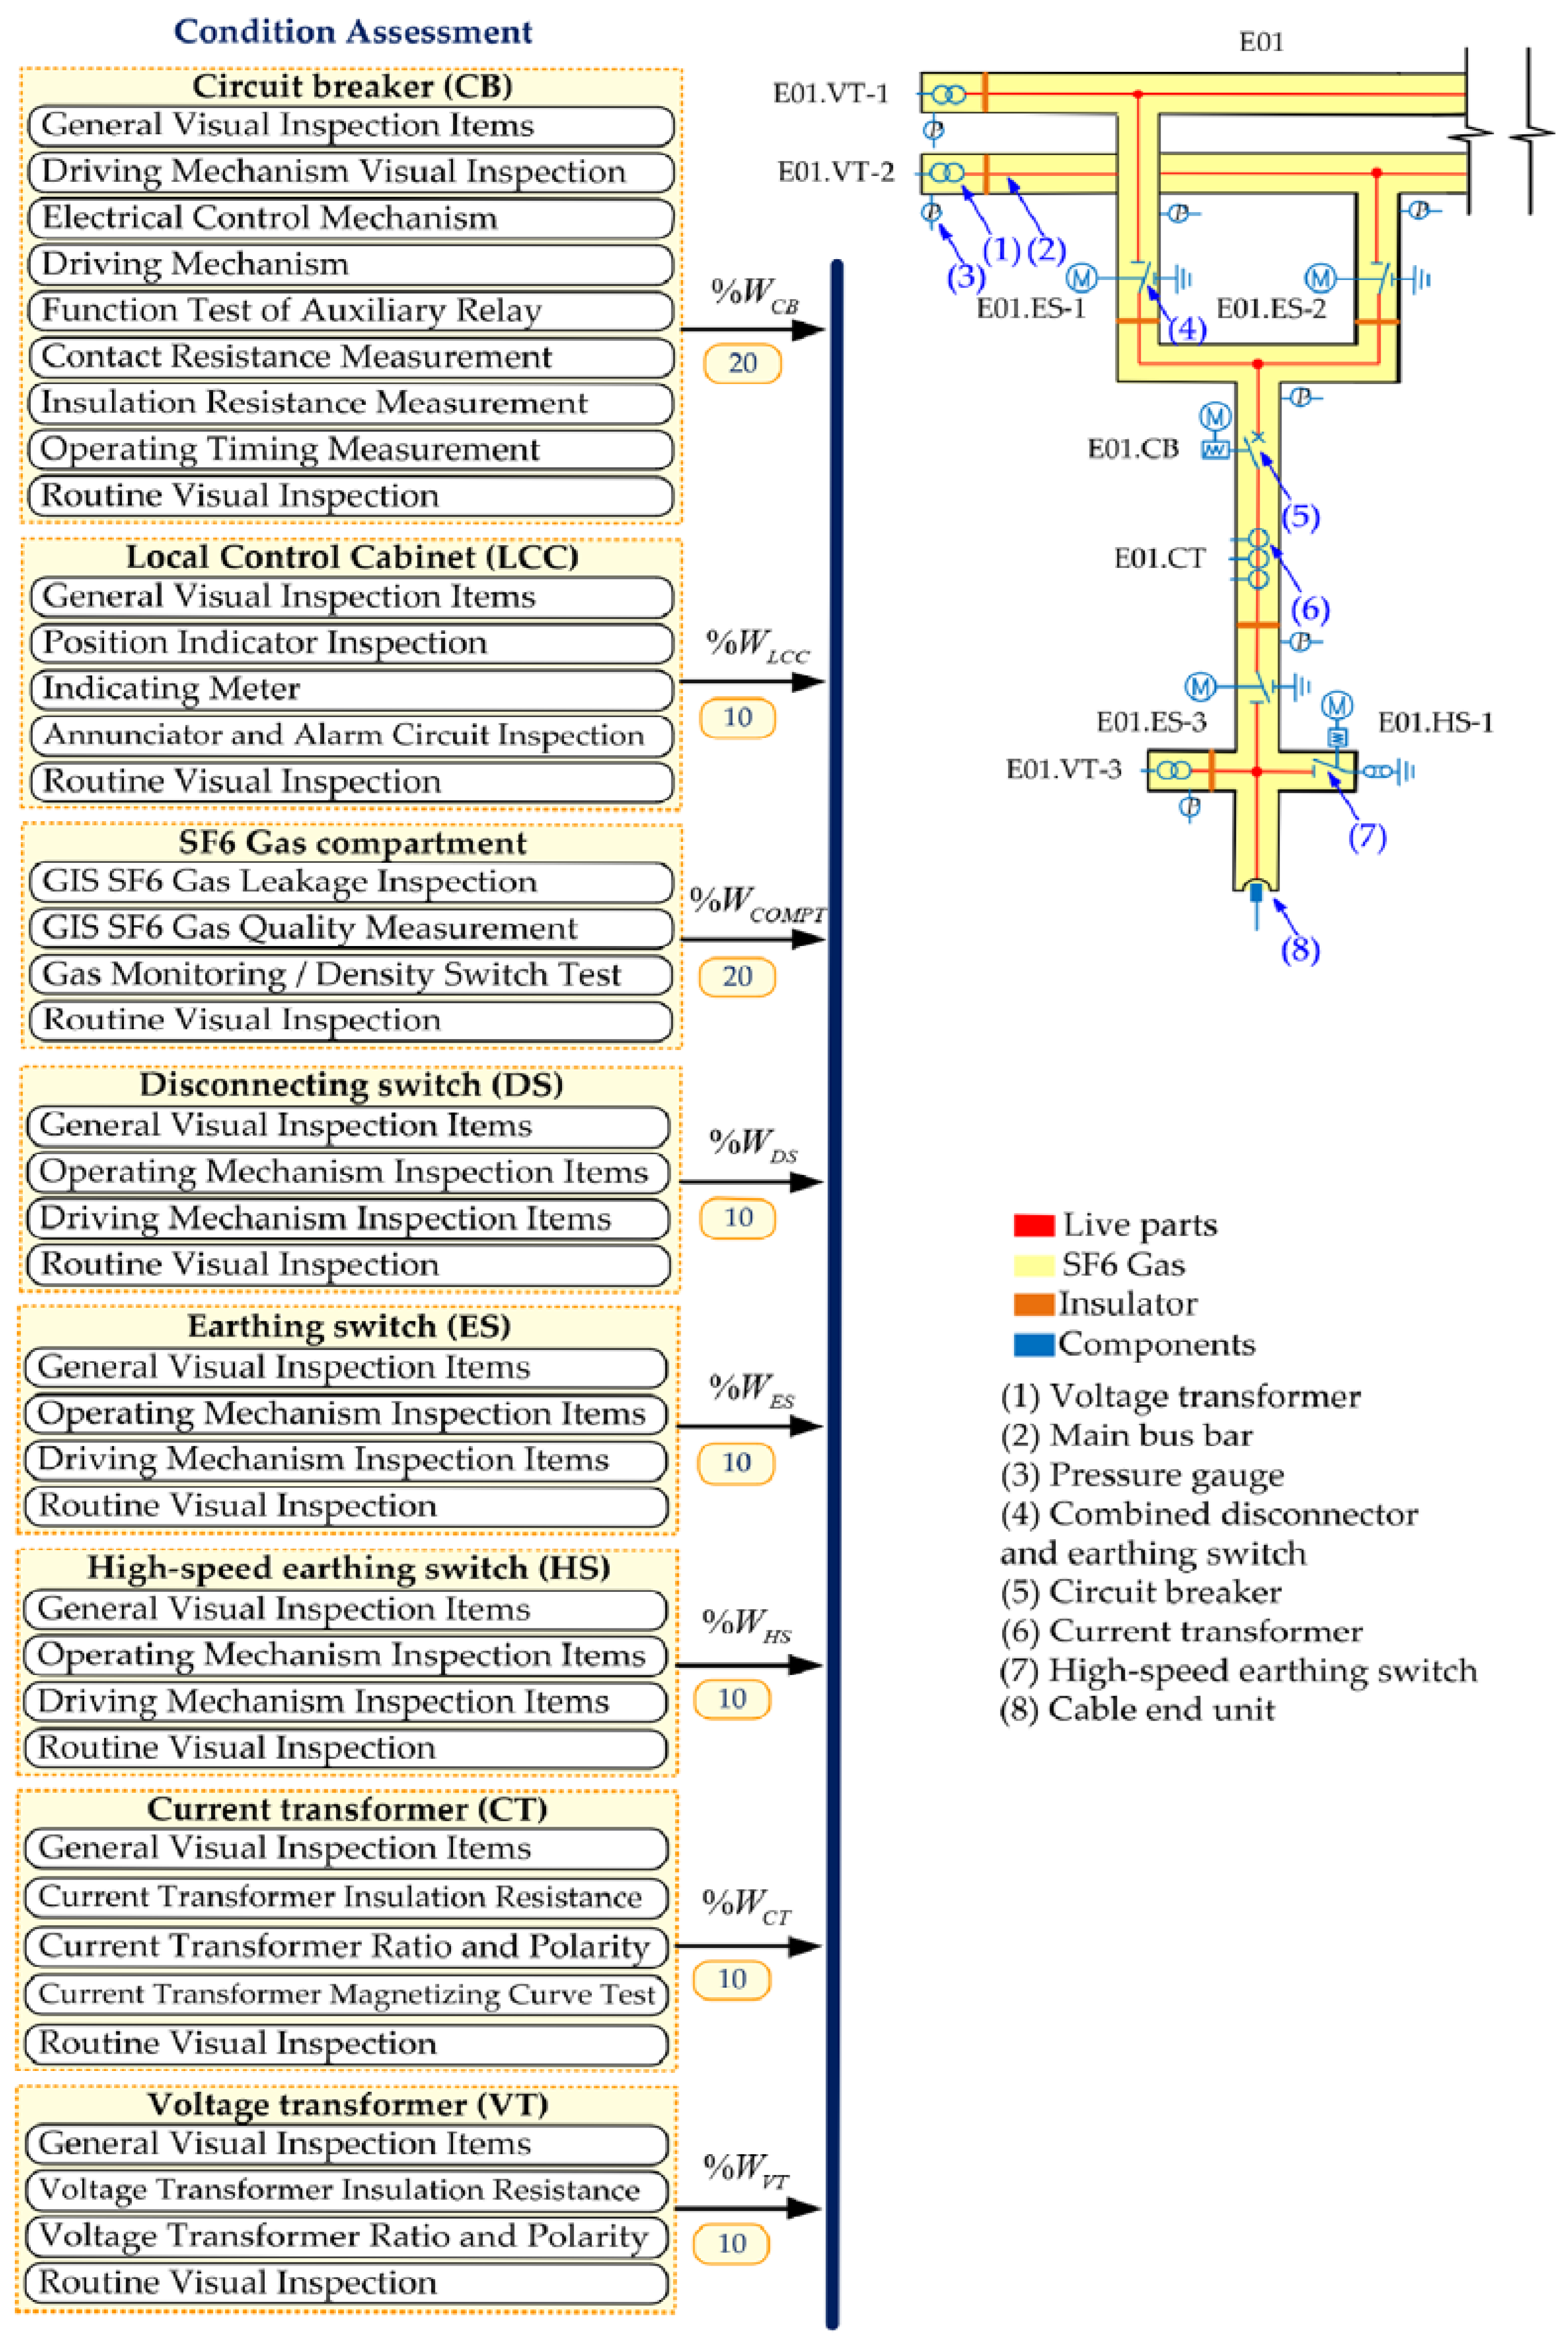
The frequency and scope of maintenance can be adjusted depending on the type and usage of GIS, as well as its operating conditions. The approved maintenance data consisting of a routine visual inspection (RVI) every 3 months and major maintenance every 3–5 years in accordance with the scheduled maintenance plan is systematically recorded in the database. Then, the GIS components are classified as eight major components, CB, ES, DS, HS, CT, VT, LCC, and COMPT, as shown in Figure 1.
The physical information from testing and maintenance of those components is transformed to numerical scores as inputs for the fuzzy logic approach. In Figure 1, the practical testing and inspection methods of each GIS component are presented, and the weighing factors (WC) are applied to reduce the complexity of the fuzzy logic model and to determine the bay HI with the WSM. The experts in utility were invited to brainstorm their opinions via the AHP to determine WC as described in [14].
Field diagnostic testing and maintenance are regularly performed in accordance with a predetermined time interval to ensure optimal performance of equipment, facilities, or systems, and to prevent breakdowns or failures. In practice, the manufacturer’s recommendations and international standards prescribe preventive maintenance tasks for HV equipment, including, but not limited to, (1) visual inspection to detect damage or wear, reading of measured parameters such as temperature, pressure, status indicator, and oil level, (2) equipment cleaning and lubrication of moving parts like gears, bearings, and motors to reduce friction and wear, (3) inspection by using measuring instruments to ensure that they operate within specified tolerances, (4) replacement of worn or damaged parts such as filters and seals, and (5) conducting tests to verify proper equipment operation and detect any defect that may require corrective action in accordance with recommendations and practical implementations presented in [5,7,8,36,37,38].
3. Fuzzy Logic Approach for Condition Assessment
The fuzzy logic approach based on the principle of fuzzy sets and an FRBS of fuzzy logic is applied to determine the HI of GIS components because it is an efficient and adaptable methodology for correlating the relationship among input data obtained from various testing and maintenance methods. The application of the fuzzy logic approach and the proposed HI determination procedure are described in this section.
3.1. Application of Fuzzy Logic Approach
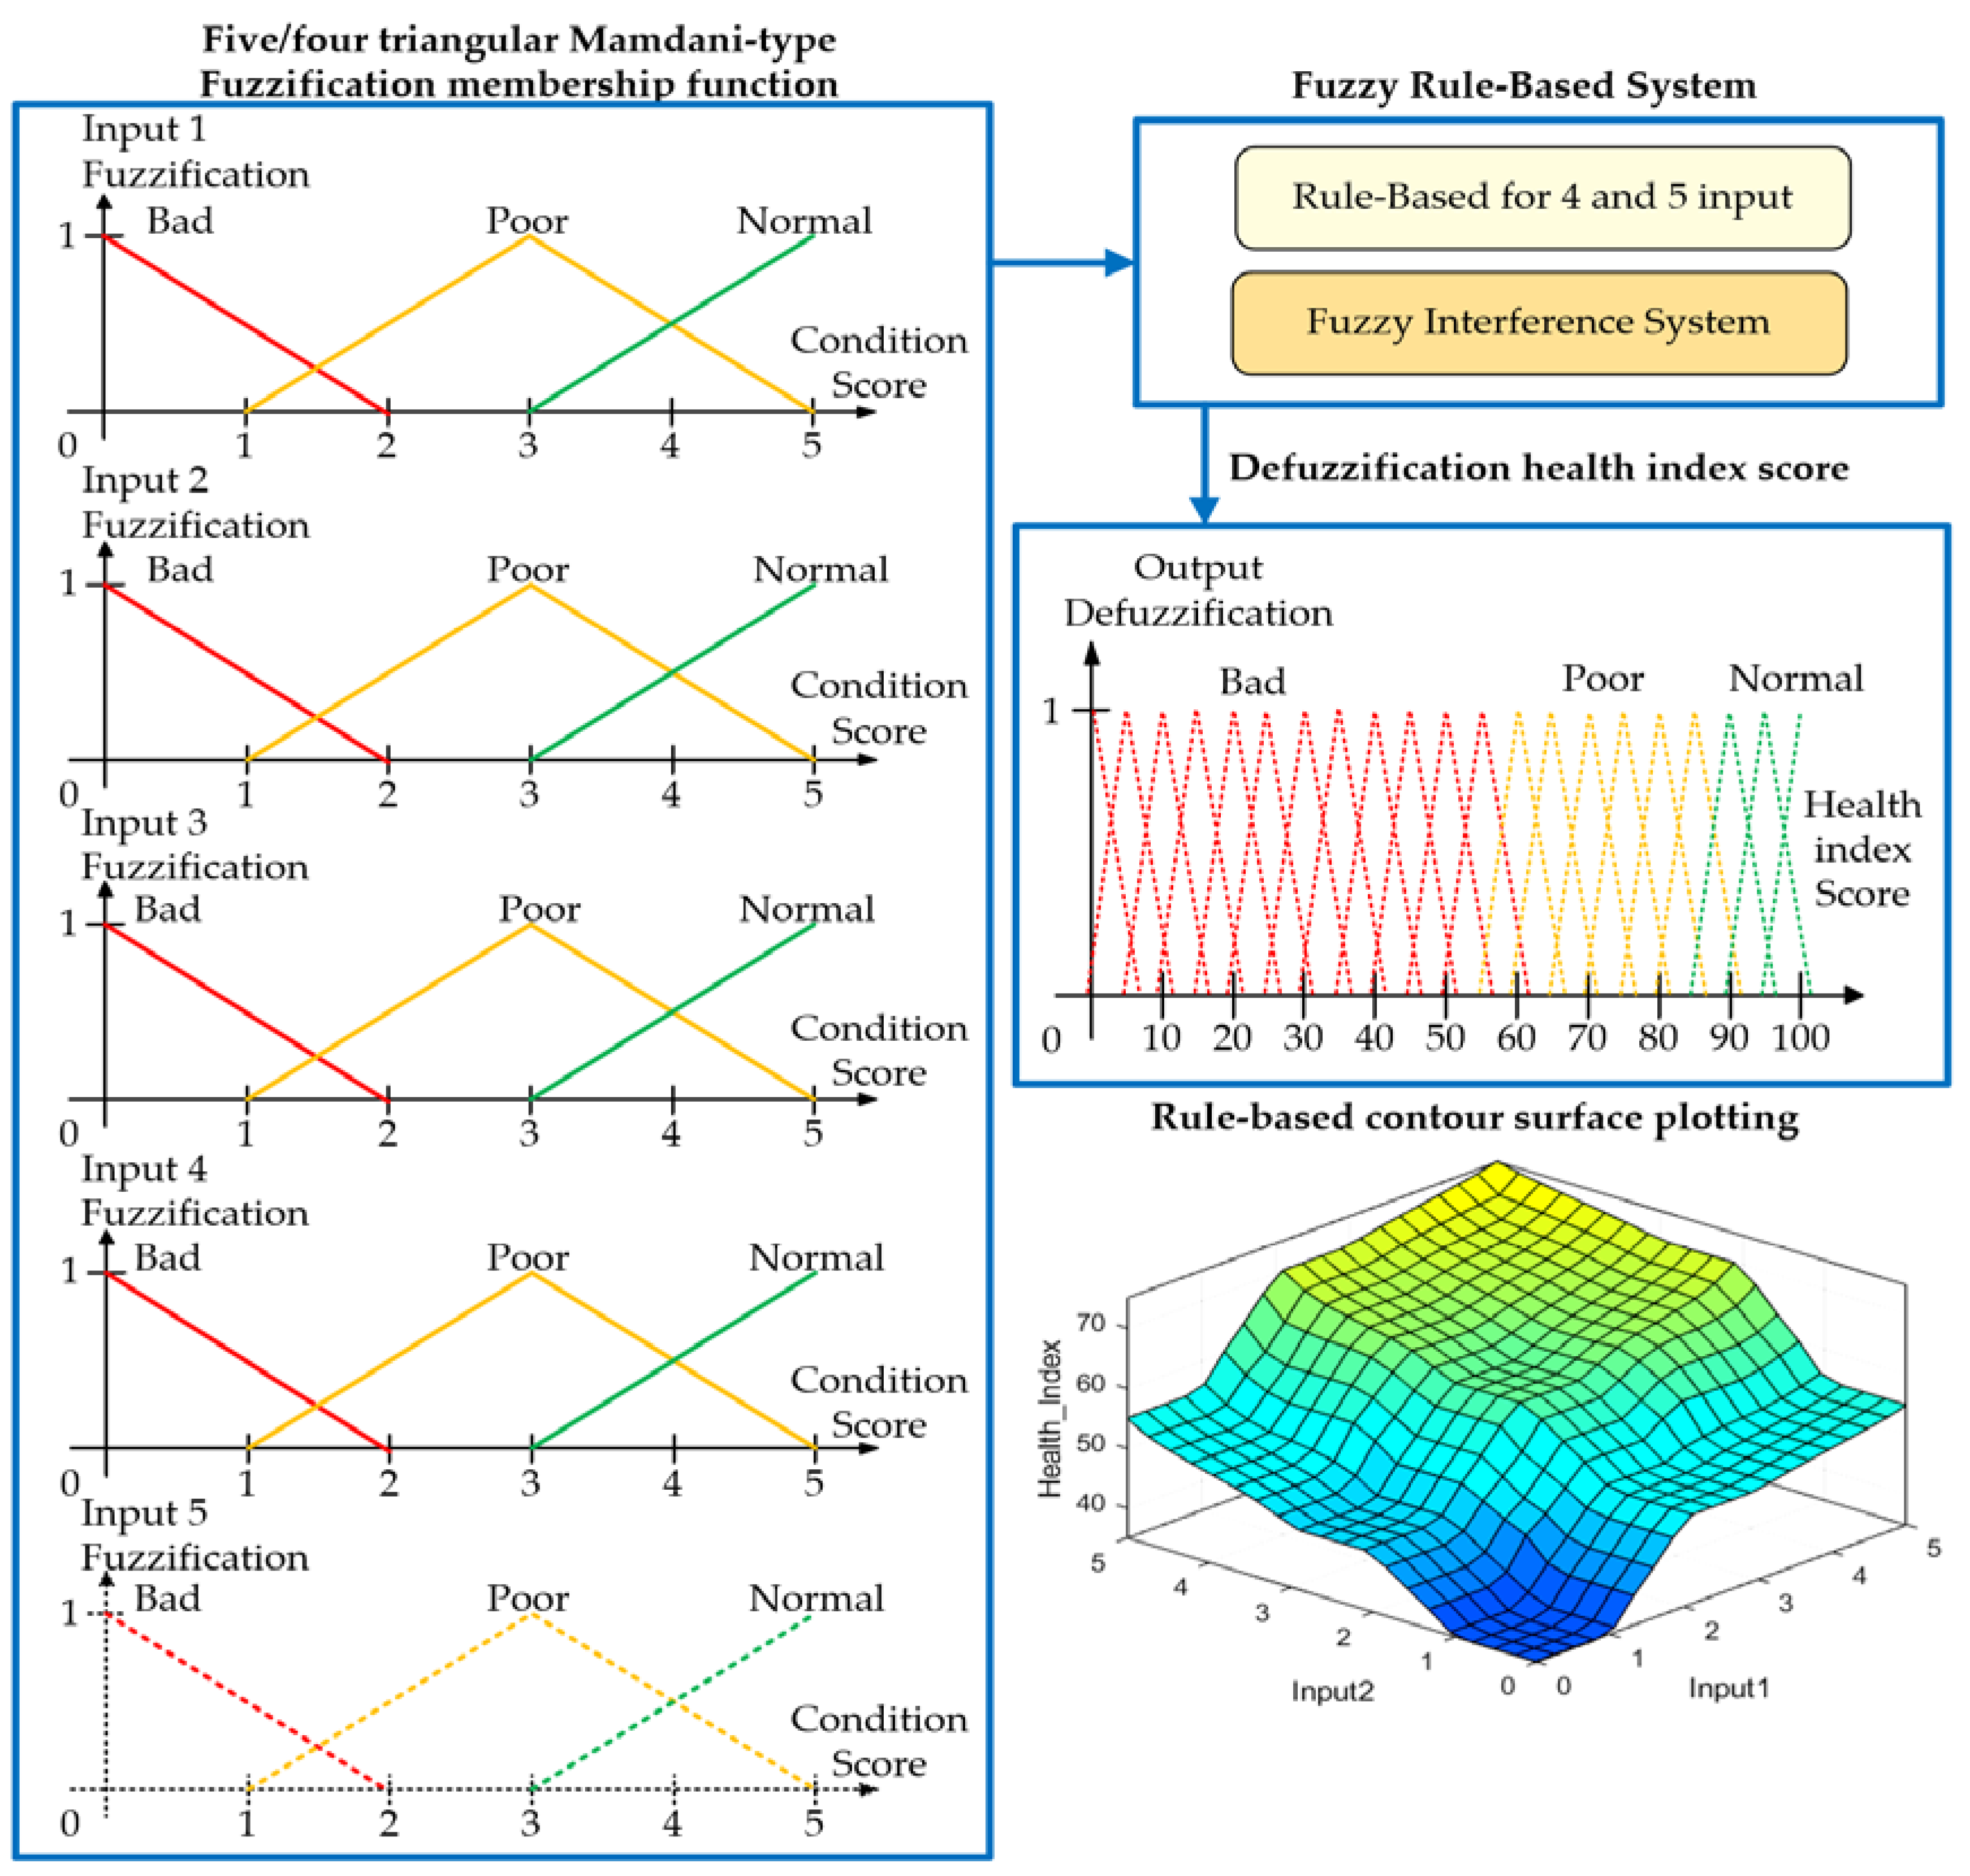
The triangular Mamdani-type fuzzy rule-based system is a common method to apply a fuzzy logic approach to a given problem. This method uses triangular membership functions to represent input and output variables of the system, and the Mamdani-type inference to make decisions based on the input–output relationship, where each fuzzy set is characterized by a triangular membership function. The membership function is used to determine the degree of membership of an element within a fuzzy set. It is specified by three parameters: the left shoulder, the peak, and the right shoulder, as in Equation (1):
where f(x; a, b, c) is the output curve of the membership function, and x is the input type of the testing method in score.
The range of membership functions of the fuzzy set is determined based on the criteria listed in Tables 2–7 in [14], with the values as follows: “0” is designated as “Bad” condition, “3” as “Poor” condition, and “5” as “Normal” condition. In terms of defining the range of the membership function, it should be overlapped to ensure a continuous transition for value evaluation. To establish shape boundaries of each membership function, overlapping areas should be specified. The midpoint value “b” is used as a reference point or peak, and then “2” scores are expanded to the left shoulder “a” and the right shoulder “c”. The “Bad” condition will overlap with the “Poor” condition in the range from score “1” to score “2”. Since the range of “Poor” and “Normal” are more sensitive to health index changes, the range of overlapping areas is between score “3” and score “5” for the “Normal” and “Poor” conditions. For instance, a value of a = 3, b = 5, and c = 5 defines a “normal” range, while a = 1, b = 3, and c = 5 defines a “poor” range and a = 0, b = 0, and c = 2 defines a “bad” range, as shown in Figure 2. As the values of parameters, a, b, and c have a strong influence on the output curve of the triangular membership function, they should be properly adjusted to minimize the parametric uncertainty.
From the above explanation, a set of fuzzy rules can be established to connect the input and output variables of the system. Each rule in the FRBS is represented in the form of an “IF-THEN” statement. The previous part of the arithmetic statement represents the input variable, while the consequential part represents the output variable. For example, a rule may state, ‘IF’ the input variables are ‘Input 1’, ‘Input 2’, ‘Input 3’, ‘Input 4’, and ‘Input 5’, ‘THEN’ the output variable is ‘Output’. The inference engine of the system applies these fuzzy rules to the input variables to compute the activation degree of each rule. The output variable is derived by combining the activation degree of each rule with its corresponding output membership function known as a Mamdani-type inference. Finally, the output variable is defuzzified to determine a clear output value representing the decision of the system.
From the above fuzzy logic theory, the traditional WSM condition assessment procedure can be enhanced by the implementation of the FRBS and fuzzy logic model. To prepare the input data of the fuzzy logic model, field-testing data from various testing and inspection methods must be transformed to numerical scores based on inspected conditions, with a score of 5 representing “Normal”, 3 as “Poor”, and 0 as “Bad” condition. Then, the raw testing and maintenance data of 175 GIS bays recorded in a database management system were converted into numerical input scores. To apply the fuzzy logic approach, a technical assessment procedure and invisible ageing criteria are investigated and studied to design the number of fuzzy logic inputs for the health index and conditional factor determinations. In this paper, the fuzzy logic model is developed for two-input, four-input, and five-input variables. To construct the FRBS, the number of fuzzy logic inputs must be clearly determined to design the FRBS number, which is calculated based on the number of membership functions raised to the power of the number of fuzzy logic inputs. For instance, if there are four fuzzy logic inputs, then the FRBS would consist of 81 rules, whereas if there are five fuzzy logic inputs, the FRBS would contain 243 rules. This demonstrates the complexity of the FRBS because the greater the number of fuzzy logic inputs and membership functions, the more fuzzy rules need to be set up.
To reduce the parametric uncertainty, a test data set representing bad, poor, and normal conditions is set up to test the proposed fuzzy logic model by observing the HI output. The obtained HI values are compared with those from the WSM and a mismatch greater than 6% required the adjustment of some FRBS values to yield the appropriate outcome as expected from the input data. Then, the actual data of 175 GIS bays could be systematically input to the fuzzy logic model.
3.2. Circuit Breaker Condition Evaluation
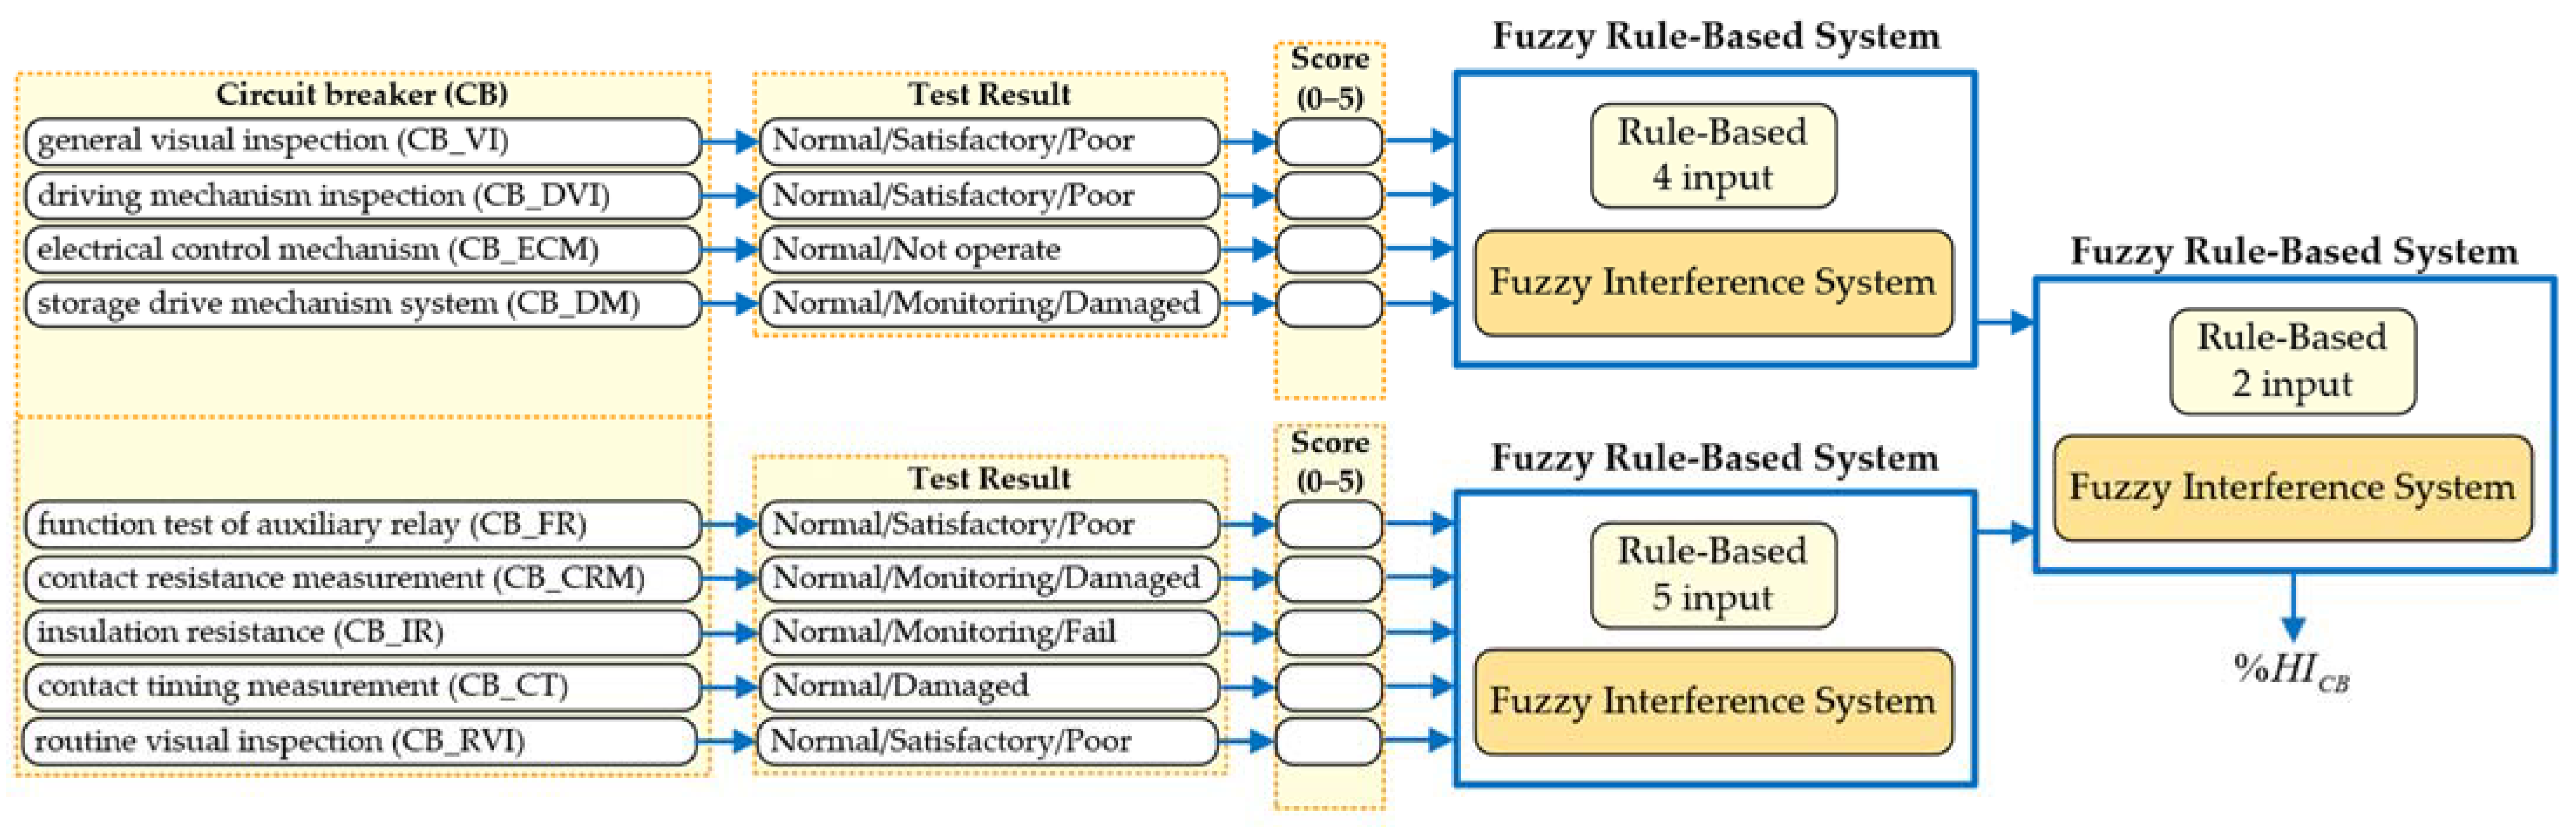
In a distribution system, the circuit breaker is the most important switching device for making, carrying, and interrupting the current in both normal and abnormal conditions [1,39]. To ensure its satisfactory operation, regular maintenance and inspections are conducted, consisting of a visual inspection of the general condition and physical damage, inspection and testing of the operating mechanism, measurement of electrical parameters related to switching operations such as contact timing, contact resistance, and insulation resistance measurements, as well as function tests of control and interlocking systems. Subsequently, the obtained test results are transformed to numerical scores based on the setup criteria based on international standards and recommendations as well as the instruction manual and organizational experience [14]. The obtained scores are further applied to input variables of the fuzzy logic model, as shown in Figure 3.
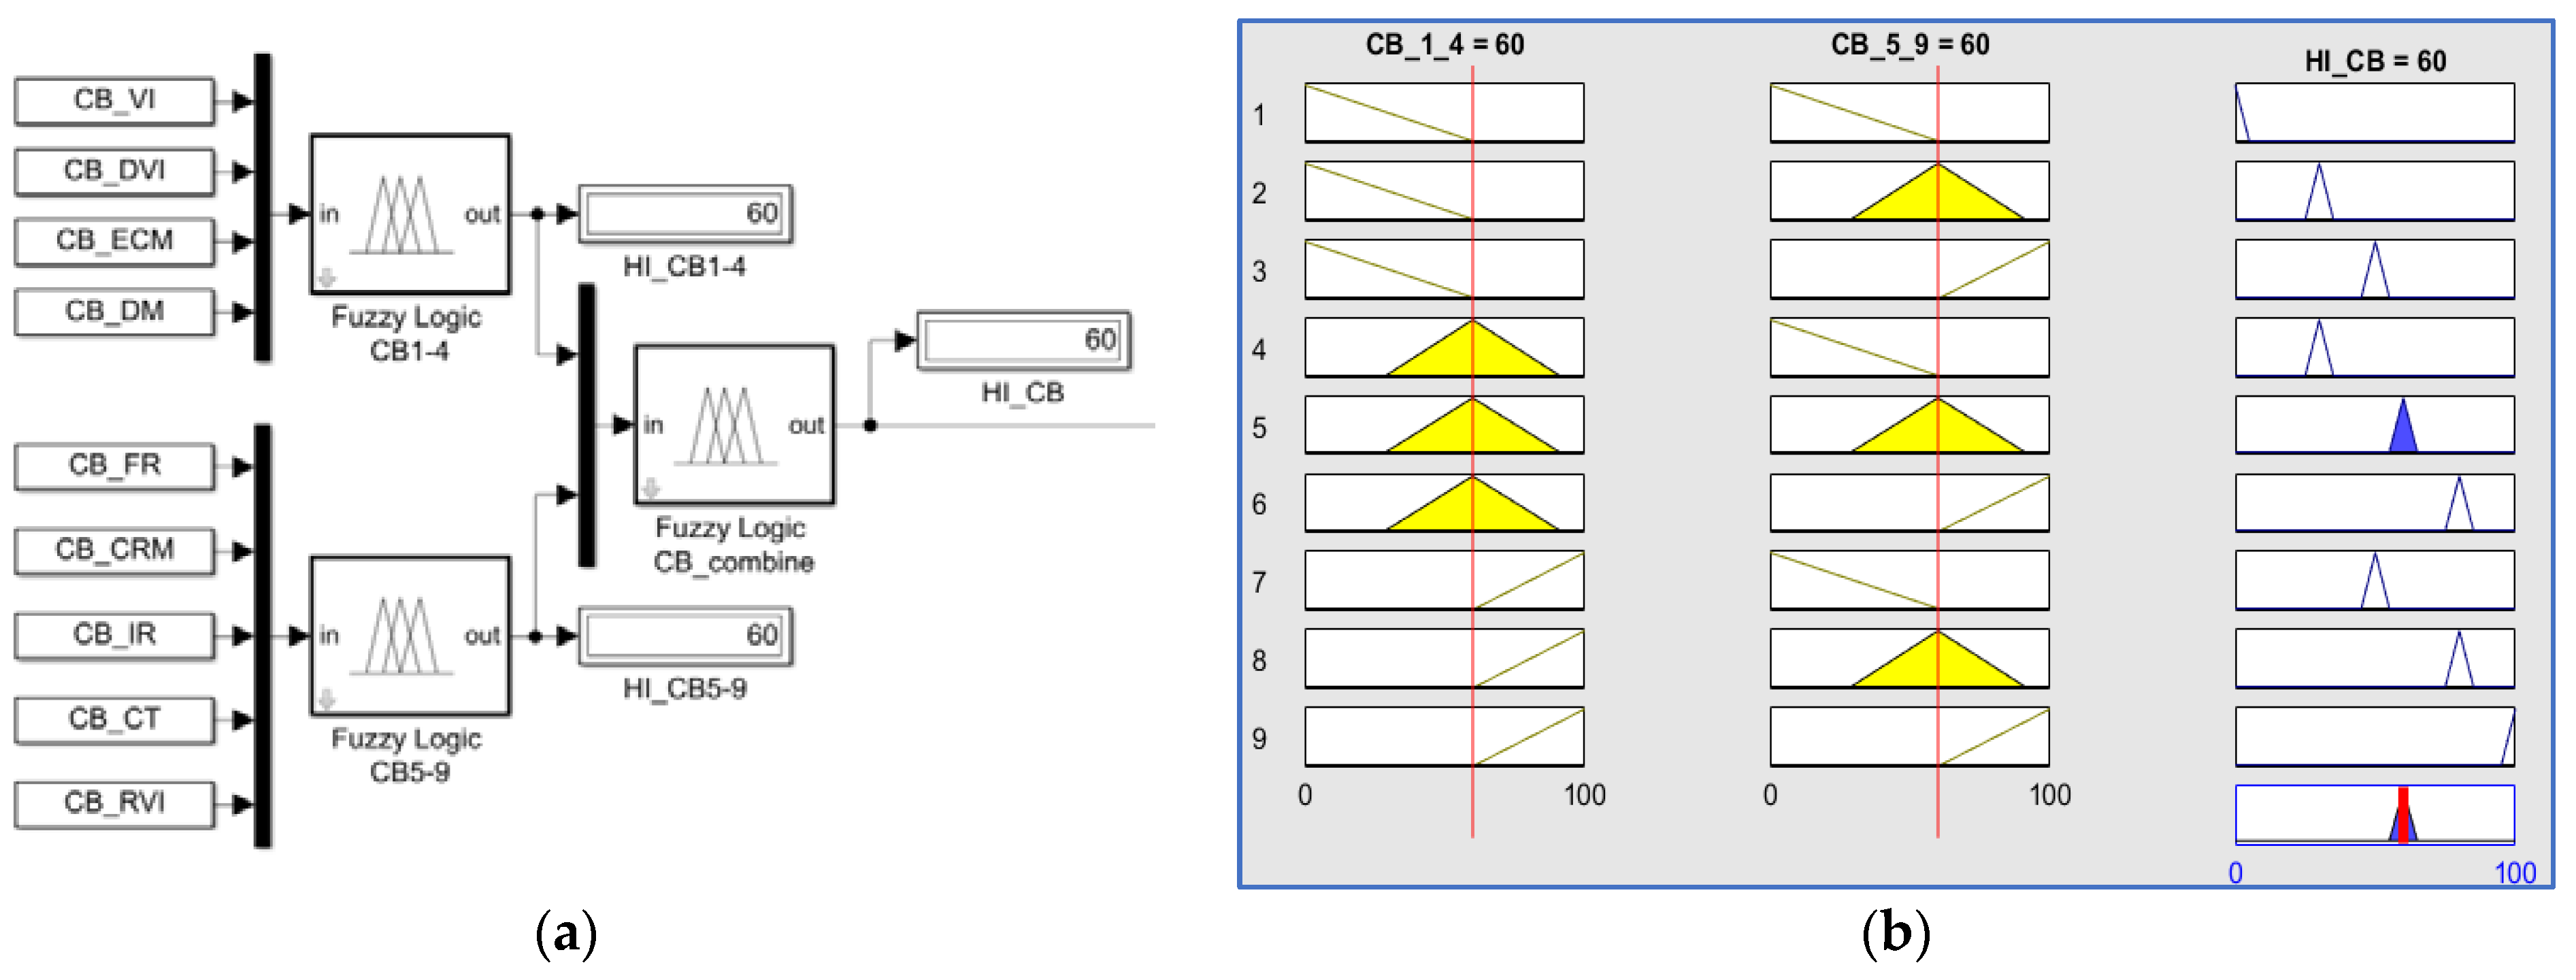
The fuzzy logic model of the CB for HI determination is divided into two models, aiming to reduce the number of fuzzy rules, and consisting of a four-input and a five-input variables model, as shown in Figure 3. The four-input variables model receives numerical scores from the physical damage and visual check of the general condition and operating mechanism inspections, while the five-input variables model receives its scoring inputs from the electrical test of the main and auxiliary circuits as well as the routine inspection of SF6 gas pressure. After that, the two-output variables from the first layer are sent to the combined fuzzy logic model in the second layer with an FRBS of nine rules to determine the HI of the CB, as shown in Figure 4a,b, which present the fuzzification and defuzzification of the fuzzy logic model in the second layer to combine outputs from the four- and five-input variables fuzzy logic models in the first layer.
To validate the accuracy of the proposed health index determination model, various CB defective cases must be tested with different scenarios that could probably occur in-service. When all nine input variables of the CB are set to a value of 5, simulating a good condition, then the delivered HI is found as 98.65%. Similarly, when all input variables are set to a value of 3, and subsequently to a value of 0, simulating moderate and bad conditions, the resulting HIs of the CB are 60% and 1.34%, respectively. These outcomes demonstrate the effectiveness of the fuzzification and defuzzification procedures, which increases confidence in the application of the proposed method to the case of HI determination.
3.3. Gas Compartment Condition Evaluation
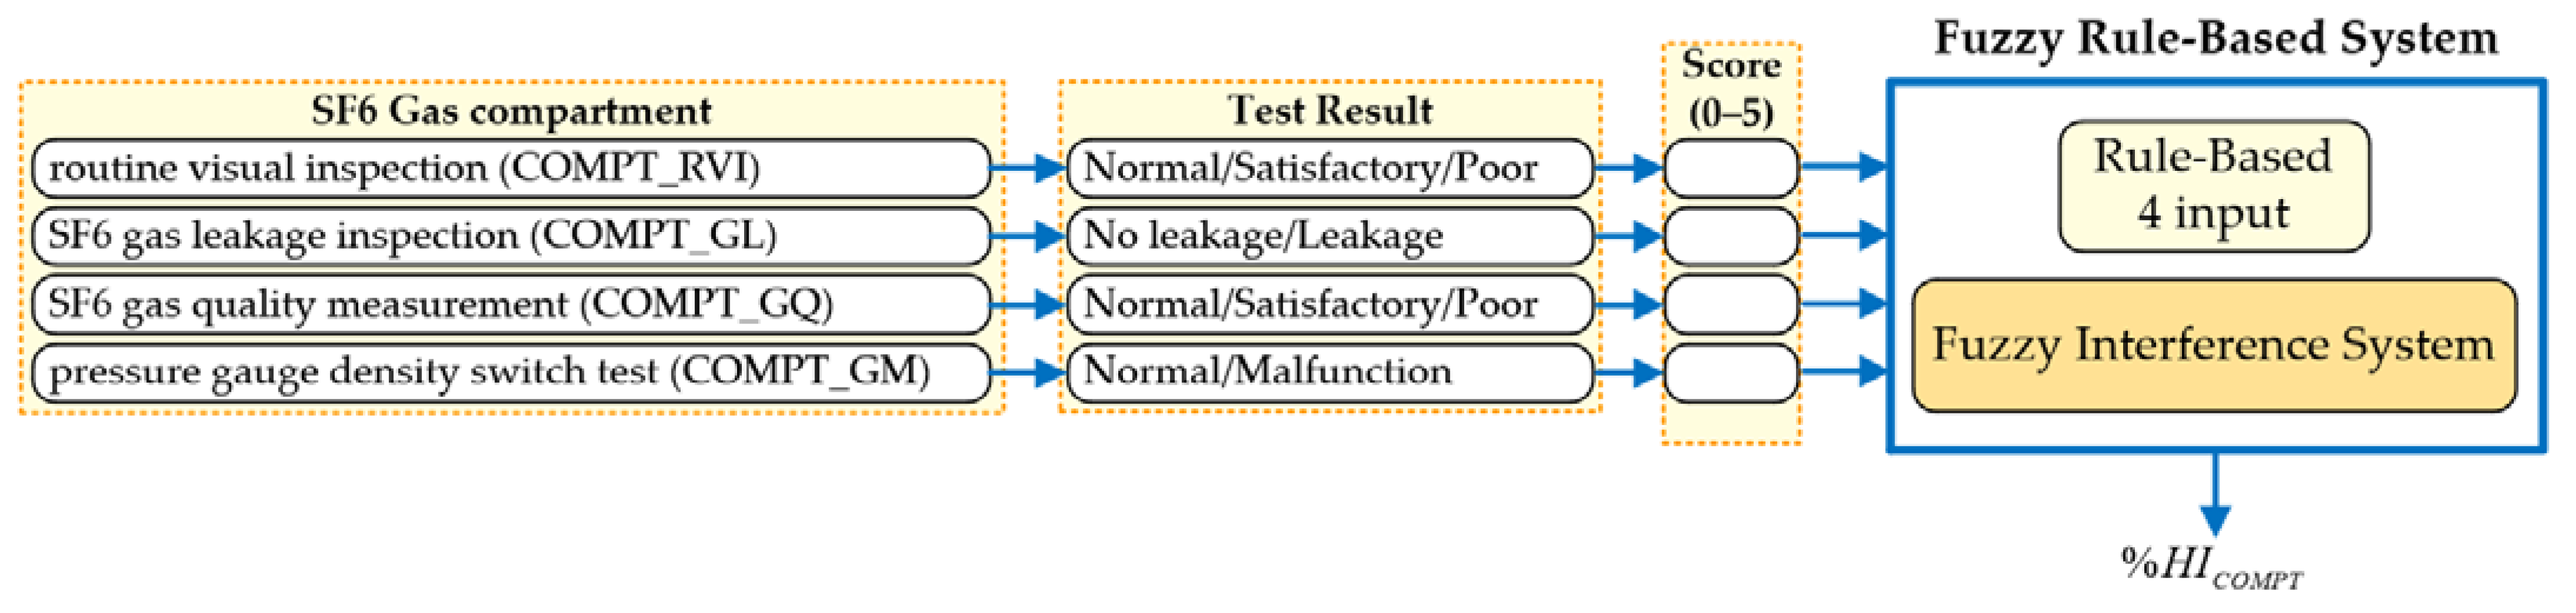
The gas compartment of a GIS is designed to keep insulating gas within the equipment under a specific pressure to ensure a good dielectric strength of gas insulation, a high degree of protection for personnel safety, as well as equipment protection from external factors [1]. In practice, the insulating gas may gradually leak from the gas compartment due to various factors such as improper installation of the pressure density gauge or ageing of the sealing gasket, which could lead to moisture ingress and gas contamination. The poor gas quality caused by mixing with oxygen and moisture under high electric field stress could lead to low energy discharge producing an amount of SO2 and reducing the SF6 volume percentage. Then, the gas quality can be evaluated based on the dew point temperature, dew point moisture, SF6 purity, and SO2 content. To ensure the proper functionality of the equipment, to mitigate potential failure, and to prevent unplanned outages, testing and inspections must be conducted, consisting of four major groups, visual inspection, SF6 gas leakage detection, evaluation of insulation gas quality, and pressure gauge density switch test. Subsequently, the inspection results are transformed into numerical scores as inputs of the fuzzy logic model. After receiving the input scores, the fuzzification and defuzzification of the fuzzy logic model will compute the HI of the gas compartment in accordance with the predefined FRBS consisting of 81 rules, as shown in Figure A1.
3.4. Local Control Cabinet Condition Evaluation
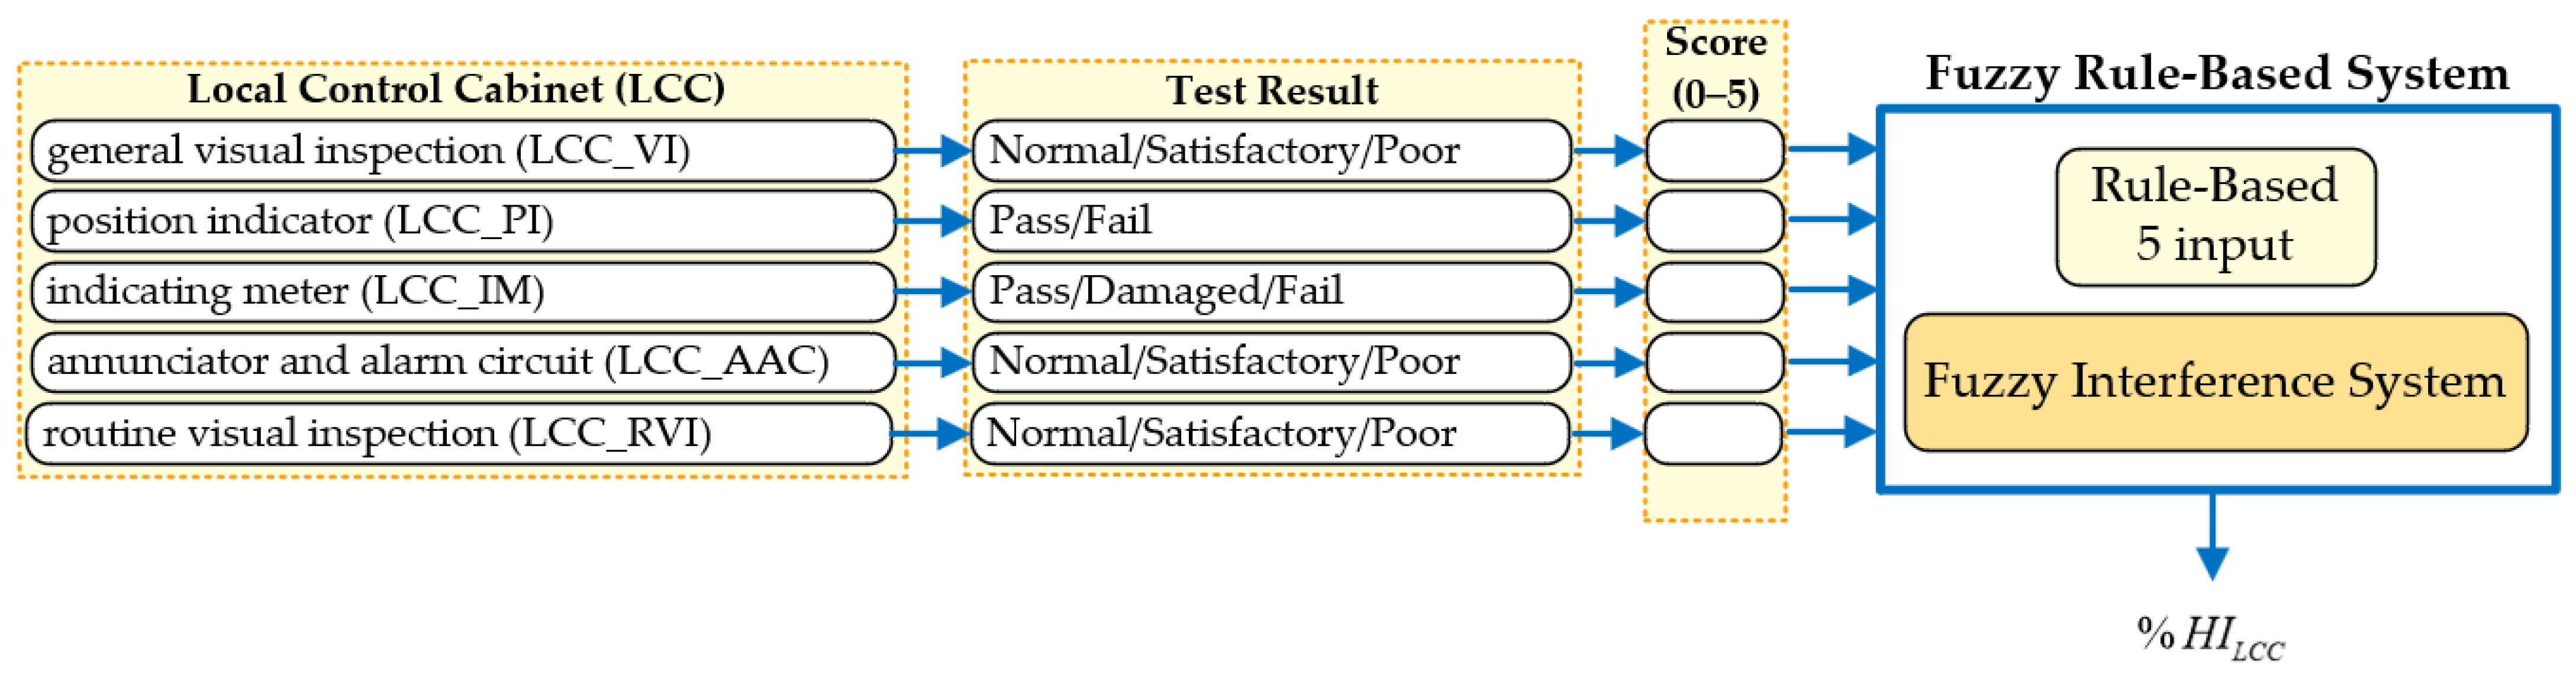
The local control cabinet is used as an interface for local operation of GIS equipment and control switches with interlocking mechanisms, and for incorporating various features such as a status display of the primary equipment, measurement indicators, and an alarm annunciator system. Moreover, all control and alarm circuits of GIS equipment are placed in the LCC and further wired to the control and protective relay panels as well as an annunciator system for remote operation. Practically, the frequently found failures of LCC are caused by water condensation due to electric heater failure, rodents biting control wires, a loosening connection in the terminal, and failure of the auxiliary relay. Therefore, testing and maintenance inspections conducted to ensure the satisfactory operation consist of a visual inspection of physical damage, indicator lamp inspection, inspection of the local indicating meter, as well as inspections of the alarm and annunciator systems. The numerical scores from these five groups of testing and maintenance results are used as fuzzy logic inputs to compute the HI of the LCC via the FRBS consisting of 81 rules, as shown in Figure A2.
3.5. Disconnecting, Earthing, High-Speed Earthing Switches Condition Evaluation
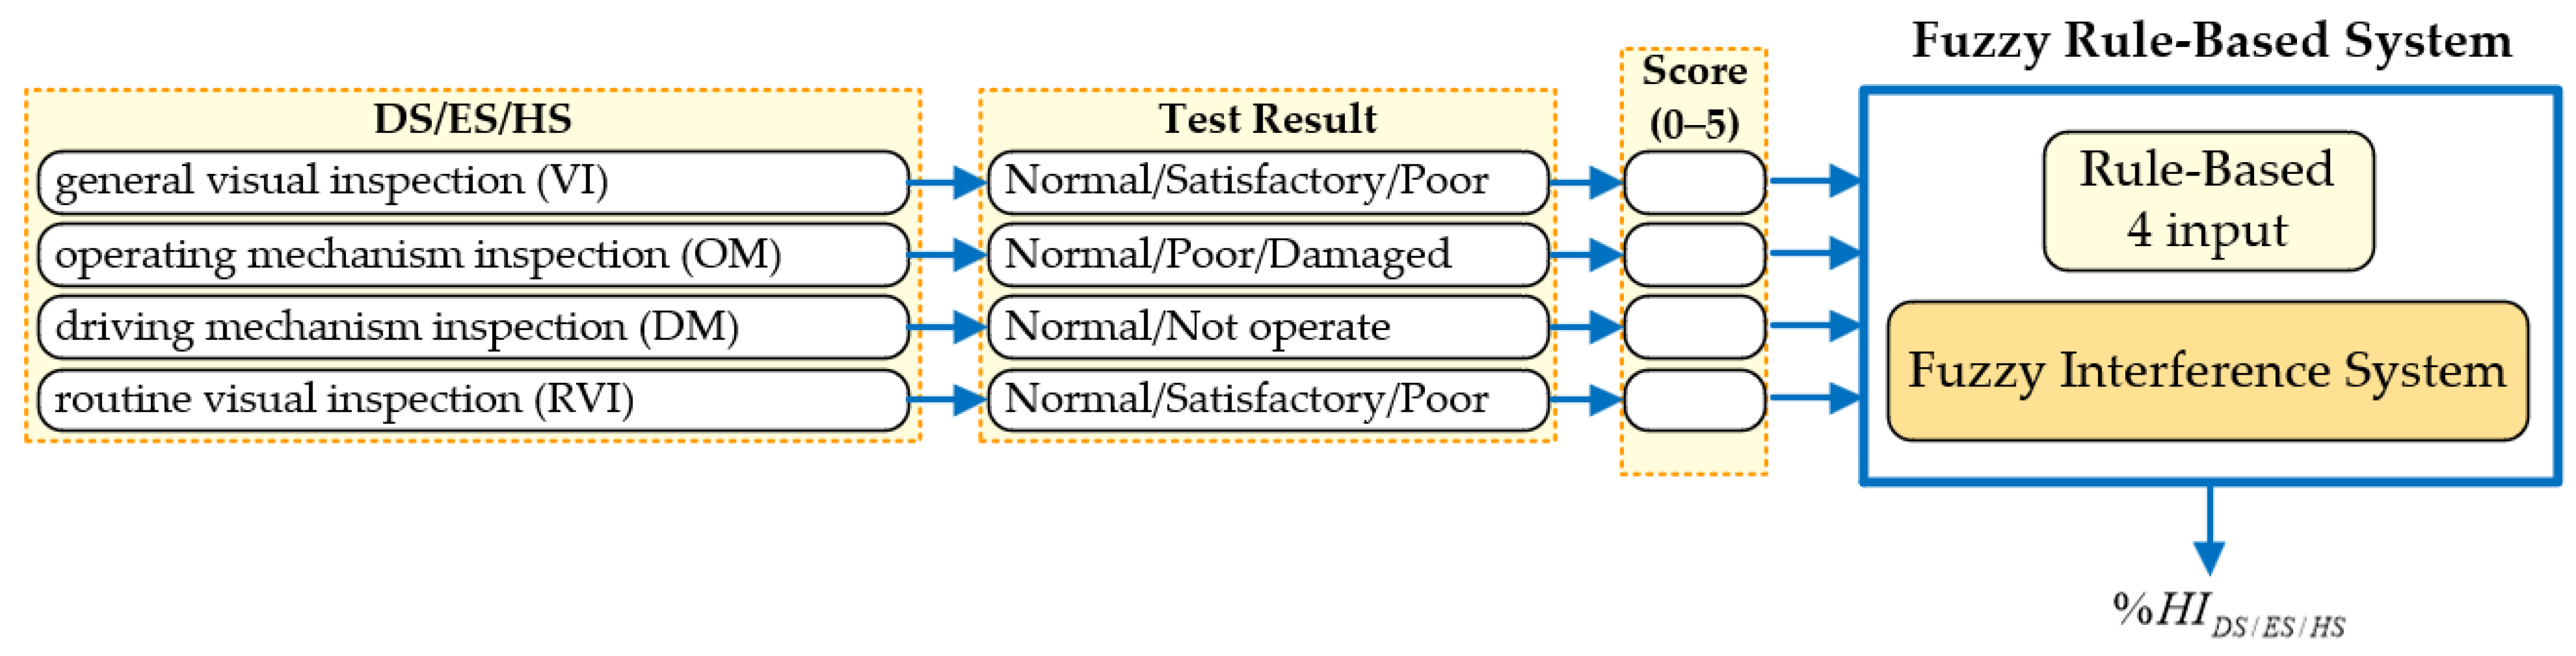
Disconnecting switches are used to provide visual isolation during maintenance of various equipment in GISs. A DS can interrupt only a small charging current in the range of 0.5 A to 2 A [39]. Meanwhile, the earthing switch is used to ground the specific section of a GIS for the safety of maintenance personnel and diagnostic testing of the CB. The high-speed earthing switch is used to ground the energized equipment such as no-load transmission lines and main bus, creating a short circuit without any damage, and is sometimes used to initiate protective relay functions known as the fault-initiating switch. It is also designed and tested to interrupt a small electrostatic charging current and electromagnetically induced current in the de-energized transmission lines installed parallel to the energized transmission lines [1,39]. In practice, switches may fail to work properly such as by not responding to commands, an incorrect position indicator between mechanical and electrical contact status, imperfect contact touch creating arcing, and friction in the operating mechanism. To avoid unexpected failure, the testing and maintenance consisting of a general inspection of physical damage, operating mechanism, driving and energy storage mechanism, and RVI should be regularly performed. Similarly, the fuzzy logic model with the FRBS consisting of 81 rules shown in Figure A3 is developed to compute the HI of the DS, ES, and HS by utilizing the score representing the field-testing and maintenance results as fuzzy logic input variables.
3.6. Current Transformer Condition Evaluation
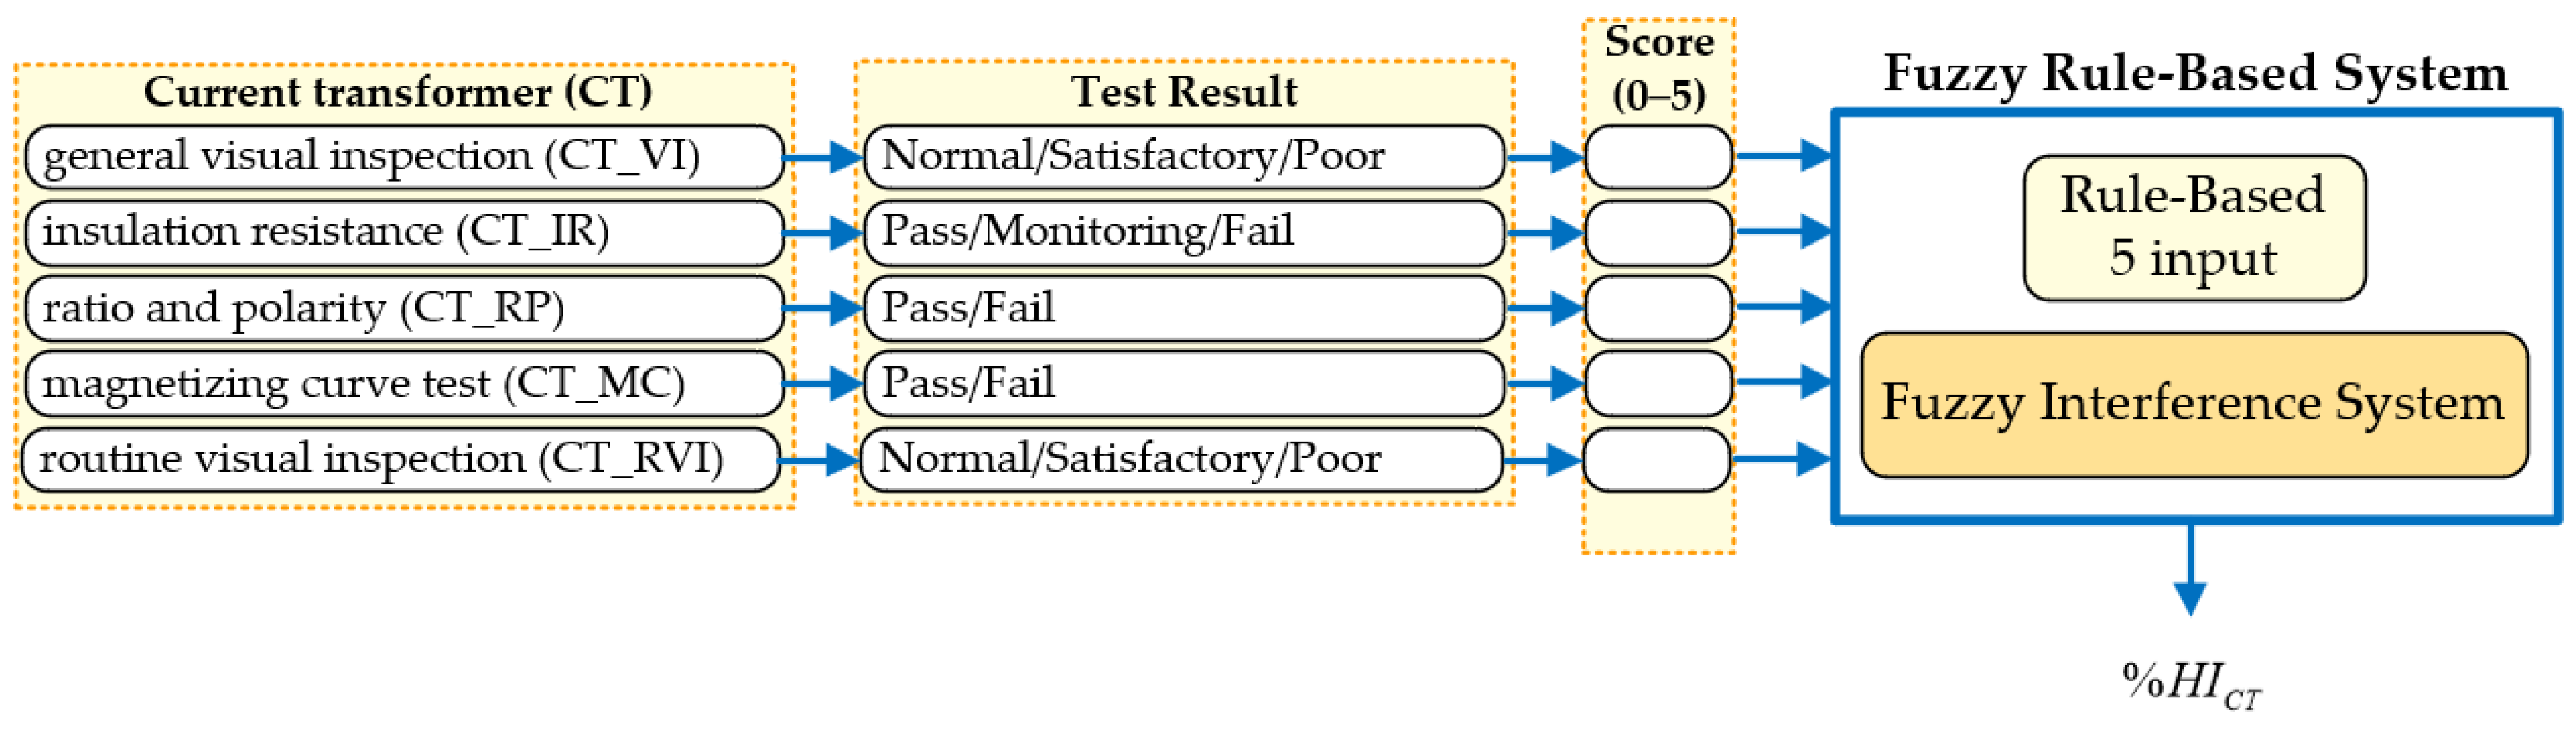
The current transformer is an instrument transformer, which is used to step down the primary current to a measurable range on the secondary side to supply the measuring instruments such as the revenue meter and protective relay. Even though the failure of the CT seldom occurs due to rugged construction and no moving parts, failure causes could originate from short turns, insulation degradation, over-fluxing, and human errors. Therefore, various testing and maintenance methods should be performed in accordance with the defined time-based interval to ensure safe operation of the device and proper functioning of the equipment connecting to the secondary side. Thus, CT testing and inspection methods consist of physical damage inspection, insulation resistance, phase angle and ratio measurements, excitation and RVI. The numerically transformed scores of five-input variables will be subsequently computed by the fuzzy logic model to determine the HI of CT as shown in Figure A4.
3.7. Voltage Transformer Condition Evaluation
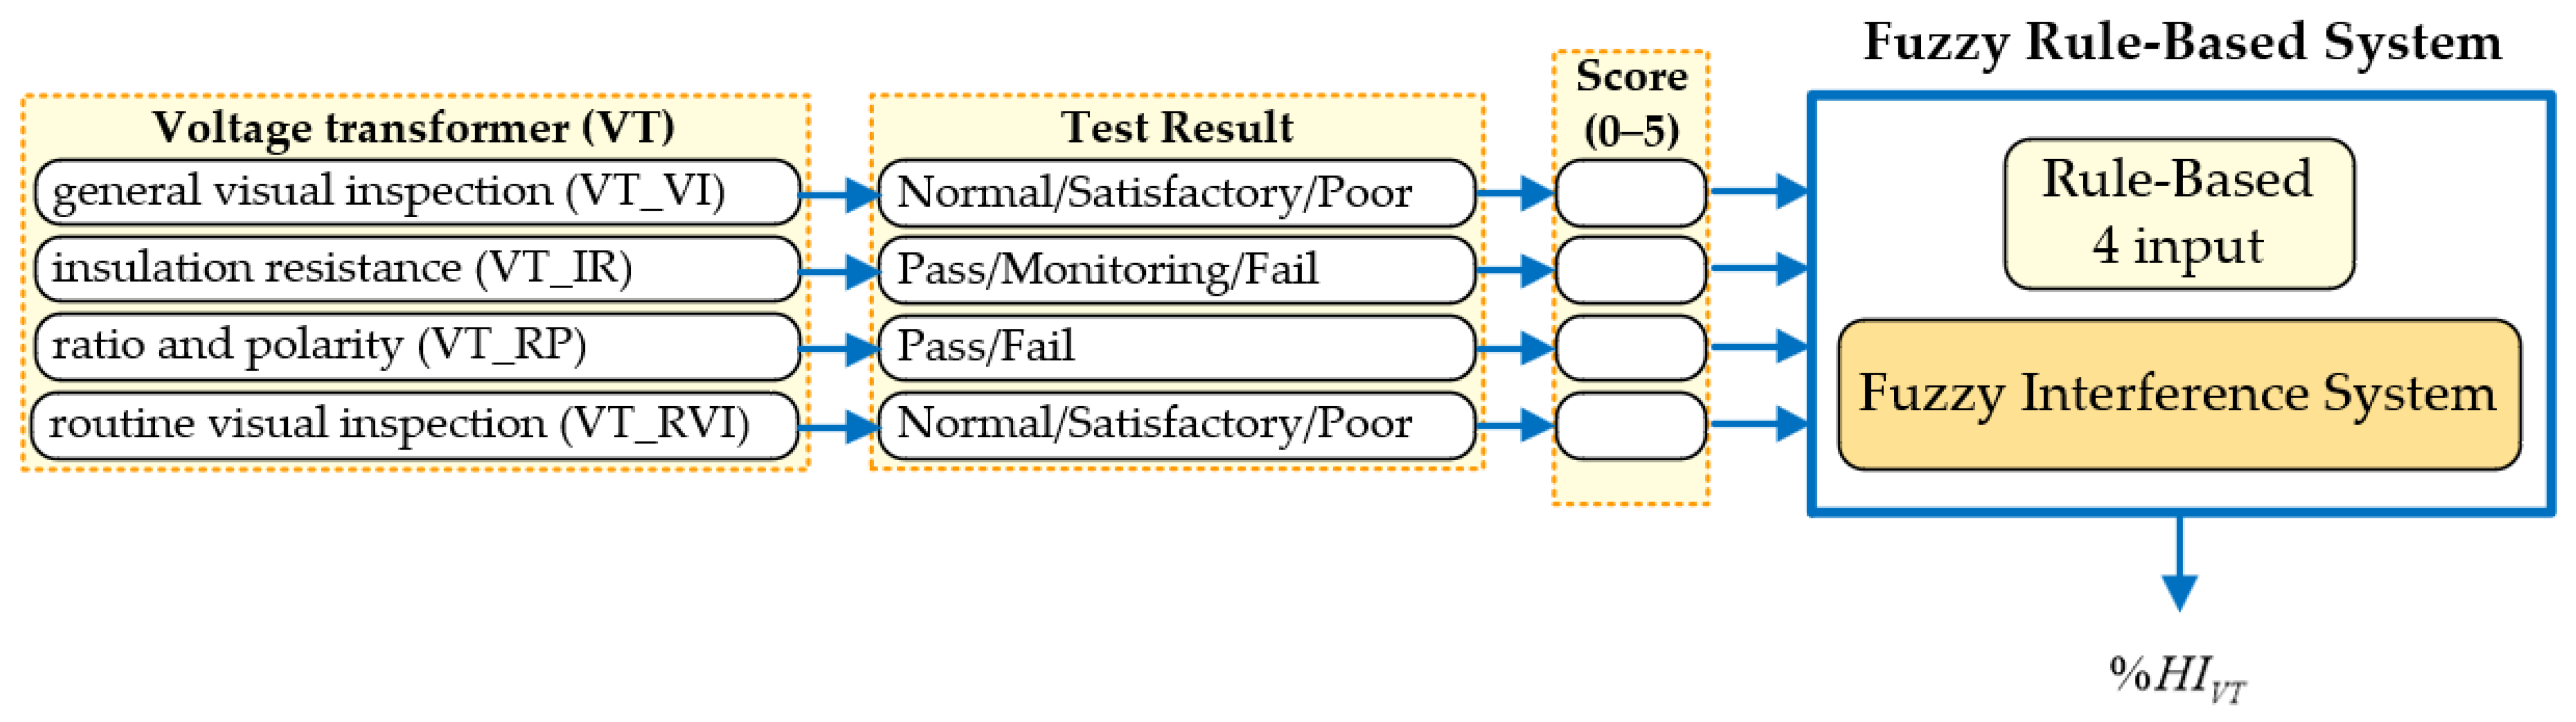
Similar to the current transformer, the voltage transformer is also an instrument transformer, however, it is used to step down a HV on the primary side to a low voltage on the secondary side which is supplying to protective relays, revenue meters, voltage regulators, and control devices. Since the VT is usually installed at the entrance of the incoming line and at the main bus, its potential failure is normally caused by abnormal voltage stresses such as transient overvoltage and Ferro-resonance leading to a saturated magnetic core, short-turn winding, and insulation failure [39]. Therefore, various testing and maintenance methods in accordance with the time-based maintenance should be followed to ensure the proper operation of the VT and its associated equipment on the secondary side. Then, the VT testing and inspection methods can be divided into four groups, physical damage inspection, insulation resistance, phase angle and ratio measurements, and RVI. The numerical scores of these maintenance methods are passed through the fuzzy logic model to calculate the HI of the VT, as shown in Figure A5.
3.8. Gas-Insulated Switchgear Bay Condition Evaluation
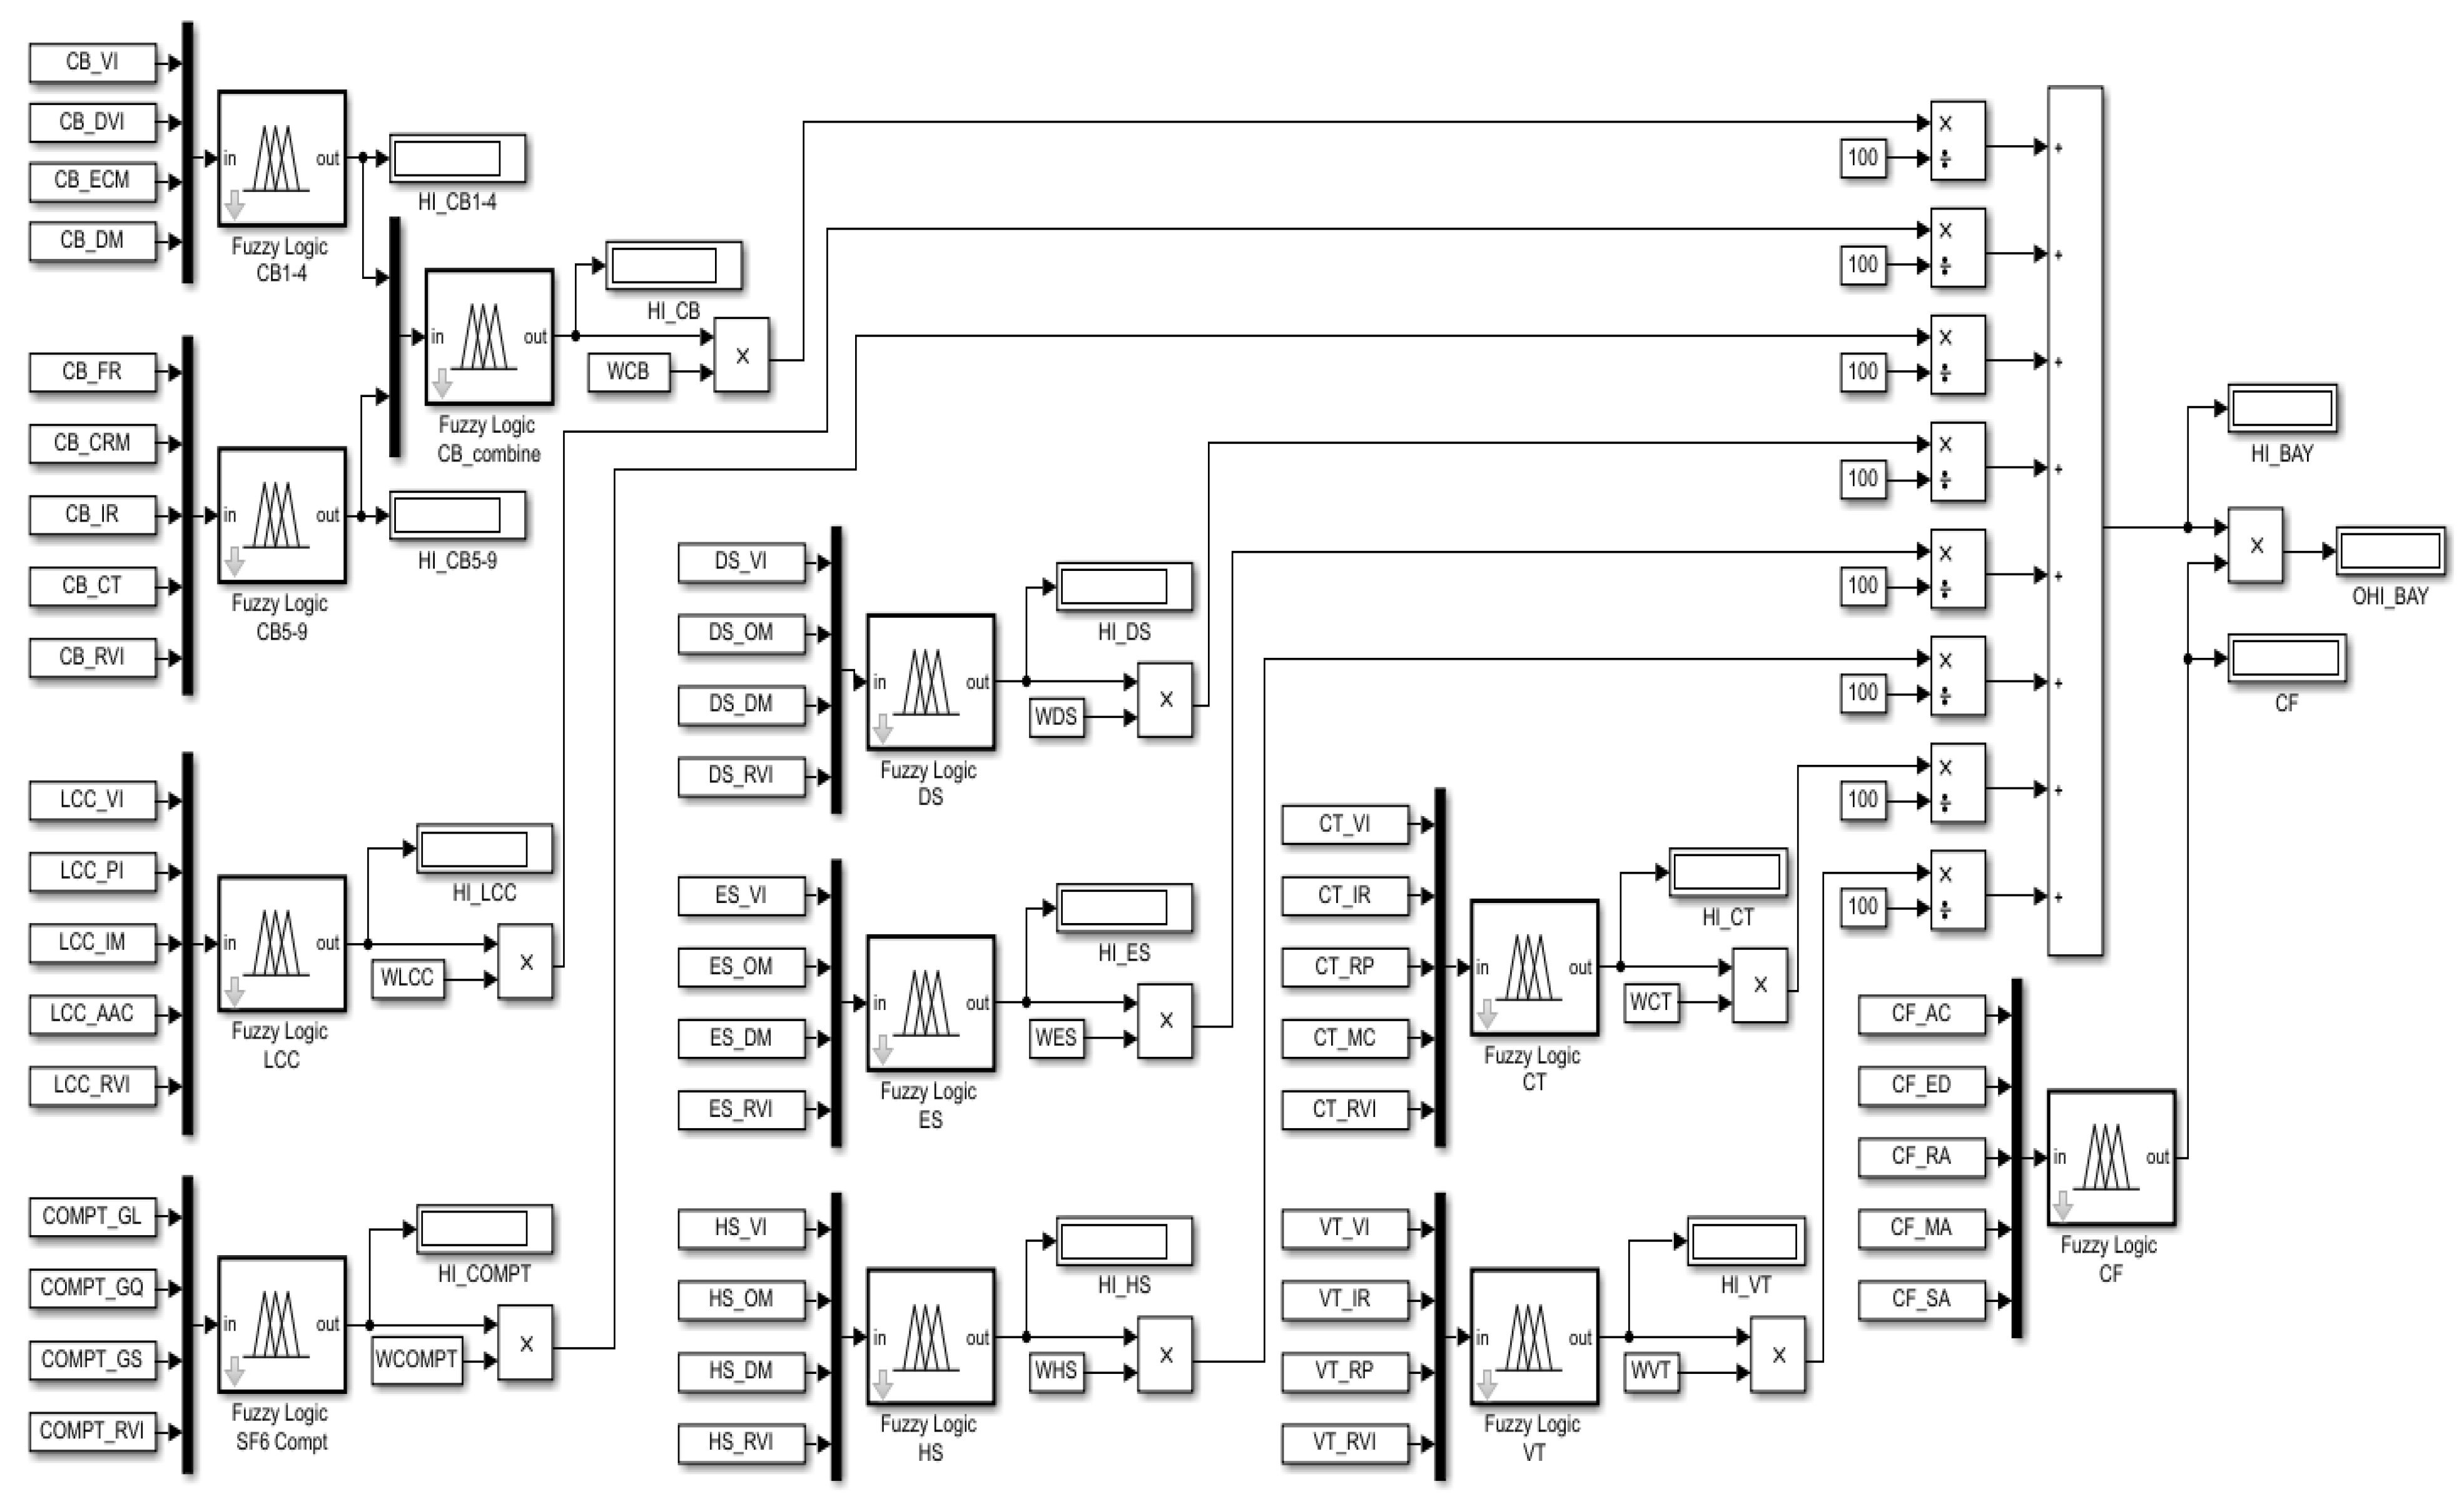
The previously evaluated component health index indicates the visible ageing of all GIS components based on their detectable inspection and maintenance data. To evaluate the component HI, the fuzzy logic approach provides a mathematical method for computing based on degree of truth to handle imprecise information and qualitative data. Traditionally, the conventional WSM has been applied to evaluate the condition of HV assets, however, it is a subjective method, and the accuracy of the result depends mainly on the weighting setup based on expert opinions. Since the fuzzy logic method is an effective tool in decision-making processes based on vague and uncertain information, it has been applied to evaluate the condition of the GIS components and the conditional factor representing the invisible ageing of the GIS bay. However, to calculate the bay HI from eight-input variables representing the component HI, the fuzzy logic approach cannot be directly applied due to the complexity of the FRBS rule setup for the required total of 6561 rules. Thus, a combined method of the fuzzy logic model and the conventional WSM is applied to determine the bay health index and the overall health index, as illustrated in Figure 5, for the developed health index determination procedure created in MATLAB Simulink.
To determine the component health index percentage (%HIC) using the fuzzy logic model, the scores transformed from the raw testing data are used as inputs for the fuzzy logic model to compute %HIC. The fuzzy logic model is applied to calculate the %HIC of eight components, CB, LCC, COMPT, DS, ES, HS, CT, and VT and to compute the conditional factor. To avoid the complexity of the FRBS setup, the conventional WSM is adopted to calculate the bay health index percentage (%HIBAY) with the related weight of major components. The %HIBAY is calculated by using Equation (2):
where %HIBAY is the bay health index percentage; %HIC;j is the component health index percentage jth; WC;j is the percentage weight of the major component jth; and N is the maximum number of major components.
3.9. Conditional Factor Calculation
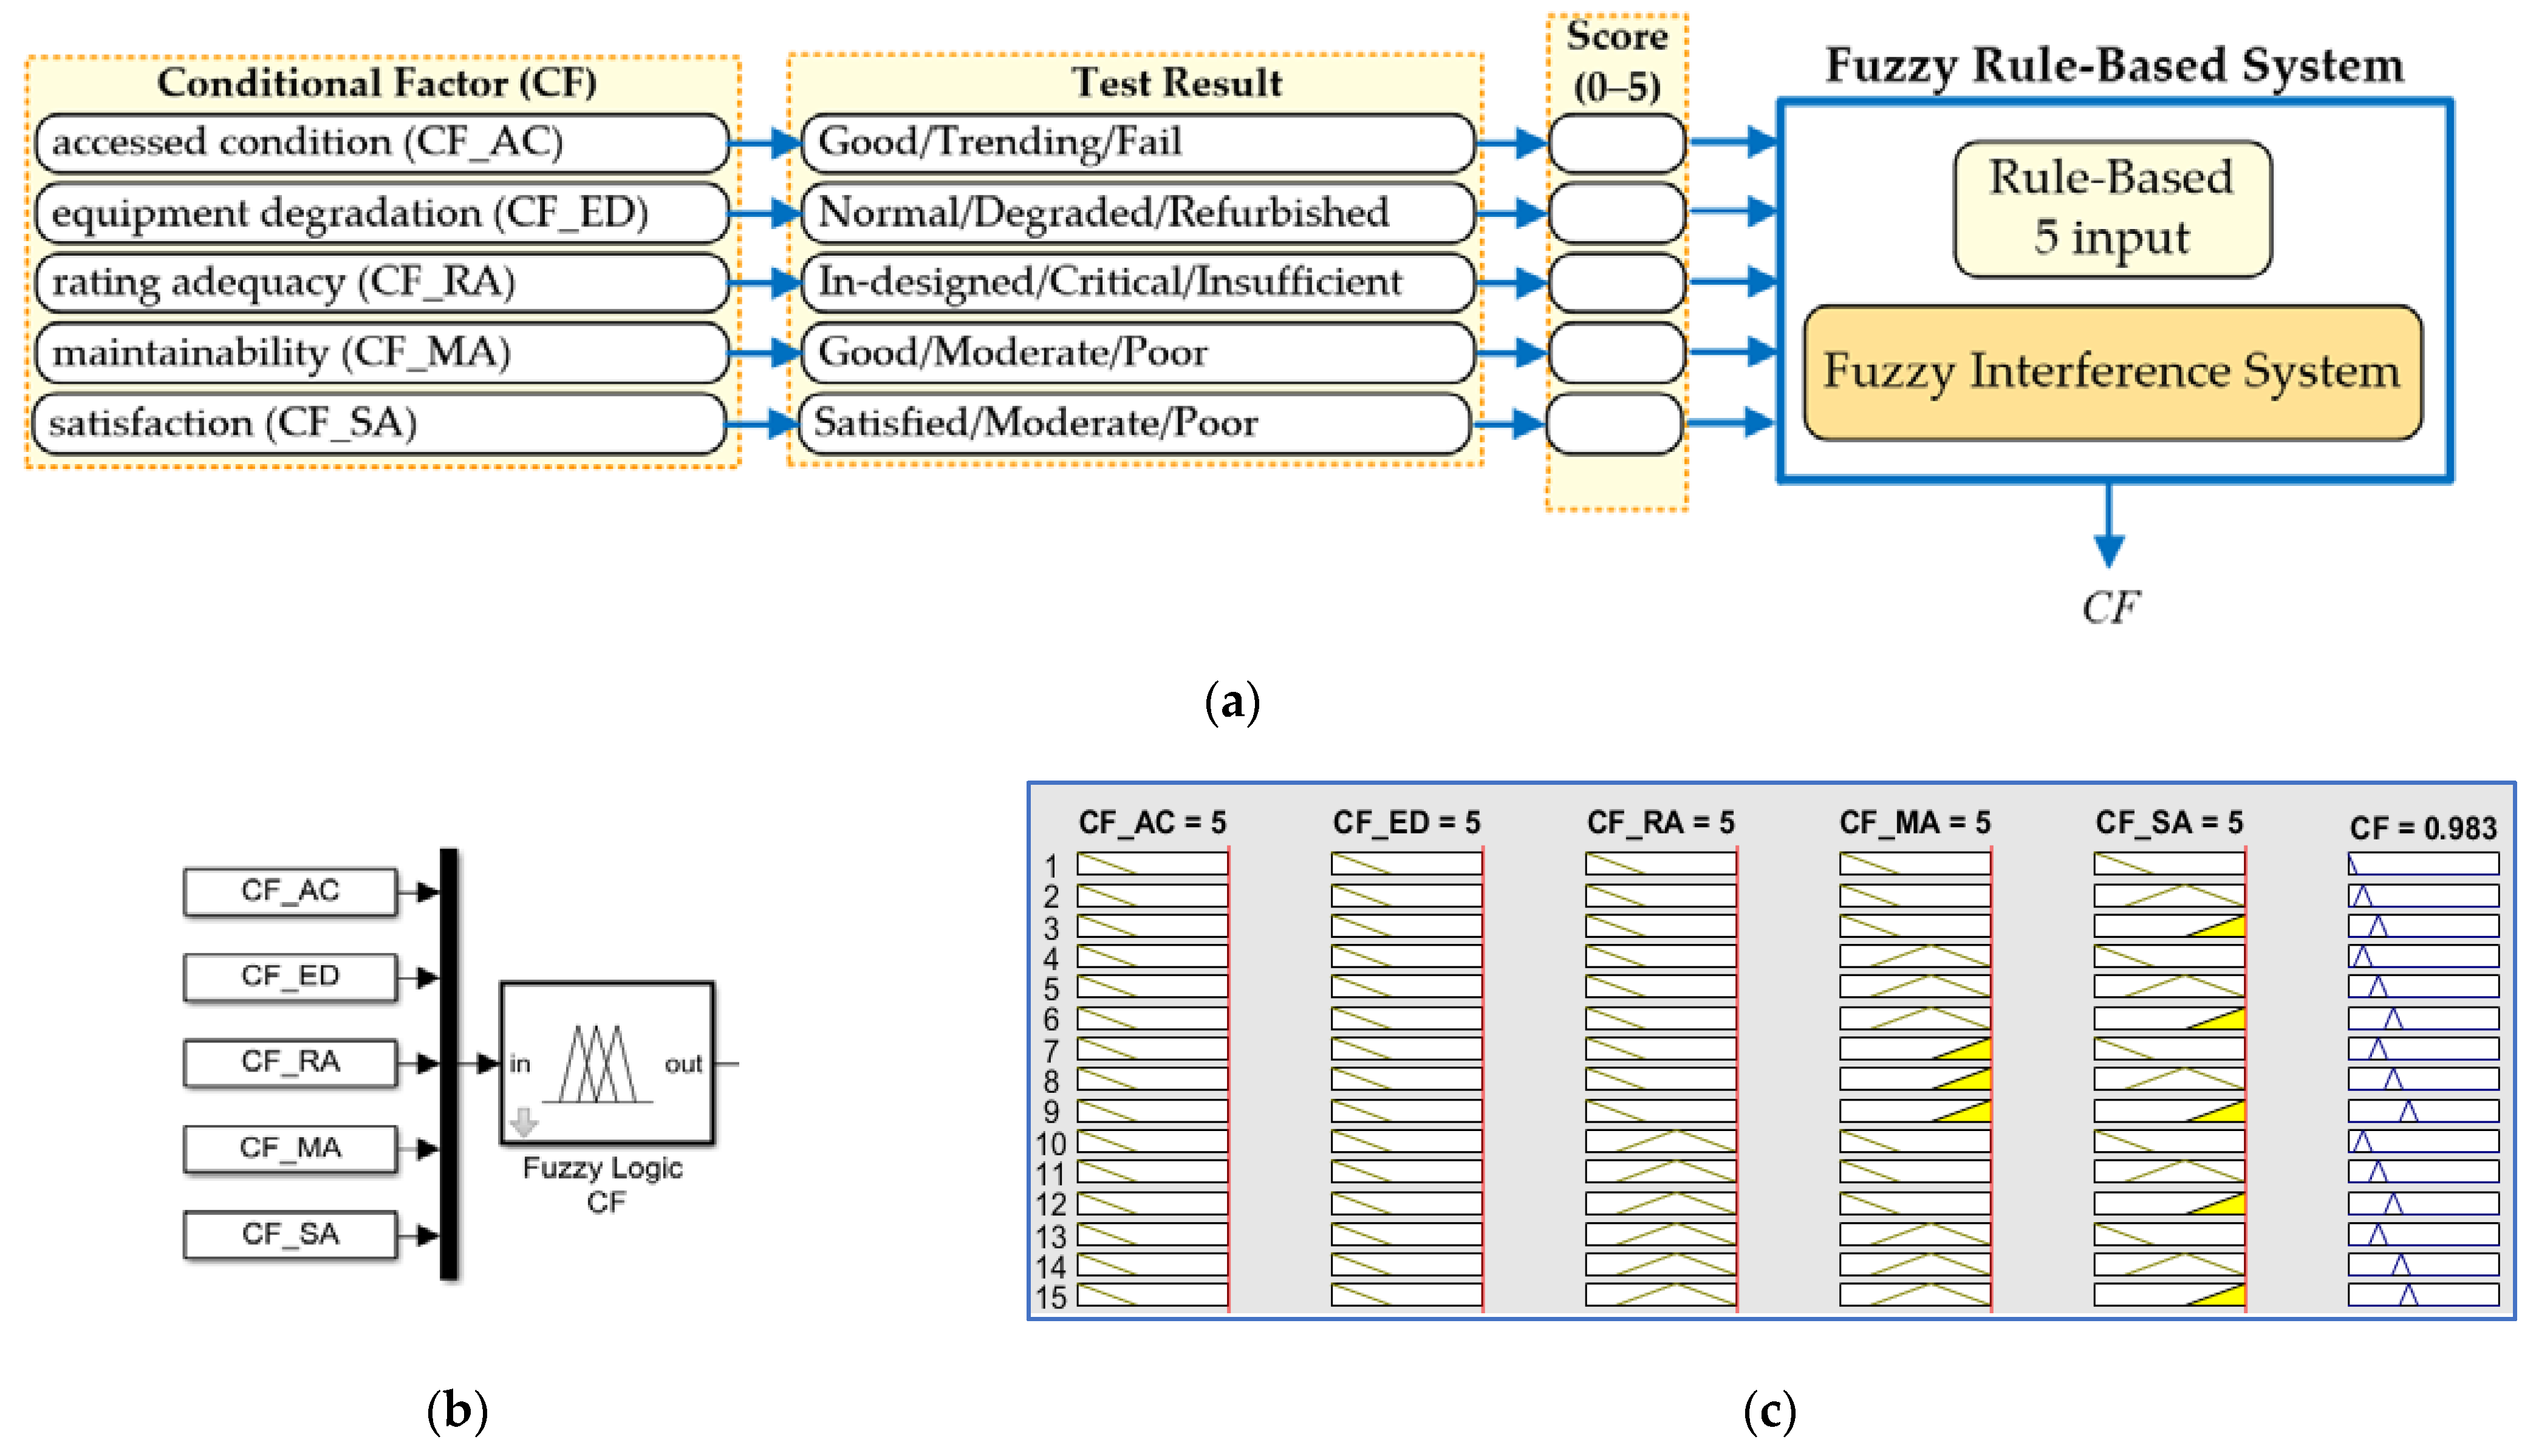
An accurate health assessment of HV assets cannot be achieved solely through field testing, inspection, and diagnostic data, since it only accounts for visible aging, which is measurable through technical assessment. To enhance the accuracy of the health index determination procedure, the invisible aging consisting of age, usage condition represented by the number of switching operations, the rating adequacy to represent system requirements, obsolescence in terms of the availability of spare parts, skilled workers, cost of repair, down time, and satisfactory performance in terms operation and usage by considering the historical failure record must be taken into account as conditional factors to adjust the %OHI of the GIS bay. Table 1 presents the CF criteria and details of the scoring system.
The fuzzy logic model is developed to determine the conditional factor based on five groups of invisible aging measures obtained from all criteria mentioned in Figure 6a, including accessed condition, equipment degradation, rating adequacy, maintainability, and satisfaction. These five-input variables are passed through the fuzzification and defuzzification process to compute the output variable through the predefined FRBS, as shown in Figure 6b,c.
To verify the accuracy of the proposed fuzzy logic model, it is necessary to conduct various tests of the conditional factor under different scenarios. By setting all five input variables of the conditional factor scores to a value of “5”, which indicates satisfactory in operation, the resulting CF is 0.98. Similarly, when all input variables are set to “3” and subsequently to “0”, representing moderate and approaching end-of-life conditions, the resulting CFs are 0.60 and 0.01, respectively. As these CF outcomes clearly demonstrate the accuracy improvement of the proposed model, it can be implemented to determine the overall health index of GIS.
3.10. Overall Health Index Calculation
To improve the accuracy of the GIS health index determination, the concept of the overall health index percentage (%OHIBAY) is introduced by considering the health of equipment from technical assessments based on testing and maintenance results as %HIBAY together with the equipment maintainability due to invisible ageing as CF. Therefore, the %OHIBAY is computed by multiplying the obtained %HIBAY with the CF as shown in Equation (3):
where %OHIBAY is the bay overall health index percentage; CF is the conditional factor; and %HIBAY is the bay health index percentage.
The %OHIBAY, once obtained, is categorized into three zones, namely good, moderate, and poor conditions of a GIS bay, as presented in Table 2. These indicators presenting the overall condition of the GIS bay should be designed to attract the immediate attention of the maintenance officer and to provide a clear and quick understanding of the result, such as by using traffic light indicators. The overall health index determination process is a valuable tool for managing maintenance tasks based on the available human resources and budget, and for determining the appropriate maintenance strategy.
4. Results and Discussion
The maintenance data collected from 175 GIS bays containing 2036 major components have been systematically recorded since 2019. Different types of testing and inspection were conducted for each component, and then the results were transformed using the setup criteria into numerical scores. Then, the 175 GIS bays were evaluated through the proposed health index determination procedure using the fuzzy logic model with the aid of the conventional WSM. The obtained %HIBAY is used to present the visible ageing of GIS components via the technical assessment. After that, the %OHIBAY is determined by multiplying the obtained %HIBAY with the conditional factor to incorporate the invisible ageing. In this section, the evaluation results are clarified and discussed. The %OHIBAY results with moderate and poor condition are selected to explain the evaluation procedure and to validate the obtained results for a comprehensive understanding of the proposed method.
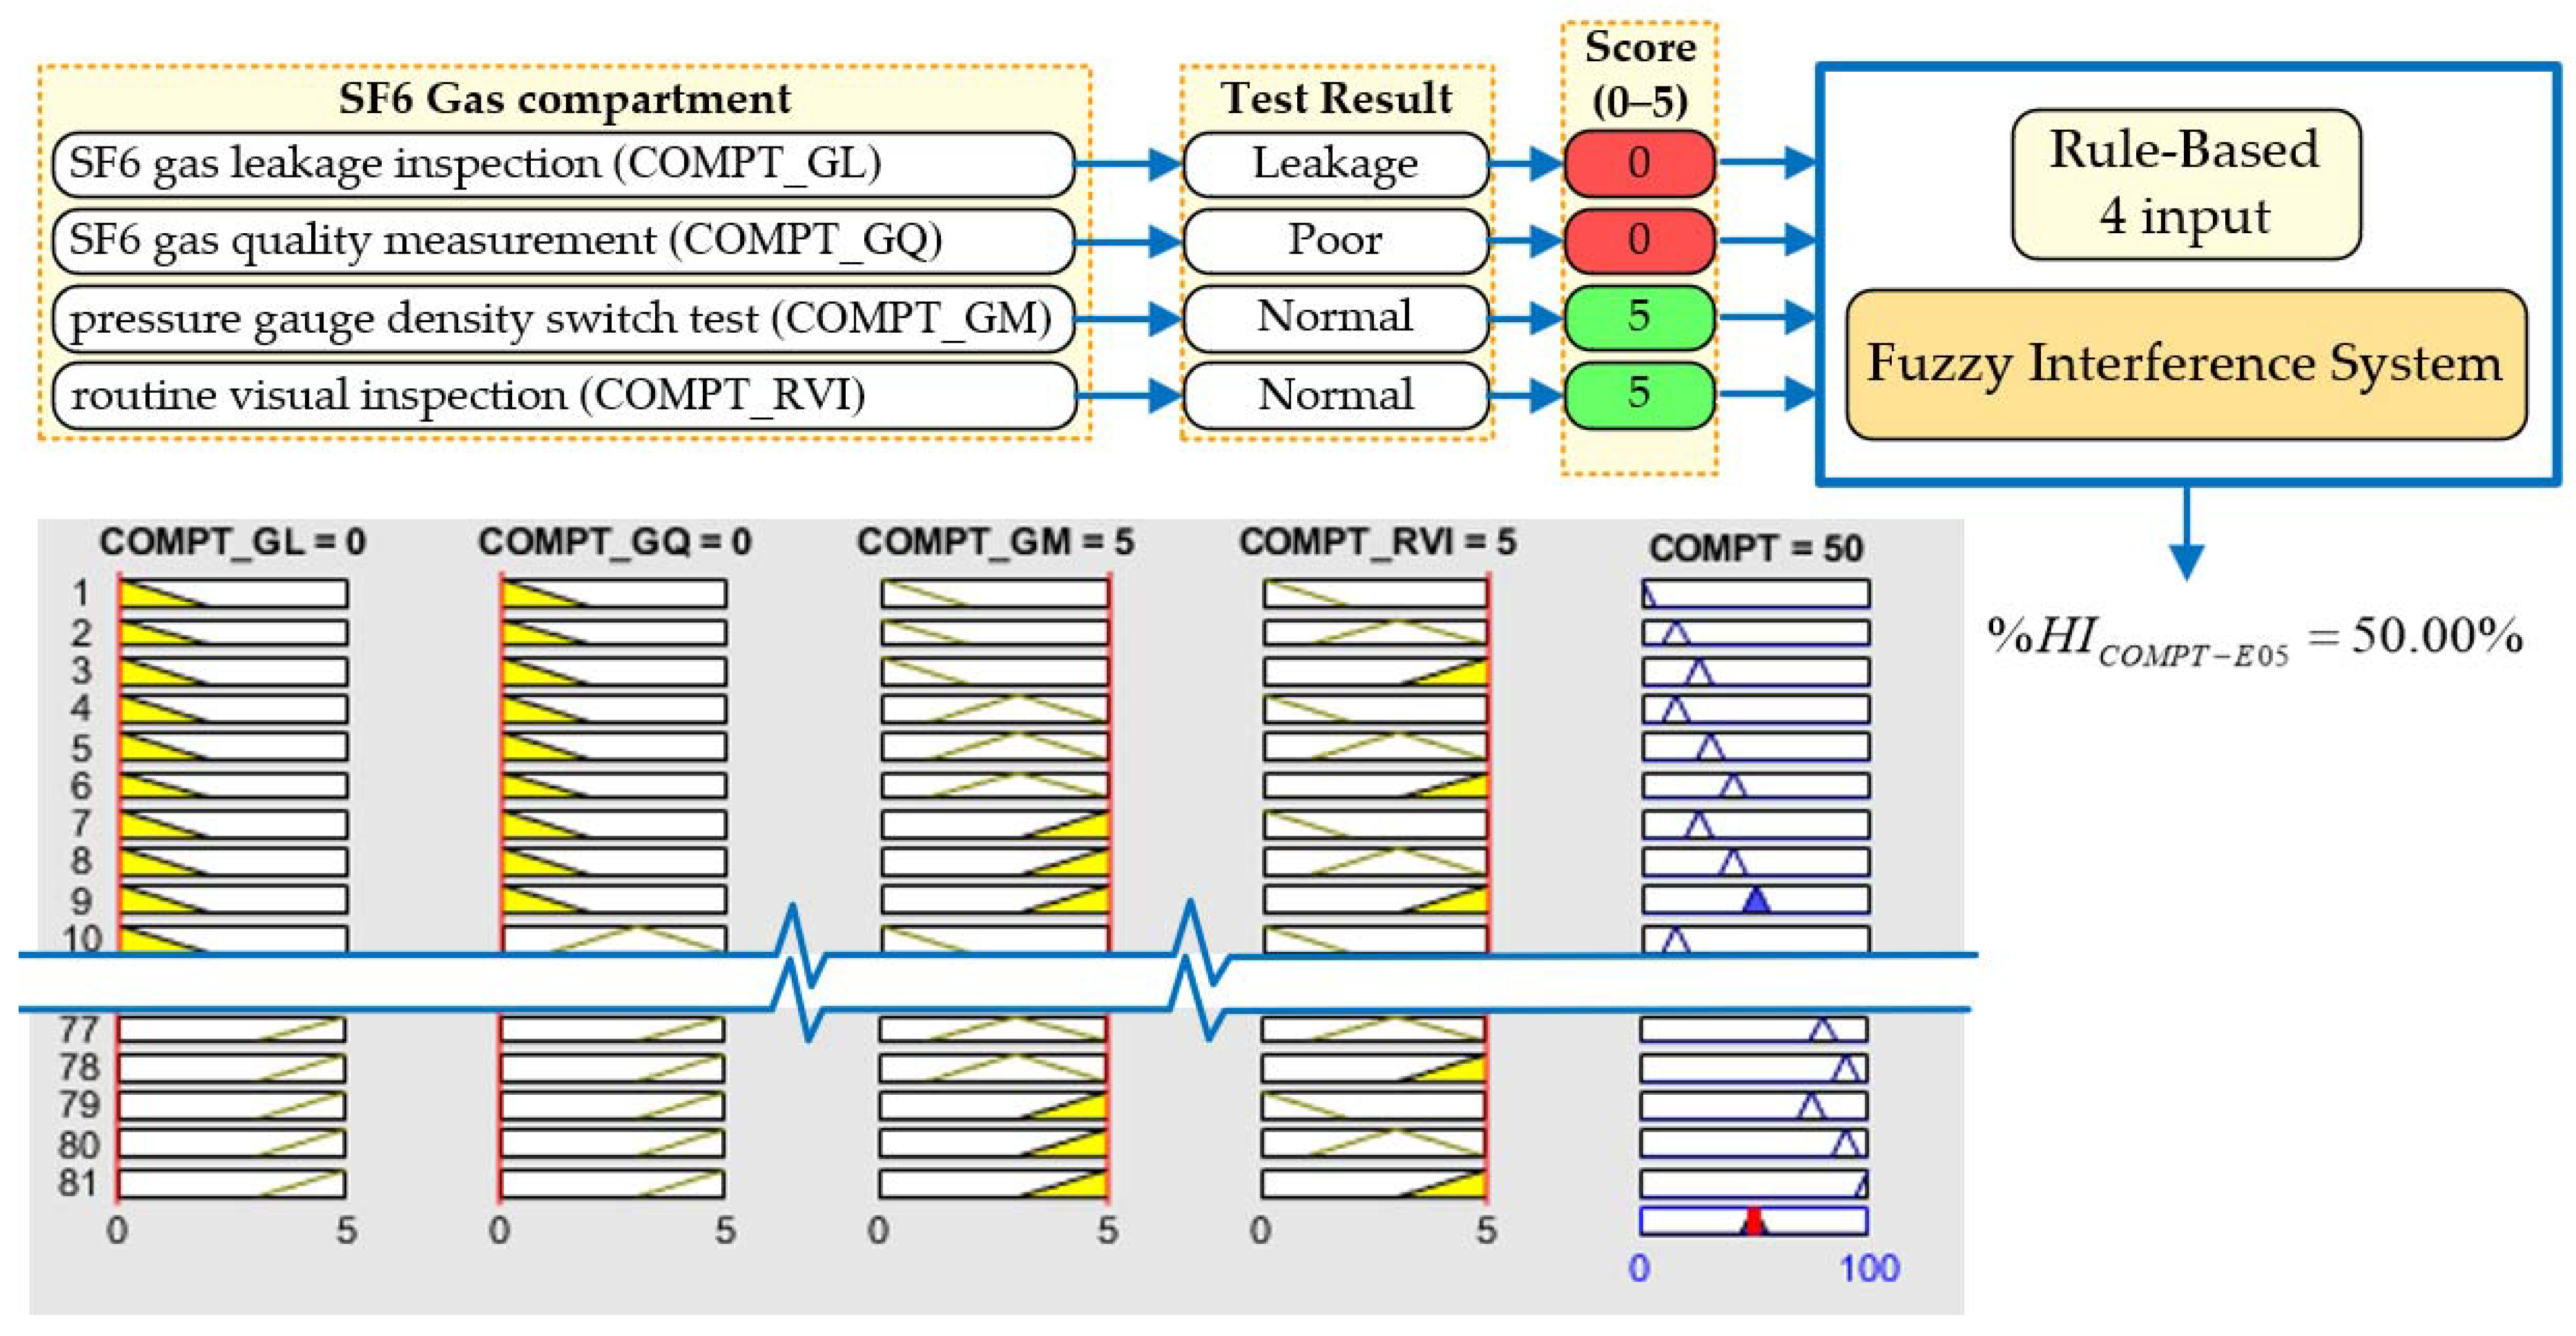
Using bay E05 as an example, a problem with gas leakage and SF6 gas quality in the gas compartment was identified, with the consequence of severe electrical discharge caused by electrical insulation deterioration, as described in Figure 7. Then, the scores of gas leakage and gas quality measurements decreased from 5 to 0 as a result of bad conditions for both testing items. However, the pressure gauge density switch and RVI score were in normal condition, meaning that their scores remained 5. Thus, the health index gas compartment percentage (%HICOMPT) of bay E05 is 50.00%. Additionally, the actual scoring values of eight defective GIS bays are listed in Table A1.
In the case of the CT and VT evaluations, due to their construction with three individual phase components, the worst health index score among the three components is selected to be representative in terms of health index determination. Additionally, the major components in the GIS bay consisting of DS, ES, and HS are a combined three-phase component and located in different locations and functions, and the worst health index among them in each bay is also chosen as a representative. The evaluation results of eight GIS bays and their components, together with the corresponding weight of each component, are presented in Table 3.
The %HIC for the CB, LCC, COMPT, DS, ES, HS, CT, and VT components are represented as %HICB, %HILCC, %HICOMPT, %HIDS, %HIES, %HIHS, %HICT, and %HIVT, respectively. The %Wc;j column represents the weighting assigned to each component in the bay health index percentage evaluation, which is obtained by considering the cost, responsible function, maintainability, and failure probability. Therefore, the greater the weighting of a component, the more significant that component is to the GIS bay performance. This indicates that the malfunction or defect of the more significant components should cause a larger variation of the percentage health index of the GIS bay. Thus, %HIBAY, representing the health index of the GIS bay, can be determined by considering all %HIC and the assigned weighting of every component.
To determine the %HIBAY, all pre-calculated %HIC are further calculated using Equation (2) based on the conventional WSM to represent the visible ageing of the GIS bay. The calculation detail of the percentage health index of bay E05 (%HIBAY-E05) is shown below.
From the above calculation, the %HIBAY-E05 is 79.87%, which was the lowest value and required immediate attention. After searching for the lowest component health index, it was determined that the problems arose from the CB and gas compartment due to defects in the operating mechanism and linkages leading to a deviation of contact timing as well as a gas leakage, leading to low gas pressure in some gas compartments. Because the weighting of these two components was 20%, the decrease in %HICB-E05 and %HICOMPT-E05 had a strong influence on the bay health index evaluation. Based on the evaluation results of eight GIS bays, the percentage bay health index ranged from 79.87% to 95.56%, which indicated that most bays were in relatively good condition, whereas three specific GIS bays required more attention, as shown in Table 3.
Since the above health index determination relies on the technical assessment based on testing and maintenance data representing visible aging, the conditional factor of the GIS bay was introduced to adjust the health index by considering invisible ageing, usage condition, obsolescence, and satisfactory operation. The CF determined from the fuzzy logic model was then multiplied with the %HIBAY to obtain %OHIBAY in order to enhance the accuracy of the obtained result. Then, Table 4 illustrates the CF value, and finally the %OHIBAY, of eight GIS bays. For example, the original %HIBAY-E05 as 79.87% was adjusted by its CF to 0.75 to calculate the overall health index percentage of bay E05 (%OHIBAY-E05), which was 59.09%. Thus, the condition of bay E05 changes from a moderate to a poor condition because of several fault interruptions and the difficulty in finding spare parts. Consequently, the decrease of %OHIBAY-E05 due to the CF adjustment draws immediate attention to urgently determining the planned outage maintenance of interrupting units and to purchasing the critical spare parts just in time for the replacement.
For bay E06, although the %HIBAY-E06 was above 90%, the %OHIBAY-E06 was 58.92% due to the lowest CF value of this GIS bay. Its CF was only 0.65 as a result of a long service life leading to a lack of spare parts, discontinuity of after-sales service, and unsatisfactory operation and maintenance, which could probably cause a long down time and high penalty in terms of cost when the failure occurs. This information indicates that bay E06 is approaching its end-of-life period, and that therefore, a short-term replacement plan should be executed.
To validate the accuracy of the proposed fuzzy logic approach, the obtained results of eight out of 175 GIS bays with moderate and poor conditions were compared with the conventional WSM and the HI dominant score technique. The %HI results of the three procedures are presented in Table 5.
The remaining 167 GIS bays, being in good condition, can be excluded from the comparison because a significant health index deviation cannot be observed. A significant agreement can be observed between the conventional WSM and the proposed fuzzy logic approach with errors ranging from a minimum of 0.06% for bay E01 to a maximum of 5.47% for bay E07. These errors arise due to the mechanism of the fuzzy logic approach, which operates on the FRBS and requires appropriate adjustment of the membership functions for each input variable to achieve optimum error.
When comparing the proposed procedure with the health index dominant score technique focusing on GISs used in severe operating conditions in tropical areas, only a slight discrepancy in one GIS bay can be observed. This difference arises because another method utilizes a non-linear scoring model with scores of 1, 10, 30, and 100 based on predefined norms and rules. Moreover, to allow the poor parameter to really stand out, the worst component score is chosen to represent the health index score of bays. Additionally, the non-linear scoring criteria make the evaluation result highly sensitive to minor and major degradation of GIS components. Consequently, the condition assessment result of bay E03 obtained from the health index dominant score shows a very high probability of failure due to the problem of gas quality. The non-linear scoring of the gas quality measurement makes the evaluation process sensitive to any defect in the dielectric subsystem by considering gas pressure, gas density, SF6 purity, SO2 content, and dew point. Thus, the poor SF6 gas quality in bay E03 leads to a dominant score of 100, indicating a very high probability of failure in order to lead to immediate corrective action. However, the health index result of bay E03 through the proposed procedure indicates a moderate condition because the FRBS and the weighted-average techniques are designed as a general procedure, not as focusing on any specific problem. Therefore, the gas quality problem is considered a normal defect.
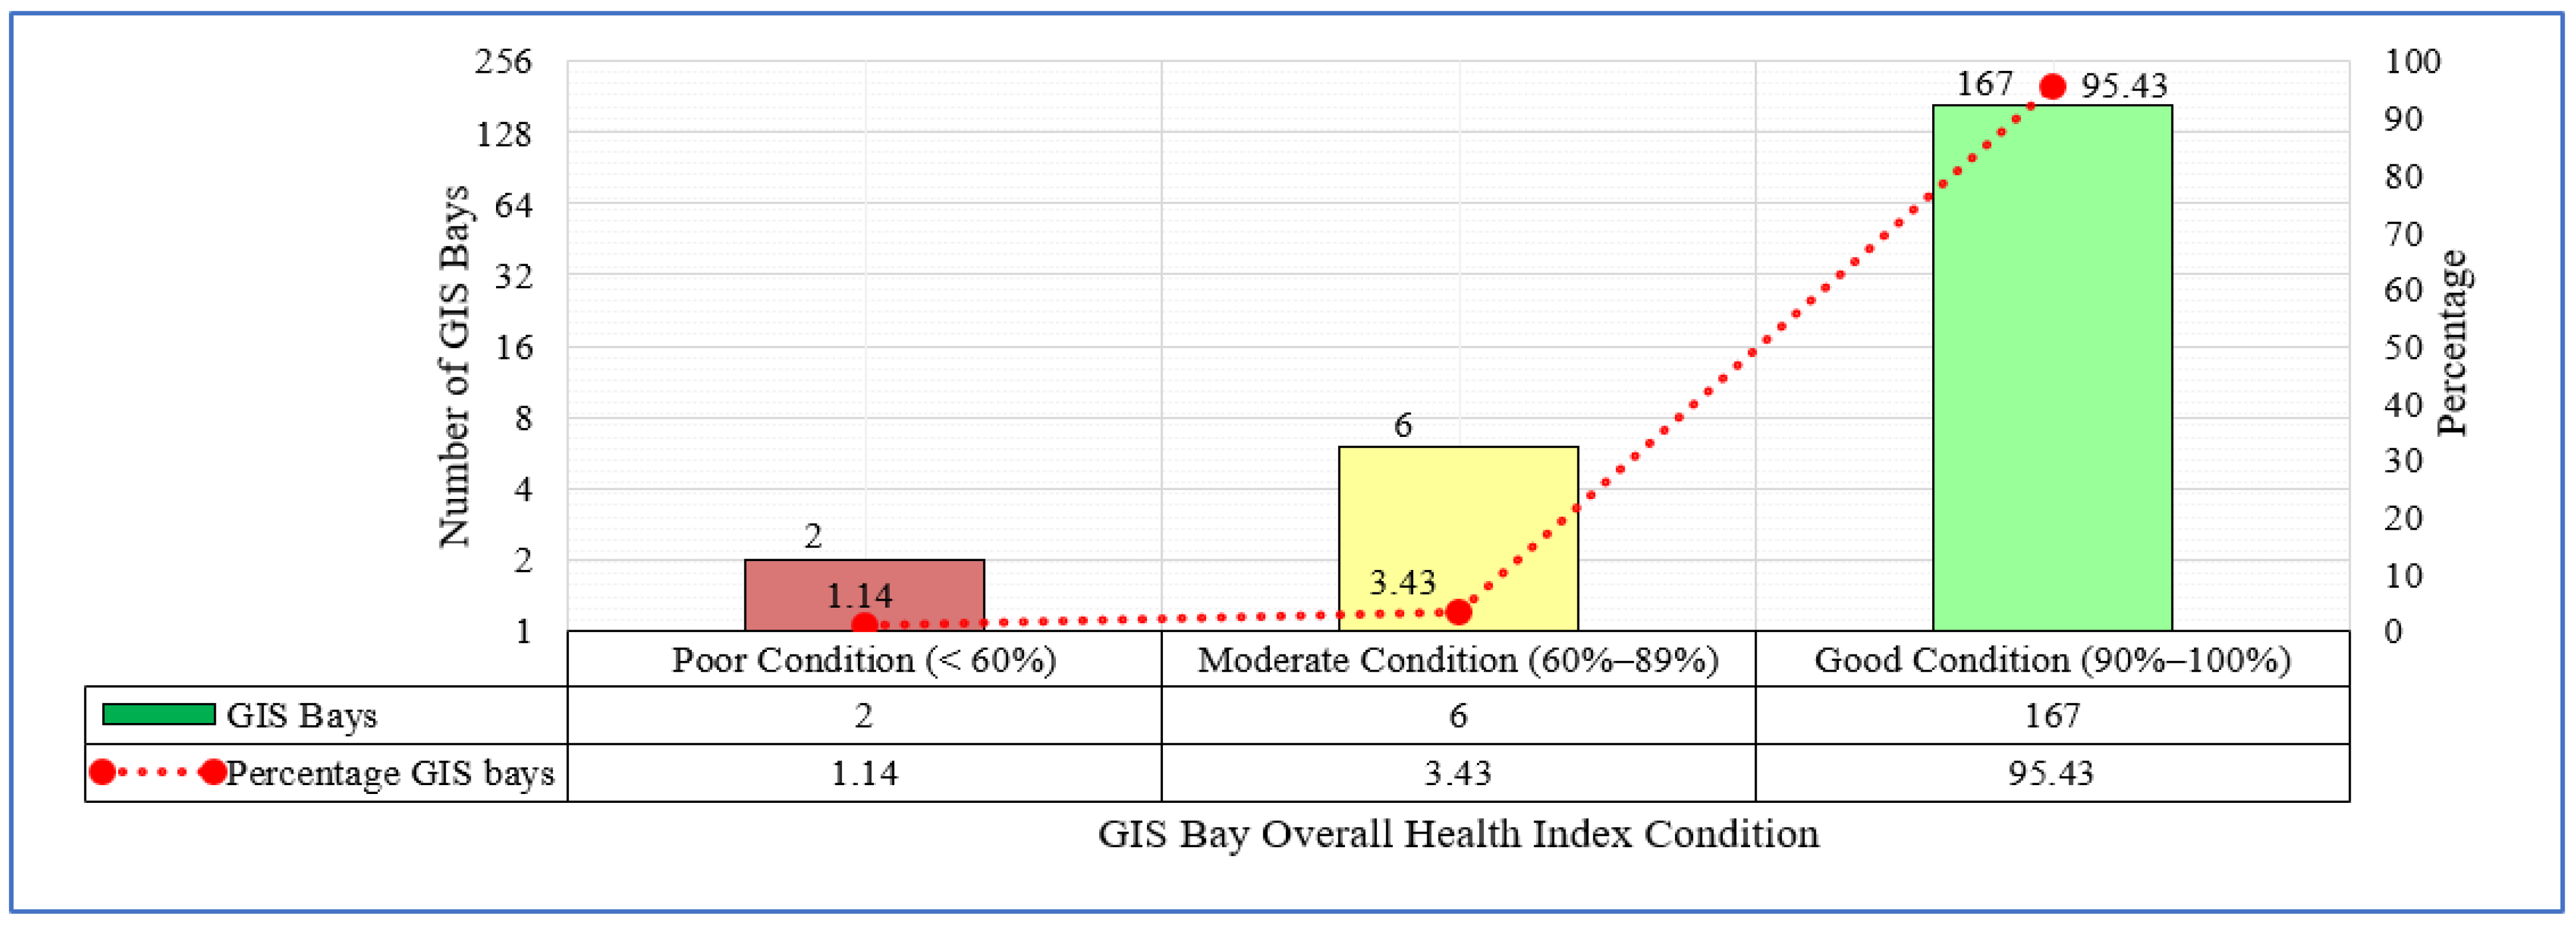
Following the successful validation, the evaluation results of 175 bays comprising 11 GIS models in nine substations are summarized in Figure 8.
The range of %OHIBAY and their related condition was defined by performing the sensitivity test to simulate all possible defects, major and minor failures, as well as the severity of failures and their consequences. As a result, a majority of %OHIBAY, consisting of GIS bays, indicated a good condition, even though their ages differ from 3 to 29 years. This is because major preventive maintenance and inspections are regularly conducted to comprehensively cover all the test items in accordance with the commissioning test, and testing and inspections are more frequent than the manufacturer’s recommendation. Since the outage costs are significantly higher, it is advisable to perform the routine and major maintenance as before in order to continually keep up the performance of these GIS bays. According to the overall result, 95.43% of the GIS bays were classified as being in good condition, whereas 3.43% and 1.14% fell into the categories of moderate and poor conditions, respectively. For six GIS bays with moderate condition, the interval of routine inspection should be reduced to observe the defect development and to detect the symptoms of defects early. In the meantime, the root cause of the problems must be clearly identified to correct the defected parts during the next scheduled maintenance and to define the proper preventive measures. The found defects of those six GIS bays consist of SF6 gas low pressure, CT saturation, and insulation failure in the instrumentation circuit of the CT and VT, respectively. Lastly, two GIS bays in poor condition, E05 and E06, are comprehensively discussed in the previous section.
Nevertheless, the confidence of the evaluated results is limited by the amount of actual data representing defective components, which cover only eight GIS bays due to an excellent maintenance practice of the power-producing company. To gain more confidence and to reduce uncertainty of the obtained results, more data on defective components could be obtained from a major overhaul with comprehensive inspection and diagnosis of internal parts, historical/future major and minor failure records with root cause analysis, and recorded data on defects found during preventive maintenance. Last but not least, the end-of-life assessment data, when they are available, are of prime significance to adjust the FRBS and to enhance the result validation.
The obtained %OHIBAY and the number of GIS bays in each condition are useful information to prioritize the appropriate maintenance tasks based on the health of equipment, corrective urgency, available budget, and human resources. Then, effective maintenance can be achieved resulting in lower equipment failure rate, lifetime extension, and reduction in unplanned outages, as well as lower maintenance costs and costs of failure.
5. Conclusions
This paper presents a comprehensive procedure for the health index determination of GISs utilizing the fuzzy logic approach. At first, the maintenance data obtained from time-based testing and inspection must be transformed into numerical scores and subsequently evaluated by using the fuzzy logic model with the fuzzification and defuzzification process via the FRBS to determine the health index of each component. To avoid the complexity in defining the FRBS, the WSM is employed to calculate the health index percentage of a GIS bay. Since the obtained health index only reflects visible aging, the conditional factor has been introduced by multiplying it with the health index percentage of the GIS bay to incorporate invisible aging and maintaining ability. This method can improve the accuracy of the health index determination procedure and provide reasonable results for the overall health index of a GIS bay. To validate the proposed procedure, the obtained results were compared with other methodologies, including health index models utilizing dominant score techniques and conventional WSM, resulting in satisfactory agreement. Then, the proposed procedure was used to analyze the actual data from 175 bays of GISs operating at 115 kV and 230 kV. As a result, eight GIS bays were identified as in moderate and poor condition. Subsequently, their required corrective actions were recommended to prevent in-service failures. The obtained overall health index percentage information is valuable information for prioritizing maintenance requirements, effectively allocating human resources and diagnostic tools, preventing unplanned outages, and achieving cost savings.
Author Contributions
Conceptualization, T.S. and C.S.; Data curation, N.P.; Formal analysis, N.P.; Investigation, N.P., T.S. and C.S.; Methodology, N.P. and T.S.; Project administration, C.S.; Resources, T.S. and C.S.; Software, N.P.; Supervision, T.S. and C.S.; Validation, T.S.; Visualization, N.P.; Writing—original draft, N.P.; Writing—review and editing, T.S. and C.S. All authors have read and agreed to the published version of the manuscript.
Funding
This research received no external funding.
Data Availability Statement
Not applicable.
Conflicts of Interest
The authors declare no conflict of interest.
Nomenclature
| GIS | Gas-insulated switchgear |
| HI | Health index |
| CF | Conditional factor |
| CB | Circuit breaker |
| ES | Earthing switch |
| DS | Disconnecting switch |
| HS | High-speed earthing switch |
| CT | Current transformer |
| VT | Voltage transformer |
| LCC | Local control cabinet |
| COMPT | SF6 gas compartment |
| RVI | Routine visual inspection |
| WSM | Weight and score method |
| %HIc | Component health index percentage |
| %HIBAY | Bay health index percentage |
| %OHIBAY | Overall health index percentage |
| FRBS | Fuzzy rule-based system |
Appendix A
Figure A1.
Testing methods and health index determination model of SF6 gas compartment using fuzzy logic approach.
Figure A1.
Testing methods and health index determination model of SF6 gas compartment using fuzzy logic approach.

Figure A2.
Testing methods and health index determination model of local control cabinet using fuzzy logic approach.
Figure A2.
Testing methods and health index determination model of local control cabinet using fuzzy logic approach.

Figure A3.
Testing methods and health index determination model of switches using fuzzy logic approach.
Figure A3.
Testing methods and health index determination model of switches using fuzzy logic approach.

Figure A4.
Testing methods and health index determination model of current transformer switches using fuzzy logic approach.
Figure A4.
Testing methods and health index determination model of current transformer switches using fuzzy logic approach.

Figure A5.
Testing methods and health index determination model of voltage transformer using fuzzy logic approach.
Figure A5.
Testing methods and health index determination model of voltage transformer using fuzzy logic approach.


Table A1.
Transformed testing and maintenance scores of eight gas-insulated switchgear bays.
| Component | Type of Test Methods | Score | |||||||
|---|---|---|---|---|---|---|---|---|---|
| E01 | E02 | E03 | E04 | E05 | E06 | E07 | E08 | ||
| CB | general visual inspection items | 5 | 5 | 5 | 5 | 5 | 3 | 5 | 5 |
| driving mechanism inspection | 5 | 5 | 5 | 5 | 5 | 5 | 5 | 5 | |
| electrical control mechanism | 5 | 3 | 5 | 5 | 5 | 5 | 0 | 5 | |
| driving mechanism | 5 | 5 | 5 | 5 | 0 | 5 | 0 | 5 | |
| function test of auxiliary relay | 5 | 0 | 5 | 5 | 5 | 5 | 5 | 5 | |
| contact resistance measurement | 5 | 5 | 5 | 5 | 0 | 5 | 3 | 5 | |
| insulation resistance measurement | 5 | 5 | 3 | 5 | 5 | 5 | 5 | 5 | |
| operating timing measurement | 5 | 5 | 5 | 5 | 0 | 5 | 5 | 5 | |
| routine visual inspection | 3 | 5 | 5 | 5 | 0 | 5 | 5 | 5 | |
| LCC | general visual inspection items | 5 | 5 | 5 | 3 | 5 | 5 | 5 | 5 |
| position indicator visual inspection | 5 | 3 | 5 | 5 | 5 | 5 | 5 | 5 | |
| indicating meter | 5 | 5 | 5 | 5 | 5 | 5 | 5 | 0 | |
| annunciator and alarm circuit | 5 | 5 | 5 | 5 | 5 | 5 | 5 | 0 | |
| routine visual inspection | 3 | 3 | 5 | 0 | 5 | 5 | 5 | 5 | |
| SF6 COMPT | SF6 gas leakage inspection | 5 | 3 | 5 | 5 | 0 | 5 | 3 | 3 |
| SF6 gas quality measurement | 5 | 3 | 0 | 5 | 0 | 5 | 5 | 5 | |
| gas monitoring/density switch test | 3 | 5 | 5 | 5 | 5 | 5 | 5 | 5 | |
| routine visual inspection | 3 | 3 | 5 | 5 | 5 | 5 | 5 | 5 | |
| DS | general visual inspection items | 5 | 5 | 5 | 5 | 5 | 5 | 5 | 5 |
| operating mechanism inspection | 5 | 0 | 5 | 5 | 5 | 0 | 5 | 5 | |
| driving mechanism inspection | 5 | 0 | 5 | 5 | 5 | 0 | 5 | 5 | |
| routine visual inspection | 3 | 5 | 5 | 5 | 5 | 5 | 5 | 5 | |
| ES | general visual inspection items | 5 | 5 | 5 | 5 | 5 | 5 | 5 | 5 |
| operating mechanism inspection | 5 | 5 | 5 | 5 | 5 | 5 | 5 | 5 | |
| driving mechanism inspection | 5 | 5 | 3 | 5 | 5 | 5 | 5 | 5 | |
| routine visual inspection | 3 | 5 | 5 | 5 | 5 | 3 | 5 | 5 | |
| HS | general visual inspection items | 5 | 5 | 5 | 5 | 5 | 5 | 5 | 5 |
| operating mechanism inspection | 5 | 5 | 5 | 5 | 5 | 5 | 5 | 5 | |
| driving mechanism inspection | 5 | 5 | 5 | 5 | 5 | 5 | 5 | 5 | |
| routine visual inspection | 3 | 5 | 5 | 5 | 5 | 3 | 5 | 5 | |
| CT | general visual inspection items | 5 | 5 | 5 | 5 | 5 | 3 | 5 | 5 |
| CT insulation resistance | 5 | 5 | 5 | 5 | 5 | 5 | 5 | 5 | |
| CT ratio and polarity | 5 | 5 | 5 | 5 | 5 | 5 | 5 | 5 | |
| CT magnetizing curve test | 5 | 3 | 5 | 5 | 5 | 5 | 5 | 5 | |
| routine visual inspection | 3 | 5 | 5 | 5 | 5 | 5 | 5 | 5 | |
| VT | general visual inspection items | 5 | 5 | 5 | 5 | 5 | 5 | 5 | 5 |
| VT insulation resistance | 5 | 5 | 5 | 5 | 5 | 5 | 5 | 5 | |
| VT ratio and polarity | 5 | 5 | 5 | 5 | 5 | 5 | 5 | 5 | |
| routine visual inspection | 3 | 5 | 5 | 5 | 5 | 5 | 5 | 3 | |
References
- C37.122-2021; IEEE Standard for High-Voltage Gas-Insulated Substations Rated Above 52 kV. IEEE: Piscataway, NJ, USA, 2021; pp. 1–76. [CrossRef]
- Wilson, H.; Curcanu, G.; Ito, H.; Jung, T.; Küng, T.; Pagän-Diaz, E.; Patel, G.; Pokora, S. Circuit-Breaker Controls Failure: Survey on Circuit-Breaker Controls Systems; CIGRE: Paris, France, 2007. [Google Scholar]
- Runde, M.; Sölver, C.E.; Carvalho, A.; Cormenzana, M.L.; Furuta, H.; Grieshaber, W.; Hyrczak, A.; Kopejtkova, D.; Krone, J.G.; Kudoke, M.; et al. Final Report of the 2004–2007 International Enquiry on Reliability of High Voltage Equipment—Part 2: SF6 Circuit Breakers; CIGRE: Paris, France, 2012. [Google Scholar]
- Runde, M.; Sölver, C.E.; Carvalho, A.; Cormenzana, M.L.; Furuta, H.; Grieshaber, W.; Hyrczak, A.; Kopejtkova, D.; Krone, J.G.; Kudoke, M.; et al. Final Report of the 2004–2007 International Enquiry on Reliability of High Voltage Equipment, Part 5–Gas Insulated Switchgear (GIS); CIGRE: Paris, France, 2012. [Google Scholar]
- Duggan, E.; Ring, I.; Füchsle, D.; Meyer, F.; Sieber, P.; Kopejtkova, D.; Kurte, R.; Jänicke, L.-R.; Glaubitz, P.; Saida, T.; et al. SF6 Analysis for AIS, GIS and MTS Condition Assessment; CIGRE: Paris, France, 2014. [Google Scholar]
- Morshuis, P.; Mehairjan, R.; Ford, G.; Zhou, C.; Balint, N.; Cavallini, A.; Dorrest, B.; Le Blanc, M.; Lee, J.H.; Okamoto, T.; et al. Guidelines for the Use of Statistics and Statistical Tools on Life Data; CIGRE: Paris, France, 2017. [Google Scholar]
- C37.10.1-2018; IEEE Guide for the Selection of Monitoring for Circuit Breakers. IEEE: Piscataway, NJ, USA, 2019; pp. 1–61. [CrossRef]
- Uzelac, N.; Heinrich, C.; Pater, R.; Arnold, J.; Benson, K.; Deck, B.; Fanget, A.; Ferraro, V.; Gariboldi, N.; Livshitz, A.; et al. Non-intrusive Methods for Condition Assessment of Distribution and Transmission Switchgear; CIGRE: Paris, France, 2018. [Google Scholar]
- Razi-Kazemi, A.A.; Niayesh, K. Condition Monitoring of High Voltage Circuit Breakers: Past to Future. IEEE Trans. Power Deliv. 2021, 36, 740–750. [Google Scholar] [CrossRef]
- Jung, J.R.; Seo, H.D.; Kim, S.J.; Kim, H.S.; Joo, J.O.; Ryoo, S.S. Application of an Asset Health Management System for High-Voltage Substations. In Proceedings of the CIGRE, Paris, France, 28 August–2 September 2022. [Google Scholar]
- Srinuntawong, W.; Srangtook, W.; Kerdmanee, S.; Suwanasri, T.; Suwanasri, C.; Fuangpian, P.; Kumpalavalee, S.; Somsak, T. Data Warehouse and Asset Management Intelligence Architecture for Condition Assessment of Major Equipment in Power Plant. In Proceedings of the 2019 IEEE PES GTD Grand International Conference and Exposition Asia (GTD Asia), Bangkok, Thailand, 19–23 March 2019; pp. 532–537. [Google Scholar]
- Tanaka, H.; Tsukao, S.; Yamashita, D.; Niimura, T.; Yokoyama, R. Multiple Criteria Assessment of Substation Conditions by Pair-wise Comparison of Analytic Hierarchy Process. IEEE Trans. Power Deliv. 2010, 25, 3017–3023. [Google Scholar] [CrossRef]
- Witchawut, K.; Fuangpian, P.; Suwanasri, T.; Suwanasri, C. Condition Assessment of a Gas Insulated Substation. In Proceedings of the 2018 International Electrical Engineering Congress (iEECON), Krabi, Thailand, 7–9 March 2018; pp. 1–4. [Google Scholar]
- Panmala, N.; Suwanasri, T.; Suwanasri, C. Condition Assessment of Gas Insulated Switchgear Using Health Index and Conditional Factor Method. Energies 2022, 15, 9393. [Google Scholar] [CrossRef]
- Montanari, G. Condition Monitoring and Dynamic Health Index in Electrical Grids. In Proceedings of the 2016 International Conference on Condition Monitoring and Diagnosis (CMD), Xi’an, China, 25–28 September 2016; pp. 82–85. [Google Scholar]
- Purnomoadi, A.P.; Mor, A.R.; Smit, J.J. Health index and risk assessment models for Gas Insulated Switchgear (GIS) operating under tropical conditions. Int. J. Electr. Power Energy Syst. 2020, 117, 105681. [Google Scholar] [CrossRef]
- Arshad, M.; Islam, S.M.; Khaliq, A. Fuzzy logic approach in power transformers management and decision making. IEEE Trans. Dielectr. Electr. Insul. 2014, 21, 2343–2354. [Google Scholar] [CrossRef]
- Diahovchenko, I.; Korzh, P.; Kolcun, M. A fuzzy-logic-based method for maintenance prioritization of high-voltage SF6 circuit breakers, considering uneven wear. Results Eng. 2022, 16, 100788. [Google Scholar] [CrossRef]
- Poonnoy, N.; Suwanasri, C.; Suwanasri, T. Fuzzy Logic Approach to Dissolved Gas Analysis for Power Transformer Failure Index and Fault Identification. Energies 2021, 14, 36. [Google Scholar] [CrossRef]
- Su, Q.; Lai, L.L.; Austin, P. A fuzzy dissolved gas analysis method for the diagnosis of multiple incipient faults in a transformer. In Proceedings of the 2000 International Conference on Advances in Power System Control, Operation and Management, APSCOM-00, Hong Kong, China, 30 October–1 November 2000; Volume 342, pp. 344–348. [Google Scholar]
- Geng, S.; Wang, X. Research on data-driven method for circuit breaker condition assessment based on back propagation neural network. Comput. Electr. Eng. 2020, 86, 106732. [Google Scholar] [CrossRef]
- Natti, S.; Kezunovic, M. Assessing circuit breaker performance using condition-based data and Bayesian approach. Electr. Power Syst. Res. 2011, 81, 1796–1804. [Google Scholar] [CrossRef]
- Žarković, M.; Stojković, Z. Artificial intelligence SF6 circuit breaker health assessment. Electr. Power Syst. Res. 2019, 175, 105912. [Google Scholar] [CrossRef]
- Boudreau, J.-F.; Poirier, S. End-of-life assessment of electric power equipment allowing for non-constant hazard rate—Application to circuit breakers. Int. J. Electr. Power Energy Syst. 2014, 62, 556–561. [Google Scholar] [CrossRef]
- Arias Velásquez, R.M.; Mejía Lara, J.V.; Melgar, A. Reliability Model for Switchgear Failure Analysis Applied to Ageing. Eng. Fail. Anal. 2019, 101, 36–60. [Google Scholar] [CrossRef]
- Guo, H.; Guo, L. Health index for power transformer condition assessment based on operation history and test data. Energy Rep. 2022, 8, 9038–9045. [Google Scholar] [CrossRef]
- Subramaniam, A.; Sahoo, A.; Manohar, S.S.; Raman, S.J.; Panda, S.K. Switchgear Condition Assessment and Lifecycle Management: Standards, Failure Statistics, Condition Assessment, Partial Discharge Analysis, Maintenance Approaches, and Future Trends. IEEE Electr. Insul. Mag. 2021, 37, 27–41. [Google Scholar] [CrossRef]
- Zhong, J.; Li, W.; Billinton, R.; Yu, J. Incorporating a Condition Monitoring Based Aging Failure Model of a Circuit Breaker in Substation Reliability Assessment. IEEE Trans. Power Syst. 2015, 30, 3407–3415. [Google Scholar] [CrossRef]
- Al-Suhaily, M.; Meijer, S.; Smit, J.J.; Sibbald, P. Knowledge Rules Development for Diagnostics Outcomes in GIS. In Proceedings of the 2012 IEEE International Conference on Condition Monitoring and Diagnosis, Bali, Indonesia, 23–27 September 2012; pp. 313–316. [Google Scholar]
- Arias Velásquez, R.M.; Mejía Lara, J.V. Root cause analysis methodology for circuit breaker associated to GIS. Eng. Fail. Anal. 2020, 115, 104680. [Google Scholar] [CrossRef]
- Kamei, M.; Takai, O. Influence of Sensor Information Accuracy on Condition-Based Maintenance Strategy for GIS/GCB Maintenance. IEEE Trans. Power Deliv. 2011, 26, 625–631. [Google Scholar] [CrossRef]
- Rayon, J.; Penning, J.; Aitabdelmalek, F.; Weidmann, W.; Juge, P.; Granelli, G.; Girodet, A.; Gautschi, D. Monitoring and Condition Assessment for GIS Substations and GIL; CIGRE: Paris, France, 2012; pp. B3–B208. [Google Scholar]
- Razi-Kazemi, A.A. Applicability of auxiliary contacts in circuit breaker online condition assessment. Electr. Power Syst. Res. 2015, 128, 53–59. [Google Scholar] [CrossRef]
- Yanbin, C.; Bo, C. The Condition Based Maintenance Evaluation Model on On-post Vacuum Circuit Breaker. Syst. Eng. Procedia 2012, 4, 182–188. [Google Scholar] [CrossRef]
- Gulski, E.; Lemke, E.; Quak, B.; Marshall, R.; Groot, E.R.S.; Muhr, M.; Tusek, J.; Okamoto, T.; Wester, F.J.; Pelissou, S.; et al. Generic Guidelines for Life Time Condition Assessment of HV Assets and Related Knowledge Rules; CIGRE: Paris, France, 2010. [Google Scholar]
- Anguas, J.; Ford, G.; Jung, T.; Kopejtková, D.; Mercier, A.; Ravetta, C.; Schumacher, M.; Skog, J.; Steingräber, W.; Woodcock, D. Obtaining Value from On-Line Substation Condition Monitoring; CIGRE: Paris, France, 2011. [Google Scholar]
- Reuters, M.; Linn, T.; Templeton, D.; Lopez-Roldan, J.; Beck, M.; Penning, J.-F.; Bélec, M.; Ring, I.; Dullni, E.; Rowland, S.; et al. Benefits of PD Diagnosis on GIS Condition Assessment; CIGRE: Paris, France, 2017. [Google Scholar]
- C37.09-2018; IEEE Standard Test Procedures for AC High-Voltage Circuit Breakers with Rated Maximum Voltage Above 1000 V. IEEE: Piscataway, NJ, USA, 2019; pp. 1–119. [CrossRef]
- Koch, H.J. Gas Insulated Substations; John Wiley & Sons: Hoboken, NJ, USA, 2014. [Google Scholar]
Figure 1.
GIS components with testing methods and weighting factors.

Figure 2.
The triangular Mamdani-type fuzzy rule-based system.

Figure 3.
Testing methods and health index determination model of circuit breaker using fuzzy logic approach.
Figure 3.
Testing methods and health index determination model of circuit breaker using fuzzy logic approach.

Figure 4.
(a) Health index determination model of circuit breaker using fuzzy logic approach; (b) fuzzy logic rules for health index determination of circuit breaker in the second-layer model.
Figure 4.
(a) Health index determination model of circuit breaker using fuzzy logic approach; (b) fuzzy logic rules for health index determination of circuit breaker in the second-layer model.

Figure 5.
Health index determination procedure of gas-insulated switchgear using fuzzy logic approach with the aid of weighting scoring method.
Figure 5.
Health index determination procedure of gas-insulated switchgear using fuzzy logic approach with the aid of weighting scoring method.

Figure 6.
(a) Testing methods and fuzzy logic model for conditional factor determination; (b) fuzzy logic model for conditional factor determination; and (c) fuzzy logic rules for conditional factor determination.
Figure 6.
(a) Testing methods and fuzzy logic model for conditional factor determination; (b) fuzzy logic model for conditional factor determination; and (c) fuzzy logic rules for conditional factor determination.

Figure 7.
Fuzzy logic model for SF6 gas compartment for health index determination of bay E05.

Figure 8.
Number of bays and their %OHI based on their conditions.

Table 1.
Criteria and their related scoring for conditional factor assessment.
| Operating Conditions | Score | ||
|---|---|---|---|
| (0) | (3) | (5) | |
| age in service (years) | >40 | 31–39 | <30 |
| overall condition | fail | trending | good |
| number of mechanical operations | >5000 | 4500–5000 | <4500 |
| number of switching operations | >2000 | 1700–2000 | <1700 |
| number of short circuit current interruptions | >20 | 15–20 | <15 |
| percentage of actual load current to rated current | >100% | 80–100% | <80% |
| percentage of actual short circuit to interrupting capacity | >100% | 80–100% | <80% |
| maintenance and replacement efforts | difficult | moderate | easy |
| technology, know-how, and skilled personnel | poor | moderate | good |
| after-sale service | poor | moderate | good |
| satisfaction in operation | poor | moderate | satisfied |
Table 2.
Range of %OHIBAY for condition classification and recommended actions.
| %OHI | Indicator | Description |
|---|---|---|
| 90–100% | Good | Maintain normal maintenance and routine visual inspection. |
| 60–89% | Moderate | Increase maintenance cycle in order to track the change in condition. |
| less than 60% | Poor | Plan replacement and end-of-life assessment. |
Table 3.
Health index evaluation of eight GIS bays and their components.
| Component Health Index | %Wc;j | GIS Bay Condition | |||||||
|---|---|---|---|---|---|---|---|---|---|
| E01 | E02 | E03 | E04 | E05 | E06 | E07 | E08 | ||
| %HICB | 20 | 98.65 | 86.10 | 96.73 | 98.65 | 54.40 | 96.73 | 69.97 | 98.65 |
| %HILCC | 10 | 90.00 | 85.00 | 98.33 | 70.00 | 98.33 | 98.33 | 98.33 | 60.00 |
| %HICOMPT | 20 | 80.00 | 70.00 | 75.00 | 98.33 | 50.00 | 98.33 | 90.00 | 90.00 |
| %HIDS | 10 | 90.00 | 50.00 | 98.33 | 98.33 | 98.33 | 50.00 | 98.33 | 98.33 |
| %HIES | 10 | 90.00 | 98.33 | 90.00 | 98.33 | 98.33 | 90.00 | 98.33 | 98.33 |
| %HIHS | 10 | 90.00 | 98.33 | 98.33 | 98.33 | 98.33 | 90.00 | 98.33 | 98.33 |
| %HICT | 10 | 90.00 | 90.00 | 98.33 | 98.33 | 98.33 | 90.00 | 98.33 | 98.33 |
| %HIVT | 10 | 90.00 | 98.33 | 98.33 | 98.33 | 98.33 | 98.00 | 98.33 | 90.00 |
| %HIBAY | 89.73 | 83.22 | 92.51 | 95.56 | 79.87 | 90.64 | 90.99 | 92.06 | |
Table 4.
Conditional factor evaluation and overall bay health index modification.
| Operating Condition | SCF | |||||||
|---|---|---|---|---|---|---|---|---|
| E01 | E02 | E03 | E04 | E05 | E06 | E07 | E08 | |
| age in service (years) | 5 | 5 | 5 | 5 | 5 | 3 | 5 | 5 |
| overall condition | 5 | 5 | 5 | 5 | 3 | 5 | 5 | 5 |
| number of mechanical operations | 5 | 5 | 5 | 5 | 5 | 5 | 5 | 5 |
| number of switching operations | 5 | 3 | 5 | 5 | 5 | 5 | 5 | 5 |
| number of short circuit current interruptions | 5 | 5 | 5 | 5 | 3 | 5 | 3 | 5 |
| percentage of actual load current to rated current | 5 | 5 | 5 | 3 | 5 | 5 | 5 | 5 |
| percentage of actual short circuit to interrupting capacity | 3 | 5 | 5 | 5 | 5 | 5 | 5 | 5 |
| maintenance and replacement efforts | 5 | 5 | 3 | 5 | 3 | 3 | 5 | 3 |
| technology, know-how, and skilled personnel | 3 | 5 | 5 | 3 | 5 | 5 | 5 | 5 |
| after-sale service | 5 | 5 | 5 | 5 | 5 | 0 | 5 | 5 |
| satisfactory in operation | 5 | 5 | 5 | 5 | 5 | 3 | 5 | 5 |
| CF | 0.85 | 0.90 | 0.90 | 0.85 | 0.75 | 0.65 | 0.90 | 0.90 |
| %HIBAY | 89.73 | 83.22 | 92.51 | 95.56 | 79.87 | 90.64 | 90.99 | 92.06 |
| %OHIBAY | 76.27 | 74.89 | 83.26 | 81.22 | 59.09 | 58.92 | 81.89 | 82.85 |
Table 5.
Health index results from fuzzy logic approach, conventional WSM, and dominant score.
| Bay | Fuzzy Logic Approach Proposed Procedure | WSM [14] with Aid of AHP | HI [16] PLN Research Institute | |||
|---|---|---|---|---|---|---|
| %OHI | Condition | %OHI | Condition | Dominant Score | Prob. Fail. | |
| E01 | 76.27 | Moderate | 76.31 | Moderate | 30 | HIGH |
| E02 | 74.89 | Moderate | 77.35 | Moderate | 30 | HIGH |
| E03 | 83.25 | Moderate | 84.62 | Moderate | 100 | VERY HIGH |
| E04 | 81.22 | Moderate | 81.83 | Moderate | 30 | HIGH |
| E05 | 59.90 | Bad | 58.38 | Bad | 100 | VERY HIGH |
| E06 | 58.91 | Bad | 56.49 | Bad | 100 | VERY HIGH |
| E07 | 81.89 | Moderate | 86.37 | Moderate | 30 | HIGH |
| E08 | 82.85 | Moderate | 86.90 | Moderate | 30 | HIGH |
Disclaimer/Publisher’s Note: The statements, opinions and data contained in all publications are solely those of the individual author(s) and contributor(s) and not of MDPI and/or the editor(s). MDPI and/or the editor(s) disclaim responsibility for any injury to people or property resulting from any ideas, methods, instructions or products referred to in the content. |
© 2023 by the authors. Licensee MDPI, Basel, Switzerland. This article is an open access article distributed under the terms and conditions of the Creative Commons Attribution (CC BY) license (https://creativecommons.org/licenses/by/4.0/).
Share and Cite
MDPI and ACS Style
Panmala, N.; Suwanasri, T.; Suwanasri, C. A Fuzzy Logic Approach to Health Index Determination for a Gas-Insulated Switchgear. Energies 2023, 16, 6605. https://doi.org/10.3390/en16186605
AMA Style
Panmala N, Suwanasri T, Suwanasri C. A Fuzzy Logic Approach to Health Index Determination for a Gas-Insulated Switchgear. Energies. 2023; 16(18):6605. https://doi.org/10.3390/en16186605
Chicago/Turabian StylePanmala, Nattapon, Thanapong Suwanasri, and Cattareeya Suwanasri. 2023. "A Fuzzy Logic Approach to Health Index Determination for a Gas-Insulated Switchgear" Energies 16, no. 18: 6605. https://doi.org/10.3390/en16186605
Note that from the first issue of 2016, this journal uses article numbers instead of page numbers. See further details here.