
Subsea Power Cable Health Management Using Machine Learning Analysis of Low-Frequency Wide-Band Sonar Data


1
James Watt School of Engineering, University of Glasgow, Glasgow G12 8QQ, UK
2
The School of Engineering and Physical Sciences (EPS), Heriot Watt University, Edinburgh EH14 4AS, UK
*
Author to whom correspondence should be addressed.
Energies 2023, 16(17), 6172; https://doi.org/10.3390/en16176172
Submission received: 24 March 2023
/
Revised: 30 June 2023
/
Accepted: 3 August 2023
/
Published: 25 August 2023
(This article belongs to the Special Issue Condition Monitoring of Power System Components)
Abstract
:Subsea power cables are critical assets for electrical transmission and distribution networks, and highly relevant to regional, national, and international energy security and decarbonization given the growth in offshore renewable energy generation. Existing condition monitoring techniques are restricted to highly constrained online monitoring systems that only prioritize internal failure modes, representing only 30% of cable failure mechanisms, and has limited capacity to provide precursor indicators of such failures or damages. To overcome these limitations, we propose an innovative fusion prognostics approach that can provide the in situ integrity analysis of the subsea cable. In this paper, we developed low-frequency wide-band sonar (LFWBS) technology to collect acoustic response data from different subsea power cable sample types, with different inner structure configurations, and collate signatures from induced physical failure modes as to obtain integrity data at various cable degradation levels. We demonstrate how a machine learning approach, e.g., SVM, KNN, BP, and CNN algorithms, can be used for integrity analysis under a hybrid, holistic condition monitoring framework. The results of data analysis demonstrate the ability to distinguish subsea cables by differences of 5 mm in diameter and cable types, as well as achieving an overall 95%+ accuracy rate to detect different cable degradation stages. We also present a tailored, hybrid prognostic and health management solution for subsea cables, for cable remaining useful life (RUL) prediction. Our findings addresses a clear capability and knowledge gap in evaluating and forecasting subsea cable RUL. Thus, supporting a more advanced asset management and planning capability for critical subsea power cables.
1. Introduction
There is a growing trend of increased investment in offshore renewable energy [1]. The United Kingdom presents a well-established and expanding market opportunity with 29 operational offshore wind farms, currently providing a total installed capacity of 5.1 GW. The UK plans involve generating 20–40 GW of power from its offshore wind farms, necessitating an investment of approximately GBP 80–160 billion [2]. These offshore installations heavily depend on crucial infrastructure assets like subsea power cables, responsible for exporting and transmitting power to the mainland. The demand for this vital asset is projected to increase significantly, reaching an estimated total of 24,103 km between 2017 and 2021, driven by the continuous expansion of offshore wind power capacities [3,4].
The sustainability and economic feasibility of offshore wind farms hinge on the reliability of subsea cables for asset owners. Failures in these cables can lead to disruptions in power supply, resulting in substantial revenue losses for utility companies and asset owners. To illustrate, a 300 MW wind farm could face losses of approximately GBP 5.4 million per month in revenue due to a power outage caused by a fault in one of its subsea cables [5].
In 2015, insurance claims related to subsea power cables in the offshore sector amounted to EUR 60 million, as reported by underwriter GCube [6]. The cost for locating and replacing a damaged section of a subsea cable can vary from GBP 0.6 million to GBP 1.2 million [7], while any delay in repair and replacement may cost more than EUR 20,000 per extra hour [8]. Prior to deployment, cable manufacturers undertake rigorous tests to ensure cables meet specific pre-set standards related to the electrical and thermal behaviour of cables and their mechanical strength during operation [9]. However, once cables are deployed underwater, this becomes more difficult to monitor due to the long distance between onshore substations and offshore wind farms and dynamic subsea environment.
To improve our understanding of subsea power cable failures and produce a more intelligent prognostic solution, our previous work [10] shows that historical subsea cable failures are mostly associated with external factors such as harsh environmental conditions. Current monitoring systems in the commercial sector primarily concentrate on internal failure modes of subsea cables. These systems utilize techniques such as partial discharge monitoring and distributed strain and temperature (DST) measurements to assess the thermal condition of the cables. Operators can analyze the outputs from the DST printouts at onshore substations to identify and locate any internal fiber damage within the subsea cables. However, it is important to note that these measurements do not serve as a definitive precursor indicator of failure. Therefore, to ensure the status of the cable and the surrounding environment, regular inspections by divers or remotely operated underwater vehicles (ROVs) are essential.
In addition, little has been reported on wear-out mechanisms due to corrosion and abrasion. Available abrasion wear tests where cables are subjected to mechanical rig tests can verify cable robustness during installation but not during cable operations. Larsen-Basse et al. [11] introduced a specialized abrasion wear model designed for a specific section of the cable route, but it does not account for corrosion and scouring. Booth and Sandwith [12] outlined a method to determine the abrasion wear coefficient for polyethylene outer-serving using the Taber abrasion test; however, it is important to note that data from this test have not been utilized in any model-based analysis before [13].
Thus, so far, mechanical failures and chemical and electrical failures have been well documented, yet the most common failure modes, namely, environmental and third-party damages which could also lead to abrasion and corrosion, have not been fully examined. Consequently, cable users are limited to few reactive, time-based options for assessing the remaining useful life (RUL) of subsea cables. Hence, there is a demand for an inventive approach that centers on monitoring the degradation, reliability, and maintenance of subsea cables. According to a Crown Estate report [4], such innovative solutions offer opportunities to “decrease Operation and Maintenance (O&M) expenditures and minimize downtime”.
In our previous work [14], we developed a multi-physics model that predicts the health status and RUL of subsea power cables using both cable specification data and environmental information, such as tidal flows, as well as experimental data on abrasion and corrosion wear. This methodology enables offline predictions of cable lifetime. However, a more comprehensive, holistic approach requires validation of RUL predictions and including real-time monitoring capabilities to provide in situ status updates for this critical asset, e.g., integrity and degradation changes.
In this paper, we utilize bio-sonar sensing technologies to gather echo response data from subsea power cables, which then become inputs to train machine learning algorithms for real-time assessment of cable integrity and degradation analysis.
This approach enhances the capability for maintenance planning and improves the accuracy of cable integrity forecasting by validating or updating predictions from the offline physics of failure (PoF) model. We also proposed a holistic asset health management solution incorporating both online and offline monitoring capabilities. This solution provides precursor indicators to asset operators and managers, assisting them in monitoring subsea cable degradation and planning inspections and maintenance. Our tailored solution offers cost-effective and timely intervention to subsea power cables, enabling predictive forecasting of cable failures, including degradation rates and locations.
Specifically, Section 2 presents the background on subsea power cables and their failure modes and reviews the state-of-the-art condition monitoring for this critical asset. Section 3 outlines our previous work on a multi-physics model, then describes the proposed fusion asset health management architecture. In Section 4, we use wideband low-frequency bio-sonar to obtain the first collated integrity dataset on different levels of cable degradation. In Section 5, we demonstrate how a machine learning approach can be used as part of the fusion prognostics architecture, to address gaps in present subsea cable condition monitoring and inform intelligent asset management and planning framework. Lastly, Section 6 brings a conclusion and suggests future work.
2. Background
2.1. Subsea Power Cables
There are two widely utilized types of high-voltage subsea cables: high-voltage alternating current (HVAC) cables and high-voltage direct current (HVDC) cables. HVAC cables are known as “three-phase” cables that employ solid insulation materials, such as ethylene propylene rubber (EPR) or crosslinked polyethylene (XLPE) [15]. These cables consist of three conductors enclosed by conductor screenings and insulation systems made of EPR or XLPE. The primary purpose of these insulation systems is to prevent partial discharges and overheating [16]. Additionally, binder tapes are used to bind the conductors together, and the entire assembly is protected by a single or double steel armor layer. The steel armor provides stability against tension, compression, and mechanical damage during the installation process and protects the cable from abrasion caused by the seabed and rocks [17].
To protect subsea cables from external threats like fishing equipment or ship anchors that could cause damage, one of the most effective approaches is cable burial. This process can be carried out in suitable seabed conditions [14]. Single-armored cables are typically buried to provide overall protection, especially in areas where external threats can compromise the cable’s integrity [15]. On the other hand, double-armored cables, although heavier and less flexible, offer enhanced protection and are better suited for achieving the desired burial depth. These cables are considered preferable alternatives to single-armored cables in regions with a higher risk of damage due to trawling, heavy ship traffic, and other third-party activities [15].
To further shield the armor layer from corrosion, an exterior layer is added, typically comprising Hessian tape, bituminous compound, and yarn or polypropylene strings. This outer serving layer prevents penetration by seawater, maintaining a dry environment for the inner steel armor.
2.2. Subsea Power Cable Failures
Subsea cables play a critical role in undersea power transmission, but repairing them is a challenging and costly process. Cable failures can result in power outages, loss of revenue, and can be mainly classified into four categories, internal, early-stage, external, or environmental damage, as well as third-party damage [14]; however, data on cable failures are limited because cable operators are often reluctant to report it.
Internal failures can be caused by overvoltage and overheating, while early-stage failures may result from manufacturing defects, installation stresses, or damage during installation. External failures are often due to environmental conditions, such as corrosion, abrasion, and third-party damage from fishing activities or installation mishaps. Environmental factors like ocean currents, waves, and natural disasters can also contribute to cable damage.
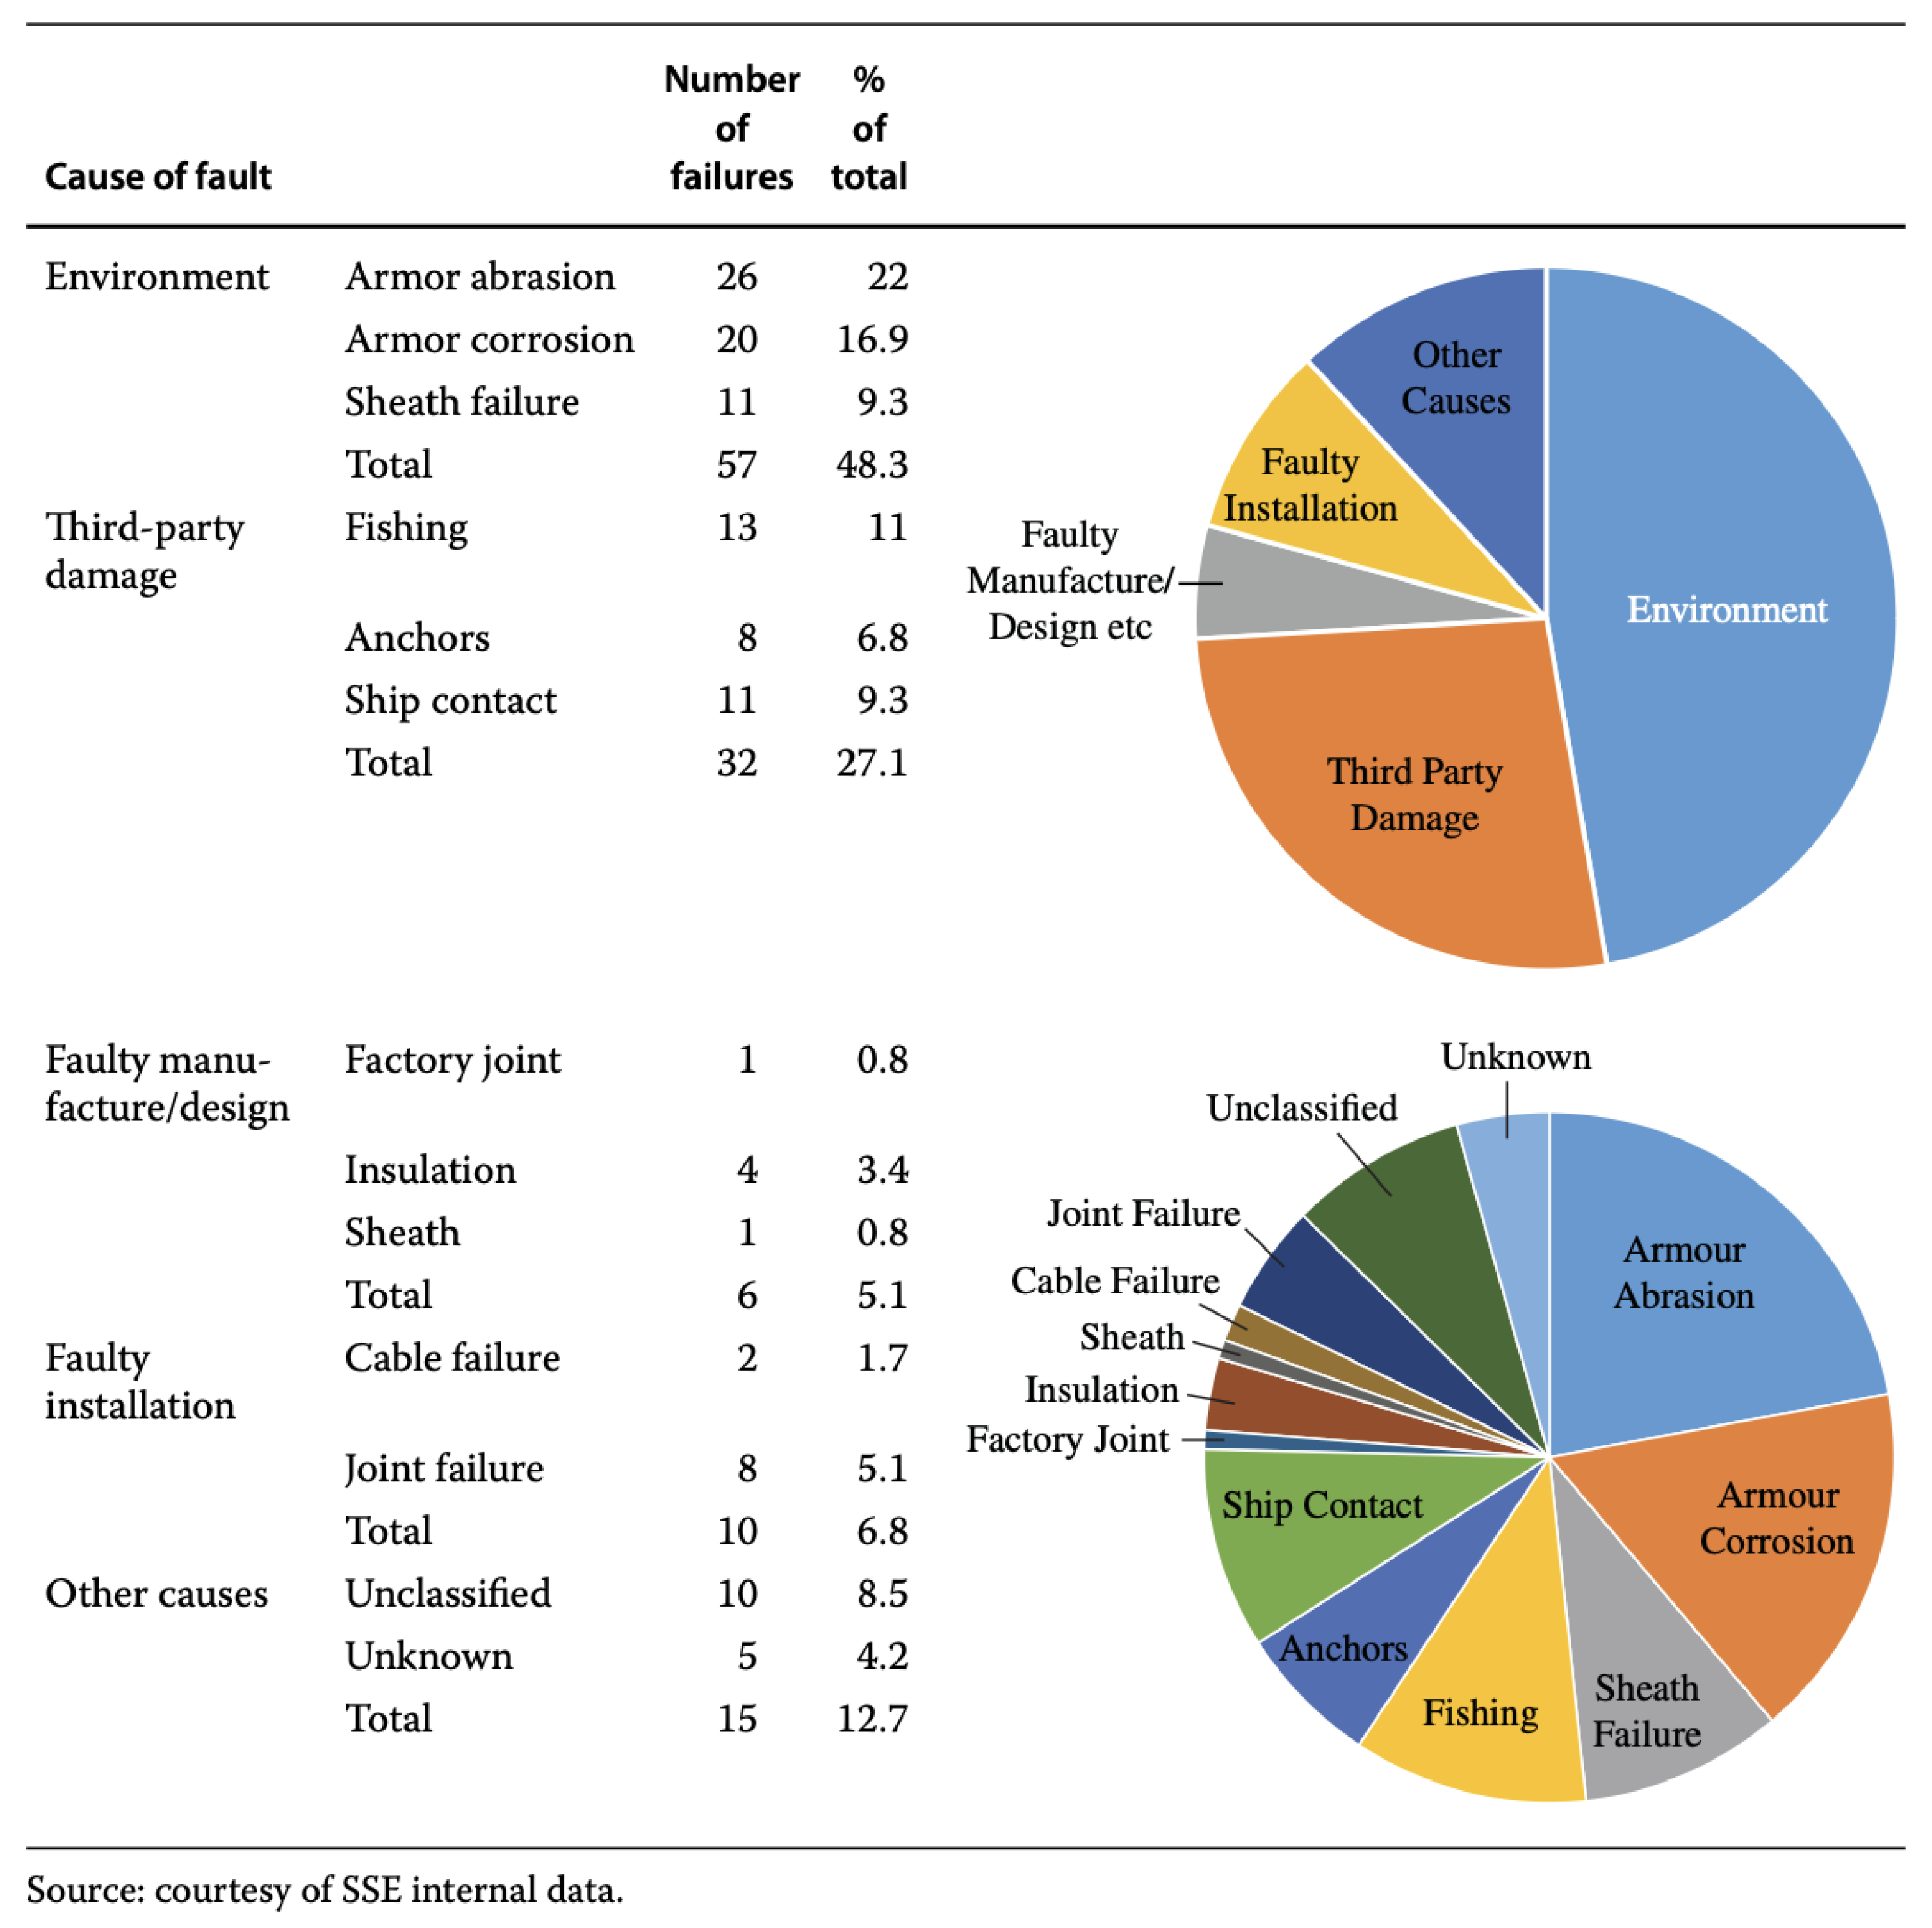
Previous studies [14,18,19] have indicated that the primary causes of subsea cable failures are related to environmental conditions (48%) and third-party damage (27%), as shown in Figure 1. Failures of cable armor and sheath are due to wear-out mechanisms, such as corrosion and abrasion, while third-party-inflicted failures result from random events caused by shipping practices, such as anchoring and trawling. Several reports from Cigré have shown that commercial fishing is also a major cause of offshore cable failures, which is supported by the SSE report [14]. When subsea cables become exposed and float above the burial seabed, fishing activities can endanger cable health.
2.3. Subsea Power Cable Standards and Condition Monitoring
To ensure cables meet specific pre-set standards, cable manufacturers conduct rigorous tests that focus on the electrical and thermal behavior of cables, as well as their mechanical strength during operation, as detailed in the IEC standard 60229 [20]. However, these tests, such as the abrasion wear test, which involves subjecting a cable to a mechanical rug test where a steel angle is dragged horizontally along the cable, are not always applicable to cables’ actual operating conditions. For example, these tests may not capture the mechanical strength of cables when subjected to sliding on the seabed due to tidal flows. Therefore, test results may not reflect actual abrasion behavior during cable operation. Once cables are in operation, they become more challenging to monitor due to the long distance between onshore substations and offshore wind farms.
Billions of dollars have been invested in international subsea cable projects recently. However, the monitoring systems currently in use for subsea power cables lack the capability to monitor or predict the RUL concerning significant subsea cable failure mechanisms. Most of these failures result from environmental factors. Traditional condition monitoring technologies for subsea cables are centered around internal failure modes, including partial discharge monitoring and distributed temperature sensing (DTS) monitoring, to detect cable overheating and electrical overload using embedded fibre optics [10,21,22]. However, these methods does not offer precursor indicators to cable failures, and does not monitor operating environment induced failures, such as abrasion and corrosion due to interactions between subsea cable, seabed, and tidal flows.
Recent developments on providing more dynamic condition monitoring capabilities can be found in [23] where embedded optic fibre is shown to be useful for monitoring damage related to tidal flows under experimental conditions, but not verified using operational cable data. In addition, combined with temperature and stress sensors, fibre Bragg sensors (FBG) can also help detect stress and strain along subsea cable as in [24]. Compared to prescribed cable capacity, the robustness level obtained using this hybrid-sensor method can help warn asset operators about potential external failures. However, sensors need to be embedded into subsea power cables pre-installation, thus subject to higher costs for asset owners. In addition, when defects are detected, verification is required through inspections. Current commercial inspection programs that involve expensive and challenging visual inspection with diver and/or ROV supported video footage are subject to requiring good visibility, challenges in locating the cable and inability to identify failure modes at the interface of the seabed.
There exists limited studies on condition monitoring of subsea cables due to abrasion and corrosion. Larsen-Basse et al. [11] use a localized abrasion wear model for a specific section of the cable route but does not include corrosion and scouring. In Wu’s [25], modeling abrasion and corrosion requires cable movement information to be readily available as input data. As discussed earlier, abrasion and corrosion are likely to result from external and environmental factors. In addition, existing methods outlined previously have limited capacity to provide precursor indicators for cable integrity status, and are developed mostly under controlled, static experiment conditions.
Currently, there are limited options available for assessing the RUL of subsea cables through effective monitoring and prediction. While mechanical, chemical, and electrical failures are well-documented, environmental and third-party damages, which are the most common failure modes, have not been fully examined. To achieve effective subsea power cable health management, more dynamic condition monitoring techniques are required, along with advanced sensing technologies to obtain data for damages, such as abrasion and corrosion.
In situ measurements are necessary to predict external cable failure modes due to the sensitivity of degradation rates to local ambient conditions. However, inspection is limited to diver inspection and video footage, which has various limitations, such as requiring good visibility, access to the cable, challenges in locating the cable, and limited data. To address this knowledge gap, we explore the capability of advanced sensing technology to build the world’s first in situ cable integrity data library, which will be detailed in the following sections.
2.4. Low-Frequency Wide-Band Sonar
There has been extensive research into dolphin echolocation, or bio-sonar systems, which allows the animal to detect objects, and evaluate size, shape, and other object characteristics, such as material and thickness [11,26,27,28,29]. In essence, dolphins emit short acoustic pulses, also known as clicks towards objects, and then evaluate the returned echo for object characterisation. Sound scattering from the object creates return echos, which were found to contain information on size and structure of target objects [30]. Gaunaurd et al. [31] showed that echo responses returned by recorded wideband dolphin pulses can be processed to obtain features that identifies radius and thickness, as well as material of a cylindrical beeswax-filled shell. Development of bio-inspired systems include dolphin-based sonar that emits and receives biometric dolphin-like pulses designed by the Bio-sonar Program office at the SPAWAR Systems Center, San Diego, and Applied Research Laboratories, University of Texas (ARL-UT) [32]. The application of bio-inspired wide-band sonar for cable inspection builds upon the research conducted by [33], which focused on underwater target detection and tracking. In their work, they developed a compact bio-inspired sensing system capable of being fitted onto an autonomous underwater vehicle. This system enabled autonomous tracking of underwater cables. The wideband sonar proved to be exceptionally effective in classifying and recognizing mid-water and bottom set targets. Moreover, Ref. [34] conducted a study that demonstrated the use of sonar for object classification. They represented the echo responses from sonar scans of underwater objects in the Time-Frequency Domain (TFD) and input these data into a Convolution Neural Network system for classification. The accuracy of using sonar echo responses for object classification reached an impressive 98.44%. These findings suggest the potential of utilizing bio-sonar in real-time monitoring of subsea cables. Implementing this technology could offer in situ status updates for critical aspects of these cables, such as their integrity and any changes in degradation over time.
3. Prognostic and Health Management System for Subsea Power Cables
Physics of Failure Modelling and Fusion Prognostics Architecture
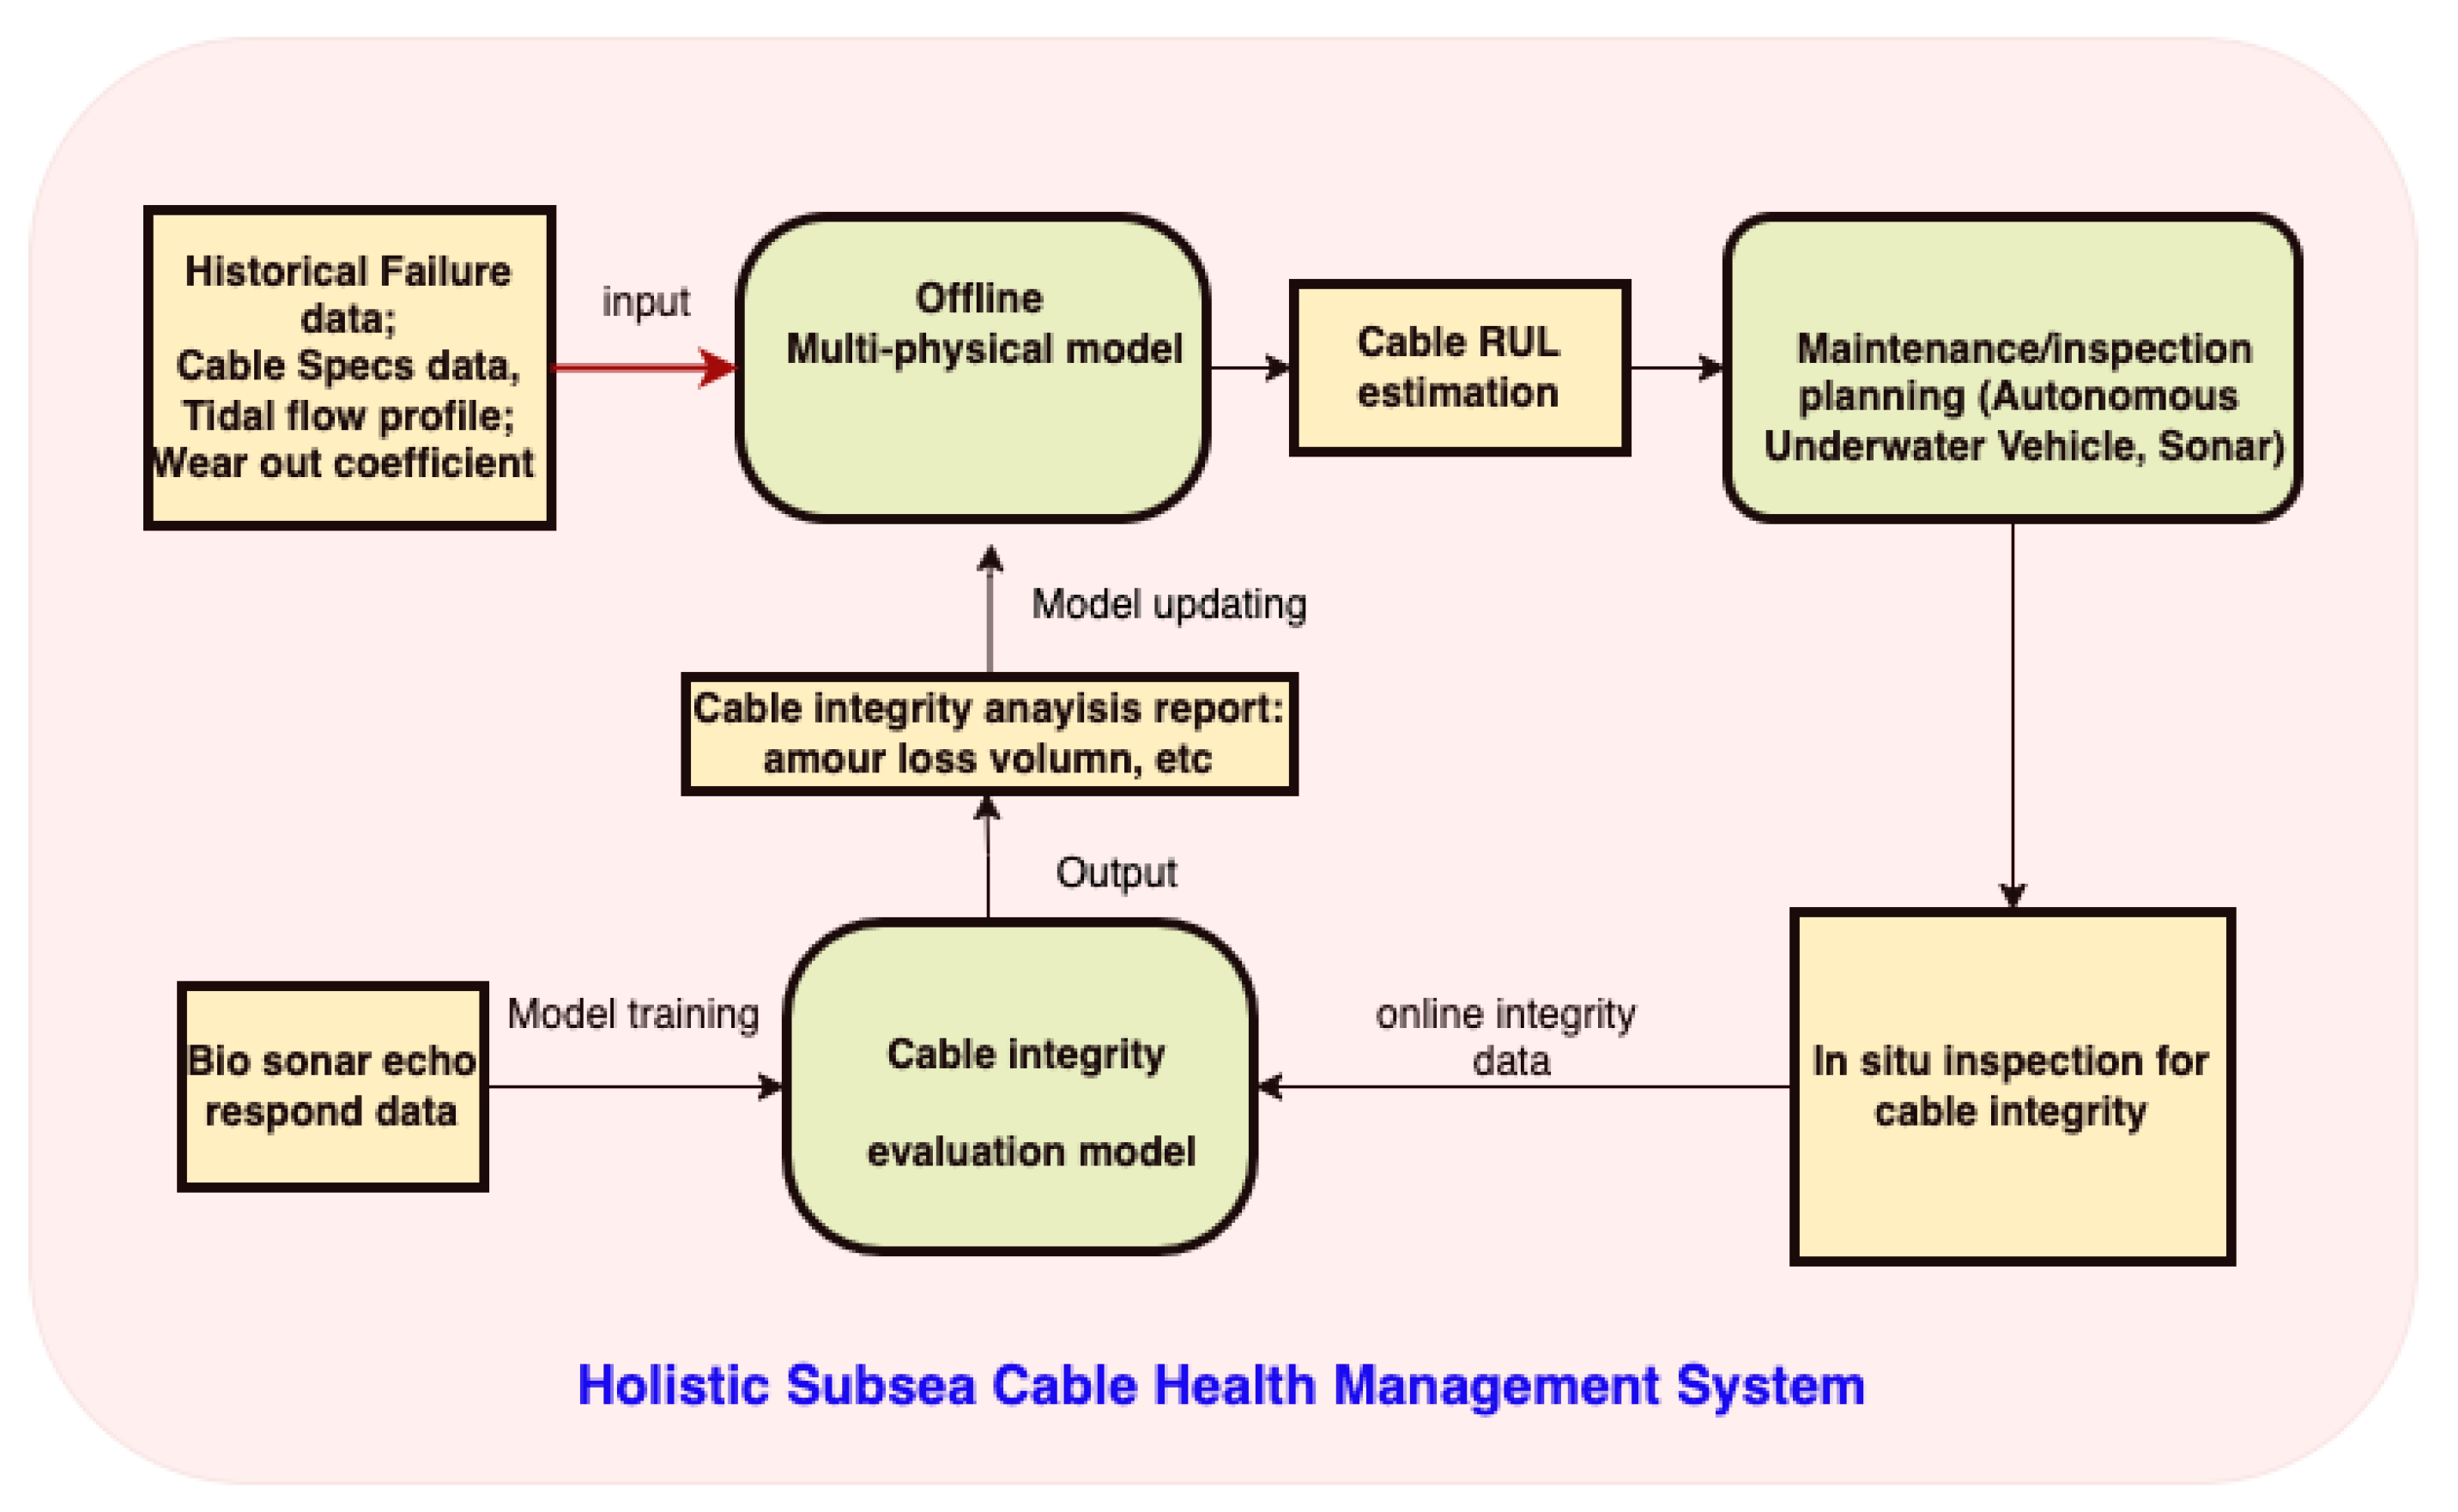
As discussed in Section 2.3, existing challenges present for subsea power cable prognostic and health management include a knowledge gap on wear-out mechanisms, such as corrosion and abrasion when cables are subject to harsh and dynamic underwater environment; and limited accessibility to cables for inspections and verification purposes, which is related to the lack of integrity data for conducting in situ cable integrity assessment. These challenges create a need for more sophisticated and dynamic approach to design health management system for subsea power cables. In our previous work [14,35], we developed a physics of failure (PoF) model for subsea power cable prognostics. The model characterises subsea power cable movements under-water for in situ conditions, and predicts scouring, and wear from abrasion and corrosion. Specifically, the PoF model combines cable specifications data with abrasive wear coefficients estimated from a Taber test, material properties, and sea topography data as inputs to estimate the volume loss of cable protective layers due to abrasion and scouring, and estimates expected life of cables. The model allows for the accurate prediction of the time and location of failure within a cable section, taking into account local seabed conditions and tidal current parameters. This capability leads to reduced operation and maintenance costs while minimizing risks to this vital infrastructure. Additionally, the model is integrated into a desktop tool, providing valuable support to cable manufacturers, offshore operators, and utility companies. It enables them to assess the life expectancy of their cabling systems with precision throughout the entire process, from design and deployment to ongoing lifecycle management.
However, subsea power cables require a comprehensive approach that validates RUL predictions and provides real-time monitoring capabilities for this critical asset. To meet this need, we propose a tailored solution for subsea cable health management that utilizes a hybrid approach, as illustrated in Figure 2. This solution integrates an offline multi-physics model for RUL predictions with a cable integrity evaluation model that incorporates in situ inspection data acquired from operating cables.
The main focus of this paper is to present the cable integrity evaluation model in the architecture above, which utilizes bio-sonar sensing technologies to acquire in situ cable integrity data that were previously unavailable. We employ machine learning algorithms to perform real-time assessments of cable integrity, including degradation levels. These assessments enhance maintenance planning and improve the accuracy of cable integrity forecasting, providing critical insights into subsea cable health management. The upcoming sections of our paper will provide further details about the sonar system, experiment design, data collection process, machine learning modeling, and evaluation results.
4. Subsea Cable Integrity Evaluation Using Wideband Sonar
4.1. Sonar System Specification
The system used in this study for sonar detection can be illustrated by the diagram in Figure 3. To start, a digital pulse is generated and then directed into the digital-to-analogue converter (DAC). The analogue signal is then amplified by the power amplifier (PA) before being transmitted through the medium by the transmitter (). As the pulse travels through the medium, it reflects and returns to the receiver (), where it is acquired and amplified by the pre-amplifier (Pre-A) and converted into digital format by the analogue-to-digital converter (ADC).
The sonar employed in this research is capable of transmitting pulses of varying shape and duration within the frequency range of 30 kHz to 160 kHz. It is composed of the sonar bottle, the transducers ( and ), a power supply, and a computer. The electronics are powered by two supply lines, one at 28 V which powers the A/D and D/A converters as well as the onboard computer, and the other at 24 V which powers the remaining components, both rated at 3.5 A. The user can choose the sampling frequency of the A/D and D/A converters (set to 1 MHz for this experiment), the pulse length (200 µs), and the voltage at the output of the D/A converter (3 V) and input of the A/D converter (10 V). These settings are entered into the onboard computer via an Ethernet cable connected to a personal computer.
4.2. Experiment Objects and Settings
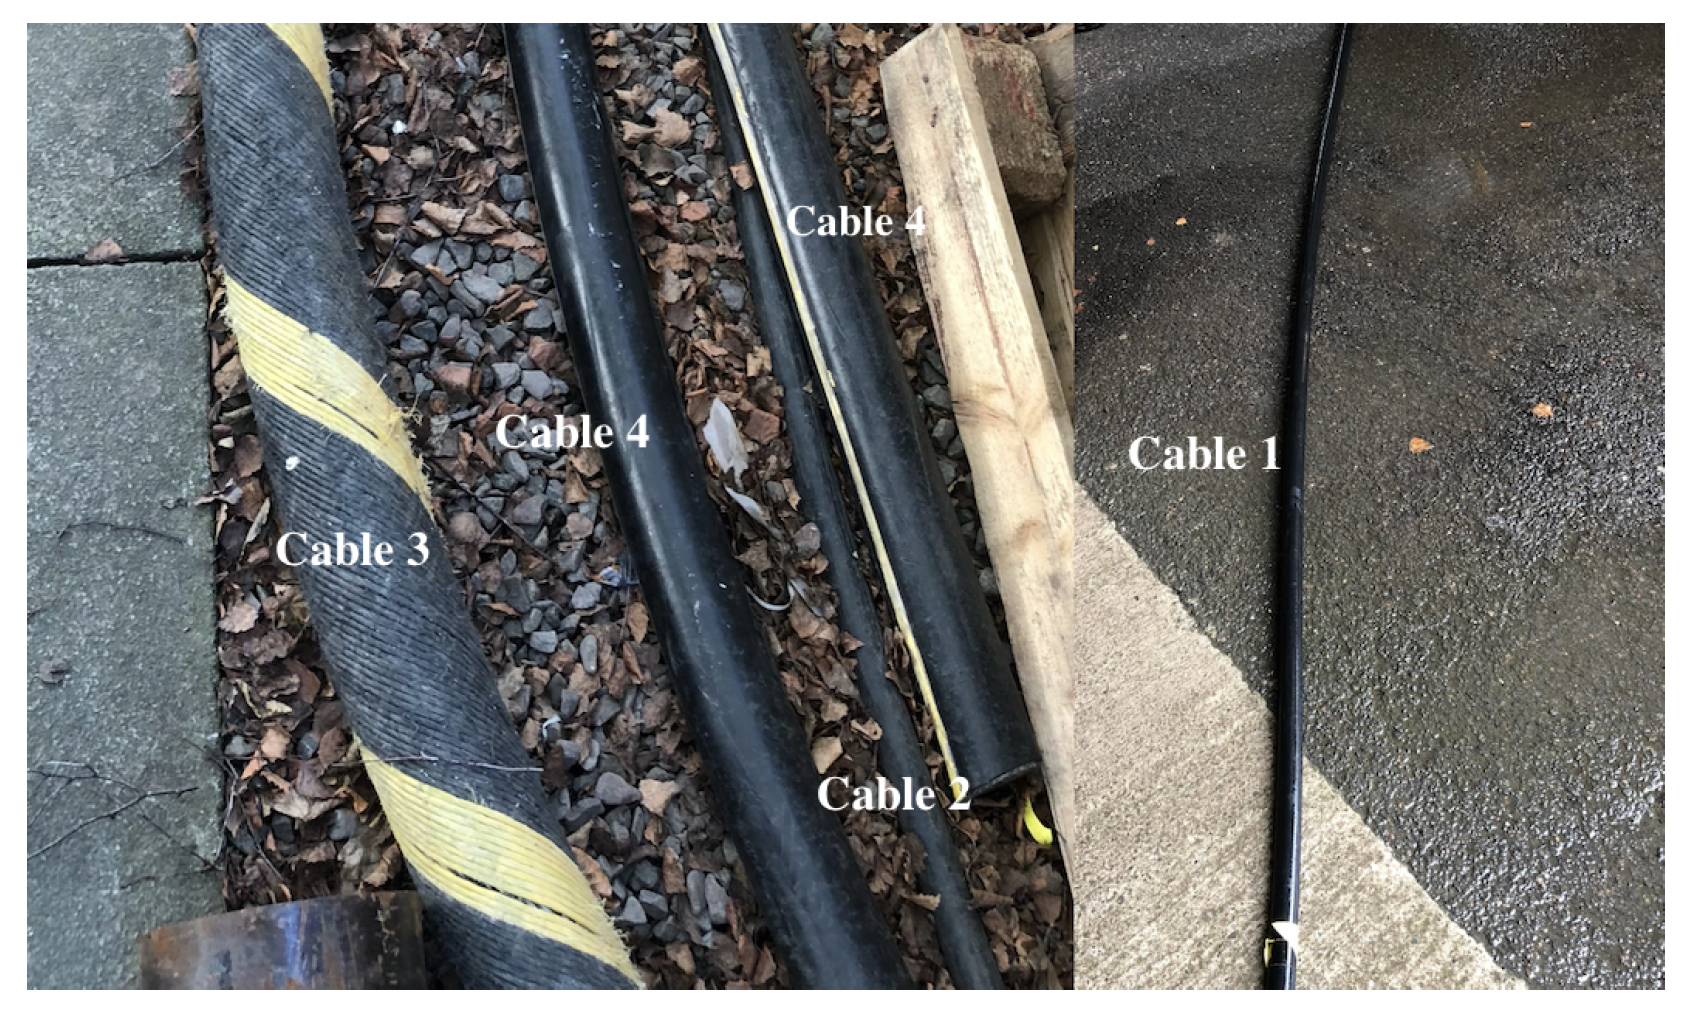
In our experiment, we obtained our cable samples from JDR Cable Systems Ltd and the European Marine Energy Centre (EMEC). Figure 4 shows the cable sample, which consists of subsections from 4 different subsea power cables, including decommissioned and healthy ones. The subsections of cables used in this experiment share similar lengths of 3 m, but varies in other physical characteristics, such as weight and diameter. In addition, the cables each have different physical properties as shown in Table 1.
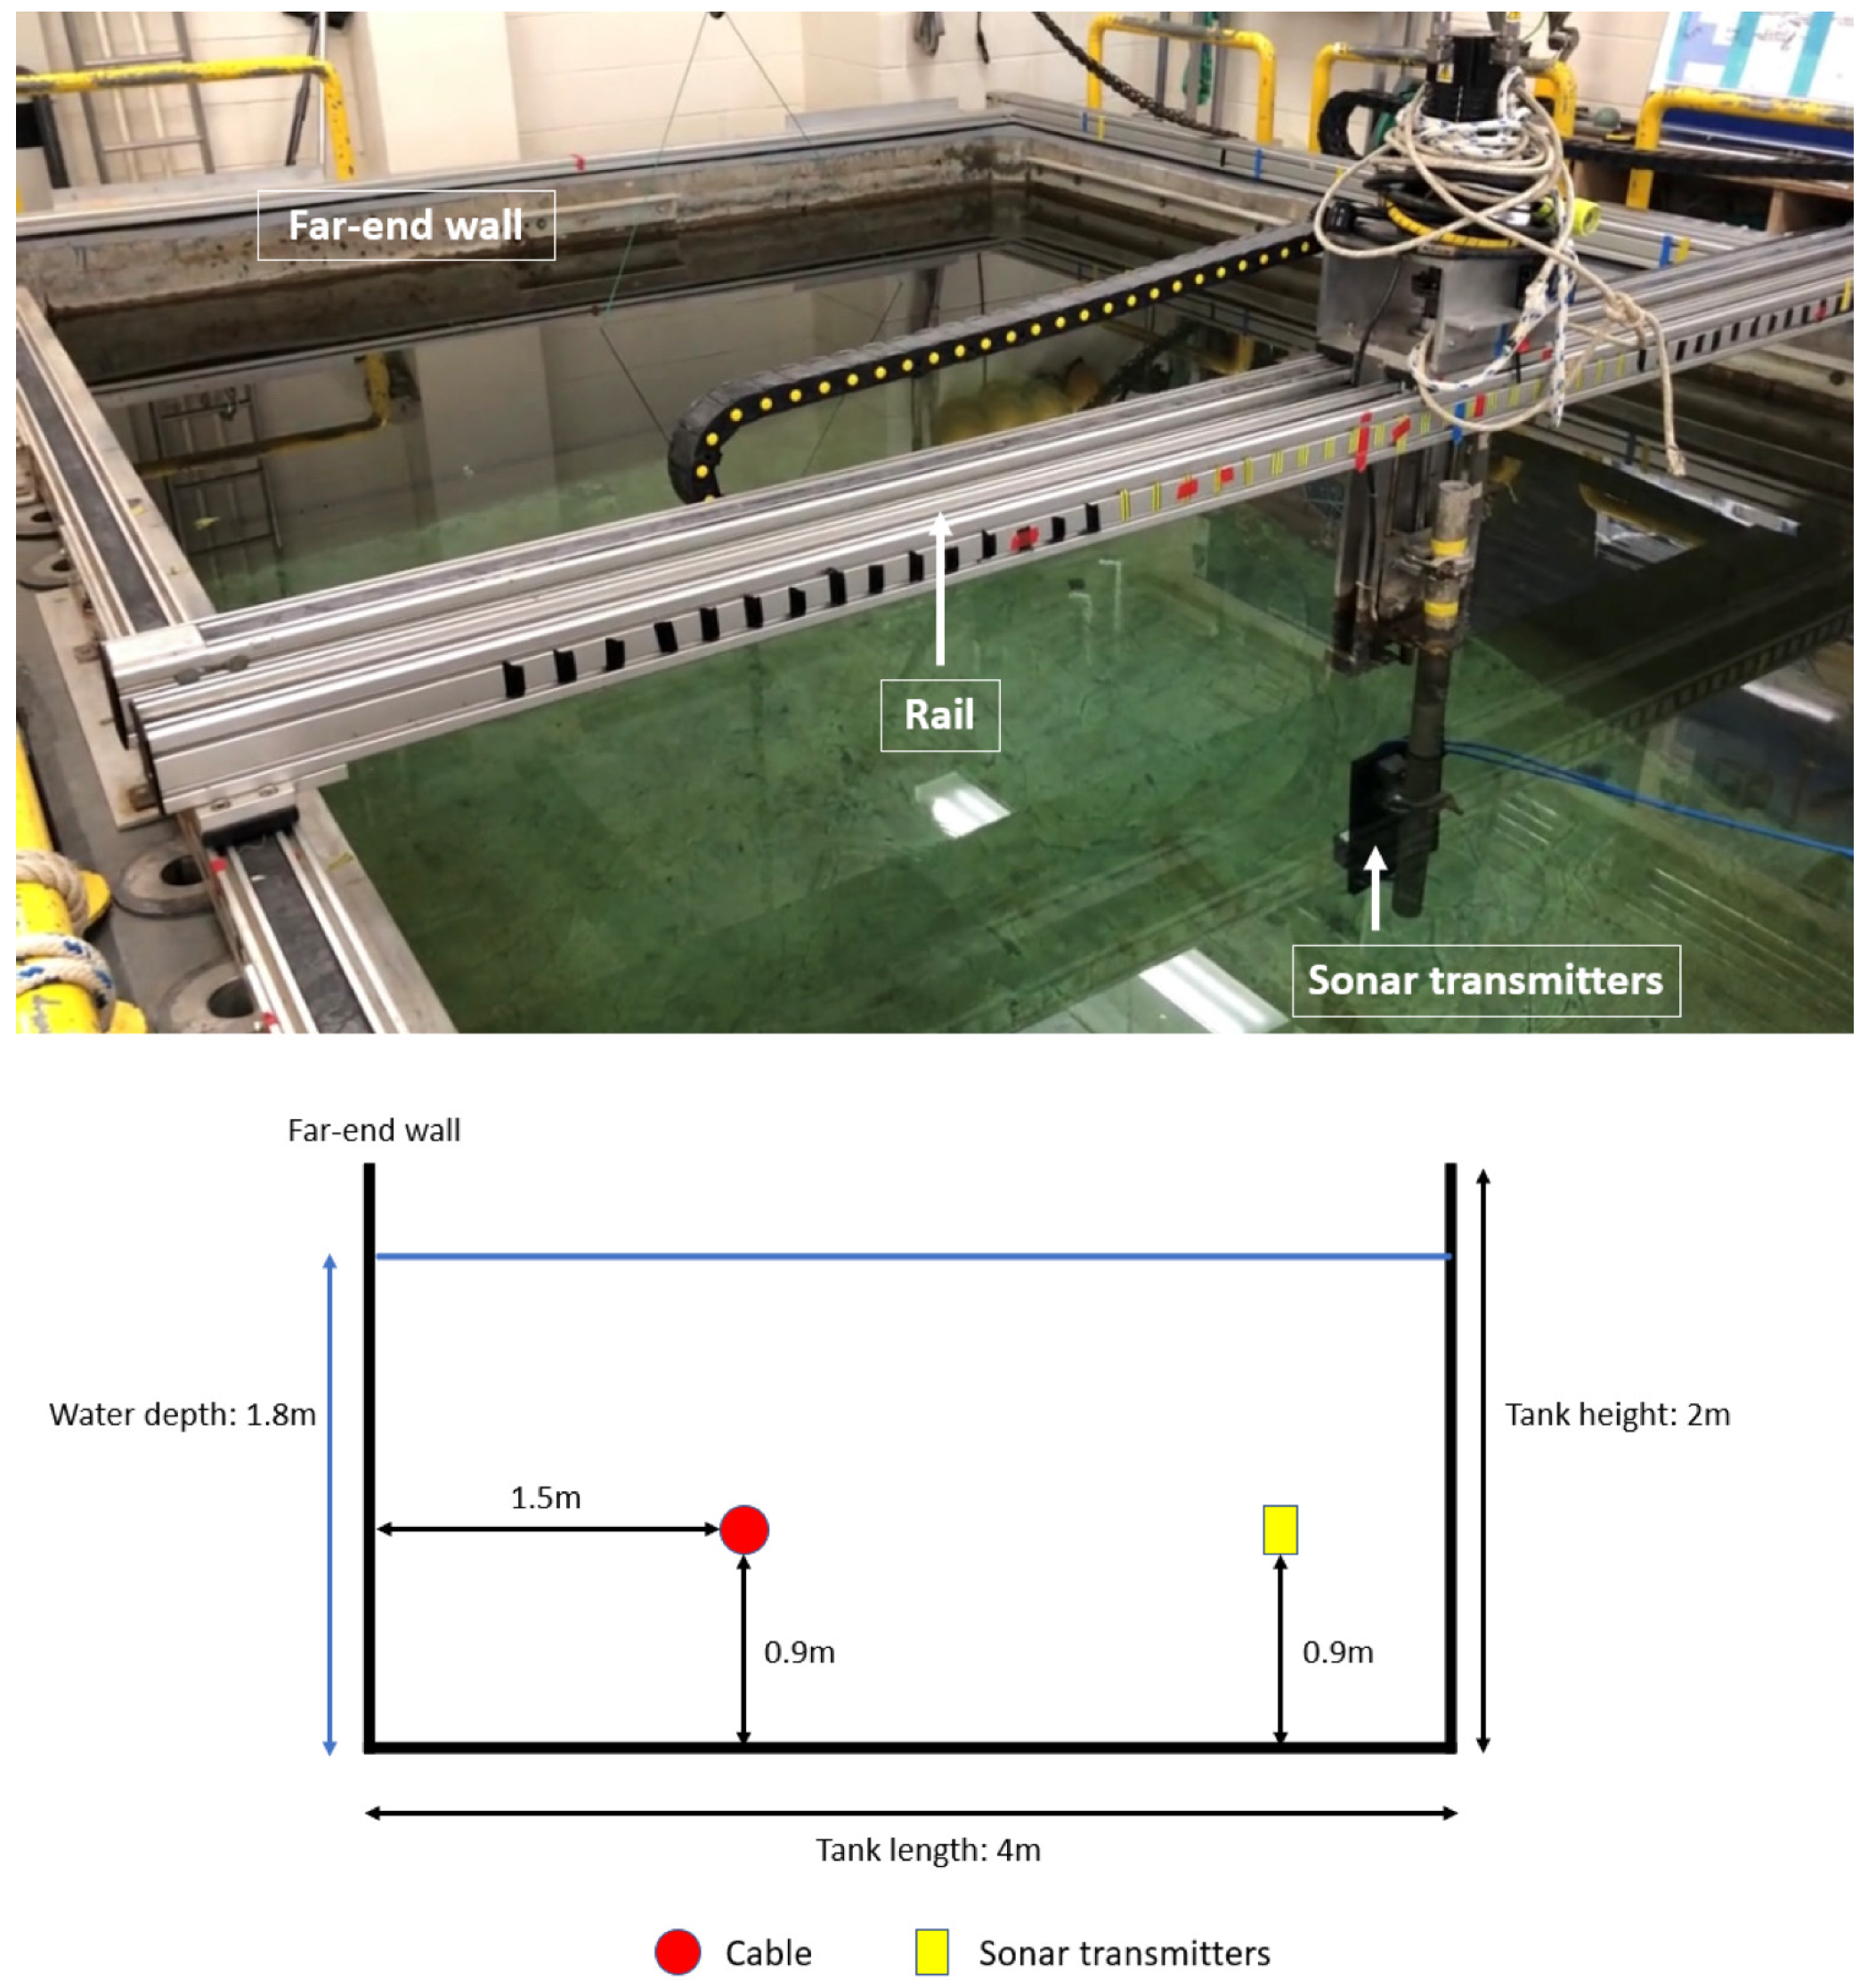
In our experiment, the cables are placed in a water tank and scanned under various experimental settings. Specifically, we employ a water tank of dimension: 3 m × 4 m × 2 m with water depth of 1.8 m. Sonar transmitters are mounted on rail with the midline of the transmitter is at approximately 0.9 m depth (Figure 5). The cables are suspended in the water using weight at 1.5 m from the far wall of the tank, and placed in front of the sonar’s transducer with cable midline at 0.9 m depth to coincide with the acoustic centres for the transducer array.
4.3. Echo Data Acquisition Process
The sonar operates through a series of steps. Initially, a digital pulse is loaded from a text file that is stored on the on-board computer. This pulse is then sent to both a digital-to-analog converter and an electronic module before being transmitted as an acoustic wave by the active element of the transmitter. The wave travels through the water tank and encounters the walls, floor, and cable within it. As the wave encounters each of these, a portion of it is reflected back to the active element of the receiver. The receiver then converts the reflected acoustic wave into individual analog electrical signals, which are subsequently transmitted through an electronic module before being converted into digital signals by an analog-to-digital converter.
During the scanning process, signals received from the bio-sonar transducer are sent to an on-board computer, from where the echo responses are sent to an on-board computer, and saved as a binary file for model training later.
4.3.1. Side Scanning Settings
In our experiment, we place our sample cables the water tank in front of the sonar transducer. As shown in Figure 5, when placed in the water tank, the cable will be naturally suspended, hence the distance between the sonar transducers and the cable is not constant. This provides a natural setting where the angle between the transducer and the cables vary along the full length of the cable. Therefore, scanning the full length cable at a fixed distance is equivalent to scanning at varying angles. Specifically, during each scan, we move the sonar transmitters slowly along the rail from the left end to the right end of the tank, and obtain echo response data on the full length of the suspended cable. In addition, with cables fixed at 1.5 m away from the far end of the tank, we move the rail mounted with sonar towards and away from the cable so that each cable is scanned at varying distances, 0.5 m, 1.5 m, and 2.5 m from the sonar transducer.
4.3.2. Accelerate Life Cycle Testing
As discussed earlier, operating subsea power cables are subject to harsh environmental conditions, such as strong tidal velocities that can cause abrasion to cables’ protective amour. Abrasion is one of the key causes of cable integrity loss. Existing inspection techniques have limited ability to detect and evaluate the severity of abrasion, while there is also no available data on subsea cables suffering from abrasion. Therefore, in this experiment, we designed experiment to collect cable echo data with armour loss due to abrasion effect, and then explore the capability of bio-sonar on integrity analysis for abraded cables.
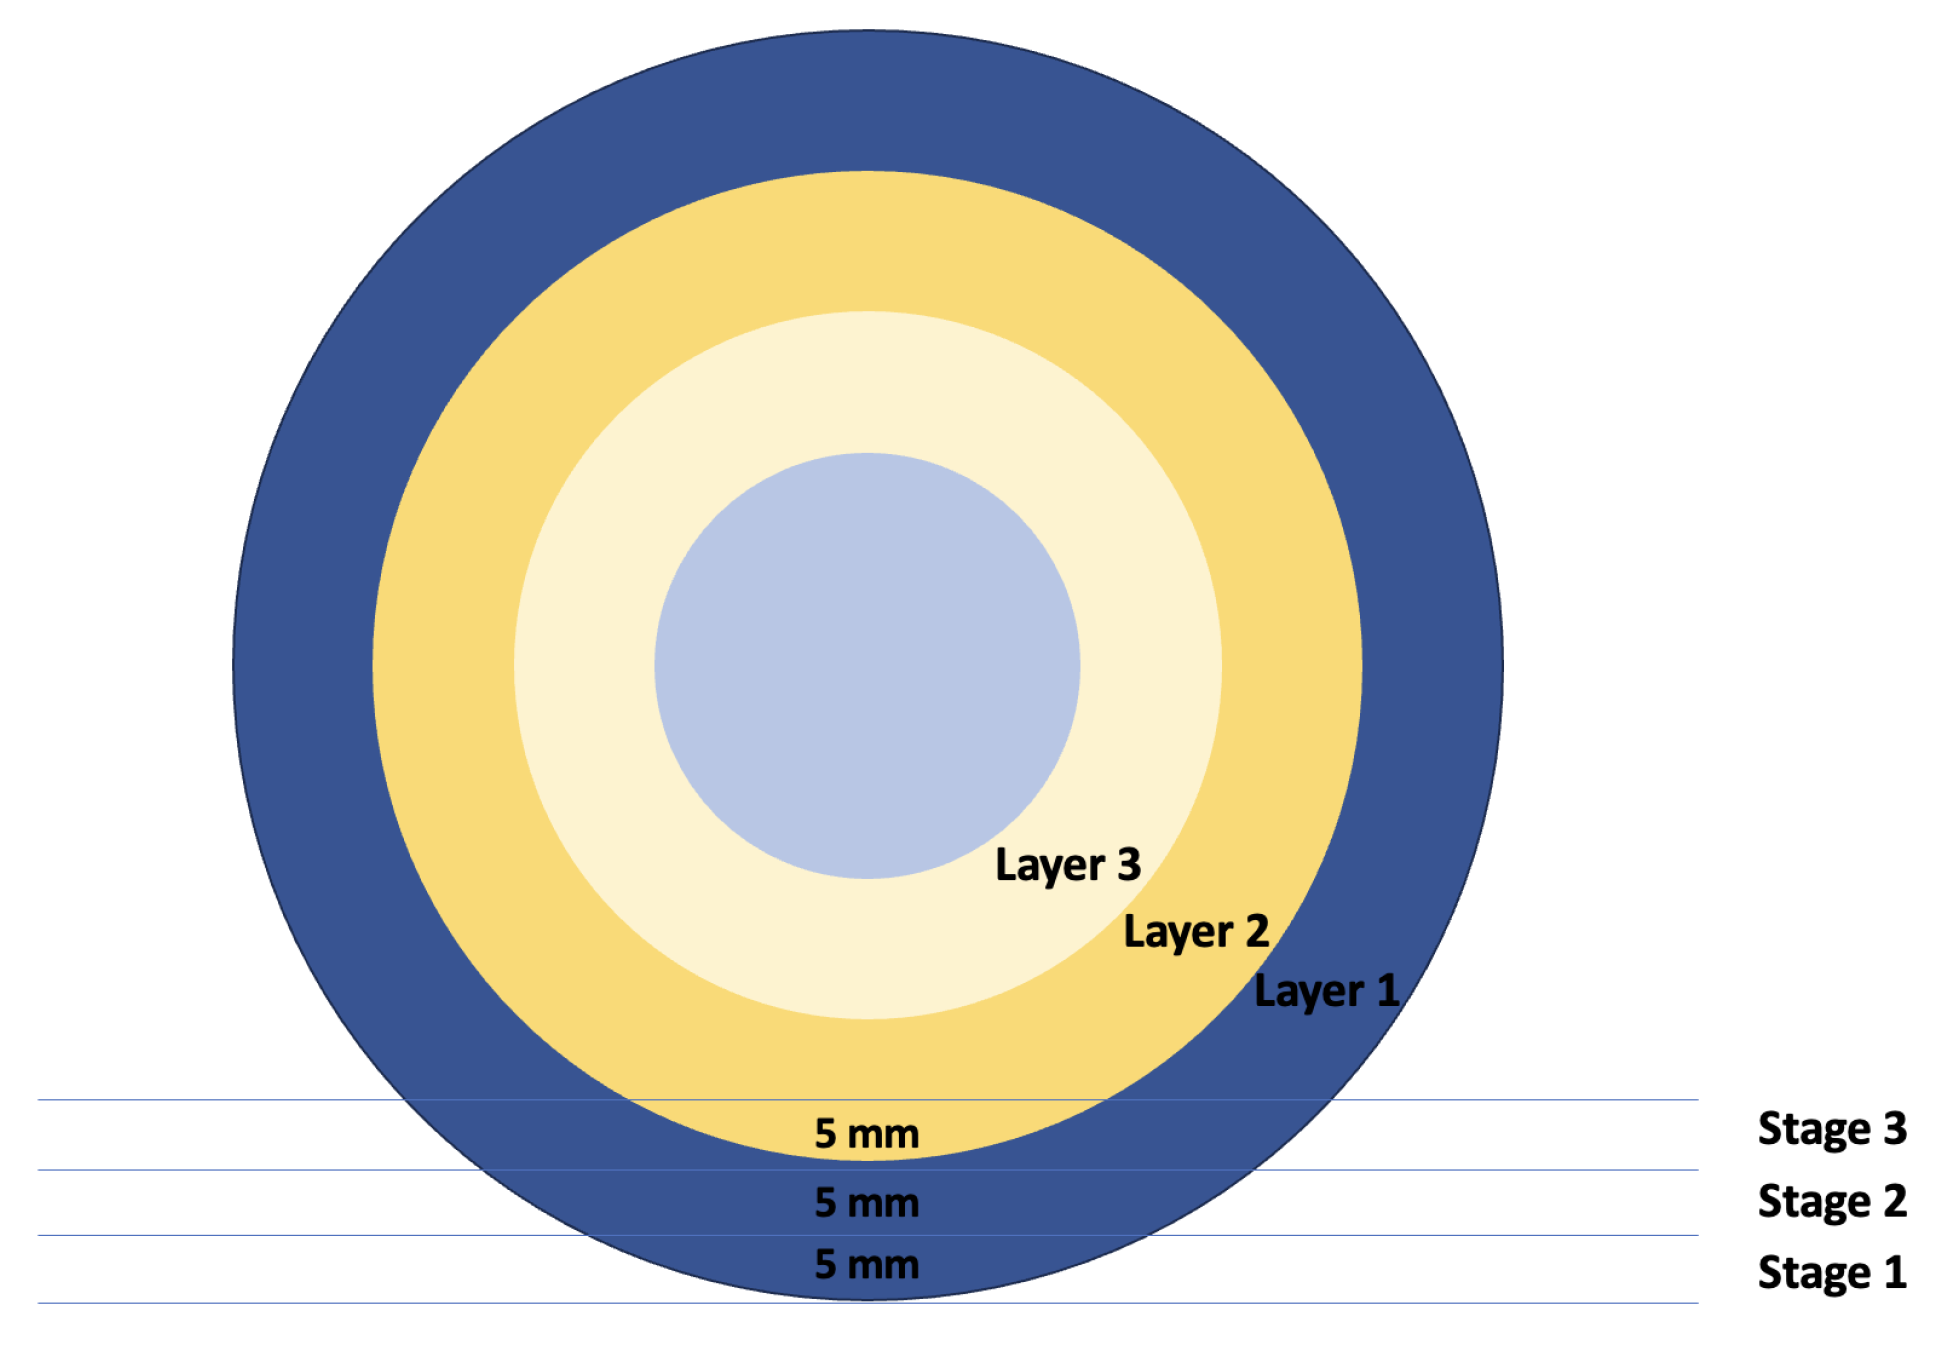
Specifically, we induce controlled abrasion using a grinder on our subsea cable samples. To obtain sufficient integrity data of different levels of degradation, we abrade the outer layers of the cable at three levels. At each level, the top part of the outer armour layer is reduced by 5 mm (as shown in Figure 6).
After each 5 mm abrasion, we place the cable in the water tank for side scanning. The side scanning follow similar procedure as described in the previous section. We first place the abraded side of the cable facing sonar transmitter and scan at varying distances (0.5 m, 1.5 m and 2.5 m). Then the cable is rotated with abraded side facing upwards (90 degrees from the sonar transmitter), and facing backwards (180 degrees from the sonar transmitter). This procedure ensures that for each level of abrasion and distance from the sonar, we obtain echo response data of the abrade cable at varying angles and distances.
5. Data Analysis Using Machine Learning
This section provides solution for subsea power cable integrity analysis using wideband bio-sonar and machine learning techniques. Our first objective is to correctly identify variations in physical properties of scanned subsea power cable samples. Section 4.2 shows the distinctions in cable length, diameter, and other physical characteristics which lead to cable samples having unique reflected echo response containing physical features which represent the targets. These variations translates into echo response data obtained from the previously outlined data collection process, and are used to train machine learning classification models. In machine learning, classification refers to the ability of a model to assign instances to their correct groups. In the context of this case study, the task is to identify different type of cable samples and validate the potential of using wideband sonar for cable integrity analysis.
The next step is to examine the usefulness of bio-sonar in detecting and evaluating varying levels of abrasion on subsea cables. As described in the previous section, we scanned manually abraded cables at varying angles and distances from the sonar transmitter to obtain enough training datasets used for machine learning analytics for degradation and integrity analysis.
5.1. Data Prepossessing
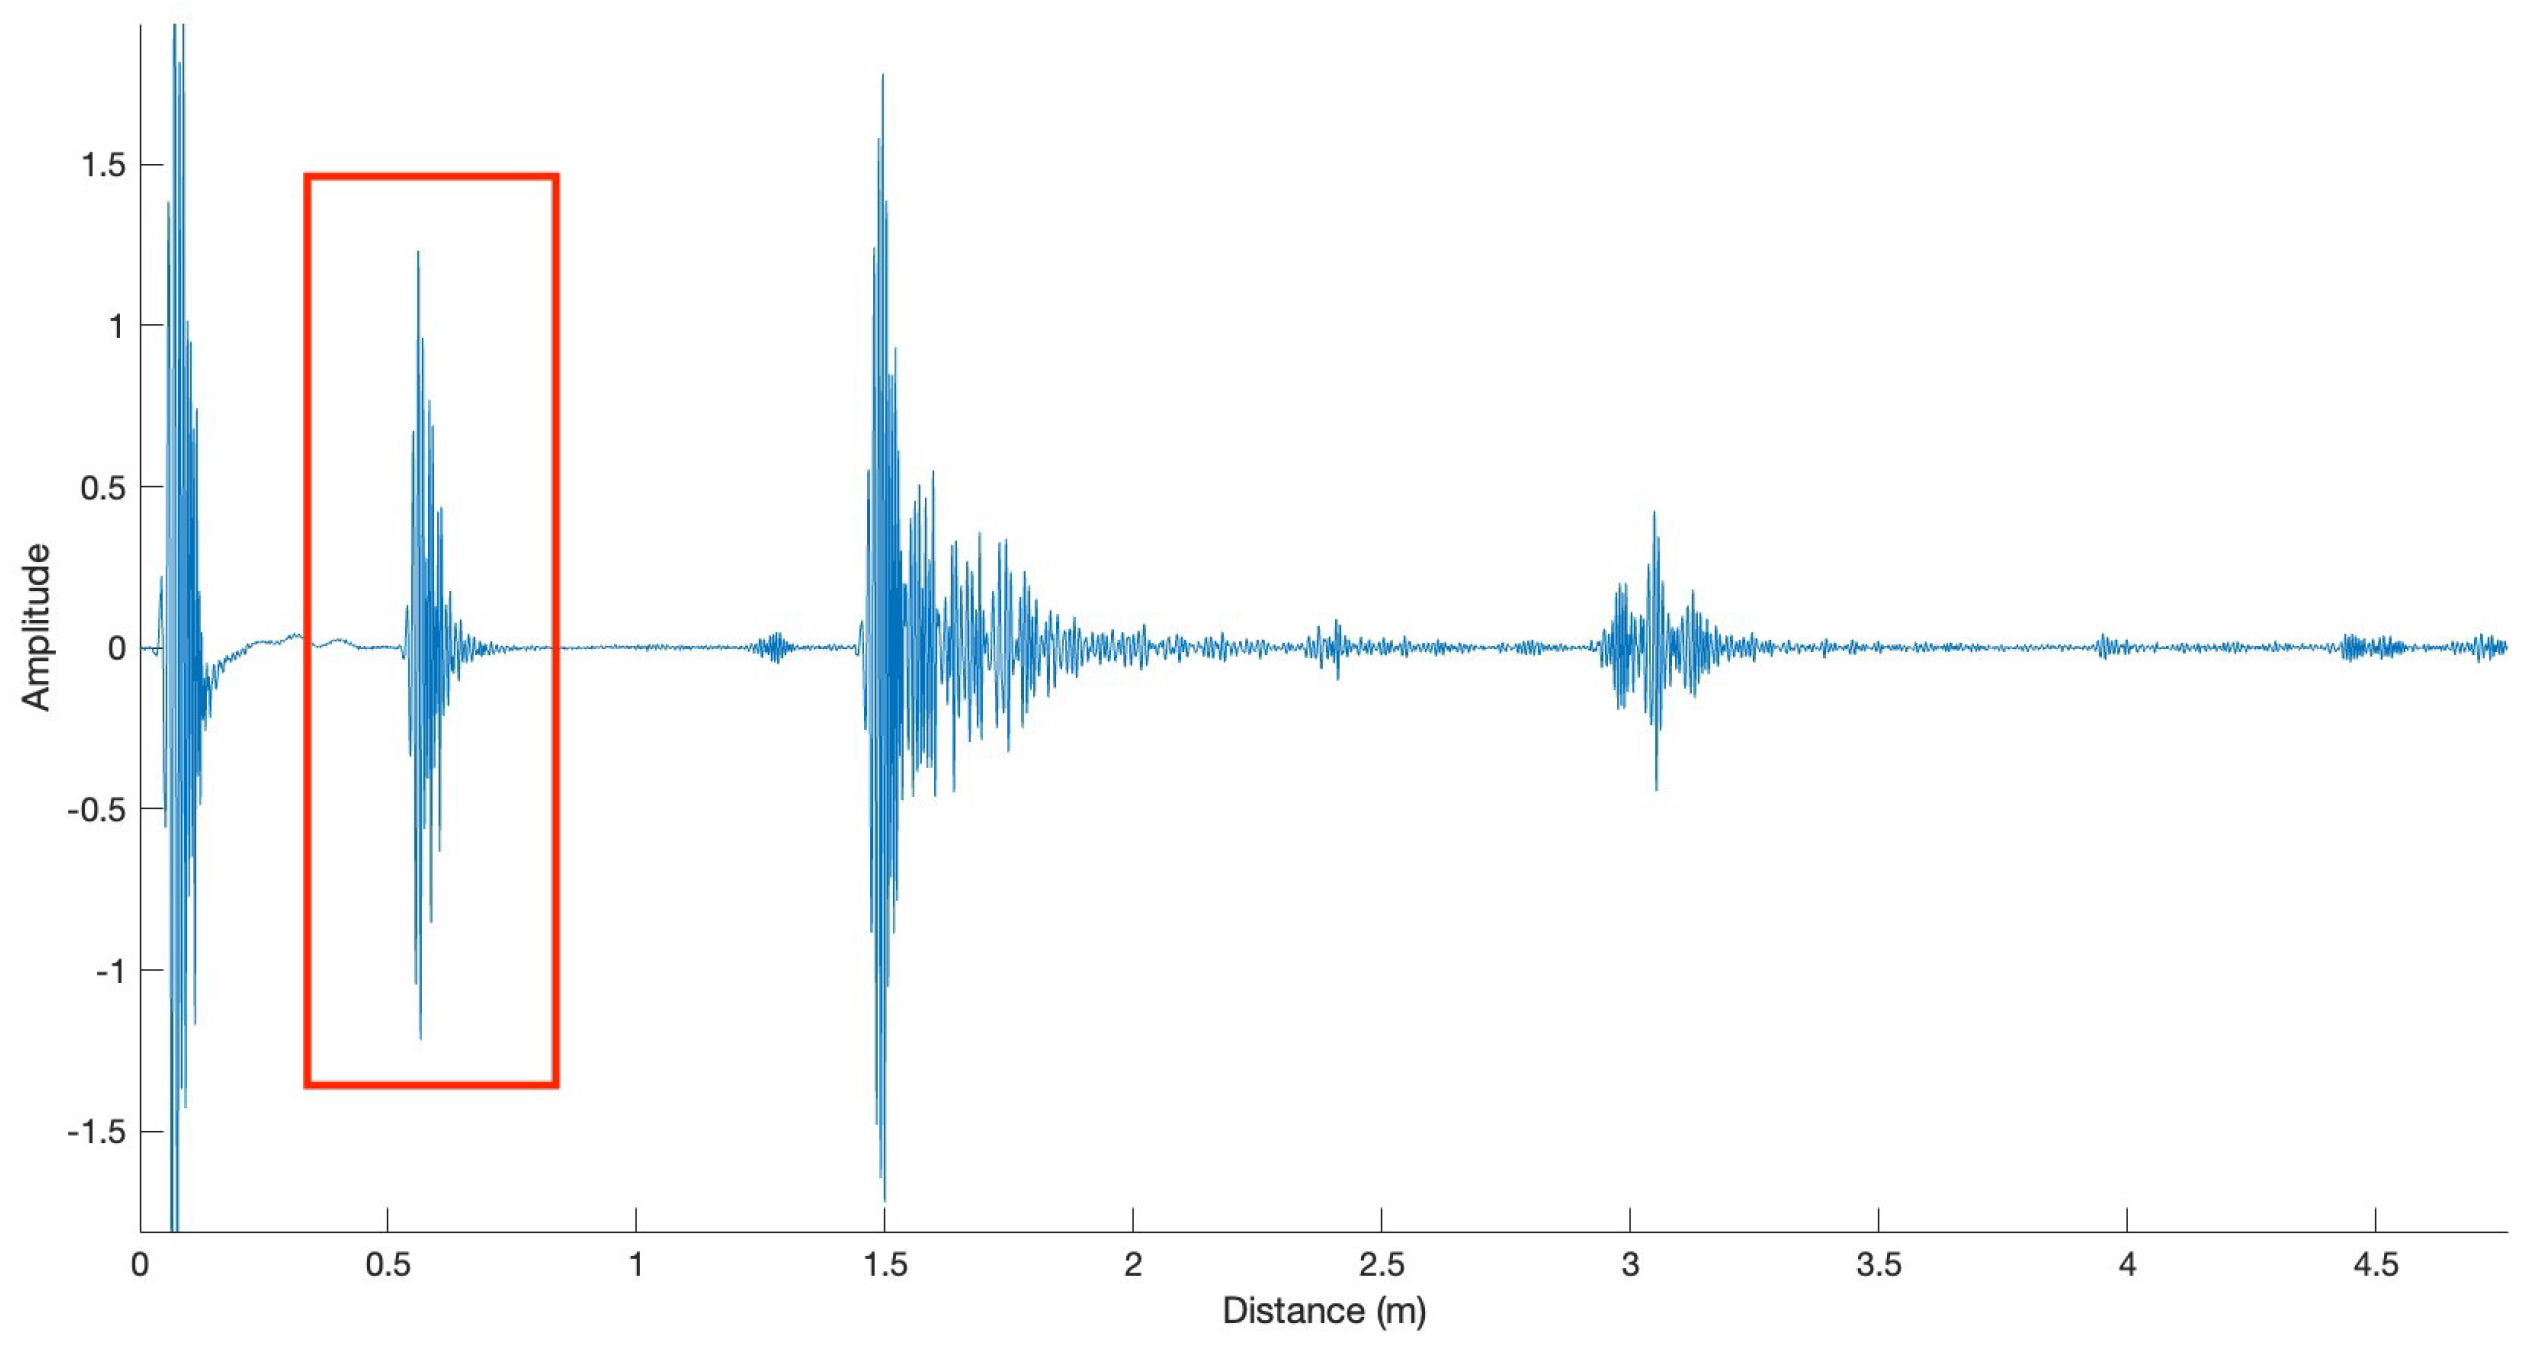
In this study, the sampling rate is 1 MHz during the echo data acquisition, which means 1,000,000 samples per second on each channel for one ping. After each ping, the sonar records 100,000 samples at MHz, so each recorded ping is 100 ms (0.1 s) long. When scanning an object in a water tank, the original recorded echo response will contain number of reflections, including reflection from the target, walls, bottom of the tank and other surfaces (Figure 7). The horizontal axis of Figure 7 is distance, measured in metres. This is computed by multiplying the speed of sonar echo response travelling underwater by the time elapsed until receiving signal. This distance maps the different distances where cables are placed in the experiment water tank.
In this scenario, there are several components involved in the data recording process. The first component captures the transmitted pulse, followed by the second component (red box in Figure 7), which records the reflection from the target. The third component corresponds to the reflection from the back wall of the test tank, and so on. Among these components, our main interest lies in the echo response from the target, as it contains crucial information about the cable and its properties. This echo response data is essential for training the model. For instance, in Figure 7, the highlighted area specifically represents the echo response data that contains valuable information about the properties of Cable No. 1.
For data pre-processing purposes, it is necessary to extract such echo response segments representing cable properties for each of our cable samples. We do so by firstly locate the peak amplitude observed at the distance where cables are placed, and then select the range of echo response data between −0.15 ms and +0.15 ms from the peak amplitude. Cable No. 1 was the thinnest from all cable samples, and its echo response segment of interest has a length of 0.3 ms, therefore we use −0.15 ms to +0.15 ms as the length for echo response segment selection. This procedure is repeated for all dataset we obtained from scanning at each cable from different distances. Then we utilized a sliding window approach to segment the echo signal into our training data pool. Sliding window refers to small, overlapping blocks of signals with a certain window length L which moves in time to be used for signal processing. Different window length of the echo data are applied to investigate the influence of the time resolution into the performance of the classifiers. In this analysis, the window length was selected in the range L∈ [0.005, 0.01, 0.015, 0.02, 0.025, and 0.03] (ms).
5.2. Machine Learning Algorithms for Classification
In our work, we applied different machine learning algorithms for the multi-objects classification task.
The Support Vector Machine (SVM) is a widely used classification model that aims to find an optimal hyperplane to separate different classes of data and maximize the margin between them using gradient descent [36]. This machine learning algorithm serves as a discriminative classifier when presented with multiple labeled classes of data. Its objective is to determine the best hyperplane that effectively separates all these classes. Once this hyperplane is established, new examples can be tested and classified based on their position relative to the hyperplane.
The K-nearest neighbors (KNN) method is a non-parametric technique used for both classification and regression tasks [37]. It falls under the category of instance-based learning, wherein the function approximation is performed locally, and all computations are deferred until the classification process. When dealing with classification and regression problems, KNN assigns more significance to nearby neighbors compared to distant ones. This means that closer neighbors have a greater influence on the final outcome or average. To achieve this, one common weighting scheme assigns a weight of , where d represents the distance to the neighbor. In the KNN approach, the neighbors are obtained from a set of objects that have known class labels for KNN classification or known property values for KNN regression. Although explicit training steps are not mandatory, the set of objects effectively serves as the training set for the KNN algorithm.
Back propagation (BP) neural network is a multi-layer feedforward network, trained with error back propagation algorithm. BP utilised mean squared error method and gradient descent to modify the connection weight of the network [38]. Specifically, the algorithm fine-tunes the weight value of a neural network based on the error rate obtained from the previous iteration. It is currently one of the most popular NN models in the field of signal image processing and classification.
Convolutional neural network (CNN) takes its name from the mathematical concept of linear operation between matrices called convolution. The basic structure of CNN includes CNN layers, input layer, convolutional layer, pooling layer, and fully-connected layers that are also known as multi-layer perceptron layers (MLP layers). Typical applications of CNN include image data, natural language processing (NLP). CNN can use either two-dimensional (2D), such as time-frequency data, or one-dimensional (1D) signals such as a raw vibration signal. Such signals may be decomposed into sub-bands in many scales for 1D CNN to learn to “extract” specific features that can be used for classification tasks, such as bearings fault detection [39], paritne-specific electrocardiogram (ECG) classification [40], and other damage detection tasks for structural health monitoring for civil, mechanical and aerospace engineering [41,42]. In 1D CNN, feature extraction and classification are fused into one process, leading to reduction in computational complexities [43]. 1D CNN also has lower hardware requirement and, hence, lower costs compared to 2D CNN, for which training normally requires special hardware setup [44]. Low computational requirements also imply suitability for real-time applications [40].
5.3. Classification of Cable Samples with Different Physical Properties and Abrasion Loss Level
The echo responses are classified into four different classes with three cables shown in Table 2 and one empty object. The empty object does not contain any cables. The cable samples used in our study (Cables 1, 2, and 4) share similar lengths but differ in diameters and materials. We conducted sonar side scanning to collect data from these cable samples. By training machine learning algorithms with the sonar echo response data, our aim is to accurately identify variations in these cables’ physical properties.
As discussed in the data acquisition process (Section 4.3), we manually introduce varying degrees of abrasion to the cable’s protective layer (Cable 2). The echo response data collected represents four cable integrity levels: healthy and abraded cables of 5 mm, 10 mm, and 15 mm abrading depths, as shown in Table 3. This step aims to correctly classify cables into their corresponding degrees of degradation and demonstrate the ability to use bio-sonar and machine learning analytics for cable degradation.
5.4. Results and Discussion
In our experiment, each full-length side scanning generates 300 full response data. For each of these 300 full response data, we obtain the echo response segment of interest (containing cable information) and create 30 sliding windows on this segment. Because side scannings are conducted at three different settings (i.e., three different cable distances to wall), the resulting number of data we have is 27,000 for each class (for the second experiment the number is 54,000 since the side scans also conducted for the back-side of the cable which is not abraded). A 5-fold cross-validation is also performed in the evaluation.
We firstly employ ML analytics on echo response data for classifying cables with different physical characteristics. As shown in Table 4, SVM, KNN, BP, and 1D-CNN classifiers performs sufficiently accurately, where the minimum mean accuracy was (78.3 ± 0.20)% for SVM and the highest level of accuracy was achieved by the 1D-CNN classifier of (98.4 ± 0.15)%. The results confirms the capability of using ML analytics and low-frequency bio-sonar echo response data for cable integrity analysis.
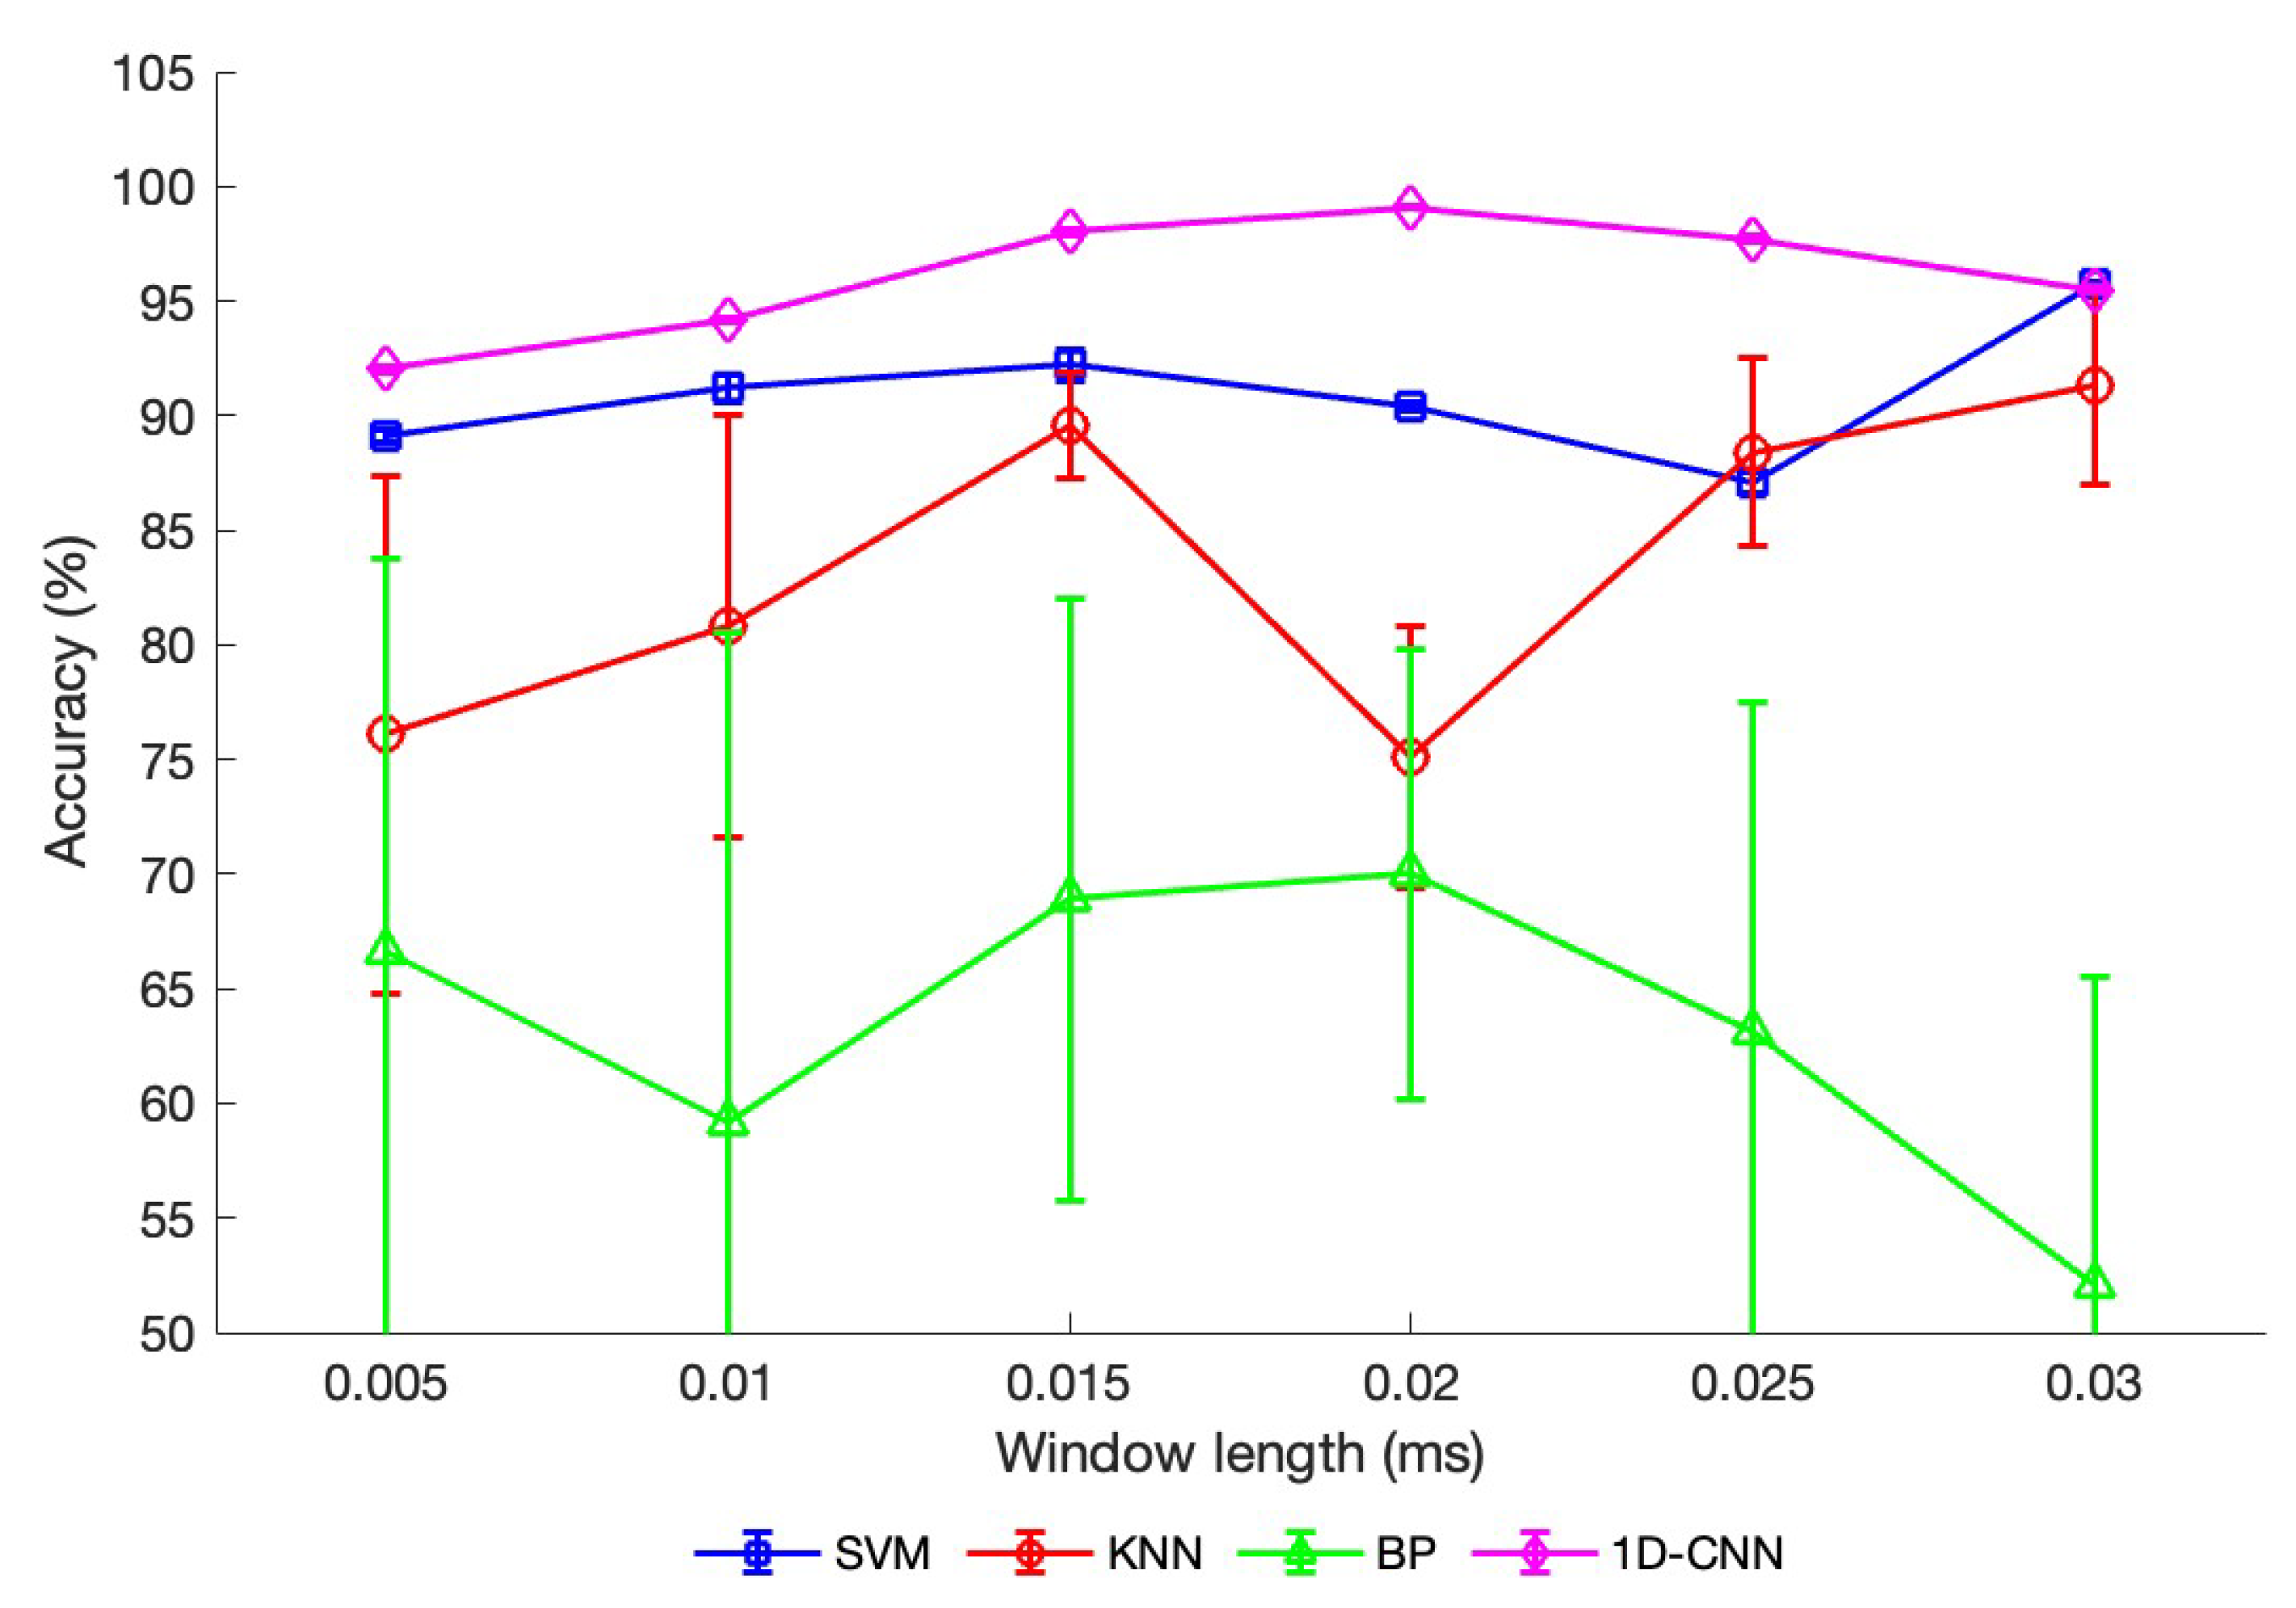
Table 5 shows the results of the four ML classifiers in determining cable degradation levels. Since the primary goal of this paper is to determine the best performing algorithm in general, we highlight the best performance achieved by each algorithm in Table 5. We also provide a visual representation of the results in Figure 8. It is evident that the 1D-CNN classifier exhibits the highest accuracy rate of (99.1 ± 0.08)% overall. The next best classifier was found in SVM at (95.7 ± 0.13)% accuracy rate. BP had poor performance with its highest accuracy rate reaching (70.1 ± 9.80)%. Furthermore, standard deviation of 1D-CNN is also the lowest (0.08)%, which can be interpreted as a stable model for classifying cable degradation.
In addition, we also aim to explore the optimal range for the size of the data segment, commonly referred to as the window length. This exploration provides valuable insights for future research, as it helps researchers make informed decisions regarding the choice of window length. In Figure 8, the horizontal axis is the window length in milliseconds and vertical axis the accuracy rate of the algorithm. We observe that the best-performing classifier 1D-CNN demonstrates superior performance within specific window lengths (specifically, from 0.015 ms to 0.025 ms) compared to other window lengths.
Results from Table 4 and Table 5 demonstrate that ML analytics can be used to analyse bio-sonar echo response data on subsea cable samples. The CNN classifier, in particular, has shown high accuracy in both classifying both the physical characteristics and the level of degradation of subsea power cables. The CNN classifier performance is also stable across different window lengths L with the highest accuracy achieved under L = 0.02 ms, but its performance slightly decreases after this point to (95.5 ± 0.14)% at L = 0.03 ms.
6. Conclusions
Subsea power cables are critical assets for ensuring reliable energy supply and are key to growth in global offshore renewable energy generation. Failure of subsea cables can incur substantial economic losses, while repairing and replacing subsea cables are time-consuming and costly to asset owners. Existing condition monitoring techniques for subsea cables centre around internal failures such as overheating, mechanical stress, etc., while integrity inspection of subsea power cables remain observational, lagged, costly and constrained by harsh underwater environments. Meanwhile, limited knowledge and data on failures induced by external and environmental conditions, including abrasion and corrosion mechanisms which accounts for around 70% cable failure modes, also prohibits development of effective cable health management.
In this paper, we proposed a tailored, fusion health management solution for predicting damage and life expectancy of subsea power cables. This solution was based on our previous work, specifically, we developed the first physics of failure model to detail cable degradation combining effects of scouring, corrosion, and abrasion. The proposed model uses historical data and computes volume loss of subsea power cables’ protective layers under environmental conditions, such as varying tidal current flow profiles, and enables failure time prediction for each protective layer on different stages of cable degradation. This fusion solution also includes a new approach for cable integrity assessment using new advanced sonar technology, to enable in situ analysis for subsea cable inspection. Our work shows the feasibility of applying low-frequency bio-sonar techniques to obtain information on cable physical characteristics, while also demonstrating the capability for ML to be used in cable integrity analysis using sonar echo response. Our bio-sonar scanning firstly allows the construction of a subsea cable physical characteristics dataset. Using this dataset, we train ML algorithms including SVM, KNN, BP, and 1D-CNN to classify different cable samples based on their unique physical properties. Among all algorithms trained, 1D-CNN showed highest accuracy rate of 98.4%, suggesting that machine learning can be used for subsea power cable integrity analysis. To mimic subsea power cables’ operating environment, we induced controlled abrasion to our cable samples. This experiment enabled the building of a data library for cables under different environmental conditions, and characterises varying stages of amour losses, which did not exist before. The results demonstrate the ability of ML and our sonar system to distinguish subsea cables by differences of 5 mm in cable degradation levels, by achieving an overall 95%+ accuracy rate from 1D CNN.
Our proposed approach is the first to predict cable RUL under varying environmental conditions based on a Physics of Failure modeling. By coupling our PoF model with machine learning algorithms trained using bio-sonar echo response data, we can capture in situ interactions between cables and the operating environment to assess cable structural integrity, including varying degrees of armor loss. This enables users to manage cables, cable materials, design routes, schedule appropriate plans for inspection tasks, and update them based on cable RUL predictions, providing valuable capabilities for subsea power cable prognostics and health management.
In terms of future work, we are planning to conduct additional sonar experiments using various tank environment settings: we will explore scenarios such as placing test cables next to hard objects in water tanks to mimic subsea cables surrounded by rocks, or laying cables at the bottom of tanks filled with sediments to simulate seabed conditions. These experiments will contribute to building a comprehensive data library for cables under different environmental conditions. Moreover, we will explore the application of digital twin technology for cable integrity visualization: we intend to leverage digital twin technology to create visual representations of cable integrity over its remaining useful life. This visualization approach will provide a valuable tool for understanding and monitoring cable health. We will explore the application of the developed prognostics solution in real-world underwater environments. We plan to examine the effectiveness of using AUVs and sonar sensing to locate partly buried subsea cables. Furthermore, we aim to validate the accuracy of our machine learning algorithms for analyzing the integrity of in-service subsea power cables. This research will provide valuable insights for asset owners regarding cable-environment interactions, cable displacement, and cable structural integrity in real-world conditions.
Author Contributions
Conceptualization, D.F. and K.B.; methodology, W.T.; software, W.T. and D.M.; validation, W.T.; formal analysis, D.F. and J.B.; investigation, D.M.; resources, K.B.; data curation, W.T.; writing—original draft preparation, W.T.; writing—review and editing, D.F. and K.B.; visualization, W.T.; supervision, D.F. and K.B.; project administration, D.F. and K.B.; funding acquisition, D.F. and K.B. All authors have read and agreed to the published version of the manuscript.
Funding
This research was funded by the EPSRC project on HOME-Offshore (grant EP/P009743/1). The experiments were supported by Hydrason Ltd. in the provision of their sensing technology and the Ocean Systems Laboratory in Heriot Watt University. The authors also want to acknowledge the support of JDR Cable Systems Ltd. and European Marine Energy Centre (EMEC) in the provision of cable samples. The APC was funded by Heriot Watt University.
Data Availability Statement
Not applicable.
Conflicts of Interest
The authors declare no conflict of interest.
References
- European Subsea Cable Association. Submarine Power Cables, Ensuring the Lights Stay On! 2017. Available online: http://www.escaeu.org/articles/submarine-power-cables/ (accessed on 1 January 2017).
- The Crown Estate. Transmission Infrastructure Associated with Connecting Offshore Generation. 2013. Available online: https://knowledge.energyinst.org/search/record?id=87359 (accessed on 4 January 2013).
- Douglas-Westwood. Offshore Wind Driving 2017–2021 Subsea Cable Market Growth. 2013. Available online: http://www.offshorewind.biz/2017/02/24/offshore-wind-driving-2017-2021-subsea-cable-demand/ (accessed on 24 February 2017).
- The Crown Estate. Offshore Wind Operational Report. 2017. Available online: https://www.thecrownestate.co.uk/media/2082/offshore-wind-operational-report-2017.pdf/ (accessed on 1 April 2018).
- Warnock, J.; McMillan, D.; Pilgrim, J.A.; Shenton, S. Review of offshore cable reliability metrics. In Proceedings of the 13th IET International Conference on AC and DC Power Transmission (ACDC 2017), Manchester, UK, 14–16 February 2017; pp. 1–6. [Google Scholar] [CrossRef]
- Clark, D. Down to the Wire: An Insurance Buyer’s Guide to Subsea Cabling Incidents; Technical Report; GCube Renewable Energy Insurance: Newport Beach, CA, USA, 2016. [Google Scholar]
- Beale, J. Transmission cable protection and stabilisation for the wave and tidal energy industries. In Proceedings of the 9th European Wave and Tidal Energy Conference (EWTEC), University of Southampton, Southampton, UK, 5–9 September 2011. [Google Scholar]
- Electrical Review. Reliable Offshore Power Connection. 2015. Available online: https://uk.megger.com/electrical-tester/march-2015/reliable-offshore-power-connections (accessed on 1 March 2015).
- PFOW Enabling Actions Project: Sub-Sea Cable Lifecycle Study; Technical Report; European Marine Energy Centre Ltd. (EMEC): Stromness, UK; The Crown Estate and UK Government: London, UK, 2015.
- Tang, W.; Flynn, D.; Robu, V. Sensing Technologies and Artificial Intelligence for Subsea Power Cable Asset Management. In Proceedings of the 2021 IEEE International Conference on Prognostics and Health Management (ICPHM), Detroit, MI, USA, 7–9 June 2021; pp. 1–6. [Google Scholar] [CrossRef]
- Au, W. The Sonar of Dolphins; Springer: New York, NY, USA, 2004. [Google Scholar] [CrossRef]
- Booth, K.G. Abrasion Resistance Evaluation Method for High-Density Polyethylene Jackets Used on Small Diameter Submarine Cables; Technical Report; Washington University Seattle Applied Physics Laboratory: Seattle, WA, USA, 1993. [Google Scholar]
- Dinmohammadi, F.; Flynn, D.; Bailey, C.; Pecht, M.; Yin, C.; Rajaguru, P.; Robu, V. Predicting Damage and Life Expectancy of Subsea Power Cables in Offshore Renewable Energy Applications. IEEE Access 2019, 7, 54658–54669. [Google Scholar] [CrossRef]
- Flynn, D.; Bailey, C.; Rajaguru, P.; Tang, W.; Yin, C. PHM of Subsea Cables. In Prognostics and Health Management of Electronics, 1st ed.; Pecht, M., Kang, M., Eds.; Wiley: Hoboken, NJ, USA, 2018; pp. 451–478. [Google Scholar] [CrossRef]
- Department for Business Enterprise & Regulatory Reform. Review of Cabling Techniques and Environmental Effects Applicable to the Offshore Wind Farm Industry, Technical Report. 2008. Available online: http://webarchive.nationalarchives.gov.uk/+/http:/www.berr.gov.uk/files/file43527.pdf/ (accessed on 10 January 2008).
- Worzyk, T. Submarine Power Cables: Design, Installation, Repair, Environmental Aspects; Springer: Berlin/Heidelberg, Germany, 2009. [Google Scholar]
- Ardelean, M.; Minnebo, P. HVDC Submarine Power Cables in the World, Joint Research Centre Technical Reports, European Union. 2015. Available online: http://publications.jrc.ec.europa.eu/repository/bitstream/JRC97720/ld-na-27527-en-n.pdf (accessed on 1 January 2016).
- Tang, W.; Flynn, D.; Brown, K.; Valentin, R.; Zhao, X. The Application of Machine Learning and Low Frequency Sonar for Subsea Power Cable Integrity Evaluation. In Proceedings of the OCEANS 2019 MTS/IEEE SEATTLE, Seattle, WA, USA, 27–31 October 2019; pp. 1–6. [Google Scholar] [CrossRef]
- Tang, W.; Flynn, D.; Brown, K.; Valentin, R.; Zhao, X. The Design of a Fusion Prognostic Model and Health Management System for Subsea Power Cables. In Proceedings of the OCEANS 2019 MTS/IEEE SEATTLE, Seattle, WA, USA, 27–31 October 2019; pp. 1–6. [Google Scholar] [CrossRef]
- Tests on Cable Oversheaths Which Have a Special Protective Function and Are Applied by Extrusion; International Electrotechnical Commission: Geneva, Switzerland, 1982.
- Zaeni, A.; Khayam, U.; Viviantoro, D. Methods for Remaining Life Prediction of Power Cable based on Partial Discharge and Cable Failure History Data. In Proceedings of the 2019 International Conference on Electrical Engineering and Informatics (ICEEI), Bandung, Indonesia, 9–10 July 2019; pp. 662–665. [Google Scholar] [CrossRef]
- Bao, X.; Dhliwayo, J.; Heron, N.; Webb, D.J.; Jackson, D.A. Experimental and theoretical studies on a distributed temperature sensor based on Brillouin scattering. J. Lightwave Technol. 1995, 13, 1340–1348. [Google Scholar] [CrossRef]
- Masoudi, A.; Pilgrim, J.A.; Newson, T.P.; Brambilla, G. Subsea Cable Condition Monitoring With Distributed Optical Fiber Vibration Sensor. J. Lightwave Technol. 2019, 37, 1352–1358. [Google Scholar] [CrossRef]
- Srikanth, N.; Rao, S.S. Subsea Cable Health Monitoring System. In Proceedings of the 2017 Asian Conference on Energy, Power and Transportation Electrification (ACEPT), Singapore, 24–26 October 2017; pp. 1–9. [Google Scholar] [CrossRef]
- Wu, P. Undersea lightguide cable reliability analyses. In Proceedings of the Annual Proceedings on Reliability and Maintainability Symposium, Los Angeles, CA, USA, 23–25 January 1990; pp. 157–159. [Google Scholar] [CrossRef]
- Leighton, T.; White, P. Dolphin-inspired target detection for sonar and radar. Arch. Acoust. 2014, 39, 319–332. [Google Scholar] [CrossRef]
- Avital, E.; Bholah, N.D.; Giovanelli, G.; Miloh, T. Sound Scattering by an Elastic Spherical Shell and its Cancellation using a Multi-pole Approach. Arch. Acoust. 2017, 42, 697–705. [Google Scholar] [CrossRef]
- Pailhas, Y.; Capus, C.; Brown, K.; Petillot, Y. Chapter 22—BioSonar: A Bio-Mimetic Approach to Sonar Systems Concepts and Applications. In On Biomimetics; Pramatarova, A.L.D., Ed.; IntechOpen: Rijeka, Croatia, 2011. [Google Scholar] [CrossRef]
- Au, W.W.; Simmons, J.A. Echolocation in dolphins and bats. Phys. Today 2007, 60, 40. [Google Scholar] [CrossRef]
- Kaduchak, G.; Marston, P.L. Backscattering of chirped bursts by a thin spherical shell near the coincidence frequency. J. Acoust. Soc. Am. 1993, 93, 2700–2706. [Google Scholar] [CrossRef]
- Gaunaurd, G.C.; Brill, D.; Huang, H.; Moore, P.W.B.; Strifors, H.C. Signal processing of the echo signatures returned by submerged shells insonified by dolphin “clicks”: Active classification. J. Acoust. Soc. Am. 1998, 103, 1547–1557. [Google Scholar] [CrossRef] [PubMed]
- Houser, D.; Martin, S.; Phillips, M.; Bauer, E.; Herrin, T.; Moore, P. Signal processing applied to the dolphin-based sonar system. In Proceedings of the Oceans 2003. Celebrating the Past… Teaming Toward the Future (IEEE Cat. No.03CH37492), San Diego, CA, USA, 22–26 September 2003; Volume 1, pp. 297–303. [Google Scholar] [CrossRef]
- Capus, C.; Pailhas, Y.; Brown, K.; Lane, D. Detection of buried and partially buried objects using a bio-inspired wideband sonar. In Proceedings of the IEEE Oceans, Sydney, Australia, 24–27 May 2010; pp. 1–6. [Google Scholar] [CrossRef]
- Dmitrieva, M.; Valdenegro-Toro, M.; Brown, K.; Heald, G.; Lane, D. Object classification with convolution neural network based on the time-frequency representation of their echo. In Proceedings of the 2017 IEEE 27th International Workshop on Machine Learning for Signal Processing (MLSP), Tokyo, Japan, 25–28 September 2017; pp. 1–6. [Google Scholar] [CrossRef]
- Tang, W.; Brown, K.; Flynn, D.; Pellae, H. Integrity Analysis Inspection and Lifecycle Prediction of Subsea Power Cables. In Proceedings of the 2018 Prognostics and System Health Management Conference (PHM-Chongqing), Chongqing, China, 26–28 October 2018; pp. 105–114. [Google Scholar] [CrossRef]
- Kecman, V. Support Vector Machines—An Introduction. In Support Vector Machines: Theory and Applications; Wang, L., Ed.; Springer: Berlin/Heidelberg, Germany, 2005; pp. 1–47. [Google Scholar] [CrossRef]
- Duda, R.O.; Hart, P.E.; Stork, D.G. Pattern Classification, 2nd ed.; Wiley-Interscience: Hoboken, NJ, USA, 2000. [Google Scholar]
- Buscema, M. Back propagation neural networks. Subst. Use Misuse 1998, 33, 233–270. [Google Scholar] [CrossRef] [PubMed]
- Eren, L.; Ince, T.; Kiranyaz, S. A Generic Intelligent Bearing Fault Diagnosis System Using Compact Adaptive 1D CNN Classifier. J. Signal Process. Syst. 2019, 91, 179–189. [Google Scholar] [CrossRef]
- Kiranyaz, S.; Ince, T.; Gabbouj, M. Real-Time Patient-Specific ECG Classification by 1-D Convolutional Neural Networks. IEEE Trans. Biomed. Eng. 2016, 63, 664–675. [Google Scholar] [CrossRef]
- Abdeljaber, O.; Avci, O.; Kiranyaz, S.; Gabbouj, M.; Inman, D.J. Real-time vibration-based structural damage detection using one-dimensional convolutional neural networks. J. Sound Vib. 2017, 388, 154–170. [Google Scholar] [CrossRef]
- Abdeljaber, O.; Avci, O.; Kiranyaz, M.S.; Boashash, B.; Sodano, H.; Inman, D.J. 1-D CNNs for structural damage detection: Verification on a structural health monitoring benchmark data. Neurocomputing 2018, 275, 1308–1317. [Google Scholar] [CrossRef]
- Abdeljaber, O.; Sassi, S.; Avci, O.; Kiranyaz, S.; Ibrahim, A.A.; Gabbouj, M. Fault Detection and Severity Identification of Ball Bearings by Online Condition Monitoring. IEEE Trans. Ind. Electron. 2019, 66, 8136–8147. [Google Scholar] [CrossRef]
- Kiranyaz, S.; Avci, O.; Abdeljaber, O.; Ince, T.; Gabbouj, M.; Inman, D.J. 1D convolutional neural networks and applications: A survey. Mech. Syst. Signal Process. 2021, 151, 107398. [Google Scholar] [CrossRef]
Figure 1.
Subsea cable faults over a 15-year period (up to 2006) [13].
Figure 1.
Subsea cable faults over a 15-year period (up to 2006) [13].

Figure 2.
Design methodology for subsea power cable fusion Prognostics and Health Management (PHM) solutions.
Figure 2.
Design methodology for subsea power cable fusion Prognostics and Health Management (PHM) solutions.

Figure 3.
Scheme of the sonar system.

Figure 4.
Subsea power cable samples.

Figure 5.
Cable in the watertank for sidescanning.

Figure 6.
Schematic view of armour loss due to abrasion effect in three stages.

Figure 7.
Recording of a full response of Cable 1 at 0.5 m scanning distance.

Figure 8.
Performance of the classifiers for a range of window lengths L.


Table 1.
Cable samples specification.
| Sample ID | Description | Diameter (mm) | Length (mm) |
|---|---|---|---|
| 1 | 11 kV polymeric insulated power cable | 35 | 2990 |
| 2 | 50 kV polymeric insulated submarine cable | 60 | 2950 |
| 3 | 400 kV wet-aged power cable | 150 | 3030 |
| 4 | 250 kV fully armoured trefoil power cable | 138 | 2990 |
Table 2.
Description of objects in Test 1.
| Object | Diameter (mm) | Length (mm) | |
|---|---|---|---|
| 1 | Cable 1 | 35 | 2990 |
| 2 | Cable 2 | 60 | 2950 |
| 3 | Cable 4 | 138 | 2990 |
| 4 | no objects | - | - |
Table 3.
Description of objects in Test 2.
| Object | Volume Loss | |
|---|---|---|
| 1 | Cable 2 | 5 mm |
| 2 | Cable 2 | 10 mm |
| 3 | Cable 2 | 15 mm |
| 4 | no objects | - |
Table 4.
Performance of the classifiers on different samples.
| Algorithm | Mean Accuracy ± Standard Deviation, % |
|---|---|
| SVM | 78.3 ± 0.20 |
| KNN | 94.6 ± 3.15 |
| BP | 82.1 ± 5.60 |
| 1D-CNN | 98.4 ± 0.15 |
Table 5.
Performance of the classifiers for a range of window lengths L.
| Window Length (ms) | 0.005 | 0.01 | 0.015 | 0.02 | 0.025 | 0.03 |
|---|---|---|---|---|---|---|
| SVM | 89.1 ± 0.30 | 91.2 ± 0.6 | 92.2 ± 0.70 | 90.4 ± 0.15 | 87.1 ± 0.47 | 95.7 ± 0.13 |
| KNN | 76.1 ± 11.32 | 80.8 ± 9.20 | 89.6 ± 2.33 | 75.1 ± 5.70 | 88.4 ± 4.10 | 91.3 ± 4.35 |
| BP | 66.6 ± 17.20 | 59.2 ± 21.30 | 68.9 ± 13.10 | 70.1 ± 9.80 | 63.1 ± 14.40 | 52.1 ± 13.40 |
| 1D-CNN | 92.0 ± 0.14 | 94.2 ± 0.09 | 98.0 ± 0.11 | 99.1 ± 0.08 | 97.7 ± 0.12 | 95.6 ± 0.14 |
Disclaimer/Publisher’s Note: The statements, opinions and data contained in all publications are solely those of the individual author(s) and contributor(s) and not of MDPI and/or the editor(s). MDPI and/or the editor(s) disclaim responsibility for any injury to people or property resulting from any ideas, methods, instructions or products referred to in the content. |
© 2023 by the authors. Licensee MDPI, Basel, Switzerland. This article is an open access article distributed under the terms and conditions of the Creative Commons Attribution (CC BY) license (https://creativecommons.org/licenses/by/4.0/).
Share and Cite
MDPI and ACS Style
Tang, W.; Brown, K.; Mitchell, D.; Blanche, J.; Flynn, D. Subsea Power Cable Health Management Using Machine Learning Analysis of Low-Frequency Wide-Band Sonar Data. Energies 2023, 16, 6172. https://doi.org/10.3390/en16176172
AMA Style
Tang W, Brown K, Mitchell D, Blanche J, Flynn D. Subsea Power Cable Health Management Using Machine Learning Analysis of Low-Frequency Wide-Band Sonar Data. Energies. 2023; 16(17):6172. https://doi.org/10.3390/en16176172
Chicago/Turabian StyleTang, Wenshuo, Keith Brown, Daniel Mitchell, Jamie Blanche, and David Flynn. 2023. "Subsea Power Cable Health Management Using Machine Learning Analysis of Low-Frequency Wide-Band Sonar Data" Energies 16, no. 17: 6172. https://doi.org/10.3390/en16176172
Note that from the first issue of 2016, this journal uses article numbers instead of page numbers. See further details here.