
Integrating Knowledge Acquisition, Visualization, and Dissemination in Energy System Models: BENOPTex Study
by
 , , and
Danial Esmaeili Aliabadi
1,* ,
,
David Manske
1,
Lena Seeger
1,
Reinhold Lehneis
1 and
and
Daniela Thrän
1,2,* 1
Helmholtz Centre for Environmental Research—UFZ, Permoserstraße 15, 04318 Leipzig, Germany
2
Deutsches Biomasseforschungszentrum gGmbH–DBFZ, Department of Bioenergy Systems, 04347 Leipzig, Germany
*
Authors to whom correspondence should be addressed.
Energies 2023, 16(13), 5113; https://doi.org/10.3390/en16135113
Submission received: 17 May 2023
/
Revised: 22 June 2023
/
Accepted: 30 June 2023
/
Published: 2 July 2023
(This article belongs to the Special Issue Modeling Electricity Markets and Energy Systems: Challenges and Opportunities Ahead)
Abstract
:While storytelling and visualization have always been recognized as invaluable techniques for imparting knowledge across generations, their importance has become even more evident in the present information age as the abundance of complex data grows exponentially. These techniques can simplify convoluted concepts and communicate them in a way to be intelligible for diverse audiences, bringing together heterogeneous stakeholders and fostering collaboration. In the field of energy and climate research, there is an increasing demand to make sophisticated models and their outcomes explainable and comprehensible for an audience of laypersons. Unfortunately, traditional tools and methods may be inefficient to provide meaning for input and output values; therefore, in this study, we employ a storytelling tool, the so-called Academic Presenter, to digest various datasets and visualize the extended BioENergy OPTimization model (BENOPTex) outcomes in different online and offline formats. The developed tool facilitates communications among collaborators with a broad spectrum of backgrounds by transforming outcomes into visually appealing stories. Although this study focuses on designing an ideal user interface for BENOPTex, the developed features and the learned lessons can be replicated for other energy system models.
1. Introduction
As a consequence of the oil crisis in 1973, the International Energy Agency (IEA) launched a new program, intending to build the first detailed techno-economic energy system model for analyzing oil use options [1]. Since then, energy system models have become an indispensable part of the decision-making processes. Energy System Optimization Models (ESOMs) in the past have often been at the national level, focusing on the power sector with few renewable technologies (such as hydroelectric and geothermal power plants). These early attempts crudely modeled regions as nodes connected to others via trades while optimizing a single objective function (e.g., minimizing the total system cost). Although the previous generation of ESOMs enabled researchers to understand the underlying system, these streamlined models are considered outdated and incapable of addressing the complexity of real-world problems that policymakers have to confront today [2]. Unfortunately, these models often ignored social factors in their analyses [3], and many influential variables were either overlooked or oversimplified by assuming exogenous and external system boundaries (e.g., the competition over land). These shortcomings have driven practitioners in recent years to improve various aspects of these models in order to paint a more realistic picture [4,5,6].
Two particular dimensions of ESOMs are growing significantly: spatial and temporal resolution [7]. Aryanpur et al. [8] reviewed 36 multi-regional ESOMs from 22 countries and concluded that spatially resolved ESOMs provide substantial added value for regions with heterogeneous renewable energy potential, which can affect the results of the scenarios with a high mix of Variable Renewable Energies (VREs). Thus, the need for spatially resolved models increases as the proportion of VREs increases. Scheller and Bruckner [9] reviewed various ESOMs with a high level of spatial, temporal, and contextual detail and concluded that future models should address six research challenges: spatial planning, temporal resolution, an integrated view, business modeling, complexity, and uncertainty analysis. Prina et al. [10] also reviewed 22 ESOMs, 9 of which are long-term models concerning resolution in time, space, techno-economic detail, and sector-coupling. The authors concluded that none of the reviewed models achieved a high resolution in all of these fields simultaneously. After comparing 40 open access energy system models, Oberle and Elsland [11] concluded that the results of these models should not be compared with those of conventional energy system models due to their simpler technological and methodological designs. Henke et al. [12] conducted an explorative comparison of the region mapping between energy system models and the integrated assessment models and concluded that these two model types differ in the way they define regions.
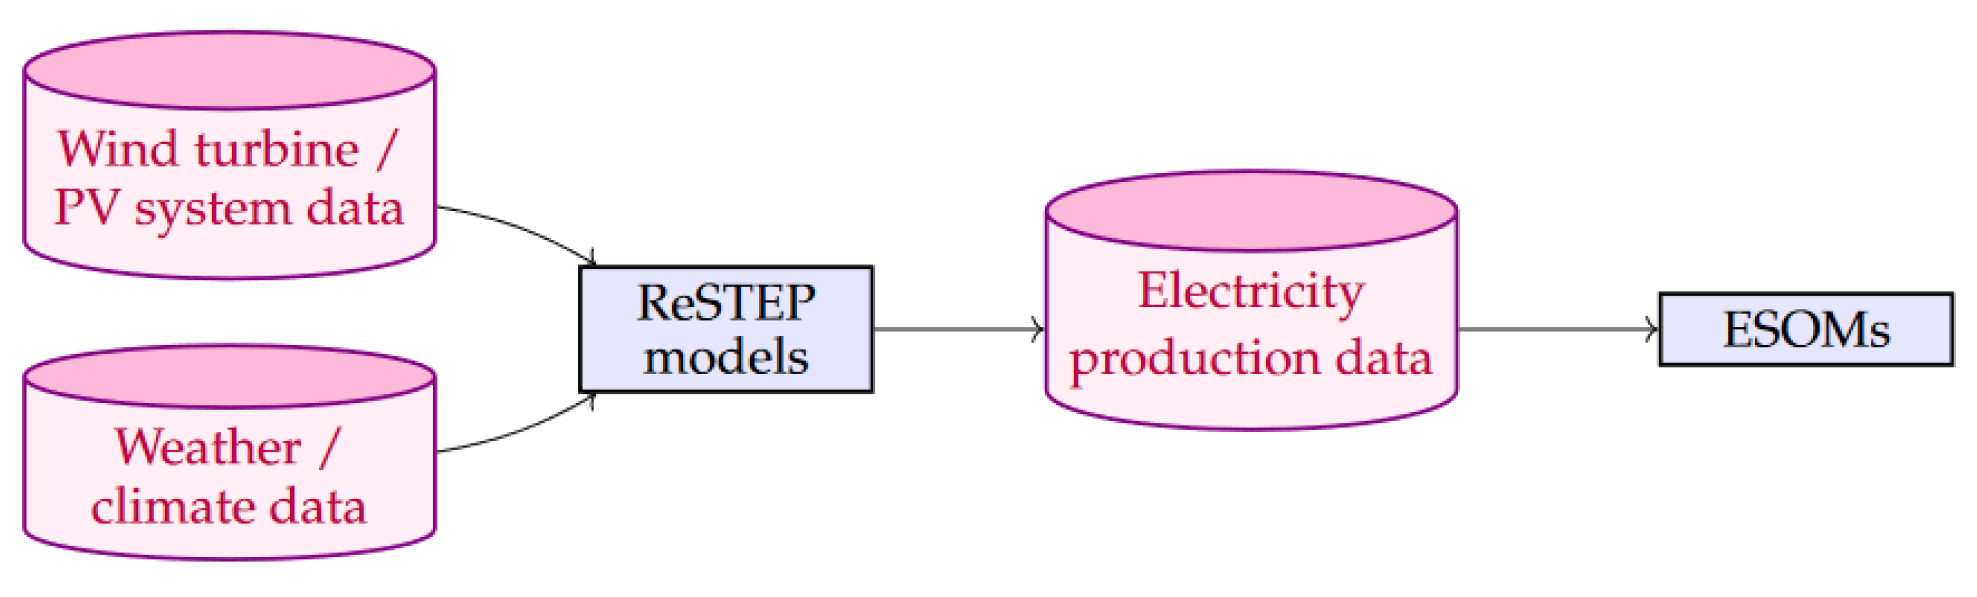
Brosowski et al. [13] emphasized the importance of considering higher temporal and spatial resolutions for straw as a major bioenergy feedstock. Sadr et al. [14] demonstrate that by incorporating daily temporal resolution for agricultural residues and energy crops, we can endogenously account for the availability of processing facilities. Lehneis and Thrän [15] and Lehneis et al. [16,17] also developed simulation models, the so-called ReSTEP models where ReSTEP stands for Renewable Spatial-Temporal Electricity Production, to enhance the spatial and temporal resolution of the electricity generated from wind turbines and photovoltaic (PV) systems considering detailed plant and weather data.
The models developed in the energy field adopt different scales in spatial, temporal, economic, and technological dimensions to answer pertinent questions. For instance, the spatial scale of ESOMs generally is rather coarse at the country level, whereas the spatial scale of the distribution grid planning models can be as refined as a household. To enhance the spatiotemporal resolutions in ESOMs, Gong et al. [18] proposed a soft-coupling framework that combines the strengths of ESOMs and Power Sector Models (PSMs) for a more comprehensive assessment of VREs in the energy system transitions. A similar linking method between ESOMs and PSMs is pursued in [19,20], resulting in complex hybrid models. Hybrid models have to deal with the multi-dimensional granularity gaps that exist between models in different disciplines [21]; therefore, the next generation of hybrid ESOMs needs novel communication methods in order to assist stakeholders with heterogeneous perspectives in comprehending the underlying interdisciplinary system.
Storytelling can connect diverse stakeholders and foster collaboration and collective action [22]. Stories can induce change and showcase the transformation that might occur in communities [23]. In the field of energy and climate research, there is an increasing demand to detect relationships integrating various aspects of the problem using information visualization, where there are plenty of quantitative data [24]. Although information visualization can assist scientists in simplifying complex systems for the users, this task can become particularly challenging as the complexity of the data increases [25]. This is due to the fact that the human cognitive capacity for processing information is limited [26]. Therefore, applying storytelling techniques together with information visualization may be necessary to present outcomes efficiently. More importantly, storytelling can enhance building confidence in outcomes. Unfortunately, energy models have faced criticism for their perceived lack of objectivity [27]. In energy system modeling, modelers utilize scenarios to quantify corresponding variables in qualitative narratives; therefore, constructing a scenario can be seen as storytelling with numbers. However, only presenting scenarios without backstories can damage the trust in the results of these models.
Including data-intensive aspects in optimization, simulation and equilibrium models are often accomplished using databases, which provide no visual clues to users. While these databases are structured to be processed efficiently by machines, they are difficult for humans to interpret and verify. To overcome this problem, researchers employ numerous innovative techniques, such as the User Interface (UI). The Model for Energy Supply Strategy Alternatives and their General Environmental Impact (MESSAGE) is a well-known pioneer ESOM that was developed in the early 1980s by IIASA [28]. MESSAGE uses a command line interface to read data in GAMS data exchange (GDX) file format. In 2019, the developers extended the original model in MESSAGEix by incorporating an online web-based user interface to facilitate the integration of data sources and methodologies across disciplines [29]. In the Renewable Energy Mix (REMix) model, modelers developed an interface that generates scenarios using a branching method for multiple regions. To minimize human effort in their design, technologies can inherit the basic properties of their parent technologies while adjusting themselves for the advanced characteristics according to the needs of the projects. This object-oriented mechanism facilitates managing the varying parameters in REMix for multiple projects [30]. For the TIMES model, different front-end and back-end interfaces have been developed, of which VEDA is the most famous one [31]. To manage data in the TIMES model, VEDA-FE employs a tagging system in Microsoft Excel. By searching through worksheets, VEDA finds tags in a specific format describing parameters. Next, VEDA-FE compiles the scenario for the GAMS model to solve. Finally, after solving the model, the back-end module (i.e., VEDA-BE) collects output files to generate reports and plots. Although VEDA-FE/BE facilitates data management in TIMES, the data values should be manually inserted in tables. Manually entering data values can be a time-intensive task, particularly for medium to large-scale models. For example, a TIMES model containing 1200 processes and 181 commodities required more than 50 thousand data values across multiple worksheets [32]. As the size and complexity of a model increase, manual data entry becomes increasingly arduous and error-prone. Another shortcoming in VEDA-FE, which is addressed in the new VEDA2.0, is the lack of parallel processing. VEDA-FE requires the sequential reading and processing of input data, resulting in significantly increased processing time.
In the Long-Range Energy Alternatives Planning (LEAP) model, developers implemented a Graphical User Interface (GUI) that simplifies the process of developing new energy systems by removing the need for entering values directly into the databases [33]. Using an interface would help to minimize human errors. However, displaying the spatial dimension in LEAP requires additional components and is limited to a maximum resolution of 300 × 300 cells. Parzen et al. [34] propose utilizing available data in OpenStreetMap to improve the spatial dimension of an open-source Python-based energy system model called PyPSA-Earth; however, the model uses a command-line tool, specifically snakemake, for the workflow management, which can present a challenging learning curve for users with no prior programming knowledge. The Open-Source energy MOdeling SYStem (OSeMOSYS) is also another umbrella of optimization models with flexible time slices that rely on Python scripts and command-line interfaces for the workflow management system [35,36].
Energy system models can be confined to a shorter time horizon instead of decades (e.g., a single year) or one sector (e.g., the power sector) or limited to a specific region, thereby enabling modelers to improve the spatial resolution to a single home or a neighborhood. These confined models often tackle energy systems from a different angle to address technical questions. Alhamwi et al. [37] developed a Geographic Information System (GIS)-based ESOM called FlexGIS to optimize storage and flexibility technologies in urban areas by solving scenarios using the oemof.solph model. It incorporates spatial and temporal approaches and uses open-source data, primarily from OpenStreetMap, to export results in various formats or visualize them directly with desktop GIS software tools. However, there are other energy system models with different features and capabilities that use spatial data and provide a graphical interface to manage input and output data. For example, HOMER is a software tool that simulates energy scenarios at the building, community, or microgrid scale and includes tables, graphs, and spatial analysis and visualization tools to analyze the results [38,39]. HOMER provides a graphical interface for specifying input data and has built-in GIS tools that allow users to import and view geospatial data such as building locations, energy infrastructure, and topography. The software also allows users to export simulation results into GIS formats for further analysis or visualization in external GIS software. Another ESOM, DER-CAM, optimizes distributed energy resource systems that incorporate different energy sources, storage options, and demand profiles using a Mixed-Integer Linear Program (MILP) model and a graphical interface [40,41,42]. DER-CAM does not have a built-in spatial visualization tool; however, the model provides detailed output data on the optimal deployment of distributed energy resources at different locations within a building or microgrid. These output data can be combined with external GIS software to create spatial visualizations. Similarly, EnergyPLAN provides an open-source energy system modeling approach that simulates how an entire region supplies and demands energy [43,44]. Although it does not have a built-in spatial visualization tool, users can export the output data from EnergyPLAN and use external GIS software to create spatial visualizations. In summary, energy modeling tools that provide GIS-based visualization capabilities and functionality help users and stakeholders understand and visualize the data and structural relationships between relevant spatial and temporal information, such as buildings, neighborhoods, and energy infrastructure, as well as their semantic relationships.
The BioENergy OPTimization (BENOPT) model employs a tagging system, similar to that of VEDA, to generate scenarios using MATLAB [45,46]. However, the BENOPT model lacks an interface to generate scenarios; thus, the numbers should be added directly into Excel worksheets. Therefore, in this study, we develop a state-of-the-art UI for the extended BioENergy OPTimization (BENOPTex) model to demonstrate the spatial and temporal characteristics of the energy systems while providing storytelling tools for effective communication.
Table 1 summarizes prominent energy modeling tools with respect to the model characteristics and the capacity of their interface in data visualization and storytelling. When it comes to the complexity of their user interfaces, two other ESOMs stand out besides BENOPTex: MESSAGEix and LEAP. Although these models are known for their powerful capabilities in energy systems modeling, their GUIs are confined to plotting results, ignoring opportunities emerging from applying storytelling techniques.
2. Methodology
To develop the GUI, we employ the rendering engine of Academic Presenter (AP) [47], which combines the potency of slide-based presentation software products with canvas-based to create stories. AP has been used previously to visualize a wide variety of problems, including the traveling salesman problem [48,49], global language networks [50], and MicroRNAs synteny-based analysis [51,52]. However, in this manuscript, we use not only the engine but also the interface to manage the spatial resolution using an infinite canvas, while the temporal resolution is presented via discrete snapshots as time frames.
This section describes the expedition to devising an exemplary GUI that can be connected to the chosen optimization model (i.e., BENOPTex). Readers should note that the development of the new GUI for BENOPTex by no means is complete, and it is an ongoing process.
2.1. Requirements for an Ideal UI of ESOMs
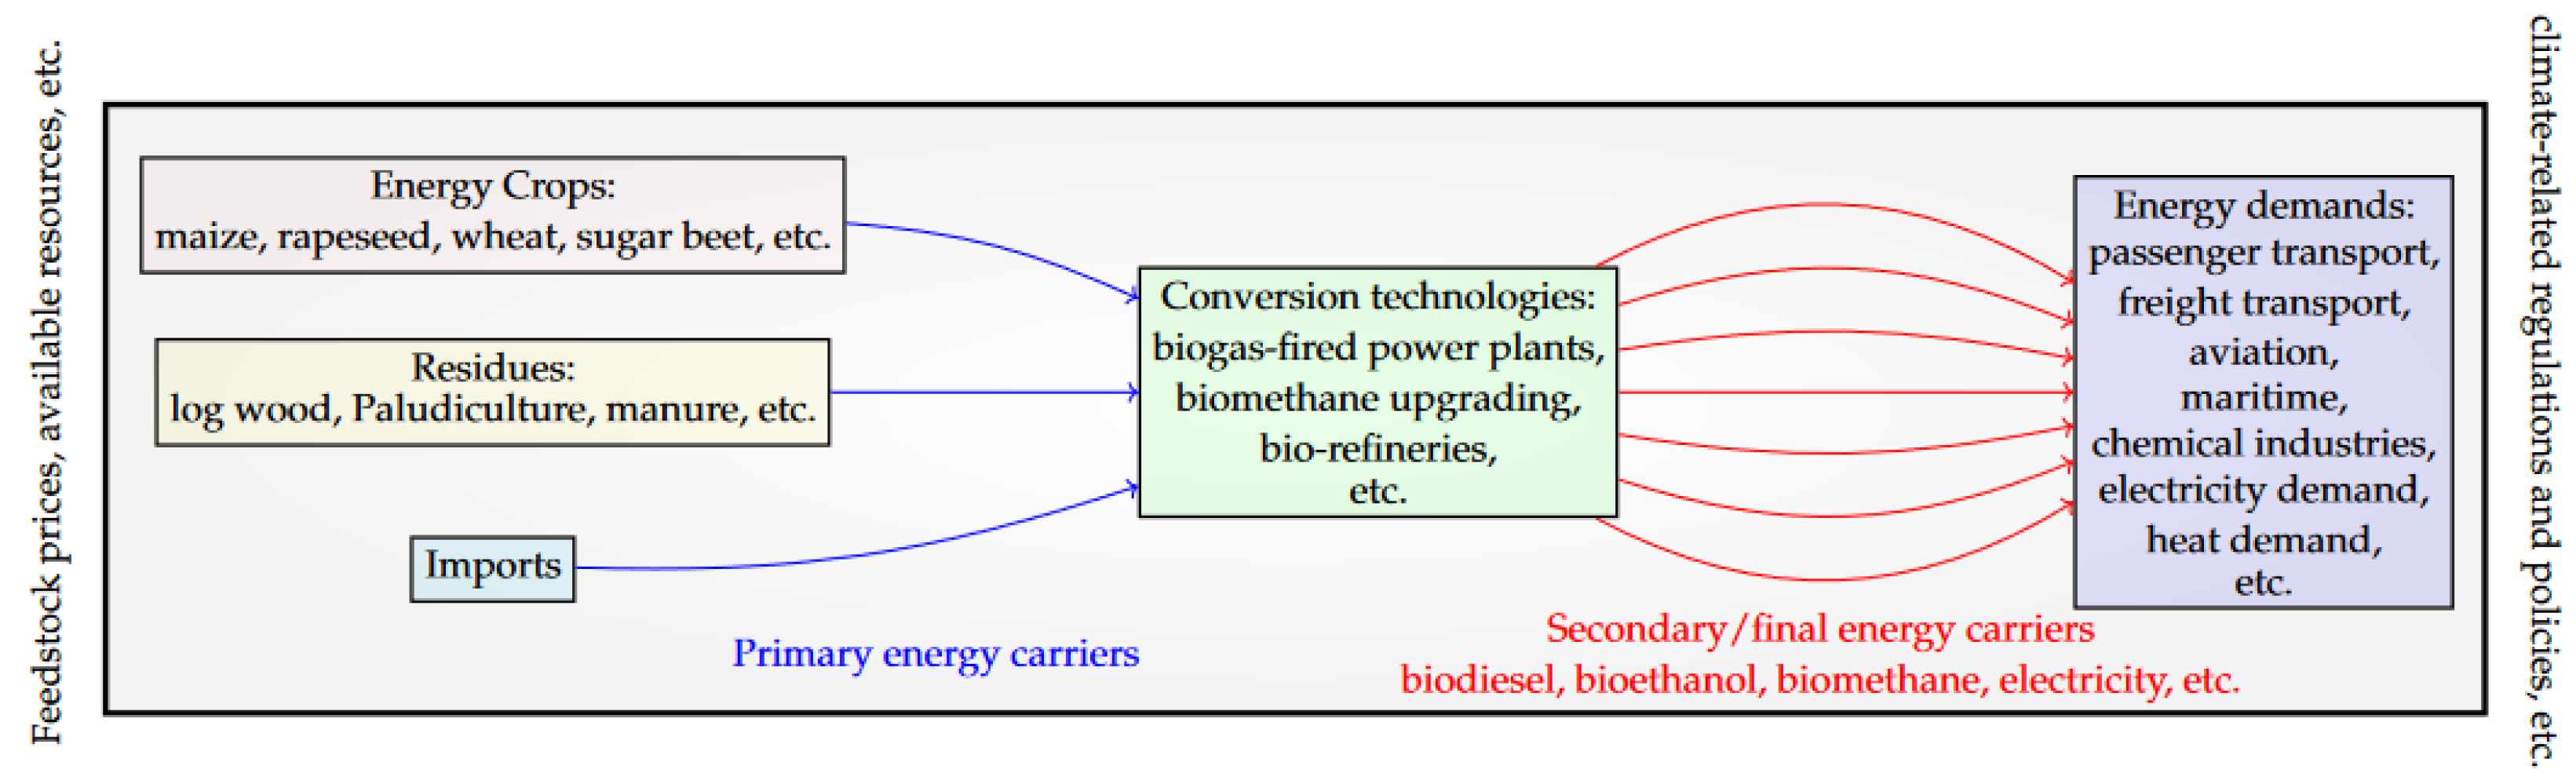
To design effective UIs for ESOMs, it is crucial to have a comprehensive understanding of how energy system models function. ESOMs are built upon the concept of transforming primary energy carriers (e.g., biomass and solar) through conversion technologies into secondary energy carriers (e.g., electricity and biodiesel), which are then consumed by demand services to fulfill the specific end-use requirements specified by top-down models. These demand service technologies can be diverse, ranging from simple household appliances to large industrial machines, and they consume energy in various forms such as electricity and gas. These conversion and demand service technologies compete to satisfy demands in the most cost-effective and environmentally friendly manner respecting technical and political constraints. Figure 1 exhibits the streamlined reference energy system in BENOPTex.
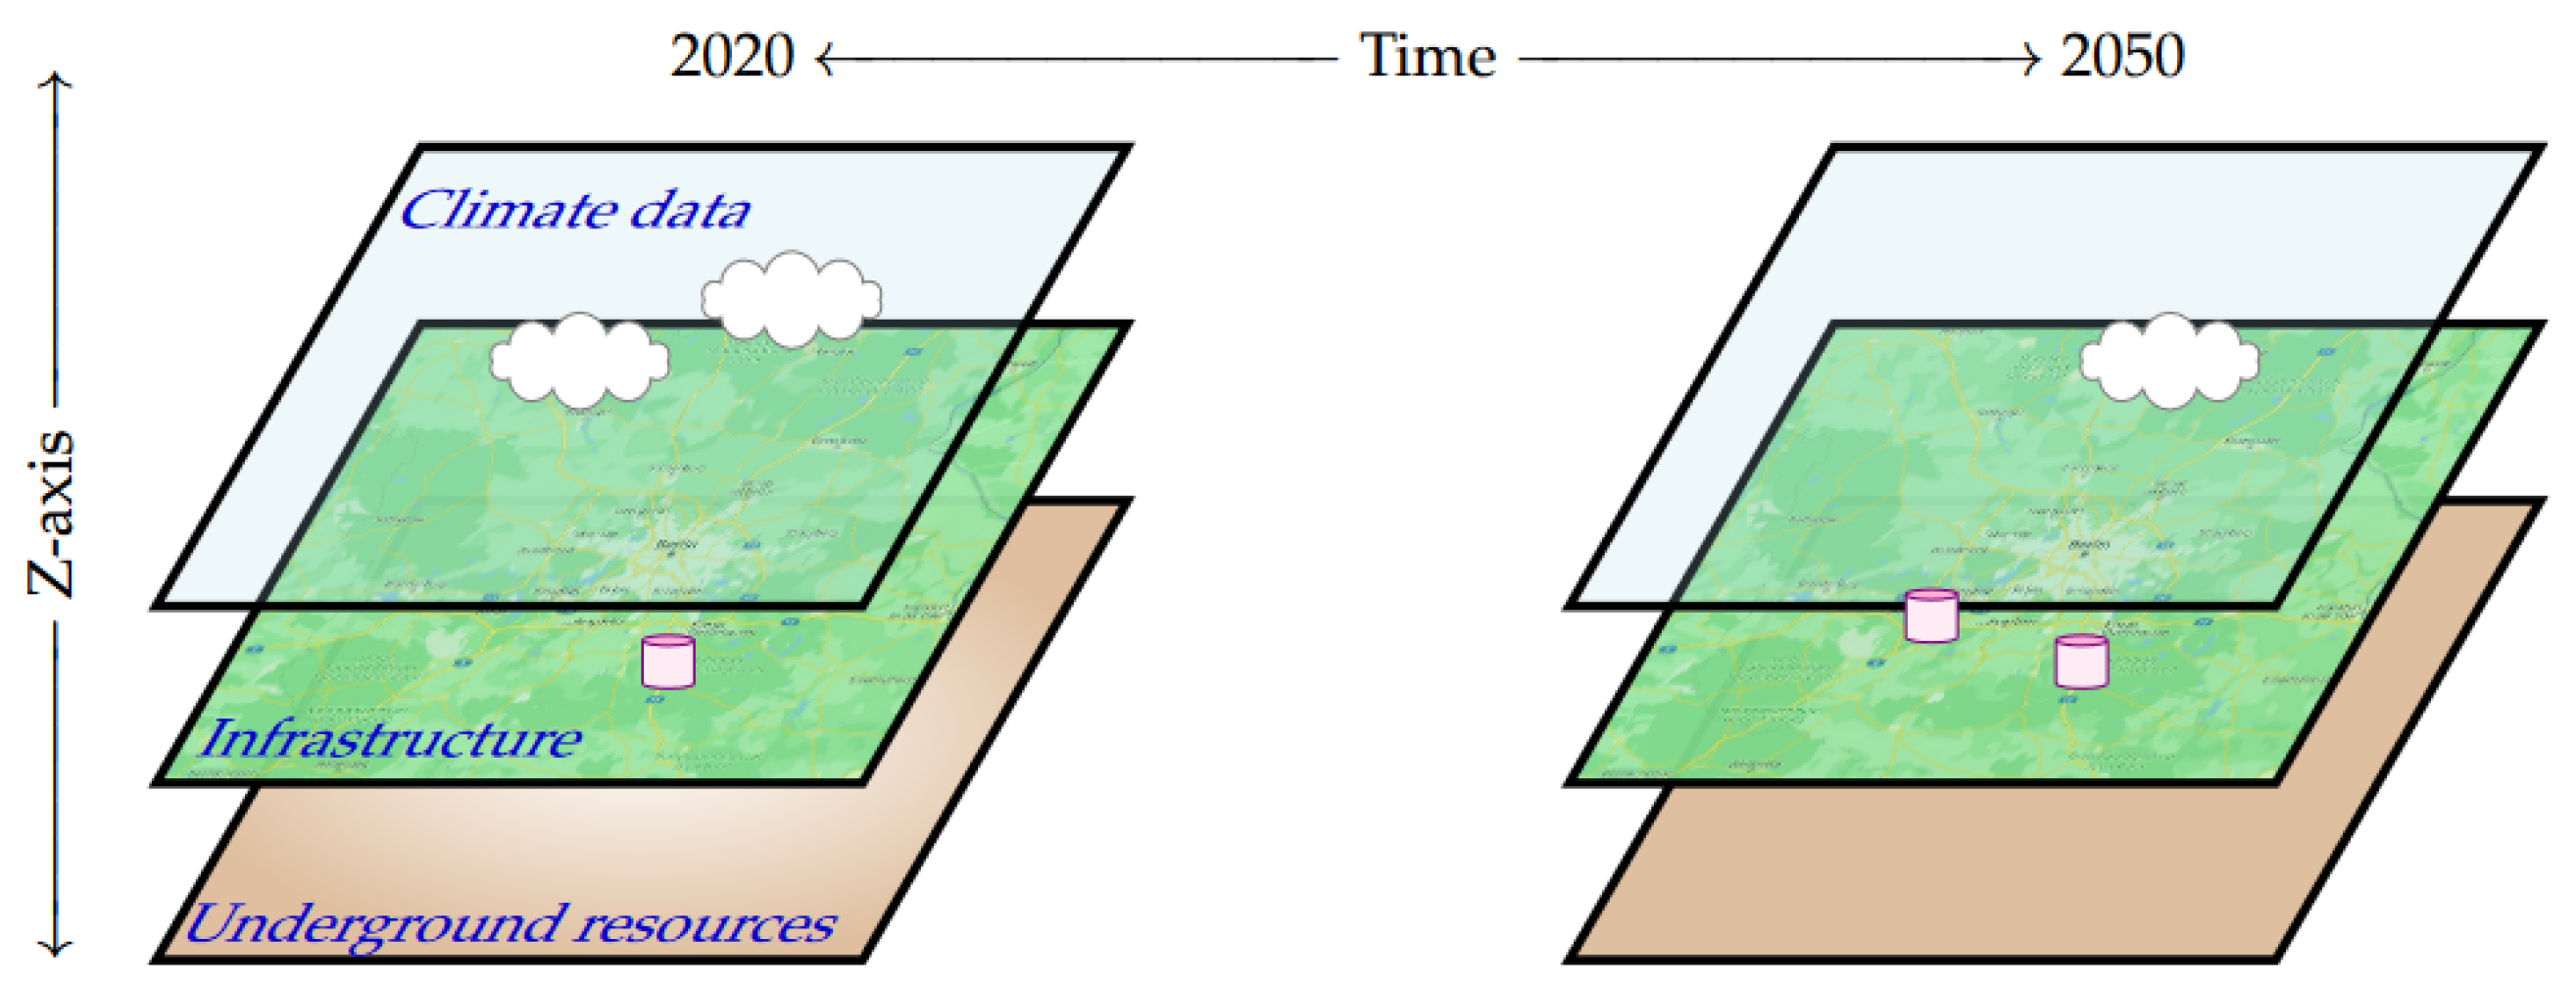
It is essential to recognize that the techno-economic parameters of commodities and technologies are highly dependent on factors such as deployment time and location; hence, these models should be able to visualize spatiotemporal aspects of various technologies to present a clear view for generating scenarios. It is vital to consider the spatial aspect of ESOMs in three dimensions, including depth, not just confined to the surface. Many technologies, such as geothermal or BioEnergy with Carbon Capture and Storage (BECCS), rely on underground resources for storage or energy extraction. Hence, the interface must consider the Z-axis. Additionally, the temporal aspect of ESOMs must be adequately distinguished by assigning flexible time resolutions to various technologies. For instance, while an hourly resolution for a biogas-fired power plant is reasonable, the availability of biomass feedstock does not need to be modeled hourly. The model and interface must be able to distinguish the required temporal resolution for various technologies in order to save computation time and memory.
Overall, the UI of ESOMs should be designed to effectively visualize the spatiotemporal aspects of various technologies, considering three-dimensional space and assigning reasonable time resolutions to different technologies. By doing so, the interface can provide a clear view of possible scenarios and aid in decision-making processes. Figure 2 depicts the primary concept for an ideal front-end for ESOMs.
2.2. The Visualizing Interface
To effectively visualize a complex multi-layer problem that evolves over time, a powerful rendering engine is essential. This engine should be capable of harnessing the immense computing power of modern graphics cards to accurately display the changing nature of the problem. In this section, we present a new approach for visualizing spatially resolved models using the state-of-the-art rendering engine of Academic Presenter (AP) [47]. The rendering engine of AP is implemented in C# using SlimDX [53], harnessing the power of a video graphics card without an intermediary.
The developed interface enables us to present the geographical information using an infinite canvas in multiple layers, while the morphing landscape through time is captured via snapshots of the system state. This feature assists users in visually identifying patterns, trends, and transformations over time, which subsequently helps them to draw an informed decision for generating scenarios. In fact, Chou et al. [54] investigate the effectiveness of various knowledge presentation methods (i.e., linear versus non-linear canvas) on learning performance. The authors conclude that canvas-based is a more efficient instructional medium for knowledge acquisition, while linear narratives demonstrated instructional effectiveness on long-term learning retention. These findings suggest that the choice of presentation method should be adjusted to the specific learning objectives and the audience’s needs. For example, a canvas-based approach may be more appropriate for conveying complex information that requires immediate comprehension, while a linear narrative may be more effective for content that needs to be retained over time. A similar observation is reported by Chappin [55]. The author points out that using a whiteboard (or a canvas) can assist primary school students with no background knowledge about energy systems to develop a visual record of concepts.
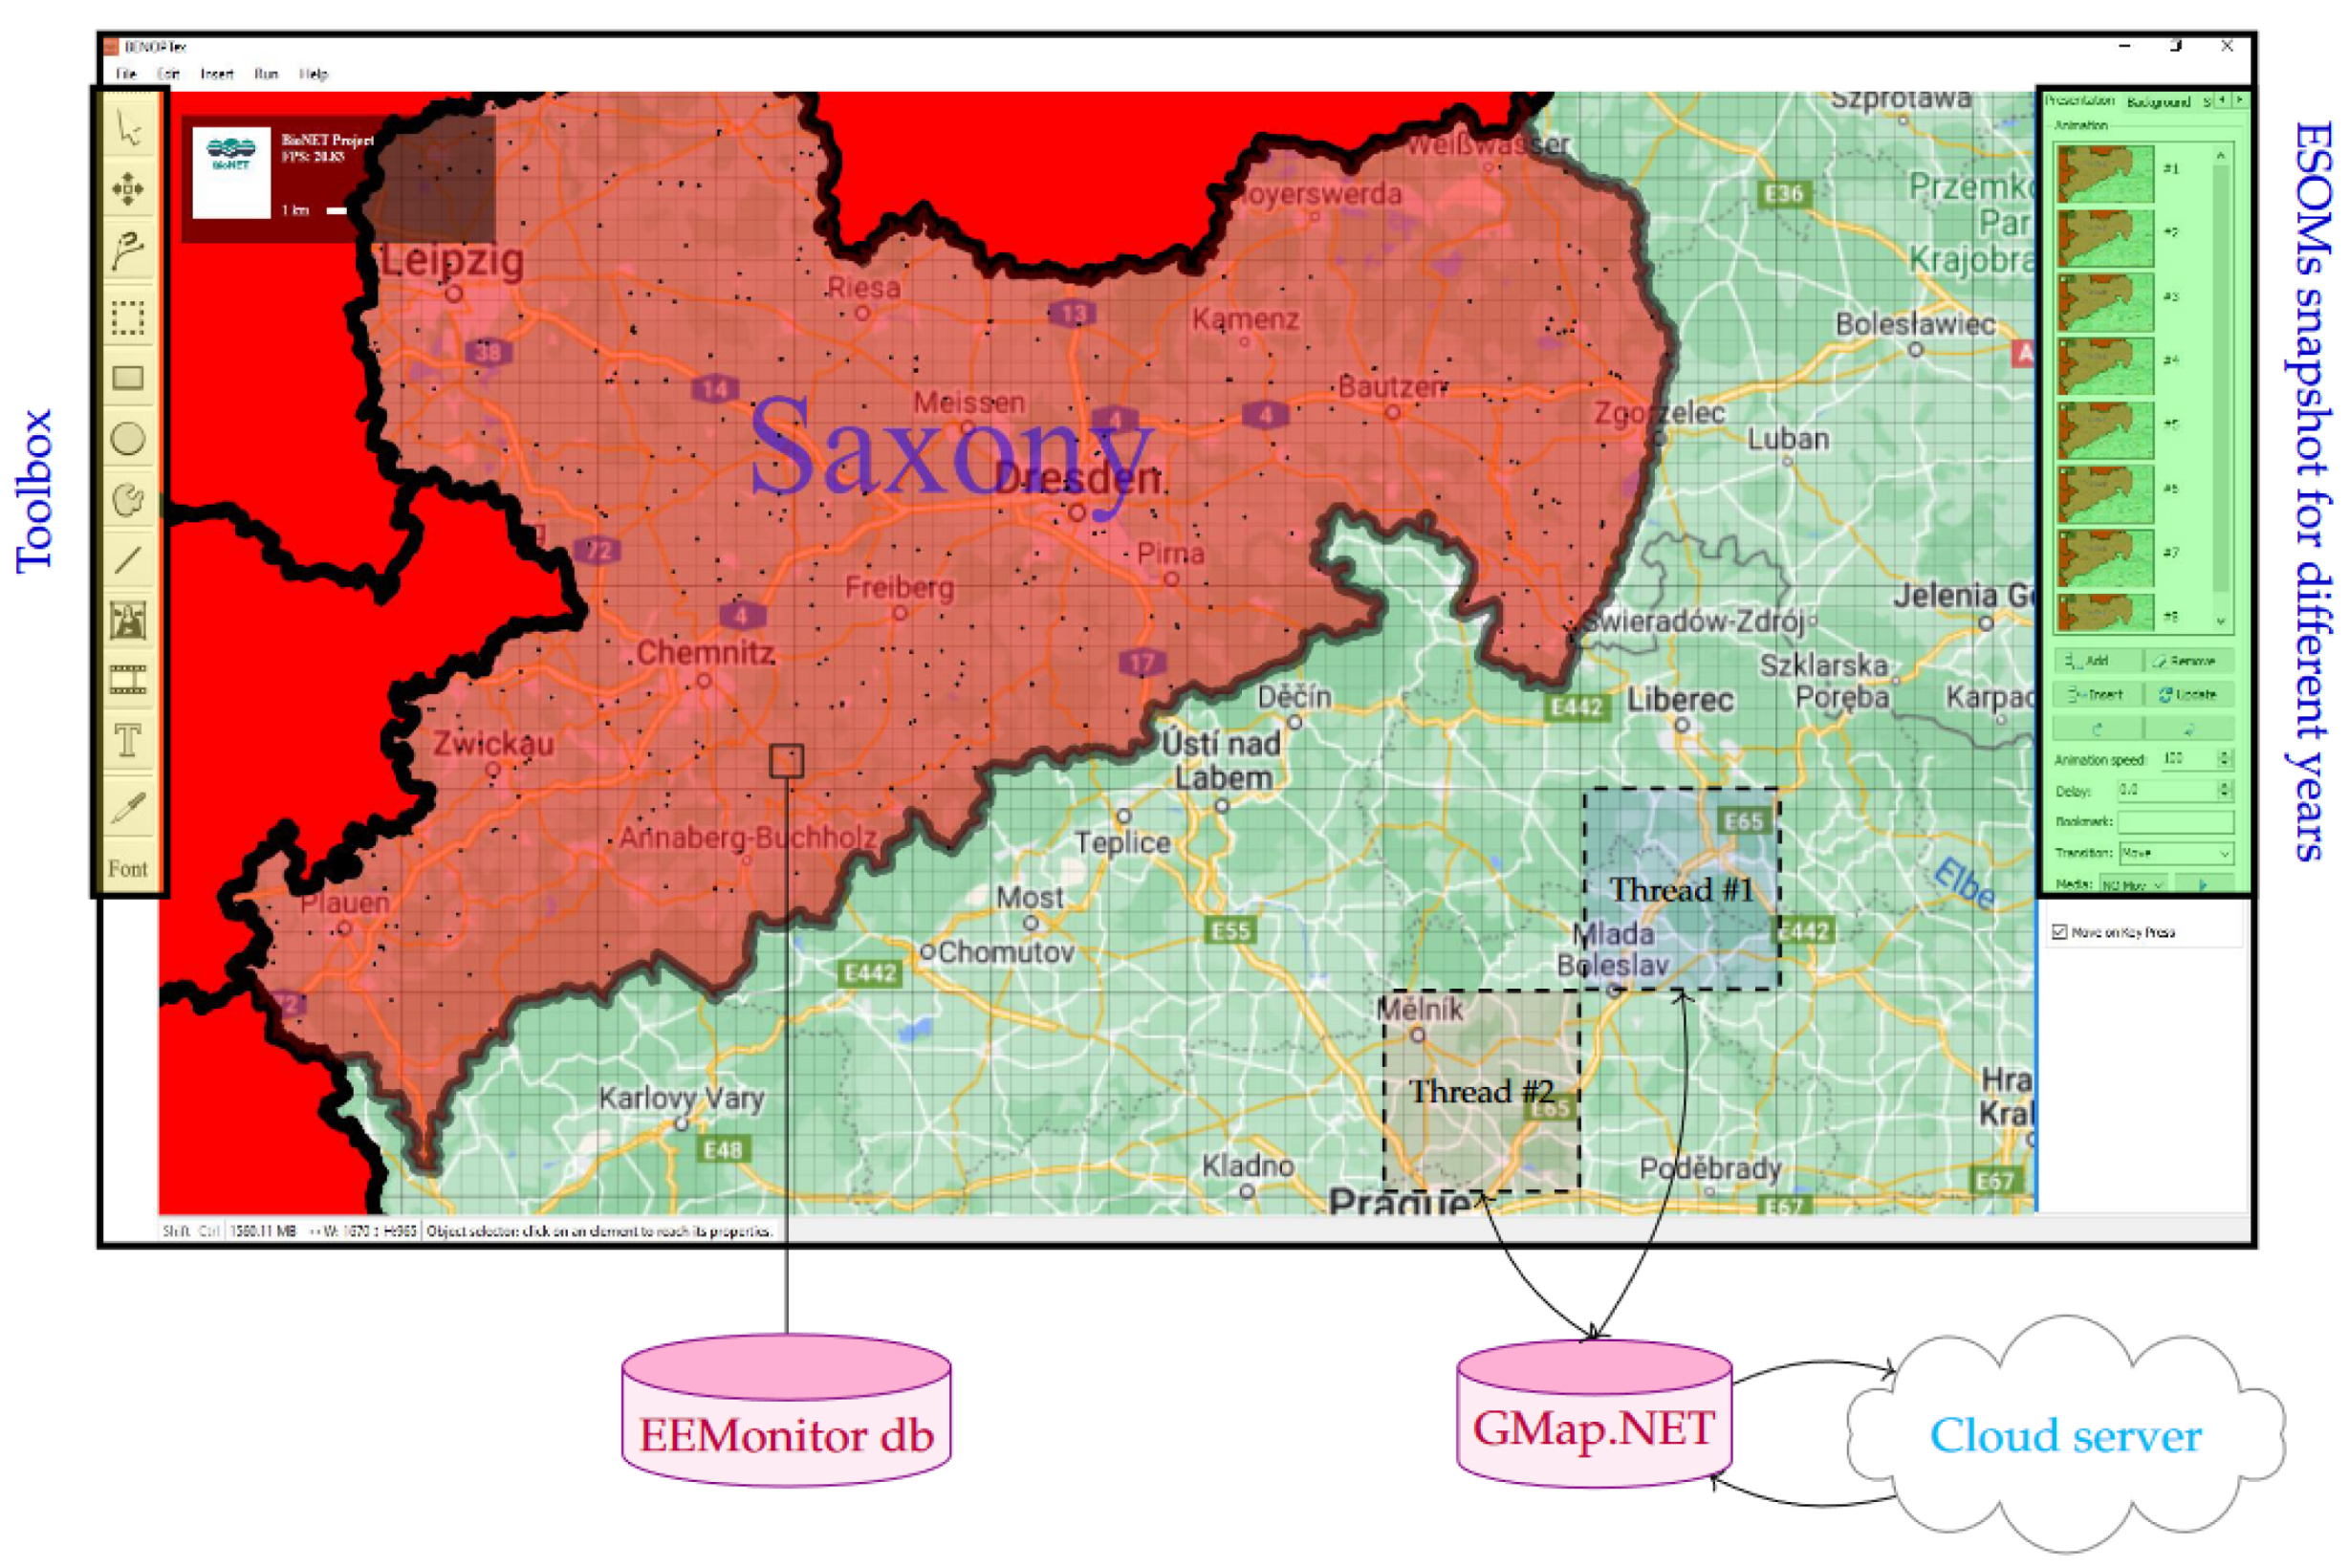
Figure 3 displays the toolbox, ESOMs snapshots for temporal changes, and the canvas panels in the new BENOPTex interface. As shown in this figure, the central panel is where the infinite canvas is placed. This canvas reads and renders information from various GIS databases. The background of the canvas is directly connected to commercial mapping services (e.g., Bing Maps, Google Maps) using GMap.NET (the package can be accessed from the following address: https://www.nuget.org/packages/GMap.NET (accessed on 16 May 2023)) to update the view when zooming and panning. When the user modifies the view, the interface requests new blocks of information from the selected servers in a multi-threaded manner. The selected mapping server sends the tiles for the requested regions to each thread separately. The thread managers in the interface then place each tile in its correct position asynchronously, thereby improving the refresh rate for rendering new scenes. For the sake of demonstration, two tiles are shown in Figure 3 for thread #1 and thread #2.
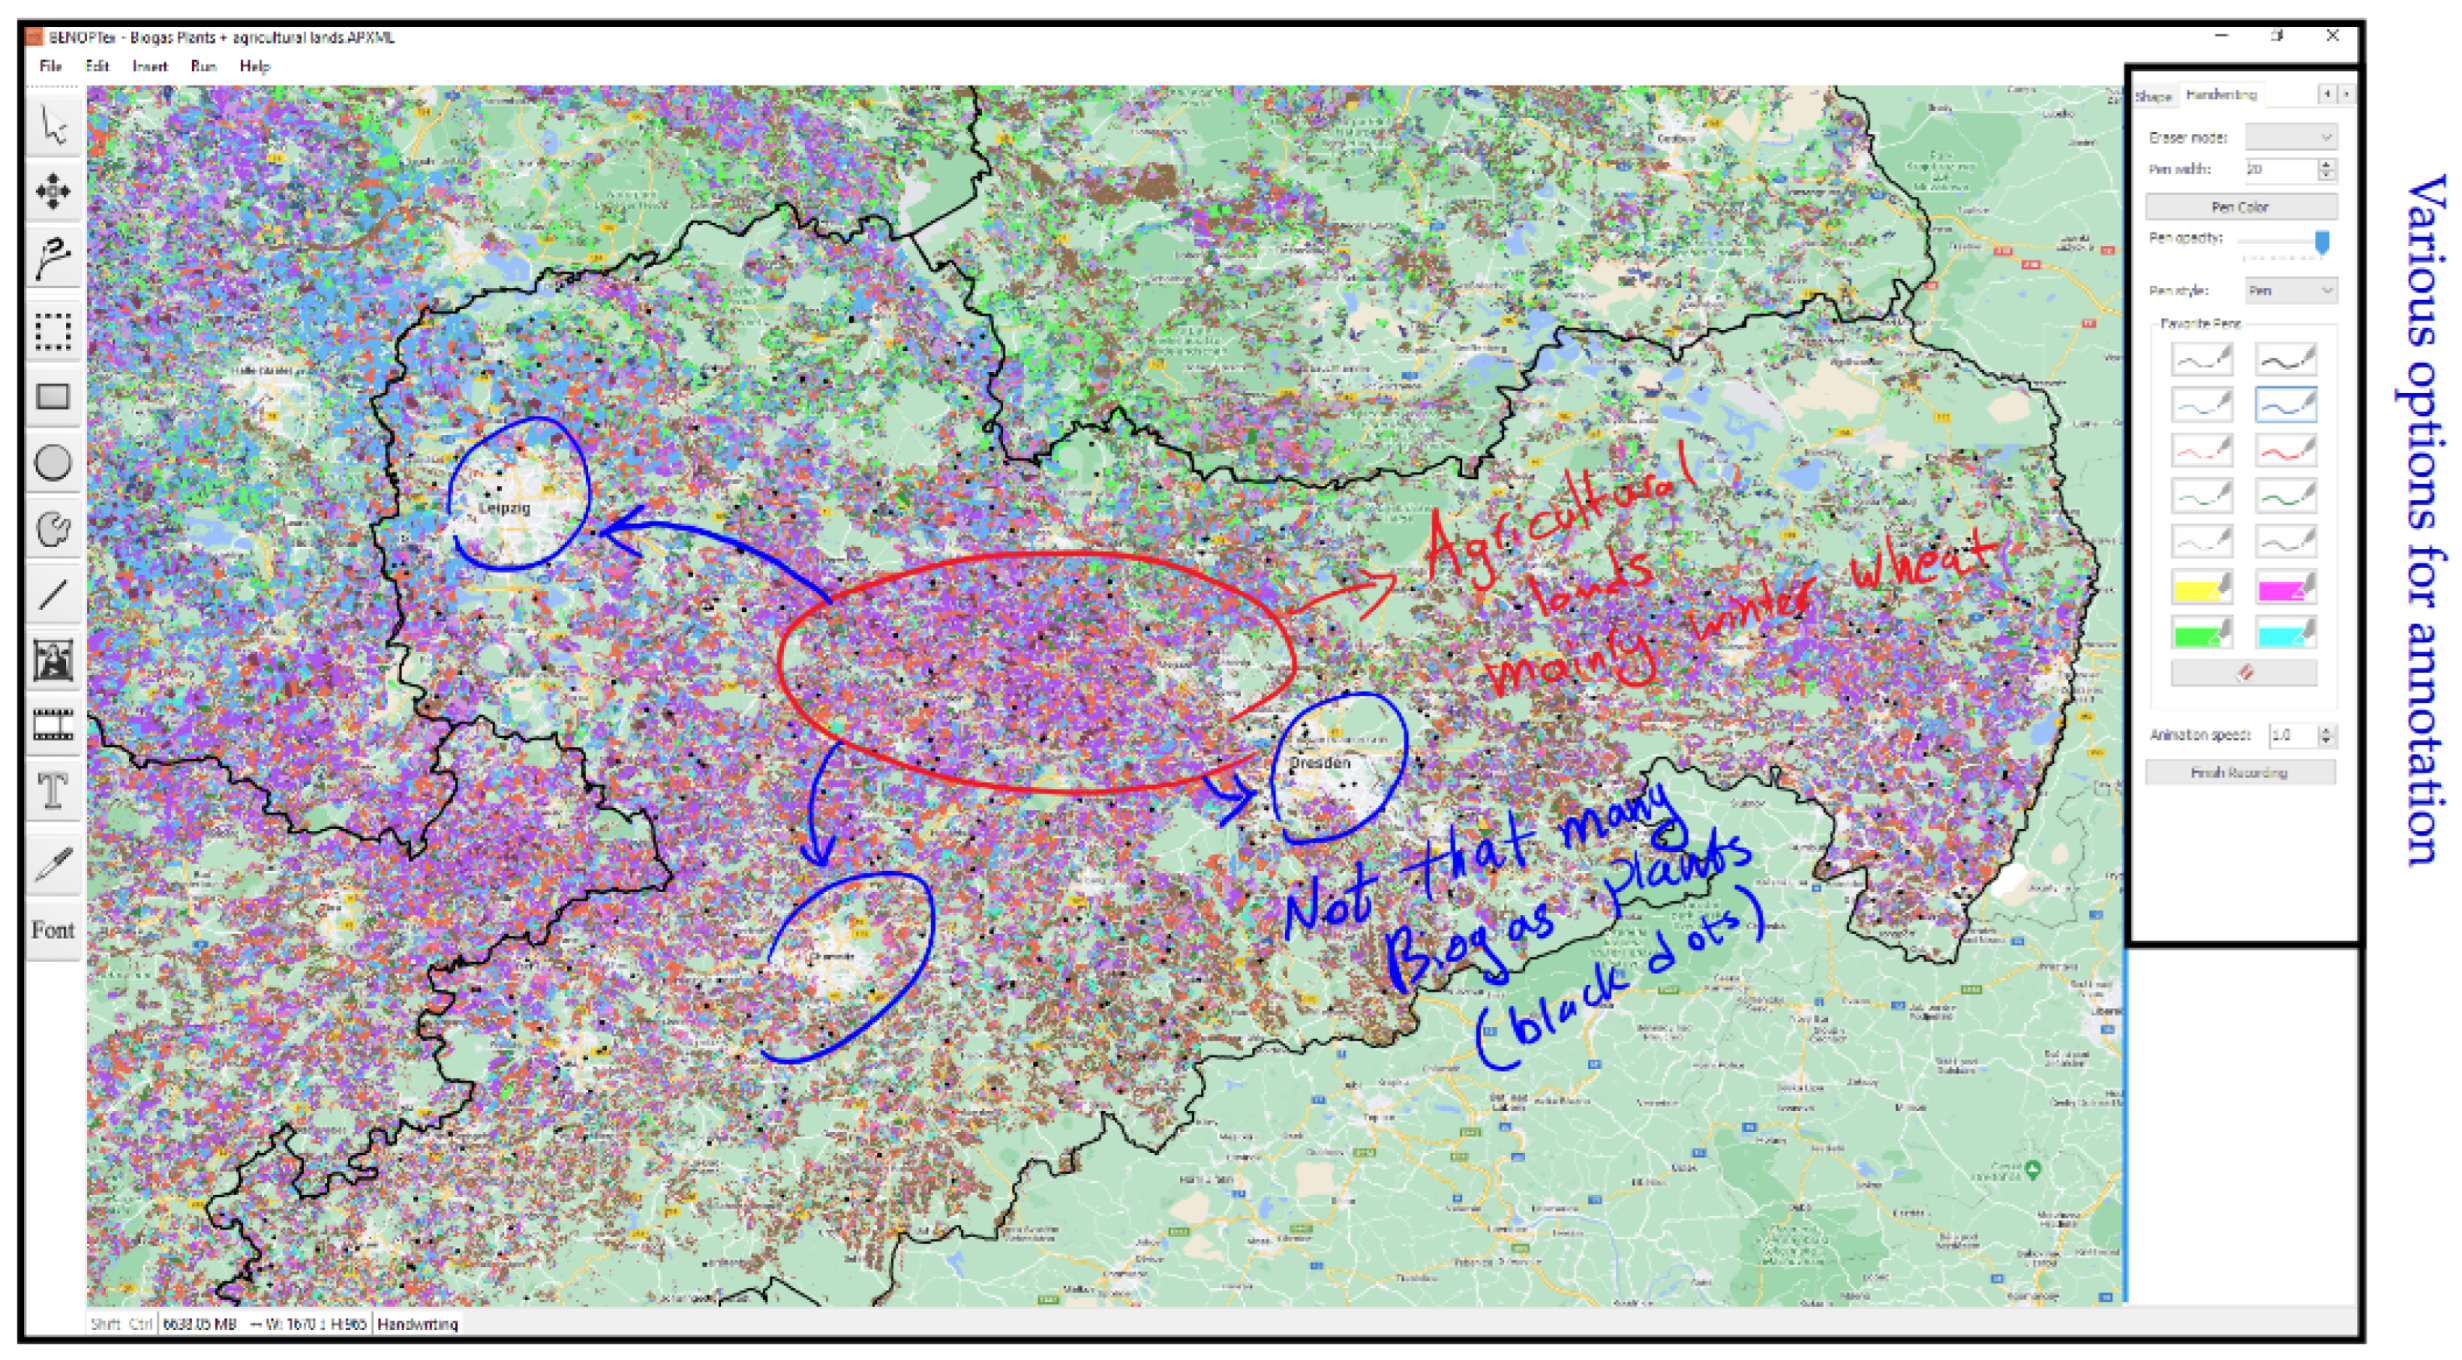
With the comprehensive toolbox borrowed from AP’s GUI, modelers can easily elevate energy systems visualizations into stories with a range of multimedia elements, including texts, equations, images, videos, and voiceovers. These features allow users to create engaging and informative stories that assist viewers in better understanding the underlying parameters in the model. In addition, the toolbox includes an annotation tool using a digitizer that enables modelers/presenters to highlight and emphasize key points in their stories, making it easier for audiences to follow along and stay engaged. According to anecdotal evidence from sources such as Roam [56] and Lee et al. [57], it is suggested that dynamic sketches accompanied by narration could be a more effective means of delivering information compared to conventional presentations. The annotation tool offers an editable layer-based drawing system that allows movements on the canvas to be replayed whenever needed. The toolbox provides users with a range of pens and highlighters that are easily accessible. Additionally, users have the ability to adjust the replay speed to suit their needs. In Figure 4, a digitizer is utilized to highlight a region in Saxony, where many agricultural lands are available with comparatively fewer biogas-fired power plants to use their residues. Using arrows, the modeler shows that this region is the centroid of the three most populated cities in Saxony, which can provide an opportunity to dispatch the generated electricity with low transmission loss. The annotation allows modelers and content creators to create engaging stories that can be presented to stakeholders, by which they can justify their results. On the left-hand side, the GUI displays various editing options when the annotation tool is selected.
The GIS data related to available bioenergy and renewable energy facilities are acquired from the EE-Monitor project [58] and the Core Energy Market Data Register [59]. These renewable energy facilities can additionally be simulated in terms of their electricity production using the ReSTEP models, providing further important input information for ESOMs. To calculate the electricity generated from variable renewables, i.e., wind turbines and PV systems, spatially and temporally resolved weather data are required in addition to the necessary plant data containing geographical locations and technical parameters of the selected renewable energy facilities. In this way, future climate change effects can also be included in the numerical simulations, which will further improve the prediction results of the ESOM scenarios [60]. The electricity production data generated by ReSTEP are time series with a maximum spatial resolution at the plant site level and a temporal resolution based on the weather or climate data used, typically one hour. Thus, time series with any required spatiotemporal resolution equal to or lower than these maximum resolutions can be provided as input information for the subsequent ESOMs. Figure 5 shows the scheme for generating electricity production data from variable renewables using the ReSTEP models with the necessary plant and weather data.
The data have been cleaned and converted into a proper GIS format. To accelerate the visualization process, the UI checks the size of facilities with respect to the zoom factor and the visible region. If we are on a national level, the interface ignores drawing these facilities. Similarly, we are planning to connect the new BENOPTex visualizer to new GIS datasets for the land use [61] and forest types [62].
By utilizing the described interface, users can easily generate scenarios by visually adjusting parameters in BENOPTex. Once created, these scenarios are sent to the GAMS solver for optimization of decision variables. Finally, the optimal values of the decision variables will be read from the GDX file.
2.3. Information Dissemination
The GUI has been carefully designed to seamlessly integrate BENOPTex’s visualization and information dissemination processes. This means that users can conveniently and efficiently create, manipulate, and share visualizations of their inputs and outputs. The visualizer’s view can be exported to a wide variety of static and dynamic media formats, including a web-friendly code that can be easily embedded into projects’ web pages. Using HTML5 and CSS3 [63] technologies, an online platform is created that accepts uploaded project files (please visit https://APresenter.com (accessed on 16 May 2023)). This platform will allow modelers to present stories, scenarios, and results of ESOMs using web browsers. This ensures that users can easily share their insights with stakeholders, regardless of the utilized platform or device type.
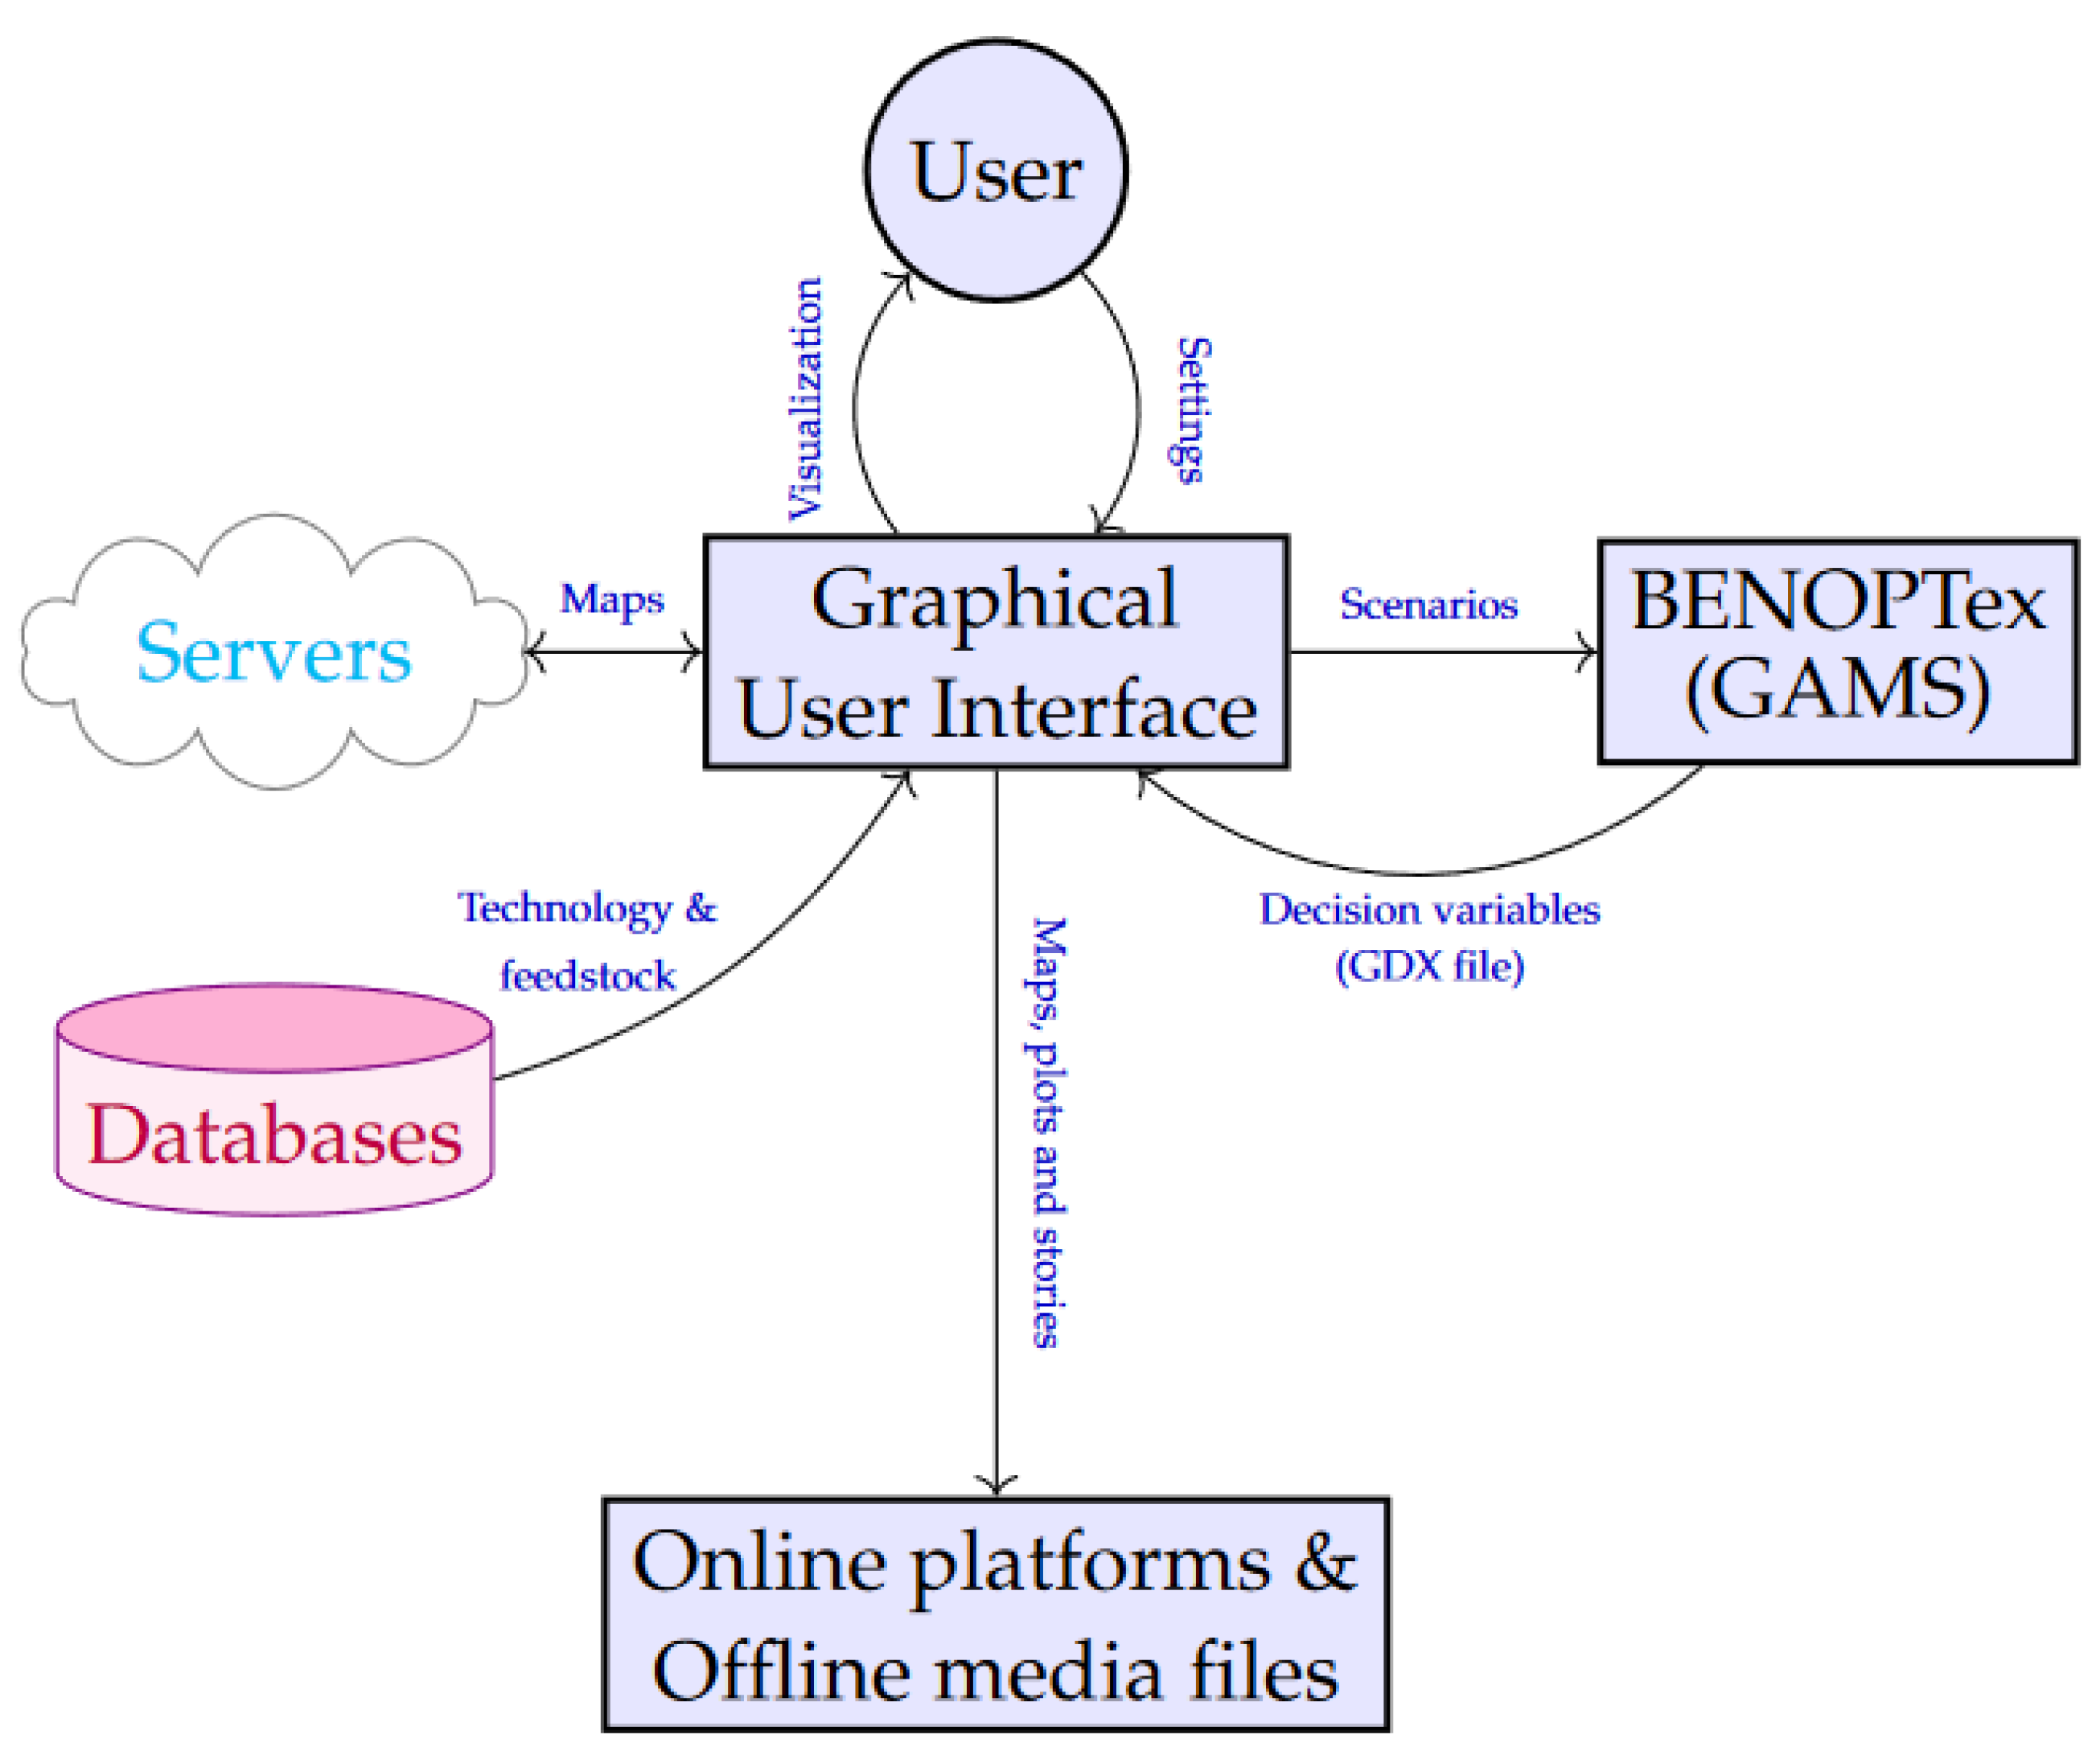
To transfer the model results/data to the server, the front-end interface first reads inputs and parameters. Then, all visual clues are translated into an extensible markup language (XML) file, in which elements (e.g., images, voices, handwriting) are encoded and embedded. Next, the visualizer assigns a unique identification number to the XML file and uploads it to the server using the hypertext transfer protocol after verifying the user’s credentials. Using the same identification number, the stored projects on the server can be invoked and shared with audiences. Figure 6 depicts the information flow and sequence of processes (i.e., data curation, scenario generation, optimization, and information dissemination).
3. Discussion
Energy system models are often by-products of research projects carried out by universities and research centers facing tight budgets and time constraints. Hence, researchers have to prioritize their tasks to ensure the full development of the main component of these models, which can sometimes deprioritize the development of user-friendly interfaces. To aggravate the situation, visualizers and UIs can often be developed after the completion of the main model, which can mislead researchers to undervalue their importance. As a result, many models remain in their primitive script forms to answer specific questions, limiting their applicability and maintainability.
To extend the use of these models beyond the scope of their parent projects, a community of users is required, emphasizing the critical importance of intuitive and accessible interfaces. One possible strategy is to develop multiple versions of the model tailored to specific purposes. For example, LPJ-GUESS (a dynamic global vegetation model) has two distinct versions—one for research and another for educational purposes [64]. The educational variant of LPJ-GUESS offers a GUI and simpler instructions, making it more user-friendly for beginners. Nonetheless, managing version control of these customized models may pose a challenge, as changes made to one version may not be compatible with the other.
In this manuscript, the key aspects of ESOMs have been comprehensively reviewed, which aids in identifying the optimal design for a UI that satisfies users’ needs. The thought process has been described in detail, exposing the technical difficulties that need to be addressed. It is anticipated that the next generation of ESOMs will be GIS-based, and therefore, spatial detail should be integrated into future UIs. This can be achieved either by linking scripts to available GIS tools, such as QGIS and ArcGIS, or by creating an entirely new GUI that meets the ESOMs’ requirements.
Moreover, the temporal resolution of such models should be adjustable to suit the requirements of technologies and objectives. This will minimize the runtime of optimization models. Finally, it is expected to see more hybrid models in the future as policymakers aim to gain a comprehensive understanding of the problem by incorporating the viewpoints of heterogeneous stakeholders. As a result, future UIs should be devised to consolidate the understanding of these stakeholders using visualization and storytelling techniques. Furthermore, the latest UIs should enable convenient interactions with other optimization/simulation models. A sophisticated GUI can be created apart from the optimization model, much like the GAMS software, in which the model only needs to be written once, and the solver can be specified afterward based on the model’s characteristics [65].
By analyzing various ESOMs, this study shows that the GUI is the Achilles’ heel of these models. Unfortunately, the status quo is lagging behind the other aspects of these energy modeling tools. Therefore, project managers and developers should dedicate enough resources to enhance the user-friendliness of these interfaces. A glimpse of the future generation of UIs can suggest that these interfaces will be streamlined using large language models, such as the Generative Pre-trained Transformer (GPT) [66]. The Artificial Intelligence (AI) will enable users to generate scenarios and modify the optimization code based on descriptions and given datasets.
4. Conclusions
This study reiterates the importance of employing data visualization and storytelling techniques to better align stakeholders’ understandings of energy systems and refine their expectations. Unfortunately, many models suffer from poor UI with technical complexities that make them impractical to outsiders. This shortcoming prevents the community from forming around these ESOMs; however, expectations are growing rapidly in favor of developing user-friendly software tools for efficient data management with minimum space for human errors. Therefore, in this manuscript, major dimensions are first identified for an ideal user interface, by which one can address future requests from these optimization models. Next, a GUI has been developed for the selected ESOM (i.e., BENOPTex) that visualizes various datasets and generates stories around them.
This manuscript can be extended in multiple directions. Linking power market models (e.g., EMSimulator [67] and AMIRIS [68]), climate models (e.g., REMO [69,70]), or vegetation models (e.g., FORMIND [71]) can be followed with the selected ESOMs using an advanced user interface. Moreover, the impact of data visualization and storytelling in the developed GUI on stakeholders’ collaboration can be investigated. Finally, it is crucial to devise and implement high-performance optimization techniques for efficiently solving spatially detailed ESOMs.
Author Contributions
Conceptualization, methodology, validation, data curation, formal analysis, software, and visualization, D.E.A.; data curation, L.S. and D.M.; writing—original draft preparation, D.M., D.T., R.L. and D.E.A.; supervision, D.E.A. and D.T. All authors have read and agreed to the published version of the manuscript.
Funding
This work has received financial support from the Helmholtz Association of German Research Centres through the POF 4 program Changing Earth–Sustaining our Future, Topic 5 Landscapes of the Future.
Data Availability Statement
Not applicable.
Acknowledgments
The authors would like to thank Edris Esmaeili, who developed the online platform.
Conflicts of Interest
The authors declare no conflict of interest.
Abbreviations
The following abbreviations are used in this manuscript:
| AI | artificial intelligence |
| AP | academic presenter |
| BECCS | bioenergy with carbon capture and storage |
| BENOPTex | extended bioenergy optimization model |
| ESOMs | energy system optimization models |
| GPT | generative pre-trained transformer |
| GUI | graphical user interface |
| IEA | international energy agency |
| MESSAGE | model for energy supply strategy alternatives and their general |
| environmental impact | |
| OSeMOSYS | open-source energy modeling system |
| PSMs | power sector models |
| REMix | renewable energy mix |
| ReSTEP | renewable spatial-temporal electricity production |
| VRE | variable renewable energies |
| UI | user interface |
| XML | extensible markup language |
References
- OECD/IEA. From Oil Security to Steering the World toward Secure and Sustainable Energy Transitions. Available online: https://www.iea.org/about/history (accessed on 22 April 2023).
- Aliabadi, D.E.; Çelebi, E.; Elhüseyni, M.; Şahin, G. Modeling, simulation, and decision support. In Local Electricity Markets; Elsevier: Amsterdam, The Netherlands, 2021; pp. 177–197. [Google Scholar]
- Süsser, D.; Gaschnig, H.; Ceglarz, A.; Stavrakas, V.; Flamos, A.; Lilliestam, J. Better suited or just more complex? On the fit between user needs and modeller-driven improvements of energy system models. Energy 2022, 239, 121909. [Google Scholar] [CrossRef]
- Nikas, A.; Gambhir, A.; Trutnevyte, E.; Koasidis, K.; Lund, H.; Thellufsen, J.Z.; Mayer, D.; Zachmann, G.; Miguel, L.J.; Ferreras-Alonso, N.; et al. Perspective of comprehensive and comprehensible multi-model energy and climate science in Europe. Energy 2021, 215, 119153. [Google Scholar] [CrossRef]
- Lopion, P.; Markewitz, P.; Robinius, M.; Stolten, D. A review of current challenges and trends in energy systems modeling. Renew. Sustain. Energy Rev. 2018, 96, 156–166. [Google Scholar] [CrossRef]
- Zendehboudi, S.; Rezaei, N.; Lohi, A. Applications of hybrid models in chemical, petroleum, and energy systems: A systematic review. Appl. Energy 2018, 228, 2539–2566. [Google Scholar] [CrossRef]
- Martínez-Gordón, R.; Morales-España, G.; Sijm, J.; Faaij, A. A review of the role of spatial resolution in energy systems modelling: Lessons learned and applicability to the North Sea region. Renew. Sustain. Energy Rev. 2021, 141, 110857. [Google Scholar] [CrossRef]
- Aryanpur, V.; O’Gallachoir, B.; Dai, H.; Chen, W.; Glynn, J. A review of spatial resolution and regionalisation in national-scale energy systems optimisation models. Energy Strategy Rev. 2021, 37, 100702. [Google Scholar] [CrossRef]
- Scheller, F.; Bruckner, T. Energy system optimization at the municipal level: An analysis of modeling approaches and challenges. Renew. Sustain. Energy Rev. 2019, 105, 444–461. [Google Scholar] [CrossRef]
- Prina, M.G.; Manzolini, G.; Moser, D.; Nastasi, B.; Sparber, W. Classification and challenges of bottom-up energy system models—A review. Renew. Sustain. Energy Rev. 2020, 129, 109917. [Google Scholar] [CrossRef]
- Oberle, S.; Elsland, R. Are open access models able to assess today’s energy scenarios? Energy Strategy Rev. 2019, 26, 100396. [Google Scholar] [CrossRef]
- Henke, H.; Dekker, M.; Lombardi, F.; Pietzcker, R.; Fragkos, P.; Zakeri, B.; Rodrigues, R.; Sitarz, J.; Emmerling, J.; Fattahi, A.; et al. The mutual benefits of comparing energy system models and integrated assessment models. Open Res. Eur. 2023, 3, 69. [Google Scholar] [CrossRef]
- Brosowski, A.; Bill, R.; Thrän, D. Temporal and spatial availability of cereal straw in Germany—Case study: Biomethane for the transport sector. Energy Sustain. Soc. 2020, 10, 42. [Google Scholar] [CrossRef]
- Sadr, M.; Aliabadi, D.E.; Avşar, B.; Thrän, D. Assessing the seasonality impact on bioenergy production from energy crops in Germany. In Proceedings of the European Biomass Conference and Exhibition Proceedings, Bologna, Italy, 5–9 June 2023; pp. 1–5. [Google Scholar]
- Lehneis, R.; Thrän, D. Temporally and Spatially Resolved Simulation of the Wind Power Generation in Germany. Energies 2023, 16, 3239. [Google Scholar] [CrossRef]
- Lehneis, R.; Manske, D.; Thrän, D. Generation of Spatiotemporally Resolved Power Production Data of PV Systems in Germany. ISPRS Int. J. Geo-Inf. 2020, 9, 621. [Google Scholar] [CrossRef]
- Lehneis, R.; Manske, D.; Thrän, D. Modeling of the German Wind Power Production with High Spatiotemporal Resolution. ISPRS Int. J. Geo-Inf. 2021, 10, 104. [Google Scholar] [CrossRef]
- Gong, C.C.; Ueckerdt, F.; Pietzcker, R.; Odenweller, A.; Schill, W.P.; Kittel, M.; Luderer, G. Bidirectional coupling of a long-term integrated assessment model with an hourly power sector model. arXiv 2022, arXiv:2209.02340. [Google Scholar]
- Seljom, P.; Rosenberg, E.; Schäffer, L.E.; Fodstad, M. Bidirectional linkage between a long-term energy system and a short-term power market model. Energy 2020, 198, 117311. [Google Scholar] [CrossRef]
- Esmaeili Aliabadi, D.; Wulff, N.; Jordan, M.; Cyffka, K.F.; Millinger, M. Soft-coupling energy and power system models to analyze pathways toward a de-fossilized German transport sector. In Operations Research Proceedings 2022; Lecture Notes in Operations Research; Springer: Berlin, Germany, 2023. [Google Scholar]
- Cao, K.K.; Haas, J.; Sperber, E.; Sasanpour, S.; Sarfarazi, S.; Pregger, T.; Alaya, O.; Lens, H.; Drauz, S.R.; Kneiske, T.M. Bridging granularity gaps to decarbonize large-scale energy systems—The case of power system planning. Energy Sci. Eng. 2021, 9, 1052–1060. [Google Scholar] [CrossRef]
- Moezzi, M.; Janda, K.B.; Rotmann, S. Using stories, narratives, and storytelling in energy and climate change research. Energy Res. Soc. Sci. 2017, 31, 1–10. [Google Scholar] [CrossRef]
- Snow, T.; Murikumthara, D.; Dusseldorp, T.; Fyfe, R.; Wolff, L.; McCracken, J. Storytelling for Systems Change: Insights from the Field. Centre for Public Impact. 2021. Available online: https://www.centreforpublicimpact.org/partnering-for-learning/storytelling-for-systems-change (accessed on 16 May 2023).
- Buschmann, S.; Hoffmann, P.; Agarwal, A.; Marwan, N.; Nocke, T. GPU-based, interactive exploration of large spatiotemporal climate networks. Chaos Interdiscip. J. Nonlinear Sci. 2023, 33, 043129. [Google Scholar] [CrossRef]
- Bai, X.; White, D.; Sundaram, D. Visual intelligence density: Definition, measurement, and implementation. In Proceedings of the 10th International Conference NZ Chapter of the ACM’s Special Interest Group on Human-Computer Interaction, Auckland, New Zealand, 6–7 July 2009; pp. 93–100. [Google Scholar]
- Bai, X.; Sundaram, D.; White, D. Towards a flexible user-centred visual presentation approach. In Proceedings of the PACIS 2015, Singapore, 5–9 July 2015; p. 10. [Google Scholar]
- Ellenbeck, S.; Lilliestam, J. How modelers construct energy costs: Discursive elements in energy system and integrated assessment models. Energy Res. Soc. Sci. 2019, 47, 69–77. [Google Scholar] [CrossRef]
- Messner, S.; Strubegger, M. User’s Guide for MESSAGE III; IIASA: Laxenburg, Austria, 1995. [Google Scholar]
- Huppmann, D.; Gidden, M.; Fricko, O.; Kolp, P.; Orthofer, C.; Pimmer, M.; Kushin, N.; Vinca, A.; Mastrucci, A.; Riahi, K.; et al. The MESSAGEix Integrated Assessment Model and the ix modeling platform (ixmp): An open framework for integrated and cross-cutting analysis of energy, climate, the environment, and sustainable development. Environ. Model. Softw. 2019, 112, 143–156. [Google Scholar] [CrossRef]
- Gils, H.C.; Scholz, Y.; Pregger, T.; de Tena, D.L.; Heide, D. Integrated modelling of variable renewable energy-based power supply in Europe. Energy 2017, 123, 173–188. [Google Scholar] [CrossRef] [Green Version]
- Gargiulo, M.; Vailancourt, K.; de Miglio, R. Documentation for the TIMES model part IV. In IEA Energy Technology Systems Analysis Programme; IEA: Paris, France, 2016; pp. 1–121. [Google Scholar]
- Aliabadi, D.E.; Thrän, D.; Bezama, A.; Avsar, B. A systematic analysis of bioenergy potentials for fuels and electricity in Turkey: A bottom-up modeling. In Transitioning to Affordable and Clean Energy; MDPI: Basel, Switzerland, 2022; p. 295. [Google Scholar]
- Heaps, C. An Introduction to LEAP; Stockholm Environment Institute: Stockholm, Sweden, 2008; pp. 1–16. [Google Scholar]
- Parzen, M.; Abdel-Khalek, H.; Fedotova, E.; Mahmood, M.; Frysztacki, M.M.; Hampp, J.; Franken, L.; Schumm, L.; Neumann, F.; Poli, D.; et al. PyPSA-Earth. A new global open energy system optimization model demonstrated in Africa. Appl. Energy 2023, 341, 121096. [Google Scholar] [CrossRef]
- Barnes, T.; Shivakumar, A.; Brinkerink, M.; Niet, T. OSeMOSYS Global, an open-source, open data global electricity system model generator. Sci. Data 2022, 9, 623. [Google Scholar] [CrossRef] [PubMed]
- Howells, M.; Rogner, H.; Strachan, N.; Heaps, C.; Huntington, H.; Kypreos, S.; Hughes, A.; Silveira, S.; DeCarolis, J.; Bazillian, M.; et al. OSeMOSYS: The open source energy modeling system: An introduction to its ethos, structure and development. Energy Policy 2011, 39, 5850–5870. [Google Scholar] [CrossRef]
- Alhamwi, A.; Medjroubi, W.; Vogt, T.; Agert, C. GIS-based urban energy systems models and tools: Introducing a model for the optimisation of flexibilisation technologies in urban areas. Appl. Energy 2017, 191, 1–9. [Google Scholar] [CrossRef]
- Lambert, T.; Gilman, P.; Lilienthal, P. Micropower system modeling with HOMER. In Integration of Alternative Sources of Energy; Wiley: Hoboken, NJ, USA, 2006; pp. 379–418. [Google Scholar]
- Lilienthal, P.; Lambert, T.; Gilman, P. Computer Modeling of Renewable Power Systems. In Encyclopedia of Energy; Cleveland, C.J., Ed.; Elsevier: New York, NY, USA, 2004; pp. 633–647. [Google Scholar] [CrossRef]
- Marnay, C.; Venkataramanan, G.; Stadler, M.; Siddiqui, A.S.; Firestone, R.; Chandran, B. Optimal Technology Selection and Operation of Commercial-Building Microgrids. IEEE Trans. Power Syst. 2008, 23, 975–982. [Google Scholar] [CrossRef]
- Stadler, M.; Kloess, M.; Groissböck, M.; Cardoso, G.; Sharma, R.; Bozchalui, M.C.; Marnay, C. Electric storage in California’s commercial buildings. Appl. Energy 2013, 104, 711–722. [Google Scholar] [CrossRef] [Green Version]
- Cardoso, G.; Stadler, M.; Bozchalui, M.C.; Sharma, R.; Marnay, C.; Barbosa-Póvoa, A.; Ferrão, P. Optimal investment and scheduling of distributed energy resources with uncertainty in electric vehicle driving schedules. Energy 2014, 64, 17–30. [Google Scholar] [CrossRef]
- Connolly, D.; Lund, H.; Mathiesen, B.V.; Østergaard, P.A.; Möller, B.; Nielsen, S.; Ridjan, I.; Hvelplund, F.; Sperling, K.; Karnøe, P.; et al. Smart Energy Systems: Holistic and Integrated Energy Systems for the era of 100% Renewable Energy. In Smart Energy Systems; Report; Aalborg University: Aalborg, Denmark, 2013. [Google Scholar]
- Lund, H.; Thellufsen, J.Z.; Østergaard, P.A.; Sorknæs, P.; Skov, I.R.; Mathiesen, B.V. EnergyPLAN—Advanced analysis of smart energy systems. Smart Energy 2021, 1, 100007. [Google Scholar] [CrossRef]
- Aliabadi, D.E.; Chan, K.; Jordan, M.; Millinger, M.; Thrän, D. Abandoning the Residual Load Duration Curve and Overcoming the Computational Challenge. In Proceedings of the 2022 Open Source Modelling and Simulation of Energy Systems (OSMSES), Aachen, Germany, 4–5 April 2022; pp. 1–6. [Google Scholar]
- Millinger, M.; Tafarte, P.; Jordan, M.; Musonda, F.; Chan, K.; Meisel, K.; Aliabadi, D.E. A model for cost-and greenhouse gas optimal material and energy allocation of biomass and hydrogen. SoftwareX 2022, 20, 101264. [Google Scholar] [CrossRef]
- Avsar, B.; Aliabadi, D.E.; Aliabadi, E.E.; Yousefnezhad, R. Academic presenter: A new storytelling presentation software for academic purposes. arXiv 2016, arXiv:1607.06979. [Google Scholar] [CrossRef]
- Avşar, B.; Aliabadi, D.E. Parallelized neural network system for solving Euclidean traveling salesman problem. Appl. Soft Comput. 2015, 34, 862–873. [Google Scholar] [CrossRef]
- Avsar, B.; Aliabadi, D.E.; Aliabadi, E.E. TSP Solver: An Integrated Framework for Solving Traveling Salesman Problems Consistent with TSPLIB. In Proceedings of the FSDM, Hualien, Taiwan, 24–27 November 2017; pp. 70–78. [Google Scholar]
- Aliabadi, D.E.; Avşar, B.; Yousefnezhad, R.; Aliabadi, E.E. Investigating global language networks using Google search queries. Expert Syst. Appl. 2019, 121, 66–77. [Google Scholar] [CrossRef]
- Avşar, B.; Esmaeilialiabadi, D. Identification of microRNA elements from genomic data of European hazelnut (Corylus avellana L.) and its close relatives. Plant Omics 2017, 10, 190–196. [Google Scholar] [CrossRef] [Green Version]
- Avsar, B.; Esmaeili Aliabadi, D. miRCurator: A rapid curation and analysis tool for plant microRNA studies. bioRxiv 2023. [Google Scholar] [CrossRef]
- Fontanini, M. Game Development with SlimDX; Packt Publishing: Birmingham, UK, 2013. [Google Scholar]
- Chou, P.N.; Chang, C.C.; Lu, P.F. Prezi versus PowerPoint: The effects of varied digital presentation tools on students’ learning performance. Comput. Educ. 2015, 91, 73–82. [Google Scholar] [CrossRef]
- Chappin, E. Teaching Highly Intelligent Primary School Kids Energy System Complexity. Review of Artificial Societies and Social Simulation. 2023. Available online: https://rofasss.org/2023/04/19/teachcomplex (accessed on 19 April 2023).
- Roam, D. The Back of the Napkin (Expanded Edition): Solving Problems and Selling Ideas with Pictures; Portfolio: Edmonton, AL, Canada, 2013. [Google Scholar]
- Lee, B.; Kazi, R.H.; Smith, G. SketchStory: Telling more engaging stories with data through freeform sketching. IEEE Trans. Vis. Comput. Graph. 2013, 19, 2416–2425. [Google Scholar]
- Thrän, D. Naturschutzfachliches Monitoring des Ausbaus der erneuerbaren Energien im Strombereich und Entwicklung von Instrumenten zur Verminderung der Beeintràchtigung von Natur und Landschaft (“EE-Monitor”). 2020. Available online: https://webapp.ufz.de/ee-monitor/ (accessed on 16 May 2023).
- FederalNetworkAgency (BNetzA). Core Energy Market Data Register (MaStR). Available online: www.marktstammdatenregister.de/MaStR/ (accessed on 16 May 2023).
- Craig, M.T.; Wohland, J.; Stoop, L.P.; Kies, A.; Pickering, B.; Bloomfield, H.C.; Browell, J.; de Felice, M.; Dent, C.J.; Deroubaix, A.; et al. Overcoming the disconnect between energy system and climate modeling. Joule 2022, 6, 1405–1417. [Google Scholar] [CrossRef]
- Blickensdörfer, L.; Schwieder, M.; Pflugmacher, D.; Nendel, C.; Erasmi, S.; Hostert, P. National-Scale cRop Type Maps for Germany from Combined Time Series of Sentinel-1, Sentinel-2 and Landsat 8 Data (2017, 2018 and 2019). 2021. Available online: https://zenodo.org/record/5153047 (accessed on 16 May 2023). [CrossRef]
- Blickensdörfer, L.; Oehmichen, K.; Pflugmacher, D.; Kleinschmit, B.; Hostert, P. Dominant Tree Species for Germany (2017/2018). 2022. Available online: https://www.openagrar.de/receive/openagrar_mods_00084346 (accessed on 16 May 2023).
- Sikos, L. Web Standards: Mastering HTML5, CSS3, and XML; Apress: New York, NY, USA, 2014. [Google Scholar]
- Smith, B.; Prentice, I.C.; Sykes, M.T. Representation of vegetation dynamics in the modelling of terrestrial ecosystems: Comparing two contrasting approaches within European climate space. Glob. Ecol. Biogeogr. 2001, 32, 621–637. [Google Scholar] [CrossRef]
- Bussieck, M.R.; Meeraus, A. General algebraic modeling system (GAMS). In Modeling Languages in Mathematical Optimization; Springer: Berlin/Heidelberg, Germany, 2004; pp. 137–157. [Google Scholar]
- Brown, T.; Mann, B.; Ryder, N.; Subbiah, M.; Kaplan, J.D.; Dhariwal, P.; Neelakantan, A.; Shyam, P.; Sastry, G.; Askell, A.; et al. Language models are few-shot learners. Adv. Neural Inf. Process. Syst. 2020, 33, 1877–1901. [Google Scholar]
- Aliabadi, D.E.; Chan, K. The emerging threat of artificial intelligence on competition in liberalized electricity markets: A deep Q-network approach. Appl. Energy 2022, 325, 119813. [Google Scholar] [CrossRef]
- Nitsch, F.; Schimeczek, C.; Nienhaus, K.; Frey, U.; Sperber, E.; Sarfarazi, S.; Kochems, J.; El Ghazi, A.A. AMIRIS-The Open Agent-based Market Model: How to get involved and profit from our model. In Proceedings of the Openmod Workshop, Laxenburg, Austria, 22–24 March 2023. [Google Scholar]
- Flato, G.; Marotzke, J.; Abiodun, B.; Braconnot, P.; Chou, S.C.; Collins, W.; Cox, P.; Driouech, F.; Emori, S.; Eyring, V.; et al. Evaluation of climate models. In Climate Change 2013: The Physical Science Basis. Contribution of Working Group I to the Fifth Assessment Report of the Intergovernmental Panel on Climate Change; Cambridge University Press: Cambridge, UK, 2014; pp. 741–866. [Google Scholar]
- Jacob, D.; Podzun, R. Sensitivity studies with the regional climate model REMO. Meteorol. Atmos. Phys. 1997, 63, 119–129. [Google Scholar] [CrossRef]
- Fischer, R.; Knapp, N.; Bohn, F.; Shugart, H.H.; Huth, A. The relevance of forest structure for biomass and productivity in temperate forests: New perspectives for remote sensing. Surv. Geophys. 2019, 40, 709–734. [Google Scholar] [CrossRef]
Figure 1.
Schematic of BENOPTex inputs and outputs.

Figure 2.
Schematic diagram of an ideal UI that takes into account the climate, land, and underground resources change over time. The pink cylinders represent energy infrastructures, such as biogas power plants.
Figure 2.
Schematic diagram of an ideal UI that takes into account the climate, land, and underground resources change over time. The pink cylinders represent energy infrastructures, such as biogas power plants.

Figure 3.
The infinite canvas is displayed in the central panel. The toolbox is highlighted in yellow. Users can insert images and videos or draw on the canvas to tell stories. The green box also shows the system snapshots that capture the system change through time.
Figure 3.
The infinite canvas is displayed in the central panel. The toolbox is highlighted in yellow. Users can insert images and videos or draw on the canvas to tell stories. The green box also shows the system snapshots that capture the system change through time.

Figure 4.
Using a digitizer to draw on the map. It displays that there are not enough biogas power plants located near agricultural lands and the three most populated cities in Saxony.
Figure 4.
Using a digitizer to draw on the map. It displays that there are not enough biogas power plants located near agricultural lands and the three most populated cities in Saxony.

Figure 5.
Scheme for generating electricity production data of renewable energy facilities by ReSTEP required as input information for ESOMs.
Figure 5.
Scheme for generating electricity production data of renewable energy facilities by ReSTEP required as input information for ESOMs.

Figure 6.
The flow of information from databases to the solver and the online and offline visualizer.
Figure 6.
The flow of information from databases to the solver and the online and offline visualizer.


Table 1.
Comparing reviewed energy models (alphabetically sorted) concerning the model characteristics and associated interface. Dash lines mean that no information is found related to that specific dimension.
Table 1.
Comparing reviewed energy models (alphabetically sorted) concerning the model characteristics and associated interface. Dash lines mean that no information is found related to that specific dimension.
| Model | Programming Technique | Back-End Language | Front-End Language | User Interface | Spatial Visualization | Integrated Information Dissemination | Storytelling |
|---|---|---|---|---|---|---|---|
| BENOPT | LP | GAMS | MATLAB | MATLAB | No | No | No |
| DER-CAM | MILP | GAMS | .NET | DER-CAM desktop | No | Yes | No |
| EnergyPLAN | Simulation | Delphi/Pascal | Delphi/Pascal | EnergyPLAN | No | No | No |
| FlexGIS | Simulation/LP | oemof.solph | Python/Java | CL | Yes | No | No |
| HOMER | Simulation | - | - | - | Yes | - | No |
| LEAP | Heuristics | - | - | LEAP | Yes | - | No |
| MARKAL | LP | GAMS | - | CL | No | No | No |
| MESSAGE | MILP | GAMS | - | CL | No | No | No |
| MESSAGEix | MILP | GAMS | Python & R | CL & web-based | No | Yes | No |
| OSeMOSYS | LP | GNU | Python | CL | Yes | No | No |
| PyPSA | MILP/LP | Python | Python | CL | Yes | No | No |
| REMix | MILP | GAMS | Python | CL | No | No | No |
| ReSTEP | Simulation | PowerShell | - | CL | No | No | No |
| TIMES | LP | GAMS | VB | VEDA-FE/BE | No | No | No |
| TIMES | LP | GAMS | C#/PostgreSQL | VEDA2.0 | No | Yes | No |
| BENOPTex | LP | GAMS | C# | BENOPTex | Yes | Yes | Yes |
Disclaimer/Publisher’s Note: The statements, opinions and data contained in all publications are solely those of the individual author(s) and contributor(s) and not of MDPI and/or the editor(s). MDPI and/or the editor(s) disclaim responsibility for any injury to people or property resulting from any ideas, methods, instructions or products referred to in the content. |
© 2023 by the authors. Licensee MDPI, Basel, Switzerland. This article is an open access article distributed under the terms and conditions of the Creative Commons Attribution (CC BY) license (https://creativecommons.org/licenses/by/4.0/).
Share and Cite
MDPI and ACS Style
Esmaeili Aliabadi, D.; Manske, D.; Seeger, L.; Lehneis, R.; Thrän, D. Integrating Knowledge Acquisition, Visualization, and Dissemination in Energy System Models: BENOPTex Study. Energies 2023, 16, 5113. https://doi.org/10.3390/en16135113
AMA Style
Esmaeili Aliabadi D, Manske D, Seeger L, Lehneis R, Thrän D. Integrating Knowledge Acquisition, Visualization, and Dissemination in Energy System Models: BENOPTex Study. Energies. 2023; 16(13):5113. https://doi.org/10.3390/en16135113
Chicago/Turabian StyleEsmaeili Aliabadi, Danial, David Manske, Lena Seeger, Reinhold Lehneis, and Daniela Thrän. 2023. "Integrating Knowledge Acquisition, Visualization, and Dissemination in Energy System Models: BENOPTex Study" Energies 16, no. 13: 5113. https://doi.org/10.3390/en16135113
Note that from the first issue of 2016, this journal uses article numbers instead of page numbers. See further details here.