

Financial Analysis of a Desalination–Wastewater Recycle Plant Powered by a DC-DC Photovoltaic-Batteries System on the Aeolian Islands, Italy

1
Independent Researcher, 20832 Desio, Italy
2
Department of Materials Science and Solar Energy Research Centre MIB-SOLAR, University of Milano-Bicocca, Via Cozzi 55, 20125 Milano, Italy
*
Author to whom correspondence should be addressed.
Energies 2023, 16(13), 4935; https://doi.org/10.3390/en16134935
Submission received: 19 April 2023
/
Revised: 18 June 2023
/
Accepted: 22 June 2023
/
Published: 25 June 2023
(This article belongs to the Topic Application of Smart Technologies in Water Resources Management)
Abstract
:The scarcity of drinking water is an increasingly pressing issue in many regions of the world, even in areas up till now considered developed. Climate change deprives many populations of the amount of water necessary for human consumption and traditional crops. Therefore, finding new water sources and making their usage more efficient and able to adapt to new environmental conditions without worsening the situation with further pollution is becoming mandatory. In the case study considered here, set on the Italian island of Vulcano in the Central Mediterranean, we propose the economic analysis and financial sustainability of plants for the desalination and recycled wastewater, powered by a DC-DC photovoltaic tracker system with silicon crystal panels sustained by a daily pack of lithium batteries. We present an estimation of the necessary budget, and propose a mix of traditional and innovative financial instruments to construct and analyse the economic trends of the installations over 30 years, considering the specific area price levels, salaries and interest rates. Finally, through the net present value index, we evaluate the financial sustainability of the entire operation, namely, identifying the circumstances when funding and building these plants in areas as remote as the one considered here is cost-effective.
1. Introduction
The island of Vulcano, which is part of the Aeolian archipelago and under the administration of the Municipality of Lipari and the Region of Sicily, has many characteristics typical of many peripheral Mediterranean areas [1]: a population below 10,000 inhabitants, little building space, economic and social conditions below the national average, serious backwardness in infrastructure and technological development. However, it has an environment extremely favourable for the development of renewable energies, an active involvement of a large part of the population to ensure an improvement in living conditions (prices, wages, services, etc.) and a special interest of the European Union in bridging the gaps in economic and social factors that separate the continent from areas like this that have so far remained on the fringes of development.
The first steps to bring essential services to residents have already been taken in 2013 with the approval of a reverse osmosis (RO) desalinator set to satisfy the necessities of both inhabitants and tourists; the inauguration took place in 2019 after a challenging administrative process and, since then, the island has been able to have access to high-quality controlled drinking water without needing more very expensive weekly supplies via tankers.
Along with this already functioning structure, we will add a sewage treatment plant (not yet existing) and a biaxial tracking solar power plant combined with a DC-DC system of lithium batteries to power both plants for the entire life span of the project (30 years) as an alternative to the only other energy source present, a diesel power plant.
Starting from the already available desalter construction [2] and maintenance [3] costs, we perform an economic analysis comprising these structural additions that aim to make the existing water system more efficient and sustainable both financially and environmentally.
We first introduce the main components of the proposed integrated system and provide a concise technical description of their functionality. Subsequently, we outline the methodology employed to calculate their costs, as well as potential revenues.
This is followed by the identification and exploitation of the most suitable financial instruments available to finance these expenses; subsequently, we introduce the employed index to assess the financial sustainability of the overall project for prospective investors.
Furthermore, we calculate a budget trend encompassing the expected costs and revenues based on various factors such as price levels, wages, and interest rates. These estimates are derived from on-site data and reliable sources.
Finally, we determine a price for the sold water that satisfies the financial sustainability index, accounting for the environmental benefits derived from the monetization of carbon dioxide savings achieved by utilizing renewable sources to power the integrated system.
The primary sources underpinning this forthcoming presentation are derived from our prior study [4] in the same area, albeit with some infrastructural modifications, as well as an article [5] published within this same journal. The latter source provides a solid technical foundation for structuring the engineering aspects of the proposed plant.
2. Materials and Methods
2.1. Integrated Water System: Desalter and Wastewater Purifier
2.1.1. Operating Processes
The desalination and wastewater recovery processes chosen in this project follow almost identical phases with numerous similarities in the technologies: both use pumps to collect the water to be treated (from the sea and from the sewage system) and then gather them in basins where they undergo pre-treatment to free them from physical residues (such as sand or plastics) and chemical substances (such as oils).
Once this process is completed in the desalination plant, the treated sea water is pushed through a membrane system depriving it of any suspended mineral salts and bacterial flora to obtain perfectly distilled water and brine as processing waste, a thick liquid made up of water, salts and microorganisms.
In the purification plant, the sewage water, still full of organic residues, after the pre-treatment must first undergo another type of processing through the introduction of chemical substances and digestion processes in special tanks. This process serves to prevent the development of dangerous toxic substances caused by the action of bacteria and algae present that thrive naturally in urban waste. After a few weeks, the pre-treated and digested wastewater is ready to be pumped through a membrane system that separates the suspended solid components and microorganisms from the final product, water intended for non-human consumption (for example in agriculture); this liquid is free from harmful elements and the resultant waste made by organic residues once dried can be reused both as fertilizer and as fuel.
Lastly, in both plants the water produced is conveyed to collection tanks connected to the city water systems where it undergoes the last chemical processes: the distilled water produced by the desalinator is made potable introducing some additives to obtain drinkable water, and for recycled water small quantities of substances are added to prevent the few bacteria still present from proliferating, making it storable for many months. The brine is eliminated by releasing it into the sea (in a suitable area) and the pre-treatment residues are disposed in waste treatment plants.
2.1.2. Physical Data for Water Production Estimate
In the island simulation we considered the average consumption per inhabitant of its region, equal to about 0.18 m3
[6]. To calculate the correct number of consumers served we used the concept of population equivalent (PE) which incorporates the water consumption of both people and economic activities in a territory. Considering that the area has a strong tourist vocation and a long agricultural tradition, we summed these contingencies with the average number of people present during the year, estimating a daily need for water equal to that of 10,000 PE.
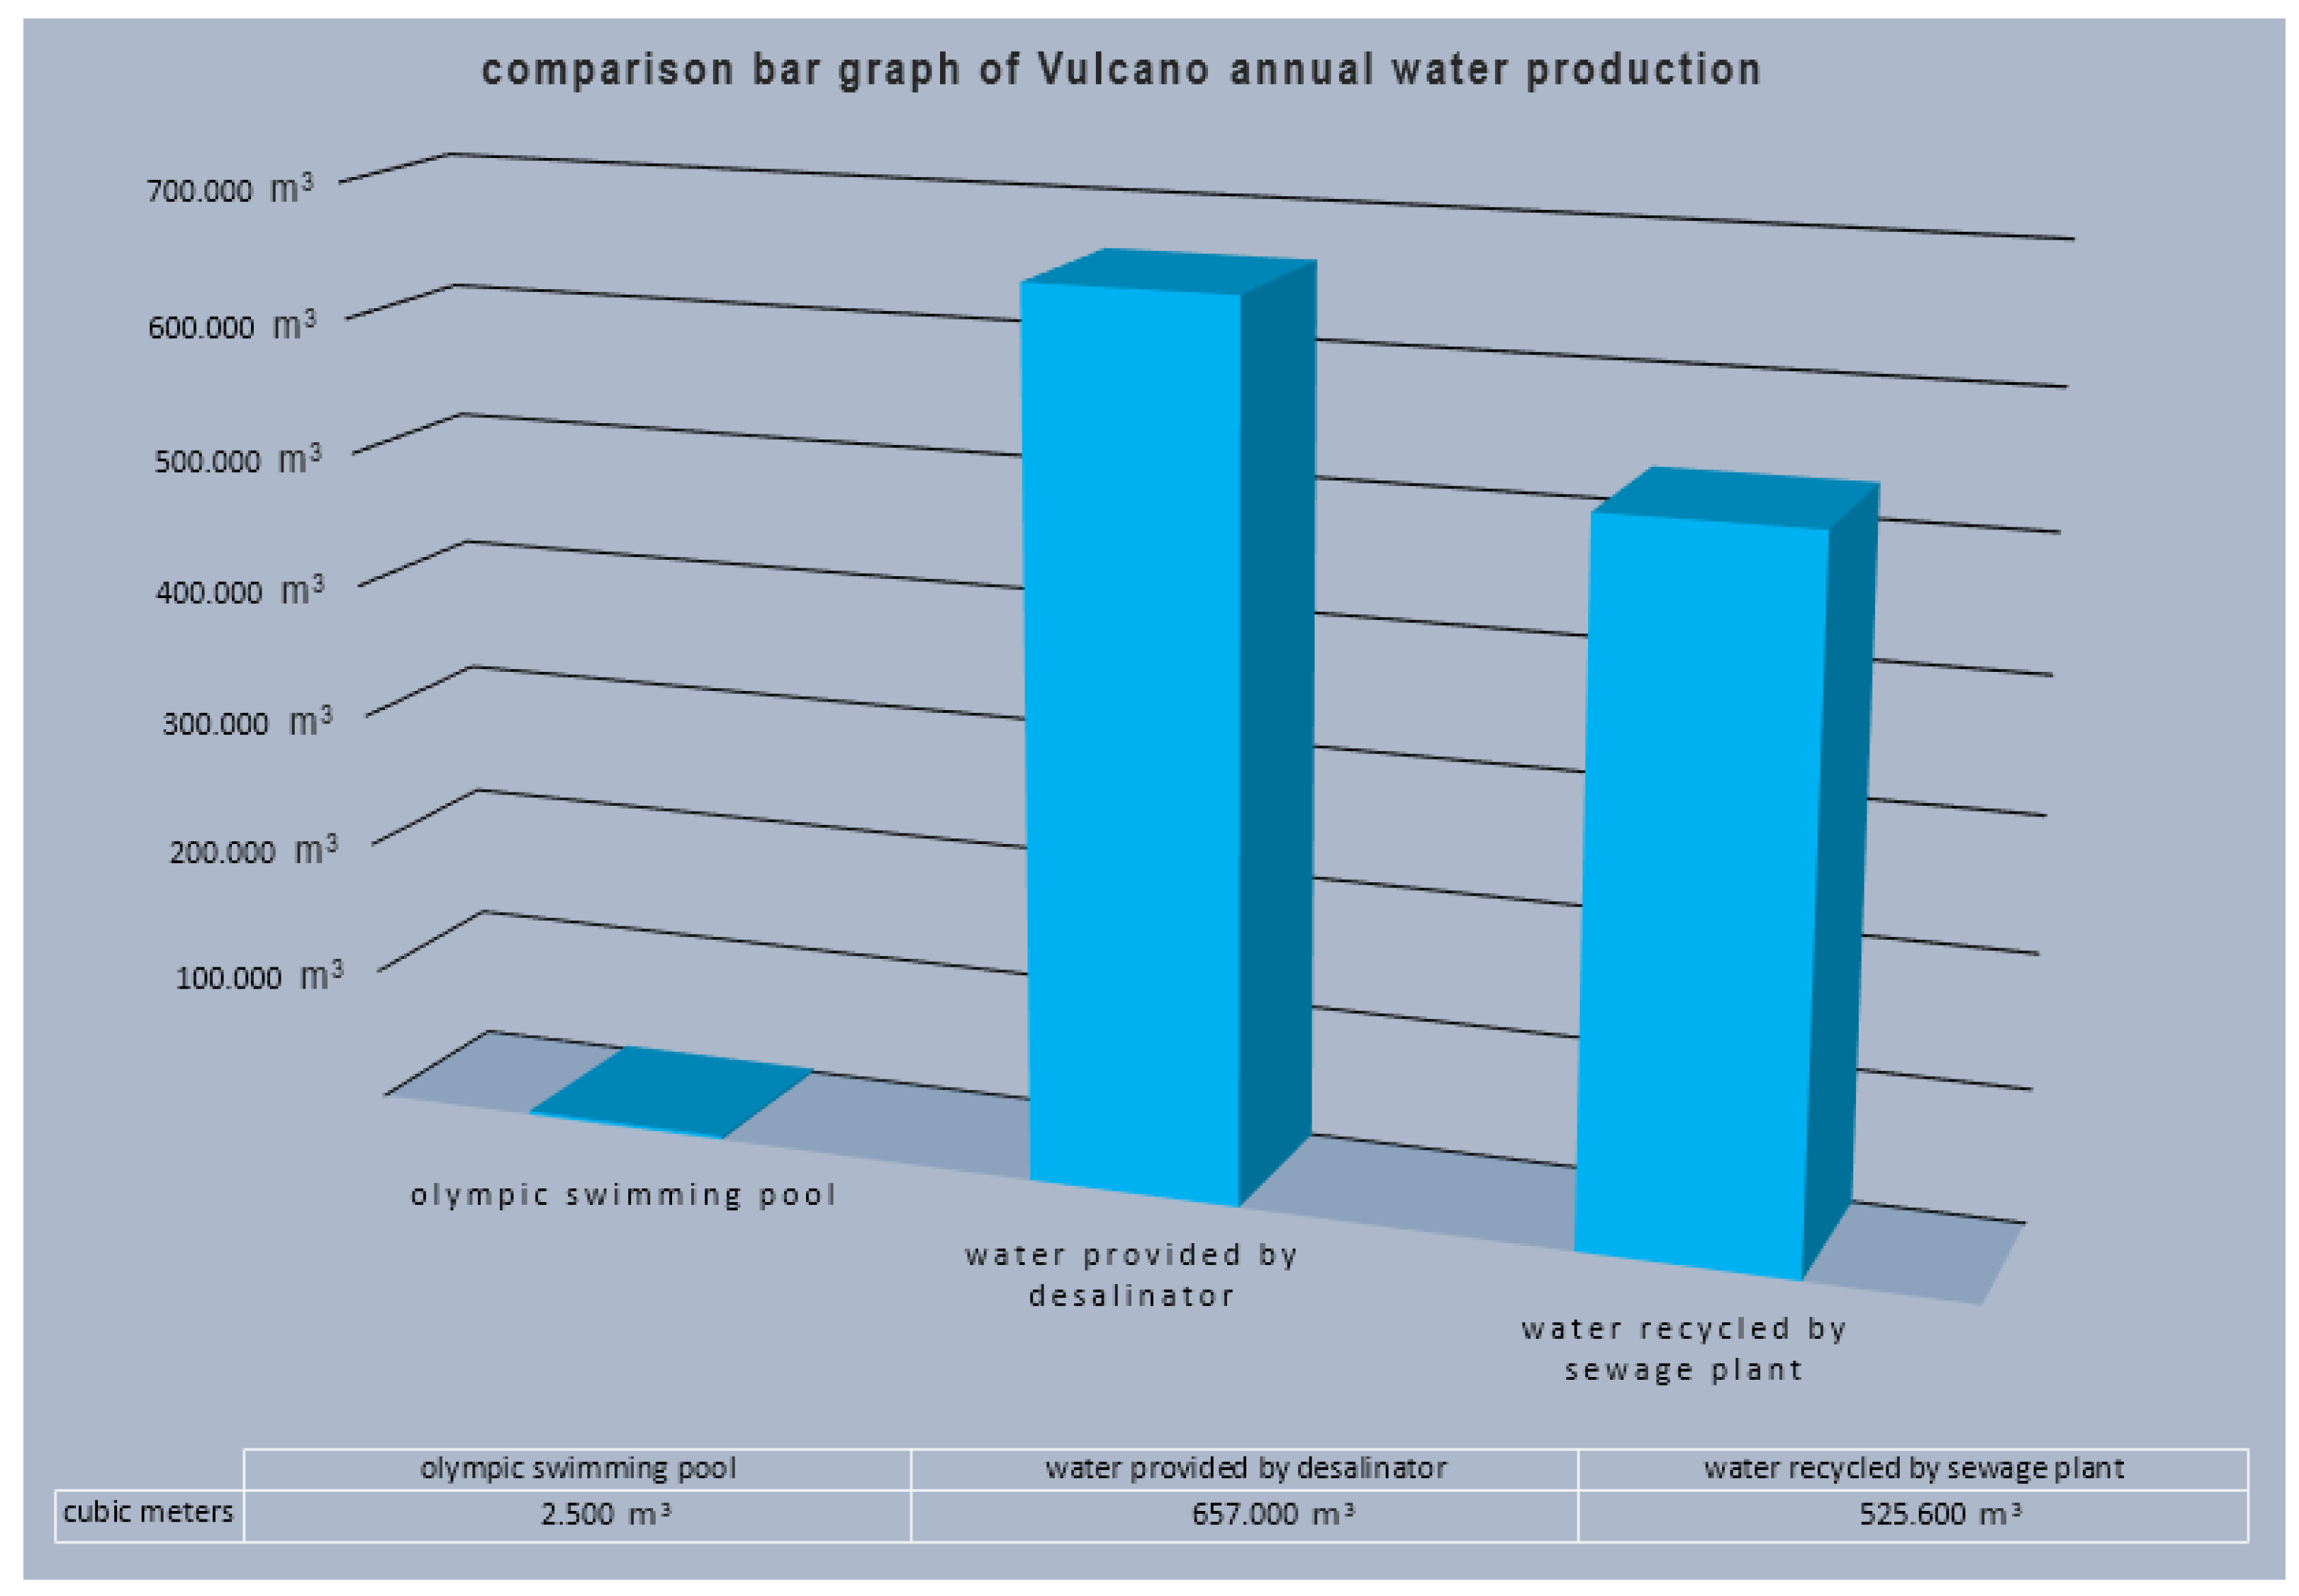
The desalination plant in Vulcano has a nominal daily capacity of 2160 m3 [7], while in the simulation the daily production is equal to 1800 m3. Therefore, the plant operates at around 83% of its maximum capacity. Approximately 657,000 m3 of potable water is produced annually (Figure 1) and distributed through the island’s water system to meet the needs of the island.
Through the data obtained we learnt that the production of 1 m3 of drinking water requires 3.5 kWh of energy, mostly used to operate the pumps that carry the water during the various refining processes. Therefore, we can estimate that annually the water production plant needs at least 2300 MWh of electricity to feed itself. In this article the energy source powering the plant is supplied by photovoltaic (PV) power, a renewable and well-known energy source.
The wastewater purification plant is designed for a maximum load of 10,000 PE: because part of the drinking water produced will be inevitably lost during the transport/storage/use of it. Therefore, even if the desalination plant was forced to operate at its peak capacity (equal to 12,000 PE) the wastewater to be treated would be expressed as a lower percentage, estimated at 80%. In this situation, we estimated that the annual volume of recycled water produced is approximately 525,600 m3 (Figure 1), thus providing large quantities of new hydric resources for the island.
The particular choice of purifier, a membrane bio reactor (MBR) system designed for small islands, imposes a higher average energy consumption compared to other technologies [8]; however, with some modifications the electricity needed can be tempered [9]. Therefore, we estimated an annual energy consumption per PE to be 40 kWh, meaning an annual power supply equal to 400 MWh. Furthermore, the electricity will be provided through a PV green energy source.
2.1.3. Building Costs
Identifying the costs to support the construction of this integrated plant was facilitated by the presence of the recently built desalination plant, whose expenditures were obtained through the documents made available by the public administration.
For the wastewater purification system, we calculated the costs thanks to an exhaustive technical manual from which we drew the necessary economic knowledge to estimate them. Following the proposed model we used the number of PEs and a reference parameter to estimate a reliable figure of the costs: this parameter varies according to the purification technology chosen and the plant sizing. In this case we found that for an MBR system operating autonomously and serving a maximum number of PE equal to 10,000 corresponds to approximately 370 €/PE. Therefore, the estimated cost for the construction of the wastewater treatment plant is €3,700,000.
Table 1 shows all the foreseen expenses at the time of construction (year 0), including taxes and administrative procedures (referring to Italian law).
2.1.4. Operating Costs
Providing a reliable estimate of the annual running costs of this kind of plant is essential to be able to make long-term forecasts during the economic and financial analysis. Herein, we report both real data collected by desalination service operators and data estimated from a series of calculations and forecasts based on sizing and territorial conditions.
Both production plants in this simulation are powered by a purpose-built PV system, and therefore we consider the energy costs subtracted from the annual total expenditure budget. Furthermore, we provide a representative figure of these costs and show the impact they may have in case a non-self-sustained structure is chosen.
For the energy costs of the desalter we refer to the previously calculated annual energy requirements and combine it with a price parameter that relates the energy costs on the electricity market and the MWh consumed: the Prezzo Unico Nazionale (PUN) (single national price) which in 2022 (the last complete year of measurement) was on average 303.95 €/MWh [10].
Knowing that the annual electricity requirement of the desalination plant is approximately 2300 MWh, it is possible to determine the expenditure necessary to support the energy requirement at 700,000 €/year, the largest part of the individual cost items.
For other expenses, we report the data adapted to price levels and wages of the last year (i.e., 2022), also providing details to give a more precise idea of the individual items and the corresponding figures.
Under “salaries” we expect the presence of at least five workers: one manager, one technician and three operators in combination with their ancillary costs (clothing, medical expenses, overtime, etc.).
In the “materials” item we show the costs for the reagents and filters used in the treatment of sea water, together with the costs to clean and periodically replace the osmotic membranes.
“Miscellaneous costs” represent all services for a good quality working life (gardening, cleaning and sanitizing, insurance, stationery and office, digital connections, etc.).
The “laboratory tests” and “routine maintenance” items correspond to more volatile elements of which we can provide an estimate, specifying that they can vary based on the presence or absence of faults and/or anomalous detections in the drinking water produced.
“General expenses” are all possible variations in the previous cost items that can fluctuate and harm the budget if unforeseen. In this case a percentage of 15% of the total of the previously mentioned expenses is used to calculate them.
Finally, “extraordinary expenses” are all the unforeseen costs that could occur in unfavourable conditions that must be accounted for by a good manager. In this case a percentage of 10% of the total of all the previous items is used.
With all the items presented and calculated, Table 2 can be constructed to show the annual operating costs of the desalination plant.
The annual costs of the purifier plant instead have been identified and calculated on a theoretical basis, as there is no plant on the island with the chosen technology (MBR) from which to draw the data.
The energy cost, identified with the same methodology as the desalination plant, is substantial with respect to the other items because the energy consumption of the MBR is higher than other technologies. However, due to the PV plant autonomously compensating for the annual electricity need, this figure was removed from the final budget.
The subsequent items were all calculated using parameters referring to the choice of plant technology and size, which can vary greatly with fluctuation of the PE number served. For example, the item “salaries payment” is the result of the multiplication between the plant size (10,000 PE) and the parameter 16 €/PE/year, including the cost of operating and office personnel.
The next cost taken into consideration relates to both the purchase of reagents used in the treatment of sludge and their disposal, carried out by shipping them to specialized centres. We estimated the parameters for the quantity of waste produced (ex. sludge = 0.06 T/PE/year) and after determining these quantities we multiplied the amount of waste (in tonnes) produced by the expected unit cost for its transportation and disposal, found at 200 €/T. In this way, we calculated both the quantity of necessary reagents (about 0.8 T/year) whose final cost is negligible, and the (large) quantity of sludge and other waste products, which amounts to about 606 T/year. The expenses for their safe disposal are substantial, as shown in the Table 3.
Routine maintenance was calculated based on the plant size and the type of work carried out (electromechanical and civil), determined at 3.45 €/PE/year.
The incidences and plant integrations were calculated using percentages of the total of the costs calculated previously and distributions of expenditure between the different types of works carried out. Given that this topic is very technical and of little relevance to the purpose of this work, we only provide the figures obtained from these estimates.
Finally, general expenses, as in the previous case, refer to all the various costs that a installation must anticipate and manage effectively. Additionally in this case, the figure is calculated with a percentage equal to 15% of the total of all expenses discussed above.
A list of all the cost items was constructed and is presented in Table 3.
2.1.5. Decommissioning Costs
At the end of the estimated life cycle of the integrated water system (30 years) the structures and machineries will be outdated and will require renovations and/or dismantling. For this reason, we foresee a cost item equal to 10% of the total building costs included in the budget at the end of the last year of activity, a figure we estimate to be equal to €2,486,320.
2.2. PV Power Plant
2.2.1. System Operation and Data Collection
There are two viable ways to power the integrated water plant: buy electricity from the energy market or produce it autonomously. Here, we analyse this second possibility allowing us to explore the advantages inherent in the use of a green resource, such as PV, a sector in wide development which can supply large and competitive quantities of energy to many areas of the world combined with precise structural planning. An advantage of electricity production from PV combined with water production systems, such as RO and MBR technology, lies in the recent drastic reduction in energy demand for medium–large plants, as ascertained by various studies [11] and empirical data.
PV is a low-density energy production method, i.e., it cannot supply large quantities of electricity per space used and needs sufficient and constant solar radiation to operate optimally. These intrinsic limits, at the current state of technological development, can be largely attenuated with technical studies and plant engineering choices.
PV systems require large open areas and quality daily sun exposure to be competitive. Therefore, the right installation site must be chosen properly: Vulcano naturally offers, thanks to its geographical location, a large amount of light irradiation with little chance of clouds and rain, guaranteeing long periods of uninterrupted production.
The surface needed to achieve the required electricity production can be reduced with efficient orientation towards the angle of maximum solar radiation intensity. Otherwise, a combination of sensors, AI, and movable support beams can be used to make the panels “track” the apparent movement of the Sun throughout the day, maximizing energy absorption.
The electricity produced during the day must then be immediately consumed: this limitation can be overcome by building a power storage system which preserves the energy for long periods, making it available when needed, i.e., a battery pack.
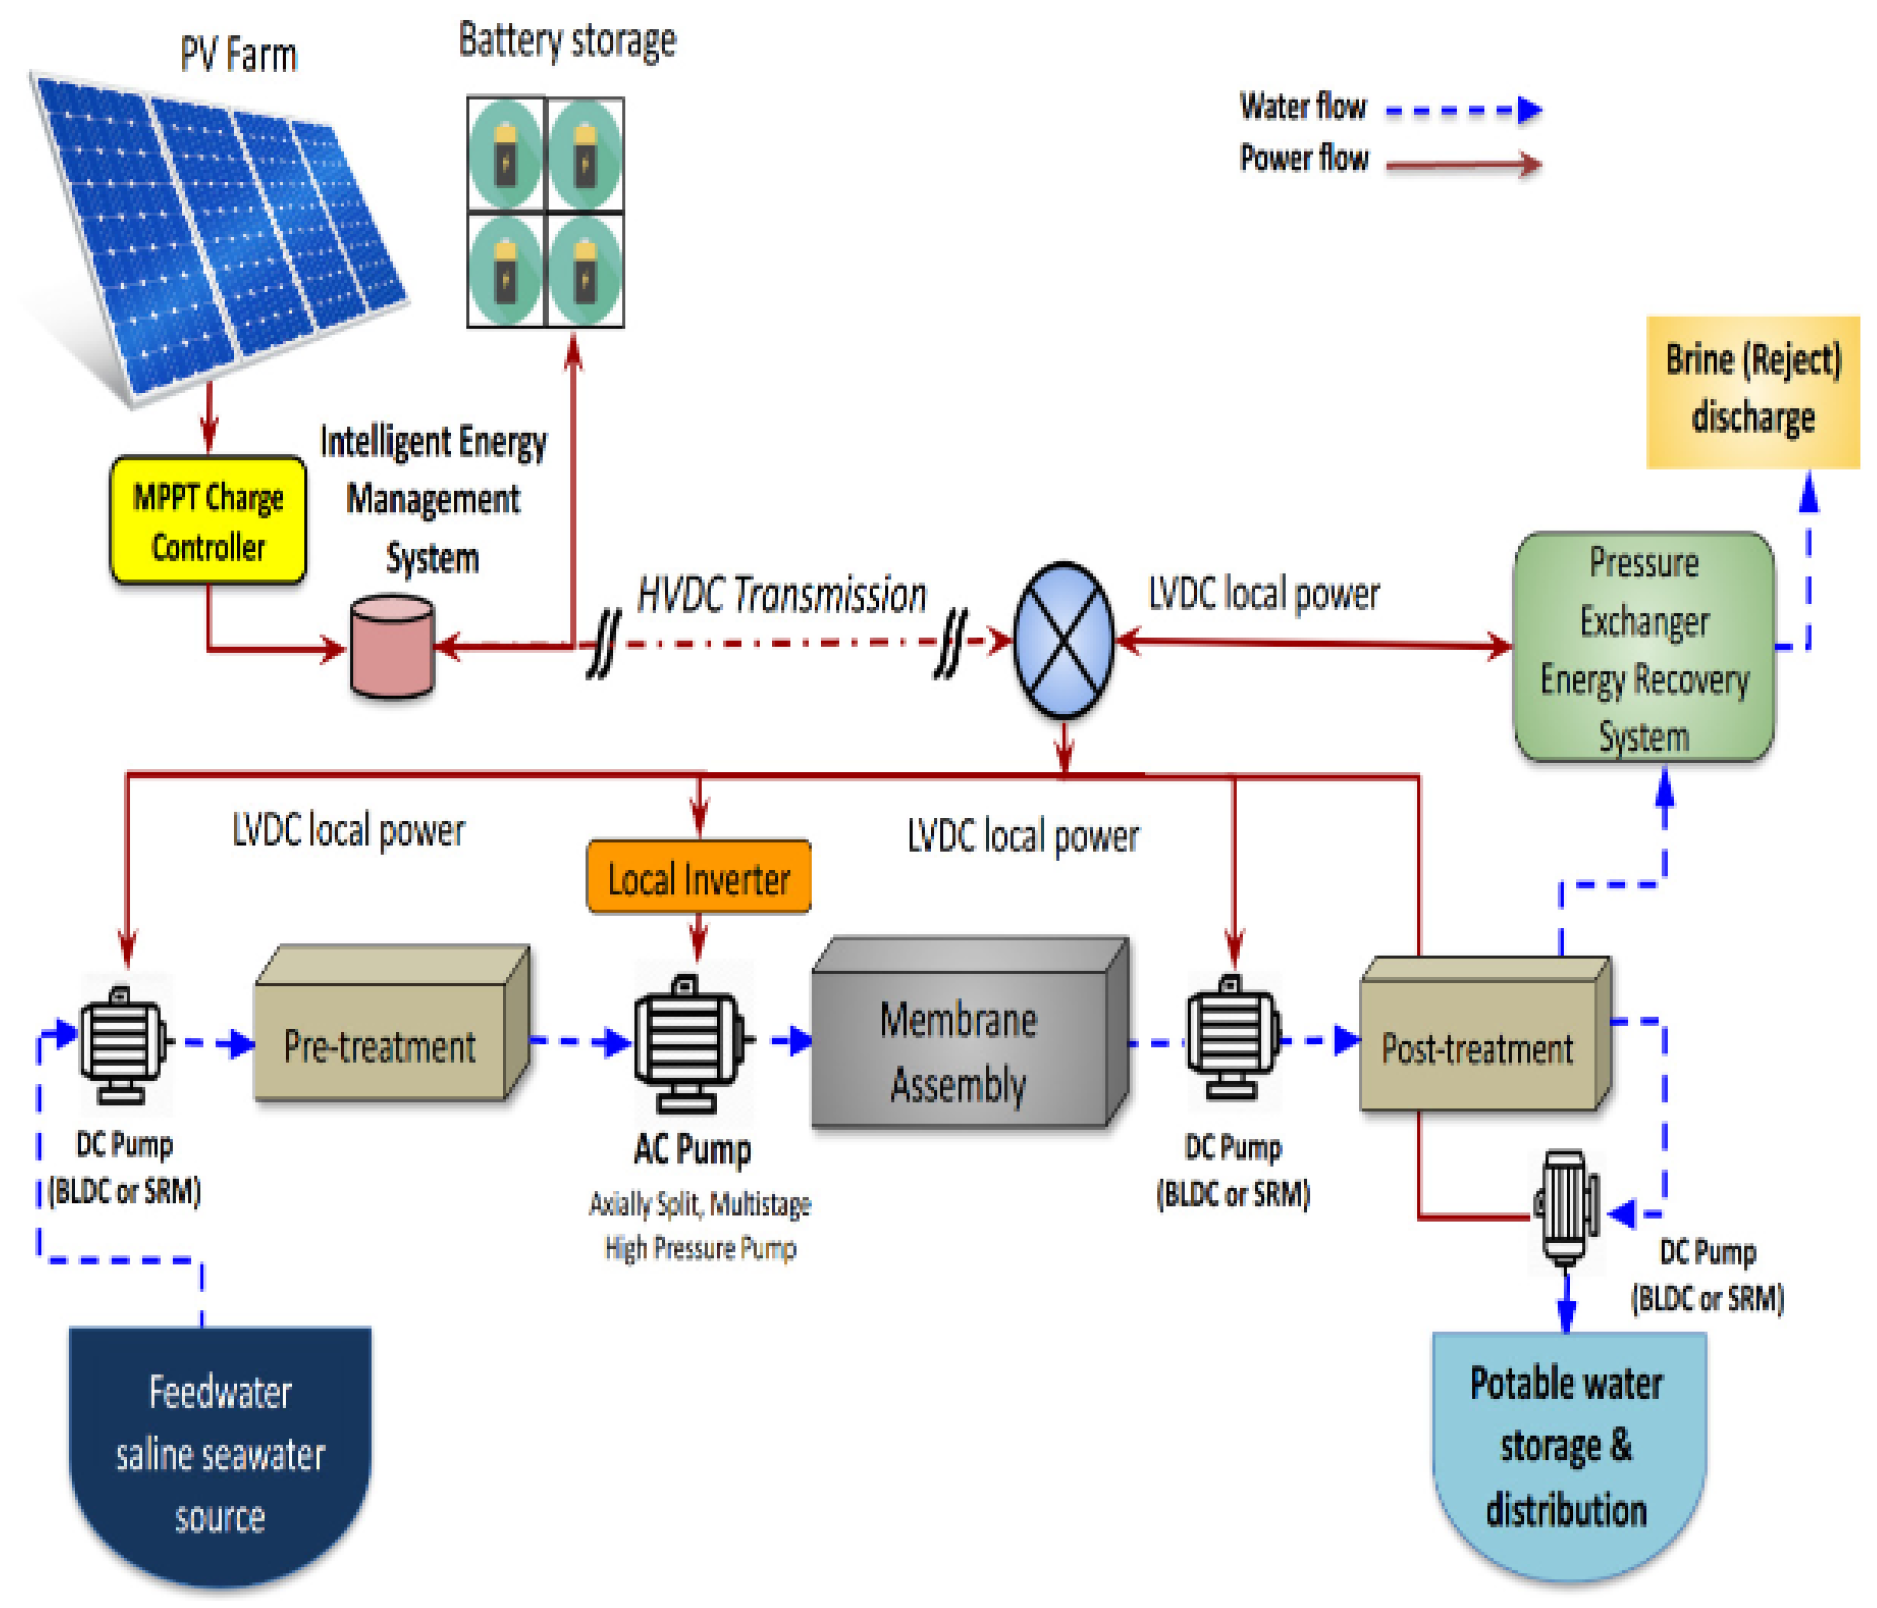
Both systems are built to work in DC and the processes to obtain desalinated water and purified water share the same technology and type of structures. Therefore, a common integrated electrical system can be built to maximize usage and minimize wastage, as shown in Figure 2.
The technologies chosen for this power system are lithium batteries and crystalline silicon panels mounted on a tracker system.
Both are widely tested, moderately efficient, and easily available on the global market with low purchase, installation and maintenance costs [12,13].
Lithium batteries are designed to operate on a daily cycle of at least 18 h and run up to a maximum of 8000 cycles, with a life span of approximately 15 years. The sizing of the batteries is given by the daily demand of the integrated water system increased by 20% due to the depth of discharge, a phenomenon which, if not counteracted, can damage the batteries. In this case, extra energy capacity is added to ensure that the electricity inside the batteries is not completely depleted during the cycle, but a small active part is kept in each cell.
The solar power plant with crystalline silicon modules (with an efficiency of 20%) is sized to meet the daily demand of the production plants for every year of the life cycle. An extra 25% of the energy generated was considered to meet the energy losses due to network engineering and machinery inefficiencies.
Once establishing the daily electricity quantity needed, we used the JRC tool [14], made available by the EU, to calculate the power of the PV farm to feed the plants all the entire year. This calculation is made possible by the continuously updated databases on land conditions (e.g., solar radiation, altitude, temperature, etc.) across Europe, collected both with satellites and ground sensors.
Thus, we found that the required power of the solar station is 2.5 MW with an occupied area of about 12,500 m2, and a size of the lithium batteries of about 11.1 MWh.
2.2.2. Building Costs
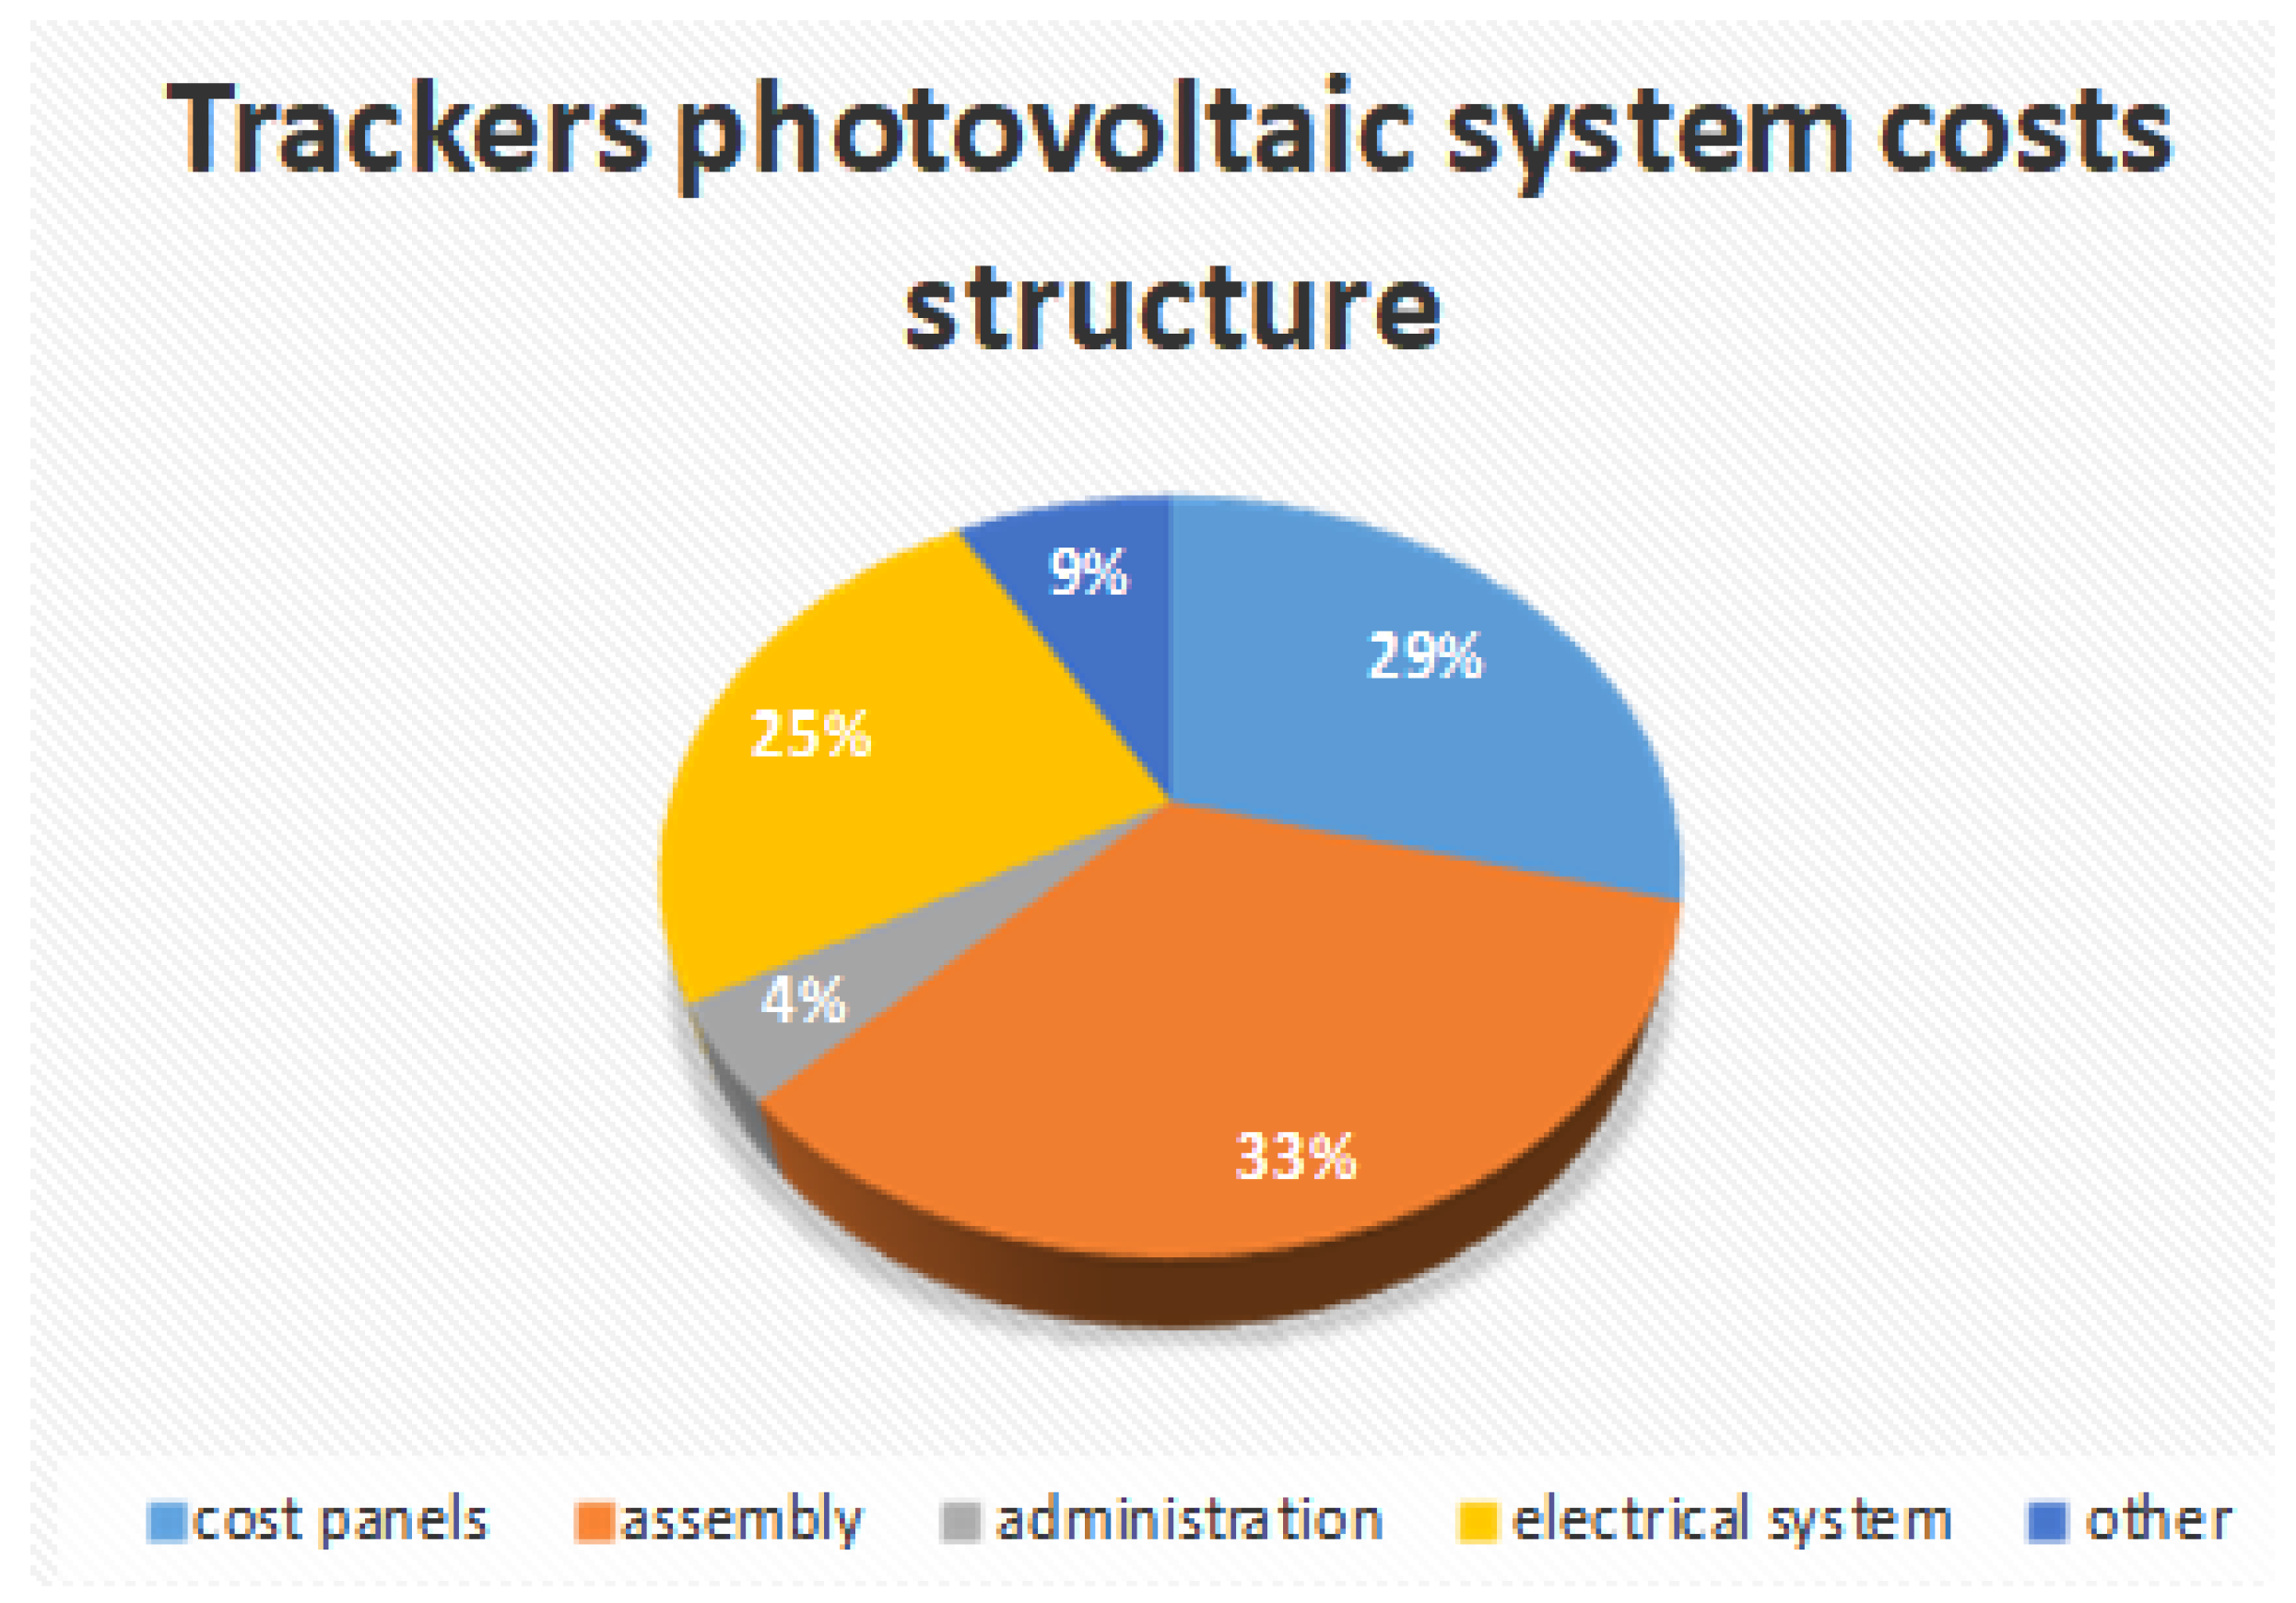
There are various ways to evaluate the costs for the installation of a PV power plant: generally specialized companies should be contacted to acquire estimates or to study similar projects carried out from entities similar both geographically and economically. Here, we follow an alternative path, simpler and more accessible to all. Figure 3 developed through an experimental method, identifying the Italian market prices of the main components of the PV plant (solar panels, bi-axial tracking system and electrical components) and then identifying the average costs between the minimum and maximum prices of these elements over the previous years. To underline its validity, we tested the percentage subdivisions with the current maximum Italian market prices, obtaining a deviation from the simulated results of less than 10%, thus validating the proposed chart subdivision of costs for a tracking PV system installed in Italy for the period 2020–2023.
Using the percentage system presented we can start our calculations from the cost of a m crystalline silicon panel with an efficiency of 20% to obtain the overall costs of the PV plant. With a panel cost of 220 €/m2 and knowing the covered area we calculated a cost of €2,750,000 for the purchase of the panels, equal to 29% of the total cost.
Using a system of proportions and having the other percentages we found the costs of the remaining items, summing them to obtain the total expenditure for the PV farm, equal to approximately €11,650,000.
For the batteries in the first period (Year 0/Year 15) we estimated a price of 200,000 €/MWh for the purchase and installation of the lithium battery storage system. Considering that this expense is expected to decrease as the market expands, we foresee that by Year 15 the price will have fallen by at least 25%, bringing the unit cost to 150,000 €/MWh. Knowing the prices and required size of the battery pack we multiplied them to obtain the expenditures for the round 1 (€2,220,000) and round 2 (€1,665,000), which will be included in the budget.
The list below (Table 4) summarizes all the presented items to show all the costs in the appropriate order.
2.2.3. Operating Costs
The operating costs for this type of system are generally contained thanks to the high reliability of the materials and the quality of the manufacturing techniques of the companies that produce (and guarantee) the components.
In particular, the producers of PV panels almost always include the costs of insurance and extraordinary maintenance in the purchase, leaving the tasks of surveillance, cleaning and ordinary management of the electrical systems to local operators. Despite these advantages, it is always necessary to consider the place chosen to carry out this work. In the case of Vulcano we foresee higher costs than normal due to the isolation of the island for most of the year; therefore, in case of failures, this would produce longer and more expensive service times.
The batteries’ upkeep costs include the maintenance of the digital control systems (to avoid sudden changes in voltage, make the daily charge/discharge cycle more efficient, etc.) as well as temperature regulation and periodic checks by specialized technicians.
The operating costs for the solar power plant can be calculated with a chosen ratio of 15,000 €/MW/year; therefore, we inserted into the budget an average of €37,500 of expenditure per year for maintenance.
The operating costs for the battery system were found by applying 2.5% to the purchase costs, thus identifying an average annual cost of €55,500 for round 1, and an estimated average annual cost of €41,600 for the round 2.
2.3. Financial Instruments
Following the building costs, its necessary to give adequate financial coverage. In this work we chose to provide the perspective of a generic actor (public or private) with no personal liquidity and aims to obtain debt-based investments to finance the project. Two debt instruments were chosen and analysed, a traditional one (such as a bank loan) and an innovative one (such as a green bond).
2.3.1. Financing the Desalination–Wastewater Recycle Plant: A Bank Loan
The first of the instruments identified for this project is a bank loan, the most conventional and well-known by all. The loan is used to fund the construction of the integrated water system and is provided by the European Investment Bank (EIB).
This bank was chosen for various financial, political and geographical convenience reasons. The aim is to involve actors interested in pursuing goals not based exclusively on profit, but also on the environmental benefits [15] of having this kind of infrastructure in the territory. Furthermore, both the lack of a profit goal and the support for sustainable investments in the sector (e.g., energy, water, transport, agriculture, etc.) [16] are present in the EIB statute.
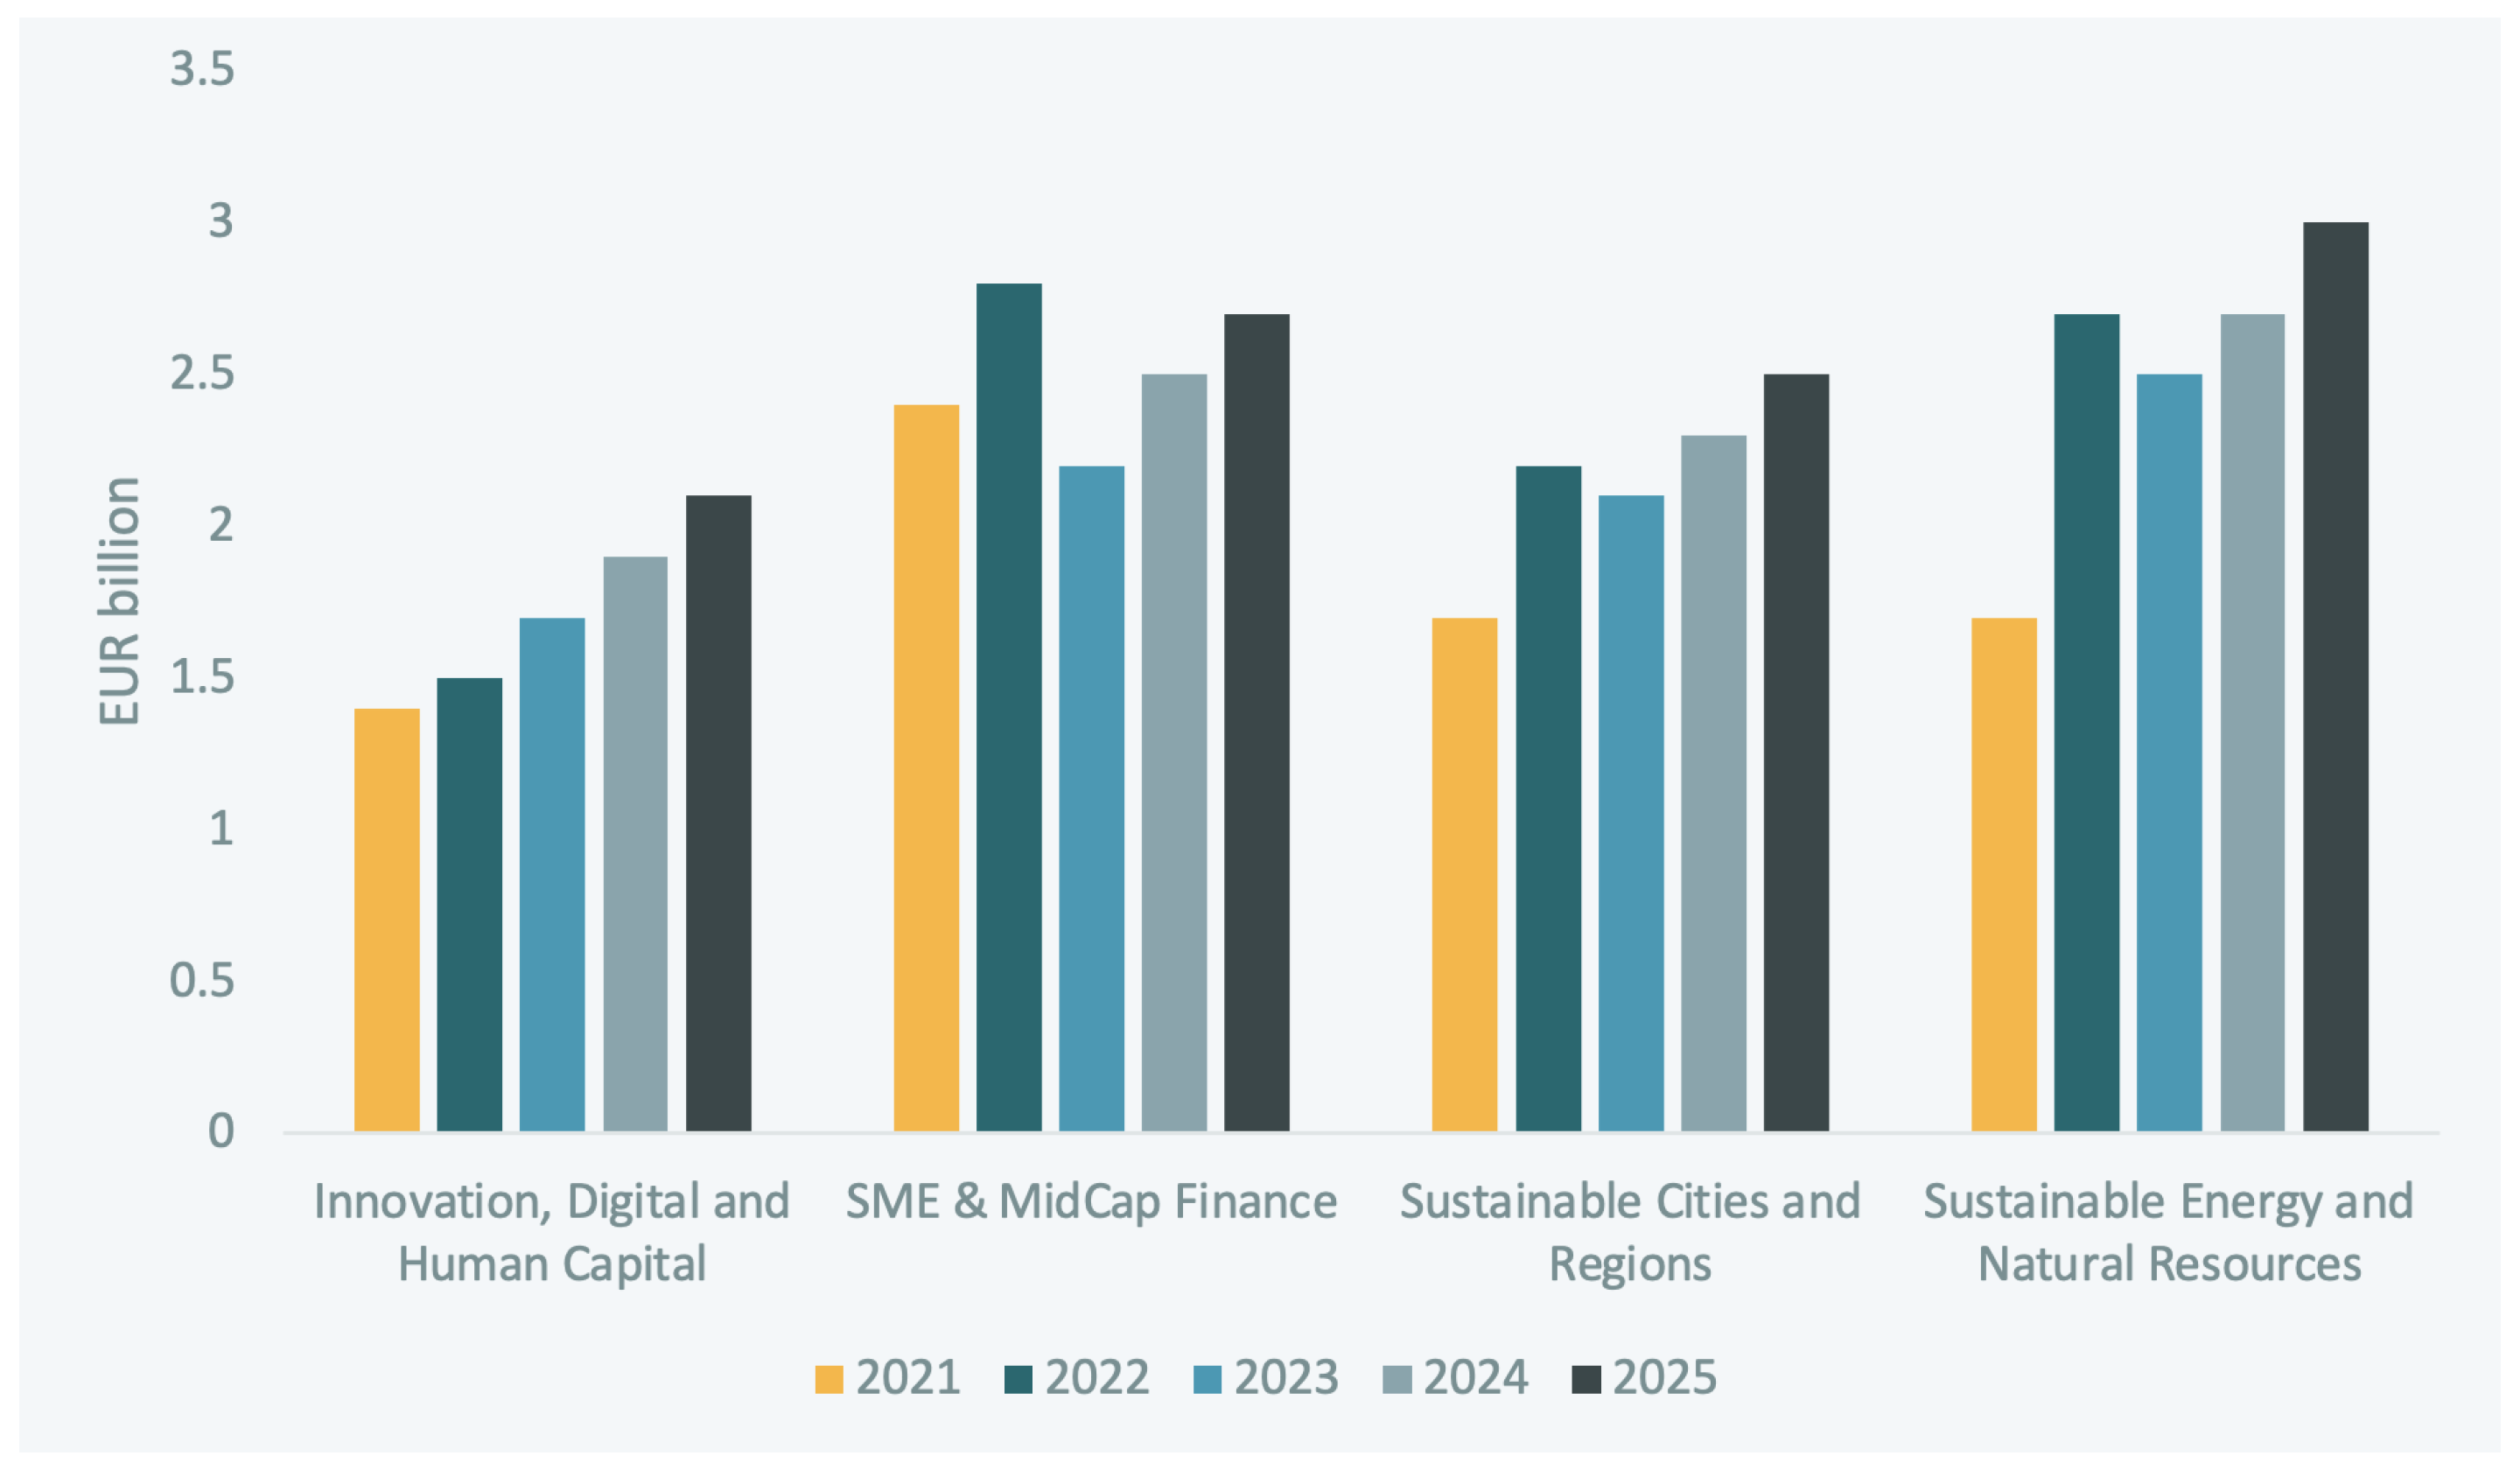
The EIB group is a major European project financier, aiming to reduce inequalities between citizens. In particular, Figure 4 [17] shows the bank’s commitment in supporting investments of billion euros, over the next few years, in sectors heavily involved with the realization of these installations.
A great advantage of the EIB lies in its very low interest rates, its connections with many national/regional banks and the wide possibilities of bargaining on the times and methods for the distribution of these loans. The bank also offers support to public and private entities, without distinction of form but only based on the validity of the projects and compliance with the principles on which it is based.
An aspiring borrower must submit the project to be evaluated by the bank. This includes a description of the entity (public or private), a statement of the purposes of the project, a certified technical and environmental study of the project and a financial analysis that considers the market conditions in that area with credible forecasts for the future [18].
The bank makes its experience and consultancy services available to analyse and support these practices which, if confirmed, ultimately lead to granting the loan. Here, the choice of the EIB as a lending institution depended on the commonality of several factors: the search for very low interest rates and long-term loan repayments (15 years), the particular sector involved (among those directly mentioned in the EIB’s statute), adherence to the bank’s principles concerning the elimination of inequalities (water services available for all citizens) and emission reductions (installations powered by renewable sources).
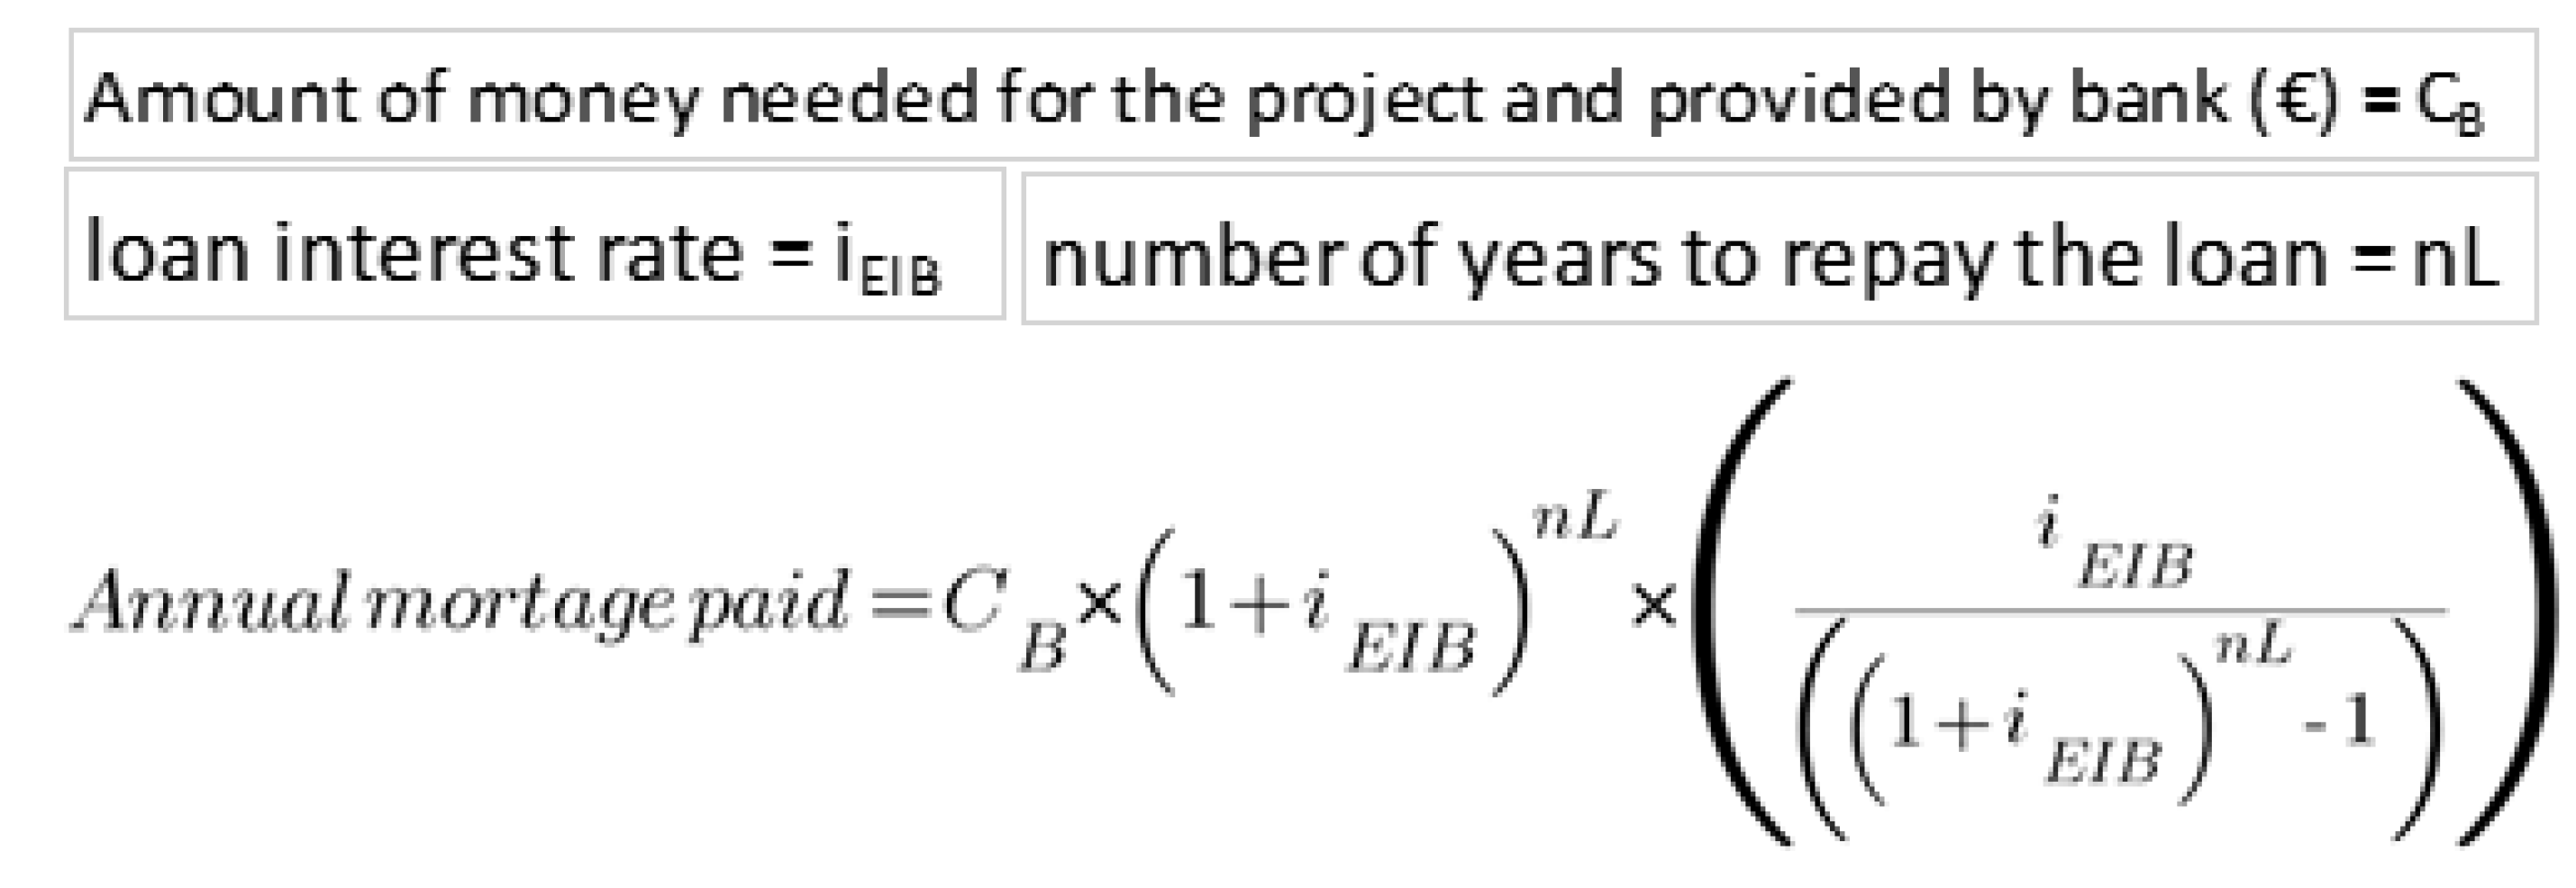
The sum required in this simulation is equal to the cost for the integrated water system construction (€24,863,200), and this part is financed with an EIB loan.
Once the loan amount was determined, an interest rate was agreed upon with the EIB to keep the fee as low as possible (in the proposed case we set an annual interest of 1%). This is feasible because, unlike a commercial bank, the EIB does not operate to make profits but to finance projects addressed to European citizens for goods and services at the lowest price.
While discussing the interest rate, we also determined an agreement with the bank concerning the number of years in which the loan will be repaid. Furthermore, in this case, the availability of the EIB allows us to spread the repayments over a long time so as not to excessively burden the annual balance sheets of the project (in this case we expect to sign a repayment agreement spread over a 15-year period from the plants initial operation).
Finally, the annual mortgage is calculated with the formula described in Figure 5 and the liquidity transferred to the borrower, who will undertake the obligation to repay the debt over the years and in the established manner.
2.3.2. Financing the PV-Batteries System: A Green Bond
A popular instrument used to finance projects is represented by one of the most widespread financial market products: the bond. Bonds are debt securities issued by a company or a public body, and they are sold on the financial market, usually through a double step.
In an initial phase, the price of the bond and the interest rate are negotiated between the company and a financial institution with experience in dealing with these securities (such as a bank); following the acceptance of the conditions, the bank provides the required liquidity and creates the bonds, which they have full possession of (the primary market).
In the second phase, the bonds are sold by the financial institution to private investors, negotiating new terms with them; in this phase, the company has usually no say in this trading (the secondary market). Bonds, along with stocks and loans, are the most popular financing tools to raise the capital needed to carry out projects; each offers different advantages and disadvantages for investors. Unlike stocks, bonds do not guarantee buyer control over the company on which they finance the operations; however, at the same time the bondholders have a pre-emption right on the shares for the debt repayment.
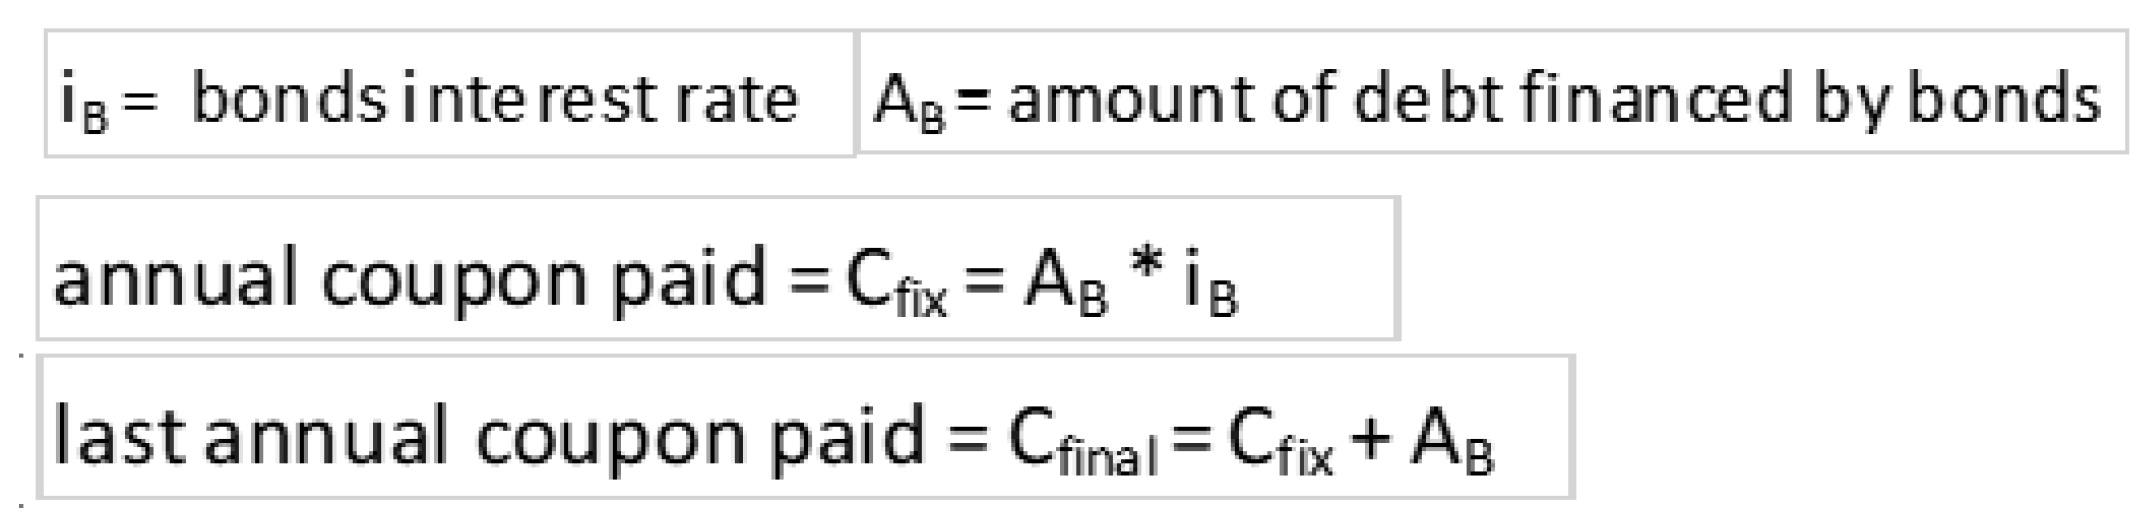
In the bank loan, the sum borrowed is returned over a period of time in individual instalments plus interest (mortage), in the bond the repayment consists of a periodic amount of money (coupon) paid to the holders of the security and, at the end of the last repayment period, the full sum of the debt issued plus the coupon is refunded. Figure 6 shows an example of how to calculate an annual coupon:
The green bond is essentially no different from a normal bond from a financial perspective and has the same contractual and currency characteristics described above. What distinguishes its is the object of the funds, while a bond can finance any operations of a company that decides to issue it, for a green bond to be granted it must include in its primary objectives investments that contribute to environmental protection and the development of a sustainable economy [19].
Currently, there is no standardized legislation on how to distinguish a green bond from a normal bond but the guidelines of the ICMA (International Capital Market Association) are the most widespread and accepted. These guidelines [20] are briefly summarized in four points:
- 1
- Use of proceeds: a series of sectors that indicate what can be financed with a green bond (e.g., PV farms and related batteries energy storage, biodiversity conservation, etc.).
- 2
- Process of project evaluation and selection: the issuer of green bonds must provide a series of documents and evaluations to investors demonstrating the use of the proceeds to favour not only the financial stability of the project but also the environmental protection that it ensures.
- 3
- Management of proceeds: the profits from the financed projects should be credited to an account that can always be consulted by the investors and updated for any changes that influence the project and its budget.
- 4
- Reporting: transparency in this type of bond should be exemplary and the issuer should regularly produce reports that keep investors updated on the project’s activities, its (positive) impact on the environment and the liquidity use in relation to other funding sources.
The green bond has some advantages over a traditional one:
- It is more socially accepted by people compared to financial operations involved in polluting or questionable sectors, and for this reason, it attracts a very wide selection of investors eager to keep themselves informed about the results of their investments.
- Investors tend to lengthen the maturity terms for projects financed with this instrument, making them comparable to long-term ones such as government bonds.
- The green bond, especially in project evaluation and reporting activities, is not dominated by a few specialized agencies as in conventional bonds (for example Moody’s, Standard & Poors, Fitch) but it is driven by many smaller companies that make these activities more transparent, thus increasing the investors’ confidence when exploited.
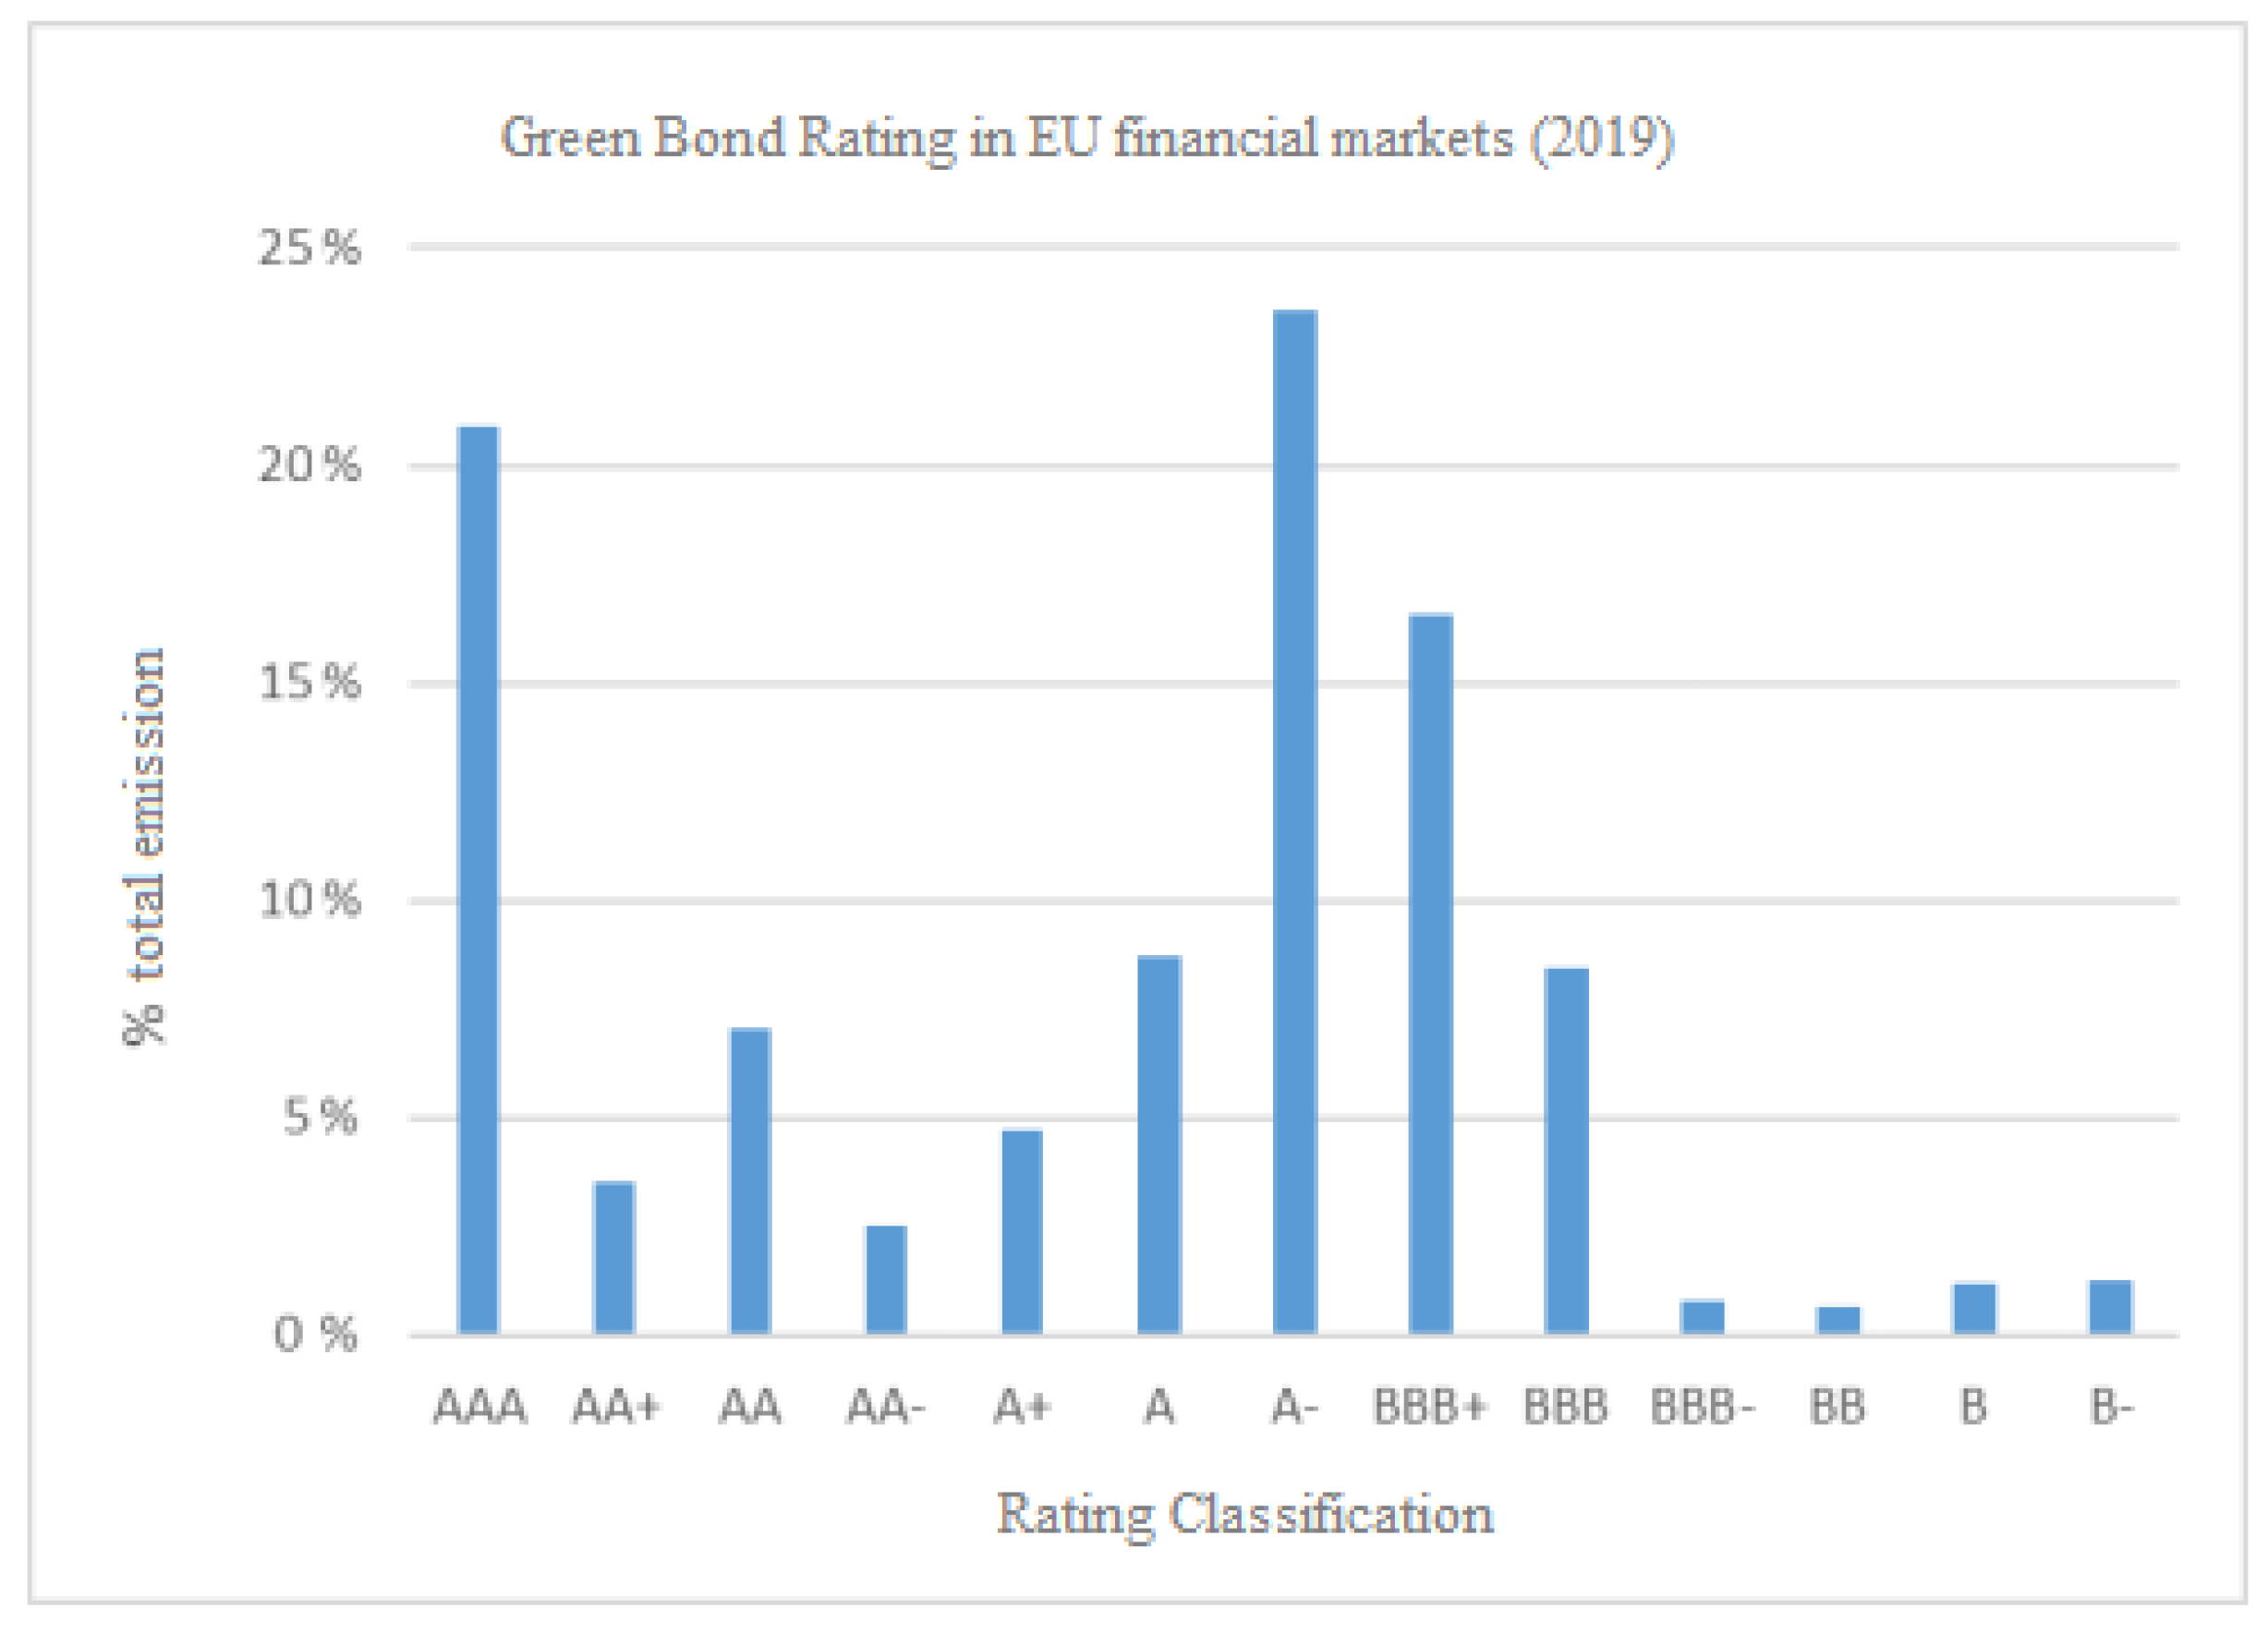
Due to the additional costs for maintaining transparency on the activities carried out and due to the long maturities this type of investment aims for, the expected earnings from these bonds are generally lower than those made on equal terms, sometimes resulting in a lower rating. Figure 7 represents the percentage distribution of green bonds in the various risk classes during 2019 [21] issued by financial institutions, and then exchanged within the EU secondary market.
In this work the needs of the project perfectly aligned with the use of the green bond, guaranteeing low rates, long periods of debt repayment, and the amount of liquidity necessary to cover the costs for the purchase and installation of the PV system and the battery pack.
2.4. Expected Revenues of the Project
2.4.1. Sale of Water Products and Quotas
The desalination plant and purifier sell two products on the island’s network with distinct uses, drinking water and water for non-human consumption.
Having previously determined the theoretical quantity of water that can be produced, we must now evaluate the selling prices for each and the number of users in Vulcano.
In the Italian system, in addition to the purchase tariff linked to the m3 of water consumed, there is also a fixed annual figure to pay (the access quota) which can be traced back to a distinct user place (house, hotel, shop, etc.), for each entry point to the water and sewage network.
The number of users is fixed in this simulation at 1500: this figure was determined considering the strong touristic and agricultural environment of the island which reduces the estimated consumers (10,000 PE) to a smaller number of places to access the water services (ratio 1:6.67 PE).
Since currently there are still no data on the tariffs and quotas which will (eventually) come into force in the future on the Aeolian Islands, we borrow those already in use in the neighbouring territories of the same region.
The fixed tariff for all services (drinking water, sewage and purification) was set at 2.22 €/m3, and we used this to calculate the revenues from the volumes of water produced by the desalination plant and consumed. The annual revenue from the access quotas was calculate based on the number of users (1500) and and it differs for each available service: 120 €/user/year for the aqueduct, 40 €/user/year for the sewerage grid, and 35 €/user/year for purification.
These are the fixed revenues derived from the volumes of drinking water consumed and reprocessed that can be immediately estimated. On the other hand, for the revenues derived from selling recycled water, we leave the price free to vary, using us to identify the figure beyond which investment into the project becomes convenient.
2.4.2. Sale of Electricity, Incentives and Used Devices
In this case study, the PV system was set up to cover the energy needs of the integrated water system at any time of the year, thus eliminating energy costs, but in this way it also produces an excess of energy for most of the year which can be sold on the island’s energy market.
In Italy, the price of electricity is determined by various factors and it is fixed for all energy sources. This means that the price of electricity from fossil fuels is the same as that of renewable energies. This single price is summarized by the PUN, which in 2022, due to the gas price crisis, surged reaching an average of 303.95 €/MWh. This figure was used as a reference point to determine the price of electricity, and this parameter was used to calculate the revenues obtainable from the sale of excess electricity produced by the PV system.
Even if the average PUN varies from year to year and a substantial drop in price is expected as the country has implemented new strategies to react to the crisis, there are still no concrete measures to separate the energy prices according to the production source. Therefore, we expect that in the future the PUN will again increases as fossil fuels will become more costly to acquire. With these forecasts in mind we carried out the simulation maintaining the high PUN of 2022 for the whole duration of the project.
In the Italian energy market the operators of the local electricity service purchase excess energy sold by producers using the PUN but with a substantial discount in their favour before reselling it to final consumers, thus making a profit from the difference between the purchase price and the final sale price.
In the simulation we fix this discount at a percentage of 30% on the average PUN and determine the fixed revenues from selling the excess of PV production accordingly for each of the 30 years of operation.
Since this territory is considered disadvantaged by the Italian government, Vulcano together with other islands has the right to economic supports that are no longer present in most of the country. An example exploited by the project is the remuneration for the amounts of energy produced from renewable sources.
This incentive, which lasts 20 years from the initial operation of the plant, is regulated by the national energy authority (ARERA) and it consists of two parts: a fixed part called the “feed in tariff” and one linked to the PUN called the “feed in premium”.
The first one sets a tariff based on the power of the renewable energy plant, while the second is determined by the difference between a price chosen by the authority and the average annual PUN. Since the latter is much higher than the chosen price, the difference would be negative; therefore, the revenue from the feed in premium tariff is considered equal to 0 in each operational year considered.
Instead the first tariff (feed in tariff) for year 1 (and then valid for all subsequent years) was set at 147.40 €/MWh and is the only valid incentive in the construction of the balance sheet. The tariff is multiplied for the excess of the electricity produced and then inserted as the revenue for the first 20 years of operation, and later being eliminated from active incomes.
Furthermore, for the PV system and battery pack, we must consider their life-end. However, in this case we do not consider their disposal a cost but a revenue due the expected future evolution of this sector.
The idea is that both the electrical systems and materials of the employed devices can be easily reused and/or recycled, recovering components for new systems and extracting valuable substances (e.g., crystalline silicon, lithium, precious metals, etc.) thanks to the numerous techniques patented in the last decade.
These techniques have translated in recent years, thanks to the possibility of recycling processes of first-generation implants, into new economic opportunities.
Although these new markets are not worldwide, it is expected that in the near future they will become one of the most active and innovative components of the economy, with a wide range of expansion. For this reason many nations are moving to promote and regulate these sectors already considered as strategic.
While foreseeing this scenario, we use some prudence in our discussion by establishing that the proceeds derived from the sale of the PV system and the two end-of-life battery packs will be limited to 5% of the costs incurred for their purchase and installation. In any case, what used to be considered a cost in the integrated water system has become income here.
2.4.3. Monetary Benefits from Savings
In recent years, studies on environmental impacts have quantified not only the pollution emissions but also made clear that the price paid indirectly by the inhabitants of the area (e.g., damage from environmental disasters, cleaning costs for poisoned areas, medical treatment for diseases caused by pollution, etc.) and it can be identified and calculated.
This project is powered by a completely renewable and clean energy source; therefore, we can easily calculate the amount of pollution saved and compare the environmental impact with the standard sources of energy available on the island (i.e., a diesel power plant completely dependent on external fuel supplies).
Knowing the amount of electricity produced annually with the PV farm and correlating it to the ratio between the energy produced by diesel and the tonnes of produced (equal to 0.855 ton/MWh) we can identify the positive contribution that the renewable energy source provides to the environment during its lifetime expressed in tonnes of saved.
These amounts can be translated into monetary terms and included in the project’s revenues to intercept these benefits, allowing investors to evaluate a payback from environmental factors that until now had not been considered associated with financial analyses.
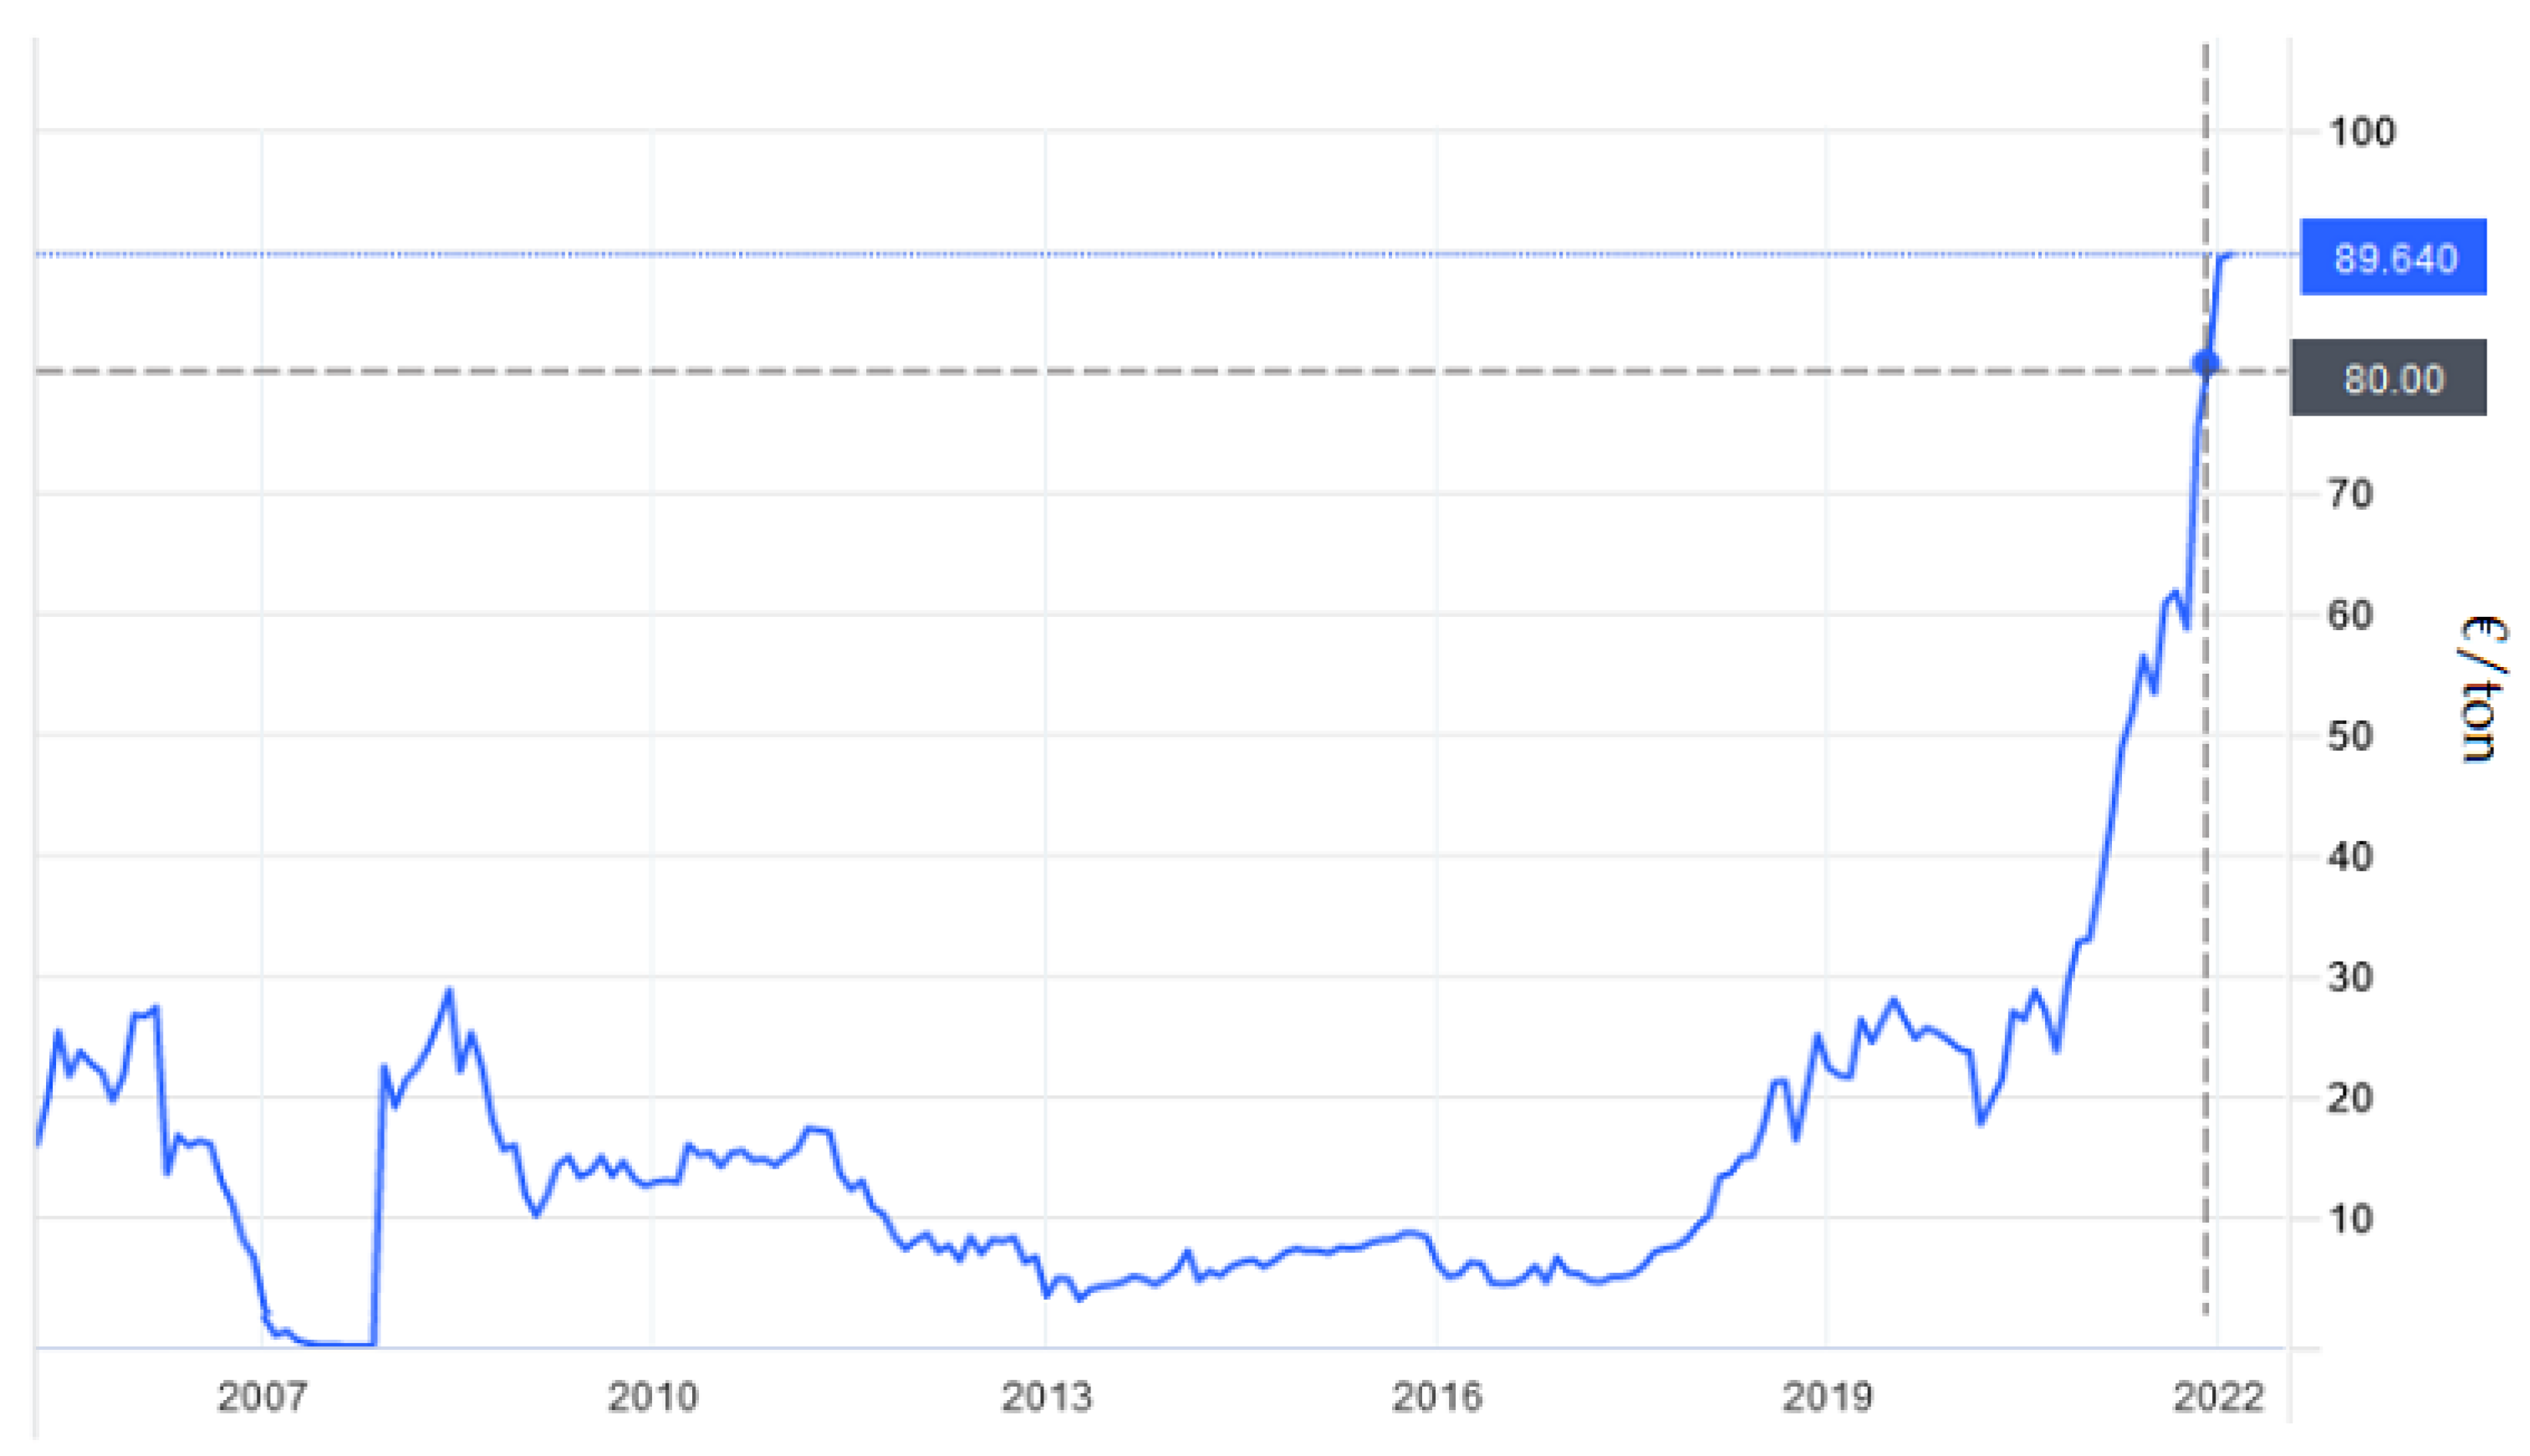
To find a fair price to assess the impact of emissions, we analysed one of the biggest databases available on the topic [22]. Figure 8 shows the current situation valued in economic terms.
For the first year of the simulation, we extrapolated from this figure a starting price of 80 €/ton and increased this by an additional 3% for each following year of PV plant activity, considering the growth trend which in recent years is becoming more and more consistent.
This price, which normally denotes the extra expenses due to the impact of the produced, in our case becomes an “immaterial” revenue which can be included in the balance sheet to evaluate the positive outcome of using green technologies in the balance sheet preparation.
2.5. Project Evaluation Financial Index: Net Present Value
After examining the proposed technological system, verified its feasibility and built a table of costs and revenues expected to evaluate its cost-effectiveness, we must conduct a financial analysis to test the project’s cost-effectiveness.
To do this we used one of the well-known financial indicators in project management: the net present value (NPV), a financial index that can easily determine whether a project is worth investment.
This index evaluates, with reference to the expected initial costs and the total financing required at a given interest rate, the possibility that a project will generate a profit for investors and therefore be a valid proposition.
The golden rule is that the stakeholder considers the investment only when the NPV > 0, in order to increase the profit.
This statement has often been criticized because the economic parameters included in the balance sheet rarely intercept all the positive aspects that a project can generate. However, we expect that using appropriate correction parameters (except the inclusion of a monetized positive environmental impact) the NPV can perform its evaluation with better results.
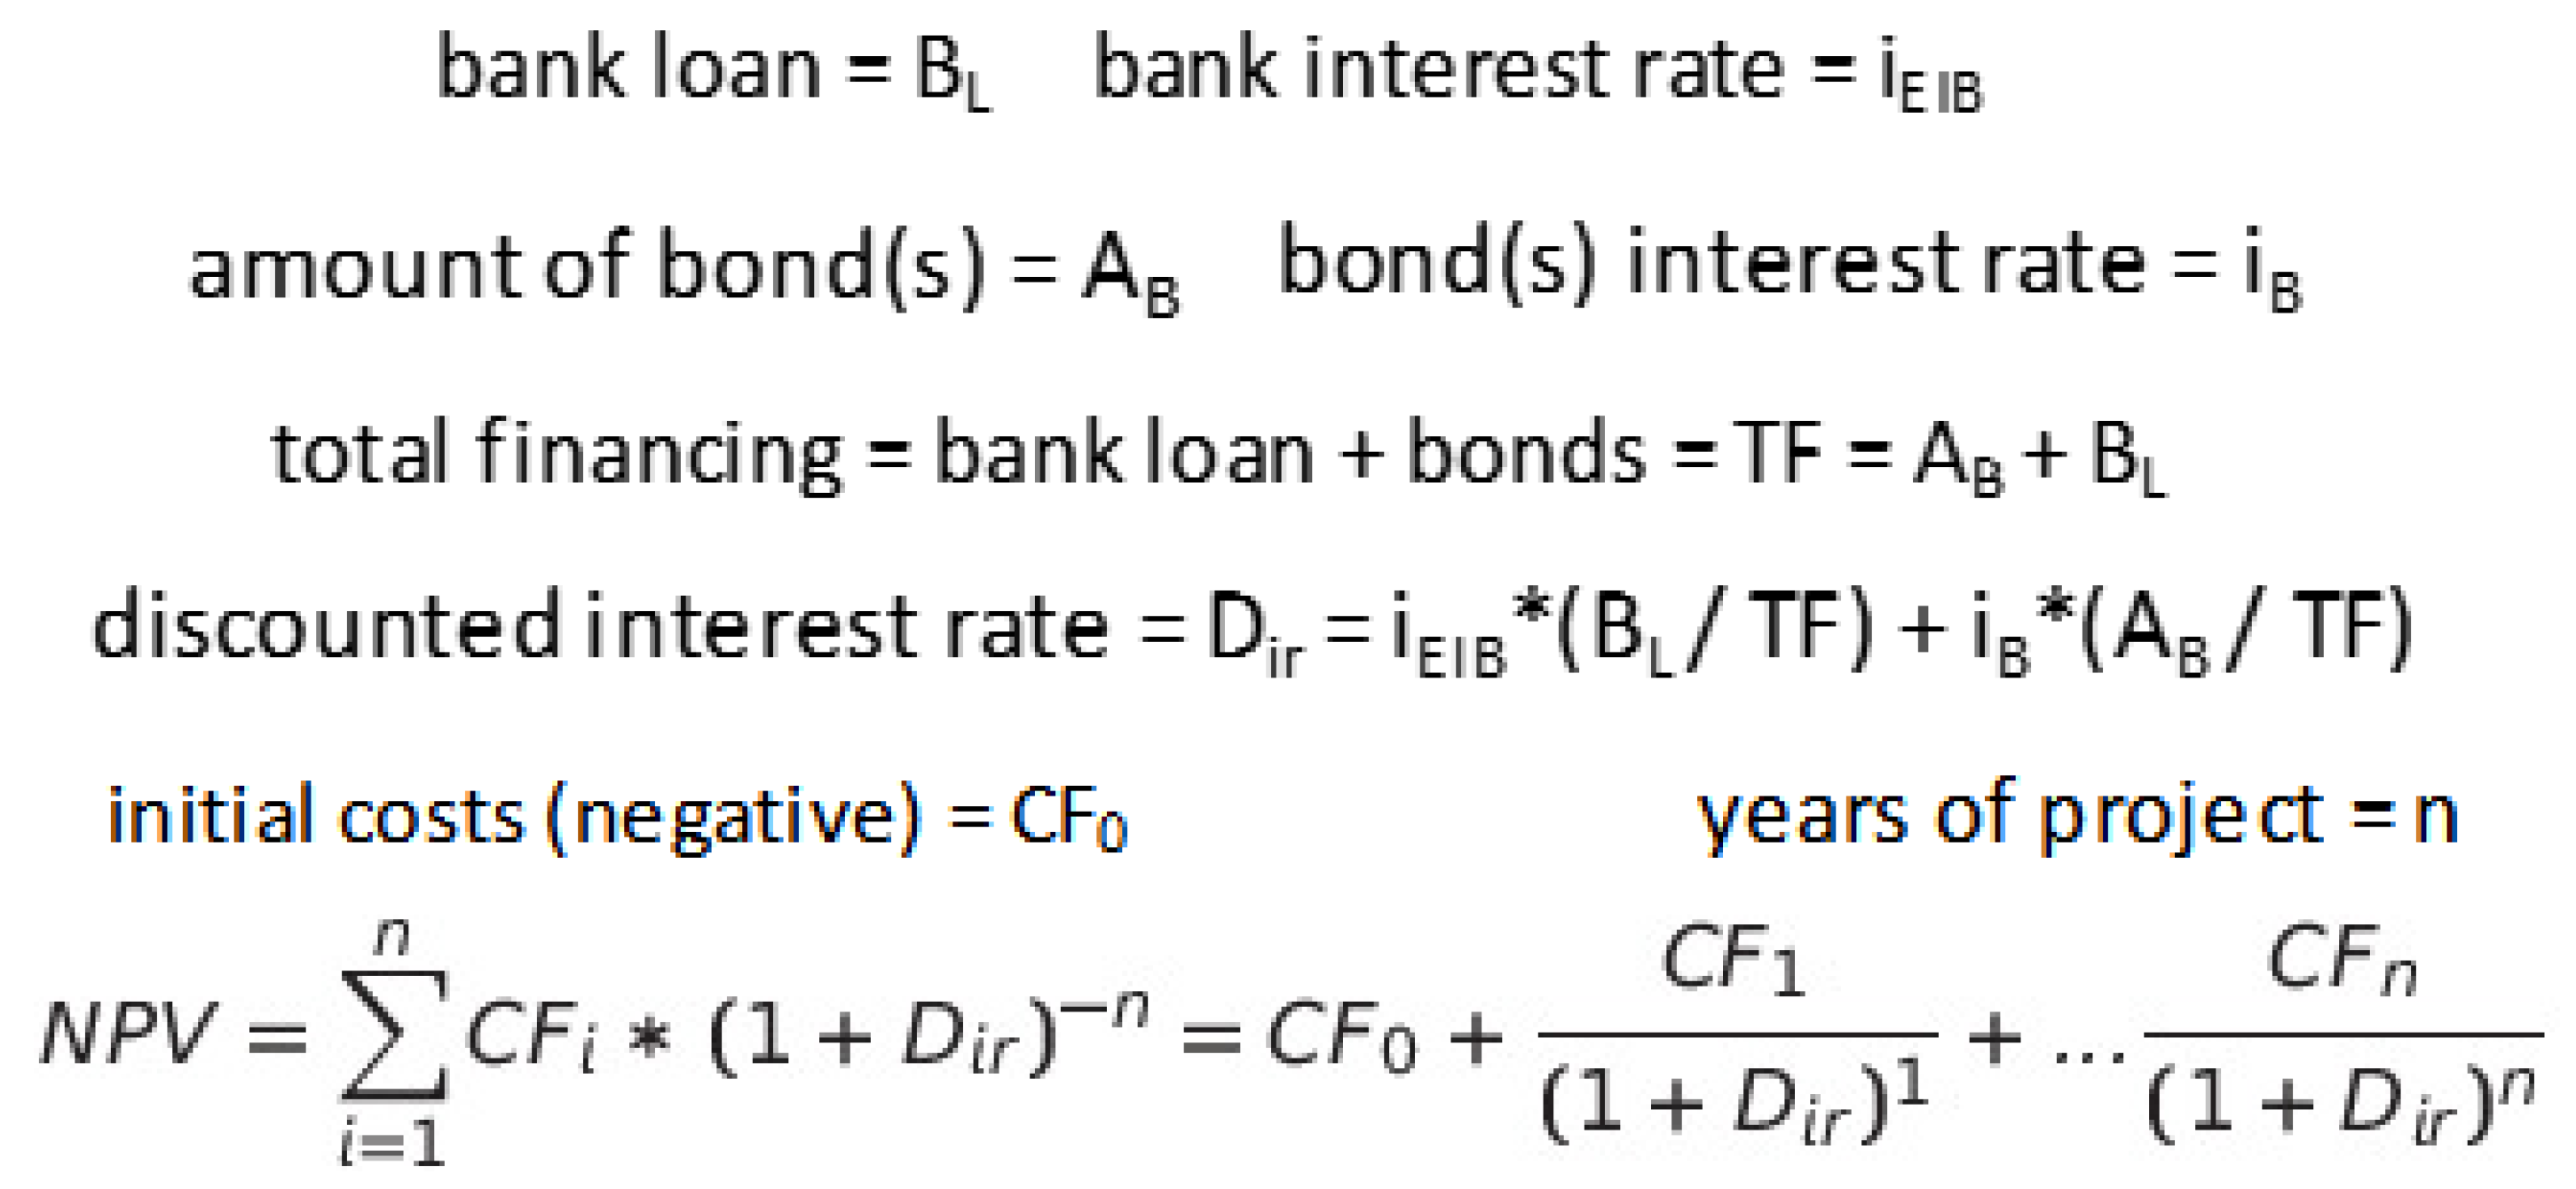
In our simulation the interest rate chosen was a simplified version of the one normally used (WACC) and was a weighted average of the interest rates of the EIB bank loan (1%) and the green bond (8%). Due to the duration of the project (30 years), the total initial costs of year 0 and the cash flows for each year () we can summarize the formula for the NPV calculation with Figure 9:
In the next section, we analyse the price of the recycled water produced by the purifier to have an NPV value greater than zero. We examined two different simulations with the same initial costs, discounted interest rate, total financing and project duration but with two different annual cash flows. The first case does not incorporate the monetized benefits while other includes it in the balance sheet: this shows how the NPV can be adjusted for more realistic results for the evaluation of potential investors.
3. Results
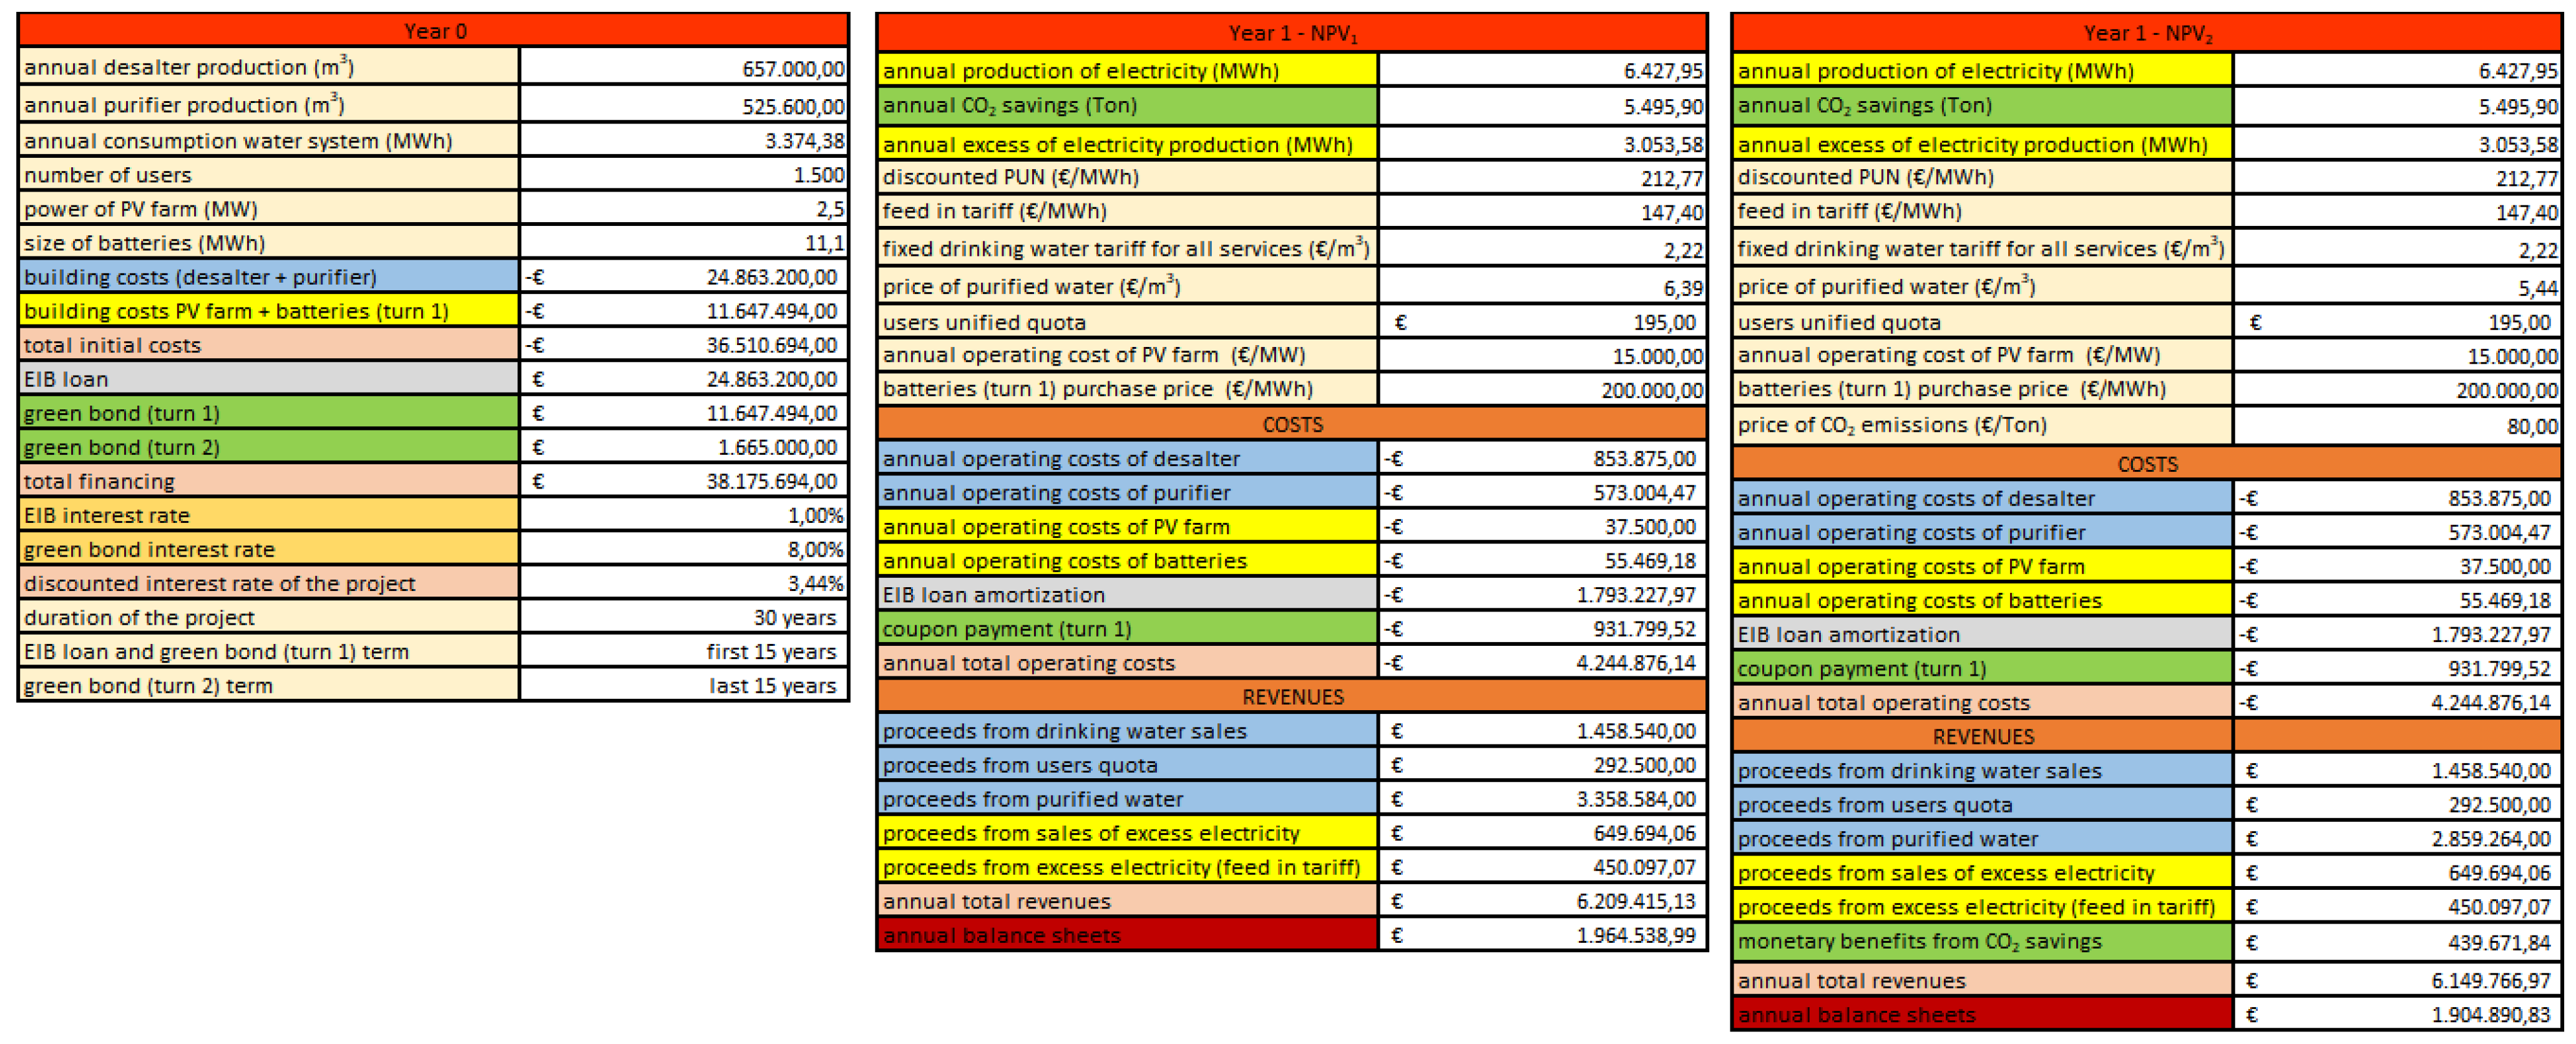
After entering all the necessary data with the methodology indicated above, we can simulate the scenarios with the two purified water prices, where only one accounts for the environmental gains from the PV usage to power the integrated water system. As an example, we report in Figure 10 the first two years of the simulations: the year of construction (year 0), common to both scenarios, and year 1 of operational service, to show differences in the balance sheet preparation.
As is noted, the costs section remained unchanged in both year(s), while the revenues section of the second incorporated the monetized benefits of the saved. Both produced the same amount of solar energy, but only in one simulation () is the green source considered as a revenue and included in the budget.
With the aim of the simulations to find the first NPV > 0, we can lower the purified water price in the second scenario, taking advantage of the extra revenue calculated from the price of saved inserted. It is worth noting that both balance sheets are already positive from the first year, highlighting the economic sustainability of the project under the previously established conditions.
From the latest data available [23] on per capita production in Italy (5.415 ton/year) we calculated that the PV usage allows us to save the emissions of about 840 people every year, whom in the second scenario are counted as an ever-rising extra revenue thanks to the expected annual growth in the price of .
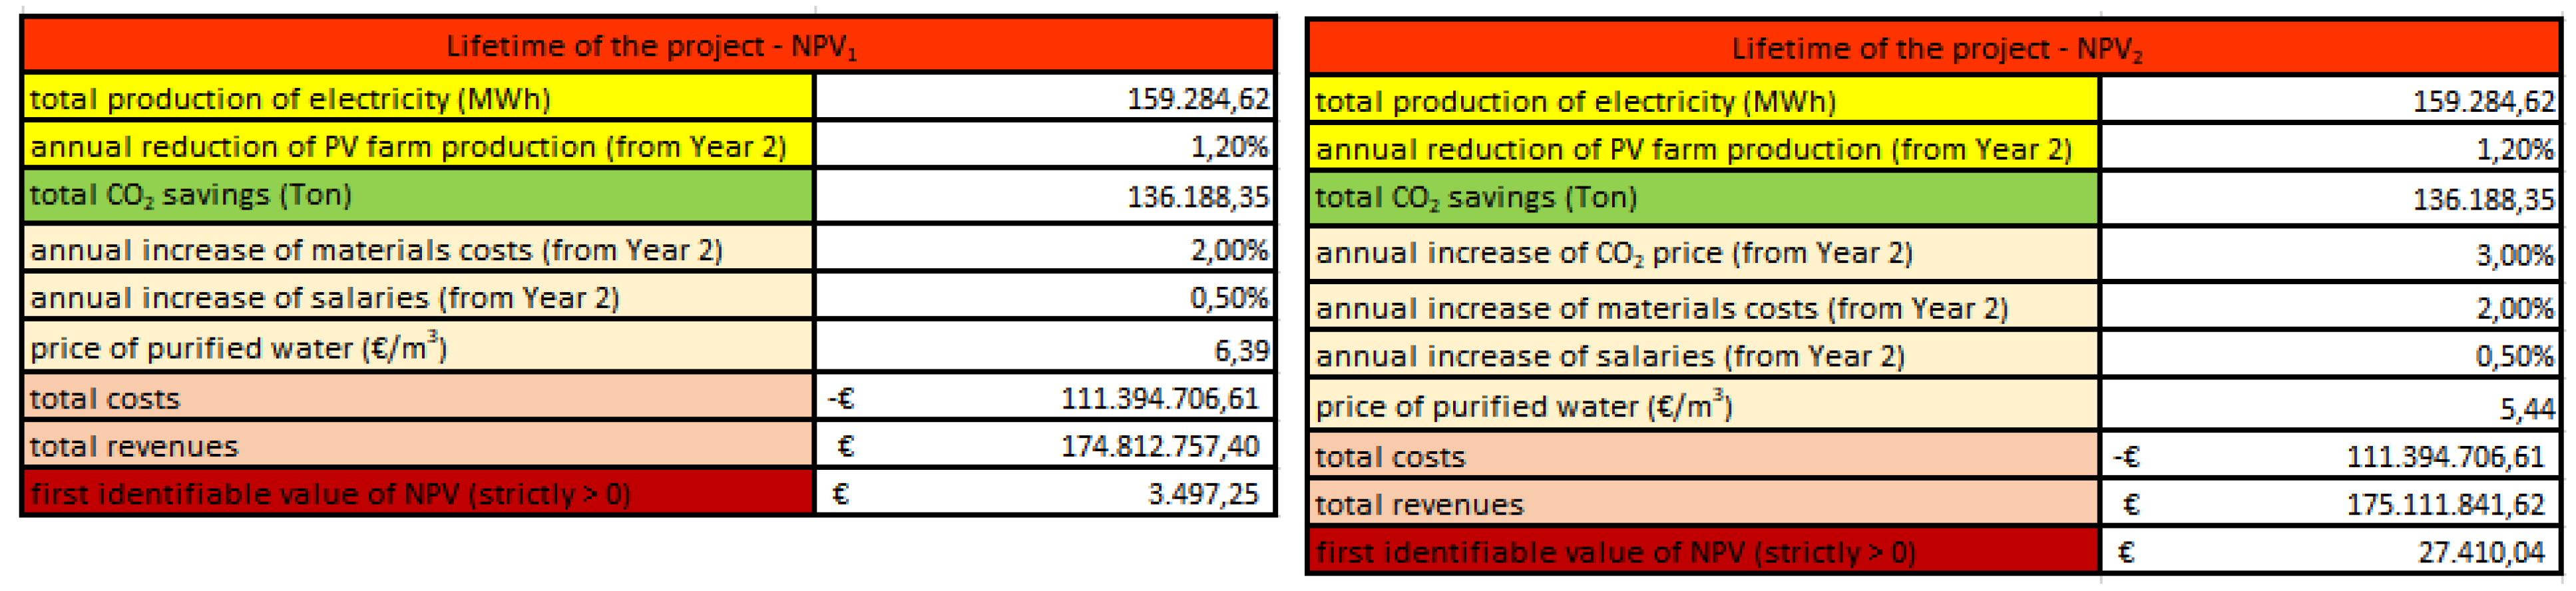
With this increase, incorporating the worsening environmental impact over time by not using renewable energies, the total revenues (presented in Figure 11) of the second scenario are slightly higher than the first, despite the lower price of purified water sold. This also leads to a higher NPV, showing that the inclusion of environmental parameters is also a more advantageous financial policy at the same cost.
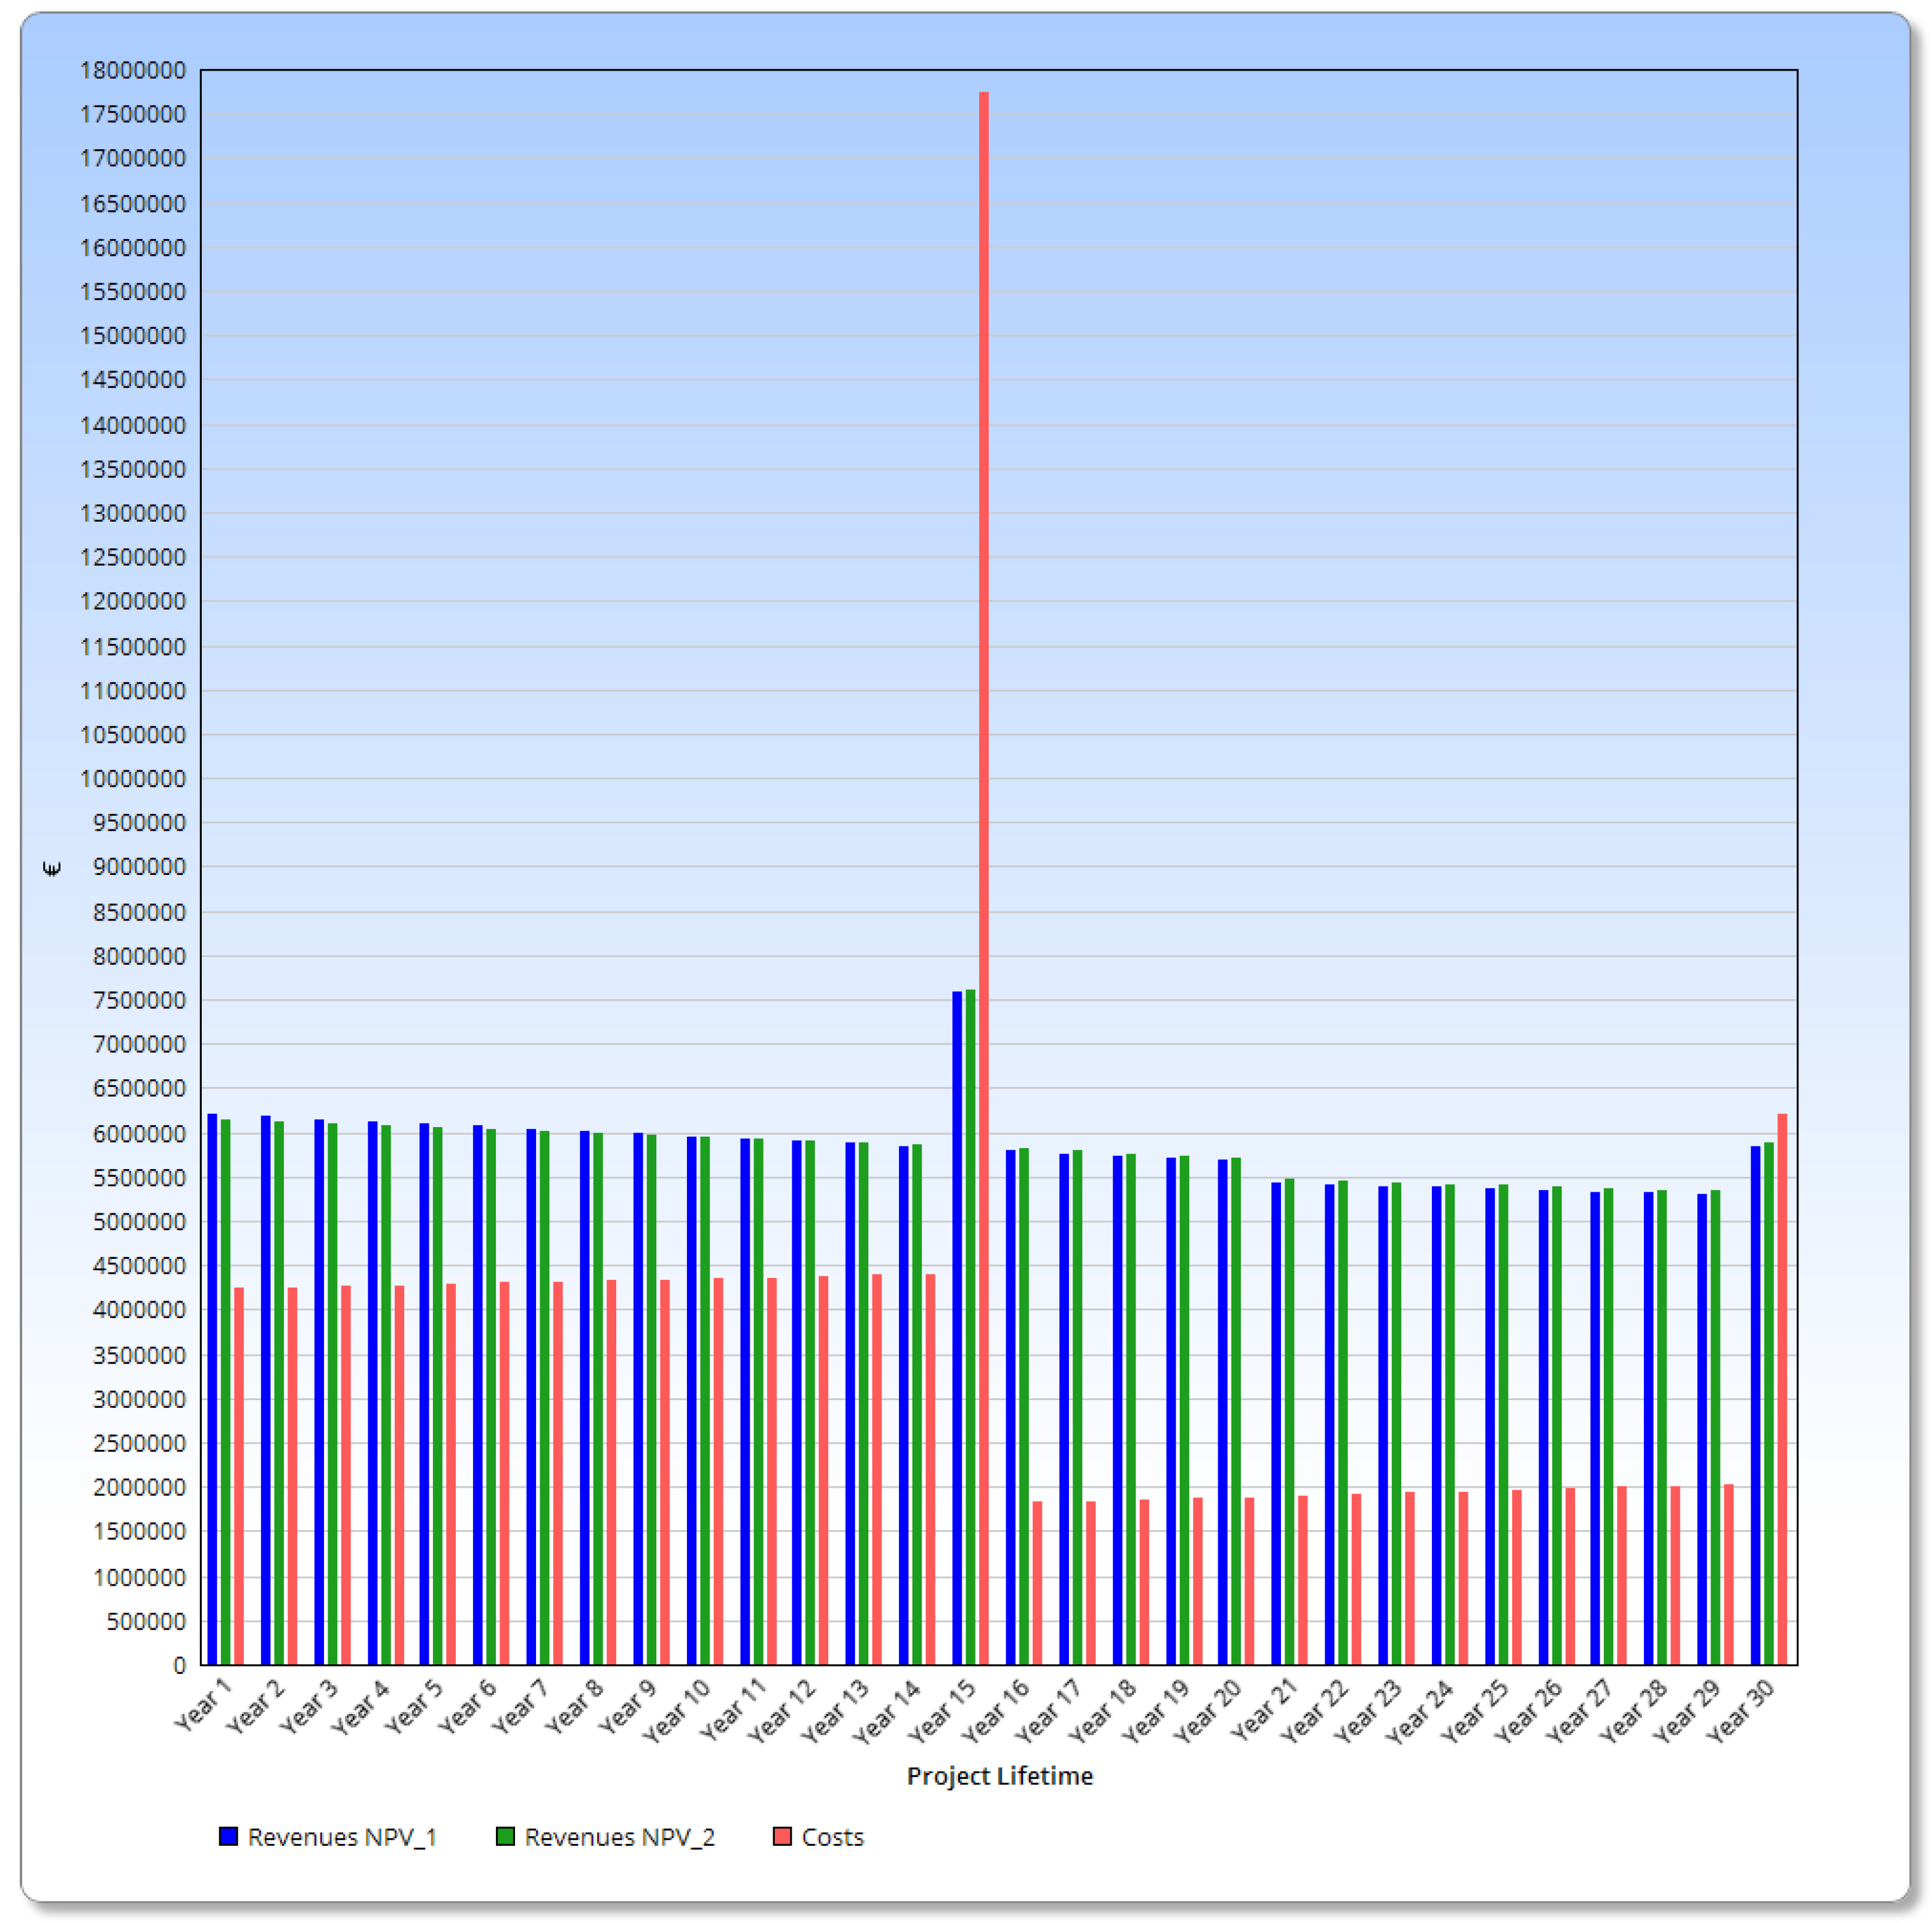
Finally, through Figure 12, we analysed the trend of costs and revenues for the entire duration of the simulations. As for year 1, and almost all other periods considered, a positive difference is maintained between expenses and revenues.
This occurs despite the reduction in PV production (and consequent lower electricity sales), as well as the constant increase in wages and material prices except:
- in year 15, where costs largely exceed revenues due to the achievement of the maturity date of the green bond (turn 1) and the purchase of new batteries;
- in year 30, where the payment of the green bond (turn 2) and the decommissioning costs for the integrated water system occur;
With the vast majority of years remaining, there is always enough surplus budget to cover these two negative periods and, indeed, reach a span of investment, evidenced by the positive and found.
4. Discussion
The primary purpose of this article was twofold. Firstly, it aimed to provide non-specialists with an opportunity to deepen their scientific and economic knowledge in the fields of desalination and wastewater treatment. By presenting relevant data and information, the article aimed to bridge the gap between technical experts and a broader audience, enabling individuals to better understand and engage with these topics.
Secondly, the article sought to serve as a point of reference for professionals working in the field. By providing data and insights, it aimed to facilitate comparisons with their own work, fostering further research and advancements in the area of desalination and wastewater treatment.
The motivation for reporting the results was also driven by the current dynamic and evolving nature of the Euro-Mediterranean area. Factors such as political changes, environmental challenges, and economic crises (such as the hydrocarbon crisis resulting from the war in Ukraine, growing drought in various regions, and initiatives such as the Next-Gen EU in response to the COVID-19 pandemic) highlight the need for technological solutions [24]. In the face of such fluctuations and unforeseen events, there is a demand for practical solutions to address the problems at hand.
Unfortunately, the lack of sufficient scientific dissemination and technical updates often precludes the possibility of making positive changes in local realities where there would be large margins for improvement. In fact, RO desalination technology and membrane wastewater treatment powered by renewable sources, such as PV or similar [25], are now economically sustainable realities and it is often more cultural and bureaucratic difficulties that prevent their diffusion than factual problems.
Frequently, a good project in this field is held back by these limitations; even when they are within reach, the realization is uneconomical or above the available budget. For this reason, when working in the field of planning, economic and financial analysis is essential for the success of the operation. It is necessary to identify all the relevant parameters, build a credible budget plan and identify the correct forms of investment [26].
In this article we have not only dealt with technical issues but also shown a series of steps that can facilitate the realization of similar projects, concerning issues that are becoming increasingly pressing today.
The scarcity of water and energy, combined with climate change and underdevelopment in many islands can be effectively countered if an innovative approach is pursued, not only in terms of technology but also culturally and economically. Moving from a production system of essential services based on fossil fuels and welfarism to a renewable and self-sufficient one [27] can be made possible using all the tools that the globalized world offers, including the financial markets and their instruments.
In our simulations we have tried to show how a project for the construction of strategic infrastructures is more than the sum of their costs and revenues but brings externalities that can be effectively intercepted only if the investors and the territories concerned are willing to compromise. An example can be the purchase of green bonds with a 15-year duration (a maturity above the average and therefore less attractive) countered with the assurance that these funds will be spent to create renewable energy sources, whose (missed) emissions will benefit everyone.
Another example of a possible agreement concerns the interlocutors: a private individual, for example, will be less inclined to agree in selling purified water at a lower price in exchange for environmental gains that they cannot perceive, such as the benefits of the saved.
On the other hand, a public entity, which is interested in the environmental consequences on the population, will be more willing to reach an agreement between producers and consumers of services, guaranteeing the former compensation for lost earnings and the latter a lower price to meet their economic constraints given by the isolated and underdeveloped local reality. This type of agreement between private entities that manage the production and public entities that supervise compliance with laws takes the name of PPP (public private partnership) and is rapidly spreading across countries (such as Italy) where the progressive abandonment of statism in key sectors of the economy is followed by the involvement of private entities and their investments [28].
With the use of the NPV index we demonstrated not only the profitability of the project in both cases but also the achievement of economic sustainability for technologies such as PV and desalination, often criticized in previous decades as less convenient than the more widespread methodologies. This lowering in costs and the prospects for development on new markets (such as the recycling of panels and batteries) open up new avenues for many local realities that until now had neither the means nor the economic possibilities to favour autonomous infrastructural development unrelated to state funding and seasonality of the local economy.
In conclusion, even for difficult territories such as Vulcano and the Aeolian archipelago there are many possibilities still to be explored to improve the well-being of the population, favour the green transition and make profits with local investments. We recommend the use of all available financial instruments and the collaboration between public and private entities as two fundamental components for the future development and maintenance of a high standard of living in these remote but certainly liveable areas.
Author Contributions
Conceptualization, G.M. and M.F.A.; methodology, G.M.; software, G.M.; validation, G.M. and M.F.A.; formal analysis, G.M.; investigation, G.M.; resources, G.M.; data curation, G.M.; original draft preparation, G.M.; review and editing, G.M.; visualization, G.M.; supervision, M.F.A.; project administration, M.F.A. All authors have read and agreed to the published version of the manuscript.
Funding
This research received no external funding.
Data Availability Statement
Not applicable.
Conflicts of Interest
The authors declare no conflict of interest.
Abbreviations
The following abbreviations are used in this manuscript:
| DC | Direct current |
| RO | Reverse osmosis |
| PE | Population equivalent |
| MBR | Membrane bioreactor |
| PUN | Prezzo Unico Nazionale |
| PV | Photovoltaic |
| EIB | European Investment Bank |
| ICMA | International Capital Market Association |
| ARERA | Autorità di regolazione per energia reti e ambiente |
| NPV | Net present value |
| WACC | Weighted average cost of capital |
| PPP | Public private partnership |
References
- Triantafyllou, P.; Koroneos, C.; Kondili, E.; Kollas, P.; Zafirakis, D.; Ktenidis, P.; Kaldellis, J.K. Optimum green energy solution to address the remote islands’ water-energy nexus: The case study of Nisyros island. Heliyon 2021, 7, e07838. [Google Scholar] [CrossRef]
- Pelaggi, L. (Ministero dell’Ambiente e della Sicurezza Energetica, Italy). Determinazione n.4. 22 June 2013. [Google Scholar]
- Veolia Water Technologies Italia S.p.A. Annual Estimate of Running Costs for the Vulcano Watermaker; Veolia Water Technologies Italia S.p.A.: Milan, Italy, 2019. [Google Scholar]
- Mosconi, G. A green proposal for the Aeolian Islands: Financial Analysis of a Project Involving a Photovoltaic System for the Production of Electricity and a Desalination Plant for the Supply of Drinking Water. Master’s Thesis, Università degli Studi Milano-Bicocca, Milan, Italy, March 2022. [Google Scholar]
- Powar, V.; Singh, R. Stand-Alone Direct Current Power Network Based on Photovoltaics and Lithium-Ion Batteries for Reverse Osmosis Desalination Plant. Energies 2021, 14, 2772. [Google Scholar] [CrossRef]
- Istat. Utilizzo e Qualità della Risorsa Idrica Italiana; Streetlib: Milan, Italy, 2019; p. 22. [Google Scholar]
- Augi, S.; Stagno, S. Progetto per L’affidamento del Servizio di Gestione, per un Periodo di 10 Anni, Finalizzata alla Produzione di Acqua Potabile, dell’impianto di Dissalazione ad Osmosi Inversa dell’isola di Vulcano; Regional Department of Water and Waste: Palermo, Italy, 2016. [Google Scholar]
- De Feo, G.; De Gisi, S.; Galasso, M. Acque Reflue: Progettazione e Gestione degli Impianti per il Trattamento e lo Smaltimento; Dario Rocco Editor: Palermo, Italy, 2022. [Google Scholar]
- Kuttalam, I.; Lonchin, S. Integration of solar photovoltaic power, battery and DC-DC converter for waste water treatment. In Proceedings of the 2017 IEEE International Conference on Power, Control, Signals and Instrumentation Engineering (ICPCSI), Chennai, India, 21–22 September 2017. [Google Scholar]
- Gestore Mercati Energetici. Available online: https://www.mercatoelettrico.org/It/Statistiche/ME/DatiSintesi.aspx (accessed on 1 April 2023).
- Bundschuh, J.; Kaczmarczyk, M.; Ghaffour, N.; Tomaszewska, B. State-of-the-art of renewable energy sources used in water desalination: Present and future prospects. Desalination 2021, 508, 115035. [Google Scholar] [CrossRef]
- Lugo-Laguna, D.; Arcos-Vargas, A.; Nuñez-Hernandez, F. A European Assessment of the Solar Energy Cost: Key Factors and Optimal Technology. Sustainability 2021, 13, 3238. [Google Scholar] [CrossRef]
- Mongird, K.; Viswanathan, V.; Balducci, P.; Alam, J.; Fotedar, V.; Koritarov, V.; Hadjerioua, B. An Evaluation of Energy Storage Cost and Performance Characteristics. Energies 2020, 13, 3307. [Google Scholar] [CrossRef]
- European Commission. Available online: https://re.jrc.ec.europa.eu (accessed on 1 April 2023).
- EIB Group. (98–100, boulevard Konrad Adenauer L-2950 Luxembourg). The EIB Climate Adaptation Plan Supporting the EU Adaptation Strategy to Build Resilience to Climate Change. 13 October 2021. [Google Scholar]
- EIB Group. (98–100, boulevard Konrad Adenauer L-2950 Luxembourg). The Economic Appraisal of Investment Projects at the EIB. 30 October 2020.
- EIB Group. (98–100, boulevard Konrad Adenauer L-2950 Luxembourg). The EIB Group Operational Plan 2023–2025. 14 December 2022.
- EIB Group. (98–100, boulevard Konrad Adenauer L-2950 Luxembourg). Guide to Procurement for Projects Financed by the EIB. September 2018.
- European Commission. (Publications Office of the European Union, Luxembourg). Study on the Potential of Green Bond Finance for Resource-Efficient Investments. November 2016.
- ICMA. (Paris Representative Office 62 rue la Boétie, Paris, France). Green Bond Principles: Voluntary Process Guidelines for Issuing Green Bonds. June 2021.
- Berti, M. Green Bond: Un’analisi Empirica del Mercato Europeo; Università Ca’ Foscari Venezia: Venice, Italy, 2019. [Google Scholar]
- Trading Economics. Available online: https://tradingeconomics.com/commodity/carbon (accessed on 1 April 2023).
- European Commission. (Publications Office of the European Union, Luxembourg). CO2 Emissions of All World Countries JRC/IEA/PBL 2022 Report. 2022.
- Sayed, E.T.; Olabi, A.G.; Elsaid, K.; Al Radi, M.; Alqadi, R.; Abdelkareem, M.A. Recent progress in renewable energy based-desalination in the Middle East and North Africa MENA region. J. Adv. Res. 2022, 48, 125–156. [Google Scholar] [CrossRef]
- Trapanese, M.; Frazitta, V. Desalination in Small Islands: The Case Study of Lampedusa (Italy); IEEE: Piscataway, NJ, USA, 2018. [Google Scholar]
- Tsagkari, M.; Jusmet, J.R. Renewable Energy Projects on Isolated Islands in Europe: A Policy Review. Int. J. Energy Econ. Policy 2020, 10, 21–30. [Google Scholar] [CrossRef]
- Cauz, M.; Bloch, L.; Rod, C.; Perret, L.; Ballif, C.; Wyrsch, N. Benefits of a Diversified Energy Mix for Islanded Systems. Front. Energy Res. 2020, 8, 147. [Google Scholar] [CrossRef]
- Eras-Almeida, A.A.; Egido-Aguilera, M.A. Hybrid renewable mini-grids on non-interconnected small islands: Review of case studies. Renew. Sustain. Energy Rev. 2019, 116, 109417. [Google Scholar] [CrossRef]
Figure 1.
Visual example of the amount of water that could be treated and made available annually.

Figure 2.
Example of a DC-DC system suited for both desalination/wastewater processes, integrated with a PV energy production source and batteries for energy storage.
Figure 2.
Example of a DC-DC system suited for both desalination/wastewater processes, integrated with a PV energy production source and batteries for energy storage.

Figure 3.
Pie chart summarizing all the main expenditure items and percentages for the construction of a PV power plant with a bi-axial tracker system.
Figure 3.
Pie chart summarizing all the main expenditure items and percentages for the construction of a PV power plant with a bi-axial tracker system.

Figure 4.
Increases planned in the next period for investments in sectors considered strategic by the EIB.
Figure 4.
Increases planned in the next period for investments in sectors considered strategic by the EIB.

Figure 5.
Proposed formula for fee calculation: the French amortization method (one payment per year) has been used.
Figure 5.
Proposed formula for fee calculation: the French amortization method (one payment per year) has been used.

Figure 6.
Simplified formula to calculate a yearly coupon.

Figure 7.
Percentage rating distribution of green bonds issued in the EU financial markets during 2019.
Figure 7.
Percentage rating distribution of green bonds issued in the EU financial markets during 2019.

Figure 8.
Historical trend of economic value assigned to carbon dioxide emissions.

Figure 9.
Steps and formulas used to calculate the net present value (NPV) in the project simulation.
Figure 9.
Steps and formulas used to calculate the net present value (NPV) in the project simulation.

Figure 10.
Balance sheet for the desalination and purification plant, for year 0 and 1.

Figure 11.
Summary tables with the purified water prices that provide the NPV > 0.

Figure 12.
Costs and revenues of the two simulations are displayed for each year of the project.


Table 1.
Year 0. Costs that could be normally incurred by building an RO desalter and MBR purifier are listed here.
Table 1.
Year 0. Costs that could be normally incurred by building an RO desalter and MBR purifier are listed here.
| Building Procedures | Costs (€) |
|---|---|
| Desalter construction (12,000 PE) | 14,000,000.00 |
| Purifier construction (10,000 PE) | 3,700,000.00 |
| Security charges | 400,000.00 |
| Expropriation procedures | 35,000.00 |
| Executive planning | 240,000.00 |
| Technical and geological insights | 25,000.00 |
| Laboratory tests | 5000.00 |
| 10% VAT | 1,840,500.00 |
| Service connections | 215,000.00 |
| Contingencies and rounding | 920,000.00 |
| RUP skills and support | 400,000.00 |
| Definitive planning | 400,000.00 |
| Safety coordination | 200,000.00 |
| Consulting | 45,000.00 |
| Geotechnical investigation | 70,000.00 |
| Environmental impact study | 35,000.00 |
| Tender and procurement procedure | 80,000.00 |
| Incentives and refunds for off-site activities | 400,000.00 |
| Administrative checks | 20,000.00 |
| Connection with sewerage | 300,000.00 |
| Environmental compensations | 200,000.00 |
| Facility testing | 100,000.00 |
| Expropriations and acquisitions | 400,000.00 |
| 22% VAT | 832,700.00 |
| Total | 24,863,200.00 |
Table 2.
Year 1. The desalinator operating costs are stripped of energy expenditures due the self-sufficiency of the PV-integrated plant.
Table 2.
Year 1. The desalinator operating costs are stripped of energy expenditures due the self-sufficiency of the PV-integrated plant.
| Annual Maintenance Processes | Costs (€) |
|---|---|
| Electricity bill | 700,000.00 |
| Salaries Payment | 280,000.00 |
| Costs of materials | 150,000.00 |
| Miscellaneous costs | 35,000.00 |
| Laboratory tests | 100,000.00 |
| Routine maintenance | 110,000.00 |
| General expenses | 101,250.00 |
| Extraordinary expenses | 77,625.00 |
| Total | 853,875.00 |
Table 3.
Year 1. The purifier operating costs calculated not including the energy bill, being a self-powered plant with an integrated PV system.
Table 3.
Year 1. The purifier operating costs calculated not including the energy bill, being a self-powered plant with an integrated PV system.
| Annual Maintenance Processes | Costs (€) |
|---|---|
| Electricity bill | 121,580.00 |
| Salaries Payment | 160,000.00 |
| Materials and waste disposal | 125,408.00 |
| Routine maintenance | 34,500.00 |
| Incidences | 15,035,676.00 |
| Plant integrations | 28,000.00 |
| General expenses | 74,739.71 |
| Total | 573,004.47 |
Table 4.
Year 0–30. All building costs that could be occurred with a PV farm + battery pack.
| Building Procedures | Costs (€) |
|---|---|
| Panel purchase (29%) | 2,750,000.00 |
| Electrical tracker system purchase (25%) | 2,356,873.50 |
| Transport and assembly (33%) | 3,142,183.75 |
| Administrative procedures (4%) | 393,126.50 |
| Other costs (9%) | 785,310.25 |
| Batteries round 1 (Year 0/Year 15) purchase and installation | 2,220,000.00 |
| Total initial costs | 11,647,494.00 |
| batteries round 2 (Year 15/Year 30) purchase and installation | 1,665,000.00 |
| TOTAL costs | 13,312,494.00 |
Disclaimer/Publisher’s Note: The statements, opinions and data contained in all publications are solely those of the individual author(s) and contributor(s) and not of MDPI and/or the editor(s). MDPI and/or the editor(s) disclaim responsibility for any injury to people or property resulting from any ideas, methods, instructions or products referred to in the content. |
© 2023 by the authors. Licensee MDPI, Basel, Switzerland. This article is an open access article distributed under the terms and conditions of the Creative Commons Attribution (CC BY) license (https://creativecommons.org/licenses/by/4.0/).
Share and Cite
MDPI and ACS Style
Mosconi, G.; Acciarri, M.F. Financial Analysis of a Desalination–Wastewater Recycle Plant Powered by a DC-DC Photovoltaic-Batteries System on the Aeolian Islands, Italy. Energies 2023, 16, 4935. https://doi.org/10.3390/en16134935
AMA Style
Mosconi G, Acciarri MF. Financial Analysis of a Desalination–Wastewater Recycle Plant Powered by a DC-DC Photovoltaic-Batteries System on the Aeolian Islands, Italy. Energies. 2023; 16(13):4935. https://doi.org/10.3390/en16134935
Chicago/Turabian StyleMosconi, Gabriele, and Maurizio F. Acciarri. 2023. "Financial Analysis of a Desalination–Wastewater Recycle Plant Powered by a DC-DC Photovoltaic-Batteries System on the Aeolian Islands, Italy" Energies 16, no. 13: 4935. https://doi.org/10.3390/en16134935
Note that from the first issue of 2016, this journal uses article numbers instead of page numbers. See further details here.