Article

Experimental Investigation and Modelling of Sediments Effect on the Performance of Cadmium Telluride Photovoltaic Panels

by
Bernardo Gonçalves
1,
João F. P. Fernandes
1,2,
João Paulo N. Torres
3,4 and
Ricardo A. Marques Lameirinhas
1,3,*
1
Department of Electrical and Computer Engineering, Instituto Superior Técnico, 1049-001 Lisbon, Portugal
2
IDMEC-Instituto de Engenharia Mecânica, Instituto Superior Técnico, Universidade de Lisboa, 1049-001 Lisbon, Portugal
3
Instituto de Telecomunicações, 1049-001 Lisbon, Portugal
4
Academia Militar/CINAMIL, Av. Conde Castro Guimarães, 2720-113 Amadora, Portugal
*
Author to whom correspondence should be addressed.
Energies 2023, 16(12), 4777; https://doi.org/10.3390/en16124777
Submission received: 1 June 2023 / Revised: 13 June 2023 / Accepted: 15 June 2023 / Published: 17 June 2023
(This article belongs to the Special Issue Application of Nanotechnology in Photovoltaic Systems II)

Abstract

:
Of the different renewable sources of energy, photovoltaic energy has one of the highest potentials. In recent decades, several technological and research advances have contributed to the consolidation of its potential. One current photovoltaic energy research topic is the analysis of the impact of sediments on the panels’ performance. The development of models to predict the performance of panels in the presence of sediments may allow for better decision-making when considering maintenance operations. This work contributed to the investigation of the influence of sand on the production of photovoltaic energy in cadmium telluride (CdTe) panels. Six panels of this type with different colors and transparencies were experimentally tested with and without the presence of sand. The impact of the sand on the cells’ performance was evaluated by analyzing the change in the 1M5P model’s parameters and in the power, efficiency, and fill factors. The experimental results show different negative impacts on the output power of the CdTe panels, from −14% in the orange panel to −36% in the green panel. Based on this study, the development of a model capable of predicting the effect of the sand on these panels was introduced. The developed model was validated experimentally, with a maximum deviation of 4.6%. These results can provide support for the decision-making around maintenance activities and for the development of new techniques to avoid sediment deposition on CdTe panels.

1. Introduction

The enormous potential of photovoltaic (PV) technology, combined with advances in this field of research over the last few decades, has led to the development of several studies that promote improvements in the efficiency of solar panels [1,2,3,4]. However, photovoltaic performance is still highly dependent on environmental factors, such as temperature, irradiance, humidity, and sediments in the PV modules or energy losses in the auxiliary components of the PV system [1,5,6,7]. Thus, it is important to evaluate the impact of environmental conditions on the performance of photovoltaic technology.
In [5], a comprehensive review of the impact of dust on solar energy was conducted. This study concluded that, in moderate dust conditions, a PV system may lose between 15% and 30% of output power due to dust. This effect is increased in urban areas, where the efficiency of PV systems is also affected by atmospheric pollution and the deposition of sediment on solar panels [8,9,10]. For example, in [11], it was verified that 5% of energy production is lost in a 5 kW rooftop power plant due to the deposition of sediments after one week of operation. Additionally, [12] presented the average sediment concentration in some famous cities. Several experimental analyses might be carried out by emulating not only the temperature and irradiance in those cities but also the average dust deposition on top of the panels. Then, one must find more rigorous scenarios and, consequently, this will allow the development of more optimized maintenance plans and reduce the costs of projects. Furthermore, once this problem had been understood in more detail, some technological solutions have appeared, mainly around enhancing the materials’ optical properties to mitigate the dramatic consequences of sediments deposition [13].
It is also necessary to point out that there is a high interest in installing PV energy generation in desert or arid regions, as they present the best conditions for horizontal global irradiance [14,15]. However, in these regions, PV systems will face not only an increase in temperature but also additional deposition of sediments, creating unfavorable conditions for PV production [5,16]. In [17], the authors analyzed the impact of dust in a semi-arid climate in Morocco. Results showed that, after 30 days of exposure to dust, the efficiency of a PV system decreased by 4.4% and that, after 8 months of exposure, without cleaning, the decrease was by 27%. In most cases, dust storms cause losses during some days, leading to huge power losses, as much as 30%, as verified in [10]. Additionally, ref. [10] suggests that if one does not clean the panels, the power losses after the storm are higher due to the sediment deposition (3% higher in this case). Therefore, the mitigation of these effects on the operation of PV systems is a current challenge for all operators and for the development of new PV projects.
The impact of these conditions on the performance of PV energy generation can be predicted by the development of supporting models. The development of models capable of predicting the effects of dust and sediments on the performance of PV panels is a current state-of-the-art methodology to mitigate these effects [14,15,18]. These models may allow for better decision-making during the PV systems projects or during the planning of maintenance operations [8,19,20,21,22] and also in the development of active and passive technologies to mitigate these effects [23]. For example, in ref. [21], a review of strategies to mitigate the effect of sediments on PV panels was carried out, in ref. [22], a reliability analysis was performed on the degradation of different PV modules, and in ref. [8], a review of cleaning methods for PV modules was conducted. Another point of view is to categorize sediments in different clusters according to their impact on the performance of solar cells, namely due to their chemical, physical and optical properties [18].
Regarding the analysis of sediments and the development of models to estimate their influence on PV systems, several studies have been carried out for silicon-based PV technologies [14,15,24,25,26,27]. In [25], the authors proposed a model to predict the incidence angle-dependent attenuation for relevant soiling levels. In [26], a single-diode model was developed to consider the impact of environmental conditions on the PV panels’ performance. For CdTe PV technologies, further studies are required to evaluate their performance in such conditions. A more detailed analysis of these types of solar cells will help to compare its performance to silicon-based technologies. Some preliminary studies have already focused on the impact of dust and sand on CdTe panels [28]. However, a detailed analysis is required to allow the development of models to predict their effect on CdTe cell performance.
Following this research, this work analyzed and characterized the influence of sand on CdTe photovoltaic solar panels with different colors and transparencies. Note that these PV panels are intended to be integrated into the structure of buildings, due to their transparency. Therefore, the risk of dust or sand deposition is high. The effects of sand on the CdTe module parameters, which allow the characterization of the solar cell’s performance, were analyzed. An electrical model was also proposed to allow modeling of the effect of introducing sand into the production of CdTe photovoltaic solar energy.
The work is structured into five sections, including the introductory one. In Section 2, solar cells are introduced, focusing on CdTe solar cells. The methodology is presented in Section 3 and the experimental results are presented in Section 4. After the discussion in Section 5, the research conclusions are summarized in Section 6.

2. CdTe Solar Cells

Existing photovoltaic technology can be divided into three generations. First-generation solar cells use crystalline silicon (c-Si) technology and can be of two types—monocrystalline silicon and polycrystalline silicon. Second-generation cells use thin-film technology applied on rigid substrates and include thin-film solar cells based on a-Si, CdTe, and CIGS [29,30]. Third-generation cells include the most recent technologies—organic solar cells, dye-sensitized solar cells, and quantum dot cells [31].
In this research, the third-generation cadmium telluride (CdTe) solar cells were analyzed under different quantities of sediments. CdTe has an associated band gap of around 1.4–1.5 eV and, consequently, a maximum efficiency of 28–30%. It has a near-optimal direct band gap and a high absorption coefficient in the visible spectral range, namely between 500 nm (green) and 800 nm (red-infrared) [32,33]. Moreover, CdTe solar cells’ manufacturing processes are relatively easy to perform. Several deposition techniques, such as close-spaced sublimation or physical vapor deposition, are commonly used to deposit the polycrystalline layers of these solar cells [32].
To model the influence of the sand on the CdTe solar cell’s performance, the 1M5P model was used [1]. This model consists of a current source in parallel with a diode (p-n junction) and two resistances, one in series ( R s ) and one in parallel ( R s h ) [1,34,35]. The resistance R s helps to represent the voltage drop in the circuit to the external contacts and the resistance R s h helps to describe the existing leakage currents. The mathematical representation of the output current as a function of the output voltage and the five unknown parameters ( I p v , R s , R s h , I s and n) is described in Equation (1). I p v is the current generated by the photoelectric effect, i.e., due to the optoelectronic conversion. However, the p-n junction has active behavior, meaning that it can produce energy and, consequently, the current drops as the voltage is increased. The two aforementioned resistances were also added to the model, and the last term represents the current subtraction due to the leakage on the shunt resistance.
I = I p v I s ( e q ( V + R s I ) n k T 1 ) V + R s I R s h .
It is based on this model that the impact of sand on the CdTe solar cell’s performance was analyzed. Based on the change in the solar cell’s parameters, the maximum power point and solar cell efficiency was estimated. These results were compared with the experimental ones.

3. Methodology

To analyze the impact of sand deposition on the performance of CdTe photovoltaic panels, the following methodology was used for different colors and transparencies of CdTe panels: (i) experimental tests under real conditions and different densities of sand; (ii) identification of the 1M5P parameters; and (iii) characterization of the sand effects on the solar panels.

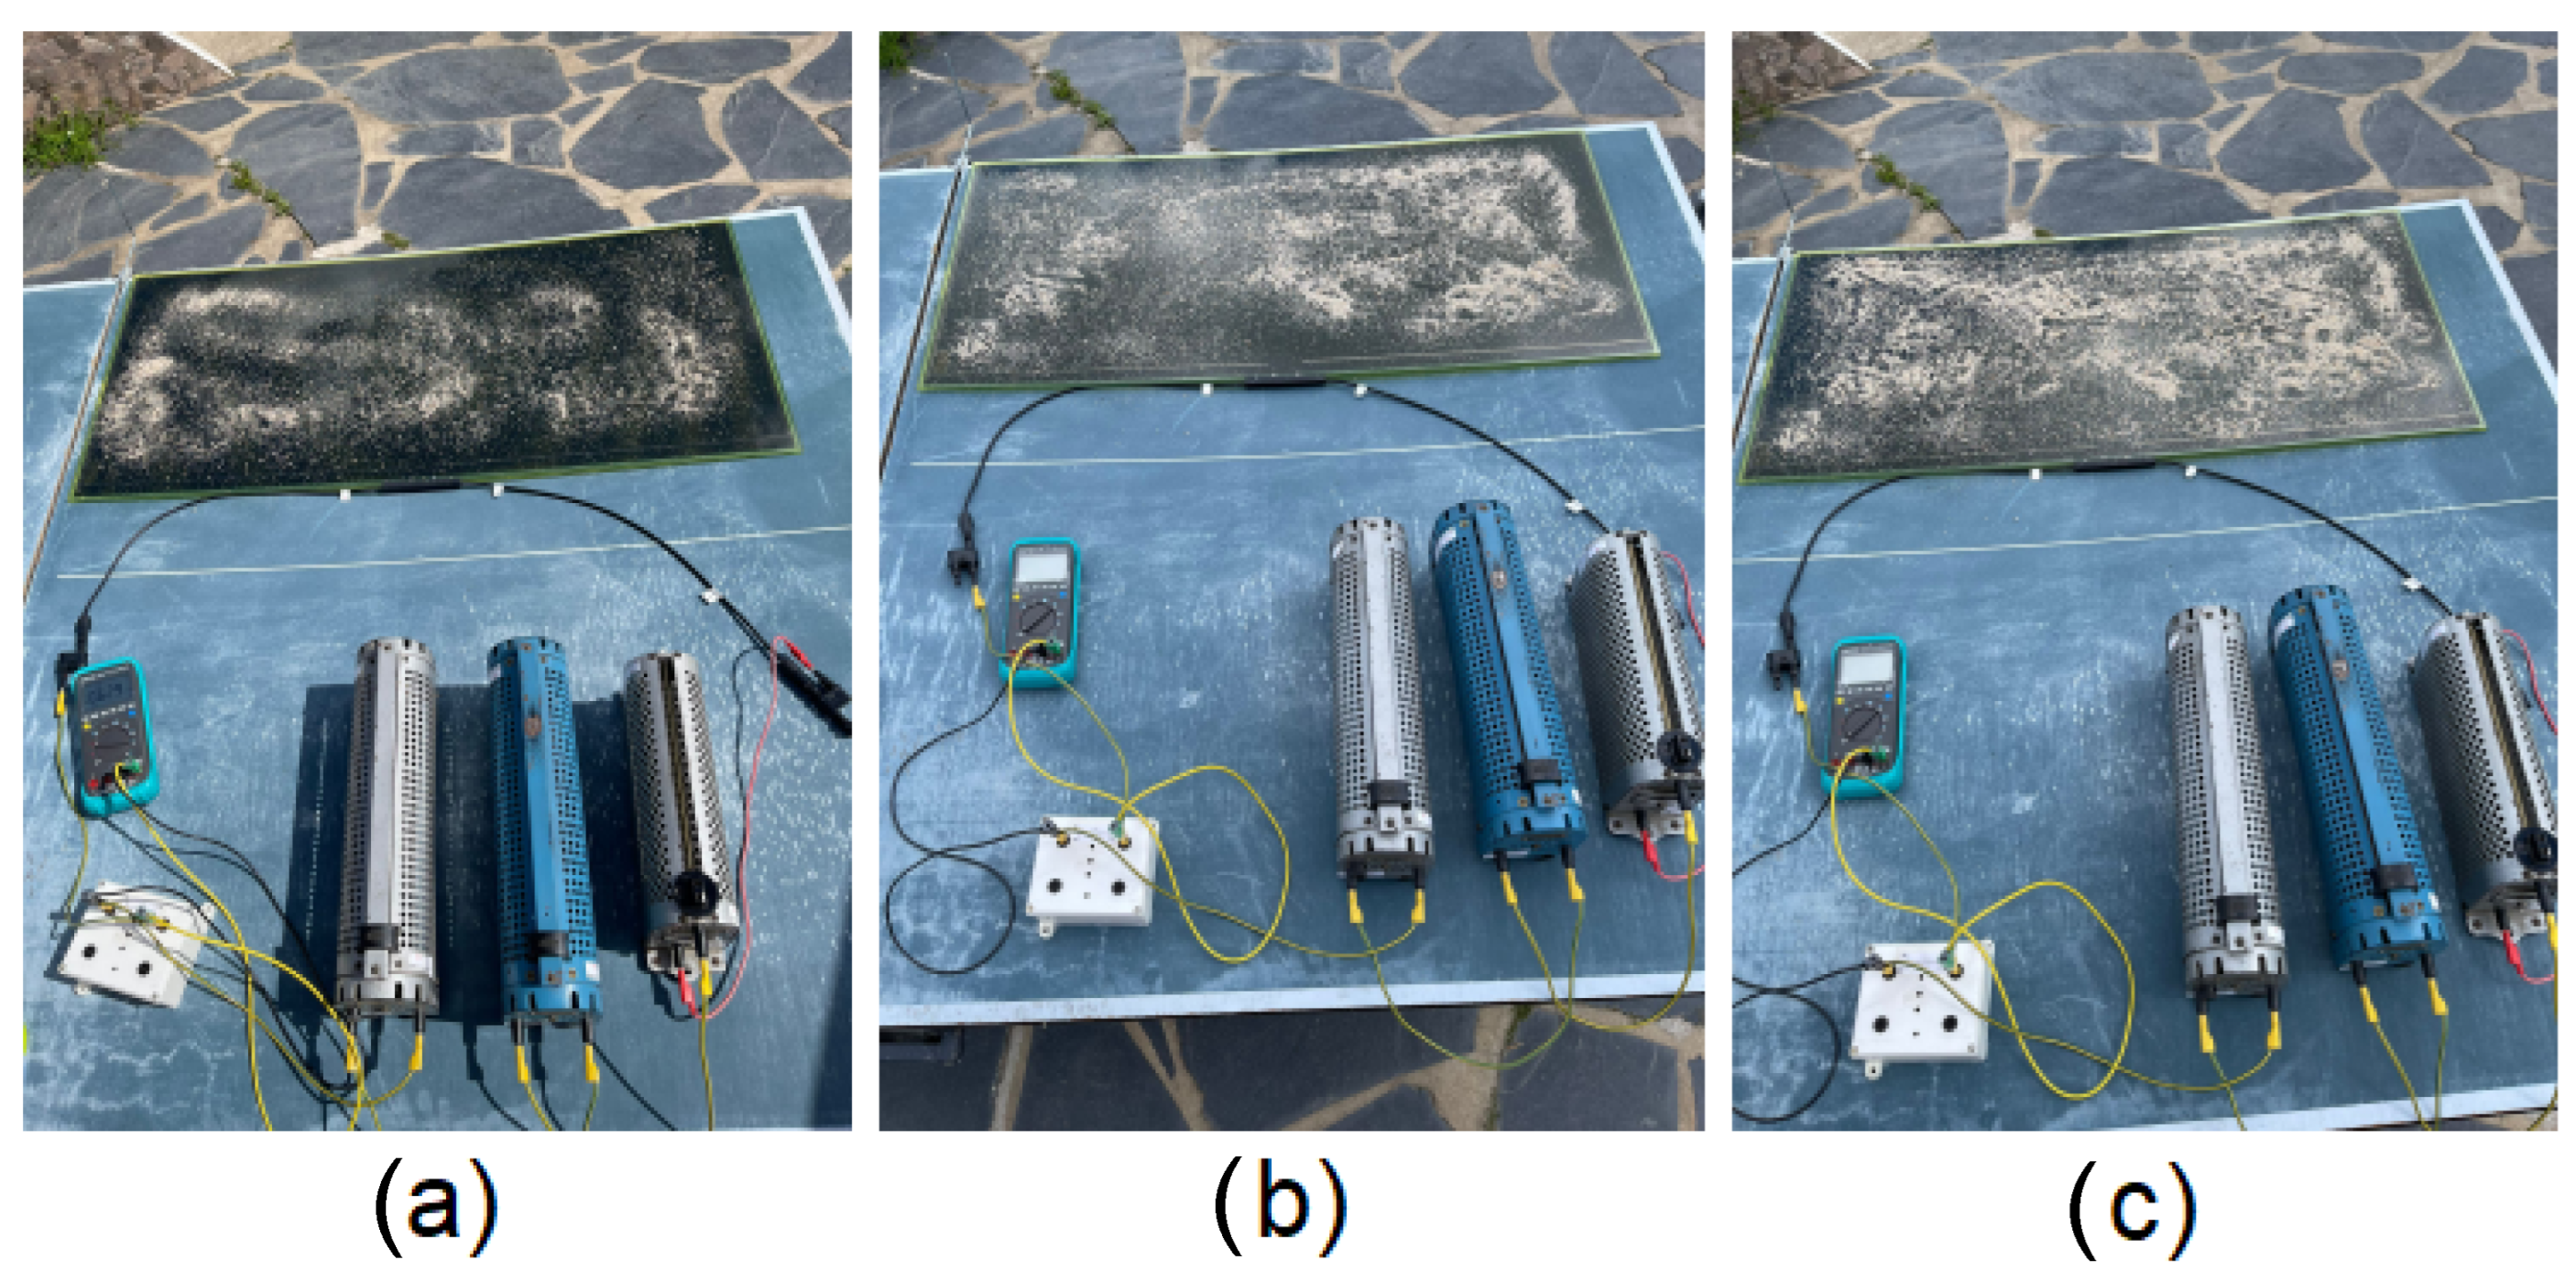
3.1. Experimental Procedures

Experimental tests were carried out to obtain the characteristic I-V and P-V curves of the CdTe photovoltaic solar modules. The load was composed of a resistance of 1 Ω and three rheostats of 945 Ω , 946 Ω , and 1890 Ω . They were in series and connected in parallel to the solar panels. By sweeping the rheostats, its resistance was varied and the current–voltage values were experimentally obtained using an oscilloscope. The oscilloscope had one channel connected to the panels’ terminals to measure their voltage and another channel connected to the 1 Ω resistance to measure its voltage (which equals the current). The experiments were carried out with clean solar panels and with three different densities of millimetre-sand (80 g/m2, 160 g/m2 e 240 g/m2), as presented in Figure 1. The values were set as the average densities verified in some cities, pointed out in [12]. Additionally, sand properties in Portugal were well-characterized in [36]. The experimental set-up is presented in this figure, for three different sand densities. Although the tests were performed using the oscilloscope, the multimeter connected to the resistance allowed us to verify the correct working of this circuit.
For this study, six CdTe photovoltaic solar panels of different colors and transparencies of 40% (grey, orange, red and yellow) and 50% (blue and green) were used.
The experiments were carried out under natural radiation and with a horizontal inclination. The tests were carried out on different days and at different hours. The same experimental procedure was applied to each panel: for a given hour, incident irradiance was measured at nine locations on the panel, as well as its temperature. After measuring the irradiance and temperature, five experimental tests were carried out for each of the following four cases: a clean solar panel and solar panels with three different densities of sand (80 g/m2, 160 g/m2 e 240 g/m2).
Regarding the cases in which sand was introduced into the solar panel, for each test, the sand was spread randomly and as uniformly as possible. In total, 255 valid experimental tests were considered. For each of the situations under analysis (no sand, 80 g/m2, 160 g/m2 e 240 g/m2), the moving average of the experimental data was obtained and the average I-V and P-V curves were calculated. Figure 2 presents one example of the measurements and the estimated I-V curve.

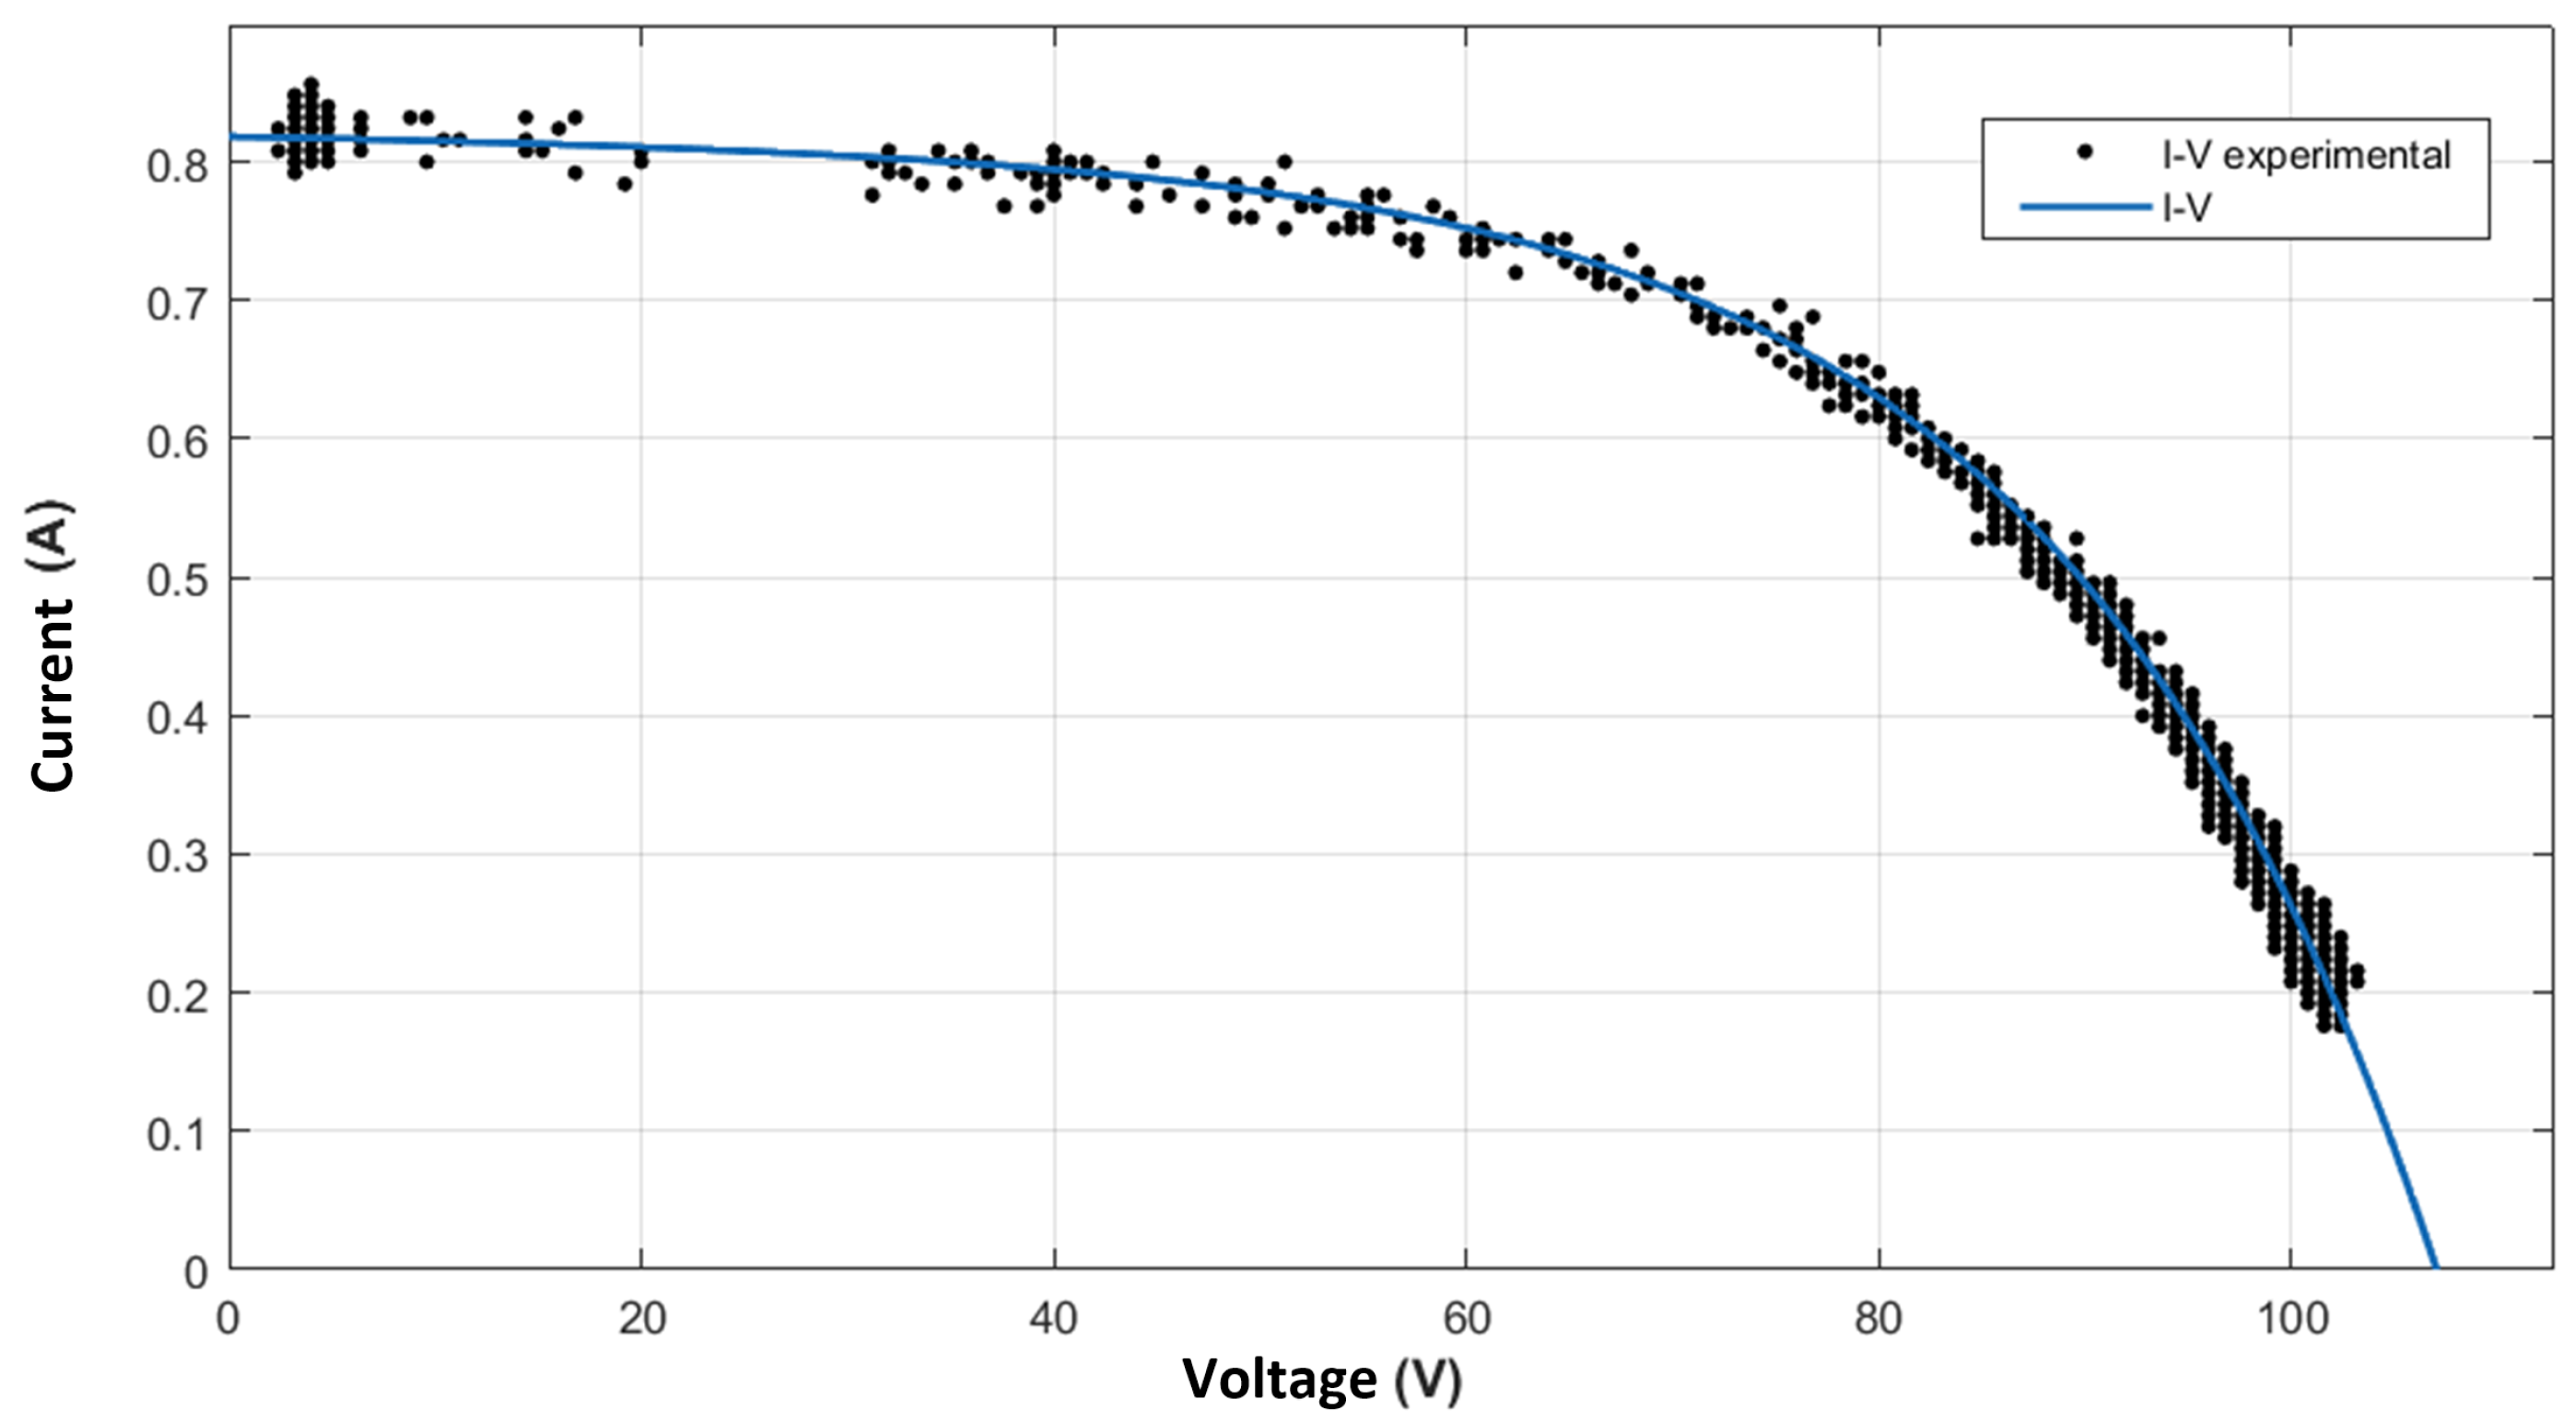
3.2. Method to Obtain 1M5P Unknown Parameters

To obtain the unknown parameters of the 1M5P model of a solar panel, the non-iterative method of Zhaoxu Song was used [37], which admits the possibility of obtaining these parameters based on characteristics of the I-V and P-V curves. According to Zhaoxu Song [37], in the I-V characteristic curve there are three important points: the short circuit point, the open circuit point, and the point of maximum power.
At the short-circuit point ( V = 0 ; I = I s c ):
I p v = I s c + I s ( e R s I s c N c e l u l a s n V t 1 ) + R s I s c R s h .
At the open-circuit point ( V = V o c ; I = 0 ):
I p v = I s ( e V o c N c e l u l a s n V t 1 ) + V o c R s h .
At the maximum power point ( V = V m p ; I = I m p ):
I p v = I m p + I s ( e V m p + R s I m p N c e l u l a s n V t 1 ) + V m p + R s I m p R s h .
For the same irradiance, the left sides of Equations (3) and (4) are the same, which means that the right side of both equations is an equality:
I s e V o c N c e l u l a s n V t + V o c V m p R s h I m p R s I m p R s h I s e V m p + R s I m p N c e l u l a s n V t = 0 .
To obtain the series resistance ( R s ) and the parallel resistance ( R s h ), one must consider (6) and (7), respectively. However, it should be mentioned that, for the resistances R s and R s h , the linearizations were applied roughly between the points [ 0.9 V o c ; V o c ] and [0; 0.1 V o c ], respectively [1].
I V 1 R s
I V 1 R s h .
Under the condition of the same irradiance, based on (2) and (3) and assuming the approximation I s e V o c N c e l u l a s n V t > > I s e R s I s c N c e l u l a s n V t , due to V o c > > R s I s c , it is possible to arrive at [1]:
I s e V o c N c e l u l a s n V t = I s c ( 1 + R s R s h ) V o c R s h .
In this way, it can be observed that the current I s is given by:
I s = I s c ( 1 + R s R s h ) V o c R s h e V o c N c e l u l a s n V t .
By substituting the current expression I s into (5), an equation restricted to one unknown was obtained, which in this case was the ideality factor, n. Consequently, through (9), the saturation reverse current of the diode was calculated, I s , and from (2) the photovoltaic current, I p v , was calculated [1].

3.3. Modelling the Sand Effect on CdTe Solar Panels

To model the sand effect on the CdTe solar panels, we considered a white box model where the input variables were the unknown 1M5P parameters ( I p v , I s , R s , R s h e n) and the output results were the maximum power generated ( P m a x ), the efficiency ( η ), and the fill factor (FF).
Bearing in mind that, for each panel, the information was collected for different irradiances, the currents and power were normalized with the incident irradiance ( I p v / G , I s c / G and P m a x / G ) [1,38]. In this way, the results of the model’s input variables were interpolated as a function of the sand density. Any variation in one of the input parameters will have an impact on the output parameters. Through the information taken from the interpolations of the input variables and considering related conditions such as incident irradiance (G), the panel temperature ( T p v ), the open circuit voltage ( V o c ) and the density of sand, an empirical model was developed to estimate the fill factor ( F F ), the maximum output power ( P m a x ), and the efficiency ( η ) of any of the six photovoltaic solar panels under study.

4. Experimental Results

In this section, the experimental values and the respective average and maximum and minimum deviations of the input parameters (unknown parameters of the 1M5P model: I p v / G , n, R s , R s h and I s ) and output parameters ( F F , P m a x / G e η ) are presented. Parameters such as short circuit current ( I s c ) and maximum output power ( P m a x ) were obtained from the average I-V and P-V characteristics. The fill factor and efficiency were obtained from (10) and (11), respectively [1].
F F = P m a x V o c I s c 1 R s I s c V o c 1 V o c R s h I s c
η = P m a x G A p v ,
where G represents the irradiance and A p v represents the active area of the solar panel.
The unknown parameters of the 1M5P model were obtained through the non-iterative method mentioned above [37]. Finally, the results of the model considering the effect of sand on solar panels are presented.

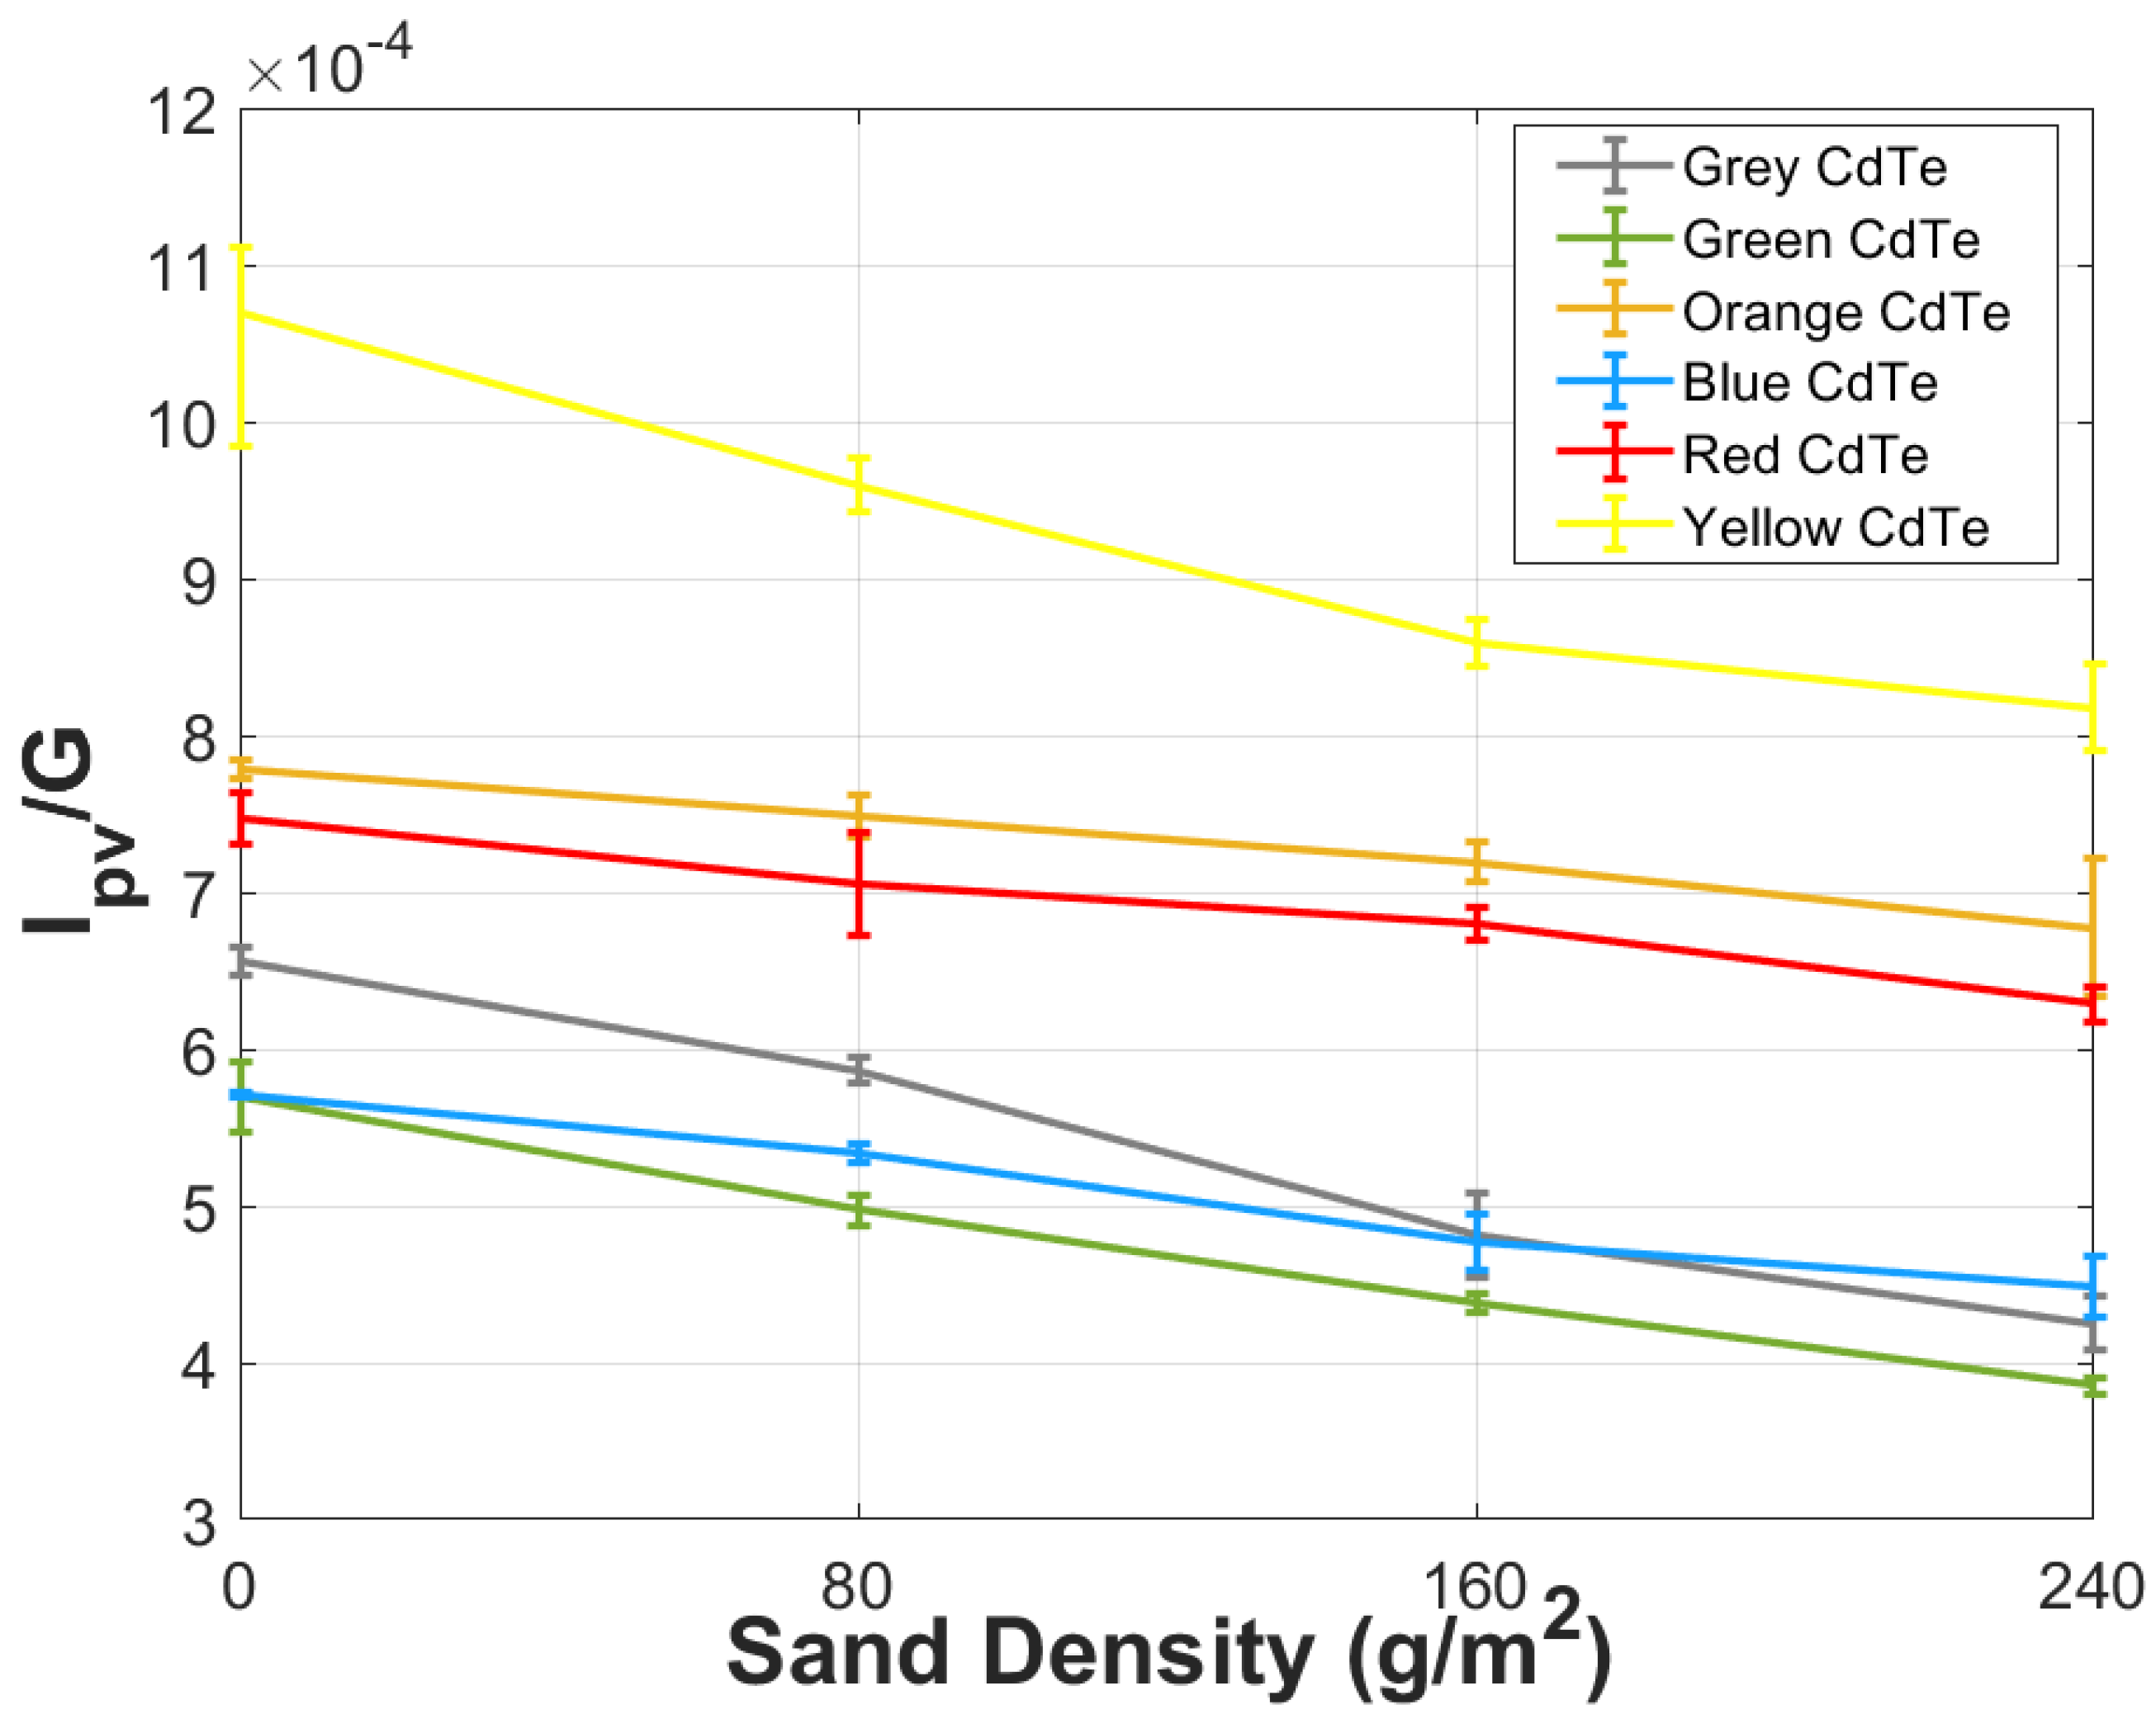
4.1. Impact of Sand in the Input Parameters of 1M5P

In all panels, the currents show an approximately linear characteristic with increasing sand density, as presented in Figure 3 and Figure 4. This behavior of the currents is due to the decrease in the capture of irradiance from the photovoltaic cells due to the shading caused by the sand. Regarding their absolute values, the yellow panel showed the highest ratios of I s c / G and I p v / G . However, considering the effect of sand, the orange and red panels showed the lowest losses with −13.0% and −15.8% between the no sand and the 240 g/m2 of sand. The grey and green ones presented the highest losses with −35.3% and −32.5%, respectively. These results were expected, since the increase of sand leads to a decrease in the converted irradiance and an increase in the cell’s temperature. Then, considering the incident irradiance constant, the photogenerated and short-circuit currents will decrease.
The characteristics of the resistances, shown in Figure 5 and Figure 6, are approximately linear with the increase of the sand density. As the sand density increases, an increase of R s is noted, in general, for all panels. In the blue panel, the highest values of this parameter were obtained and the lowest values were obtained for the yellow panel. The grey and green panels are the most sensitive to the presence of sand in this parameter, with an increase of 53.8% and 32.0%, considering the no sand and 240 g/m2 cases, respectively. The yellow and orange panels presented the lowest increase, with about 17.8% and 14.6% between the extreme cases, respectively.
Regarding the R s h resistance, its tendency is to decrease with increasing sand density. The yellow, grey, and green panels have R s h values that are considerably higher than those of the orange, blue, and red panels. However, the yellow, grey, and green panels present a higher decrease when in the presence of the 240 g/m2 of sand, 32.1%, 35.9%, and 37.5%, respectively. The other panels only presented a decrease of less than 6.0%.
The increasing of R s resistance and the decreasing of R s h resistance with the introduction of sand makes sense because the functioning of the panels deviates from the best situation (clean panel). In the ideal situation, R s tends to zero and R s h tends to infinity. This means that, ideally, the junctions’ leakage losses are null (characterized by R s h = , the resistance that subtracts current that should flow from the current source to the output terminals) and that the contact losses are also null (characterized by R s = 0 , the resistance that subtracts voltage from the terminals). Among several effects, the increase in the sand density deposited on the panel decreases the overall irradiance and increases the panels’ temperature. The investigation by João Guilherme Santos [28] with the same panels also revealed this behavior of the resistors with the addition of sand to the panels.
Regarding the ideality factor, n, cadmium telluride is a compound semiconductor, which makes it difficult to find a value typical value for this parameter. From the literature, theoretical/tabled values for this parameter can vary between 1.5 and 2 [28,39,40,41]. For the situation where the panel is clean, ideality factors varied between these values. With the introduction of sand to the solar panels, it was found, as verified in Figure 7, that the values of n, in general, decrease. One of the reasons for this decrease can be explained by the increase in the temperature of the panels caused by the addition of sand. Several studies have already shown that the ideality factor decreases with the increasing temperature of solar cells [42,43,44,45,46].
The results of the I s average current show that this is the parameter that suffered the greatest variations with the introduction of sand, as presented in Figure 8 and Figure 9. For example, in the yellow, grey, and red panels, the results for the cases in which the panels were clean and with 240 g/m2 of sand diverge by about three orders of magnitude ( 10 3 ). It is noted that, as a general rule, this parameter tended to decrease with the presence of sand, and the discrepancy between the extreme cases (panel without sand and panel with 240 g/m2) is notable. This effect can be corroborated by some research studies. The study by Mohammed Alaani [47] found values of I s between orders of magnitude 10 8 and 10 7 and the Bin Lv [48] study found values between orders of magnitude 10 7 and 10 5 . As in Figure 8 and Figure 9, our results show a range between 10 6 and 10 7 for the clean panel and between 10 5 and 10 6 for the panel with the maximum sand density. Since I S is also the dark current, the value obtained with null optical power incident on the solar cell, its variation with increasing sand density is a consequence of the temperature increase.
Table 1 presents a summary of the changes in the input parameters of the 1M5P model, between the no sand and the 240 g/m2 of sand cases, for all panels. As can be seen, the panels presenting the lowest impact due to the presence of sand are the orange and red ones.

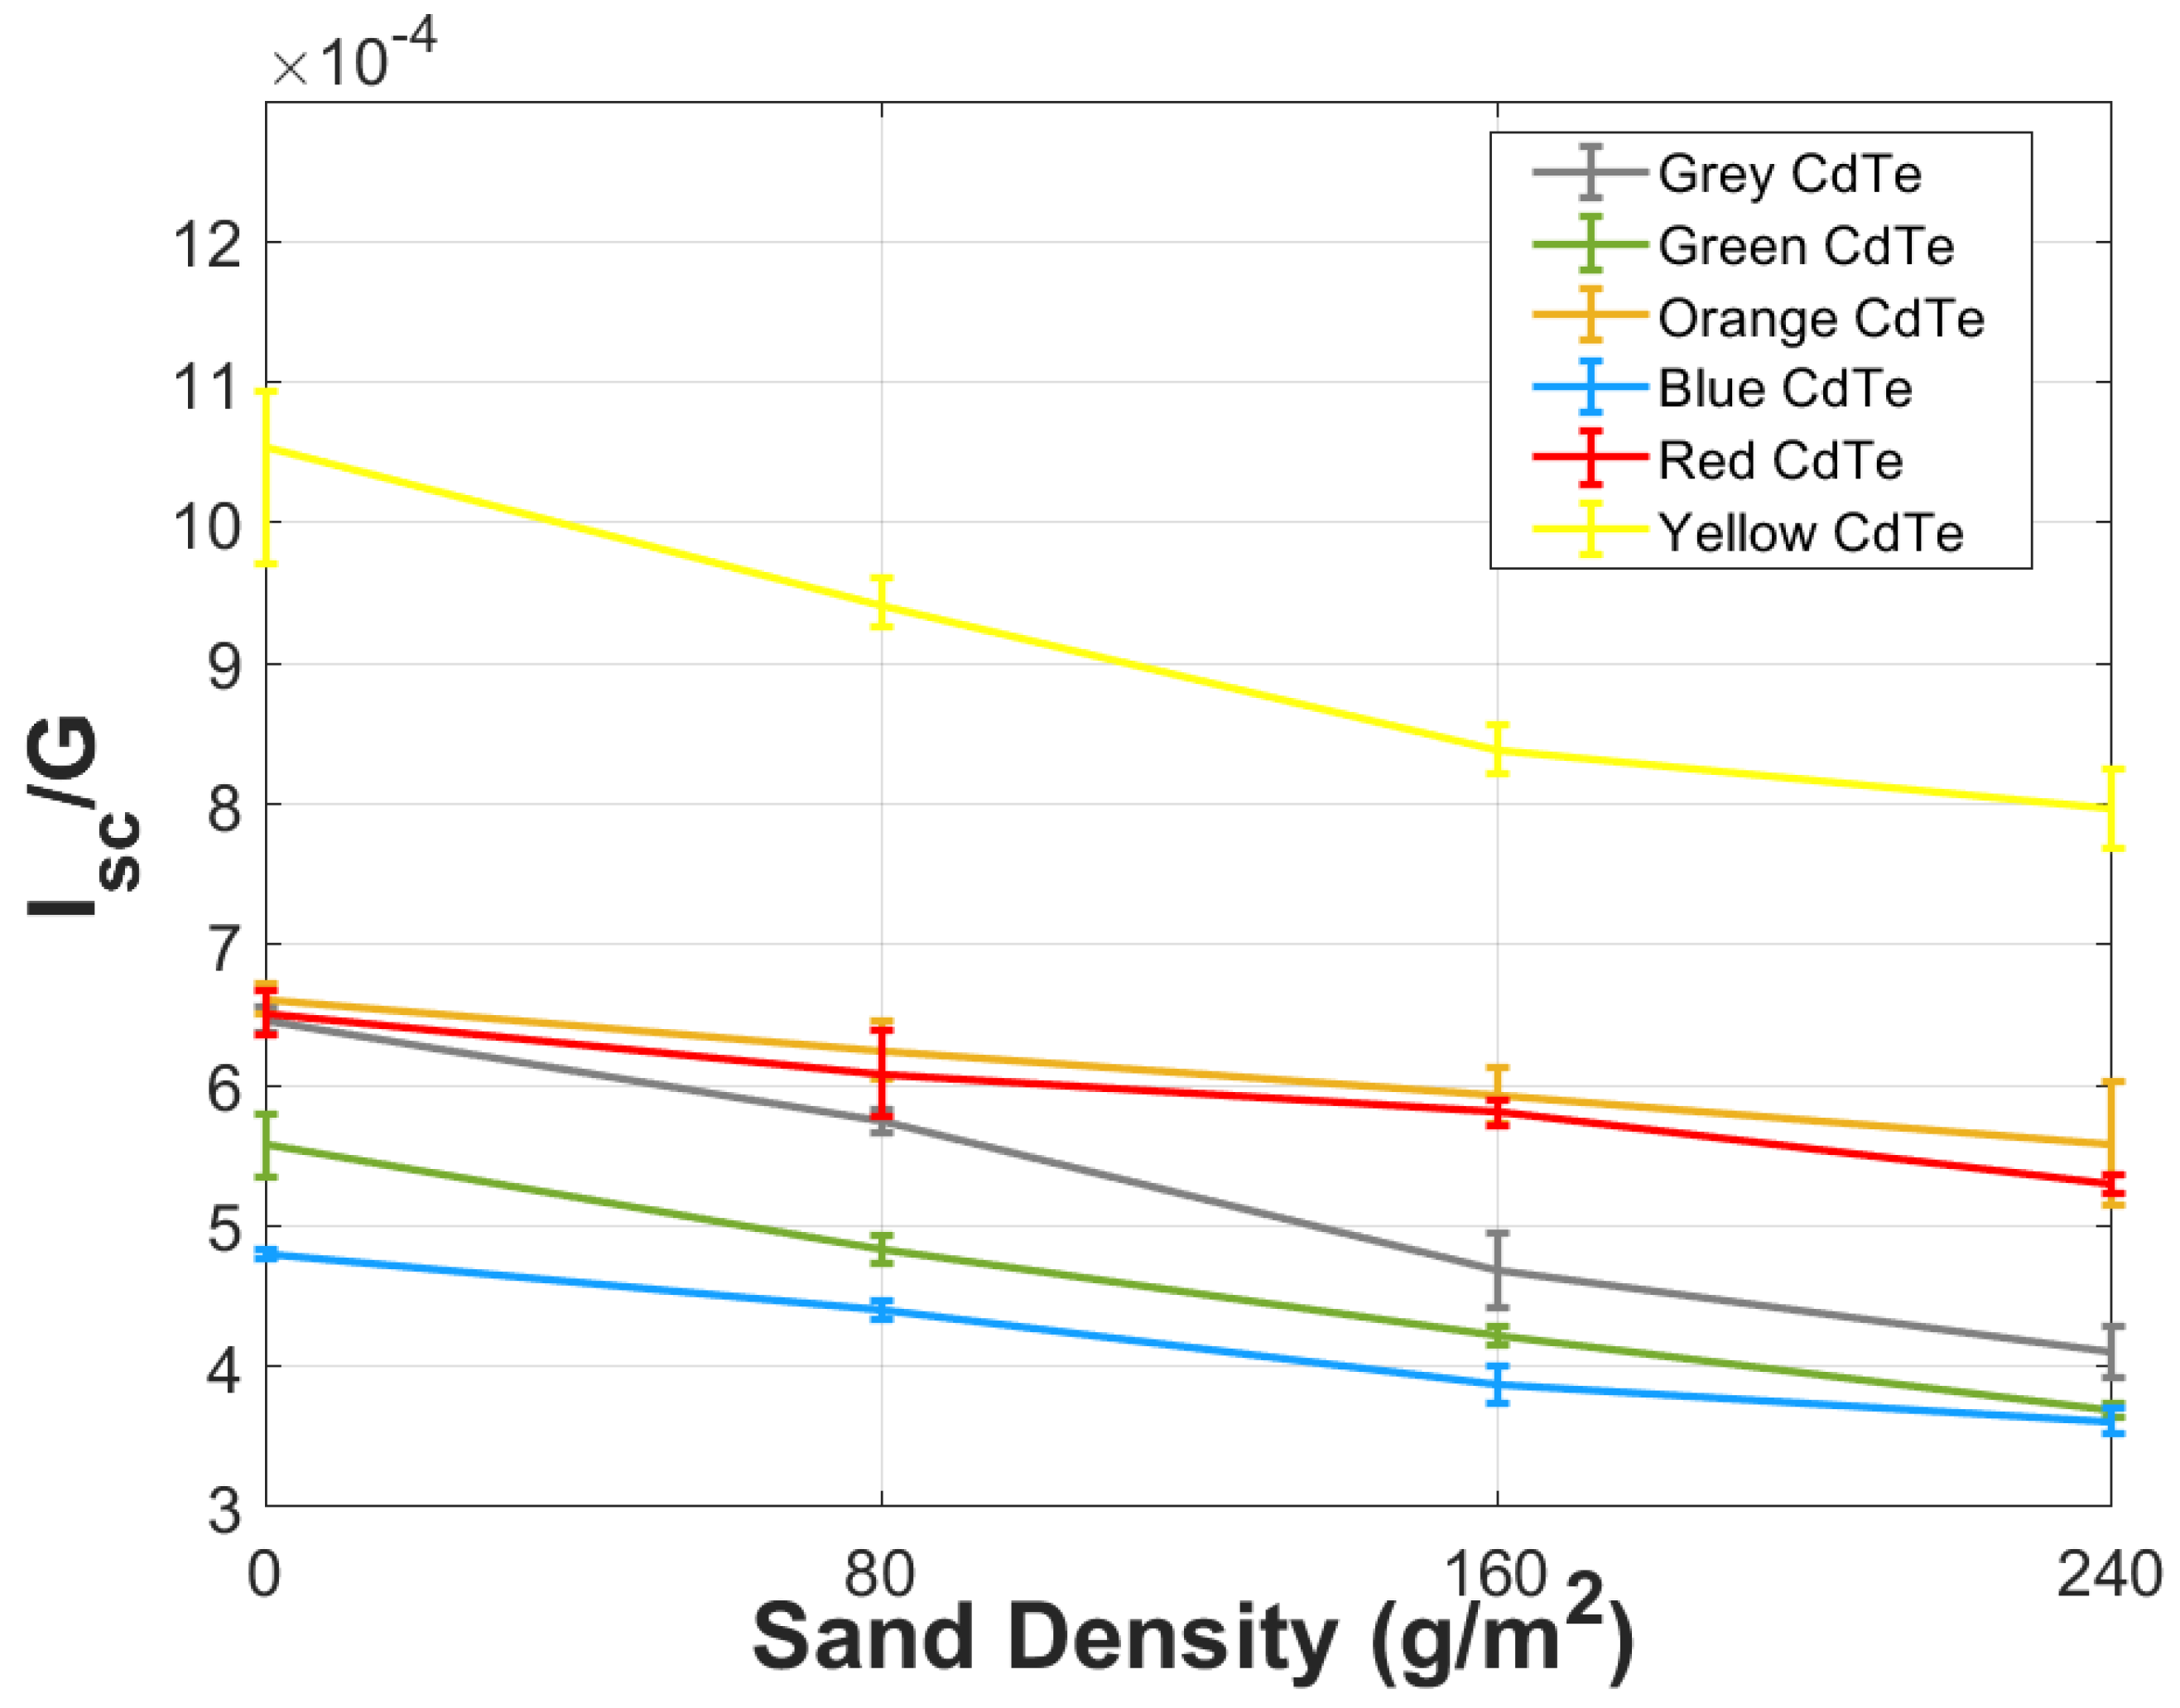
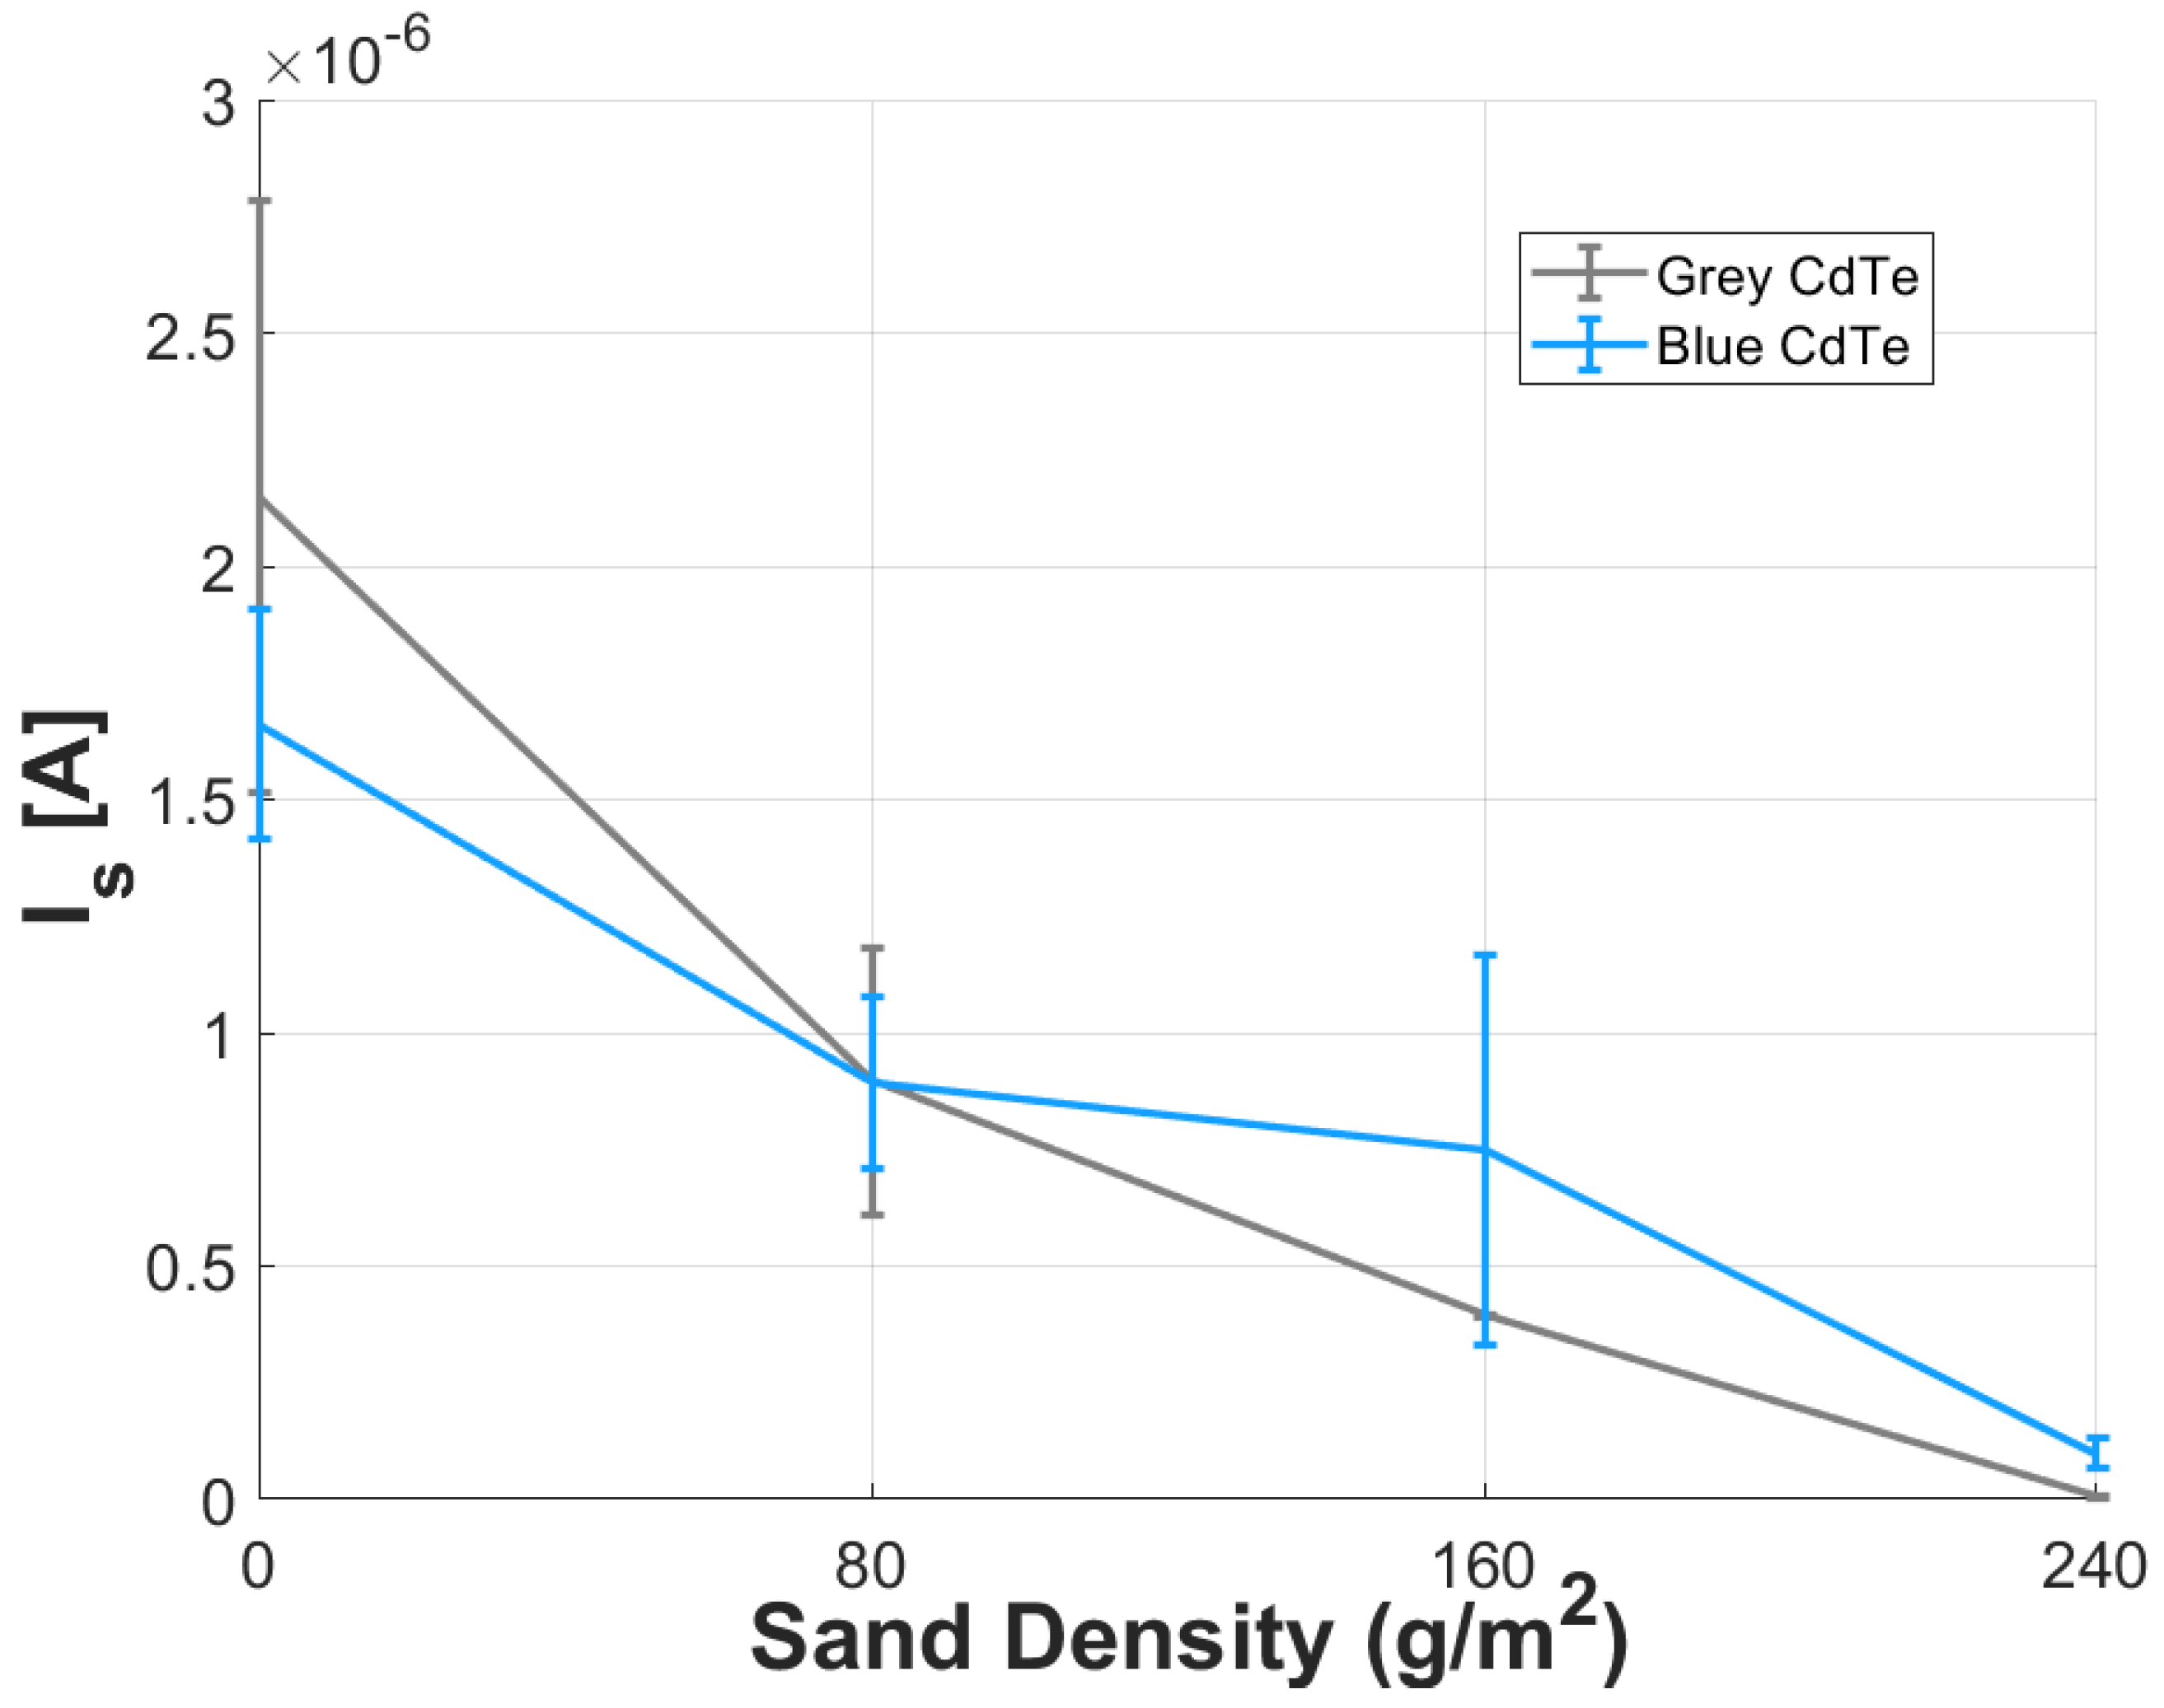
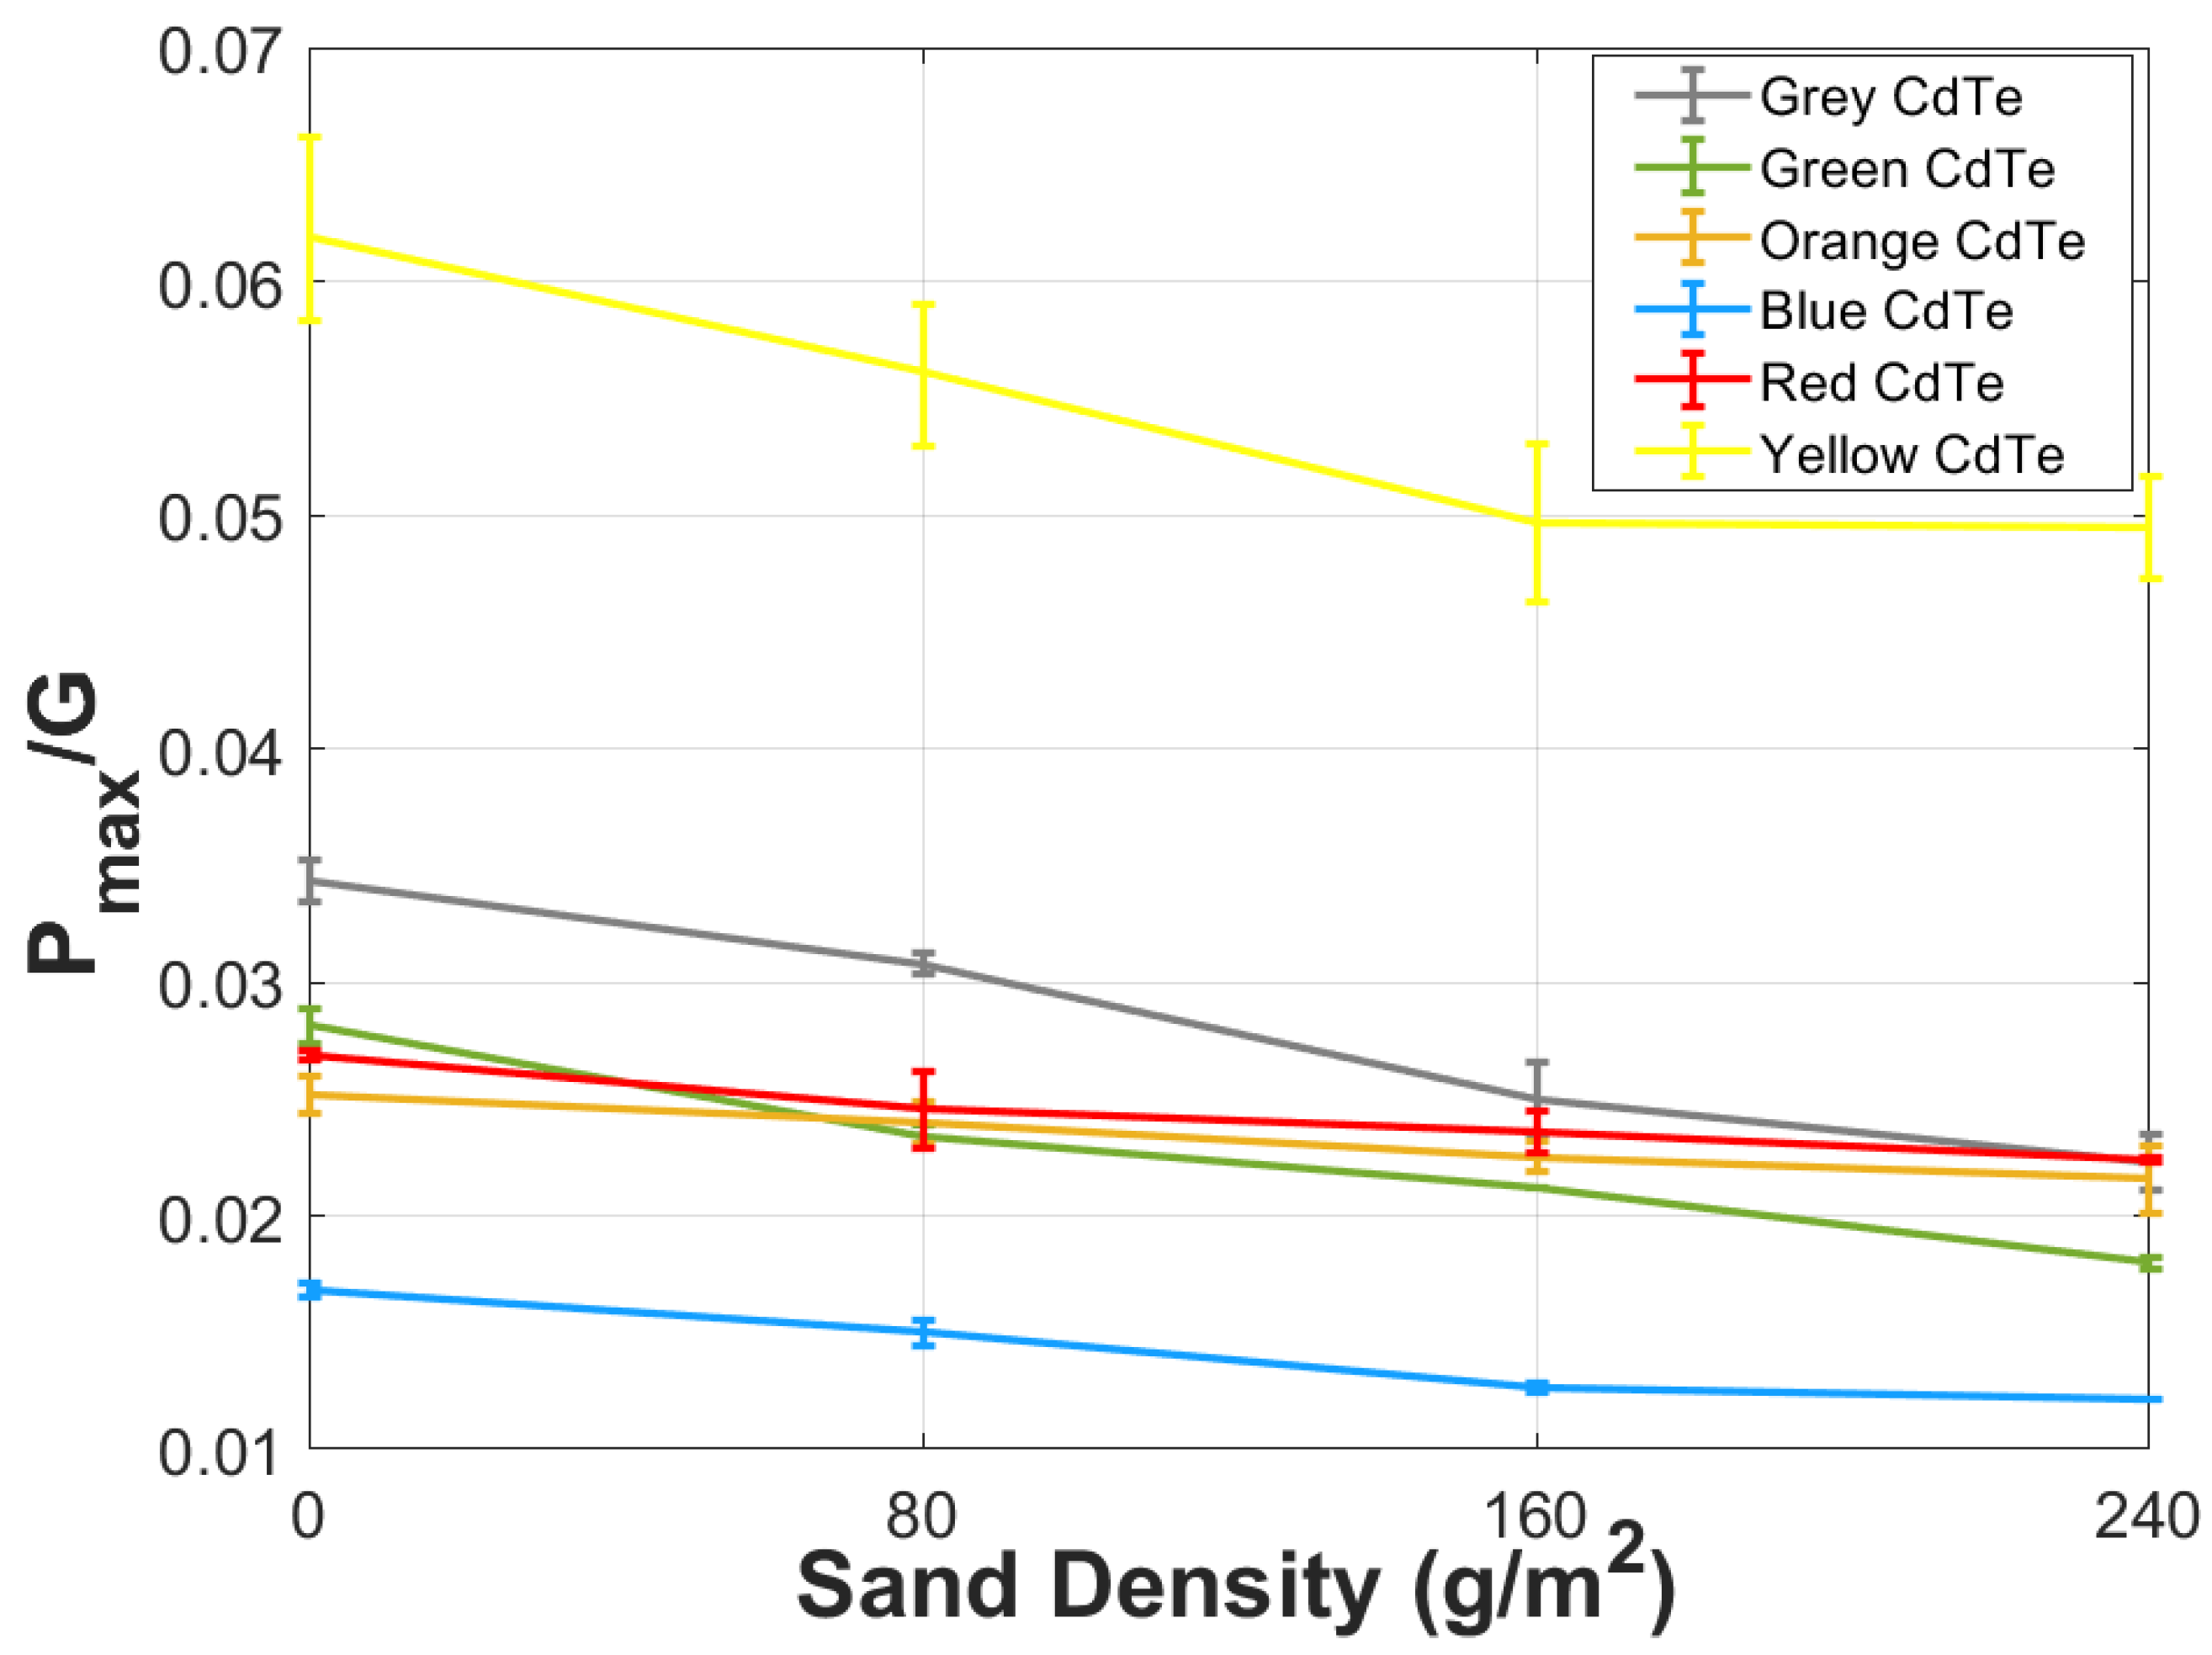
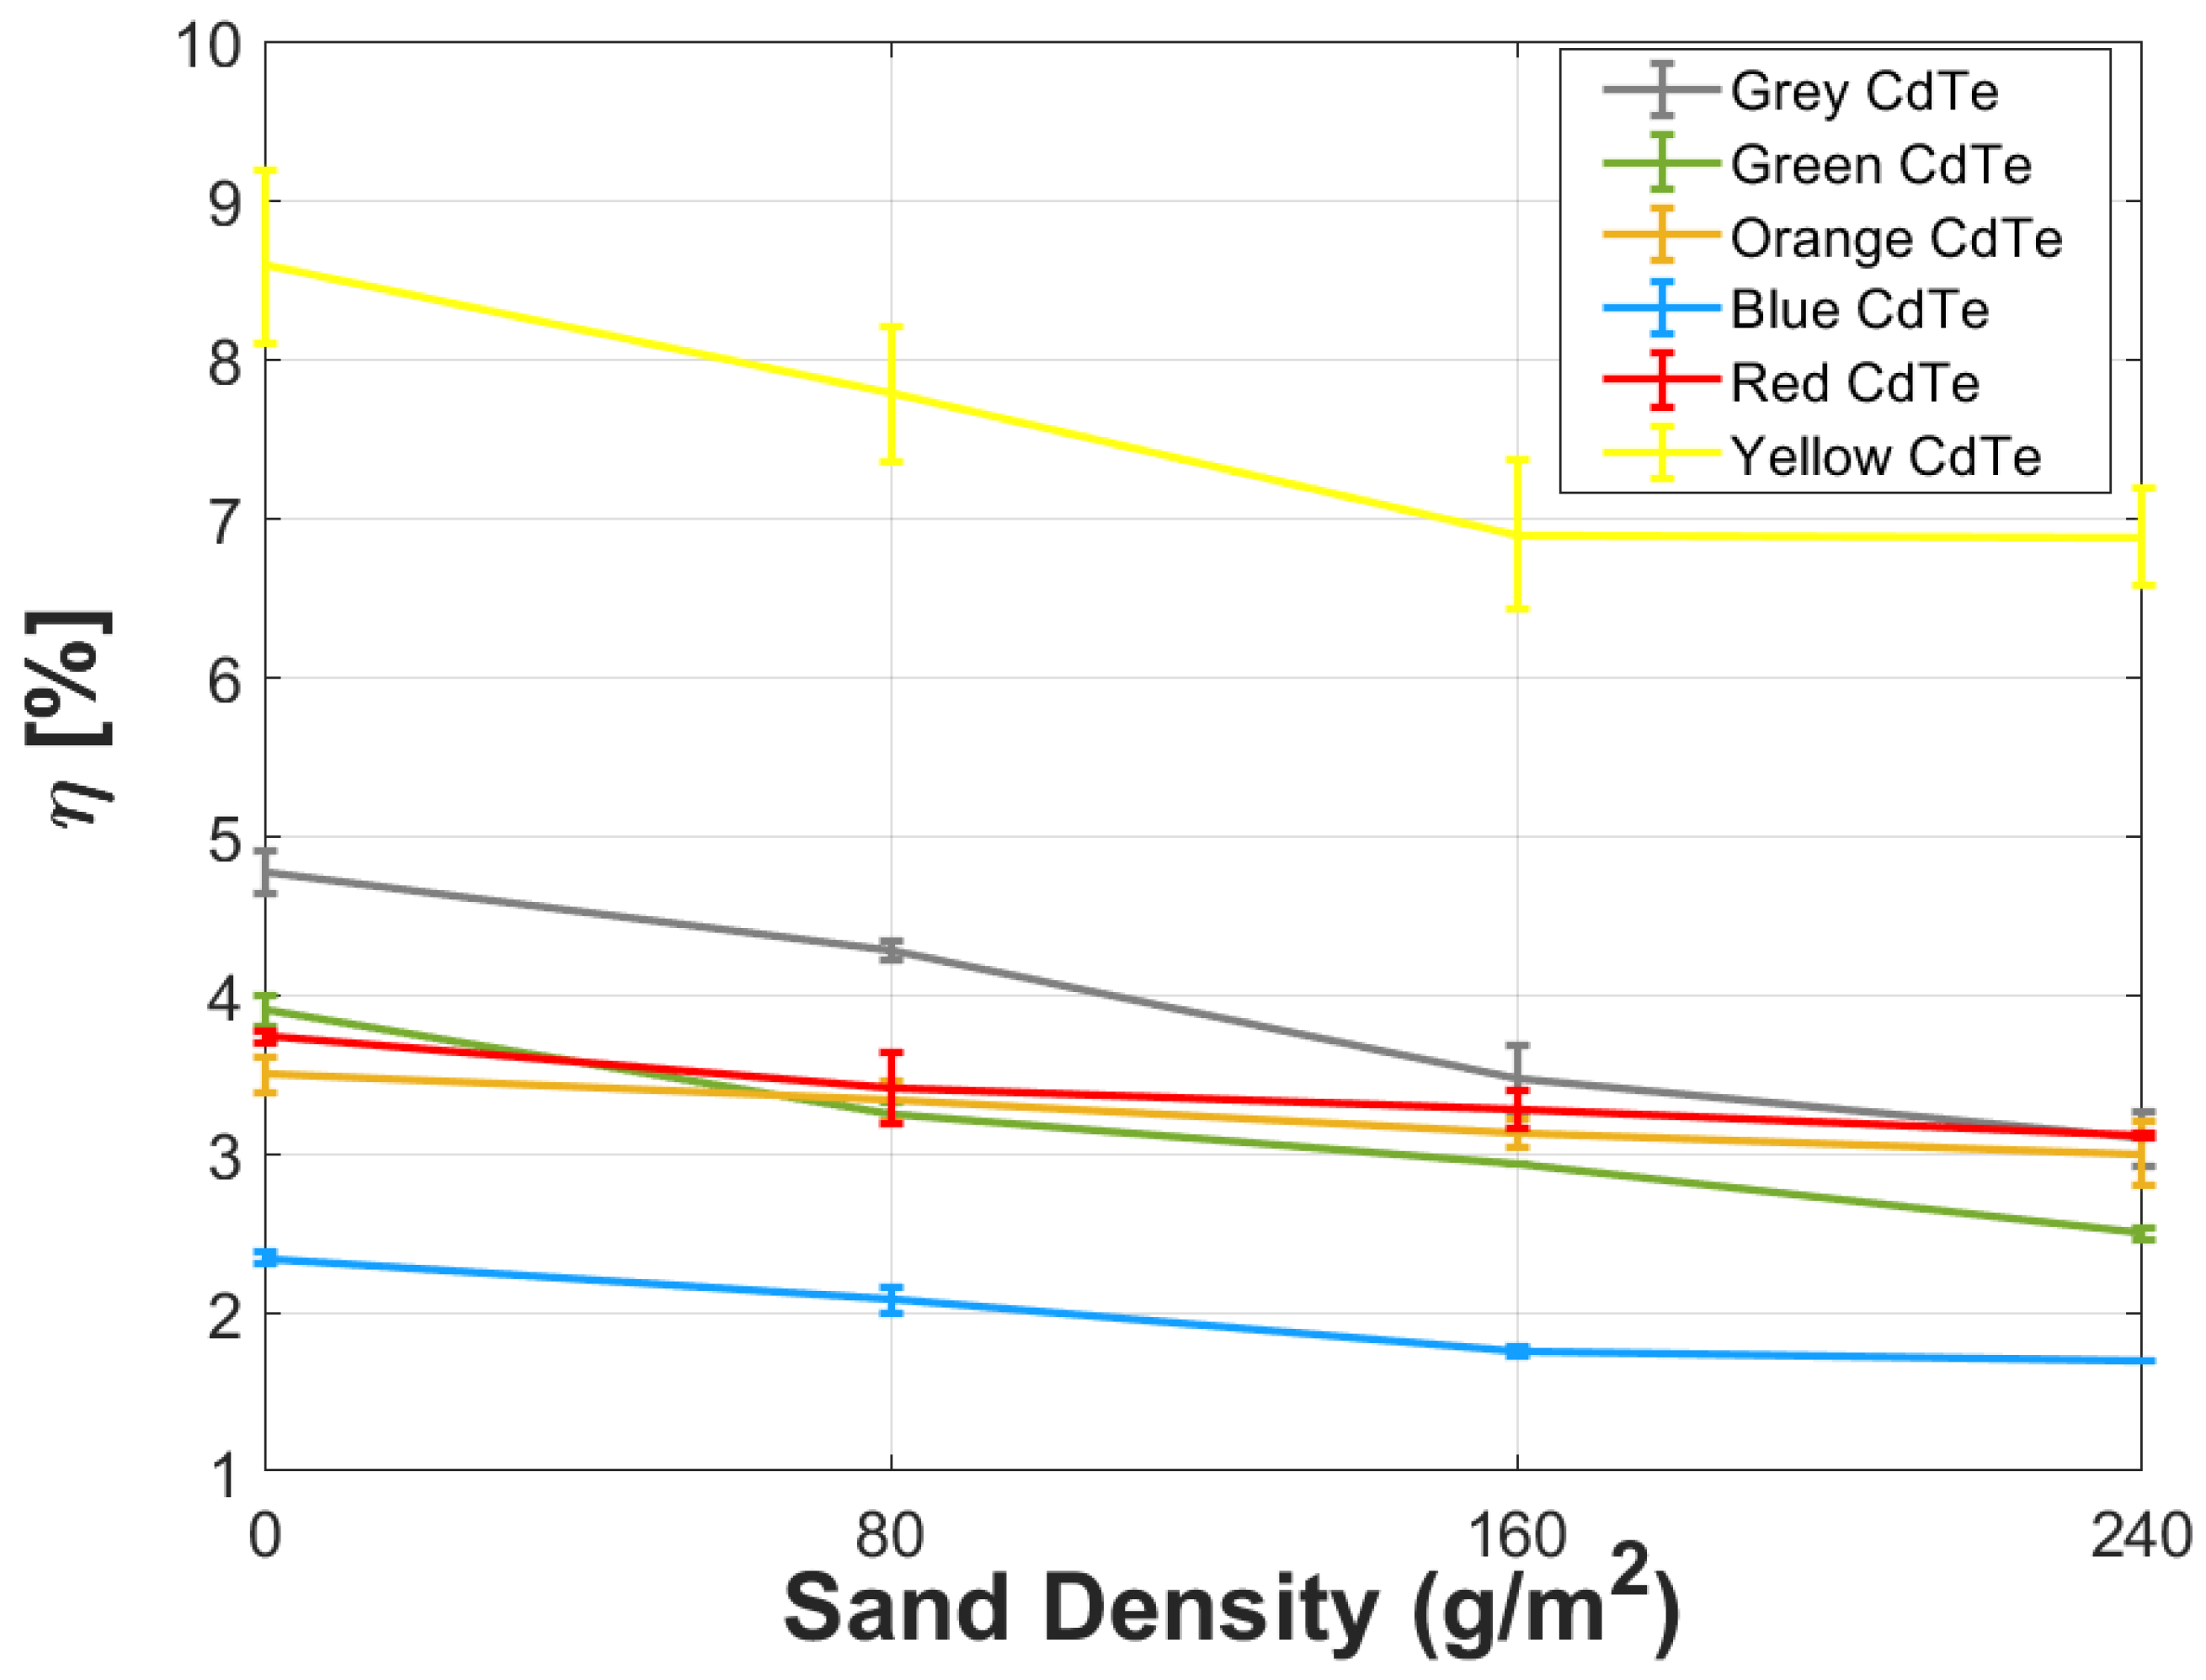
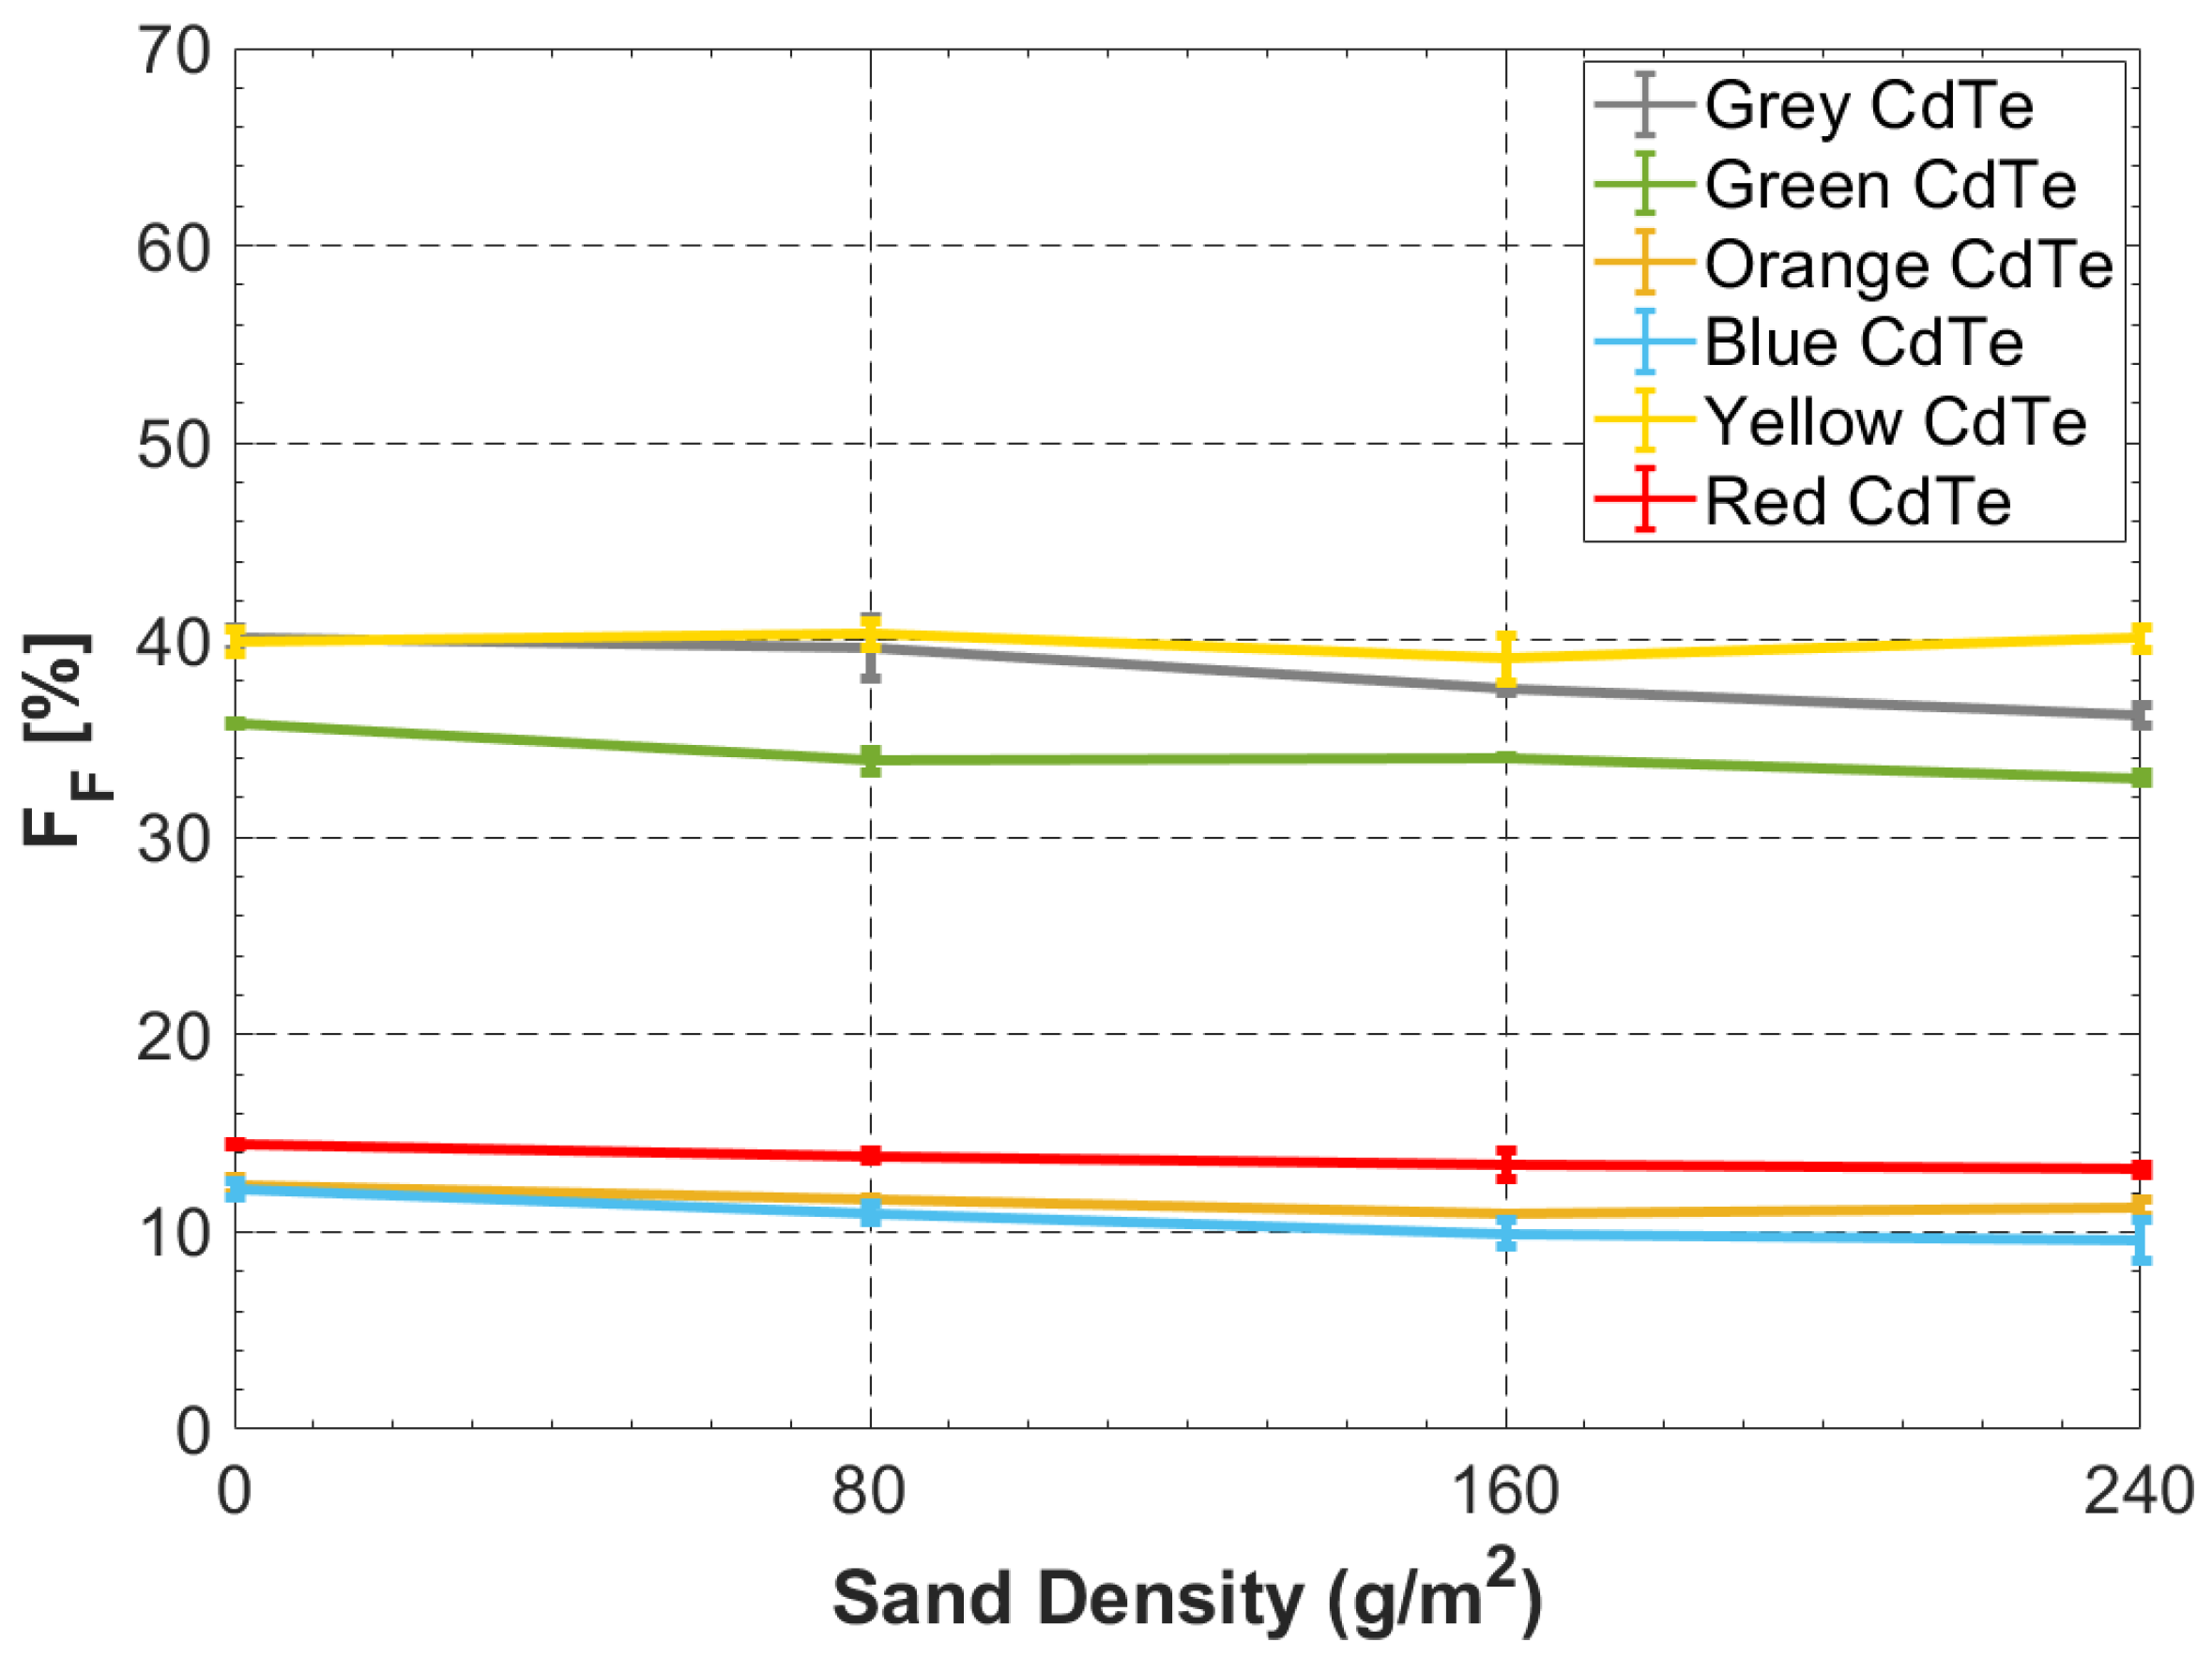
4.2. Impact of Sand in the Output Parameters of 1M5P

By analyzing the maximum power and efficiency responses of the panels, respectively, it can be seen in Figure 10 and Figure 11 that the behavior is similar in all panels. These two parameters decrease with increasing sand density, showing an approximately linear relationship. It is necessary to highlight the results of the yellow panel since they exceed the performance of the other panels. The red and orange panels present the lowest decrease in performance with 17% and 14%, respectively. The grey, green, and blue panels showed the highest losses of, approximately, −35%, −36%, and −28%, respectively. These can be justified by the decrease of I p v / G and R s h and the increase of R s , verified in the previous section for each panel.
Regarding the results of the fill factor ( F F ) presented in Figure 12, the differences in values of the yellow, grey, and green panels in relation to the orange, blue, and red panels are highlighted. The first group of panels showed higher F F values. The values of F F decrease with the introduction of sand. This can be explained mostly by the variations of R s and R s h . The highest reduction is obtained for the blue panel, with a maximum decrease of 22%. The yellow panel has the lowest change in F F , presenting a maximum reduction of 2.2%. The average reduction of F F , among all panels, is around 9.5% for 240 g/m2 of sand.

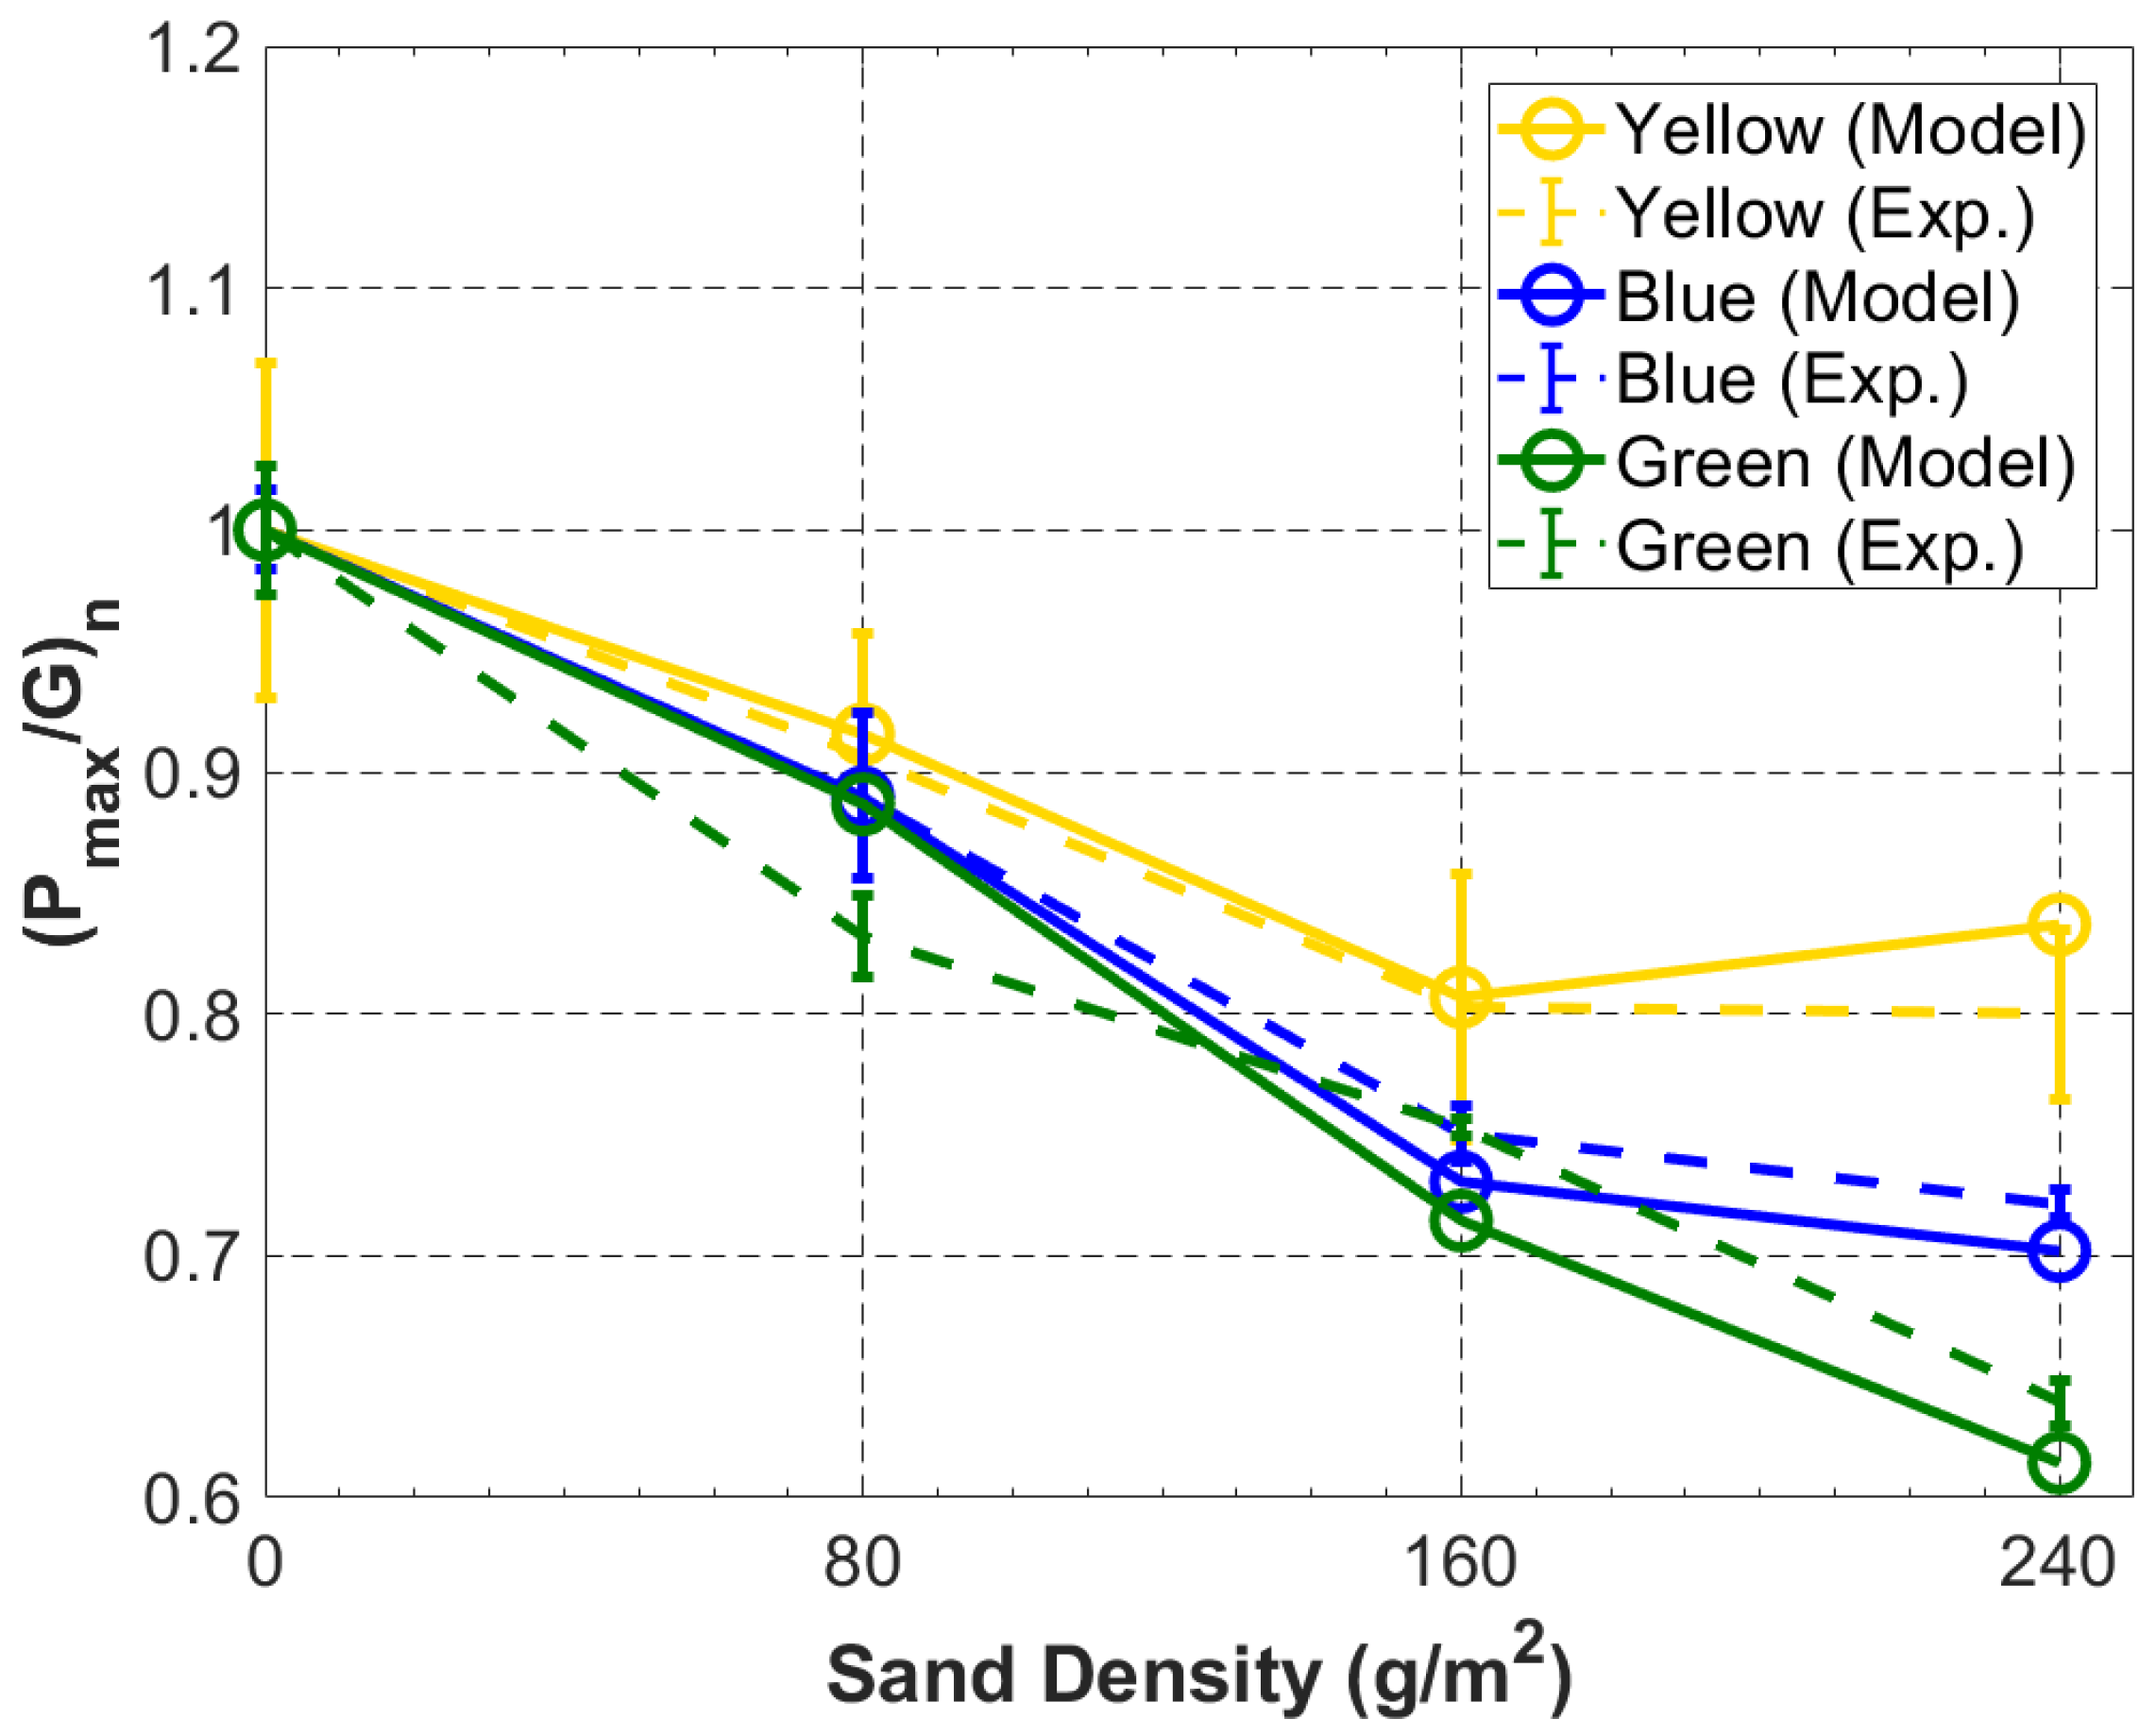
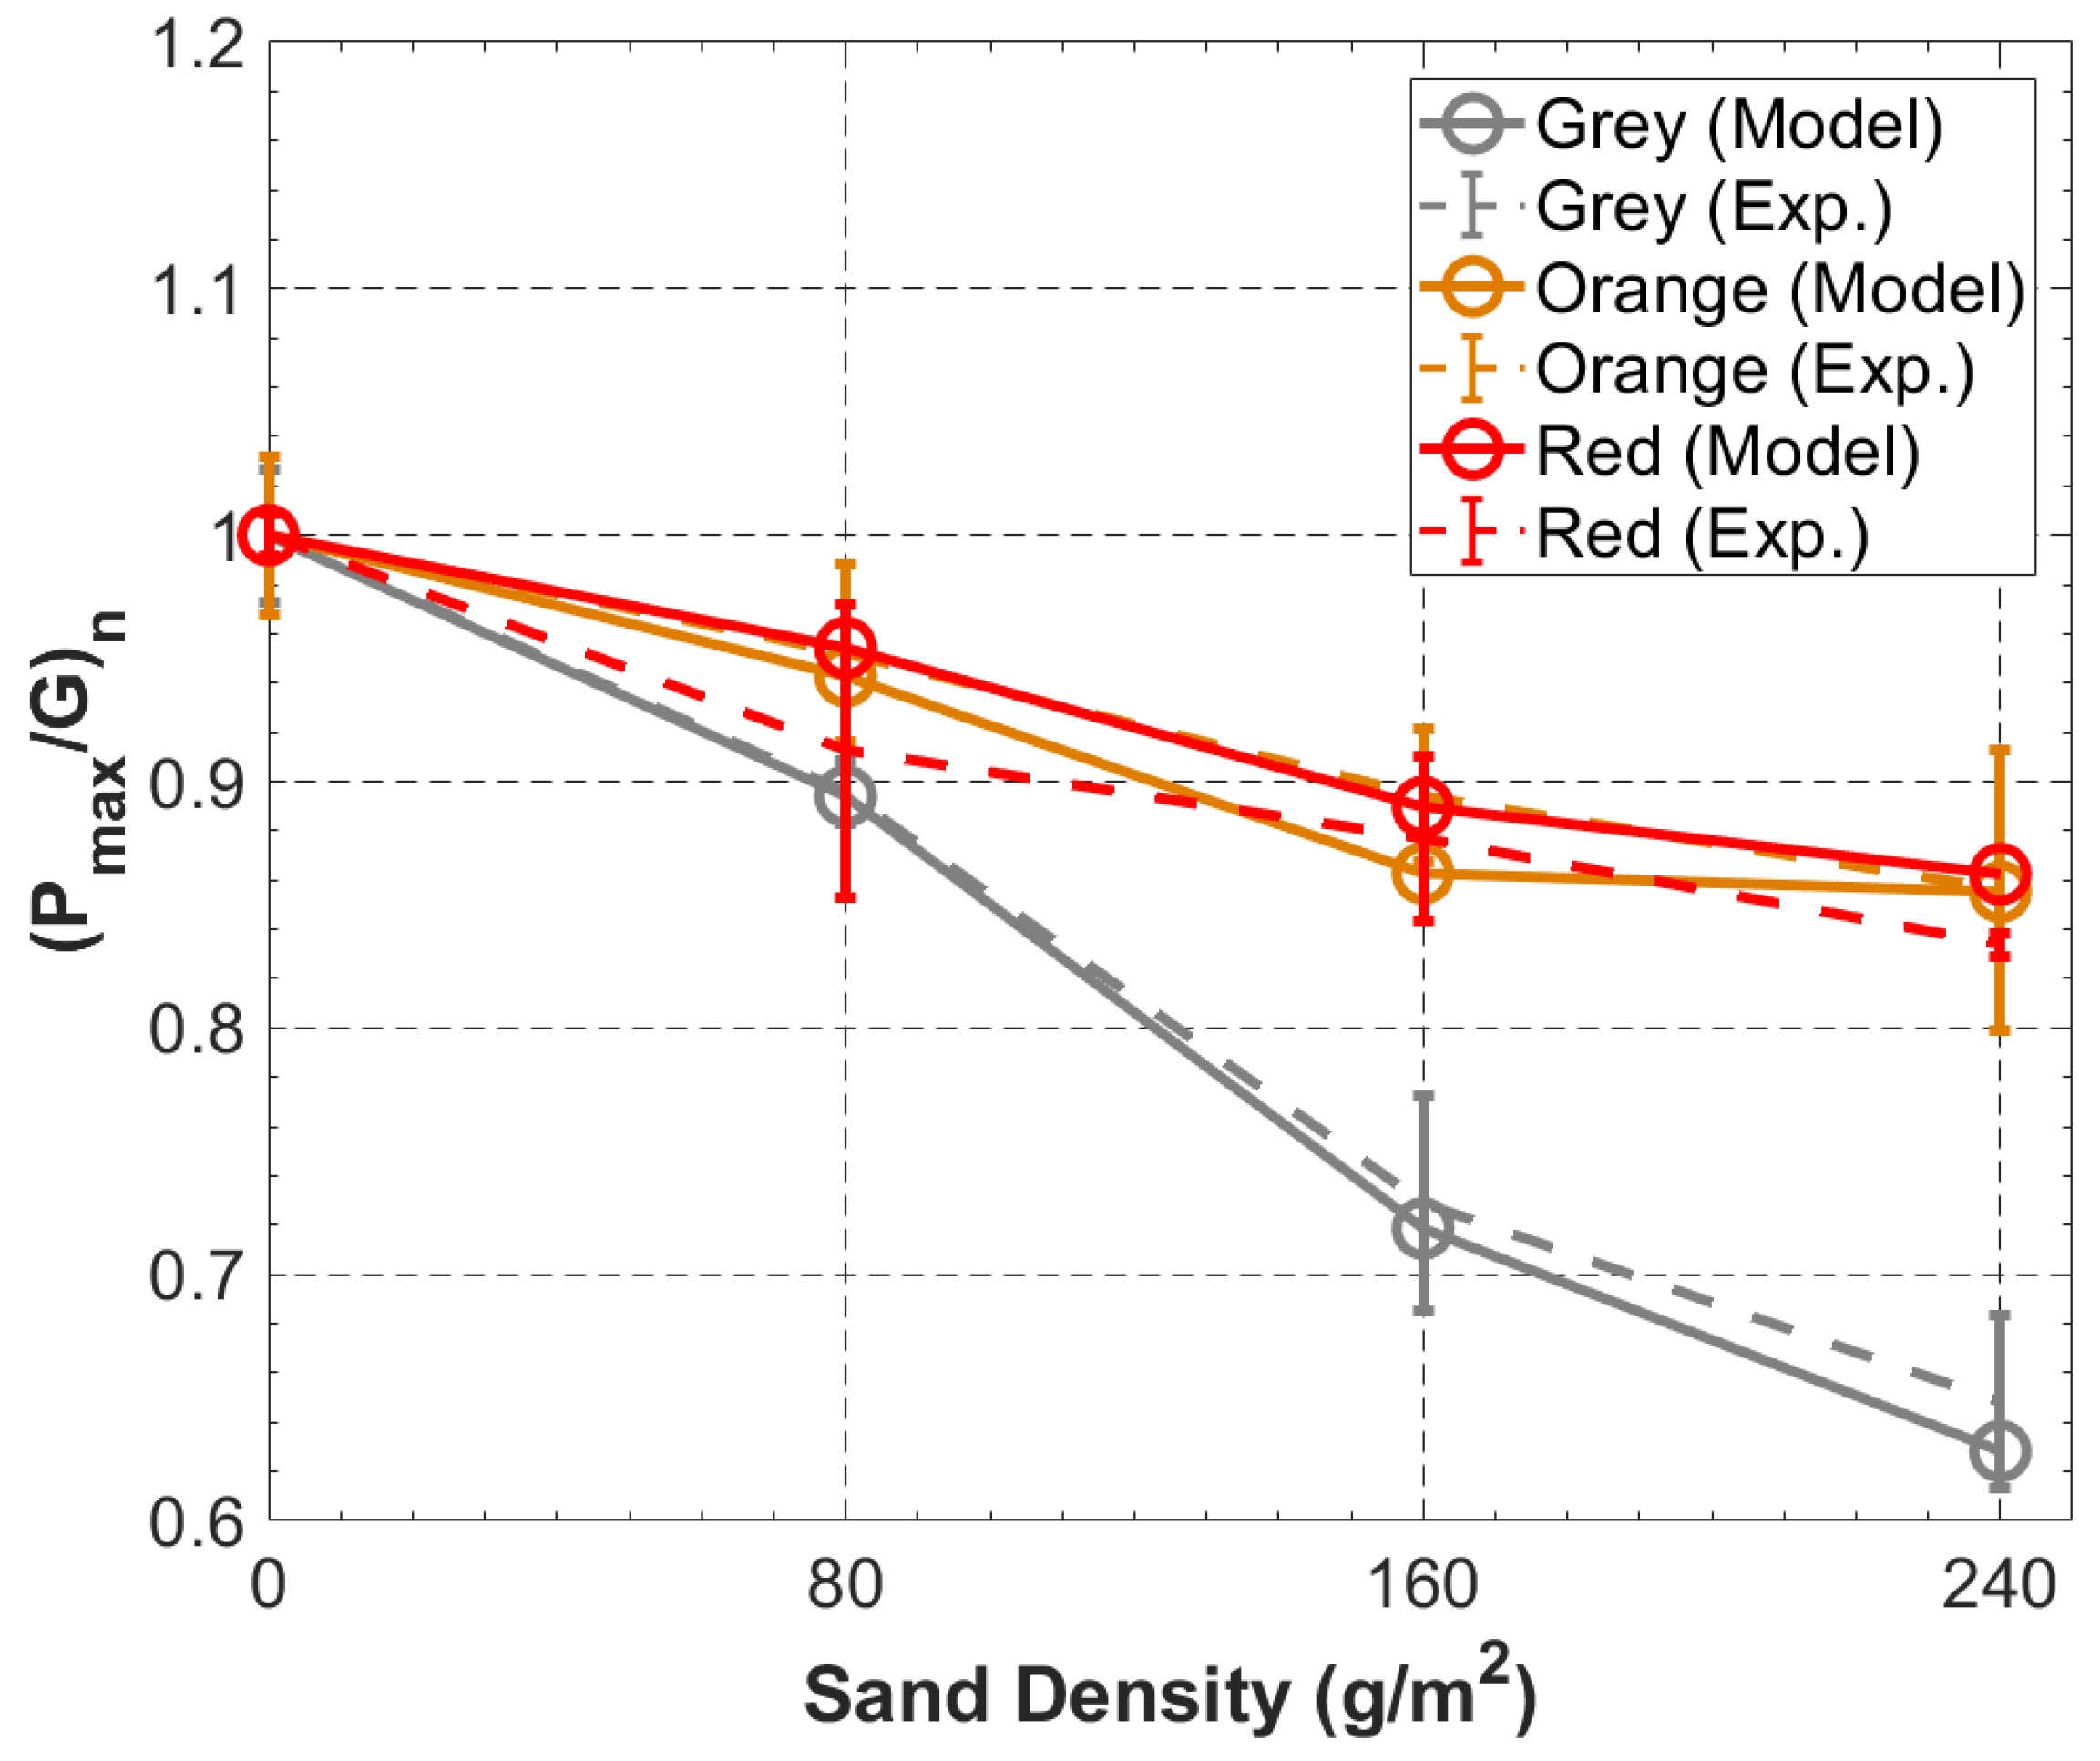
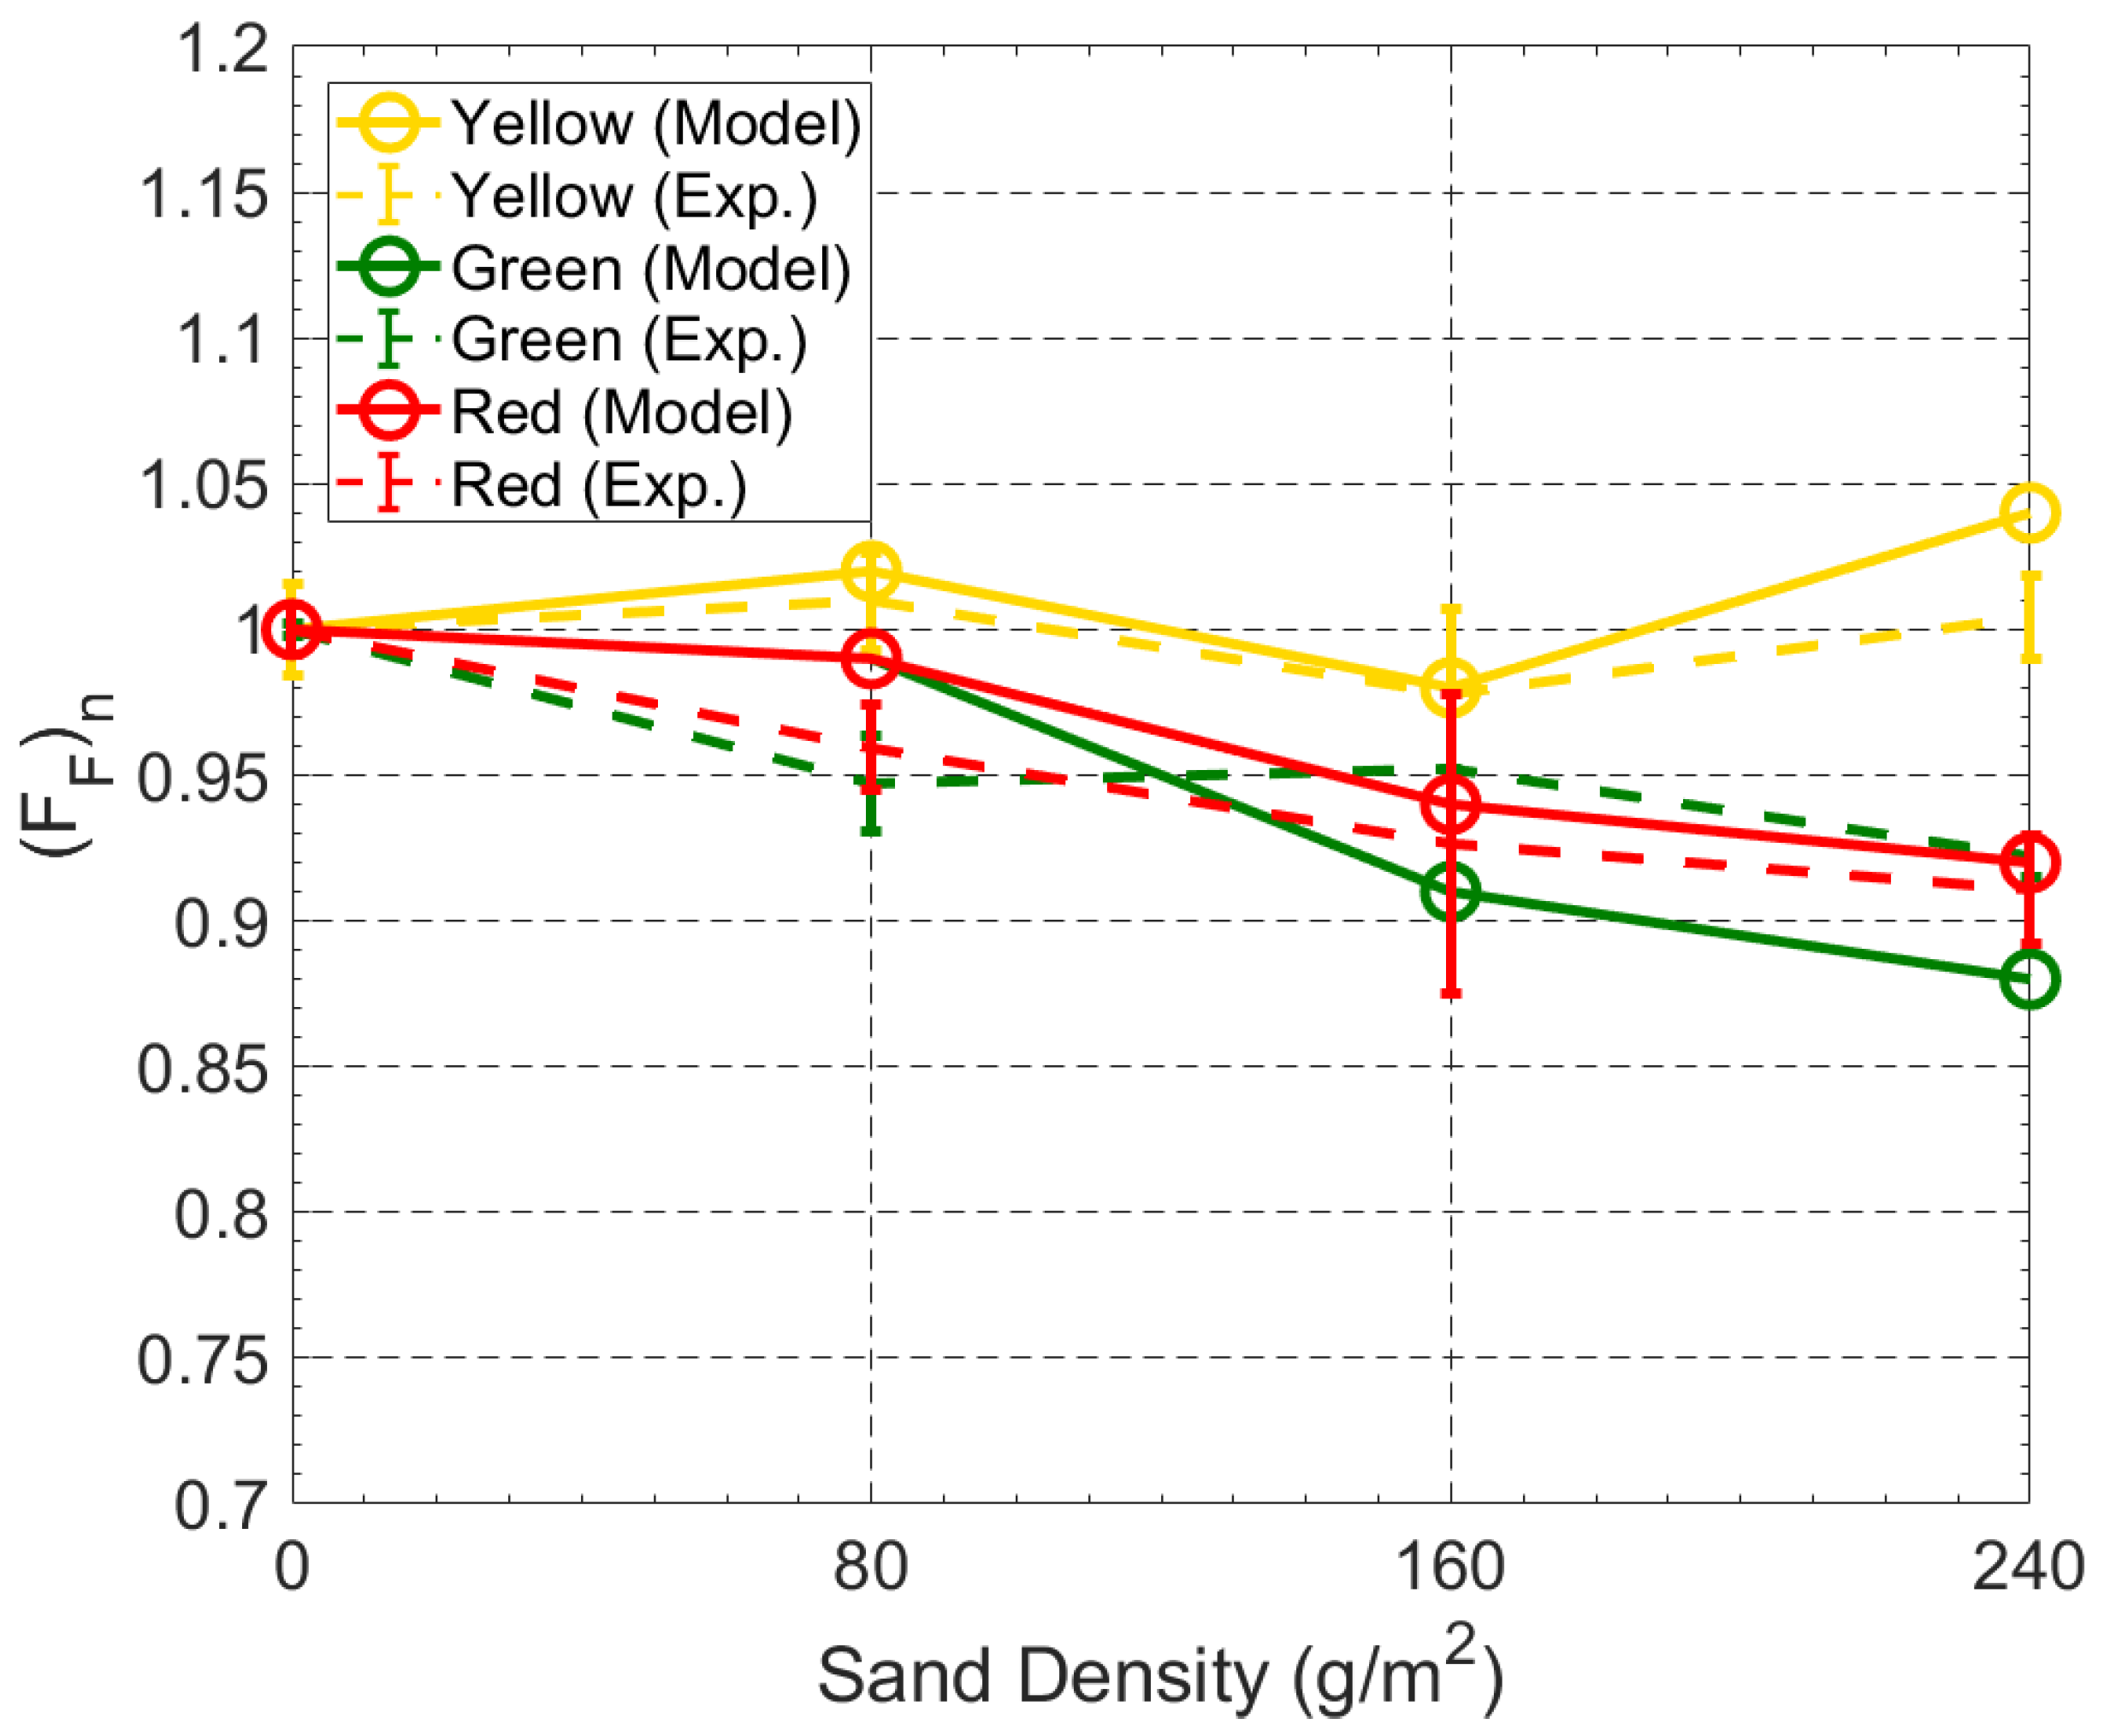
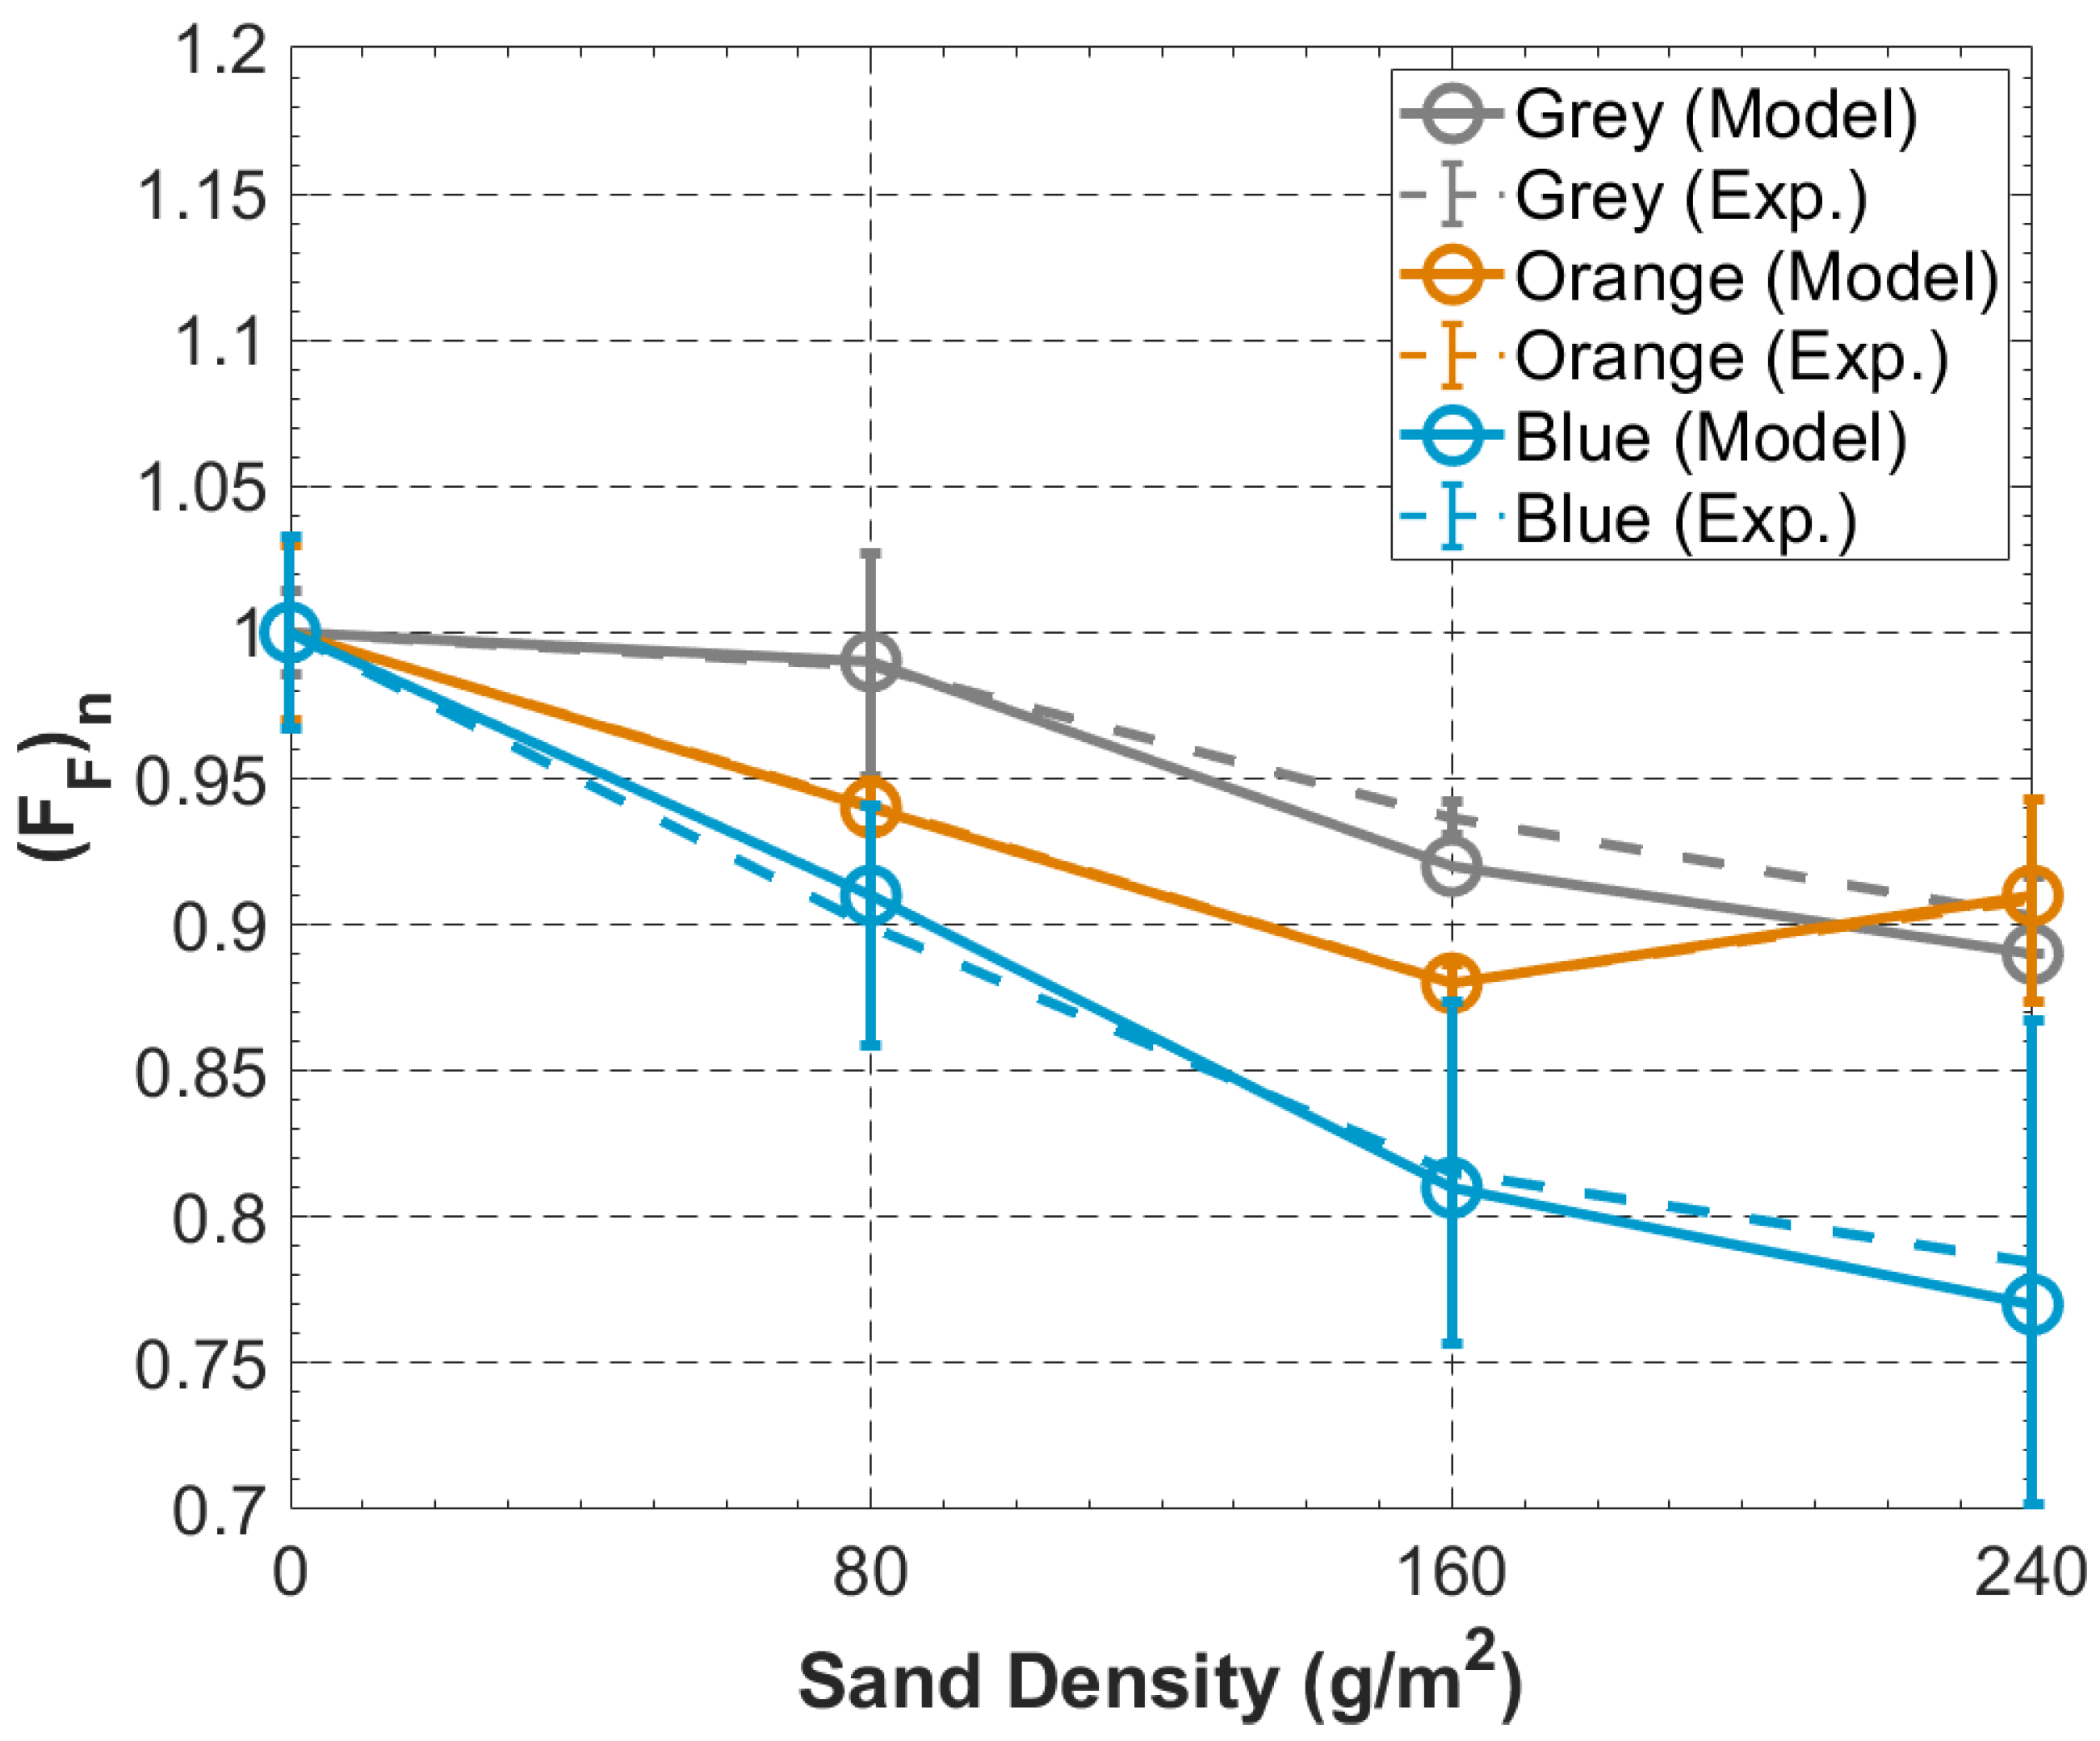
4.3. Empirical Model Results

The comparison between the experimental output parameters results and the empirical model is discussed here. The empirical model was based on the polynomial interpolation of the input parameters, presented in the previous subsection. Considering the 1M5P model and the evolution of the input parameters, the output performance of the panel was estimated for different operating conditions. The conditions considered were the panel temperature, incident irradiance, and sand density. The validation of this empirical model proves that no additional effects, other than the change of the input parameters, need to be accounted for. Figure 13, Figure 14, Figure 15 and Figure 16 present the estimations of the panel’s performance with the change of sand density. To facilitate the comparison between models in the presence of sand, each parameter was normalized to its value without sand.
It is verified that, by increasing the sand density, the output power decreases. Additionally, the negative tendency seems to stall after 160 g/m2, since the panel is already heavily covered with sand. Regarding the F F , it is found that there is no tendency, meaning that there is no relationship between the I-V shape and the sand density. Although the resistances present a certain tendency when increasing the sand density on the panel, the relationships between these resistances and the open-circuit voltage and short-circuit current are not precise.
Figure 13 and Figure 14 show the normalized values for P m a x / G . It can be seen that the empirical model is capable of obtaining the behaviors of the panels’ performance in the presence of sand. The maximum deviations between the experimental and model results are between 2.8% for the blue panel and 4.65% for the grey one.
As shown previously, the increase in sand density reduces the values of F F . The empirical model is also capable of achieving the same behavior. Figure 15 and Figure 16 show a comparison between the experimental and model results. The maximum deviation between the experimental and model results is between 0.3% for the orange panel and 4.6% for the green one.

5. Discussion

With the introduction of sand to the solar panels, it is observed that its temperature increases due to the physical properties of the sand, namely the small specific heat. The sand, in addition to preventing solar cells from capturing solar radiation, also influences the temperature of the panel, which produces a negative impact on the maximum output power ( P m a x ), efficiency ( η ), and fill factor ( F F ) of the panels.
It is concluded that parameters such as ( P m a x ), ( η ), ( F F ), and short-circuit current ( I s c ) suffered decreases, showing an approximately linear relationship with the sand density in all panels. With the increase of the sand density in the solar panels, in general, an increase of the resistance R s and a decrease of the resistance R s h is verified, evidencing the deterioration of the panels’ behavior in relation to the best case (clean panel).
Regarding the ideality factor (n), it is not possible to find with precision and certainty a theoretical/tabulated value for cadmium telluride. However, several studies have indicated that this value would be between 1.5 and values close to 2. The average values of n obtained (when the panel is clean) are around the above values. With the addition of sand to the solar panels it is verified that the values of (n), in general, decrease. This supported the previous findings stating that an increase in temperature results in an increase in the ideality factors.
Thus, is therefore possible to identify a clear evolution of the 1M5P parameters in the presence of sand. It is also possible to justify the change in performance of the panels based only on these input parameters of the 1M5P model. Using an empirical model to define the evolution of the 1M5P parameters, as a function of the sand density, the performance of each panel can be estimated.
The results of this study can provide support for the decision-making around maintenance activities. For example, through the evaluation of the I-V or P-V curves, it is possible to create a profile of the historical evolution of the 1M5P parameters, which can then be analyzed to verify the probability of the presence of sand/sediments on the panel. Weather conditions can also be used to estimate the probability of sand deposition on photovoltaic panels and, with an empirical model, the impact on PV performance can be estimated. These objectives are in line with the current state-of-the-art challenges in the monitoring of PV power pants [49,50].

6. Conclusions

This research focused on the analysis and characterization of the influence of sand on CdTe photovoltaic solar panels with different properties. Six CdTe panels with different colors and transparencies of 40% (yellow, grey, orange, and red) and 50% (green and blue) were used. Experimental tests were carried out under real ambient conditions to evaluate the impact of different densities of sand on the photovoltaic panels’ parameters and performance. From this analysis, an empirical model was developed to predict the impact of sand on the CdTe panels’ performance.
The introduction of sand to the CdTe photovoltaic panels has shown many effects on the 1M5P parameters and on the performance of the CdTe solar panels. These effects are associated with the decrease of irradiation absorbed by the panels and also with the increase in temperature due to the presence of sand.
A linear increase in sand density leads to an approximately linear decrease in the maximum output power, fill factor, and efficiency of the photovoltaic panels. The red and orange panels present the lowest decrease of maximum power, between 14% and 17%, while the grey and green panels show the highest loss, at around 35%. Regarding the 1M5P parameters, with the increase of sand density, in general an increase of the resistance R s , of between 17.8% and 53.8%, and a decrease of the resistance R s h , between 4.5% and 37.5% are observed. The ideality factor, (n), also shows a deterioration of between 14.8% and 30.5%. In general, the highest parameter changes are for the same panels—the grey and the green ones.
It is verified that, by using an empirical model based on the evolution of the 1M5P parameters, the results for the maximum output power, efficiency, and fill factor can be estimated correctly from the sand density. The maximum deviations found between the empirical model and the experimental results are lower than 5%. These results can provide support for the decision-making around maintenance activities and for the development of new techniques to avoid sediment deposition on CdTe panels. From predicting weather conditions, one can estimate the probability of sand deposition on photovoltaic panels and, with an empirical model, the impact on the PV performance can be estimated.

Author Contributions

B.G.: Conceptualization, software, methodology, formal analysis; J.F.P.F.: Conceptualization, software, methodology, investigation, formal analysis; J.P.N.T.: Conceptualization, software, methodology, investigation, formal analysis; R.A.M.L.: Conceptualization, software, methodology, investigation, formal analysis. All authors have read and agreed to the published version of the manuscript.

Funding

There is no external funds.

Data Availability Statement

Data is available on request.

Acknowledgments

This work was supported in part by FCT/MCTES through national funds and in part by cofounded EU funds under Project UIDB/50008/2020. Also, this work was supported by FCT, through IDMEC, under LAETA, project UIDB/50022/2022 and under the research grant UI/BD/151091/2021.

Conflicts of Interest

The authors declare no conflict of interest.

References

  1. Marques Lameirinhas, R.A.; Torres, J.P.N.; de Melo Cunha, J.P. A Photovoltaic Technology Review: History, Fundamentals and Applications. Energies 2022, 15, 1823. [Google Scholar] [CrossRef]
  2. Duarte, F.; Torres, J.P.N.; Baptista, A.; Marques Lameirinhas, R.A. Optical Nanoantennas for Photovoltaic Applications. Nanomaterials 2021, 11, 422. [Google Scholar] [CrossRef] [PubMed]
  3. Bernardes, S.; Lameirinhas, R.A.M.; Torres, J.P.N.; Fernandes, C.A.F. Characterization and Design of Photovoltaic Solar Cells That Absorb Ultraviolet, Visible and Infrared Light. Nanomaterials 2021, 11, 78. [Google Scholar] [CrossRef] [PubMed]
  4. Santos, M.S.; Marques Lameirinhas, R.A.; N. Torres, J.P.; P. Fernandes, J.F.; Correia V. Bernardo, C.P. Nanostructures for Solar Energy Harvesting. Micromachines 2023, 14, 364. [Google Scholar] [CrossRef] [PubMed]
  5. Sarver, T.; Al-Qaraghuli, A.; Kazmerski, L.L. A comprehensive review of the impact of dust on the use of solar energy: History, investigations, results, literature, and mitigation approaches. Renew. Sustain. Energy Rev. 2013, 22, 698–733. [Google Scholar] [CrossRef]
  6. Mehmood, U.; Irshad, H.M.; Al-Sulaiman, F.A.; Bashir, S.; Yilbas, B.S. Effect of Accumulation of Environmental Dust and Subsequent Mud Formation on Textural, Chemical, and Optical Properties of Silicon Wafers for Photovoltaic Cells. IEEE J. Photovolt. 2018, 8, 1274–1280. [Google Scholar] [CrossRef]
  7. Alves, T.; N. Torres, J.P.; Marques Lameirinhas, R.A.; F. Fernandes, C.A. Different Techniques to Mitigate Partial Shading in Photovoltaic Panels. Energies 2021, 14, 3863. [Google Scholar] [CrossRef]
  8. He, B.; Lu, H.; Zheng, C.; Wang, Y. Characteristics and cleaning methods of dust deposition on solar photovoltaic modules—A review. Energy 2023, 263, 126083. [Google Scholar] [CrossRef]
  9. Isabela, C.B.; Marques Lameirinhas, R.A.; Torres, J.P.N.; Fernandes, C.A.F. Comparative study of the copper indium gallium selenide (CIGS) solar cell with other solar technologies. Sustain. Energy Fuels 2021, 5, 2273–2283. [Google Scholar] [CrossRef]
  10. Almukhtar, H.; Lie, T.T.; Al-Shohani, W.A.M.; Anderson, T.; Al-Tameemi, Z. Comprehensive Review of Dust Properties and Their Influence on Photovoltaic Systems: Electrical, Optical, Thermal Models and Experimentation Techniques. Energies 2023, 16, 3401. [Google Scholar] [CrossRef]
  11. Castanheira, A.F.; Fernandes, J.F.; Branco, P.C. Demonstration project of a cooling system for existing PV power plants in Portugal. Appl. Energy 2018, 211, 1297–1307. [Google Scholar] [CrossRef]
  12. Svinterikos, E.; Zuburtikudis, I.; Abu Khalifeh, H.; Farvin Akbar Ali, S. Multifunctional polymer-based coatings for outdoor glass surfaces: A state of the art. Adv. Ind. Eng. Polym. Res. 2023; in press. [Google Scholar] [CrossRef]
  13. Javed, W.; Wubulikasimu, Y.; Figgis, B.; Guo, B. Characterization of dust accumulated on photovoltaic panels in Doha, Qatar. Sol. Energy 2017, 142, 123–135. [Google Scholar] [CrossRef]
  14. Vedulla, G.; Geetha, A.; Senthil, R. Review of Strategies to Mitigate Dust Deposition on Solar Photovoltaic Systems. Energies 2023, 16, 109. [Google Scholar] [CrossRef]
  15. Khalid, H.M.; Rafique, Z.; Muyeen, S.; Raqeeb, A.; Said, Z.; Saidur, R.; Sopian, K. Dust accumulation and aggregation on PV panels: An integrated survey on impacts, mathematical models, cleaning mechanisms, and possible sustainable solution. Sol. Energy 2023, 251, 261–285. [Google Scholar] [CrossRef]
  16. Gholami, A.; Ameri, M.; Zandi, M.; Ghoachani, R.G.; Eslami, S.; Pierfederici, S. Photovoltaic Potential Assessment and Dust Impacts on Photovoltaic Systems in Iran: Review Paper. IEEE J. Photovolt. 2022, 10, 824–837. [Google Scholar] [CrossRef]
  17. Azouzoute, A.; Hajjaj, C.; Zitouni, H.; Ydrissi, M.E.; Mertah, O.; Garoum, M.; Ghennioui, A. Modeling and experimental investigation of dust effect on glass cover PV module with fixed and tracking system under semi-arid climate. Sol. Energy Mater. Sol. Cells 2021, 230, 111219. [Google Scholar] [CrossRef]
  18. Chaichan, M.T.; Kazem, H.A.; Al-Waeli, A.H.A.; Sopian, K.; Fayad, M.A.; Alawee, W.H.; Dhahad, H.A.; Isahak, W.N.R.W.; Al-Amiery, A.A. Sand and Dust Storms; Impact on the Efficiency of the Photovoltaic Modules Installed in Baghdad: A Review Study with an Empirical Investigation. Energies 2023, 16, 3938. [Google Scholar] [CrossRef]
  19. Alves dos Santos, S.A.; Torres, J.P.N.; Fernandes, C.A.F.; Marques Lameirinhas, R.A. The impact of aging of solar cells on the performance of photovoltaic panels. Energy Convers. Manag. X 2021, 10, 100082. [Google Scholar] [CrossRef]
  20. Toth, S.; Hannigan, M.; Vance, M.; Deceglie, M. Predicting Photovoltaic Soiling From Air Quality Measurements. IEEE J. Photovolt. 2020, 10, 1142–1147. [Google Scholar] [CrossRef]
  21. Fares, E.; Buffiere, M.; Figgis, B.; Haik, Y.; Isaifan, R.J. Soiling of photovoltaic panels in the Gulf Cooperation Council countries and mitigation strategies. Sol. Energy Mater. Sol. Cells 2021, 231, 111303. [Google Scholar] [CrossRef]
  22. Shrestha, S.M.; Mallineni, J.K.; Yedidi, K.R.; Knisely, B.; Tatapudi, S.; Kuitche, J.; TamizhMani, G. Determination of Dominant Failure Modes Using FMECA on the Field Deployed c-Si Modules Under Hot-Dry Desert Climate. IEEE J. Photovolt. 2015, 5, 174–182. [Google Scholar] [CrossRef]
  23. Guo, B.; Javed, W. Efficiency of Electrodynamic Dust Shield at Dust Loading Levels Relevant to Solar Energy Applications. IEEE J. Photovolt. 2018, 8, 196–202. [Google Scholar] [CrossRef]
  24. Isaifan, R.J.; Johnson, D.; Ackermann, L.; Figgis, B.; Ayoub, M. Evaluation of the adhesion forces between dust particles and photovoltaic module surfaces. Sol. Energy Mater. Sol. Cells 2019, 191, 413–421. [Google Scholar] [CrossRef]
  25. Heimsath, A.; Nitz, P. The effect of soiling on the reflectance of solar reflector materials—Model for prediction of incidence angle dependent reflectance and attenuation due to dust deposition. Sol. Energy Mater. Sol. Cells 2019, 195, 258–268. [Google Scholar] [CrossRef]
  26. Gholami, A.; Ameri, M.; Zandi, M.; Gavagsaz Ghoachani, R. A single-diode model for photovoltaic panels in variable environmental conditions: Investigating dust impacts with experimental evaluation. Sustain. Energy Technol. Assess. 2021, 47, 101392. [Google Scholar] [CrossRef]
  27. Fan, S.; Wang, Y.; Cao, S.; Sun, T.; Liu, P. A novel method for analyzing the effect of dust accumulation on energy efficiency loss in photovoltaic (PV) system. Energy 2021, 234, 121112. [Google Scholar] [CrossRef]
  28. Santos, J.; Lameirinhas, R.; Fernandes, C.; Torres, J.P. The influence of sand on the performance of CdTe photovoltaic modules of different colours and transparencies. Energy Syst. 2022. [Google Scholar] [CrossRef]
  29. Rawat, R.; Kaushik, S.; Sastry, O.; Singh, Y.; Bora, B. Energetic and exergetic performance analysis of CdS/CdTe based photovoltaic technology in real operating conditions of composite climate. Energy Convers. Manag. 2016, 110, 42–50. [Google Scholar] [CrossRef]
  30. Pulli, E.; Rozzi, E.; Bella, F. Transparent photovoltaic technologies: Current trends towards upscaling. Energy Convers. Manag. 2020, 219, 112982. [Google Scholar] [CrossRef]
  31. Goetzberger, A.; Hebling, C.; Schock, H.W. Photovoltaic materials, history, status and outlook. Mater. Sci. Eng. R Rep. 2003, 40, 1–46. [Google Scholar] [CrossRef]
  32. Amin, N. Introduction of inorganic solar cells. In Comprehensive Guide on Organic and Inorganic Solar Cells; Elsevier: Amsterdam, The Netherlands, 2022; pp. 57–63. [Google Scholar]
  33. Sundaram, S.; Benson, D.; Mallick, T.K. Solar Photovoltaic Technology Production: Potential Environmental Impacts and Implications for Governance; Academic Press: Cambridge, MA, USA, 2016. [Google Scholar]
  34. Afghan, S.A.; Abdulkareem, H.; Husi, G. Simulating the electrical characteristics of a photovoltaic cell based on a single-diode equivalent circuit model. MATEC Web Conf. 2017, 126, 03002. [Google Scholar] [CrossRef] [Green Version]
  35. Sharma, S.; Shokeen, P.; Jain, A.; Kapoor, A. Exact analytical solutions of the parameters of different generation real solar cells using Lambert W-function: A Review Article. J. Renew. Energy 2014, 4, 155–194. [Google Scholar]
  36. Coutinho, I.; Medici, T.; Gratuze, B.; Ruivo, A.; Dinis, P.; Lima, A.; Vilarigues, M. Sand and Pebbles: The Study of Portuguese Raw Materials for Provenance Archaeological Glass. Minerals 2022, 12, 193. [Google Scholar] [CrossRef]
  37. Song, Z.; Fang, K.; Sun, X.; Liang, Y.; Lin, W.; Xu, C.; Huang, G.; Yu, F. An Effective Method to Accurately Extract the Parameters of Single Diode Model of Solar Cells. Nanomaterials 2021, 11, 2615. [Google Scholar] [CrossRef] [PubMed]
  38. Castro, R.; Silva, M. Experimental and Theoretical Validation of One Diode and Three Parameters–Based PV Models. Energies 2021, 14, 2140. [Google Scholar] [CrossRef]
  39. Kumar Garg, V.; Sharma, S. Performance Evaluation of Solar Module with Emulator and DC Microgrid. Int. J. Renew. Energy Res. 2021, 11, 1552–1560. [Google Scholar]
  40. Khan, F.; Singh, S.; Husain, M.O. Determination of the diode parameters of aSi and CdTe solar modules using variation of the intensity of illumination: An application. Sol. Energy 2011, 85, 2288–2294. [Google Scholar] [CrossRef]
  41. Albright, S.; Singh, V.; Jordan, J. Junction characteristics of CdS/CdTe solar cells. Sol. Cells 1988, 24, 43–56. [Google Scholar] [CrossRef]
  42. Sharma, R. Temperature Dependence of I-V Characteristics of Au/n-Si Schottky Barrier Diode. J. Electron Devices 2010, 8, 286–292. [Google Scholar]
  43. Gaewdang, T.; Wongcharoen, N.; Wongcharoen, T. Characterisation of CdS/CdTe Heterojunction Solar Cells by Current-Voltage Measurements at Various Temperatures under Illumination. Energy Procedia 2012, 15, 299–304. [Google Scholar] [CrossRef] [Green Version]
  44. Naik, S.; Rajagopal Reddy, V. Temperature Dependency And Current Transport Mechanisms Of Pd/V/N-Type InP Schottky Rectifiers. Adv. Mater. Lett. 2012, 3, 188–196. [Google Scholar] [CrossRef]
  45. Dalapati, P.; Manik, N.B.; Basu, A.N. Analysis of the Temperature Dependence of Diode Ideality Factor in InGaN-Based UV-A Light-Emitting Diode. Semiconductors 2020, 54, 1284–1289. [Google Scholar] [CrossRef]
  46. Gopal, V.; Gautam, N.; Plis, E.; Krishna, S. Modelling of current-voltage characteristics of infrared photo-detectors based on type—II InAs/GaSb super-lattice diodes with unipolar blocking layers. AIP Adv. 2015, 5, 097132. [Google Scholar] [CrossRef] [Green Version]
  47. Razooqi Alaani, M.; Abdulameer, A.F.; Adwan, N.; Awni, R.; Sabbar, E. The Electrical Characterization of p-CdTe/n-Si (111) Heterojunction Diode. Adv. Mater. Res. 2013, 702, 236–241. [Google Scholar] [CrossRef]
  48. Lv, B.; Yan, B.; Cai, P.; Gao, F.; Ye, Z.; Li, Y.; Chen, N.; Sui, C.; Lin, Q.; Cheng, G.; et al. The study on saturation current and ideality factor of CdTe solar cell based on CdS window layer deposited with hydrogen peroxide. Semicond. Sci. Technol. 2019, 34, 115025. [Google Scholar] [CrossRef]
  49. Liu, Y.; Ding, K.; Zhang, J.; Li, Y.; Yang, Z.; Zheng, W.; Chen, X. Fault diagnosis approach for photovoltaic array based on the stacked auto-encoder and clustering with I-V curves. Energy Convers. Manag. 2021, 245, 114603. [Google Scholar] [CrossRef]
  50. Dupon, I.; Carvalho, P.; Jucá, S.C.; Neto, J. Novel methodology for detecting non-ideal operating conditions for grid-connected photovoltaic plants using Internet of Things architecture. Energy Convers. Manag. 2018, 200, 112078. [Google Scholar] [CrossRef]
Figure 1. Experimental set-up for several sand densities: (a) 80 g/m2; (b) 160 g/m2; (c) 240 g/m2.
Energies 16 04777 g001
Figure 2. Yellow CdTe-No sand (G = 843 W/m2).
Energies 16 04777 g002
Figure 3. Mean Values and Deviations of I p v / G .
Energies 16 04777 g003
Figure 4. Mean Values and Deviations of I s c / G .
Energies 16 04777 g004
Figure 5. Mean Values and Deviations of R s .
Energies 16 04777 g005
Figure 6. Mean Values and Deviations of R s h .
Energies 16 04777 g006
Figure 7. Mean values and deviations of n.
Energies 16 04777 g007
Figure 8. Mean values and deviations of I s .
Energies 16 04777 g008
Figure 9. Mean values and deviations of I s .
Energies 16 04777 g009
Figure 10. Mean values and deviations of P m a x / G .
Energies 16 04777 g010
Figure 11. Mean values and deviations of η .
Energies 16 04777 g011
Figure 12. Mean values and deviations of F F .
Energies 16 04777 g012
Figure 13. Mean values of P m a x / G —experimental vs. model.
Energies 16 04777 g013
Figure 14. Mean values of P m a x / G —experimental vs. model.
Energies 16 04777 g014
Figure 15. Mean values of F F —experimental vs. model.
Energies 16 04777 g015
Figure 16. Mean values of F F —experimental vs. model.
Energies 16 04777 g016
Table 1. Change of the input parameters with the sand.
Color I sc / G R s R sh n
yellow−23.5%17.8%−32.1%−29.8%
orange−13.0%14.6%−4.5%−25.1%
red−15.8%19.6%−6.0%−25.5%
gray−35.3%53.8%−35.9%−30.4%
green−32.5%32.0%−37.5%−14.8%
blue−21.2%22.0%−5.2%−21.5%
Disclaimer/Publisher’s Note: The statements, opinions and data contained in all publications are solely those of the individual author(s) and contributor(s) and not of MDPI and/or the editor(s). MDPI and/or the editor(s) disclaim responsibility for any injury to people or property resulting from any ideas, methods, instructions or products referred to in the content.

