1. Introduction
The current economic strategy is based on the use of raw materials from non-renewable sources, which generates significant amounts of hazardous waste, and mismanagement, which leads to environmental problems [
1]. Recently, a new concept of waste-free production and technologies based on alternative sources of raw materials have begun to be developed. These types of solutions are closely related to the assumptions of a circular economy and green/cleaner production. The aforementioned systems have been developed in the EU in response to environmental problems, decreasing non-renewable materials resources, and to promote the transformation of the economy based on linear material flows to circular material flows [
2].
The tanning industry is a highly resource-intensive and waste-generating sector. Leather processing generates by-products in the form of pieces of leather, shavings, polishing dust, fatty waste, and sewage sludge [
3]. It is estimated that the treatment of 1000 kg of wet salted leather brings 200 kg of leather, up to 700 kg of solid waste, and approximately 30 m
3 of wastewater [
4,
5]. Residues from raw leather processing take different forms depending on the stage of treatment. The largest proportion consists of fleshy waste (about 50–60%) and chrome shaving or polishing (35–40%). Other waste includes leather trimmings and hair. The largest amount of by-products (80%) is produced during beam house processing, while, sequentially, 19% is produced during the tanning process and 1% from finishing [
6]. A serious environmental problem is wastewater, which contains up to 80% of the chemicals used (20% is retained in the leather) [
7]. Chromium may occur at oxidation level III or VI, the latter being considerably more toxic [
8]. Wastewater from tanneries is usually treated on-site, but in some developing countries (e.g., Ghana), it goes directly into the surface water without pre-treatment [
9].
The main components of raw leather, tannery waste, fleshings, trimmings, and splits are protein (2.5–10% m/m), fat (<10.5%), and water (<80%) [
3]. The high protein content makes this type of waste attractive for various industries. The technologies for valorisation of tannery waste are based on chemical, biological, and thermal methods. Among the chemical methods of waste treatment are alkaline [
10] and acid hydrolysis [
11]. The treatment enables a protein hydrolysis efficiency of 56%, as indicated by Babor et al., who conducted the hydrolysis of leather dust in the presence of ammonium hydroxide [
12]. Even higher efficiency is achieved using sulfuric acid (at 40 °C) and sodium hydroxide (at 50 °C), as reported by Khatoon et al. [
13]. The authors proved that hydrolysis in an alkaline environment precipitates chromium in the form of chromium (III) hydroxide, which further allows the separation of the element from the useful material.
Here, we consider a new approach, i.e.
, the use of the specific tannery waste fractions as fertiliser components and application of both light and aggressive methods. For example, Majee et al. presented a method to produce fertilisers based on blue waste leather, bone, and biomass (water hyacinth) [
14]. The tannery waste was used as a nitrogen source. The material was subjected to two-step alkaline hydrolysis to remove chromium, and acid hydrolysis to obtain collagen. The effectiveness of the bio-organic NPK fertilizer was determined to be similar to the chemical fertilizer, effecting improved growth, nearly 12–14% increase in fruit size, and 62–68% extra chlorophyll in the leaves. The application of mixed dry NPK components increased the soil ammonia concentration by about 45% [
14], as compared to natural soil. Stefan et al. reviewed various NPK collagen-containing gelatine pelt-based fertilisers using hydrogels [
15]. They represent the capacity to retain high quantities of water and the gradual release of it reduces the irrigation frequency and prevents water loss by evaporation. The smart fertilizers obtained by enzymatic hydrolysis of leather wastes are indicated for soils with high salinity. They improve the beneficial activity of microorganisms in the soil and increase the permeability of cell membranes from the root system, favoring the nutrients’ absorption and retention. In the case of alkaline soils, collagen-based fertilizers act as a naturally chelating agent for micronutrients, favoring their accessibility to the plant [
15]. Skrzypczak et al. [
16] obtained a hydrogel coating based on crosslinked alginate enriched with tannery waste-derived biochar and macro- and micronutrients. The addition of leather-waste biochar was found to have a biostimulatory effect on the growth of the underground parts of the plant (the root length increased by approximately 50% compared to seeds without coating).
The biological methods of leather-waste valorisation are based on composting [
17], bioleaching [
18], or anaerobic digestion. Anaerobic digestion of cow dung and domestic wastewater with the addition of tannery waste increases gas production. Additionally, the nutrient-rich digestate possesses fertiliser potential [
19]. Composting is another alternative to landfilling [
20].
The key thermal treatments of solid leather waste are combustion and pyrolysis. Due to the high HHV, tannery waste can serve as a raw material for heat and energy production. A major limitation of heat recovery from the combustion process is related to the high emission of nitrogen oxides (where hexavalent Cr is also formed), which can be significantly reduced by co-firing with plant biomass, generating more moderate temperature distribution. This reduces the temperature of the flame, thereby reducing NOx emissions by up to 20% [
21]. The process temperature affects the mass ratio of the products (solid, liquid, and gaseous) [
22]. Controlled conditions during pyrolysis lead to the production of high-energy liquid and gaseous products [
23]. One of the key parameters of the pyrolysis process is temperature. It directly affects the amount of each fraction of pyrolysis products, as well as their composition. The higher the temperature, the more volatile substances escape from the structure of the biochar, resulting in an increase in carbon content and a decrease in other elements, particularly nitrogen. Besides the decline of volatile matter, nitrogen, S, O, H/C molar ratio, and O/C molar ratio with the increasing pyrolysis temperature, fixed carbon, ash content, 0.1 M HCl leachability, pH, and the micropore area (m
2/g) increase, thus increasing the adsorption capacity, as well [
24]. The solid fraction produced during the process can be used to generate activated carbons [
25] or electrode materials [
26] (Han et al., 2020). The biochar derived from tannery waste can be used for the production of agrochemicals. Skrzypczak et al., (2022) presented the possibility of enriching biochar in Mn(II), Cu(II), and Zn(II) by spray sorption and used them as carriers of highly bioavailable micronutrients [
27].
This paper presents the effect of three processed (using pyrolysis or hydrolysis) and four lightly processed tanned waste fractions on the growth of ryegrass in greenhouse studies. Pyrolysis (500 °C) and hydrolysis were used, followed by pretreatment with effective microbes (EM) or by enrichment with micronutrients in order to valorise leather waste. The study evaluated the effect of chromium on plant growth, biomass yield, and nitrogen uptake. It also includes fitting the Monod kinetics model for the measured ryegrass biomass growth as a function of plant N content for two groups of tanned waste fractions. The paper also reports the biostimulatory properties of amino acids and short peptides derived from protein hydrolysis. In addition, an alternative method of waste management with potential in the energy sector is presented in line with material recycling.
2. Materials and Methods
The methodology is complex, but is widely accepted by the literature and comes from the standards: In a standardized approach for the evaluation of the functional properties of fertilizers, a series of in vitro tests (extraction tests simulating a soil solution, e.g., sodium citrate, water solubility) and in vivo on plants (sequentially, germination tests (initial dose–effect study of the functional properties), pot trials, and field trials, in which the crop yield-generating effect is tested under real conditions, were used). This standardized approach allows us to compare the obtained results with those of other authors. It also complies with the law on fertilizer registration.
The effect of tanned waste fractions on the growth of ryegrass was studied in pot experiments performed in two greenhouses: Glasshouse 1 (G1)—Prokowo, Northern Poland, and Glasshouse 2 (G2)—Gdynia Wiczlino, Northern Poland. In glasshouse G1, the experiments related to bovine shavings with Cr (SC), bovine shavings with no Cr (SFOC), splits and offcuts with Cr (OC), and splits and offcuts with no Cr (OFOC) applications were conducted during a four-month period (May–August 2021), but in G2, the effects of fertilizers based on biochar with Cr (KC), biochar with no Cr (KFOC), and hydrolysate with Cr (HC) were investigated during a similar period (July–October 2021).
2.1. Fertilisers
Several streams of bovine leather waste were used in the research. The waste is generated during the processing of tanning leather for upholstery purposes at BADER Polska Ltd., a global-range company located in Bolesławiec, southwest Poland. The global BADER group covers 20% of the automotive upholstery market worldwide. In order to improve the fertilising properties of leather waste-fractions, some were pretreated and enriched. A detailed description of the fertilisers used in the tests is presented in
Table 1. Seven fertiliser materials were investigated in the two glasshouse (G) experiments and compared with the commercially available mineral NP fertiliser.
Table 1 below provides the specifications of the materials and pre-treatments used,
Figure S1 (
Supplementary Materials) shows their form, and
Table S1 (
Supplementary Materials) shows full micro- and macro-elemental and heavy metal concentrations. Finally,
Table 2 supplies the descriptions of the pre-treatments. To improve the release of macro- and microelements from lightly processed leather waste, it was pre-treated with the use of anaerobic microorganisms. Additionally, due to the complexity of the structure and limited bioavailability, one scenario included leather waste that was subjected to hydrolysis/pre-treatment. Additionally, the advanced pre-treatments are listed below.
KC and KFOC: Enrichment with micronutrients (Cu, Mn, and Zn) was performed on two materials: char after 500 °C pyrolysis of bovine shavings char, and char after 500 °C pyrolysis of bovine shavings free of Cr. The procedure of enriching the materials with micronutrients was carried out using the spray method: 300 g of ground char was sprayed with 90 mL of a Cu, Mn, and Zn solution (with a concentration of 5000 mg/L each), and 300 g of enriched char was obtained. The materials were dried at 50 °C for 2 h. The methodology is also described in detail by Skrzypczak et al. [
27].
HC: Cr-containing shavings were hydrolyzed with a mixture of the following acids: phosphoric (V) (12%), fumaric (2%), oxalic (1.7%), and citric (1.7%). A total of 200 g of the solution and microelement sulfate salts (Cu, Zn, Mn) in the amount of 0.25% were added to 200 g of shavings and left for 1 h at a temperature of 100 °C. The pH of the prepared hydrolysate was corrected with potassium hydroxide to pH 2.5. Subsequently, the hydrolysate was granulated with biomass combustion in the ratio of 350 g of the suspension solution to 450 g of ash. According to EU legislation, the chromium (VI) content is limited in organic-mineral fertilizers. The maximum chromium (VI) content is 2 mg/kg. Speciation analysis of leather waste fertilizers shows that, in most cases, the chromium (VI) content in the formulations reaches values of <1 mg/kg. Fertilizers based on hydrolysates using sulfuric (VI) acid and phosphoric (V) acid granulated with biomass combustion ashes show acceptable levels of chromium (VI) content [
16].
As a reference fertiliser, an NP mineral fertiliser FLOROVIT (MF) was used: 19.0% (total N); 5.4% (nitrate N); 13.6% (ammonium N); 6.0% (P
2O
5 in neutral ammonium citrate and water); 3.9% (P
2O
5 in water); 2.5% (MgO total); 4.0% (Fe total). The total N content, referred to as dry matter of the tanned waste fractions, were as follows: SC 8.09%, SFOC 8.86%, OC 10.4%, OFOC 10.1%, KC 10.4%, KFOC 10.3%, and HC 1.97%. The FLOROVIT standard (fast effect) was chosen as the most typical mineral fertilizer purchased from widely available garden stores. We know that the phosphorus content in the tannery waste fractions is limited (<0.5% in all fractions tested, except HC, where it was over 8% because the material was further supplemented). The detailed composition and chemical characteristics of the materials used is shown in the
Supplementary Materials in
Table S1. The chemical composition of the selected waste fractions and processed waste fractions for fertilisers is also available in the
Supplementary Materials.
Presuming that the plant responds to nitrogen-rich organic waste, the fertiliser dosages were applied at rates ranging from 20 to 370 kg N/ha to reach the plateau on the N response curve. The levels of N added are shown in
Table 2, which also provides the experimental plan expressed by the fertiliser dosage assumption and the amounts of the corresponding calculated nitrogen and fertiliser per pot. It was decided to start with the normal dose (20 kg N/ha) that is recommended for ryegrass, according to the mineral fertiliser requirements. The dose was increased by 50 kg N/ha until it reached 170 kg N/ha, which is the yearly maximum allowed N for natural fertilisers on Polish agricultural land (Regulation of the Council of 12 Ministers of 12 July 2018 on the adoption of the “Action Program to reduce water pollution with nitrates from agricultural sources and prevent further pollution”). Then, the dose was increased further: the last dose was increased by 100 kg N/ha, as compared to the previous one, and equalled 370 kg N/ha in order to reach the plateau of over-fertilisation. Presumably, the most polluted waste fertiliser, that is, Cr-containing splits and offcuts (OC), was planned exceptionally using ca. four times higher N dosage in all the applications to see the pollutant inhibiting effect on ryegrass growth.
2.2. Soil and Plants
The plants were grown in <2 mm of the sieved fraction of a sandy soil mixed with peat in w/w ratio sand/peat = 5/1, which corresponds to v/v ratio 1:1.5. The soil properties were as follows: dry matter (d.m.), 88.77%; organic matter (o.m.), 6.08%; total Kjeldahl nitrogen (TKN), 1.32 gN/kg d.m.; total phosphorus (TP), 185.58 mgP/kg d.m.; P-Olsen, 19.04 mgP/kg d.m.; total potassium (TK), 610 mgK/kg d.m.; K-Olsen, 64.94 mgK/kg d.m.; pH 8.287; redox potential, 63.8 mV; electrical conductivity (EC), 159.7 μS/cm. Approximately 1.75 kg of the prepared soil was placed in a 14.5 cm internal diameter pot (surface area: 0.0165 m2). Supplemental nutrient solutions (except N) were added to each pot, according to the following recipe: K2SO4 (42 g/L) 12 mL/pot and 6 mL/pot in the solution: CaCl2·2H2O (90 g/L), MgSO4·7H2O (24 g/L), MnSO4·H2O (6 g/L), ZnSO4·7H2O (5.4 g/L), CuSO4·5H2O (1.2 g/L), H3BO3 (0.42 g/L), CoSO4·7H2O (0.16 g/L), Na2Mo4·2H2O (0.12 g/L). The soil in each pot was then pre-watered with 120 mL of deionized water (DIW); afterward, the soil and nutrients were thoroughly mixed in the top 5-cm soil layer.
Then, 80 annual ryegrass, that is, 0.5 g (a mixture of lolium perenne 40%, lolium multiflorum-estanzuela 284 20%, festuca rubra 25%, lolium hybridum 15%) were placed in the pots on the surface of the soil and covered with an additional 80 g of soil. The size of the soil samples were 1650 g soil/pot, i.e., initially 1464.71 g d.m. soil/pot, with an inner pot diameter 14.5 cm. Each of the 7 treatments presented in
Table 2 was duplicated. The duplicate treatments were used as a result of the compromise between the number of treatments (7 dosages) and materials (8), which gave 8 × 7 × 2 = 112 pots plus 2 controls (114 pots in total). The pots were rerandomized every 7 days to eliminate differences in insolation, and kept at a constant weight with (DIW), at field capacity (20% g H
2O/g soil d.m.), that is, approximately 26.4% (cm
3 H
2O/cm
3 soil). Harvesting was carried out every month over a 4-month period by cutting the tops about 1 cm above the soil surface. The harvested plants were then placed in paper bags and dried at 105 °C until the weight was consistent.
2.3. Soil and Plant Analysis
The soil samples were analysed for pH, EC (1:5 H2O), and soil bicarbonate-phosphorus (Bic-P) before planting and after the last harvest (Rayment and Higginson, 1992). The phosphorus concentration in the liquid samples was determined on a portable spectrophotometer (Hach DR3900, Hach Company, Loveland, CO, USA) using the Hach method 8048 with a mineralization step. Before analysis, the water soil samples were filtered on filter paper, followed with a 0.45 µm syringe filter. After each of the 4 harvests, the ryegrass tops were dried and ground. The samples were analysed for total N. The total Kjeldahl nitrogen (TKN) was determined by the Kjeldahl method. The samples were digested (SpeedDigester K-436, Büchi, Flawil, Switzerland) in concentrated H2SO4 acid in the presence of a titanium-based catalyst. The next step was the steam distillation step (K-355 distillation unit, Büchi) into a boric acid solution with a Tashiro indicator, then titrated with HCl acid to measure the released ammonia.
2.4. Agronomic Effectiveness
The absolute agronomic effectiveness (AAE) and relative agronomic effectiveness (RAE) of the materials were calculated for each of the 4 harvests, as well as cumulatively after the end of the experiment, using the total N uptake data (1–4 harvests and the cumulative) and dry matter yield data (only cumulative). AAE is expressed by a slope of the best-fit line of the relation between plant N uptake and the N application rate, and the RAE is expressed by the ratio of the AAE of the material to the AAE of the reference fertiliser [
28]. This is a standard method to evaluate the performance of various fertilisers.
The software used for data processing, modelling, and statistical analysis was Microsoft Excel.
4. Results—Modelling
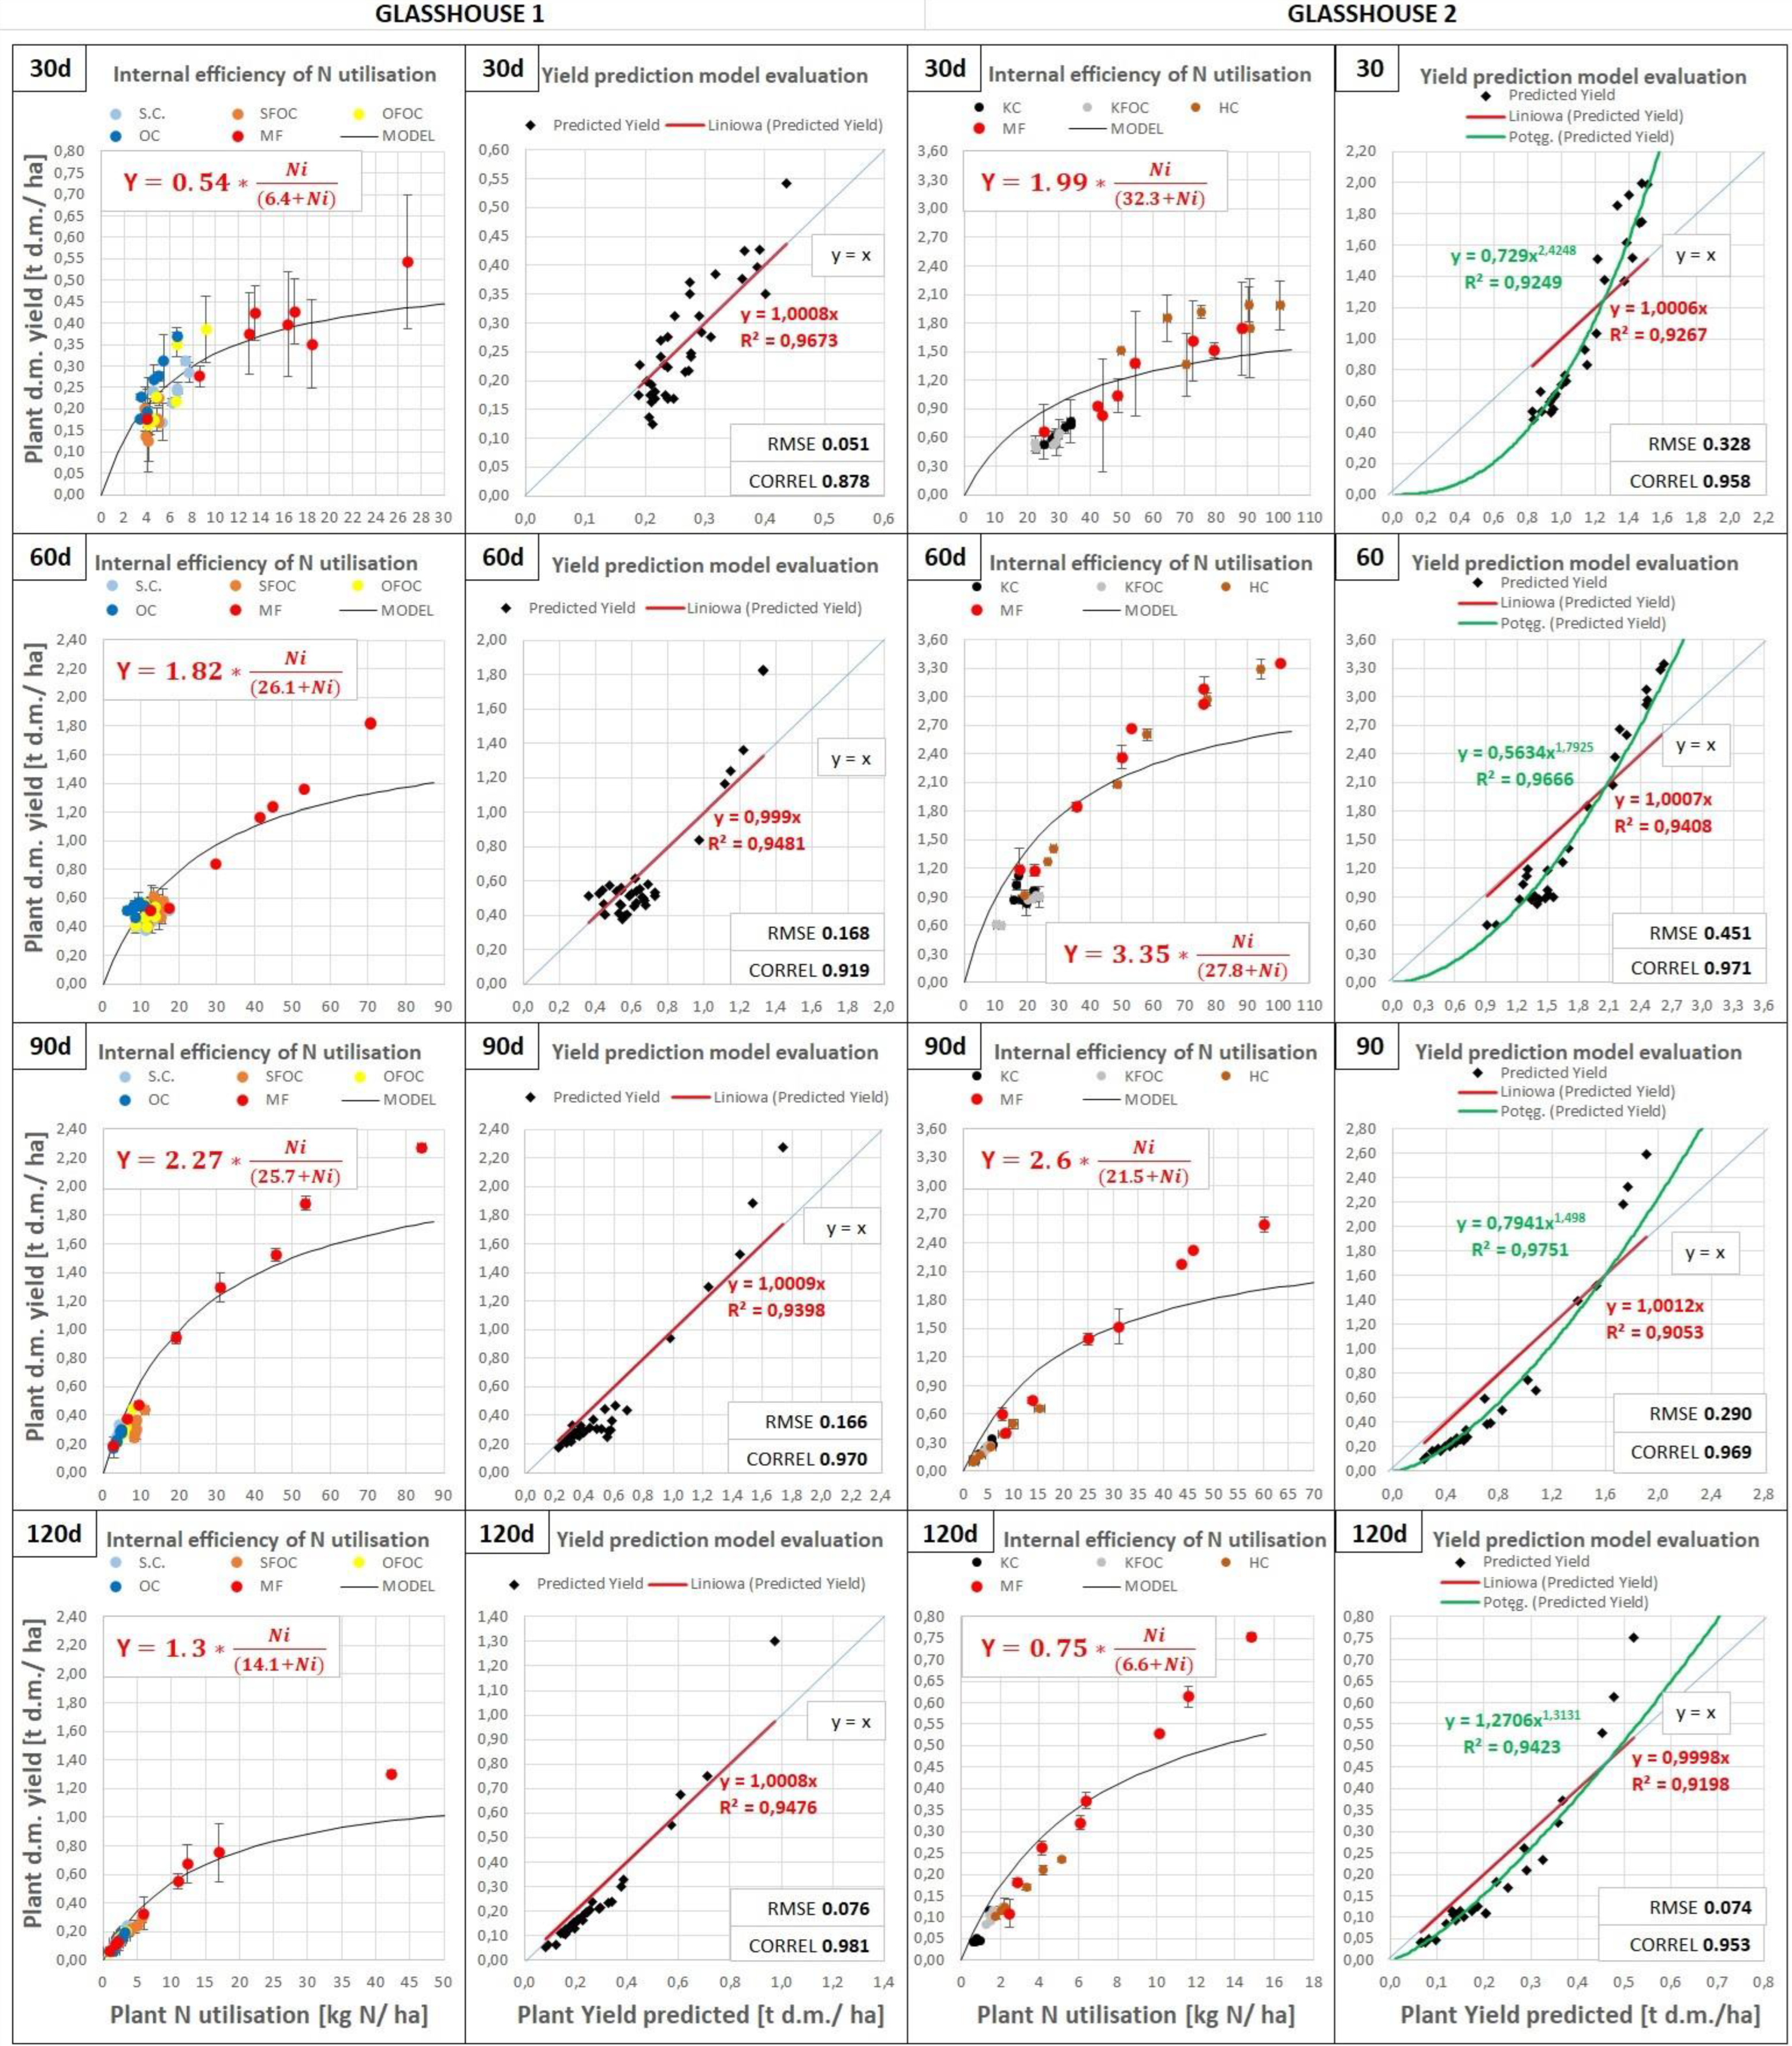
The internal efficiency curves (
Figure 4) show the d.m. yield of the plant as a function of plant N utilisation for all the fertiliser materials for each harvest in both Glasshouses 1 and 2. The presented response curves were fitted using the Monod kinetics model (1st and 3rd column), then Monod-predicted yield data were related to the measured yield (figures in 2nd and 4th column). Additionally, a power model (4th column) was related to the linear function of the predicted vs. measured data. The Monod model/kinetics is commonly used in natural, biological, ecological, and environmental studies. The model is described by equation:
where
Y represents the yield of ryegrass (in t d.m./ha) as a function of the use of plant N (kg);
Ymax is the maximum yield; and
Km is the plant N, at which
Y equals half the maximum yield. Please note that the yields (
Y and
Ymax) are presented in tonnes d.m./ha, as otherwise, the
Ymax would be too large to present in
Figure 4. In other words, in order for the equation to be coherent, the Ymax would need to be multiplied by 1000, keeping
Y in t d.m./ha.
The best-fit values of the
Ymax and
Km for each of three harvests are shown in the 1st and third columns of
Figure 4, and the function relating the fitted v. measured values are plotted in the second and fourth columns.
The slope of the function equals 1, and the coefficient of determination, R2, approaches high values (>0.94), indicating the good fit of the measured values to the Monod equation; however, this was only the case for Glasshouse 1 data. This indicates that N was the only growth-limiting factor in these experiments. However, Glasshouse 2 data are fitted by the Monod kinetics model (R2 < 0.94), which is why the power model was applied to fit the measured vs. predicted data with R2 > 0.94. An interesting fact is that the precision of the Monod kinetics model decreased with Harvest numbers 1–3 in glasshouse 1 (R2 increased from 0.967 to 0.939—second column), while the linear regression model increased with Harvest numbers 1–3 in glasshouse 2. The detailed model comparison is given below in
Figure 5.
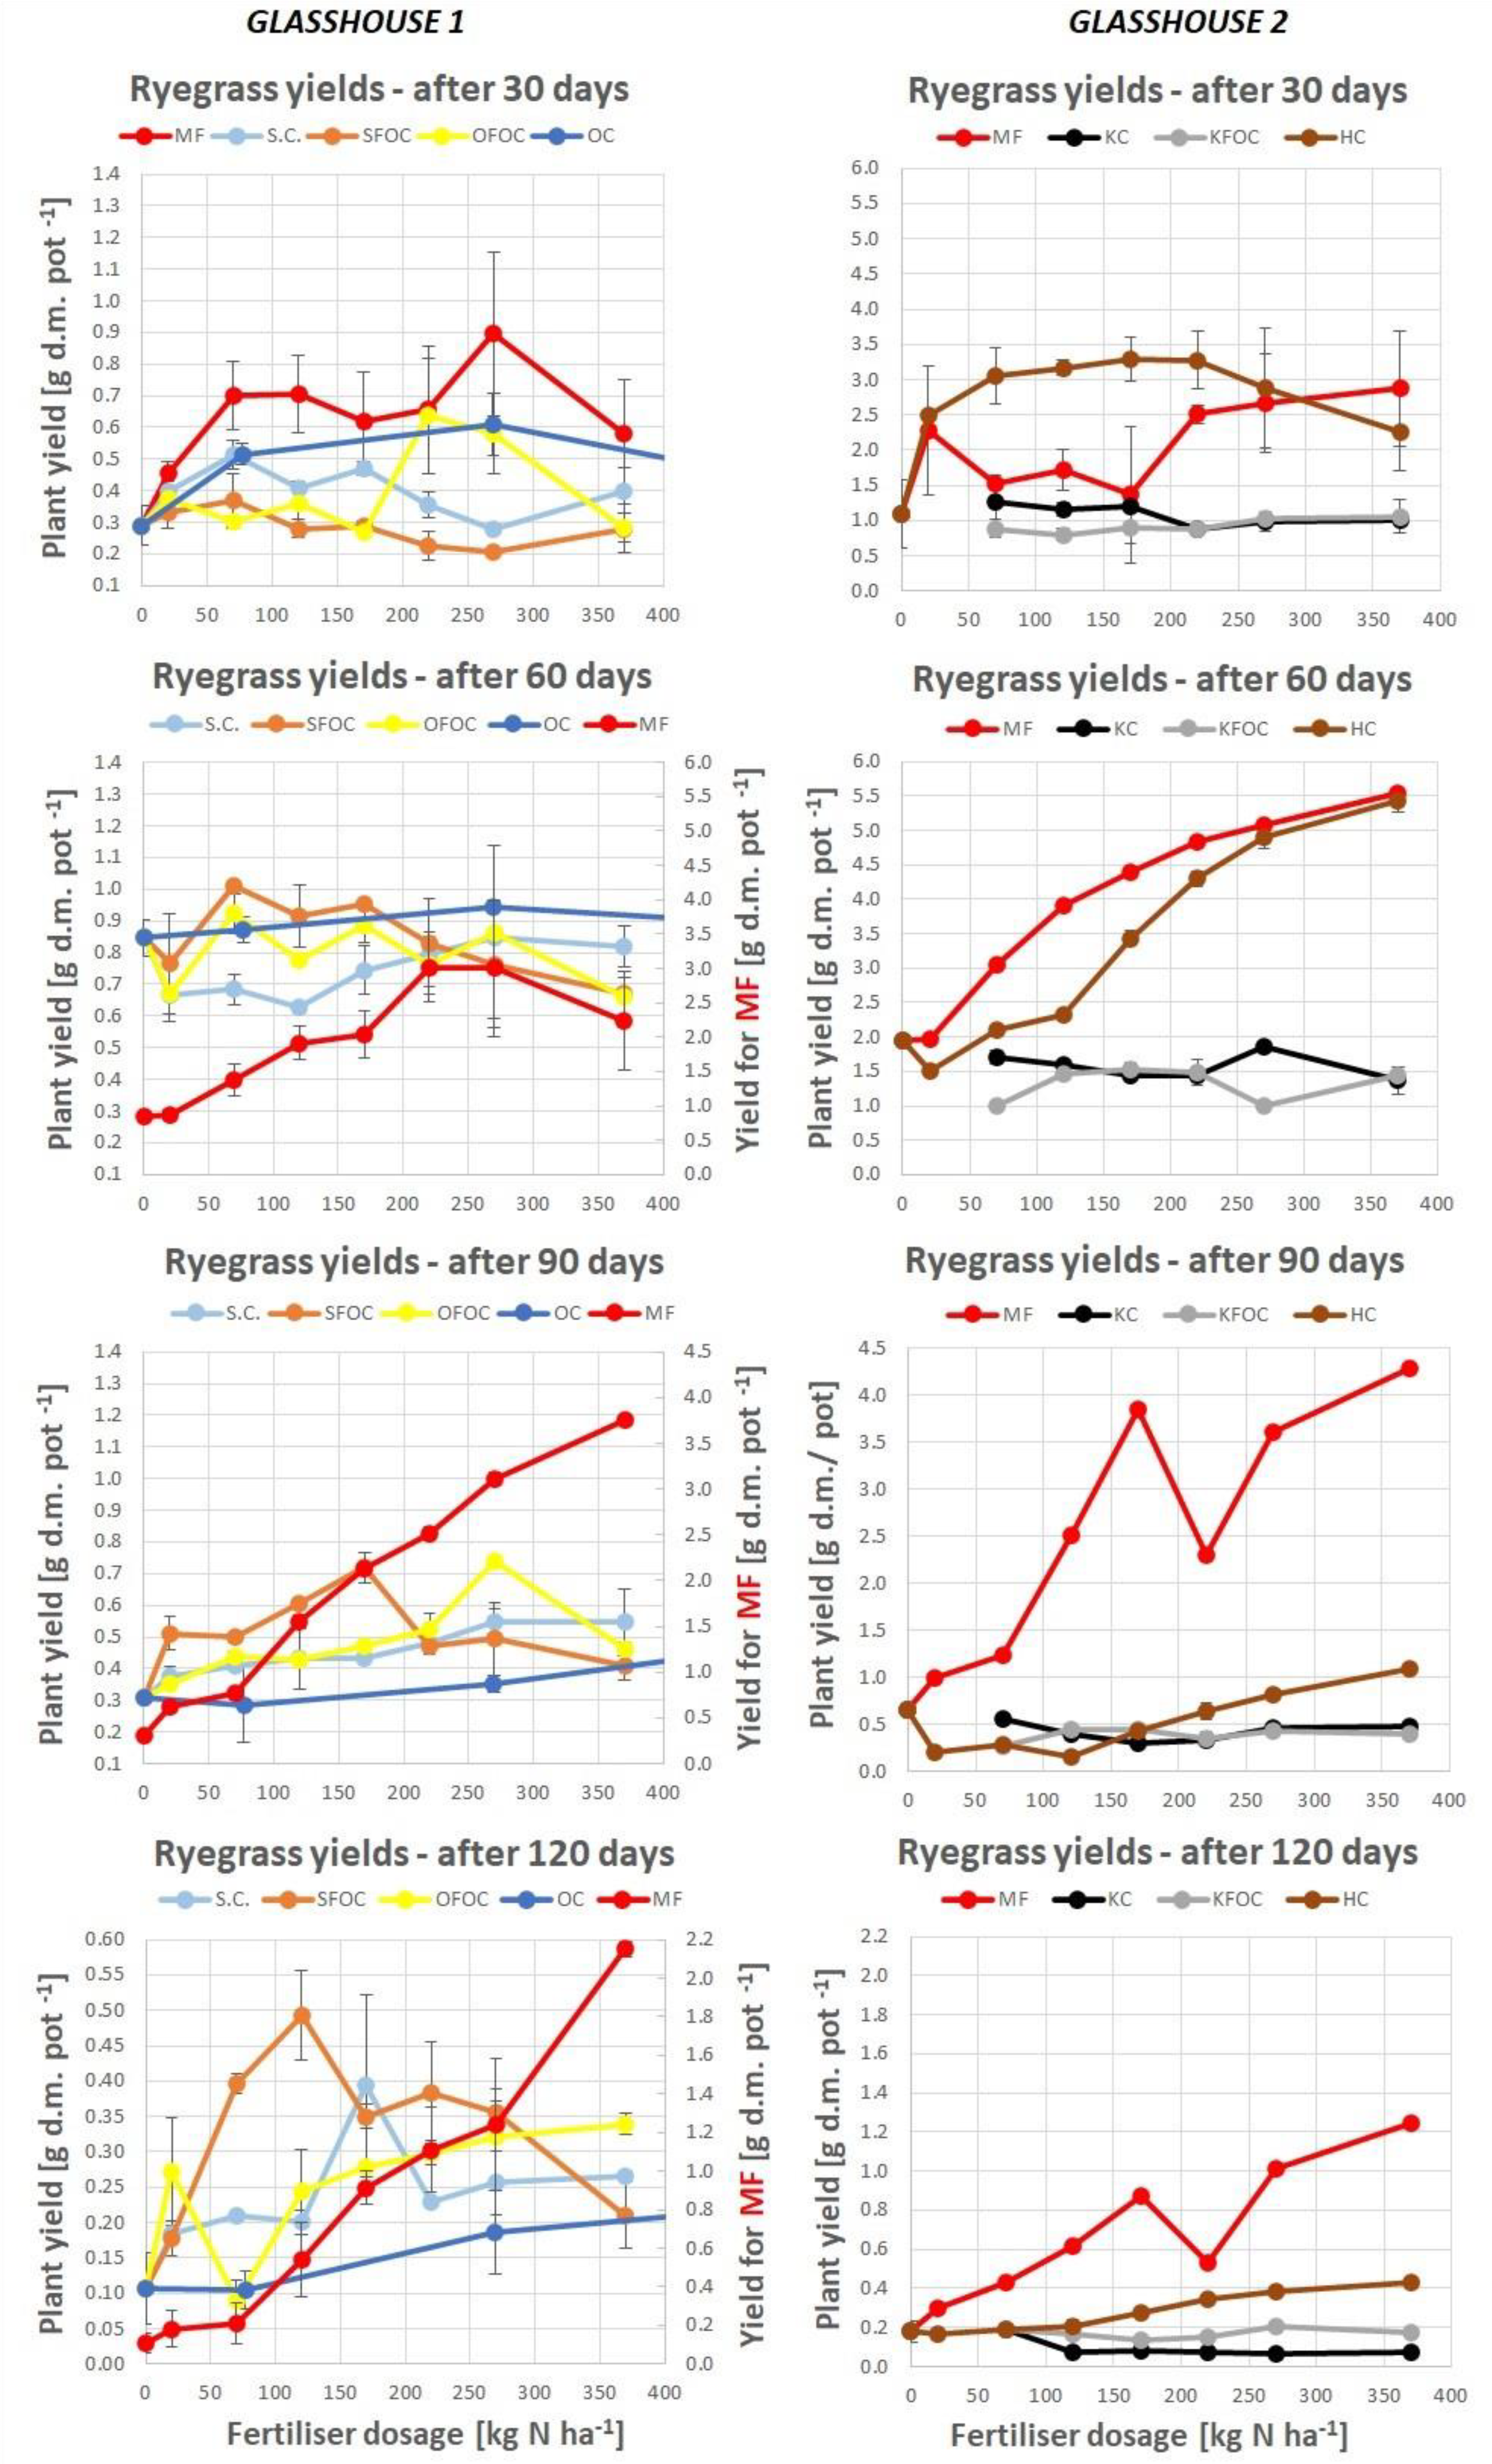
In general, the highest dry matter yields were observed for Harvest 3 (Glasshouse 1, July) and Harvest 2 (Glasshouse 2, August), up to 2.2 t d.m./ha for Glasshouse 1 and about 50% more, that is, up 3.3 t d.m./ha in Glasshouse 2. The lightly processed leather waste-based materials provided only up to 0.7 t of ryegrass d.m./ha in Glasshouse 1, while the hydrolysate of chromium-containing bovine shavings (HC) reached an efficiency similar to the mineral fertiliser (MF), showing up to 3.3 t of ryegrass d.m./ha in glasshouse 2. The use of N reached up to 100 kg N/ha (Harvest 1, 2 in G2) and 85 kg N/ha (Harvest 2, 3 in G1) and was up to three times higher for Harvest 1 in Glasshouse 2 than Glasshouse 1 due to better weather conditions in July (G2) than in May (G1). The opposite was observed for Harvest 4 due to better conditions in August (G1) than in October (G2).
In
Figure 4, we can observe the plant dry matter yields (kg d.m./ha) as a function of plant N in the plants (kg N/ha), regardless of the fertiliser dosage. However, the OC treatment should not be compared, as ca. 4 times higher dosages were used. Although in Glasshouse 1, N was probably the only limiting factor for the MF data, it is difficult to conclude the same for other lightly processed tanned leather waste-based fertilisers (SC, SFOC, OFOC) within the same fertilizer dosage range (20–370 kg N/ha). Thus, the Monod kinetics model proves that, at some point (after ca. 16, 70, 80, and 40 kg N/ha for Harvests 1, 2, 3, and 4, respectively), the dry matter response curve reaches a plateau, showing the over-fertilisation effect. Regarding the Glasshouse 2 data, the relationship between N use and the dry matter yield became more linear (for both MF and HC) with the growth time (harvests 1–4, months: VII–XI), which means that no over-fertilisation effect was observed (no plateau), therefore, applying higher fertiliser dosages would likely not limit the growth potential.
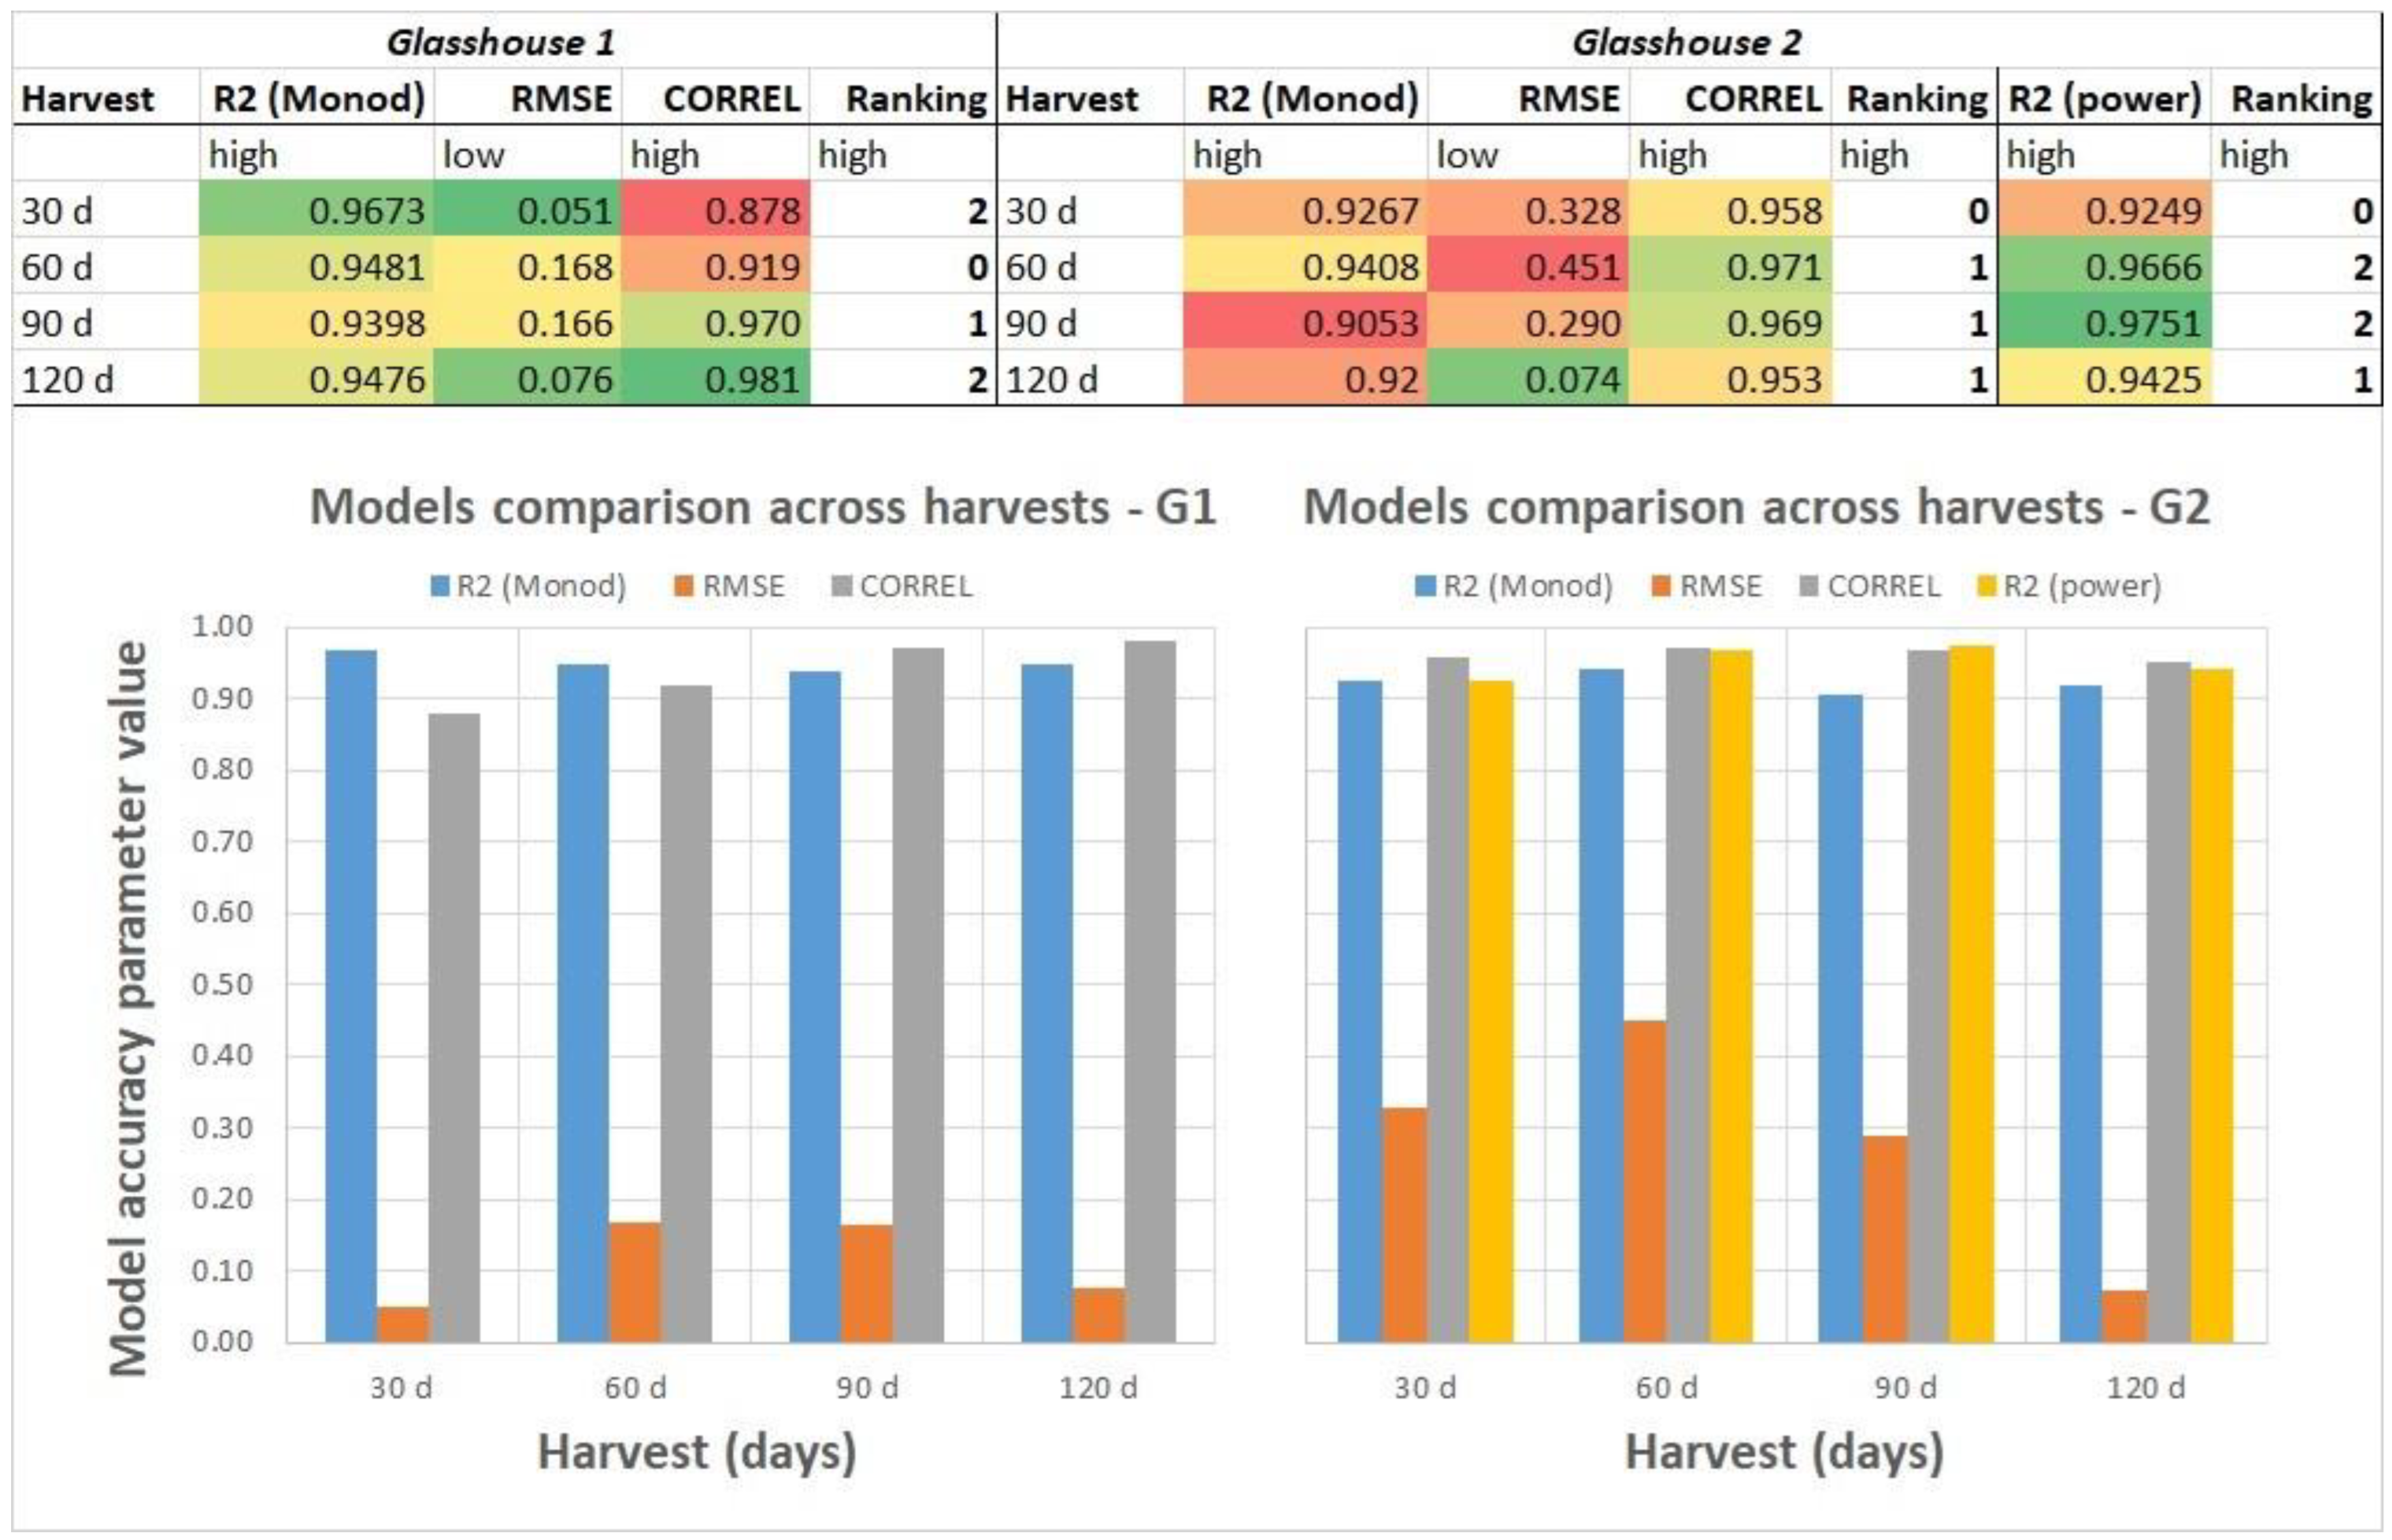
Figure 5 shows the applicability of the Monod models for the prediction of ryegrass dry matter yield as a function of N utilisation per ha. For the experiments in Glasshouse 2, the power model was tested. The comparison is expressed by three precision parameters: square root (R2), root mean square error (RMSE), and correlation coefficient (CORREL). A subjective ranking is expressed by points given for the quality of each parameter. The best parameters are marked in green and the worst are marked in red.
For Glasshouse 1, the Monod model fits the measured data well, especially for Harvests 1 (after 30 days) and 4 (after 120 days), which is evidenced by the low RMSE for Harvests 1 (0.051) and 4 (0.076), the highest R2 for Harvest 1 (0.9673), and the highest CORREL for Harvest 4 (0.981). For Glasshouse 2, the Monod kinetics did not fit the measured data as accurately as for Glasshouse 1, which is expressed by two precision parameters, i.e.
, R2 < 0.9408 and RMSE > 0.290 (except for Harvest 4, where RMSE is the lowest—0.074). The CORREL is the only parameter that reached high values, the highest for Harvests 2 and 3 equalling 0.971 and 0.969, respectively. As the Monod kinetics model was not the best solution for Glasshouse 2 data, the power model was applied and appeared to be more accurate for the prediction of the dry matter yield (with a gradual increase of R2 for Harvests 1–3). The coefficient of determination, R2, was always >0.94, unlike the Monod kinetics model, where it was <0.94 for all four harvests. The models presented above can serve as calculation tools for predicting ryegrass dry matter yields (t/ha) based on the N use data (kg/ha) measured in the plant tissue and referenced to 1 ha. A similar modelling approach was used in other studies [
38,
39].
5. Discussion
5.1. Absolute Agronomic Effectiveness
Absolute agronomic effectiveness (AAE) is expressed by the slope of the best-fit linear regression model for the response of plant growth to fertiliser dosage. It could be expressed by the relationship between N use or dry matter yield as a function of fertiliser dosage. In other words, N-based AAE describes how much nitrogen (in %) is taken up in relation to the nitrogen input (introduced and supplied with the fertiliser) across the increasing dosages. Calculating the AAE is a common way to assess a fertiliser’s performance throughout the literature and has been found in other studies [
40,
41].
Figure S4 of the
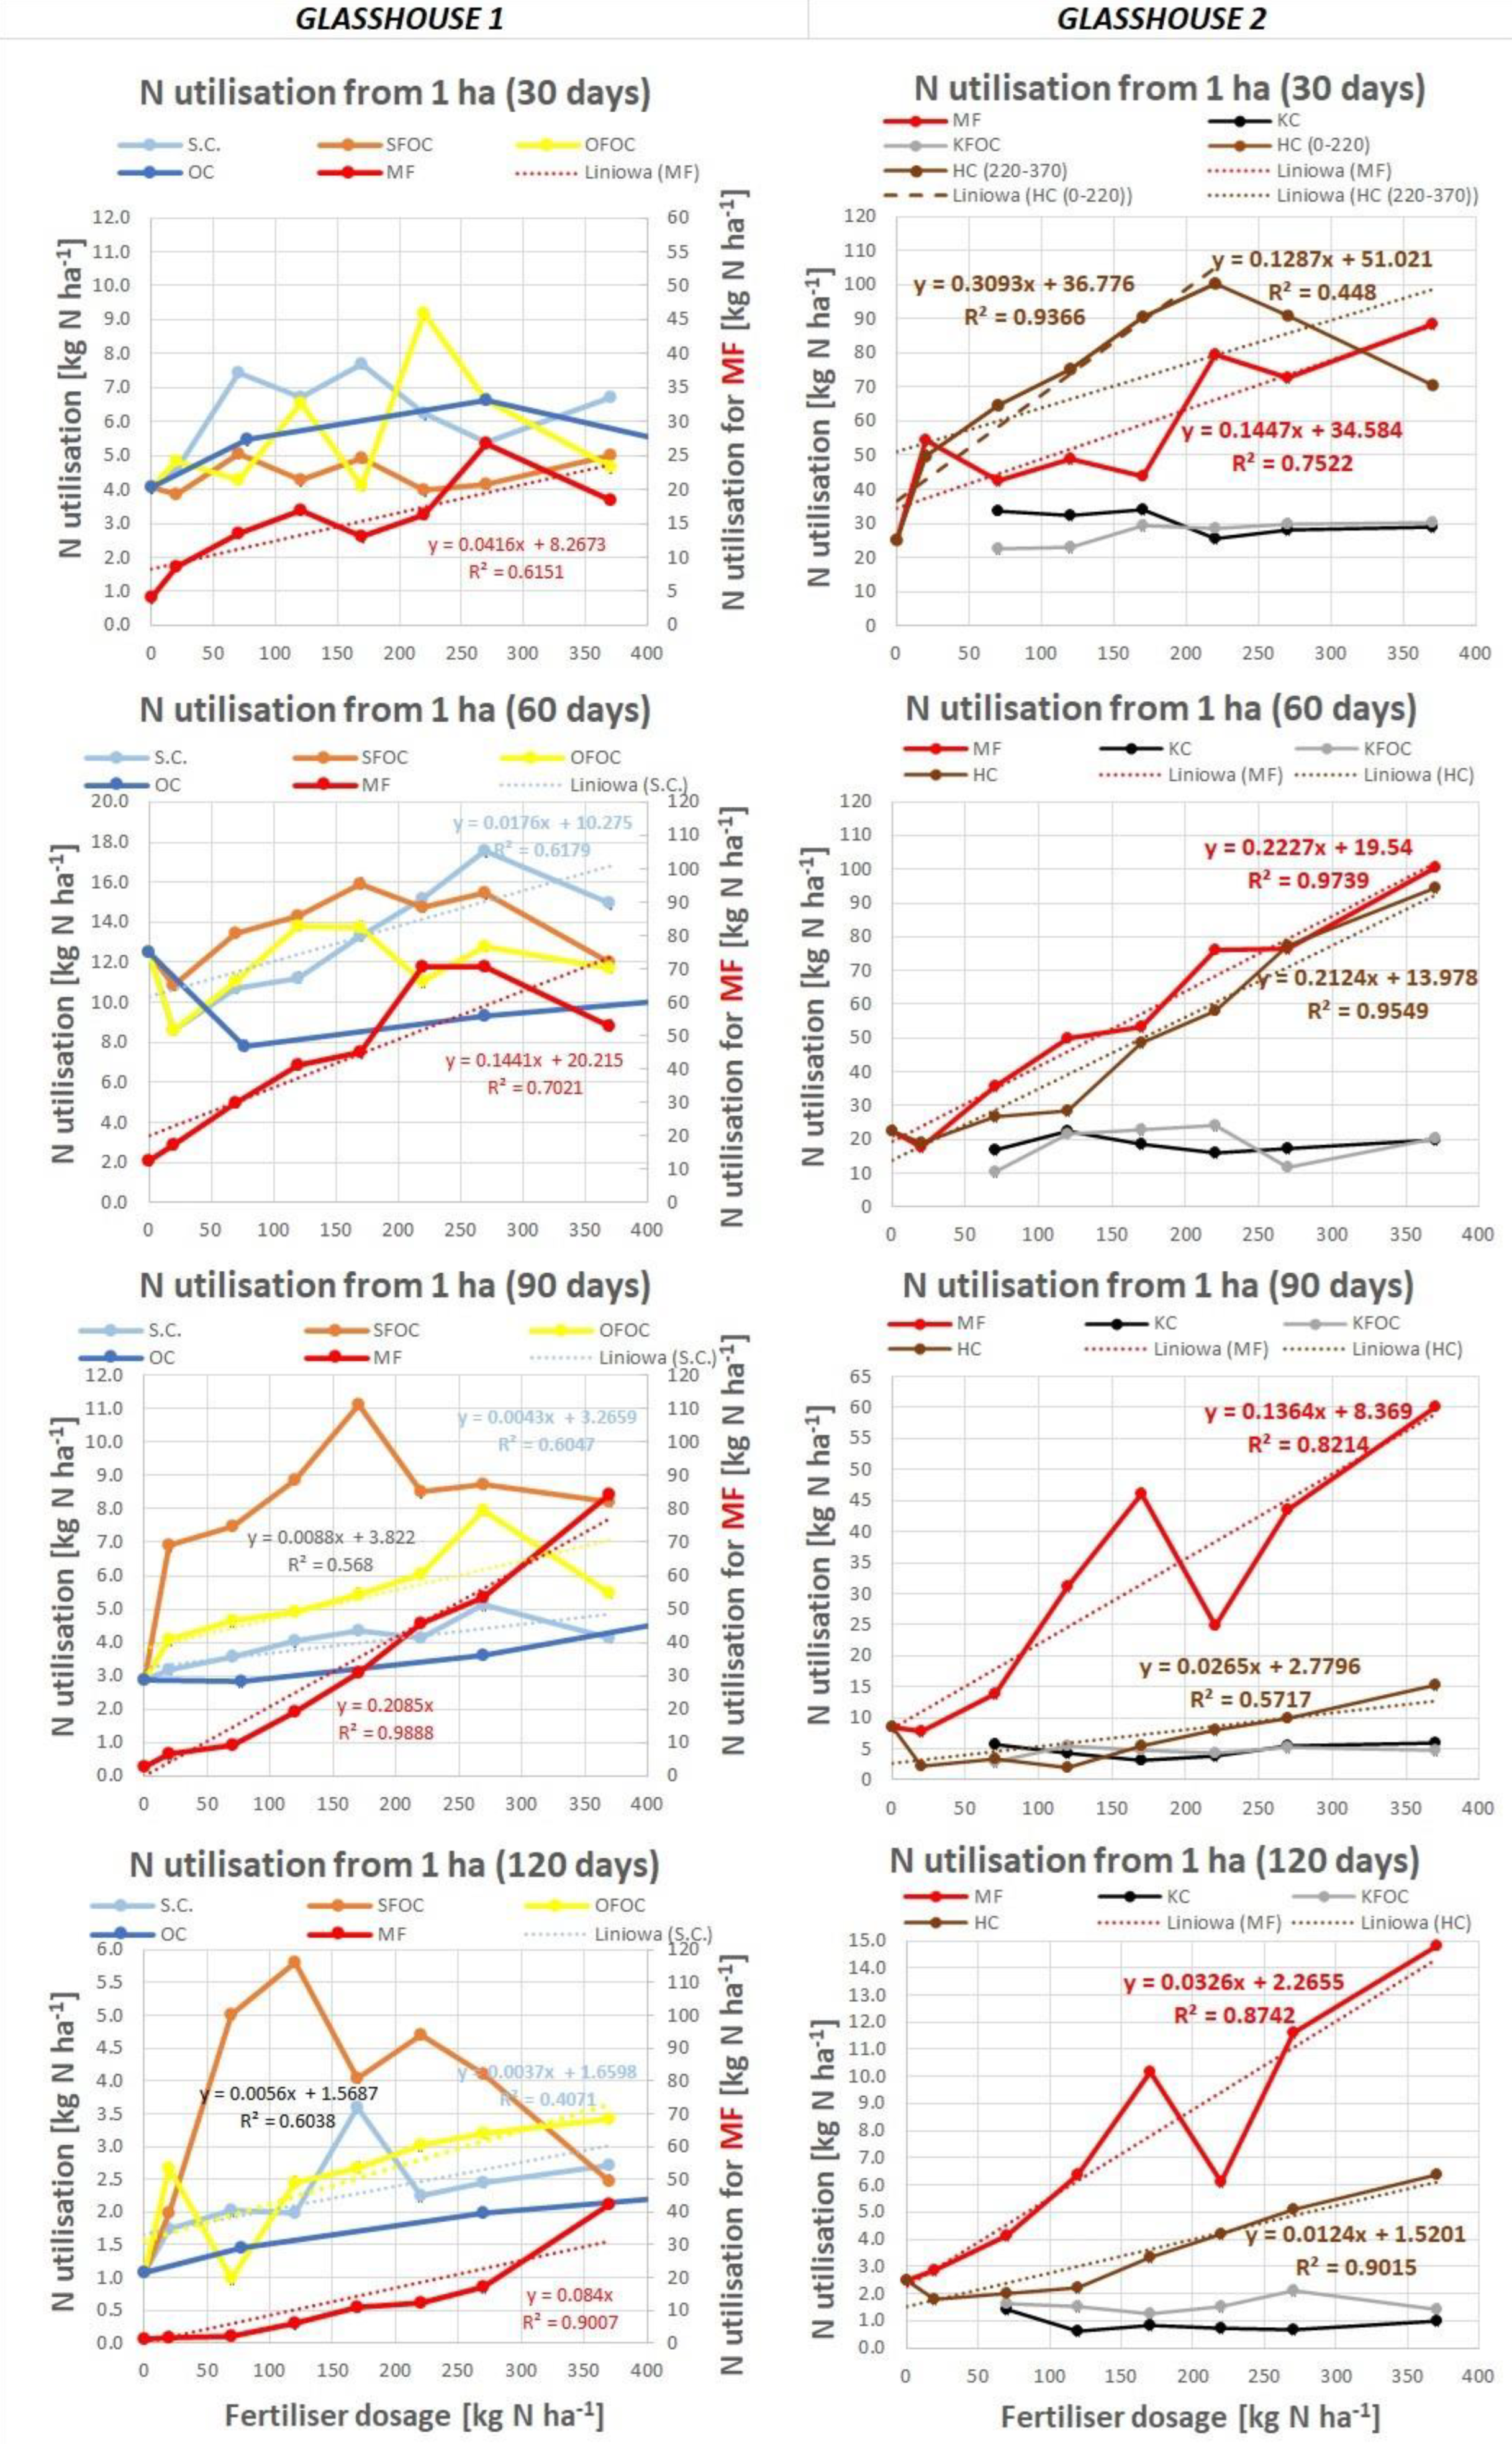
Supplementary Materials shows the total response (after 120 days) of ryegrass to the fertiliser application, expressed both as N utilisation (kg) and dry matter yield (t) calculated per 1 ha. The best fitted linear regression models (to determine AAE) were only used for the materials, which showed relatively moderate and high linear regression accuracy. All of this discussion is based on
Figure S4 (
Supplementary Materials).
5.1.1. Lightly Processed Tanned Waste (Glasshouse 1)
N Utilisation
Of the lightly processed tanned leather waste-based fertilisers, bovine shavings without Cr (SFOC) provided the maximum use of N (35 kg N/ha) at 170 kg N/ha, whereas both bovine shavings with Cr (SC) and splits and off-cuts with no Cr (OFOC) followed a similar slowly increasing linear trend, but showed about 20–80% smaller N utilisation (from 20 to 30 kg N/ha throughout the whole dosages range). It generally shows that neither the chromium content in SC nor other retanning agents (like fats, dyes, and plant-based agents) in OFOC affected the N utilisation. The lowest performance in N use was observed for OC (max. 22 kg N/ha), where some of the remaining residues of the dying agents and chromium may have affected the N uptake. The best-fit linear regressions were only plotted for those responses that represented the increased trend, e.g., SC and OFOC, and the slope of this line is the N utilisation-based absolute agronomic effectiveness (AAE). The AAE (N) for SC and SFOC was 0.0296 and 0.0225, respectively.
Dry Matter Yield
Both chromium-free lightly processed materials, OFOC and SFOC, provided up to 1.5 t d.m./ha, with a visible shift of the response peaks—for SFOC, placed between a 50 and 170 kg N/ha application rate and for OFOC, for an application rate > 270 kg N/ha. The SC and OC responses followed a similar linear trend, but the ryegrass crop had significantly lower yields (on average, 0.9–1.3 t d.m./ha for various fertiliser doses) than for OFOC and SFOC, most likely due to chromium inhibition. It seems that chromium did not actually inhibit the growth of grass in the long-term (4 months) when the ryegrass was fertilised with lightly processed tannery materials. The linear response is still maintained, but generally provides 20% less dry matter than materials without chromium (SFOC and OFOC). The best-fit linear regressions were only plotted for those responses that represented the increased linear trend, e.g., SC and OFOC, and the slope of this line is the absolute agronomic effectiveness (dry matter yield-based). The AE (Y) for SC and SFOC was 0.0007 and 0.0008, respectively.
5.1.2. Aggressively Processed Tanned Waste (Glasshouse 2)
N Utilisation
Biochar from tanned leather waste was twice as effective a N source (as compared to lightly processed leather waste) for ryegrass propagation, with N utilisation values reaching 60 kg N/ha, peaking for KC at the 120 kg N/ha dose and for KFOC at the 200 kg N/ha dose. This shift in peaks is likely related to the Cr content, stimulating growth at lower application rates. The best AAE of the processed and lightly processed tanned leather wastes was found for acid hydrolysate from bovine shavings containing Cr (HC) and equalled 0.38, while the mineral NPK fertiliser (MF) was in the range of 0.50 (Glasshouse 1) to 0.54 (Glasshouse 2). Both the MF and HC response lines are linear, with high R
2 values (0.98–0.99 for MF and 0.92 for HC. The upper right plot in
Figure S4 (
Supplementary Materials) also shows that at low application rates (<120 kg N/ha for HC and <150 kg N/ha for MF), the N utilisation exceeds the nitrogen input. This means that additional N is most likely drawn from the atmosphere and/or supplied by the soil (1.32 g/kg soil d.m.). A similar phenomenon has been observed in other studies [
38]. Above these application rates (>120 and >150 kg N/ha), the use of N amounts to less than 50% of the N input for MF and less than 38% of the N input for HC. Ideally, all supplied nitrogen should end up in the plant tissue (y = x line). In reality, only part of the supplied N ends up in plants; the rest of the nitrogen is likely preserved in the soil and/or is nitrified to atmospheric nitrogen.
Dry Matter Yield
Biochars stimulate growth up to 50% higher than lightly processed materials, namely up to 2.3 t d.m./ha (KC) and up to 1.8 t d.m./ha (KFOC); however, there is no clear tendency of the response curves. In general, with an increasing application rate, the ryegrass growth response to KC fertilisation decreased, in contrast to the response to KFOC, which initially increased, then maintained at approximately 1.6–1.8 t d.m./ha. This is consistent with the N utilization tendency for both KC and KFOC. Moreover, the dry matter yield of KC peaked at the lowest application rate, which is not likely driven by N content (lack of N utilization peak at the same application rate).
In terms of the dry matter, HC was the best waste-based fertiliser. The dry matter yield-based AAE was 0.0096 for HC, while for MF, it varied from 0.013 (Glasshouse 1) to 0.016 (Glasshouse 2). Both the MF and HC response lines are linear with high R2 values (0.95–0.96 for MF and 0.93 for HC). The increase in the dry matter yield is coherent with the nitrogen use for both MF and HC, which is also proven by
Figure 3 with the internal efficiency for N utilisation. These increasing trends are more Monod-type kinetics for Glasshouse 1 and more linear for Glasshouse 2, evidencing more growth-inhibiting effects at certain high fertiliser dosages for Glasshouse 1. This proves that chemical processing of tanned waste fractions helps in the attainment of higher yields with higher fertiliser dosages without harming the plant, as the over-fertilisation plateau for HC was not observed.
5.2. Relative Agronomic Effectiveness
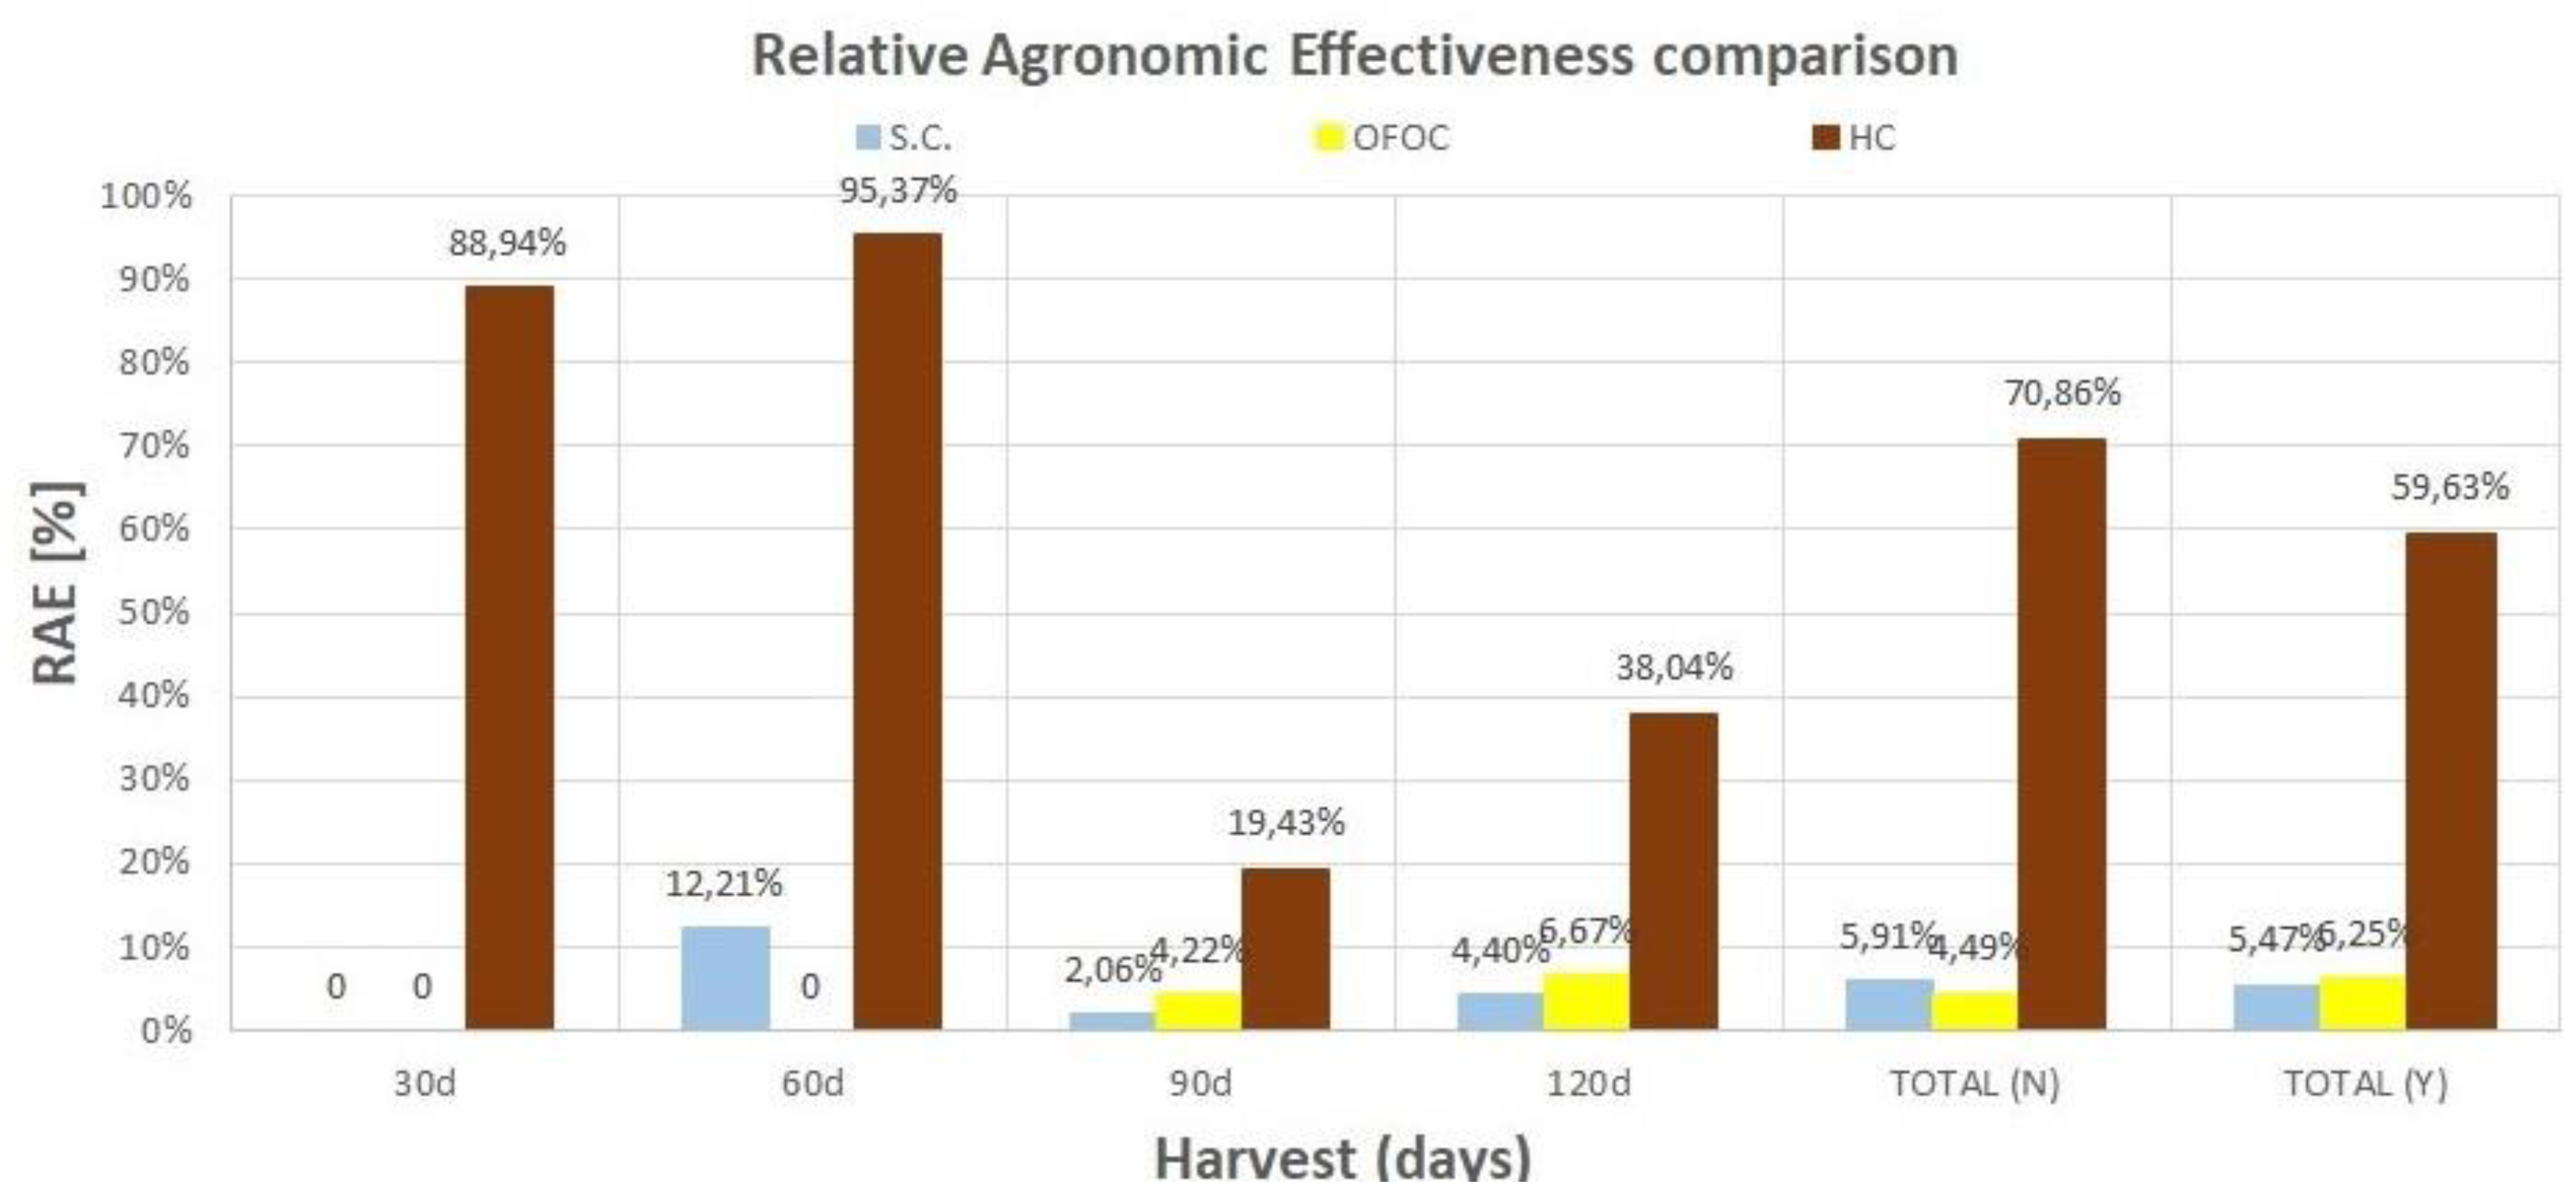
Figure 6 summarizes all the previously presented data by showing the calculated relative agronomic effectiveness (RAE) for the fertiliser materials, where it was possible to calculate AAE. The RAE is actually the AAE of the reference mineral fertiliser (MF). The RAE based on the utilization of N (RAE(N)) was calculated and presented for each subsequent harvest and also as a total value after adding all the harvest data. However, the d.m. yield-based RAE (Y) was calculated only as a total value. The N-utilisation-based RAE(N) better characterizes the fertiliser material (according to authors’ opinion), as it also contains the dry matter yield when calculating the total N-utilisation per area. The RAE values for lightly processed waste-based materials can be determined only for SC and OFOC. The SC RAE(N) reached a maximum (12.21%) during the second month of growth (it was not possible to calculate it for the first month), most likely due to the remaining stressing effect of chromium, then it dropped to 2.0% (3rd month) and 4.4% (4th month) to reach a total value of 5.9%; the RAE(Y) was determined as 5.5%. The OFOC showed comparably low values of RAE(N) at 4.2–6.7% (months 3–4), with a total value of 4.5%; the total RAE(Y) equalled 6.2%. The best RAE(N) was found for HC, reaching a maximum in the second month of 95.4% (and 88.94%, 19.4%, and 38% for the first, third, and fourth month, respectively) and a total of 70.9%; the RAE(Y) was 59.6%. This shows that hydrolysate supplemented with additional micronutrients presents the best fertilising properties among all the investigated leather wastes materials (at least with respect to RAE). In fact, the RAE of HC was increased by 200% (0.30/0.14, as seen in
Figure 3) for <220 kg N/ha during the first month. However, when looking at the entire spectrum of dosage ranges, it decreased by two data points, showing a decrease in N utilisation with increased fertiliser dosage (>220 kg N/ha). Over-fertilisation should be avoided in practice.
The regulations on the content of Cr in fertilizers in the European Union only regulate the content of Cr (VI), while Cr (III) is generally acceptable without limitation, based on literature that does not consider it to be dangerous. It is expected that in Europe, the maximum allowable Cr (VI) content will remain at 2 mg/kg, while Cr (III) will remain unlimited (Fertilizers Regulation (EC) 2003/2003 of the European Parliament and of the Council Referred to Fertilizers). The scientific literature gives a safe maximum Cr (III) content of 5000 mg/kg.
This study is advantageous to other studies on leather waste application in agriculture in the following aspects: (1) it focuses on particular tanned waste fractions, rather than on a mixed leather waste lot; (2) it proves that only minimal mechanical (grinding) and biological (EM incubation) processing does not alter the RAE significantly (<12%); (3) it shows that an application of hydrolysates enriched with a novel micronutrient spraying technique elevated the RAE to >95%; and (4) proves that typical biological studies based on a Monod kinetics model fits more lightly processed tannery waste fractions where an over-fertilisation plateau was visible at higher fertiliser rates. This is in opposition to aggressively processed fractions, where the ryegrass biomass increment was rather directly proportional to the plants’ N content, evidencing their better adaptation to higher fertiliser dosages (over-fertilisation plateau not observed).
In conclusion, with regard to untanned waste, it is possible to directly apply it as an organic nitrogen fertilizer, but in the case of chromium-tanned waste (SC, OC, KC) exceeding 5000 mg/kg of Cr, it is necessary to separate the chromium prior to application. Research in this direction is ongoing at the moment.
The use of leather waste fractions and their biochars as organic fertilizers for crop growth is a promising area of research with several future perspectives. While the results of this study are promising, they were conducted in a glasshouse environment, and there is a need to explore the feasibility of scaling up the application of leather waste fractions as fertilizers in field conditions. Large-scale field trials could provide insight into the potential of these fertilizers in improving crop yields and the long-term effects on soil health. Field trials could also provide data on the optimal application rates and timing for these fertilizers to achieve maximum benefits.
Furthermore, the challenges associated with scaling up the production and application of these fertilizers need to be addressed. These challenges may include issues such as transportation, storage, and application methods. It is essential to develop cost-effective and practical solutions to these challenges to ensure the successful adoption of leather waste fractions as organic fertilizers in agriculture.
In addition, this study focuses on ryegrass growth, but it would be interesting to investigate the effectiveness of leather waste fractions as organic fertilizers for other crops, as well. Different crops have varying nutrient requirements, and studying the impact of these fertilizers on a wider range of crops could help identify their potential for use in diverse agricultural systems. This could include crops that are commonly grown in different regions, crops with high nutrient requirements, and crops that are susceptible to diseases and pests. Furthermore, investigating the impact of these fertilizers on a wider range of crops could also provide insight into their potential for use in crop rotation systems. Crop rotation is an essential practice in sustainable agriculture, as it helps to maintain soil fertility, prevent diseases and pests, and reduces the use of synthetic fertilizers and pesticides.
Furthermore, a comprehensive environmental impact assessment is needed to evaluate the broader implications of their use in agriculture. This could include assessing the impact of these fertilizers on soil health, water quality, and greenhouse gas emissions. Leather waste fractions may contain heavy metals or other contaminants that could potentially be harmful to soil and water resources if not managed properly. Therefore, it is crucial to investigate the potential risks associated with their use and develop appropriate management practices to mitigate these risks. Moreover, the production and application of these fertilizers could potentially contribute to greenhouse gas emissions, depending on the methods used. Therefore, it is important to assess the carbon footprint associated with their production and use and develop strategies to minimize their impact on the environment.
There is also a need to explore the commercial potential of using leather waste fractions as organic fertilizers. This could involve developing cost-effective production methods for these fertilizers and exploring potential markets for their sale. Finally, future research could focus on optimizing the production processes of these fractions to maximize their effectiveness as fertilizers while minimizing any negative environmental impacts. This study investigated the use of both lightly processed and aggressively processed leather waste fractions as fertilizers, but there may be opportunities to further improve the production processes to enhance their effectiveness.
6. Conclusions
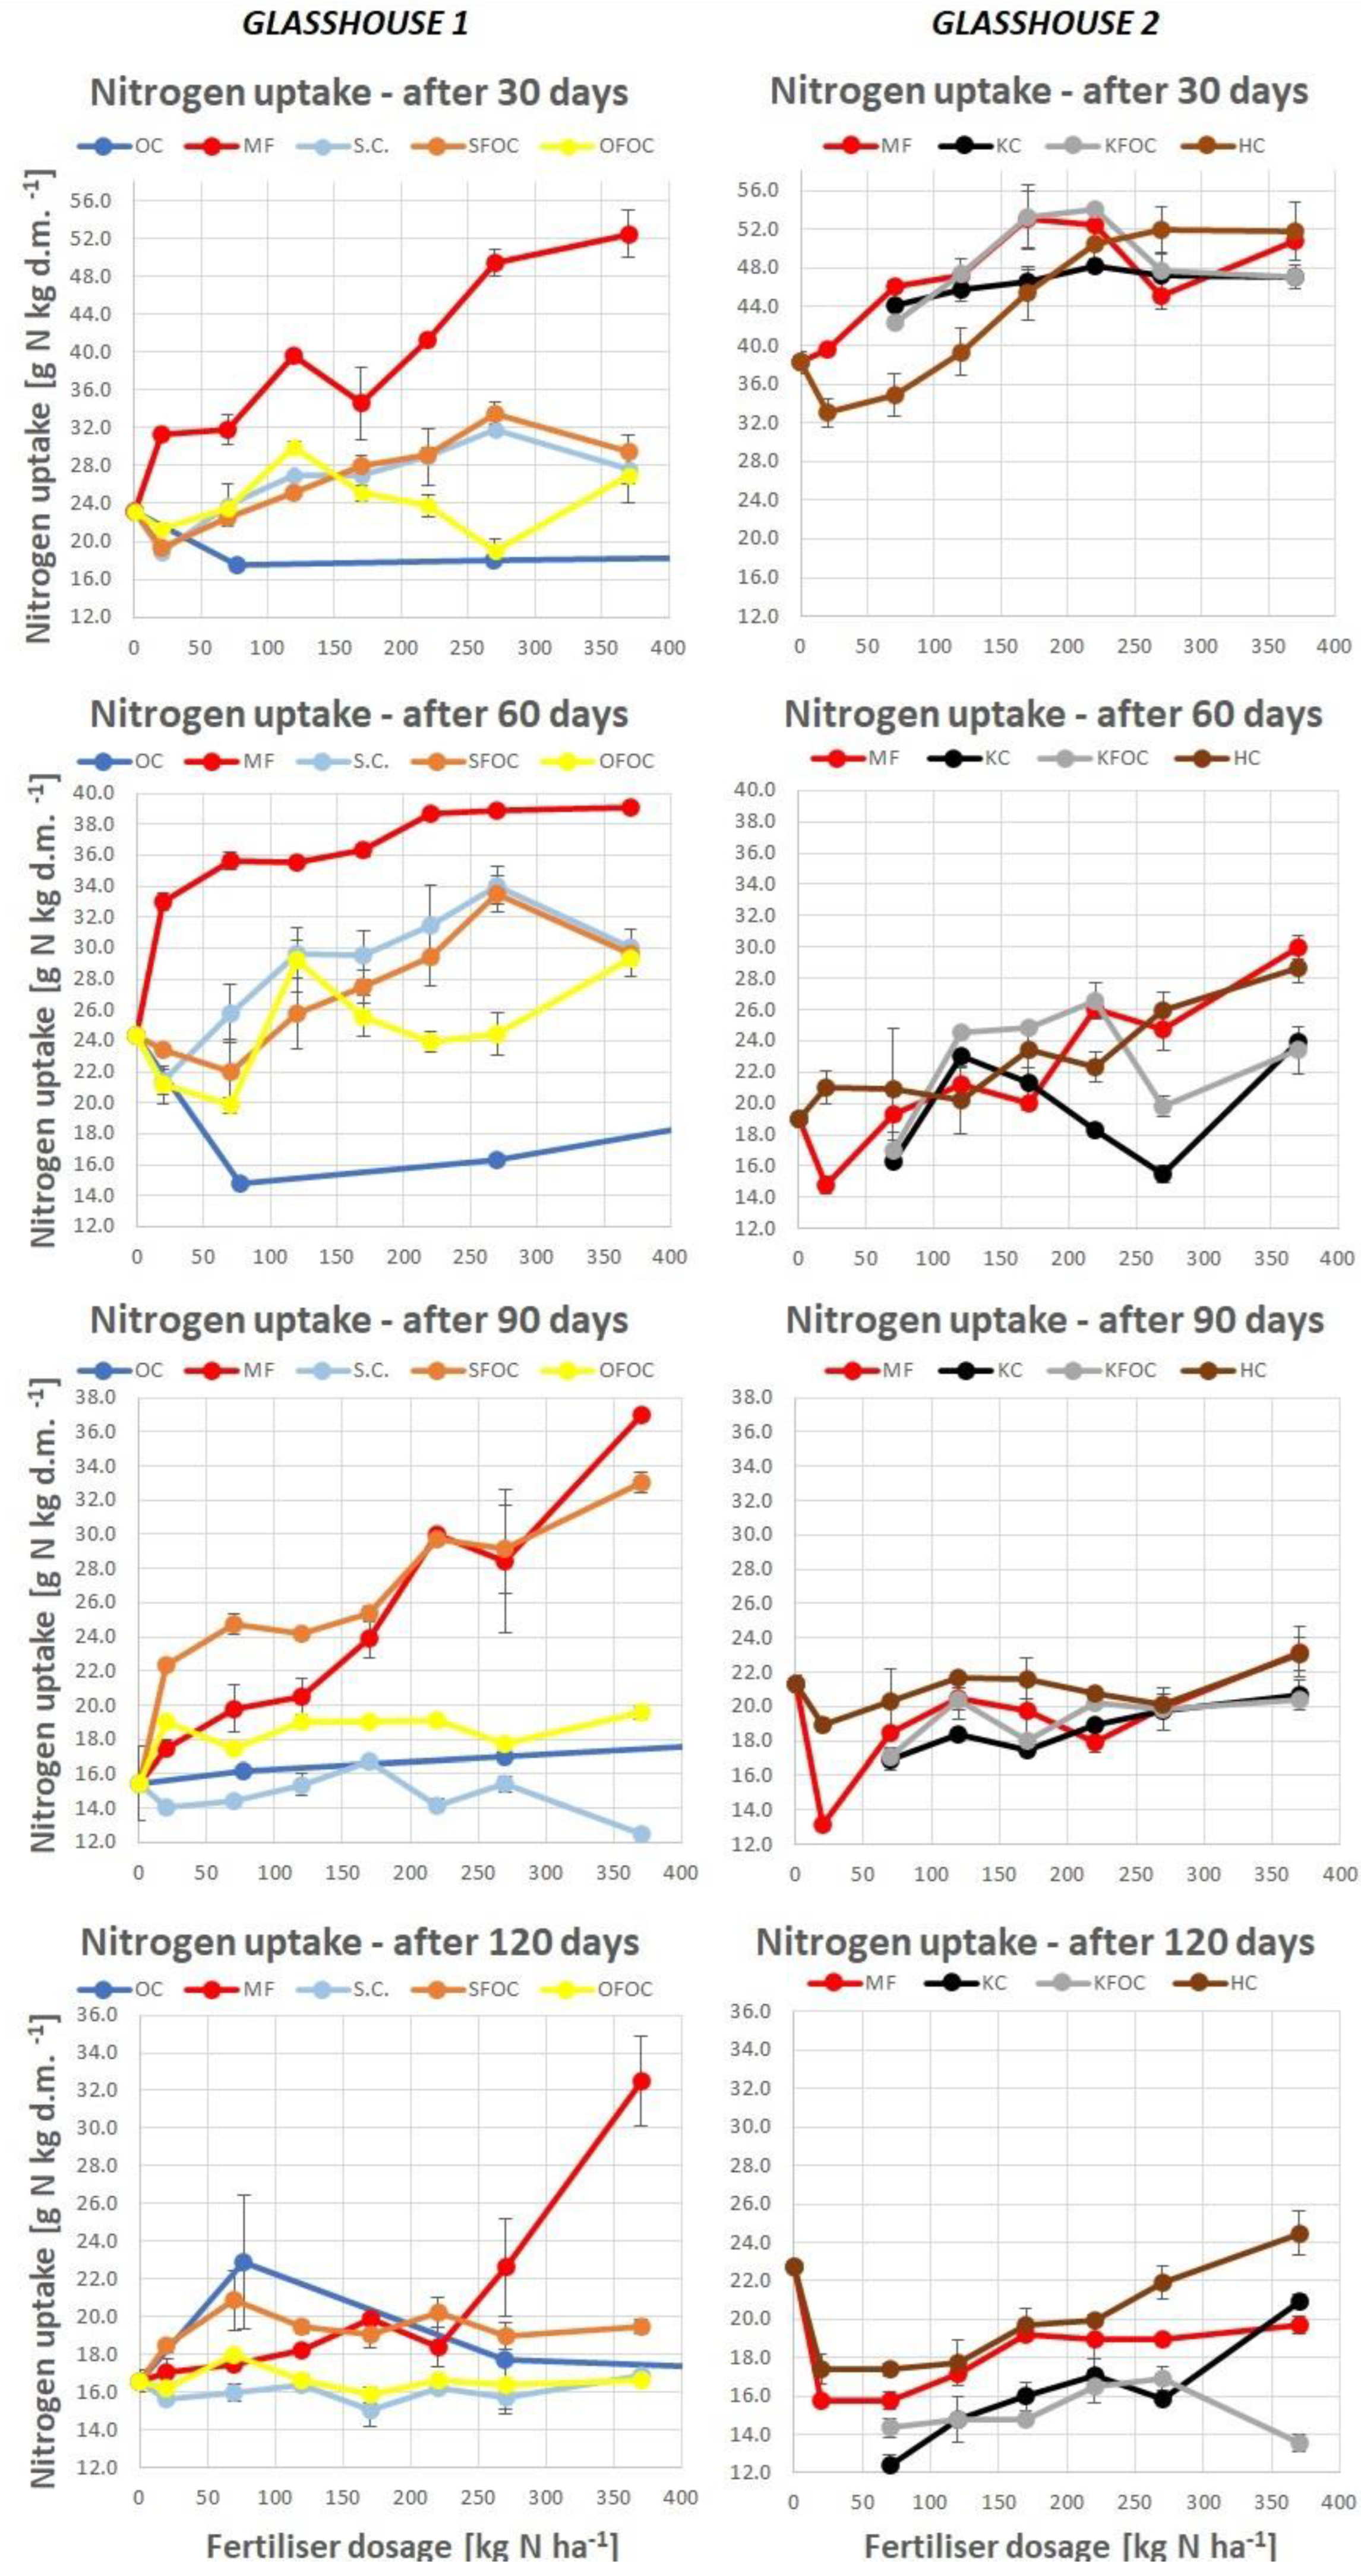
Both chromium-containing and chromium-free lightly processed (bovine shavings and splits and offcuts, ground and EM-incubated) and processed (bovine shavings ground, pyrolyzed, or acid hydrolyzed, all supplemented) fertilisers based on leather waste were applied in two separate glasshouse experiments, consisting of four subsequent harvests under spring–autumn conditions in northern Poland. The Cr stressing effect caused by Cr-containing waste (shavings—SC, and splits and offcuts—OC) stimulated the growth of ryegrass after 30 days, providing twice the dry matter yield than equivalent wastes without Cr (SFOC and OFOC). Then, after 90 and 120 days, Cr actually inhibited growth. The maximum dry matter yields were ca. 1 g d.m./pot for lightly processed (bovine shavings free of Cr) and 5.5 g d.m./pot for processed (hydrolysate) tanned leather wastes. Over-fertilisation (which should be avoided in practice) expressed by decreasing N use per area was observed only in SFOC after 170 kg N/ha. Other waste-based fertilisers showed an increase in N utilisation by ryegrass with increasing fertiliser application rates up to 370 kg N/ha. The lightly processed materials generated a concentration of N up to 34 g N/kg plant d.m. (bovine shavings, regardless of Cr content, namely SC and SFOC), while the processed ones generated up to 54 g N/kg plant d.m. (hydrolysate). Taking into account the dry matter yields, these fertilising materials resulted in N utilisation with up to 18 kg N/ha (Cr containing bovine shavings, SC) for lightly processed ones, and as high as 100 kg N/ha for the hydrolysate (similar to mineral fertiliser values).
The Monod kinetics model with the best-fitting coefficient of determination, R2 > 0.94, was developed for the internal efficiency of N utilisation for lightly processed tanned leather waste fractions for each of the four harvests, whereas more linear relations, especially with the later harvests, were found for processed tanned leather waste fractions, evidencing less growth-inhibiting effects and no over-fertilisation. HC showed the best performance, reaching the calculated N utilization-based relative agronomic effectiveness (RAE(N)) of 89%, 95%, 19%, and 38%, for 30, 60, 90, and 120 days, respectively, and 71% in total, while the RAE(N) for lightly processed fractions (SC, SFOC, OC, OFOC) was lower than 12%. This is probably due to the amino acids extracted from bovine shavings, which have the property of stimulating plant root growth and properties of chelating the ions of fertilising micronutrients, creating their more bioaccessible forms. The soil properties were not seriously affected after 120 days of growth. Another detailed toxicological study with plant fractions (kernels and roots) contamination distribution is currently in progress to further explore the behaviour of such wastes as fertilisers and their effects on plants, and to confirm that there is no negative effect on the quality of plants or soil (e.g., chromium contamination). It is also further recommended to verify the very long-term effect of such waste usage on ryegrass growth, N uptake, and soil properties, e.g., over the full year vegetation period, including winter. The soil, once fertilised in the first season, would probably hold part of the nutrients in waste for subsequent utilisation in the second season, without the need for re-fertilisation. The next dosages could be then applied in the third season and every second season thereafter. This approach would have given the full picture of tanned waste fractions usage as N-fertilisers.
While most of the literature focuses on heavy, chemical treatment of tannery waste to keep the contaminants aside and make the nutrients more available to the plants, we attempted another method. Our goal was to verify the agronomic effectiveness of tannery waste that was only slightly treated with microbial methods vs. aggressively treated with chemical methods (hydrolysis) and thermal methods (pyrolysis). These approaches were compared, and with the knowledge that direct land application of untreated tannery waste will hardly be possible due to the soil/fertilizer standards, it was still worth investigating, as the chemical extractions turn nutrients into more available forms. However, at the same time, they may consequentially produce more waste and wastewater. Secondly, slightly treated tannery waste does not need to be considered as fertilizers as such, since some of their fractions may not meet the fertilizer values. Other materials could be good candidates with less restrictions, e.g., soil ameliorants/improvers/biostimulators. These could also be used in remediation of already polluted soils. Thirdly, our research is continuous, and we are attempting to apply various microbes in order to maintain a low level of chemical treatment, which will hopefully bring us to the environmental compromise when wastes are utilized without any further waste generation, providing an added value to the system (better growth and nutrient utilisation). Lastly, the bovine shavings (wet white) with no chromium constitute a “clean” byproduct that already meets fertilizer requirements in some countries and could be applied to land with only minimal mechanical treatment to improve its handling properties (e.g., in Germany).

 ,
, 


