
Examination of the Hungarian Electricity Industry Structure with Special Regard to Renewables


1
Institute of Agricultural and Food Economics, Hungarian University of Agriculture and Life Sciences, 2100 Gödöllő, Hungary
2
Institute of Marketing, Budapest Metropolitan University, 1148 Budapest, Hungary
3
Donát Bánki Faculty of Mechanical and Safety Engineering, Óbuda University, 1081 Budapest, Hungary
*
Author to whom correspondence should be addressed.
Energies 2023, 16(9), 3826; https://doi.org/10.3390/en16093826
Submission received: 30 March 2023
/
Revised: 22 April 2023
/
Accepted: 26 April 2023
/
Published: 29 April 2023
(This article belongs to the Section C: Energy Economics and Policy)
Abstract
:The stability of electricity service mainly depends on two main factors. One of them is the country’s power plant capacity and electricity imports. Another factor is the network that delivers electricity to consumers. Recently, consumer electricity production has appeared as a third factor due to the spread of renewable energies. The article focuses on the transformation of the structure of Hungary’s electricity sources between 2010 and 2020. We used the concentration indicator to examine the structure of export–import deliveries with neighboring countries. We also analyzed the centralization of Hungary’s electricity-generating units and the composition of their fuels. In this article, we examined the increasingly widespread renewable energies, which are replacing the traditional—mainly fossil fuel—energy carriers. The relationship between coal, natural gas, nuclear, solar, wind, water, and bioenergy, as well as net imports, were analyzed using a Pearson correlation matrix. This article concludes that renewable energies will cause further transformation in the future, both in the structure of export–import and power plants. In electricity imports, green power is increasingly preferred. Electricity from renewable sources will account for an increasing share of electricity production. In the future, electricity production based on non-renewables will move toward power plants with low carbon dioxide emissions. On the other hand, it is also moving in the direction of fast-reacting power plants due to weather-dependent renewables. Annual system load peaks will continue to increase year after year in the future, thereby posing additional challenges to electricity generation and the electricity grid.
1. Introduction
The world’s population has grown significantly in recent decades. It took the global population 12 years to grow from 7 to 8 billion (2010–2022), and it will take approximately 15 years (2022–2037) to reach 9 billion. Due to the growing population, energy demand has also been increasing. Energy consumption has played a vital role in economic growth, other sectors of industry, and improving social conditions. GDP growth, population, labor force, and greenhouse gas emissions have a positive relationship with energy consumption [1]. The energy produced can be used in heating–cooling, transport, and electricity sectors. However, increasing energy consumption and rapid economic growth are also the main sources of carbon dioxide emissions [2]. Global energy demand and energy-related carbon dioxide emissions will continue in the future, but most energy sources are limited. As a result of the decreasing amount of fossil energy sources, there is an increasing interest in other energy sources, especially renewable energy sources [3,4,5].
The term “renewable energy” (RES) refers to the energy available in unlimited quantities, which are naturally replenished without being depleted in the Earth. These include bioenergy, hydropower, geothermal, solar, wind, and ocean (tidal and wave) energy [6,7,8]. The potential for renewable energy resources is enormous because they can exponentially exceed the world’s energy demand; therefore, these types of resources will have a significant share in the future global energy portfolio [9]. In the future, biomass can be considered the best option, and it has the most considerable potential, which meets the requirements and could ensure the fuel supply [10,11]. Several renewable energy technologies are available at different stages of the development cycle. Hydropower and bioenergy are the main sources of energy worldwide. Other options are technically proven and available on commercial terms but still occupy only a fraction of their potential markets [12,13]. Hydropower, wind, solar, and biomass energy are even more expensive than fossil-based power generation. However, due to steadily declining reserves of fossils and rising energy prices, it is increasingly worthwhile to switch to renewable energy sources [14].
Renewable energy growth around the world continued to be driven by a combination of targeted public policy and advances in energy technologies. The policy support for renewable energy is focused primarily on power generation, with support for renewable technologies lagging in the heating and cooling, as well as transport sectors [15]. Improving energy efficiency reduces the increasing energy demand, but, at the same time, renewable energy has become a key issue in the partial replacement of fossil energy [16,17]. The role of renewable energy is significant even if renewables are often available in smaller quantities; production cannot be regulated, and some of them depend on the weather. Renewable energies prevent the Earth’s temperature from rising and will be key to a low-carbon future. The use of RES does not burden the environment as significantly as fossil fuels. The production of renewable energy is also becoming cheaper every year due to technological advances [18]. In addition, renewable sources will never run out. However, there are several reasons why the transition from fossil fuels to renewable energy is not easy. These include specific energy capacity, intermittency, geographic location, transport bottlenecks, environmental impacts, and land availability [19]. The spread of renewables may also be impeded by the availability of fossil resources within a country [20]. The factors that provide the framework for countries follow different international obligations, differences in planning/licensing cultures, differences in public awareness concerning renewables, and/or technical differences [21].
Energy exists in heat, mechanical, light, electrical, or other forms in our everyday life. Electricity is essential for all activities; it is used in transport, services, agriculture, and industry. Electricity is the most convenient, essential, and versatile form of energy. In this article, we focus on the investigation of the source and flow of electricity. In energy statistics, the ability to separate primary and secondary energy is very important. To avoid double counting, it is essential to be able to separate new energy entering the system (primary) and the energy that is transformed within the system (secondary). Primary energy can be defined as the energy that is extracted directly from natural resources, such as crude oil, hard coal, and natural gas, or is produced from primary commodities. Primary energy sources are very important for all sectors of the economy, and global production and population have been rapidly growing. Secondary energy is energy produced from the transformation of primary energy sources, such as electricity, refined automotive fuel, or hydrogen [22,23].
This article presents the development of Hungary’s energy sources and the production and consumption of electricity in relation to the European Union in the 2010s. The analysis was carried out by using time series and economic and statistical indicators. The main emphasis is on the composition of sources, the size of production units, and the development of export–import flows over time. An important role is also given to the examination of sources that replace each other.
2. Outlook on Electricity Production and Consumption
Electricity is traditionally produced by burning fossil fuels such as coal, lignite, oil, and natural gas. It also comes from nuclear power plants and renewable sources such as biofuels, wind, solar power, water, and geothermal heat [24]. The importance of electricity has been steadily increasing since the second industrial revolution. We depended mainly on coal, oil, and gas, which totaled 61.9%, of the generated electricity in the world in 2021. The share of nuclear energy was 9.8% of the total world electricity production in 2021 [25]. At the same time, electricity is increasingly generated from renewable sources. Globally, around a quarter of electricity comes from renewable sources [26,27]. Environmental problems drive the entire energy system towards efficiency, economy, and renewable sources of electricity [28]. The problem is that, the more traditional energy sources contribute to electricity production, the slower the pace of renewable energy development. This correlation can be explained by lobbying for fossil fuel technologies, which inhibits renewable energy development [29,30,31]. The development of the world’s electricity sector is influenced by governmental and local policy, applied technologies, investments, renewables, and consumer needs [28,32].
The share of electricity in the world’s total final consumption increased notably, from 0.1% in 1900 to 4% in 1950, and now reaching 19% in 2022 [33]. The world’s electricity production amounted to 27,783 TWh in 2021 [25]. Global electricity demand continues to grow and is projected by the International Renewable Energy Agency (IRENA) to increase from 20,020 TWh/year to 41,500 TWh/year between 2015 and 2050 [34]. The share of renewable energy in electricity production should reach 85% by 2050 [35]. If we want to reach the set goal, the pace of the transition must be increased. Therefore, investing in renewable energy sources is indispensable [36].
The share of electricity from low-carbon-dioxide-emitting sources is very low, and it is almost unchanged today compared to the mid-1980s. In 1985, fossil fuels accounted for 64% of sources, nuclear for 15%, and renewables for 21% of the world’s electricity production. The ratio of fossil fuels has not changed in more than 35 years; only the ratio of nuclear and renewables has changed in favor of the latter [37]. While the share of low-carbon energy sources in the world’s electricity production amounted to 38.1%, it was 16.3% in the world’s total energy mix in 2021 [38,39]. This is because heating and transport rely much more on fossil fuels than electricity generation. Transportation and heating are more difficult to decarbonize, but efforts should be made to electrify them with low carbon dioxide emissions. An example is the transition to electric vehicles [40]. Between 2022–2024, we expect an average 2.7% annual increase in electricity demand, while an increase in the growth of renewable energy sources is also expected at that time [41].
2.1. Electricity Production and Consumption in the European Union
The European Union has different energy sources that include solid fossil fuels, natural gas, oil and petroleum, nuclear energy, and renewable energy (such as hydro, wind, and solar energy). The energy available in the European Union comes from energy produced in the EU countries and from energy imported from other countries. The EU’s energy consumption continuously decreased after 2010, and it only started to grow again after the COVID-19 epidemic.
As a result of the decrease in fossil fuels, interest in alternative energy sources is increasing. The European Union is one of the world’s largest renewable energy producers. The utilization of renewable energy sources has had an increasing role in the EU’s climate and energy policy. Increasing the use of renewable energy sources is essential to reduce carbon emissions [42]. By using more renewables to meet its energy needs, the European Union lowers its dependence on imported fossil fuels and makes energy production more sustainable. Due to regulations of the European Union’s energy sector, traditional energy sources have become economically unattractive. Renewables, considering depreciation costs, remain as the most advantageous electricity supply option for both firms and individual customers [43].
Between 2011 and 2020, most EU countries saw a positive change in the use of renewable energy. Sweden, Finland, and Denmark showed high levels of renewable energy use. In contrast, Poland, Hungary, and Slovakia had the lowest use of renewable energy [18]. In the European Union, renewable energy sources mostly replaced nuclear energy, while in Central and Eastern Europe, renewable energy sources replaced coal [44]. For more than two decades, the EU has been a pioneer in the spread of renewable energies in the world. The EU member states increased their share of RES in the last two decades. Sweden (74.5%), Portugal (58%), and Croatia (53.8%) achieved the highest shares of energy from renewable energy sources in gross electricity consumption in 2020. These shares mostly resulted from the increase in wind and solar energy generation [42].
Thanks to the results of long-term plans and policy measures, the share of renewables in gross energy consumption reached 17.7% by 2020, compared to 9% in 2005. In the future, the EU wants to double this value and reach a share of 34% by 2030. All EU countries have some cost-effective renewable energy transition programs. These contribute to the long-term decarbonization of the EU’s energy system [45].
As a result of COVID-19, energy consumption declined in all economic sectors, which took place to the greatest extent in the transport and service sectors and to a lesser extent in industry. In addition, household energy consumption increased [46]. The restrictive measures introduced during the COVID-19 epidemic also led to a reduction in energy consumption, regardless of its source [47]. The goal of the EU countries to increase the share of renewables in the final energy consumption was facilitated by the COVID-19 pandemic, which resulted in a decrease in the use of fossil fuels [48]. During the pandemic period, electricity production fell as an effect of lower energy demand. This caused big problems with power installation and energy markets, which suffered from continuous changes [49].
Influenced by economic and environmental interests, the European Union committed itself to increasing the utilization of renewable energy sources at the end of the 1990s. The energy policy of the European Union is based on three pillars: competition, security of supply, and sustainability [50]. The Directive 2009/28/EC established an overall policy for the production and promotion of energy from renewable sources in the transport, electricity, heating, and cooling sectors. Therefore, all EU member states were obliged to develop national action plans [18]. The European Union set binding targets by 2020. Each EU member state was required to fulfil at least 20% of its total energy demand with renewable energy resources by 2020. Table 1 shows the European Union’s and Hungary’s development of the share of renewable energy in the final energy consumption and the 2020 targets [51].
Hungary fulfilled its commitments to renewable energy until 2020, but this falls short of the European Union average. The reason for this is manifold. The country is poor in hydropower. Since 2016, legislation has prohibited the installation of new wind power plants in Hungary, and it is the only country in the world to do so. The expansion in the field of solar energy started late compared to other EU member states. The European Council set even more ambitious goals by increasing commitments for 2030. The aim was to promote the EU to achieve a more competitive, secure, and sustainable energy system. In 2018, Renewable Energy Directive (RED II) was approved, which requires at least 32% of the gross final energy consumption within the European Union to be renewable by 2030 [52]. In December 2019, the Commission set out a European Green Deal for the European Union aimed at carbon neutrality by 2050. The EU aimed to become the world’s first climate neutral continent by supplying clean, affordable, and secure energy. In July 2021, the European Commission proposed to increase the binding renewable energy target in the EU energy mix to 40% by 2030. Moreover, the use of renewable fuels such as hydrogen in industry and transport is being promoted [53].
The Russian-Ukrainian war that broke out in 2022 created a new energy situation. The European Commission published the REPowerEU plan to reduce the EU’s dependence on Russian gas and oil before 2030. Part of the plan is to raise the energy efficiency target from 9% to 14% by 2030 and to increase the share of renewable energy sources in the EU’s energy structure. The REPowerEU plan also supports the European Commission’s request to increase the directive to 45% by 2030. In addition, the REPowerEU plan would increase total renewable energy capacity to 1236 GW by 2030, compared to the “Towards 55%!” with 1067 GW planned for 2030 [54].
EU’s electricity consumption decreased from 2979.66 TWh to 2781.33 TWh between 2010 and 2020, while total energy consumption decreased from 18,675.88 TWh to 16,039.48 TWh [55,56]. During the examined 10-year period, the EU’s electricity consumption decreased by 6.7%, while its total energy consumption decreased by 14.1%. The share of electricity consumption in total energy consumption increased from 15.95% (2010) to 17.34% (2020) [57,58]. As can be seen from Table 2, the share of renewable energies has increased significantly, and that of coal has radically decreased, which is favorable from the point of view of the green transition and contributes to the achievement of climate goals. In the case of gas and oil, this favorable change in terms of proportions has not been observed. This is primarily due to their field of usage. Gas is needed for the chemical industry, for heating, or for fast-starting electric power plants. Oil is an important source of energy for transport and the chemical industry.
The share of fossil fuels in electricity generation indicates that the electricity mix is the main factor decelerating the deployment of renewable energy sources. A higher proportion of gas and nuclear energy can reduce the deployment of renewable energy sources more than a coal-based energy systems. Generating electricity from nuclear power is cheap and does not involve GHG emissions. The operation of gas power plants will continue for a long time due to their low operating costs and precise controllability [59].
The share of renewable electricity production has increased to varying degrees in the EU member states in the past decade because of the decarbonization policy of the European Union [60]. Non-renewable energy resources still play an important role in some Central and Eastern European countries, such as Poland, Slovakia, the Czech Republic, Bulgaria, and Hungary. However, these EU member states are also transitioning to green energy [61].
At the same time, there are some support mechanisms to produce electricity from renewable energy sources in the EU. Some of them are investment subsidies, fixed price mechanisms in the form of feed-in schemes or feed-in premiums, and quota systems based on auctions or tradable green certificates [62].
In the European Union’s gross electricity production, wind and solar energy showed spectacular growth among renewable energies between 2010 and 2020. The share of wind energy within renewables increased from 20.5% to 36.6%, which, in terms of value, represented an increase of 184% during the examined period. In the case of solar heat and solar panels, there was an extreme increase. The share of solar heat increased from 0.1% to 0.5%, while the solar cell increased from 3.3% to 12.8% within renewable energies between 2010 and 2020. In addition to market instruments, government policy has also been decisive in terms of the expansion of wind and solar energy production [63]. The share of hydropower decreased significantly (from 58.9% to 34.5%) during the decade. The consumption of geothermal energy shows slow growth, but its share was below 1% throughout the decade. This is mainly because the consumption of geothermal energy for electricity production has not been widespread; it is mostly used in the form of direct thermal energy. Although the share of bioenergy decreased (from 16.4% to 15.1%), it increased in terms of value by 47% in gross electricity production between 2010 and 2020 (Table 3).
Today, more than 50% of the EU’s electricity production is free of greenhouse gas emissions. By 2050, it is hoped that more than 80% of electricity will come from renewable energy sources [65].
2.2. The Situation of Hungarian Electricity Production and Consumption
In Hungary, the industrial electricity service was established in the 1930s. The first power plants supplied only small districts with electricity, and, later, these districts grew larger and larger thanks to the use of alternating current and transformers. This made it possible to economically transmit more significant outputs and thereby serve an ever-increasing number of consumers. Among the first power plants, the Kelenföldi Power Plant was at the forefront with its 30 kV system, and operation and electricity distribution required serious coordination even then. The first electricity law was created in 1934, and a year later, Hungary’s first electricity control center, Elektromos Művek, was established. Power plants with increasingly high performance appeared one after another, such as the Mátravidéki Erőmű in Lőrinci (not to be confused with the Mátra Power Plant). In Hungary, the eastern and western electricity systems were connected through Budapest in 1949, and the National Electricity Load Distributor was established, whose main tasks included the assessment of needs and calculating power losses due to malfunctions, the preparation of timetables, and so on. The cross-border electricity connection in the 1950s started from Hungary, first towards Czechoslovakia, and, soon, the 400 kV voltage level appeared. At this time, the Central Dispatch Office (CDU) coordinating the Eastern Bloc was established in Prague. Electricity imports from the Soviet Union were processed through this system. The direct high transmission power connection with the Soviet Union was established in 1978 between Albertirsa–Zapad (today Ukraine) via a 750 kV transmission line. Unit No. 1 of the Paks Nuclear Power Plant was connected to the Hungarian grid in 1982. After the change of regime, there was a need to establish Western–European relations. This was conditional on the Hungarian network being able to maintain frequencies, which was important from a system dynamics point of view. Hungary finally became a full member of the international electricity system in 2001.
At present, MAVIR—Hungarian Electricity Industry Regulatory Authority—coordinates the domestic work of international organizations. MAVIR cooperates with European system management and network operation and represents domestic interests in technical, economic, and legal matters. MAVIR is present in the following international organizations: ENTSO-E (the Association of European Electricity System Operators), EURELECTRIC (the Cooperation Organization of European Electricity Companies), CIGRÉ (the International Scientific Organization of High-Voltage Electricity Networks), and IEC (the International and European Standardization organization) [66,67].
In Hungary, three sources of electricity consumption can be distinguished. The most significant part of electricity is produced by domestic electricity generating plants. The other part of the electricity is produced by the consumers, preferably from renewable sources, partly for their consumption and partly for the grid. The third source of electricity consumption is imported, which comes to Hungary from the European electricity system. The change of regime had a great impact on the change in the structure of energy consumption by sector in Eastern Europe. The importance of industry and agriculture decreased, but the transport and service sectors benefited [68].
A national energy strategy was developed by the Hungarian government in 2012, which contained detailed proposals for actors and decision makers in the Hungarian energy sector until 2030 and set up a road map until 2050 into a more comprehensive and longer-term perspective [69]. However, the COVID-19 pandemic and the Russian-Ukrainian war have created a completely new situation, which requires a redesign of the strategy. Hungary has been in the middle in terms of energy imports and is one of the economically developing countries with a high demand for imported energy. Renewable energy imports started to increase after the 2008 financial crisis and showed a high rate [70]. Hungary is characterized by a high degree of diversification of the energy mix, a significant dependence on imported energy, low transformation and distribution losses, and a low average greenhouse gas intensity [71].
Hungary’s gross energy consumption was 309,270 GWh in 2010, which later decreased slightly and amounted to 304,003 GWh in 2020. It is a welcome fact that coal consumption decreased by 37.7% between 2010 and 2020, from 31,439.55 GWh to 19,573.34 GWh, which significantly contributes to Hungary’s international commitment to carbon dioxide reduction. Among the Central and Eastern European countries, Slovakia and Hungary belong to the group of countries that are moving away from coal as an energy source. Moreover, Hungary has announced that it will close its high-emission coal-fired power plants by 2030 [72].
Table 4 shows that Hungary’s gas consumption also decreased by 10.7% (from 114,154 GWh to 101,930 GWh), while oil consumption increased by 9.9% (from 79,067 GWh to 86,904 GWh) between 2010 and 2020. The share of nuclear and renewable energy sources in gross energy production did not change significantly in the period under review; nuclear energy represented 15–16% (46–47,000 GWh), while RES represented 11–12% (32–34,000 GWh) in the period under review.
Hungary’s gross electricity production was 37,371 GWh in 2010, which decreased to 34,930 GWh by 2020, which represents a 6.53% drop. Another source of electricity is imported, which increased significantly from 9897 GWh to 19,176 GWh between 2010 and 2020. One of the reasons for growing imports is that Hungary can buy electricity cheaply from neighboring states. Including imports, total electricity sources increased from 47,268 GWh to 54,106 GWh during the term. Hungarian gross electricity consumption—including network losses and self-consumption—was 42,566 GWh in 2010, which increased to 46,607 GWh by 2020, which means an increase of 9.49%. In addition to domestic electricity consumption, exports increased from 4702 GWh to 7499 GWh (Figure 1). Despite the decreasing production, the increasing electricity consumption can be explained by the significant increase in net imports. In 2010, the country’s net import of electricity compared to its gross consumption was 12.2% (5195 GWh), and by 2020 it reached 25.5% (11,677 GWh), but it was more than 30% in 2014 and 2015 [74].
It also should be noted that electricity prices steadily increased in the European Union after the financial crisis. However, in Hungary, the electricity prices decreased, and there was also a small fraction of taxes and tariffs on the price of electricity intended for private households [24].
2.3. The Hungarian Electricity Mix
Hungary will face major challenges in the coming decades to ensure its own electricity needs in a safe, economical, and environmentally friendly way. Since virtually all large installed 50 MW (megawatt)) power plants are coming to the end of their operational life, significant changes will inevitably occur in the country’s system [75]. Hungarian electricity production is based on three pillars: fossil, nuclear, and renewable energies. In 2020, coal represented 10.8%, natural gas represented 26.4%, oil and other sources represented 1.5% of fossil energy sources in Hungarian gross electricity production. In Hungary, the use of coal in the production of electrical energy decreased by more than 40% between 2010 (6234 GWh) and 2020 (3711 GWh). The share of coal consumption in total electricity production was 10.8% in 2020. One of the main reasons for this is that reducing carbon dioxide emissions is an important factor in the fight against climate change. Several international environmental and climate protection agreements include the complete elimination of coal-based energy production as soon as possible. Another main reason for the radical reduction of coal consumption is the increase in drastically increasing carbon dioxide quota prices, which is naturally included in the costs. In the future, this process will increasingly be a determining factor for economic energy production [76]. Thirdly, Hungarian coal consumption is decreasing, because the large electricity-generating generators, and in some cases, the entire power plant, are reaching the end of their planned or already extended service life. One of these is the Mátra Power Plant, which will either be shut down or completely renovated around 2025. In the former case, nearly 1000 MW of output will be missing from Hungarian electricity production. Part of this can be replaced with gas power plants and solar production, and the construction of biomass power plants using gasification or pyrolysis methods is also on the agenda [77]. Natural gas in Hungarian gross electricity production fell from 11,598 GWh to 9091 GWh between 2010 and 2020, which represents a 21.6% drop. Natural gas still accounts for 26.4% of the Hungarian electricity mix. One of the main areas of application of natural-gas-based electricity production worldwide, including in Hungary, is the supply of power plants based on renewable energy during peak periods and weather-dependent renewable energy with balancing energy. In addition, natural-gas-based electricity is produced in CHP (combined heat and power) power plants, which are power plants that produce combined heat and electricity. The main application of these power plants is residential community systems, where greater efficiency can be achieved with the combined production of heat and electricity [78]. Of course, this will change in Hungary with the shutdown of the Mátra Power Plant or, in another scenario, with the transition from lignite to natural gas. In Hungary, nuclear energy production represents a much larger proportion of electricity production than other energy production categories. With 16,055 GWh produced (in 2020), nuclear energy represents a stable 46% of the electricity mix, which is provided by the four blocks of the Paks power plant. Significant changes in nuclear-based electricity production are expected in the early 2030s when Paks I and Paks II are expected to operate simultaneously for several years [79]. Renewables are playing an increasingly important role in the production of Hungarian electricity, and, in 2020, they already accounted for 16.1% of production. In Hungary, in 2010, electricity production from renewable sources was still 3019 GWh, but in 2020, it already reached 5529 GWh, which represents an increase of 83.1% (Table 5).
In Hungary, there is no alternative to increasing renewable capacities; the question is the amount and mix of resources [81]. Among the renewable energy sources, water, wind, solar, and bioenergy are used in Hungary. The share of electricity produced from renewable energy sources increased slightly between 2006 and 2010 and then decreased in Hungary. This rate stagnated in the period between 2014 and 2016 (7.3%) and then increased significantly since 2017 [82]. Despite this, the renewable energy sector has a small share in electricity generation in Hungary [83].
Compared to other EU countries, Hungary’s electricity market is in the middle in terms of economic, environmental, and energy security, ranking 16th out of 28 countries (before Brexit) [84]. The use of electricity from water showed a 29.5% increase by 2020 compared to 2010 and amounted to 244 GWh, which represents a 4.4% share of the total. In Hungary, the potential of using hydropower is limited, and its great advantage is that it can produce electricity cleanly, without harmful emissions, and the electricity produced is relatively cheap. The electricity produced by wind accounted for 11.9% in 2020, which means 655 GWh in terms of value. This represents a 22.7% increase compared to the situation in 2010, as Hungary has had a ban on expanding capacity since 2016 [85]. Among renewable energy sources, a significant increase can be seen in the case of solar panels. Hungary stands out in terms of the power generated from solar energy [61]. While in 2010, the electricity produced by solar panels was hardly detectable (less than 1%), by 2020, their share approached 45% of the gross electricity production based on renewable energies. The energy produced by the solar panels thus amounted to 2459 GWh. One of the main reasons for the spectacular growth was that, since 2015, in addition to small-household-sized solar power plants, medium- and large-scale solar power plants appeared, which were not for self-consumption, but for grid generation. In the case of bioenergy, there was no change in quantity, but only in terms of its share. In 2020, the electricity produced from bioenergy amounted to 2159.9 GWh, but its share fell from 76.1% to 39.1%, which can be attributed to the breakthrough in the usage of solar panels (Table 6).
Unfortunately, the intensive growth of solar electricity production was not followed by the growth of wind energy production, even though it would have been possible to involve new production units. In addition to 330 megawatts of wind power capacity in Hungary, there is a realistic 500 megawatts of potential that does not yet destroy the environment in terms of landscape [87].
3. Materials and Methods
The data used for the analysis come from the international databases of the European Commission Eurostat, the International Renewable Energy Agency (IRENA), as well as the databases of the Hungarian Central Statistical Office, the Hungarian Energy and Utilities Regulatory Office, the Hungarian Electricity Control System, and MAVIR. The data series were processed from 2010 to 2021 [88,89,90,91]. The reason for the different starting or ending time of the time interval of each table is that the goal for each test was to have uniform data covering all products. The main aspect was the same source and interval of the data. The processing of the data and the analysis of the correlations of the variables, the visual display of the time series, and the results of the linear regression were prepared using the statistical program packages Minitab 20.2 and SPSS 25.0.
The degree of security of a country’s electricity supply depends significantly on imports and on the composition of domestic production. In Hungary, the lack of multi-stage electricity production threatens the security of supply. Hungary also trades electricity with several neighboring countries. The incoming and outgoing electricity varies in time and volume. Cross-border electricity imports–exports can be understood as the producer–consumer unit of a neighboring country, whose production–consumption varies over time.
The production data of the sources are gross indicators aggregated according to their nature at the level of the European Union. Thanks to the common electricity system, sources were distinguished only by accounting for costs.
The electricity reaching the consumer or the national border consists of three main components: net power plant production, self-consumption, and network loss (including power theft).
In Hungary, power plant self-consumption accounts for 5–6%, and network losses account for 8–9%; this means that 85–87% of net electricity production goes to consumers.
In this article, we examined the concentration of Hungarian electricity production, which included, on the one hand, power plants with an installed capacity of over 50 MW and, on the other hand, the composition of primary energy carriers. Then, we carried out a correlation study of the Hungarian gross electricity production by looking for the answer to how the individual energy carriers correlated with each other in pairs during the period between 2010 and 2020. The subjects of the investigation were energy sources (coal, natural gas, nuclear, bioenergy, solar, wind, water) and the net electricity import. Finally, the exposure of Hungarian electricity was evaluated, and the development of annual system load peaks was presented [92].
Regarding the methods, the Herfindahl–Hirschman Index (HHI) was used to measure market concentration. The HII is one of the indicators that is particularly sensitive to the fact that one of the actors in the market (producer, consumer, intermediary) has a predominance compared to the others. The study was based on the assumption that producer–consumer units (imports–exports, power plant production, and power plant types) can be considered market players in the same way as individual companies on the market [93]. The HHI is calculated by squaring the shares of companies (Tn) competing in a given market and then adding the resulting numbers. Tn is the share of the nth product from the total, n = 1 … i.
The formula of HHI is as follows:
The value of HHI is between 1/n and 1. The value 1/n is taken by the index if the participants have an equal market share. If there are many producers with low output, the HHI tends to be zero. If production is concentrated among one participant (monopoly), the HHI value is one.
We used a time series analysis to present the composition of incoming and outgoing electricity. During the development of the gross electricity peak, the time series analysis also included the regression analysis of electricity consumption. Correlation analysis was used to examine the magnitude and direction of the pairwise linear association between the individual energy carriers for the period between 2010 and 2020. In the correlation analysis, we estimated the correlation coefficient of two samples using Pearson’s correlation coefficient. The r is the correlation value between the two investigated variables. The n = 12 value is the number of years taken into account (2010–2021). The correlation coefficient “r” of the samples ranges from −1 to 1. The “r” value quantifies the direction and strength of the linear association between samples.
To calculate the significance, we used the t-distribution statistic. The formula is:
Using the statistical table of the result of the equation and the distribution of the t-distributed variable, we can determine whether our result is significant and, if so, to what extent.
If the correlation between two variables is positive, increasing values of one variable will be associated with increasing values of the other variable. In the other case, when the correlation between the two variables is negative, increasing values of one variable will be associated with decreasing values of the other variable. The sign of the correlation coefficient indicates the direction of the association. The magnitude of the correlation coefficient indicates the strength of the association. A correlation close to zero indicates that there is no linear relationship between two continuous variables [94].
A linear regression method was used to determine the evolution of load peaks over time. During linear regression, we examined the effect of one or more independent variables on a dependent variable. During the method, we searched for the best-fitting straight line for the plotted data. That is, we determined the equation of a straight line to which the measurement points were located at the smallest distance.
4. Results
In the Hungarian electricity system, three power plant categories can be distinguished based on the performance capacity of the power plants:
- -
- large power plants with an installed capacity of over 50 MW;
- -
- small power plants with an installed capacity of less than 50 MW;
- -
- household-sized small power plants whose output does not exceed 50 kW.
The Hungarian electricity system (VER) is centralized, and most of the electricity produced is produced in large, public power plants. Large power plants (with an installed capacity of over 50 MW) provide approximately 70% of the installed capacity of the VER and more than 80% of the annual electricity production. However, the importance of small power plants (with an installed capacity of less than 50 MW) cannot be neglected, because they play an important role in the production of heat produced in conjunction with electricity, in covering industrial energy needs, in renewable-based production, and in the system-level reserves market [95,96].
4.1. Concentration of Hungarian Electricity Production
In Hungary, 16 power plants have an installed electricity generation capacity of over 50 MW, and their total output is 6106 MW. (Table 7) The installed electricity capacity of 1–50 MW is provided by 24 power plants; their total output is 447 MW.
The five largest power plants account for three-quarters of Hungary’s installed electricity capacity. This includes the Paks Nuclear Power Plant, the Mátra Power Plant, the Dunamenti Power Plant, the Gönyűi Power Plant, and the Csepel Power Plant; their total output is 4528 MW. The concentration of Hungarian electricity production in power plants above 50 MW is low (HHI = 16.7%).
The concentration of Hungarian electricity production has increased further due to the outage of the units of the Mátrai Power Plant, which have recently been struggling with major malfunctions, which means that the HHI value rises to ~17% in the case of a 50% shutdown and to ~19.5% in the case of a complete shutdown.
In Hungary, nuclear energy accounts for 44% of gross electricity production and is worth 15,990 GWh (2021). Between 2010 and 2021, the rate of coal consumption decreased significantly (by 54%), and its share in gross electricity production fell from 18% to 8%. There was a 10% decrease in the use of natural gas, and its share fell from 30% to 27%. Electricity produced by renewable energies increased by 155% during the examined period, and their share increased from 8% to 19%. This is mainly because solar energy produced a 27-fold increase between 2015 and 2021, which alone represented an 11% share of gross electricity production in 2021 (Table 8).
According to primary energy carriers (HHI), the concentration of electricity production increased from 30.7% in 2010 to 35.1% in 2014. The reason for the increase in concentration was the increase in the share of nuclear energy and biomass, and the decrease in the use of natural gas. After 2015, the value of the HH index decreased continuously and reached 29.1 by 2021. The main reason for this can be attributed to the increasing use of renewable energies.
4.2. Examination of the Correlation of Hungary’s Gross Electricity Production Based on Energy Sources
Table 9 was the basis of the correlation analysis of Hungarian gross electricity production, where we can see the development of each energy source and net import in gross electricity production between 2010 and 2021.
We determined the magnitude and direction of the pairwise linear association between energy carriers based on a correlation matrix. The SPSS 25.0 program calculated the Pearson correlation values between the time series of the primary energy carriers, and the results are displayed in Table 10. The matrix cells contain the regression and significance values of the variables taken in pairs. For the regression value, one or two stars indicate that the regression value is within the two-tailed significance level of 0.05 and 0.01. The results only contain values below the main diagonal, since the matrix is symmetric about the main diagonal.
Table 10 shows that there were significantly correlated pairs in the columns for coal and natural gas. We can also look at it from the opposite direction, i.e., the nuclear, solar, water, and net import lines contained significantly correlated pairs. For the sake of decarbonization and uniformity, it is worth approaching the closeness and linear correlation test from the side of fossils.
4.2.1. The Carbon–Solar Correlation
The coal-solar cell correlation shows a very high negative value (−0.918), which can also be seen on the graph of the time series of the two. Figure 2 shows that decreasing carbon values are accompanied by increasing solar values. This also follows from the r-value. The negative sign refers to the opposite displacement of the variables, while the proximity to absolute 1 indicates the closeness between the two.
4.2.2. The Carbon–Nuclear Correlation
The coal and nuclear energy matrix values showed a correlation with each other. However, this is only because the production of electricity from nuclear energy is almost constant. Compared to this, the production of electricity from coal is decreasing. In reality, there is no connection between them (Figure 3).
In Hungary, nuclear energy is provided by four units with a capacity of 500 MW each; these cannot be regulated, and their operating performance per block is 100%. In nuclear-based electricity production, the change was caused by breakdowns and maintenance shutdowns [100].
4.2.3. Natural Gas and Net Import Correlation
The correlation matrix between natural gas and net imports showed a middle-strong negative relationship (−0.754). It can also be seen in the time series of Figure 4 that this was not as strong as between coal and solar cells. In terms of monotony, it was not as uniform as the coal–solar time series graph.
Water was also moderately negatively correlated with natural gas (−0.679). In this case, in examining the carbon–nuclear connection, we do not assume a real connection. Figure 5 shows, on the one hand, the low level of electricity production from hydropower. On the other hand, the water yield in Hungary is very dependent on the weather, and, therefore, the yield is hectic. Electricity production from hydropower can only be regulated within a narrow, specific framework [101].
4.3. Electricity Exposure in Hungary
Hungary imports electricity from all neighboring countries except Slovenia. As can be seen from Table 11, Hungarian electricity imports increased by nearly 30% (4512 GWh) between 2011 and 2020 and reached 19,176 GWh by 2020. Most electricity was imported from Slovakia, totaling 9254 GWh (2020), which was 48% of total imports. The second most important import partner was Austria, from which electricity imports increased significantly (by 292%) and reached 6386 GWh by 2020. At the same time, there was a significant decrease in electricity imports from Ukraine (34%), but the Ukrainian import of 2484 GWh can still be considered significant. Hungary’s imports of electricity from Croatia, Romania, and Serbia were not significant.
The concentration of Hungarian electricity imports by country showed no significant changes. The HH index decreased from 39% to 36% during the examined period.
Hungary—except for Slovenia—exports electricity to all neighboring countries. Table 12 shows that the Hungarian electricity export decreased by 7% (522 GWh) between 2011 and 2020, while it showed hectic movements. Hungary exported the most electricity (3204 GWh) to Croatia in 2020, which was only 52% of the 2010 value. The second most important target market is Romania, where Hungarian electricity exports increased significantly between 2011 and 2020 (from 340 GWh to 2185 GWh). Hungarian electricity exports to Serbia (959 GWh) and Ukraine (992 GWh) can also be considered significant, while the value of exports to Austria (102 GWh) and Slovakia (97 GWh) is of marginal importance (2020).
The concentration of Hungarian electricity exports by country decreased significantly between 2011 and 2020, and the index value of the HH index changed from 61% to 30%. The difference between electricity imports and exports is the net electricity import. Net imports and produced electricity accounted for the amount of electricity used domestically. Electricity exposure means the ratio of the difference between imported and exported electricity and the electricity used.
Figure 6 shows, Hungary’s net electricity import increased from 6643 TWh to 12,754 TWh between 2011 and 2020, which represents an increase of 92%. Such a significant change in the balance can be attributed to a 36% (5303 GWh) increase in electricity imports and a 10% (808 GWh) decrease in electricity exports. During the examined period, Hungarian electricity production did not show any significant changes and rose by a minimum of 0.3% (101 GWh) from 36,019 GWh (2011) to 36,120 GWh (2020). Based on these, Hungarian electricity exposure increased from 15.6% (2011) to 26.1% by 2021.
4.4. Evolution of Annual System Load Peaks
Based on the data of the Magyar Electricity Industry Átviteli System Control Zrt., the gross yearly peak system loads are shown in Table 13 for the period between 2011 and 2021.
The linear regression equation for summer peaks is as follows:
y = 41.6x + 6106.5; R-squared: 0.2886
The linear regression equation of the winter peaks—which was the same as the values projected for the whole year—only showed a difference in one year, in 2015:
where x is the year, and y is the peak system load of the given year in GW.
y = 94.691x + 6170.9; R-square: 0.8557
The peaks for the entire year between 2011 and 2021 showed an average annual increase of 1.7% [105]. To maintain the consumption–production balance during system load peaks, fast-starting, responsive power plant capacities are needed. This type of availability is costly whether there is production or not. Therefore, it is a cost-effective solution to soften the peaks by, for example, shifting peak consumption towards the valley period. In the future, smart systems will make it possible to control the consumption of schedulable consumers according to a schedule, even at the household level.
5. Discussion
In the 2010s, both European and Hungarian electricity production and consumption underwent a significant structural transformation. Hungary’s electricity consumption increased and was following European Union trends. Unfortunately, a significant proportion of the growing electricity demand came from imports, while Hungarian electricity production increased to an insignificant extent. At the end of the examined period, in 2021, Hungary’s electricity import exposure was 26.1%. However, it is a favorable fact that, between 2010 and 2020 during the reorganization of import sources, electricity imports from Austria increased, and a significant proportion came from green energy sources. Meanwhile, the electricity imports from Ukraine decreased, which, although it came from a nuclear energy source with low carbon dioxide emissions, cannot be classified as green energy. Croatian exports fell by half, while Romanian and Ukrainian exports increased during the period under review.
Based on their installed capacity, the Hungarian electricity-generating power plants have a low concentration, which is worsened by the occasional loss of power plant performance. The main reason for this is the aging power plant blocks. Increasing concentration has a negative effect on the achievement of diversification goals. The Paks II nuclear power plant, which is expected to be put into operation in 2032, will further worsen the situation, which will expand the Hungarian power plant network with 2 × 1200 MW of electricity generation capacity. The expansion of the number of small and medium-sized power plants producing renewable energy is very important in the movement towards decentralization.
The growing renewable energy production and renewable energy transits will require additional system flexibility from the Hungarian electricity network in the future. It should be taken into account that a significant proportion of renewables is weather-dependent, so their production cannot be precisely planned. In addition, it is necessary to take into account the ever-increasing electricity load peaks that occur every year, both in the winter and summer months. These consumption peaks show an average annual increase of 1.7% from 2011. A high degree of flexibility can be the answer to mitigating daily peak loads, and there are several solutions for this. An example of this includes peak shedding, i.e., a reduction of network capacity costs and the time shifting of loads, i.e., the scheduling of consumers and intraday trading. Flexibility can also be implemented at the distribution network level. All of these are integral parts of the Energy 4.0 technology, which is named after Industry 4.0.
The structural and correlation analysis points to the structural transformation of the use of primary energy carriers. The primary energy carriers were coal, gas, and nuclear from non-renewable sources, as well as the sun, wind, water and bioenergy from renewable sources. In addition to these, net imports were also included in the correlation studies. During the analysis, we used the time series data of the energy carriers from 2010–2021.
6. Conclusions
- In Hungary, electricity production from nuclear energy, biomass, biogas, waste, water, and wind did not show any significant changes in the recent period. In the case of nuclear energy, stagnation stems from technological specificity, while in the case of wind, it stems from government regulation. The use of oil and geothermal energy in electricity production was negligible. After a decrease until the middle of the 2010 decade, the use of natural gas in the electricity industry returned to the amount of 2010 by the end of the decade. A significant change could be seen in coal consumption, which fell by half during the period under review, and the use of solar energy exceeded the amount of electricity produced from coal by 2021.
- Using the correlation matrix, we determined the magnitude and direction of the pairwise linear association between the use of energy carriers. The correlation matrix showed a close correlation in the case of two pairs of energy carriers. One significantly correlated pair was coal and solar. This is because the removal of carbon is one of the most important measures to reduce greenhouse gas emissions. Among all primary energy carriers, coal has the highest GHG emissions. In Hungary, parallel to the consumption of coal, the growth of solar energy production started extraordinarily, both in the household and in the industrial sector. The relationship between the two processes is shown by the high negative correlation value (−0.918).
- The correlation between the use of natural gas and the amount of imported electricity was also high (−0.754), although it was not as high as between the use of coal and the production of solar energy. The decrease in the price of imported electricity led to an increase in the demand for imported electricity, and, at the same time, the use of natural gas for electricity production decreased. This is in line with the Hungarian government’s aspiration for Hungary to participate as widely as possible in the international electricity trade. This is what the new transmission line in Slovenia serves, as well as the green power line that will be connected to Azerbaijan via Romania and Georgia in the future.
- The peculiarity of the price formation of electricity in Hungary, especially for households, is that the state significantly intervenes in the prices. The state’s—especially Russian—energy procurement contracts are largely secret. Because of this, the impact of both COVID and the Russian-Ukrainian war on electricity consumption in Hungary is very complex and beyond the scope of this article. If a longer-term data series is available, it will only be possible to draw some conclusions in the future.
Author Contributions
Conceptualization, N.B. (Norbert Bozsik), A.S. and N.B. (Nándor Bozsik); Methodology, N.B. (Norbert Bozsik) and N.B. (Nándor Bozsik); Software, N.B. (Nándor Bozsik); Validation, N.B. (Norbert Bozsik) and N.B. (Nándor Bozsik); Formal analysis, N.B. (Norbert Bozsik) and A.S.; Investigation, N.B. (Norbert Bozsik) and N.B. (Nándor Bozsik); Resources, N.B. (Norbert Bozsik) and N.B. (Nándor Bozsik); Data curation, N.B. (Norbert Bozsik) and N.B. (Nándor Bozsik); Writing—original draft, N.B. (Norbert Bozsik) and N.B. (Nándor Bozsik); Writing—review & editing, N.B. (Norbert Bozsik) and A.S.; Visualization, A.S. and N.B. (Nándor Bozsik); Supervision, N.B. (Norbert Bozsik) and A.S.; Project administration, A.S.; Funding acquisition, A.S. All authors have read and agreed to the published version of the manuscript.
Funding
This research received no external funding.
Data Availability Statement
Not applicable.
Conflicts of Interest
The authors declare no conflict of interest.
References
- Zaharia, A.; Diaconeasa, M.C.; Brad, L.; Lădaru, G.-R.; Ioanăș, C. Factors Influencing Energy Consumption in the Context of Sustainable Development. Sustainability 2019, 11, 4147. [Google Scholar] [CrossRef]
- Waheed, R.; Sarwar, S.; Wei, C. The survey of economic growth, energy consumption and carbon emission. Energy Rep. 2019, 5, 1103–1115. [Google Scholar] [CrossRef]
- Tolmac, D.; Prulovic, S.; Lambic, M.; Radovanovic, L.; Tolmac, J. Global Trends on Production and Utilization of Biodiesel. Energy Sources Part B Econ. Plan. Policy 2013, 9, 130–139. [Google Scholar] [CrossRef]
- Csiszárik-Kocsir, Á.; Fodor, M.; Medve, A. Sponsors in the oil and gas industry investments carried out with project financing in 2014. Macrotheme Rev. A Multidiscip. J. Glob. Macro Trends 2015, 4, 42–58. [Google Scholar]
- Takács-György, K.; Domán, S.; Tamus, A.; Horská, E.; Palková, Z. What Do The Youth Know About Alternative Energy Sources—Case Study From Hungary And Slovakia1. Visegr. J. Bioeconomy Sustain. Dev. 2015, 4, 36–41. [Google Scholar] [CrossRef]
- Renewable Energy Sources: Definition, Types and Stocks. Available online: https://climate.selectra.com/en/environment/renewable-energy (accessed on 10 February 2023).
- Owusu, P.A.; Asumadu-Sarkodie, S. A review of renewable energy sources, sustainability issues and climate change mitigation. Cogent Eng. 2016, 3, 1167990. [Google Scholar] [CrossRef]
- Liang, X. Emerging power quality challenges due to integration of renewable energy sources. IEEE Trans. Ind. Appl. 2016, 53, 855–866. [Google Scholar] [CrossRef]
- Ellabban, O.; Abu-Rub, H.; Blaabjerg, F. Renewable energy resources: Current status, future prospects and their enabling technology. Renew. Sustain. Energy Rev. 2014, 39, 748–764. [Google Scholar] [CrossRef]
- Demirbas, M.F.; Balat, M.; Balat, H. Potential contribution of biomass to the sustainable energy development. Energy Convers. Manag. 2009, 50, 1746–1760. [Google Scholar] [CrossRef]
- Svazas, M.; Navickas, V.; Bilan, Y.; Vasa, L. The Features of the Shadow Economy Impact’ on Biomass Energy Sector. Energies 2022, 15, 2932. [Google Scholar] [CrossRef]
- International Energy Agency: Deploying Renewables 2011: Best and Future Policy Practice. 2009, p. 186. Available online: https://webstore.iea.org/deploying-renewables-2011-best-and-future-policy-practice (accessed on 8 February 2023).
- Doner, J. Barriers to Adoption of Renewable Energy Technology; Illinois State University, Institute for Regulatory Policy Studies: Normal, IL, USA, 2007; p. 32. [Google Scholar]
- Popp, J. The role of bioenergy in the global energy supply. Gazdálkodás Sci. J. 2013, 57, 419–435. [Google Scholar]
- REN21 Renewables 2018 Global Status Report 2018. Available online: http://www.ren21.net/wp-content/uploads/2018/06/17-8652_GSR2018_FullReport_web_-1.pdf (accessed on 11 February 2023).
- Popp, J.; Oláh, J.; Farkas Fekete, M.; Lakner, Z.; Máté, D. The Relationship between Prices of Various Metals, Oil and Scarcity. Energies 2018, 11, 2392. [Google Scholar] [CrossRef]
- Popp, J.; Kot, S.; Lakner, Z.; Oláh, J. Biofuel use: Peculiarities and implications. J. Secur. Sustain. Issues 2018, 7, 77–493. [Google Scholar] [CrossRef]
- Stec, M.; Grzebyk, M. Statistical Analysis of the Level of Development of Renewable Energy Sources in the Countries of the European Union. Energies 2022, 15, 8278. [Google Scholar] [CrossRef]
- Holechek, J.L.; Geli, H.M.E.; Sawalhah, M.N.; Valdez, R. A Global Assessment: Can Renewable Energy Replace Fossil Fuels by 2050? Sustainability 2022, 14, 4792. [Google Scholar] [CrossRef]
- Rabe, M.; Bilan, Y.; Widera, K.; Vasa, L. Application of the Linear Programming Method in the Construction of a Mathematical Model of Optimization Distributed Energy. Energies 2022, 15, 1872. [Google Scholar] [CrossRef]
- Reiche, D.; Bechberger, M. Policy differences in the promotion of renewable energies in the EU member states. Energy Policy 2004, 32, 843–849. [Google Scholar] [CrossRef]
- Øvergaard, S. Issue Paper: Definition of Primary and Secondary Energy. 2008. Available online: https://unstats.un.org/unsd/envaccounting/londongroup/meeting13/LG13_12a.pdf (accessed on 21 February 2023).
- IEA: World Energy Outlook 2022, Paris. 2022. Available online: https://www.iea.org/reports/world-energy-outlook-2022 (accessed on 8 March 2023).
- Rokicki, T.; Bórawski, P.; Gradziuk, B.; Gradziuk, P.; Mrówczyńska-Kamińska, A.; Kozak, J.; Guzal-Dec, D.J.; Wojtczuk, K. Differentiation and Changes of Household Electricity Prices in EU Countries. Energies 2021, 14, 6894. [Google Scholar] [CrossRef]
- Our World in Data. Available online: https://ourworldindata.org/grapher/electricity-prod-source-stacked (accessed on 8 March 2023).
- Mehedintu, A.; Soava, G.; Sterpu, M.; Grecu, E. Evolution and Forecasting of the Renewable Energy Consumption in the Frame of Sustainable Development: EU vs. Romania. Sustainability 2021, 13, 10327. [Google Scholar] [CrossRef]
- IEA. Renewable Electricity; IEA: Paris, France, 2022; Available online: https://www.iea.org/reports/renewable-electricity (accessed on 5 March 2023).
- Gharavi, H.; Ghafurian, R. Smart Grid: The Electric Energy System of the Future. Proc. IEEE 2011, 99, 917–921. [Google Scholar] [CrossRef]
- Papież, M.; Śmiech, S.; Frodyma, K. Determinants of renewable energy development in the EU countries. A 20-year perspective. Renew. Sustain. Energy Rev. 2018, 91, 918–934. [Google Scholar] [CrossRef]
- Marques, A.D.; Fuinhas, J.A. Drivers promoting renewable energy: A dynamic panel approach. Renew. Sustain. Energy Rev. 2011, 15, 1601–1608. [Google Scholar] [CrossRef]
- Cadoret, I.; Padovano, F. The political drivers of renewable energies policies. Energy Econ. 2016, 56, 261–269. [Google Scholar] [CrossRef]
- Viktor, P.; Kenderesi, Á.; Garai-Fodor, M. Research of the Hungarian Road Transportation Companies’ Alternative Fuel Usage. Macrotheme Rev. A Multidiscip. J. Glob. Macro Trends 2020, 9, 109–116. [Google Scholar]
- Pinto, R.; Henriques, S.T.; Brockway, P.E.; Heun, M.K.; Sousa, T. The rise and stall of world electricity efficiency:1900–2017, results and insights for the renewables transition. Energy 2023, 269, 126775. [Google Scholar] [CrossRef]
- IRENA. Global Energy Transformation: A Roadmap to 2050; International Renewable Energy Agency: AbuDbabi, United Arab Emirates, 2018. [Google Scholar]
- Solaun, K.; Cerdá, E. Climate change impacts on renewable energy generation. A review of quantitative projections. Renew. Sustain. Energy Rev. 2019, 116, 109415. [Google Scholar] [CrossRef]
- Puertas, R.; Marti, L. Renewable energy production capacity and consumption in Europe. Sci. Total Environ. 2022, 853, 158592. [Google Scholar] [CrossRef] [PubMed]
- Our World in Data based on BP Statistical Review of World Energy, Ember Global Electricity Review (2022) & Ember European Electricity Review (2022). Available online: https://www.bp.com/en/global/corporate/energy-economics/statistical-review-of-world-energy.html (accessed on 11 February 2023).
- Our World in Data based on BP Statistical Review of World Energy, Ember Global Electricity Review (2022) & Ember European Electricity Review (2022). Available online: https://ourworldindata.org/grapher/elec-mix-bar?country=~OWID_WRL (accessed on 11 February 2023).
- Our World in Data Based on BP Statistical Review of World Energy (2021). Available online: https://ourworldindata.org/grapher/sub-energy-fossil-renewables-nuclear?country=~OWID_WRL (accessed on 11 February 2023).
- Ritchie, H.; Roser, M.; Rosado, P. (2020)—“Energy”. Available online: https://ourworldindata.org/energy (accessed on 20 February 2023).
- IEA. Available online: https://www.iea.org/reports/electricity-market-report-january-2022/executive-summary (accessed on 11 February 2023).
- Bórawski, P.; Wyszomierski, R.; Bełdycka-Bórawska, A.; Mickiewicz, B.; Kalinowska, B.; Dunn, J.W.; Rokicki, T. Development of Renewable Energy Sources in the European Union in the Context of Sustainable Development Policy. Energies 2022, 15, 1545. [Google Scholar] [CrossRef]
- Bórawski, P.; Bełdycka-Bórawska, A.; Holden, L. Changes in the Polish Coal Sector Economic Situation with the Background of the European Union Energy Security and Eco-Efficiency Policy. Energies 2023, 16, 726. [Google Scholar] [CrossRef]
- Rakos, M.; Szendrak, J.; Erdey, L.; Komives, P.M.; Fenyves, V. Analysis of the Economic Situation of Energy Companies in Central and Eastern Europe. Int. J. Energy Econ. Policy 2022, 12, 553–562. [Google Scholar] [CrossRef]
- Renewable Energy Prospects for the European Union, European Union and IRENA. 2018. Available online: https://www.irena.org/-/media/Files/IRENA/Agency/Publication/2018/Feb/IRENA_REmap_EU_2018.pdf (accessed on 21 February 2023).
- Rokicki, T.; Jadczak, R.; Kucharski, A.; Bórawski, P.; Bełdycka-Bórawska, A.; Szeberényi, A.; Perkowska, A. Changes in Energy Consumption and Energy Intensity in EU Countries as a Result of the COVID-19 Pandemic by Sector and Area Economy. Energies 2022, 15, 6243. [Google Scholar] [CrossRef]
- Bhuiyan, M.A.; An, J.; Mikhaylov, A.; Moiseev, N.; Danish, M.S.S. Renewable Energy Deployment and COVID-19 Measures for Sustainable Development. Sustainability 2021, 13, 4418. [Google Scholar] [CrossRef]
- Miłek, D.; Nowak, P.; Latosińska, J. The Development of Renewable Energy Sources in the European Union in the Light of the European Green Deal. Energies 2022, 15, 5576. [Google Scholar] [CrossRef]
- Bórawski, P.; Bełdycka-Bórawska, A.; Holden, L.; Rokicki, T. The Role of Renewable Energy Sources in Electricity Production in Poland and the Background of Energy Policy of the European Union at the Beginning of the COVID-19 Crisis. Energies 2022, 15, 8771. [Google Scholar] [CrossRef]
- Commission of the European Communities: Green Paper. A European Strategy for Sustainable, Competitive and Secure Energy. 2006. Available online: http://europa.eu/documents/comm/green_papers/pdf/com2006_105_en.pdf (accessed on 11 March 2023).
- Council of the European Union. Directive 2009/28/EC of 23 April 2009 on the Promotion of the Use of Energy from Renewable Sources and Amending and Subsequently Repealing Directives 2001/77/EC and 2003/30/EC; Council of the European Union: Brussels, Belgium, 2009; Available online: https://eur-lex.europa.eu/LexUriServ/LexUriServ.do?uri=OJ:L:2009:140:0016:0062:en:PDF (accessed on 12 February 2023).
- Directive 2018/2001/EU of the European Parliament and of the Council of 11 December 2018 on the Promotion of the Use of Energy from Renewable Sources. Brussels, Belgium, 2018. Available online: https://eur-lex.europa.eu/legal-content/EN/TXT/?uri=uriserv:OJ.L_.2018.328.01.0082.01.ENG&toc=OJ:L:2018:328:TOC (accessed on 8 February 2023).
- Renewable Energy|Fact Sheets on the European Union|European Parliament. Available online: https://www.europarl.europa.eu/factsheets/en/sheet/70/renewable-energy (accessed on 9 December 2022).
- European Economic and Social Committee: RePowerEU Plan. 2022. Available online: https://www.eesc.europa.eu/en/our-work/opinions-information-reports/opinions/repowereu-plan (accessed on 21 December 2022).
- Eurostat, EU-27 Complete Energy Balances, Gross Available Energy. Available online: https://ec.europa.eu/eurostat/databrowser/view/NRG_BAL_C__custom_3072384/default/table?lang=en (accessed on 23 February 2023).
- Eurostat, EU-27 Complete Energy Balances, Gross Electricity Production. Available online: https://ec.europa.eu/eurostat/databrowser/view/NRG_BAL_C__custom_3072385/default/table?lang=en (accessed on 23 February 2023).
- GEP. Available online: https://ec.europa.eu/eurostat/statistics-explained/index.php?title=Glossary:Gross_electricity_generation (accessed on 27 February 2023).
- GAE. Available online: https://ec.europa.eu/eurostat/statistics-explained/index.php?title=Calculation_methodologies_for_the_share_of_renewables_in_energy_consumption&oldid=555286#Gross_available_energy (accessed on 27 February 2023).
- Lucas, J.N.V.; Francés, G.E.; González, E.S.M. Energy security and renewable energy deployment in the EU: Liaisons Dangereuses or Virtuous Circle? Renew. Sustain. Energy Rev. 2016, 62, 1032–1046. [Google Scholar] [CrossRef]
- De Rosa, M.; Gainsford, K.; Pallonetto, F.; Finn, D.P. Diversification, concentration and renewability of the energy supply in the European Union. Energy 2022, 253, 124097. [Google Scholar] [CrossRef]
- Pakulska, T. Green Energy in Central and Eastern European (CEE) Countries: New Challenges on the Path to Sustainable Development. Energies 2021, 14, 884. [Google Scholar] [CrossRef]
- Paska, J.; Surma, T.; Terlikowski, P.; Zagrajek, K. Electricity Generation from Renewable Energy Sources in Poland as a Part of Commitment to the Polish and EU Energy Policy. Energies 2020, 13, 4261. [Google Scholar] [CrossRef]
- Barnea, G.; Hagemann, C.; Wurster, S. Policy instruments matter: Support schemes for renewable energy capacity in worldwide comparison. Energy Policy 2022, 168, 113093. [Google Scholar] [CrossRef]
- Eurostat, EU-27 Complete Energy Balances, Renewable Gross Electricity Production. Available online: https://ec.europa.eu/eurostat/databrowser/view/NRG_BAL_C__custom_3068753/default/table?lang=en (accessed on 13 March 2023).
- European Commission. Communication from the Commission. A Clean Planet for All. A European Strategic Long-Term Vision for a Prosperous, Modern, Competitive and Climate Neutral Economy. Available online: https://eur-lex.europa.eu/legal-content/EN/ALL/?uri=COM%3A2018%3A773%3AFIN (accessed on 15 October 2020).
- Irinyi, D. Az Egységes Európai Villamosenergia-Rendszerről Rendszerirányítói Szemmel, Energetikai Szakkollégium. 5 May 2016. Available online: https://www.eszk.org/attachments/l293/besz/ver_beszamolo.pdf (accessed on 13 March 2023).
- Borsody, Z. A Magyar Villamosenergia Rendszer Üzemirányítása, Miskolci Egyetem. Available online: https://www.uni-miskolc.hu/~elkborzo/H%C3%A1l%C3%B3zatok-%C3%BCzemir%C3%A1ny%C3%ADt%C3%A1sa-x.pdf (accessed on 25 February 2023).
- Gostkowski, M.; Rokicki, T.; Ochnio, L.; Koszela, G.; Wojtczuk, K.; Ratajczak, M.; Szczepaniuk, H.; Bórawski, P.; Bełdycka-Bórawska, A. Clustering Analysis of Energy Consumption in the Countries of the Visegrad Group. Energies 2021, 14, 5612. [Google Scholar] [CrossRef]
- Ministry of National Development. National Energy Strategy 2030. Available online: https://2010-2014.kormany.hu/download/7/d7/70000/Hungarian%20Energy%20Strategy%202030.pdf (accessed on 15 March 2023).
- Rokicki, T.; Perkowska, A. Diversity and Changes in the Energy Balance in EU Countries. Energies 2021, 14, 1098. [Google Scholar] [CrossRef]
- Brodny, J.; Tutak, M. The comparative assessment of sustainable energy security in the visegrad countries. a 10-year perspective. J. Clean. Prod. 2021, 317, 128427. [Google Scholar] [CrossRef]
- Brodny, J.; Tutak, M. Assessing sustainable energy development in the central and eastern European countries and analysing its diversity. Sci. Total Environ. 2021, 801, 149745. [Google Scholar] [CrossRef]
- Eurostat, Hungary, Compelete Energy Balances, Gross Available Energy. Available online: https://ec.europa.eu/eurostat/databrowser/view/NRG_BAL_C__custom_3069522/default/table?lang=en (accessed on 5 March 2023).
- KSH. Available online: https://www.ksh.hu/stadat_files/ene/en/ene0008.html (accessed on 8 March 2023).
- Kiss, V.M.; Hetesi, Z.; Kiss, T. Issues and solutions relating to Hungary’s electricity system. Energy 2016, 116, 329–340. [Google Scholar] [CrossRef]
- Győri, K. Az Igazságos Energiaátmenet a Szénrégiókban—A Szénkivezetés Társadalmi Hatásai, Energiaklub 2020. Available online: https://energiaklub.hu/files/study/Az%20igazs%C3%A1gos%20energia%C3%A1tmenet%20a%20sz%C3%A9nr%C3%A9gi%C3%B3kban_Energiaklub.pdf (accessed on 1 March 2023).
- Lipták, R.; Hadházi, T. A Villamosenergia-Felhasználás Változása. Multidiszcip. Tudományok 2021, 11, 167–174. [Google Scholar] [CrossRef]
- Jin, T. The effectiveness of combined heat and power (CHP) plant for carbon mitigation: Evidence from 47 countries using CHP plants. Sustain. Energy Technol. Assess. 2022, 50, 101809. [Google Scholar] [CrossRef]
- Kovács, G. A Kormány Szerint az Atomenergia a Nyerő, Csak Paks II Árát Hagyták ki, az Egyenletből, HVG. 22 January 2020. Available online: https://hvg.hu/gazdasag/20200122_energiastrategia_klima_paks_atomenergia (accessed on 17 February 2023).
- Eurostat, Hungary, Compelete Energy Balances, Gross Electricity Production. Available online: https://ec.europa.eu/eurostat/databrowser/view/NRG_BAL_C__custom_3069534/default/table?lang=en (accessed on 18 February 2023).
- Munkácsy, B.; Kádár, P. Seeking the sustainable power mix for Central Europe. In Proceedings of the 2016 IEEE 14th International Symposium on Intelligent Systems and Informatics (SISY), Subotica, Serbia, 29–31 August 2016; pp. 257–262. [Google Scholar] [CrossRef]
- Szeberényi, A.; Rokicki, T.; Papp-Váry, Á. Examining the Relationship between Renewable Energy and Environmental Awareness. Energies 2022, 15, 7082. [Google Scholar] [CrossRef]
- Sulich, A.; Sołoducho-Pelc, L. Renewable Energy Producers’ Strategies in the Visegrád Group Countries. Energies 2021, 14, 3048. [Google Scholar] [CrossRef]
- Siksnelyte, I.; Zavadskas, E.K. Achievements of the European Union Countries in Seeking a Sustainable Electricity Sector. Energies 2019, 12, 2254. [Google Scholar] [CrossRef]
- Major, A. A Világon Példátlan Szabályokkal Lehetetleníti el a Szélenergiát Magyarország, Portfólió. 2020. Available online: https://www.portfolio.hu/gazdasag/20210423/a-vilagon-peldatlan-szabalyokkal-lehetetleniti-el-a-szelenergiat-magyarorszag-479054 (accessed on 22 February 2023).
- Eurostat, Hungary, Compelete Energy Balances, Renewable Gross Electricity Production. Available online: https://ec.europa.eu/eurostat/databrowser/view/NRG_BAL_C__custom_3070543/default/table?lang=en (accessed on 18 March 2023).
- Szabó, Y.; Kaderják, P. Ezt a Telet Csak a Megtakarítások Menthetik Meg, HVG. 4 September 2022. Available online: https://hvg.hu/360/20220904_Kaderjak_Peter_energiafuggoseg_interju (accessed on 19 March 2023).
- Eurostat. Európai Unió Statisztikai Hivatal. Available online: https://ec.europa.eu/eurostat (accessed on 11 February 2023).
- KSH. Központi Statisztikai Hivatal. Available online: www.ksh.hu (accessed on 11 February 2023).
- MEKH. Magyar Energetikai-és Közmű-Szabályozási Hivatal. Available online: www.mekh.hu (accessed on 11 February 2023).
- MAVIR. Magyar Villamosirányító Rendszer. Available online: www.mavir.hu (accessed on 12 February 2023).
- MVM. Next Energiakereskedelmi Zrt., Fogalomtár. Available online: https://mvmenergiakereskedo.hu/oldalak/699 (accessed on 12 February 2023).
- Huzsvai, L. Statisztika, Seneca Books. 2012. Available online: http://seneca-books.hu/doc/978_963_08_5016_2.pdf (accessed on 22 February 2023).
- Taylor, R. Interpretation of the Correlation Coefficient: A Basic Review. J. Diagn. Med. Sonogr. 1990, 6, 35–39. [Google Scholar] [CrossRef]
- Kulcsár, B. The territorial location of the non-subject to authorisation, renewable energy recovery small power plants in Hungary. Műszaki Tudomány Észak—Kelet Magy. Régióban 2018, 1–8, 132–139. [Google Scholar]
- Győrfi, L.K.; Hugyyecz, A. Kiserőművi Helyzetkép Magyarországon, Packs II. Zrt., Elemző Percek, 24. Rész. 30 April 2020. Available online: https://paks2.hu/web/guest/elemzo-percek (accessed on 4 March 2023).
- Magyarországi Erőművek Listája. Available online: https://hu.wikipedia.org/wiki/Magyarorsz%C3%A1gi_er%C5%91m%C5%B1vek_list%C3%A1ja (accessed on 17 February 2023).
- KSH. Available online: https://www.ksh.hu/stadat_files/ene/hu/ene0009.html (accessed on 11 February 2023).
- Eurostat. Available online: https://ec.europa.eu/eurostat/databrowser/view/NRG_BAL_PEH__custom_4409470/default/table?lang=en (accessed on 12 February 2023).
- Országos Atomenergia Hivatal. Available online: http://www.haea.gov.hu/web/v3/oahportal.nsf/web?openagent (accessed on 16 February 2023).
- Országos Vízügyi Főigazgatóság. Available online: http://www.ovf.hu/ (accessed on 16 February 2023).
- Eurostat, Online Data Code: NRG_TI_EH. Available online: https://ec.europa.eu/eurostat/databrowser/view/NRG_TI_EH__custom_4356769/default/table?lang=en (accessed on 13 February 2023).
- Eurostat, Online Data Code: NRG_TE_EH. Available online: https://ec.europa.eu/eurostat/databrowser/view/NRG_TE_EH__custom_4358134/default/table?lang=en (accessed on 13 February 2023).
- Eurostat, Online Data Code: NRG_BAL_S. Available online: https://ec.europa.eu/eurostat/databrowser/view/NRG_BAL_S__custom_4345107/default/table (accessed on 13 February 2023).
- MAVIR, Monthly and Winter/Summer Peak Data 2001–2023. Available online: https://www.mavir.hu/web/mavir-en/monthly-and-winter-summer-peak-load-data (accessed on 23 February 2023).
Figure 1.
Electricity balance of Hungary.

Figure 2.
Time series of coal and solar panels 2010–2021, GWh.

Figure 3.
Time series of coal and nuclear production 2010–2021, GWh.

Figure 4.
Time series of natural gas and net imports 2010–2021, GWh.

Figure 5.
Time series of natural gas and water 2010–2021, GWh.

Figure 6.
Hungary’s electricity import, export, and production, 2011–2021, Source: [104].
Figure 6.
Hungary’s electricity import, export, and production, 2011–2021, Source: [104].


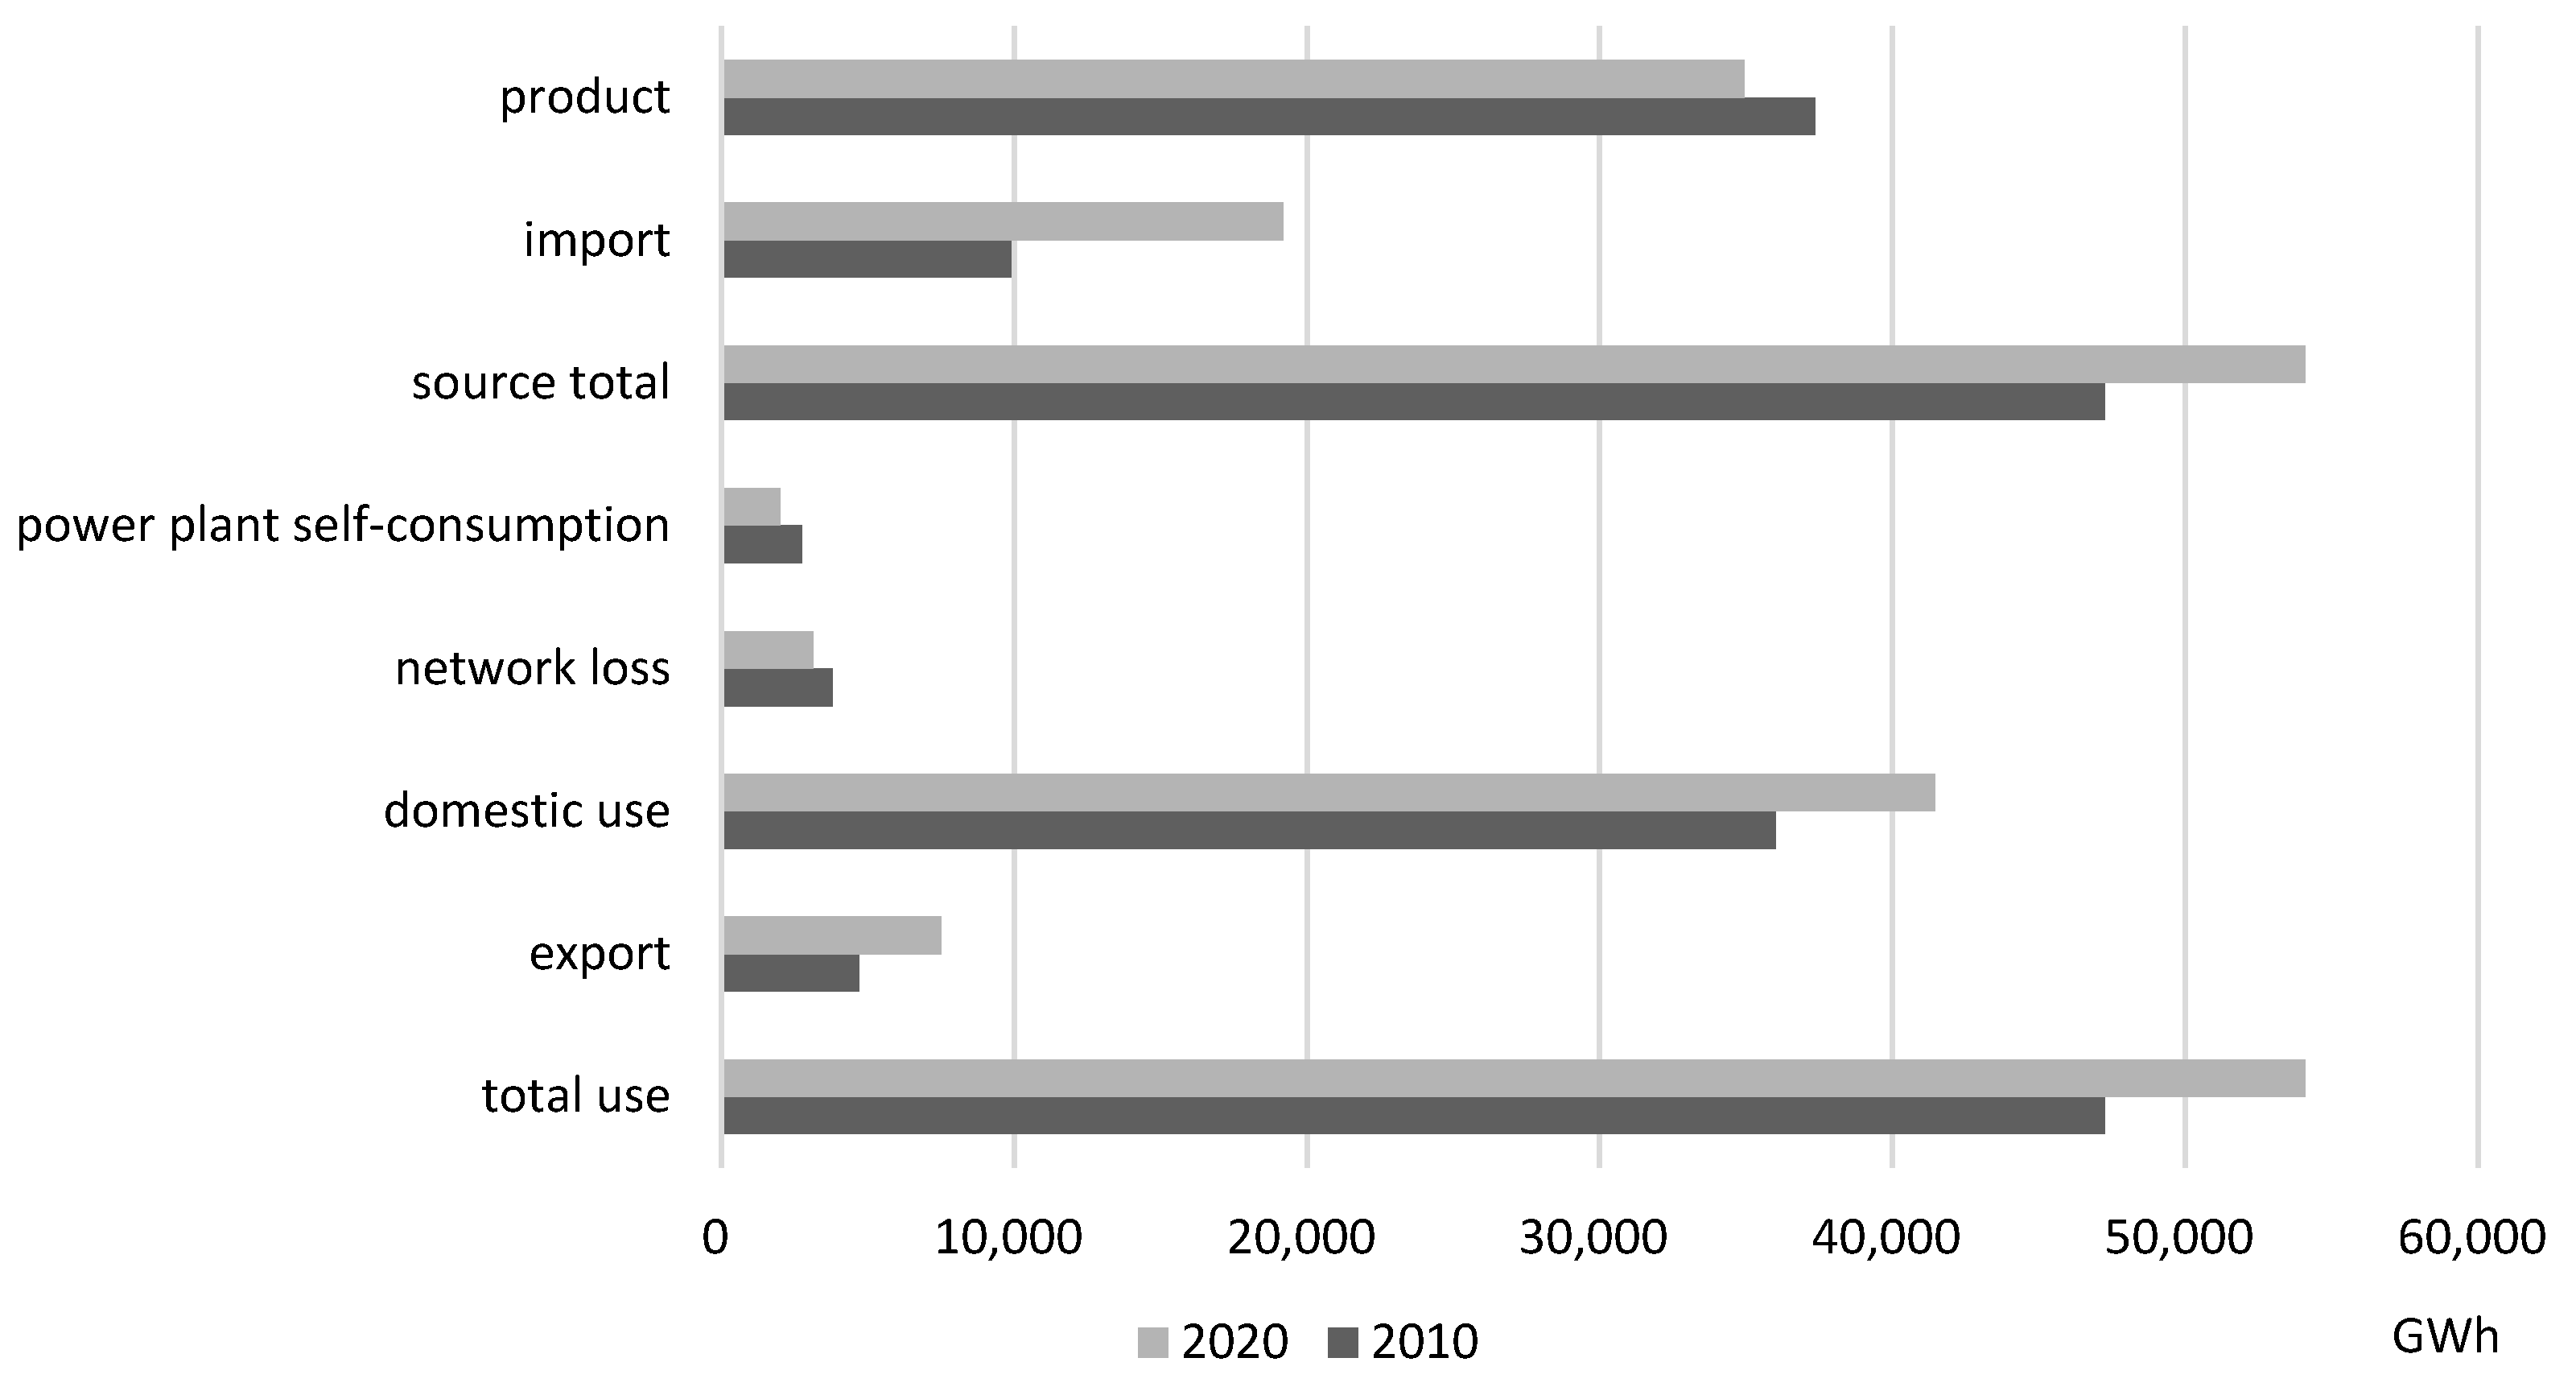
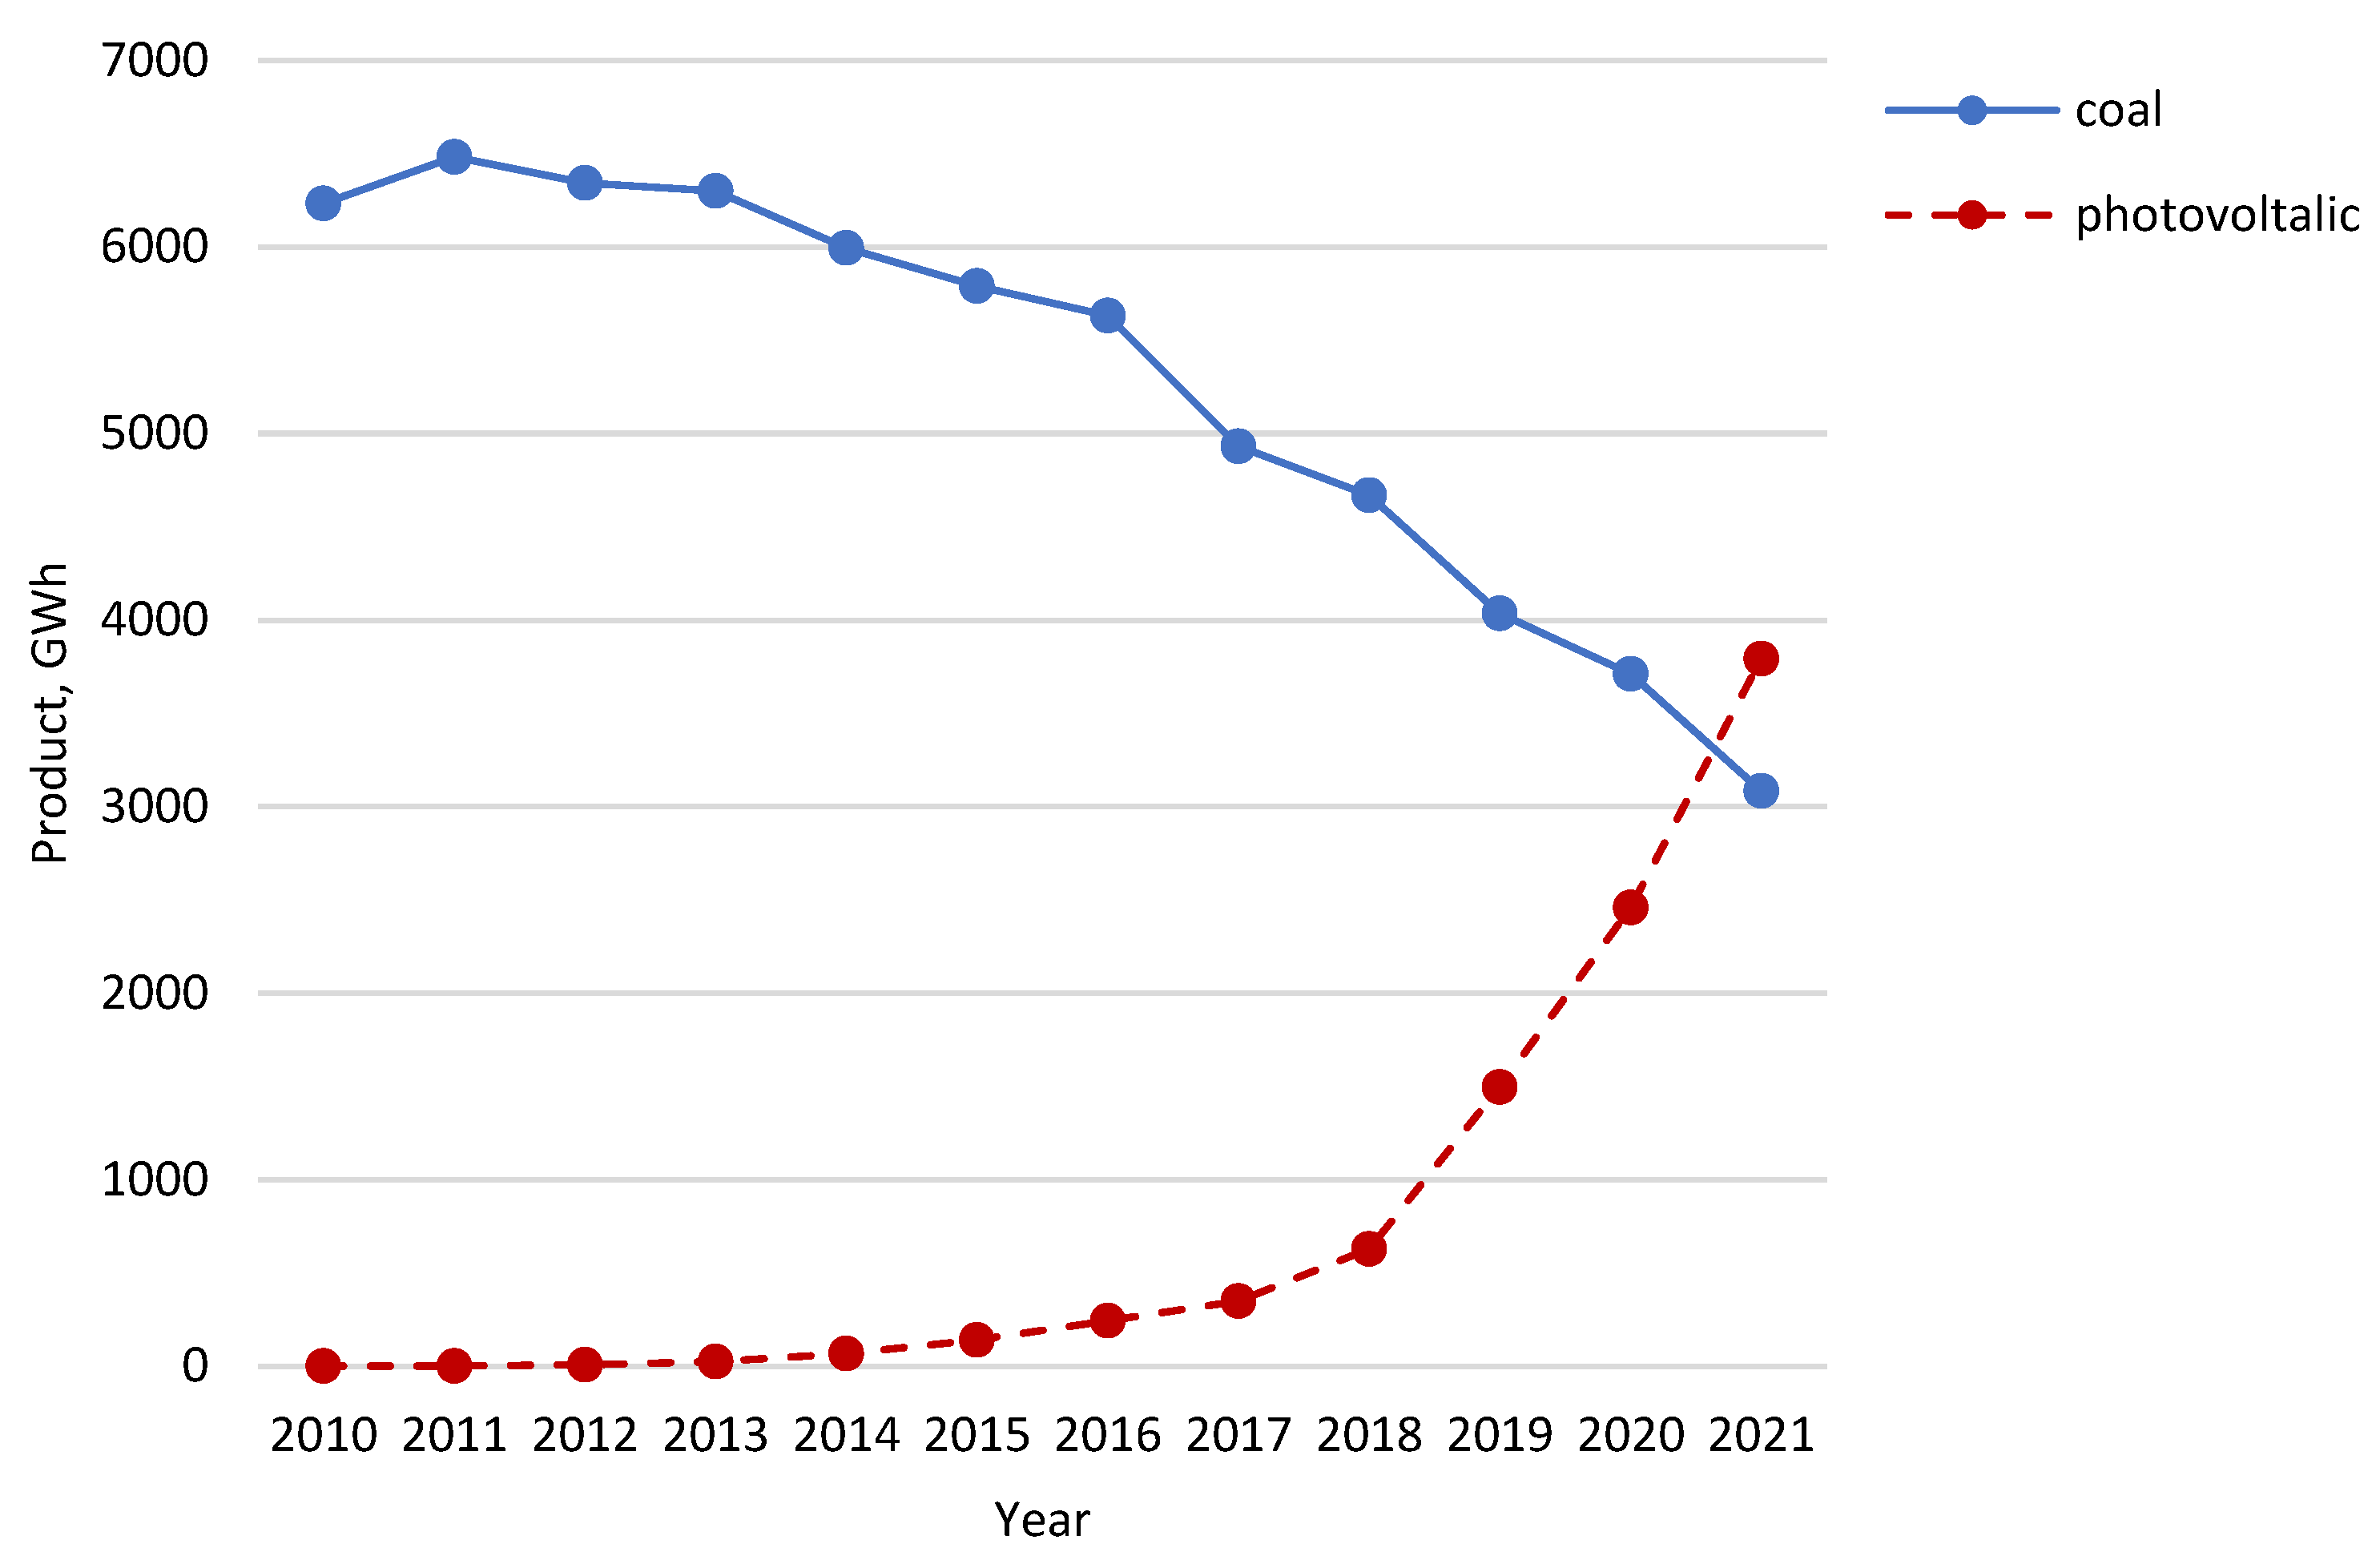
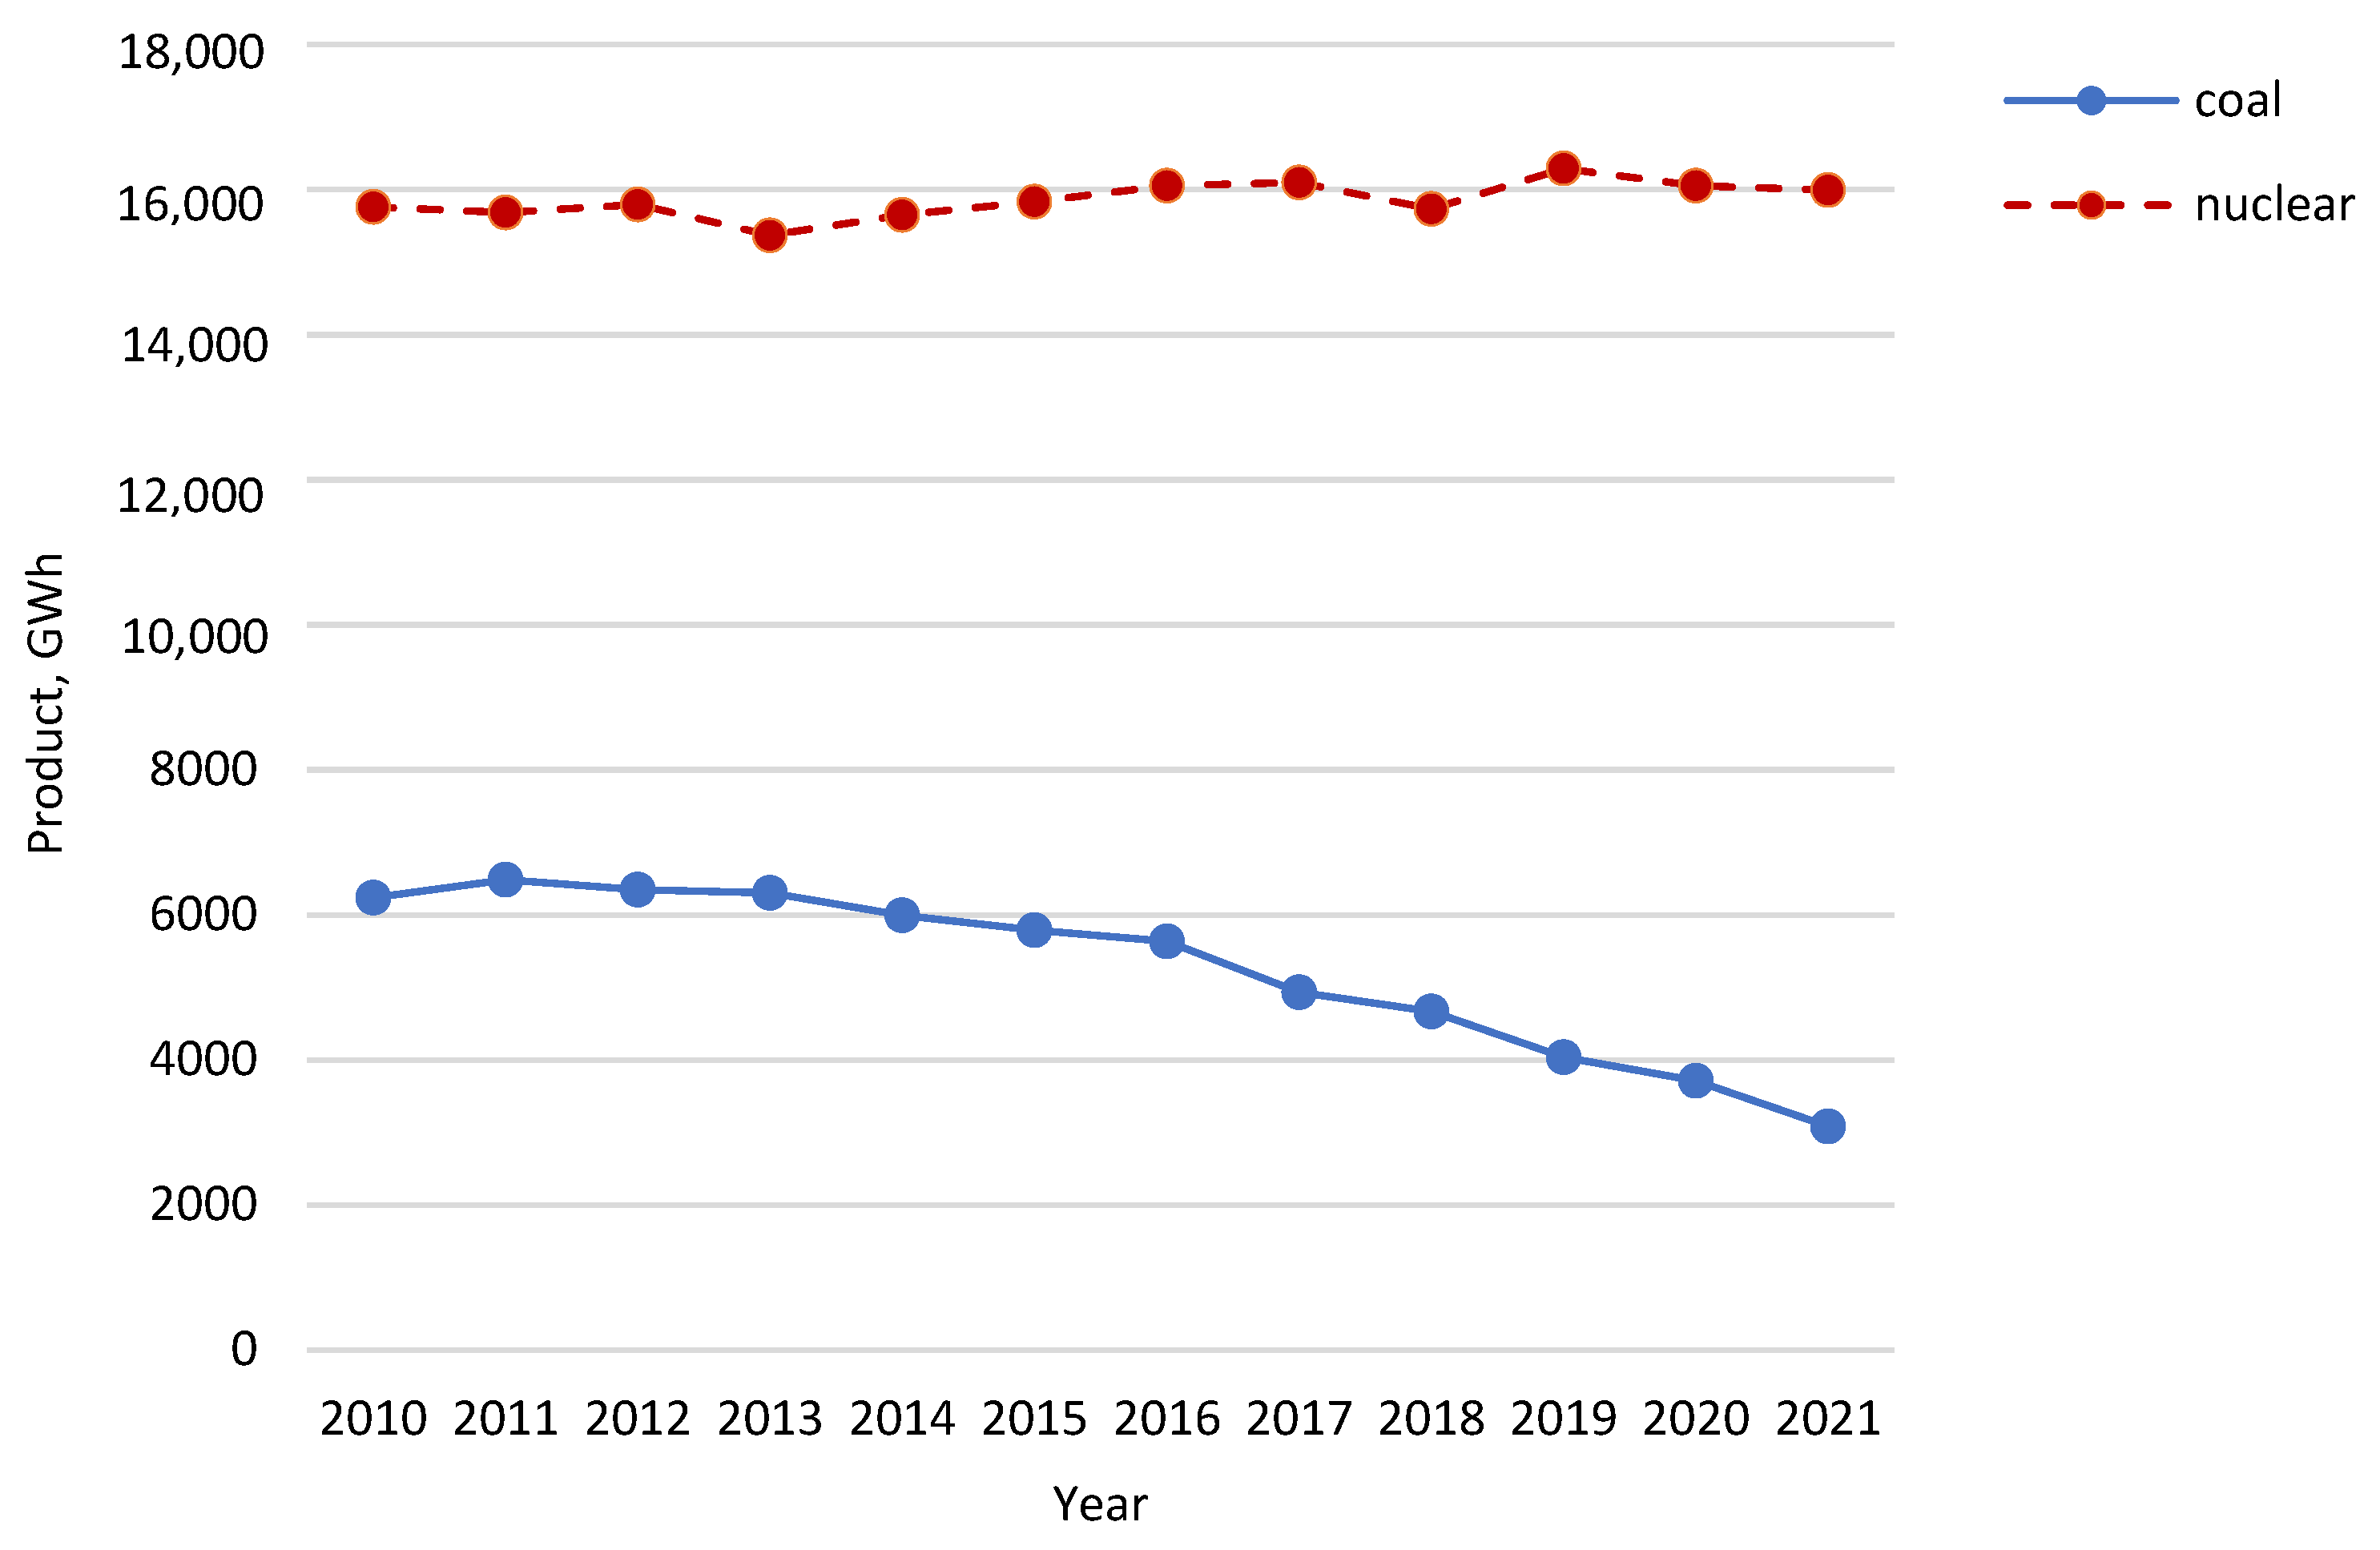
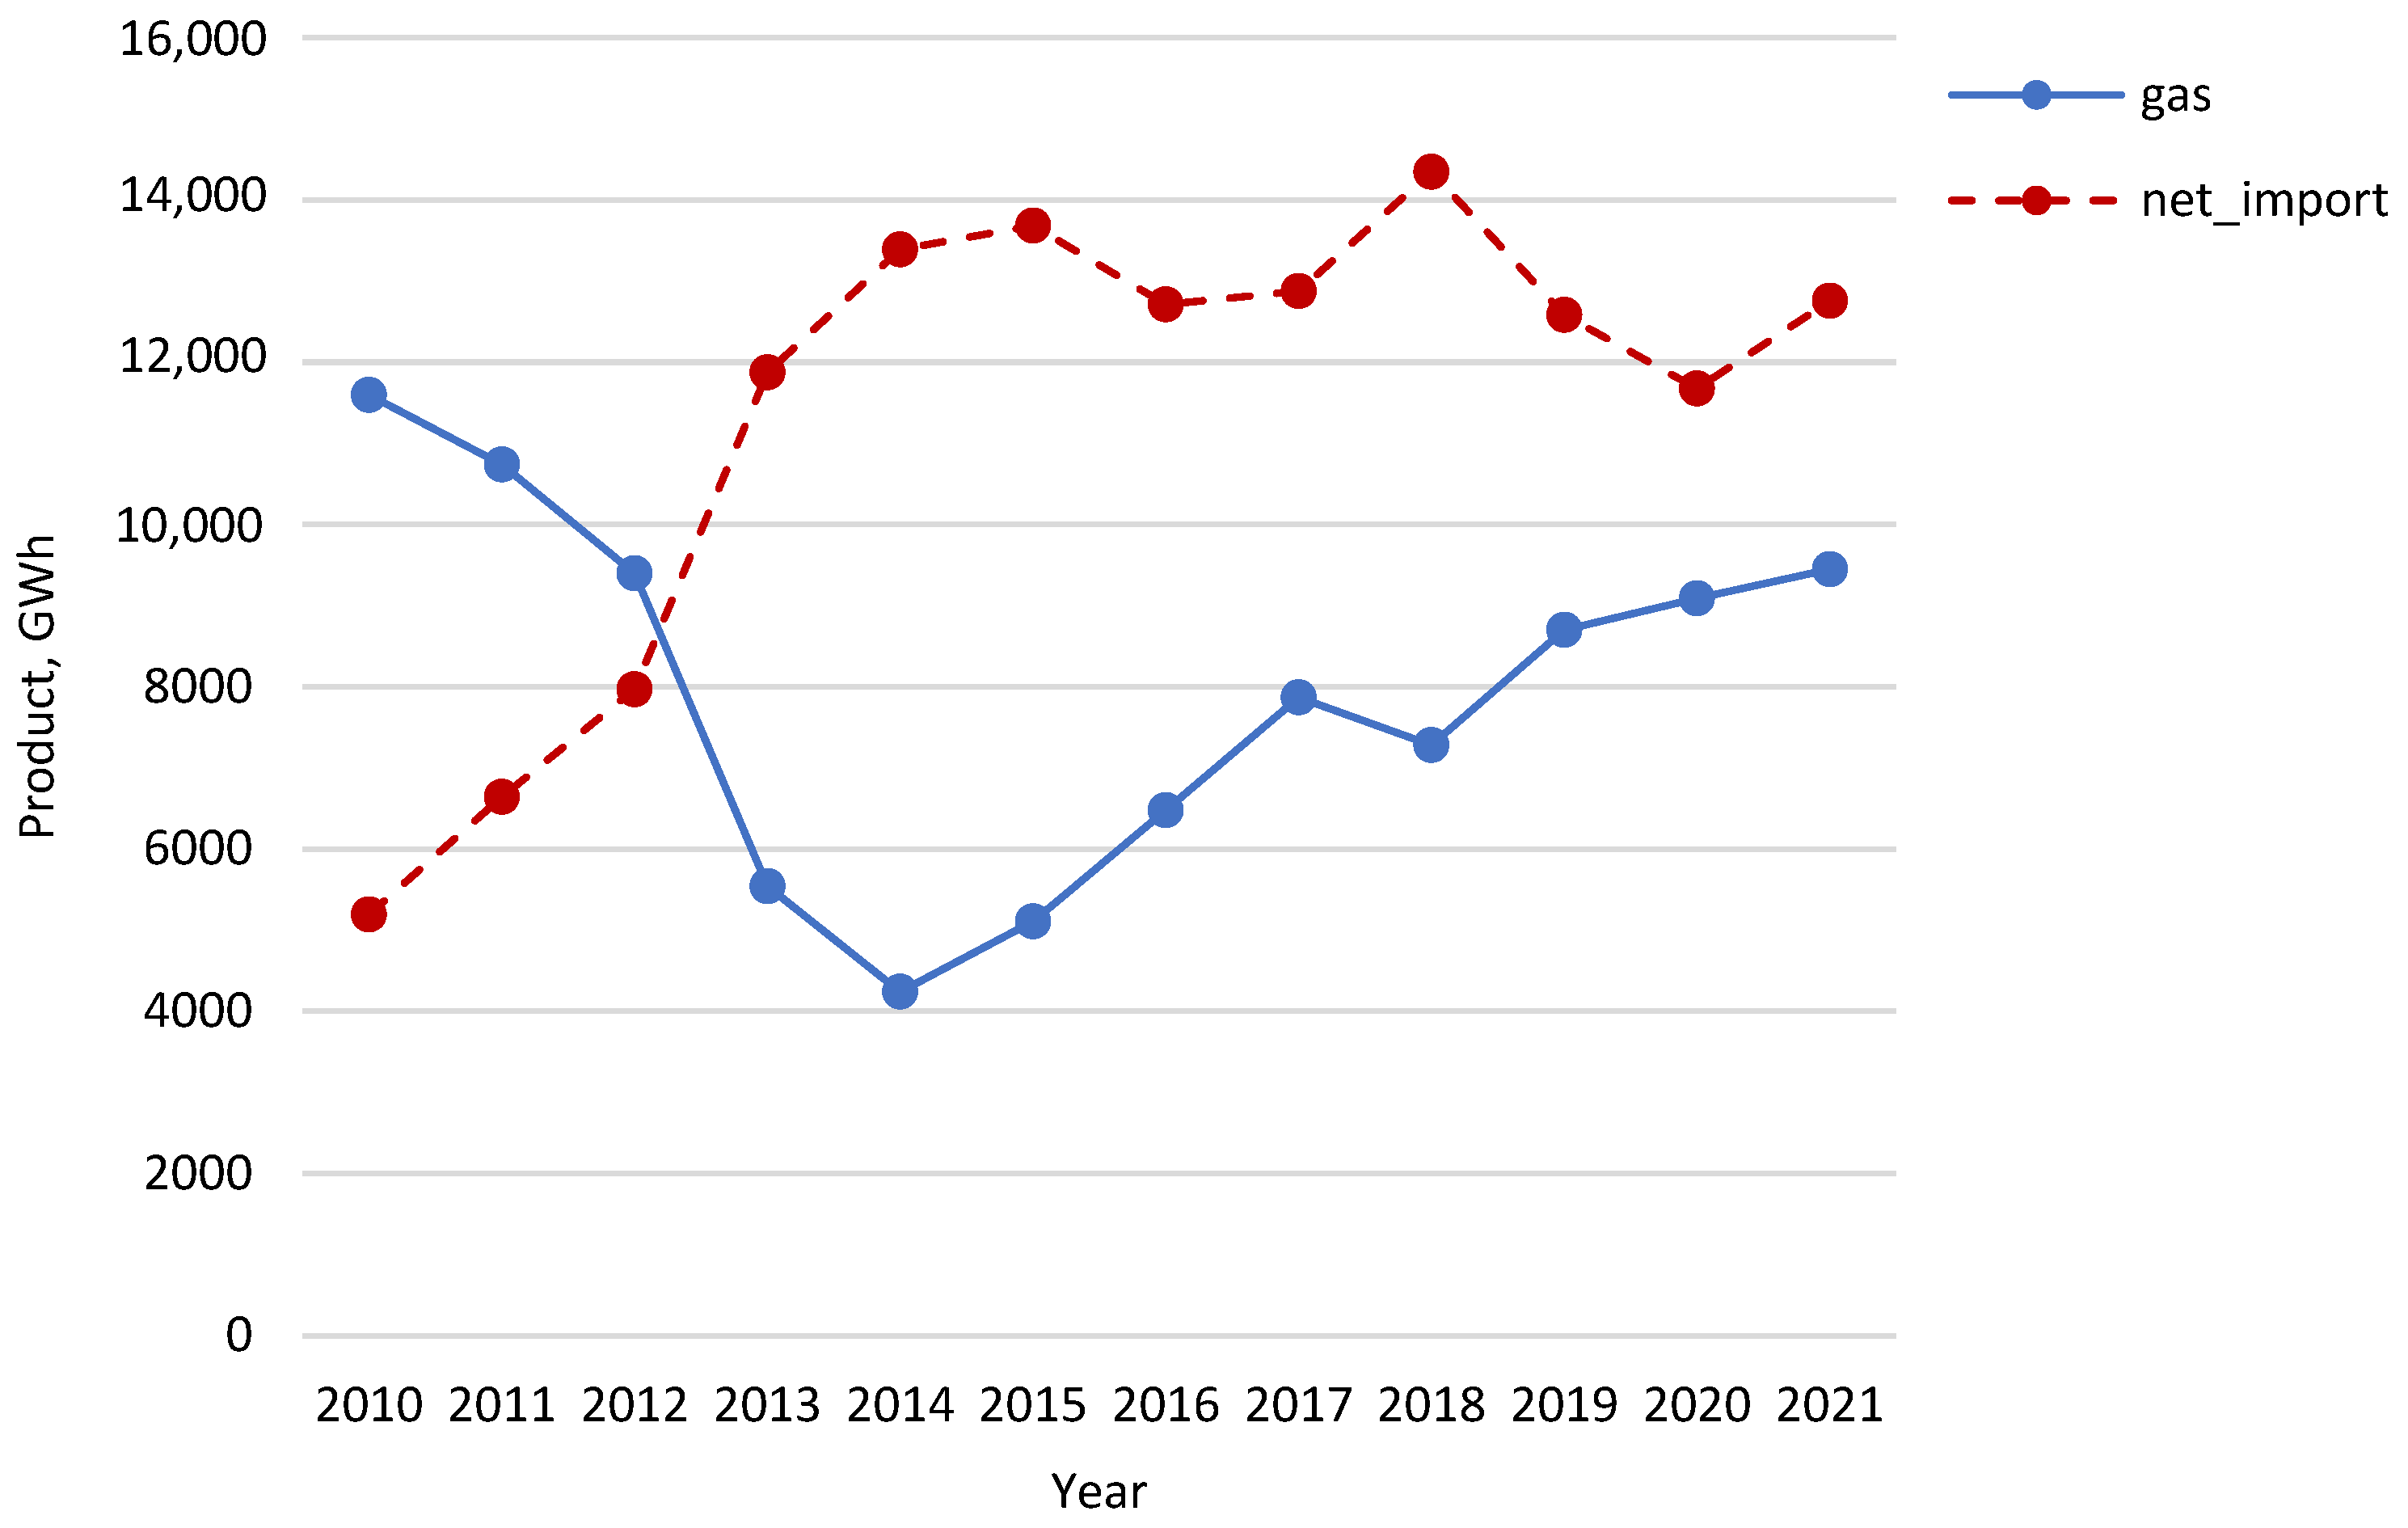
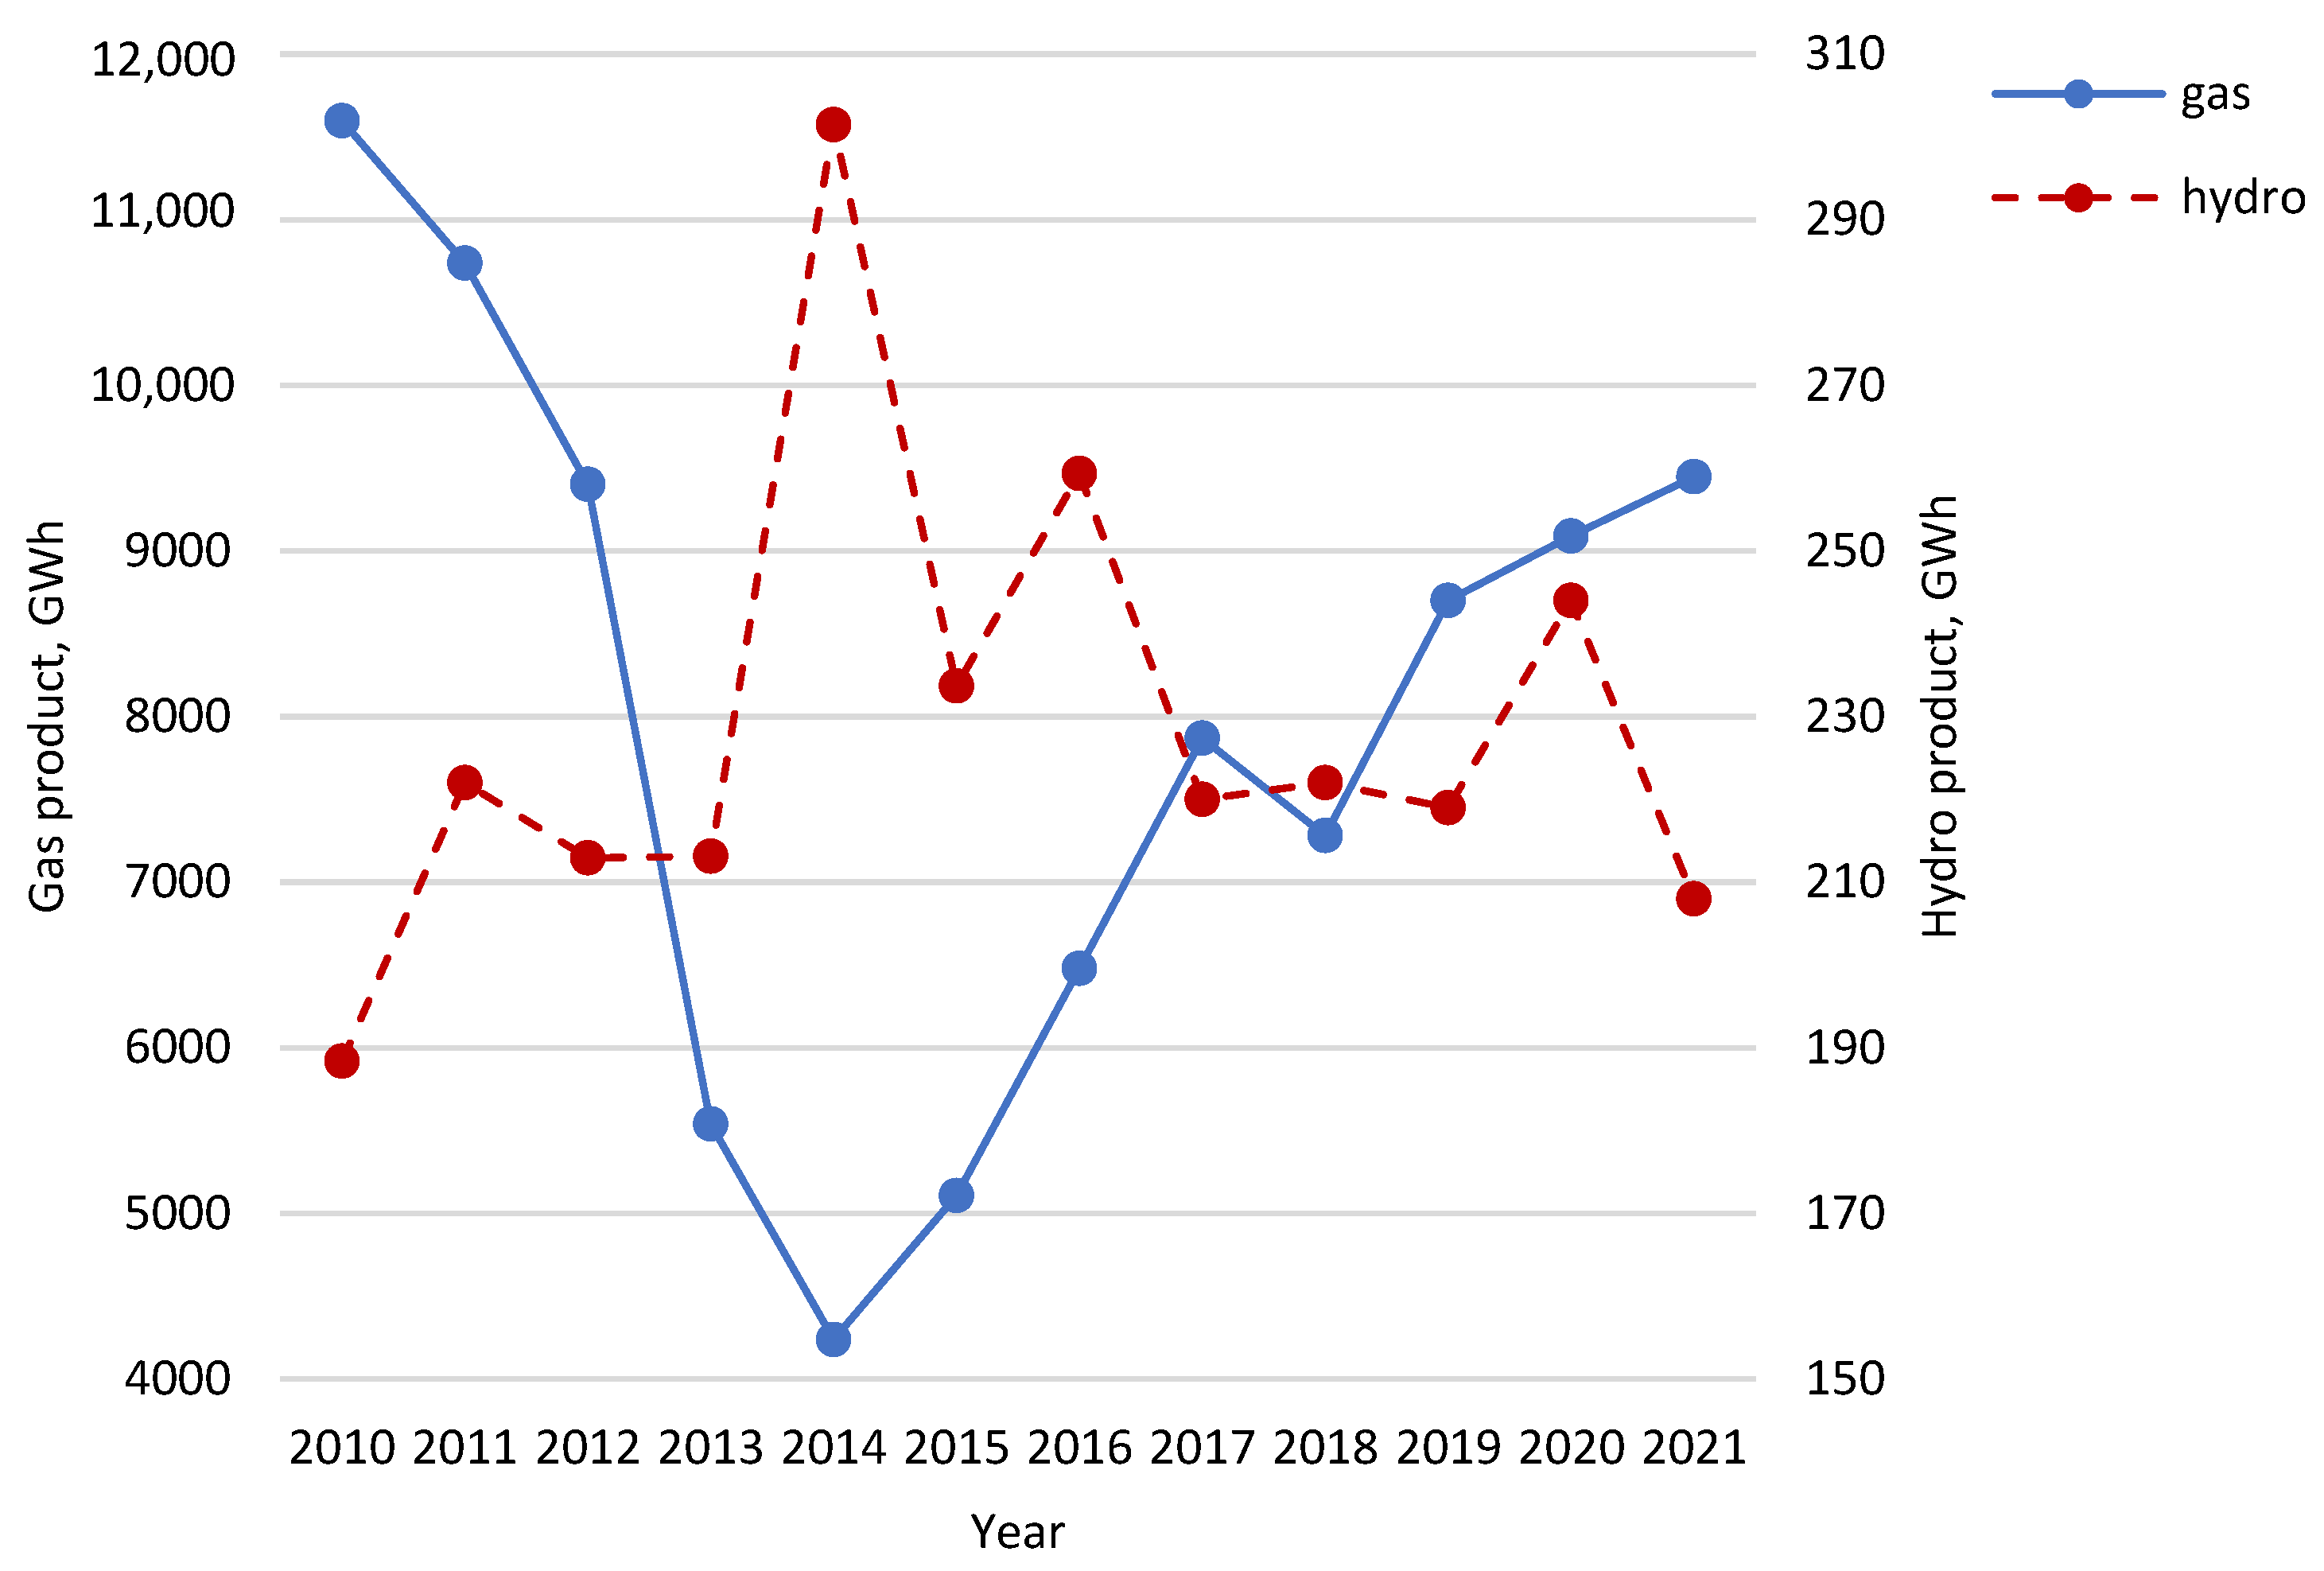
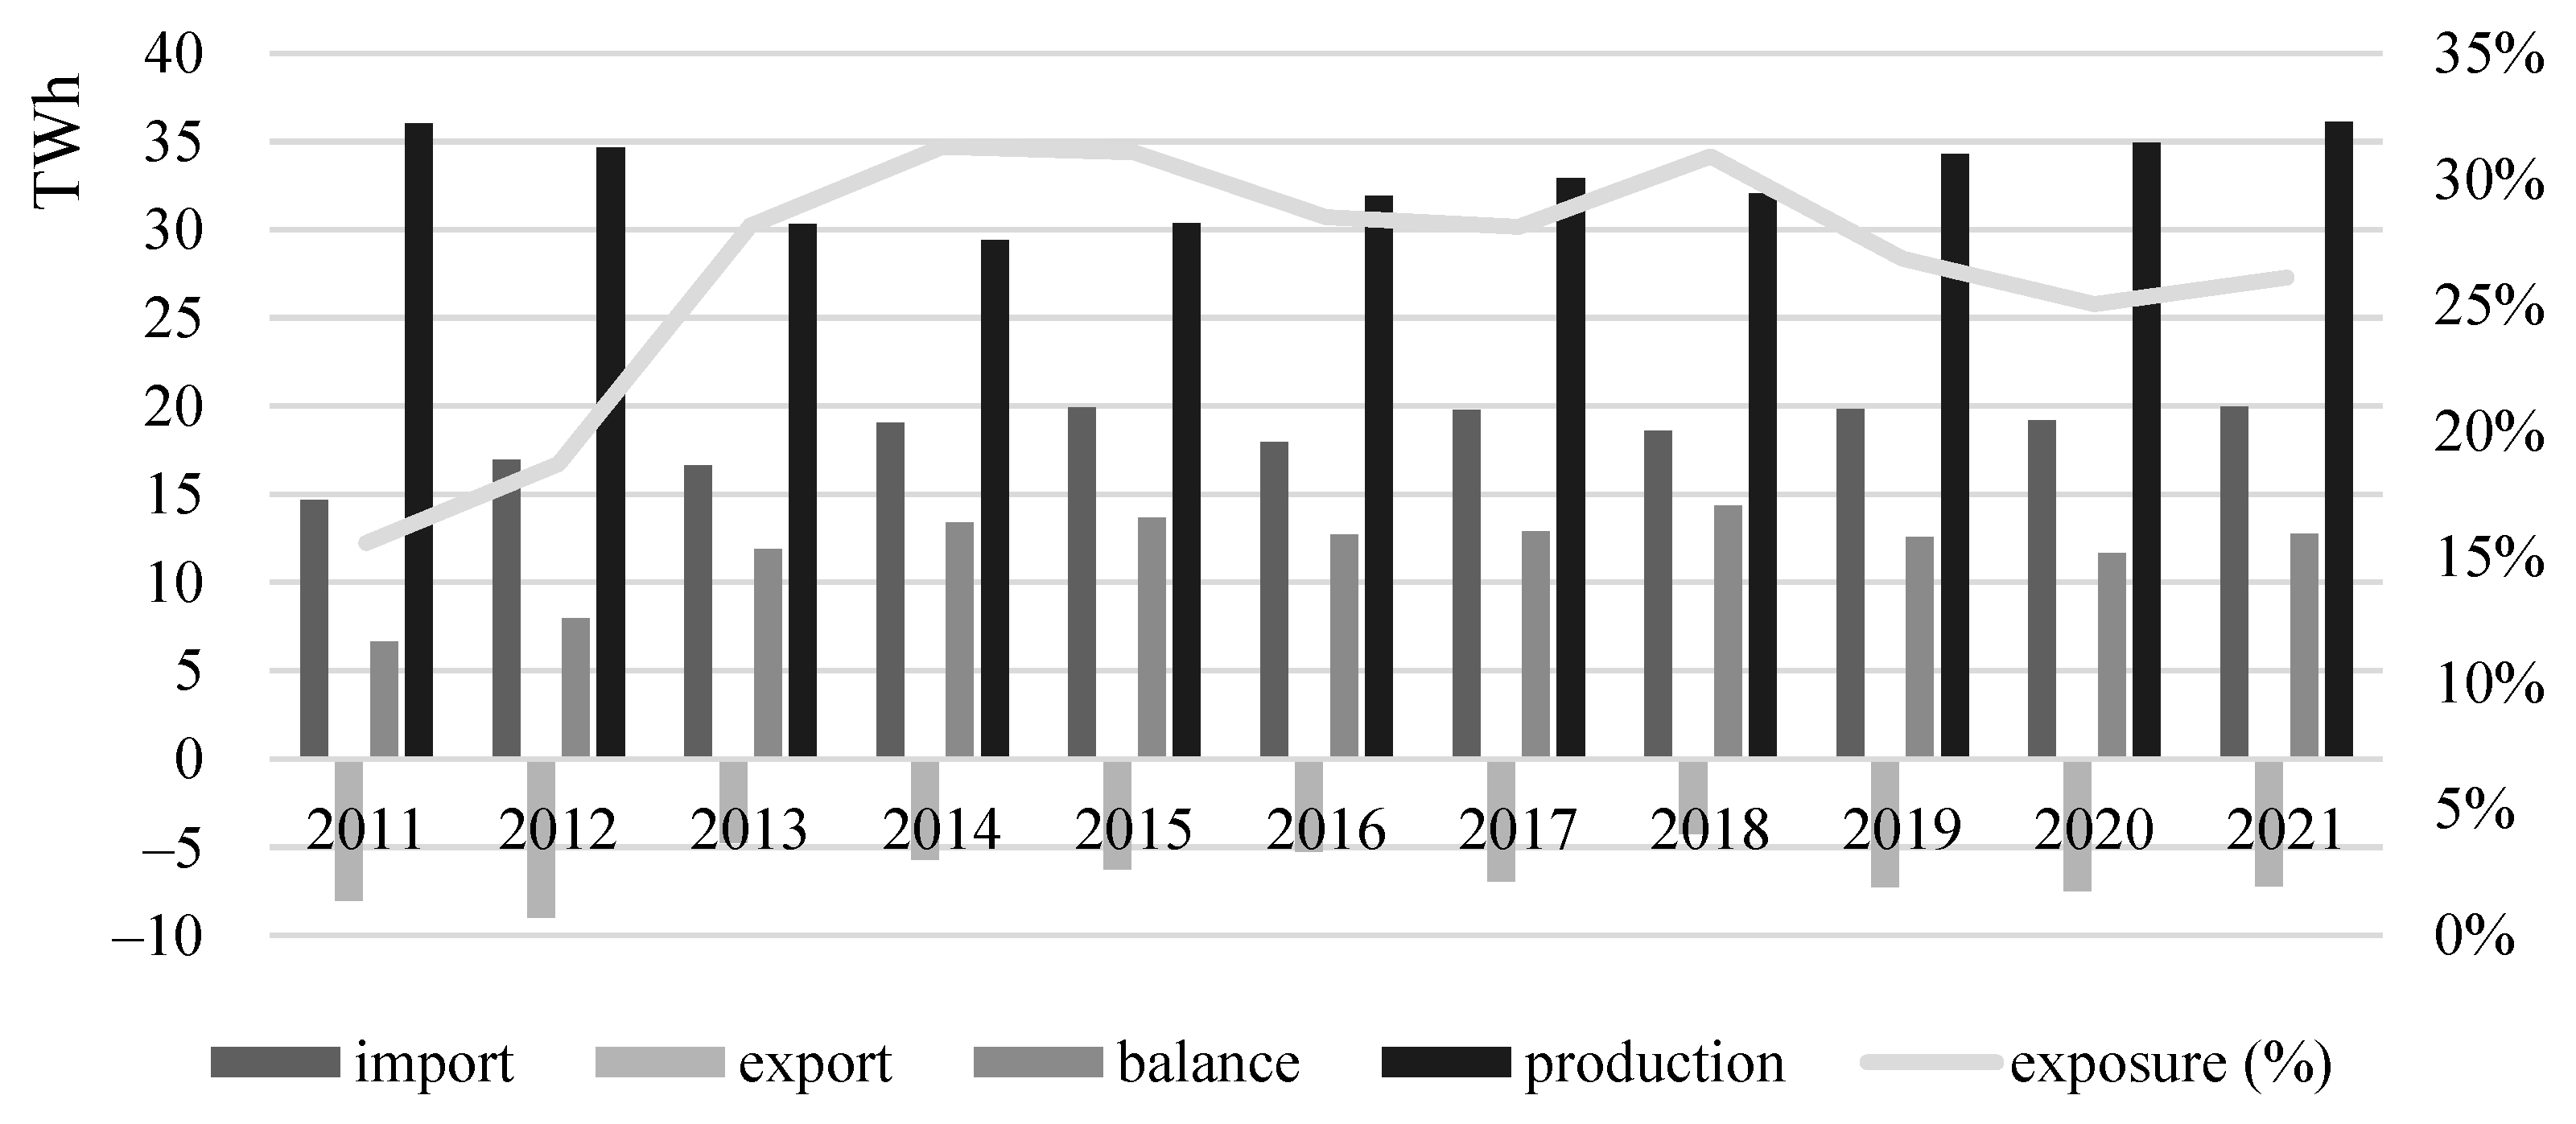
Table 1.
The development of the share of renewable energy in the final energy consumption and the 2020 targets.
Table 1.
The development of the share of renewable energy in the final energy consumption and the 2020 targets.
| 2010 | 2011 | 2012 | 2013 | 2014 | 2015 | 2016 | 2017 | 2018 | 2019 | 2020 | 2020 Target % | |
|---|---|---|---|---|---|---|---|---|---|---|---|---|
| EU-27 from 2020 | 14.4 | 14.5 | 16.0 | 16.7 | 17.4 | 17.8 | 18.0 | 18.4 | 19.1 | 19.9 | 22.1 | 20.0 |
| Hungary | 12.7 | 14.0 | 15.5 | 16.2 | 14.6 | 14.5 | 14.4 | 13.6 | 12.5 | 12.6 | 13.9 | 13.0 |
Source: Eurostat database (2021) [51].
Table 2.
The change in the European Union’s gross available energy and gross electricity production between 2010 and 2020 in GWh.
Table 2.
The change in the European Union’s gross available energy and gross electricity production between 2010 and 2020 in GWh.
| 2010 | Share | 2020 | Share | 2010–2020 | ||
|---|---|---|---|---|---|---|
| GROSS AVAILABLE ENERGY | Coal | 2,850,293.42 | 15.4% | 1,631,844.95 | 10.3% | −42.7% |
| Gas | 4,219,855.55 | 22.9% | 3,804,493.36 | 24.1% | −9.8% | |
| Oil | 6,810,519.76 | 36.9% | 5,532,945.99 | 35.0% | −18.8% | |
| Renewables | 2,016,822.10 | 10.9% | 2,790,738.67 | 17.7% | 38.4% | |
| Nuclear | 2,554,188.94 | 13.8% | 2,037,286.13 | 12.9% | −20.2% | |
| GROSS ELECTRICITY PRODUCTION | Coal | 701,230.14 | 24.1% | 351,394.19 | 12.9% | −49.9% |
| Gas | 588,794.12 | 20.2% | 560,051.87 | 20.5% | −4.9% | |
| Oil | 82,089.60 | 2.8% | 48,052.91 | 1.8% | −41.5% | |
| Renewables | 682,003.24 | 23.4% | 1,086,087.10 | 39.8% | 59.2% | |
| Nuclear | 854,470.00 | 29.4% | 683,512.15 | 25.0% | −20.0% |
Table 3.
Share of renewable energies in the European Union’s gross electricity production (GWh).
| Energy Source | 2010 | Share | 2020 | Share | Change between 2010–2020 |
|---|---|---|---|---|---|
| Water | 401,279.58 | 58.9% | 374,534.74 | 34.5% | −7% |
| Geo | 5602.41 | 0.8% | 6717.26 | 0.6% | 20% |
| Wind | 139,842.16 | 20.5% | 397,418.09 | 36.6% | 184% |
| Solar | 761.2 | 0.1% | 4992 | 0.5% | 556% |
| Photovoltaic | 22,462.86 | 3.3% | 139,240.38 | 12.8% | 520% |
| Bioenergy | 111,636.90 | 16.4% | 163,690.56 | 15.1% | 47% |
Source: Own editing based on [64].
Table 4.
Hungary’s gross available energy between 2010–2020 in GWh.
| 2010 | Share | 2020 | Share | 2010–2020 | |
|---|---|---|---|---|---|
| Coal | 31,439.55 | 10.4% | 19,573.34 | 6.7% | −37.7% |
| Gas | 114,154.25 | 37.7% | 101,929.75 | 35.1% | −10.7% |
| Oil | 79,067.09 | 26.1% | 86,904.48 | 30% | 9.9% |
| Renewables | 32,302.58 | 10.7% | 34,483.19 | 11.9% | 6.8% |
| Nuclear | 46,089.69 | 15.2% | 47,136.39 | 16.3% | 2.3% |
Source: Own editing based on [73].
Table 5.
Development of Hungary’s gross electricity production between 2010 and 2020 in GWh.
| 2010 | Share | 2020 | Share | 2010–2020 | |
|---|---|---|---|---|---|
| Coal | 6234 | 16.8% | 3711 | 10.8% | −40.5% |
| Gas | 11,598 | 31.3% | 9091 | 26.4% | −21.6% |
| Oil | 490 | 1.3% | 45 | 0.1% | −90.8% |
| Renewable | 3019 | 8.1% | 5529 | 16.1% | 83.1% |
| Nuclear | 15,761 | 42.5% | 16,055 | 46.6% | 1.9% |
| Other | 269 | 0.7% | 499 | 1.4% | 85.5% |
| Total | 37,371 | 100% | 34,930 | 100% | −6.5% |
Source: Own editing based on [80].
Table 6.
Development of Hungarian gross electricity production from renewable energy sources between 2010 and 2020 in GWh.
Table 6.
Development of Hungarian gross electricity production from renewable energy sources between 2010 and 2020 in GWh.
| 2010 | Share | 2020 | Share | 2010–2020 | |
|---|---|---|---|---|---|
| Hydro | 188.4 | 6.2% | 244 | 4.4% | 29.5% |
| Wind | 533.8 | 17.7% | 655 | 11.9% | 22.7% |
| Photovoltaic | 0.9 | 0.0% | 2459 | 44.6% | - |
| Bioenergy | 2296.5 | 76.1% | 2159.9 | 39.1% | −5.9% |
| Total | 3019.5 | 100.0% | 5517.9 | 100.0% | 82.7% |
Source: Own editing based on [86].
Table 7.
Electric power plants in Hungary with an installed capacity exceeding 50 MW.
| Power Plant | Performance | |
|---|---|---|
| Paks Nuclear Power Plant | 2000 | MW |
| Mátra Power Plant (Gagarin) (Visonta) | 950 | MW |
| Dunamenti Gas Turbine Combined Power Plant | 755 | MW |
| Gönyűi Combined Cycle Power Plant | 433 | MW |
| Csepel Gas Turbine Power Plant | 390 | MW |
| Quick Start Gas Turbine Power Plants (Litér, Sajószöged) | 240 | MW |
| Pécs Thermal Power Plant | 215 | MW |
| Oroszlányi Thermal Power Plant | 200 | MW |
| Lőrinci Gas Turbine Power Plant | 150 | MW |
| Kelenföld Gas Turbine Power Plant | 136 | MW |
| Mátravidék Power Plant (Lőrinci) | 128 | MW |
| Ajkai Gas Turbine Peak Power Plant | 116 | MW |
| Kispest Power Plant | 110 | MW |
| Ajkai Thermal Power Plant | 100 | MW |
| Debrecen Combined Cycle Power Plant | 99 | MW |
| Danube Ironworks Power Plant (Dunaújváros) | 84 | MW |
| HHI | 16.7 | % |
Table 8.
Composition and concentration of Hungarian electricity production according to primary energy carriers between 2010 and 2021.
Table 8.
Composition and concentration of Hungarian electricity production according to primary energy carriers between 2010 and 2021.
| 2010 | 2011 | 2012 | 2013 | 2014 | 2015 | 2016 | 2017 | 2018 | 2019 | 2020 | 2021 * | |
|---|---|---|---|---|---|---|---|---|---|---|---|---|
| nuclear | 15,761 | 15,685 | 15,793 | 15,370 | 15,649 | 15,834 | 16,054 | 16,098 | 15,733 | 16,288 | 16,055 | 15,990 |
| coal | 6350 | 6609 | 6492 | 6384 | 6114 | 5908 | 5758 | 5098 | 4834 | 4184 | 3841 | 3014 |
| gas | 11,598 | 10,738 | 9401 | 5541 | 4240 | 5108 | 6479 | 7838 | 7255 | 8566 | 9077 | 9653 |
| oil | 490 | 144 | 185 | 78 | 76 | 77 | 63 | 85 | 90 | 70 | 42 | 59 |
| biomass | 2034 | 1527 | 1333 | 1429 | 1702 | 1660 | 1493 | 1646 | 1799 | 1769 | 1666 | 1779 |
| biogas | 118 | 213 | 211 | 267 | 287 | 293 | 333 | 348 | 336 | 318 | 320 | 295 |
| waste | 145 | 119 | 111 | 136 | 137 | 208 | 245 | 160 | 162 | 137 | 167 | 149 |
| hydro | 188 | 222 | 213 | 213 | 301 | 234 | 259 | 220 | 222 | 219 | 244 | 212 |
| wind | 534 | 626 | 770 | 718 | 657 | 693 | 684 | 758 | 607 | 729 | 655 | 664 |
| solar | 1 | 1 | 8 | 25 | 67 | 141 | 244 | 349 | 629 | 1497 | 2450 | 3796 |
| geothermal | 0 | 0 | 0 | 0 | 0 | 0 | 0 | 0 | 12 | 18 | 16 | 12 |
| other | 152 | 135 | 118 | 133 | 173 | 204 | 290 | 284 | 360 | 359 | 391 | 352 |
| total | 37,731 | 36,019 | 34,635 | 30,294 | 29,403 | 30,360 | 31,902 | 32,885 | 32,039 | 34,154 | 34,924 | 35,975 |
| HHI | 30.7% | 31.4% | 31.9% | 33.8% | 35.1% | 34.2% | 33.0% | 32.4% | 31.9% | 31.1% | 29.9% | 29.1% |
Table 9.
Time series of Hungarian gross electricity production according to sources from 2010–2021.
| Coal | Gas | Nuclear | Bioenergy | Photovoltaic | Wind | Hydro | Net Import | |
|---|---|---|---|---|---|---|---|---|
| 2010 | 6234 | 11,598 | 15,761 | 2296 | 1 | 534 | 188 | 5195 |
| 2011 | 6483 | 10,738 | 15,685 | 1859 | 1 | 626 | 222 | 6643 |
| 2012 | 6344 | 9401 | 15,793 | 1655 | 8 | 770 | 213 | 7967 |
| 2013 | 6300 | 5541 | 15,370 | 1832 | 25 | 718 | 213 | 11,877 |
| 2014 | 5995 | 4240 | 15,649 | 2126 | 67 | 657 | 301 | 13,390 |
| 2015 | 5790 | 5108 | 15,834 | 2161 | 141 | 693 | 234 | 13,686 |
| 2016 | 5632 | 6479 | 16,054 | 2071 | 244 | 684 | 259 | 12,711 |
| 2017 | 4932 | 7869 | 16,098 | 2156 | 349 | 758 | 220 | 12,878 |
| 2018 | 4669 | 7282 | 15,733 | 2300 | 629 | 607 | 222 | 14,348 |
| 2019 | 4036 | 8700 | 16,288 | 2232 | 1497 | 729 | 219 | 12,584 |
| 2020 | 3711 | 9091 | 16,055 | 2160 | 2459 | 655 | 244 | 11,677 |
| 2021 * | 3084 | 9447 | 15,990 | 2058 | 3793 | 651 | 208 | 12,755 |
* Hungarian Central Statistical Office (KSH) forecast.
Table 10.
Correlation matrix of Hungarian gross electricity production.
| Coal | Gas | Nuclear | Bioenergy | Photovoltaic | Wind | Hydro | |
|---|---|---|---|---|---|---|---|
| gas | −0.147 | ||||||
| sign. | 0.649 | ||||||
| nuclear | −0.664 * | 0.257 | |||||
| sign. | 0.019 | 0.419 | |||||
| bioenergy | −0.445 | −0.043 | 0.410 | ||||
| sign. | 0.147 | 0.894 | 0.185 | ||||
| photovoltaic | −0.918 ** | 0.263 | 0.495 | 0.208 | |||
| sign. | 0.000 | 0.409 | 0.102 | 0.516 | |||
| wind | −0.023 | −0.353 | 0.244 | −0.493 | −0.061 | ||
| sign. | 0.943 | 0.261 | 0.444 | 0.104 | 0.851 | ||
| hydro | 0.071 | −0.679 * | −0.008 | 0.076 | −0.127 | 0.111 | |
| sign. | 0.827 | 0.015 | 0.980 | 0.814 | 0.694 | 0.732 | |
| net import | −0.499 | −0.754 ** | 0.237 | 0.345 | 0.290 | 0.348 | 0.481 |
| sign. | 0.099 | 0.005 | 0.459 | 0.271 | 0.361 | 0.267 | 0.113 |
* Correlation is significant at the 0.05 level (2-tailed). ** Correlation is significant at the 0.01 level (2-tailed).
Table 11.
Hungary’s electricity imports between 2011–2020, GWh.
| 2011 | 2012 | 2013 | 2014 | 2015 | 2016 | 2017 | 2018 | 2019 | 2020 | |
|---|---|---|---|---|---|---|---|---|---|---|
| Croatia | 11 | 4 | 415 | 60 | 46 | 292 | 31 | 725 | 154 | 376 |
| Austria | 1631 | 2428 | 1378 | 2567 | 2644 | 3090 | 5085 | 3753 | 6224 | 6386 |
| Romania | 866 | 215 | 758 | 1269 | 1359 | 929 | 359 | 1042 | 227 | 171 |
| Slovakia | 8118 | 10231 | 8298 | 9357 | 9817 | 8330 | 9459 | 6813 | 8738 | 9251 |
| Serbia | 267 | 78 | 950 | 212 | 519 | 898 | 306 | 1226 | 496 | 508 |
| Ukraine | 3771 | 4014 | 4836 | 5614 | 5550 | 4412 | 4563 | 5054 | 4014 | 2484 |
| Total | 14,664 | 16,970 | 16,635 | 19,079 | 19,935 | 17,951 | 19,803 | 18,613 | 19,853 | 19,176 |
| HHI | 38.9% | 36.2% |
Source: Own editing based on [102].
Table 12.
Hungary’s electricity exports between 2011–2020, GWh.
| 2011 | 2012 | 2013 | 2014 | 2015 | 2016 | 2017 | 2018 | 2019 | 2020 | |
|---|---|---|---|---|---|---|---|---|---|---|
| Croatia | 6171 | 6296 | 2912 | 3737 | 4866 | 3737 | 4883 | 2750 | 4236 | 3204 |
| Austria | 698 | 335 | 1014 | 547 | 525 | 432 | 134 | 591 | 39 | 102 |
| Romania | 340 | 965 | 525 | 154 | 249 | 560 | 908 | 588 | 1970 | 2185 |
| Slovakia | 5 | 2 | 8 | 0 | 1 | 11 | 6 | 60 | 44 | 57 |
| Serbia | 697 | 1295 | 278 | 1239 | 594 | 417 | 971 | 271 | 766 | 959 |
| Ukraine | 110 | 110 | 21 | 12 | 14 | 83 | 23 | 5 | 214 | 992 |
| Total | 8021 | 9003 | 4758 | 5689 | 6249 | 5240 | 6925 | 4265 | 7269 | 7499 |
| HHI | 60.9% | 30.2% |
Source: Own editing based on [103].
Table 13.
Annual load peaks of the Hungarian electricity system.
| 2011 | 2012 | 2013 | 2014 | 2015 | 2016 | 2017 | 2018 | 2019 | 2020 | |
|---|---|---|---|---|---|---|---|---|---|---|
| summer | 6212 | 6288 | 6193 | 6050 | 6457 | 6366 | 6357 | 6358 | 6633 | 6063 |
| winter | 6492 | 6463 | 6307 | 6461 | 6447 | 6749 | 6780 | 6869 | 7105 | 7095 |
| yearly | 6492 | 6463 | 6307 | 6461 | 6457 | 6749 | 6780 | 6869 | 7105 | 7095 |
Source: Own editing based on [104].
Disclaimer/Publisher’s Note: The statements, opinions and data contained in all publications are solely those of the individual author(s) and contributor(s) and not of MDPI and/or the editor(s). MDPI and/or the editor(s) disclaim responsibility for any injury to people or property resulting from any ideas, methods, instructions or products referred to in the content. |
© 2023 by the authors. Licensee MDPI, Basel, Switzerland. This article is an open access article distributed under the terms and conditions of the Creative Commons Attribution (CC BY) license (https://creativecommons.org/licenses/by/4.0/).
Share and Cite
MDPI and ACS Style
Bozsik, N.; Szeberényi, A.; Bozsik, N. Examination of the Hungarian Electricity Industry Structure with Special Regard to Renewables. Energies 2023, 16, 3826. https://doi.org/10.3390/en16093826
AMA Style
Bozsik N, Szeberényi A, Bozsik N. Examination of the Hungarian Electricity Industry Structure with Special Regard to Renewables. Energies. 2023; 16(9):3826. https://doi.org/10.3390/en16093826
Chicago/Turabian StyleBozsik, Norbert, András Szeberényi, and Nándor Bozsik. 2023. "Examination of the Hungarian Electricity Industry Structure with Special Regard to Renewables" Energies 16, no. 9: 3826. https://doi.org/10.3390/en16093826
Note that from the first issue of 2016, this journal uses article numbers instead of page numbers. See further details here.