

Methodology for the Development of Virtual Representations within the Process Development Framework of Energy Plants: From Digital Model to Digital Predictive Twin—A Review

 , , ,
, , ,
Abstract
:1. Introduction
- The summary of existing concepts of virtual representations;
- The comparison of different definitions of virtual representations;
- The collection of possible applications, challenges and properties of virtual representations in the energy sector;
- The ascertainment of sustainable development goals and sustainability indicators concerning process development;
- The definition of process development stages with the introduction of the modeling readiness level;
- The development of a unified modeling framework for the optimized development of novel energy technologies with a particular focus on the interaction between the physical facility and the virtual model.
2. Concept and Methodology
2.1. Existing Concepts and Methodologies of Virtual Representations
2.2. Definitions of Virtual Representations
2.3. Applications, Challenges and Properties of Virtual Representations in the Energy Sector
2.4. Sustainability Indicators in the Energy Sector
2.5. Introduction of the Modeling Readiness Level
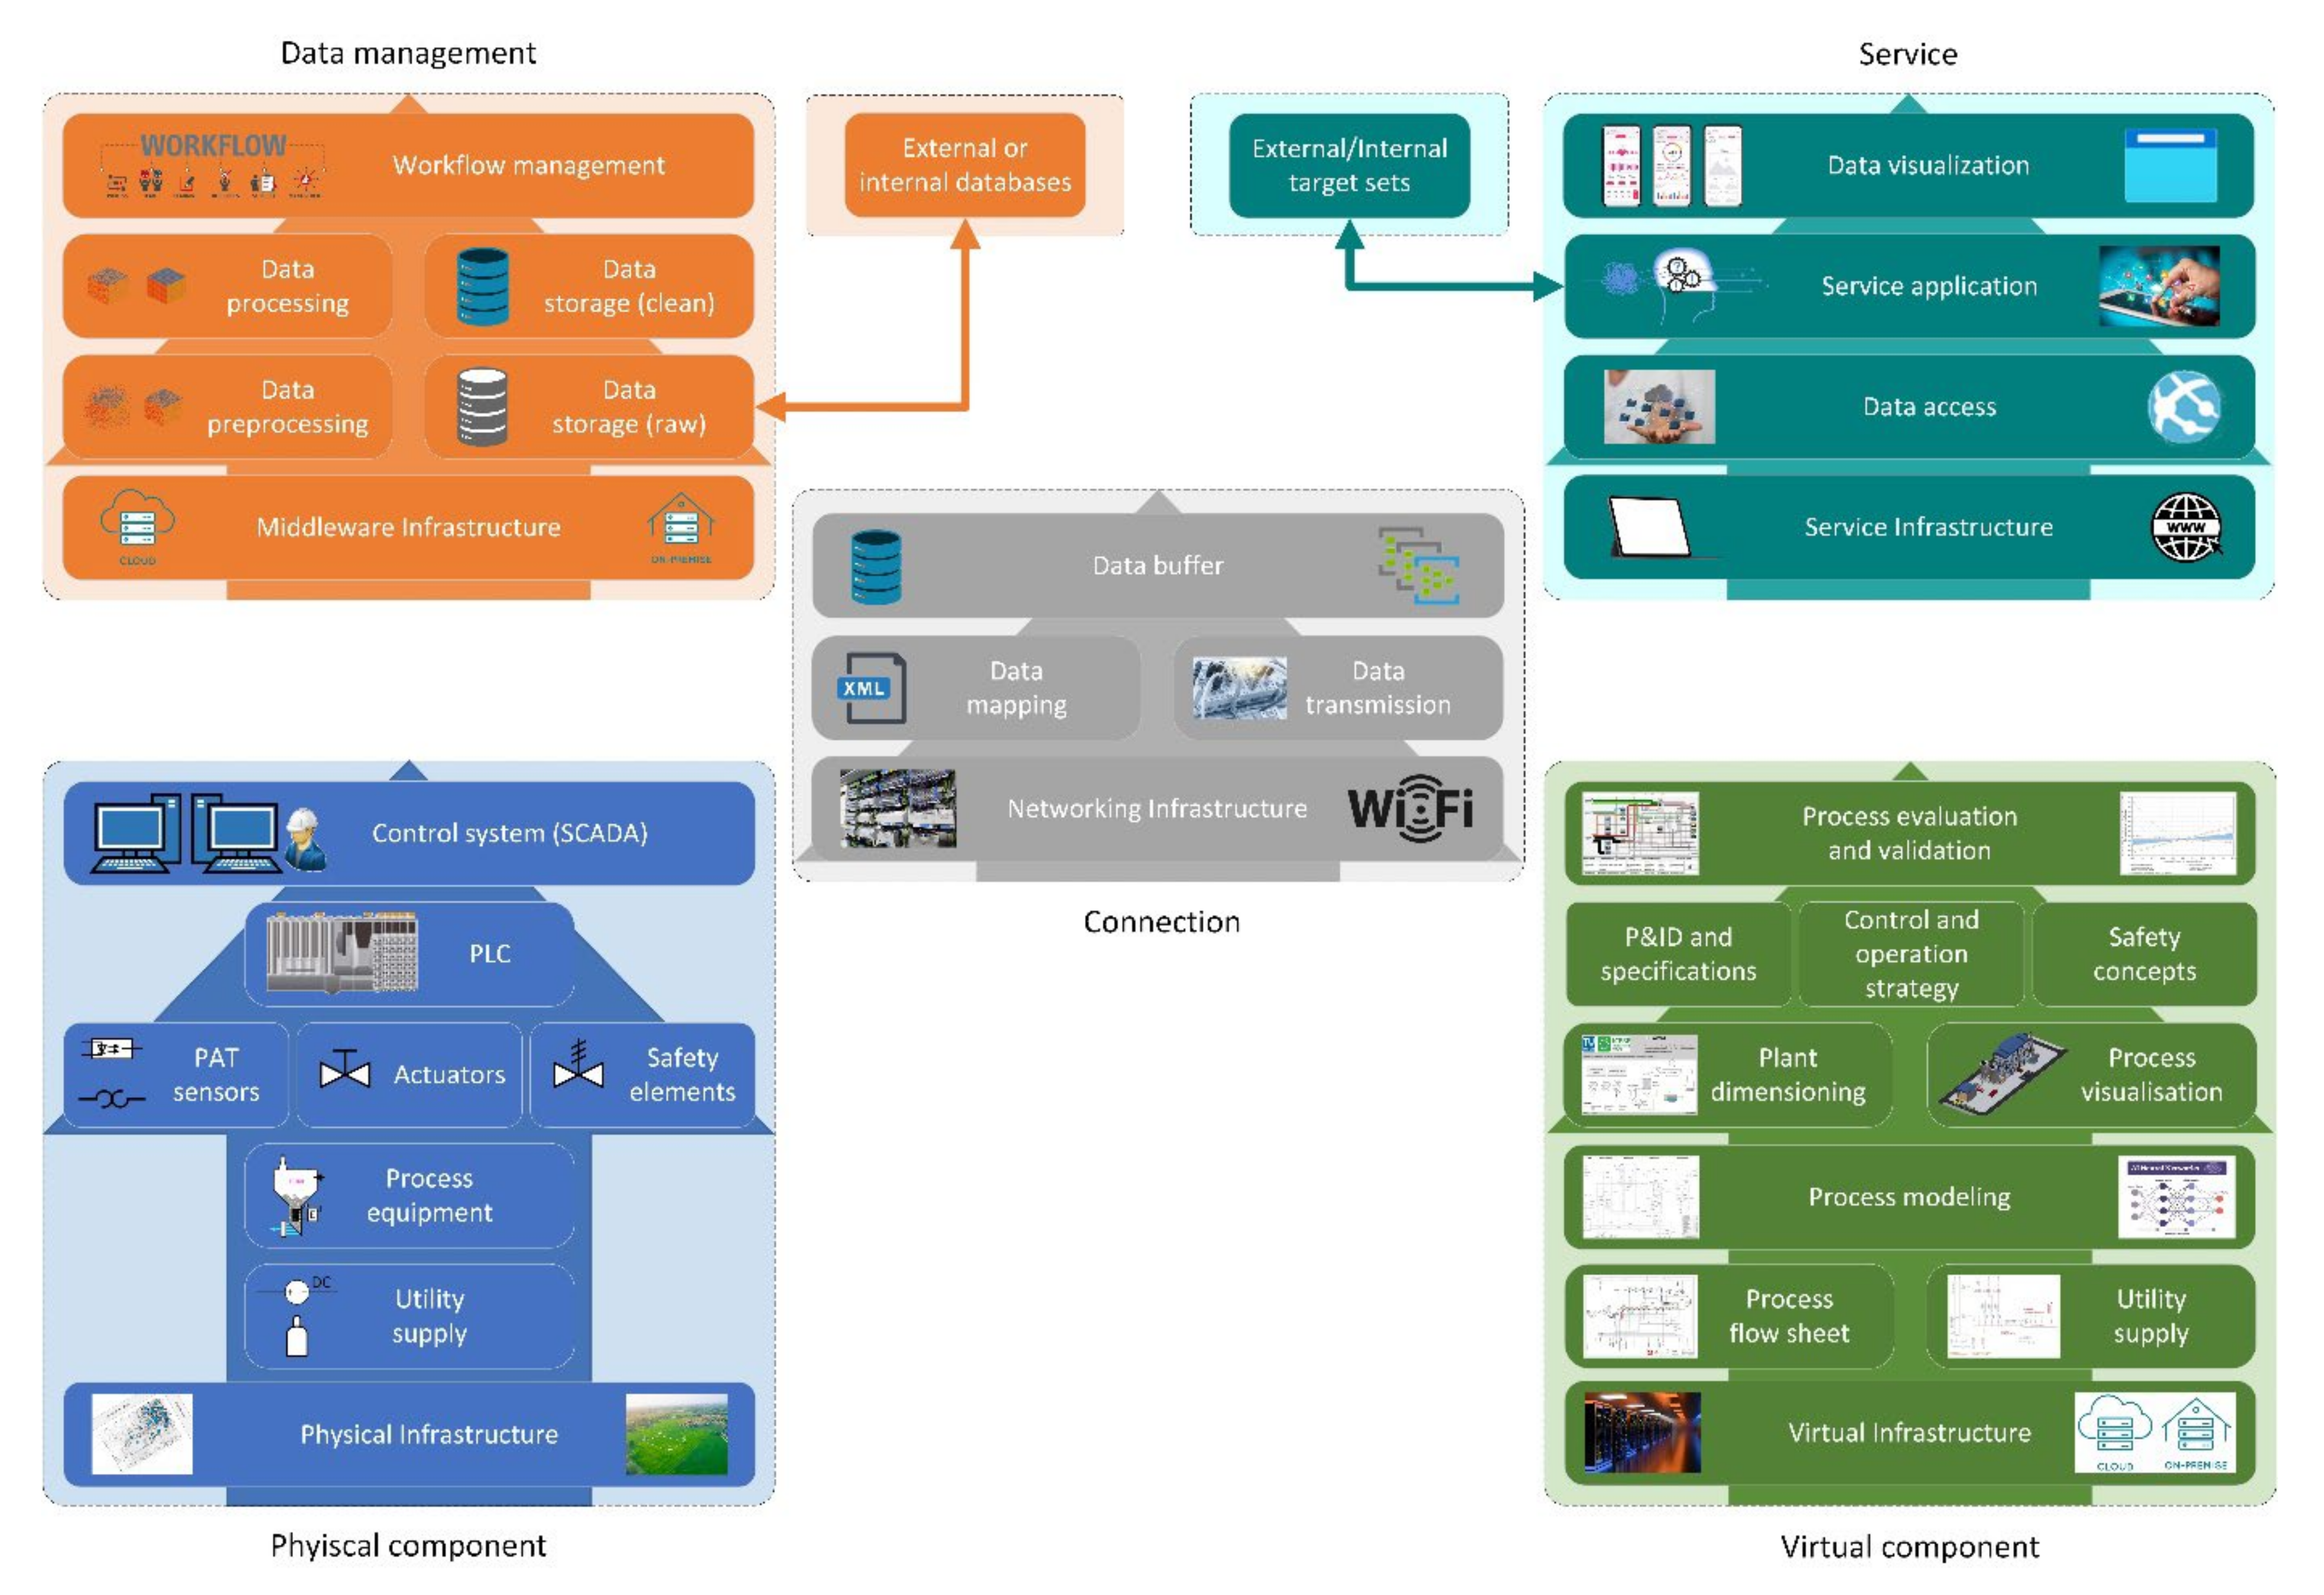
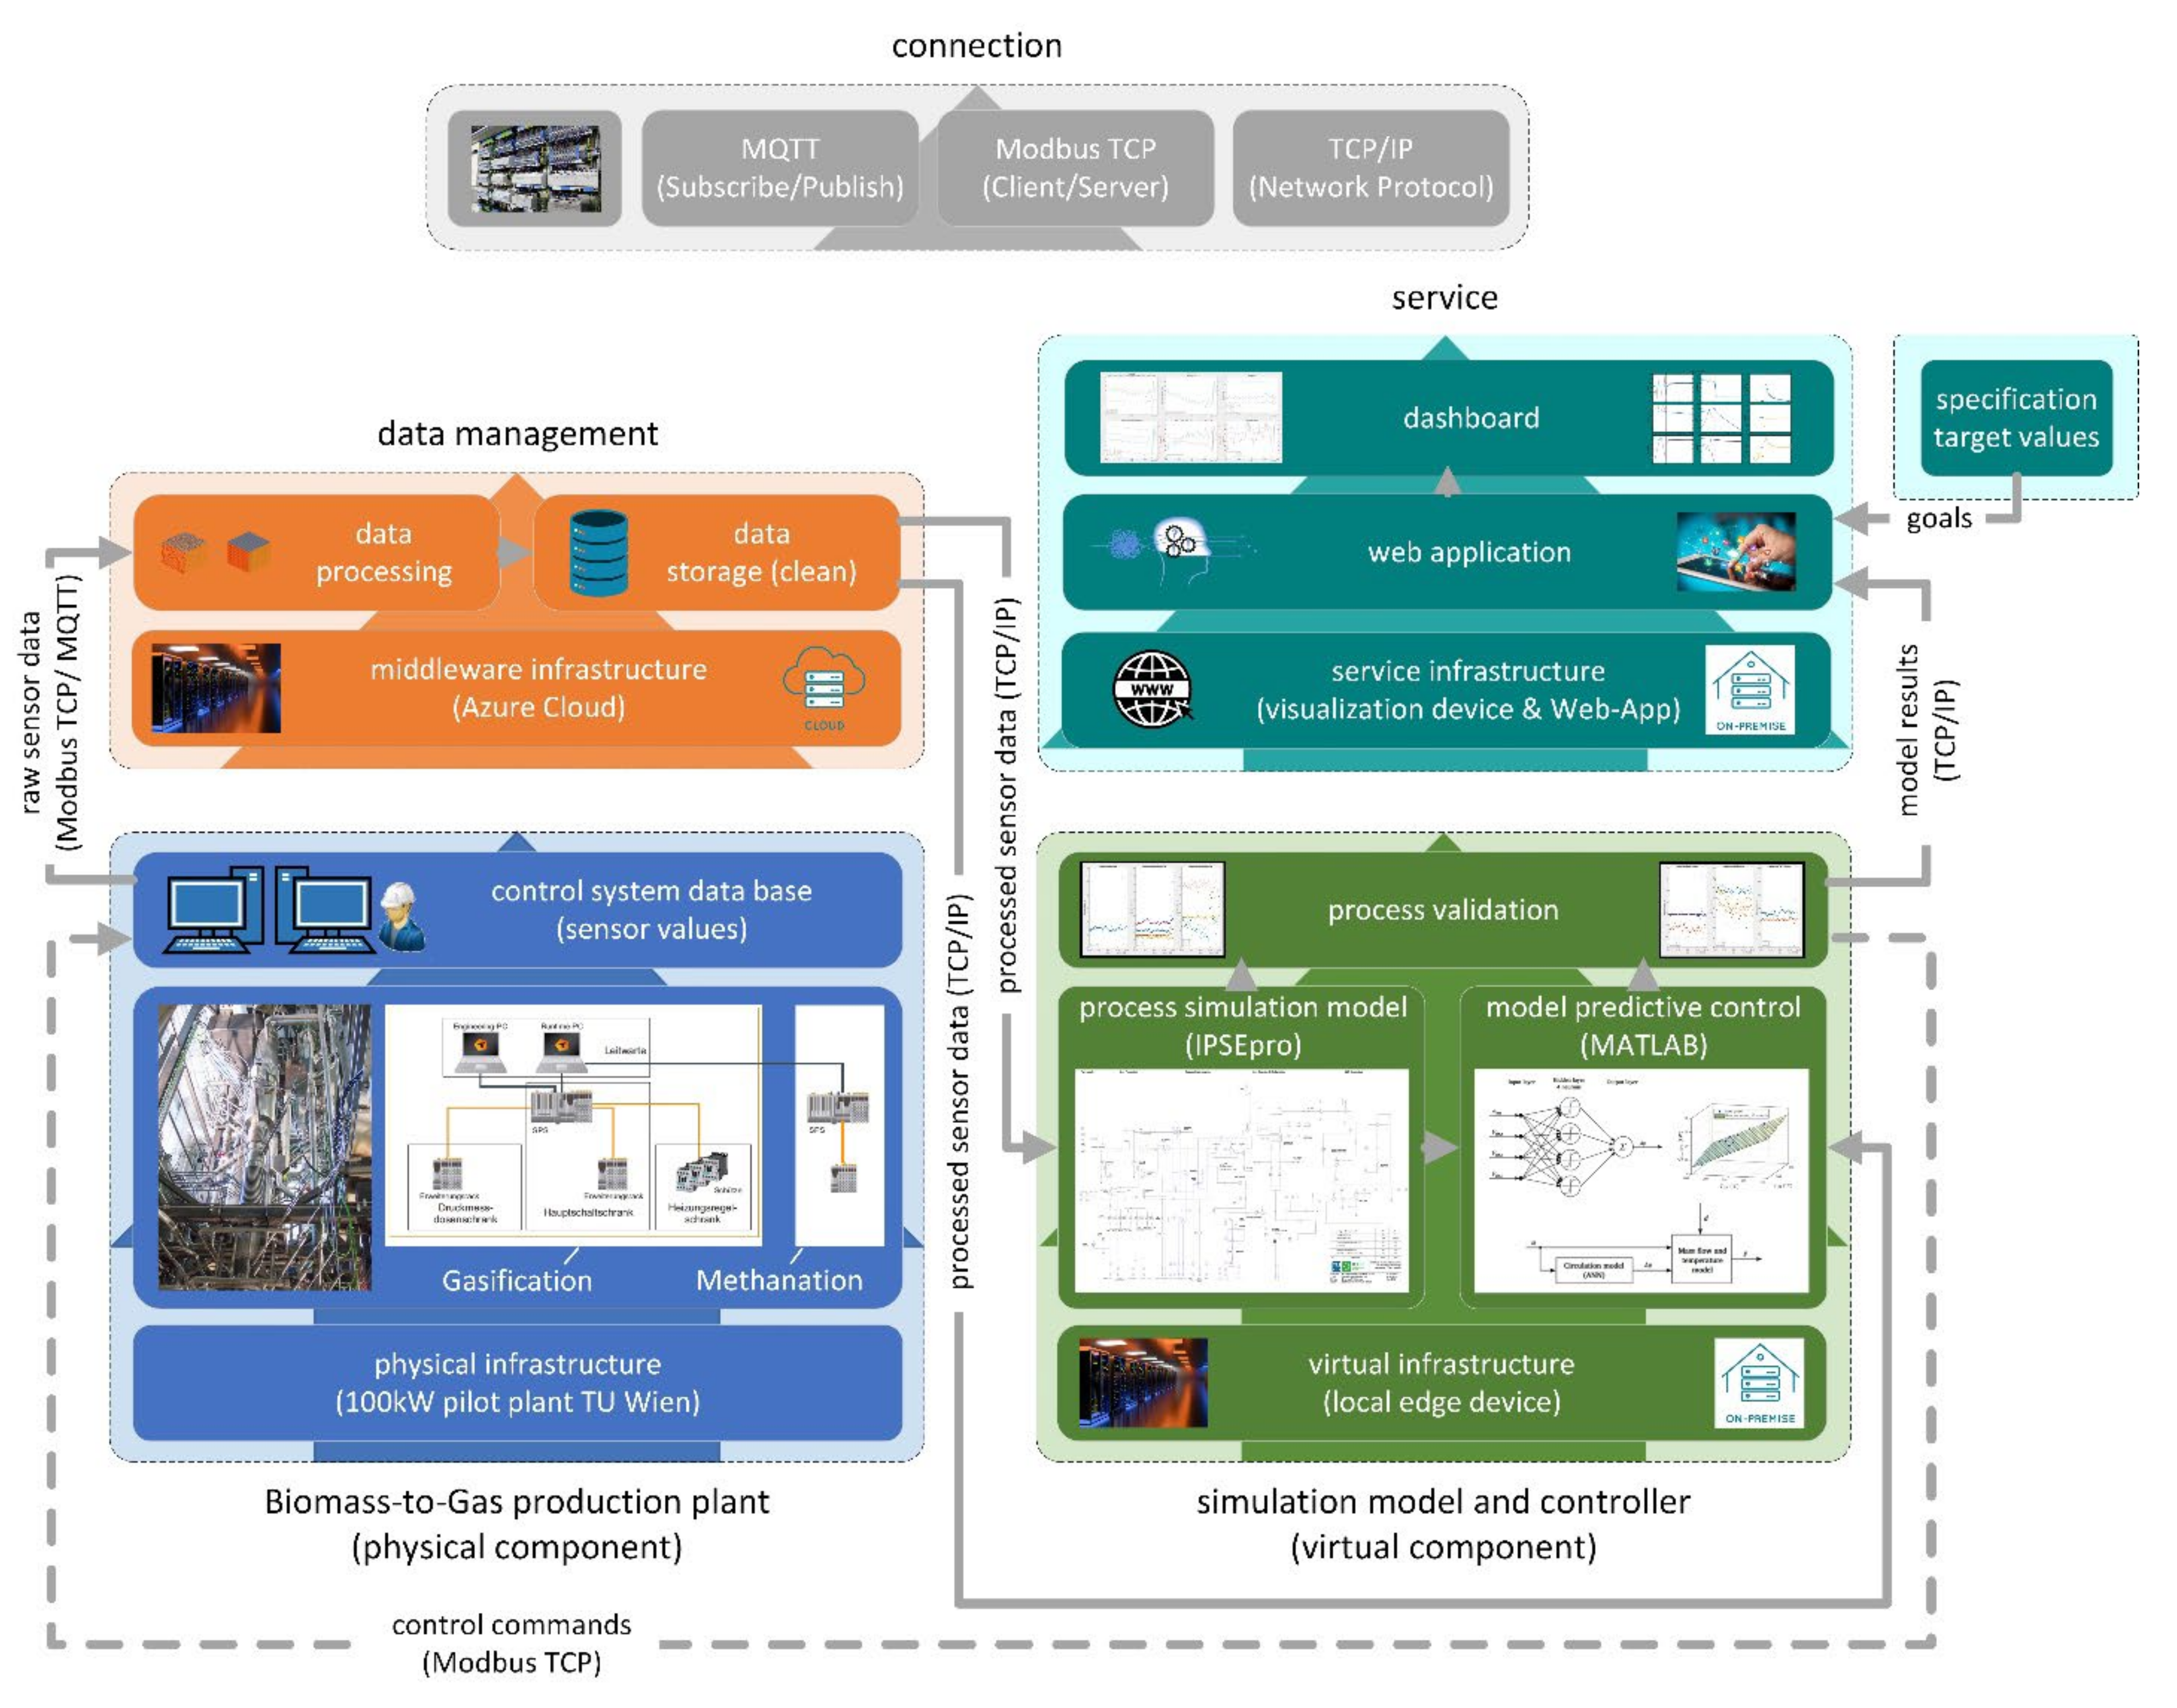
3. Virtual Representation Framework in the Process Development Environment
4. Conclusion and Outlook
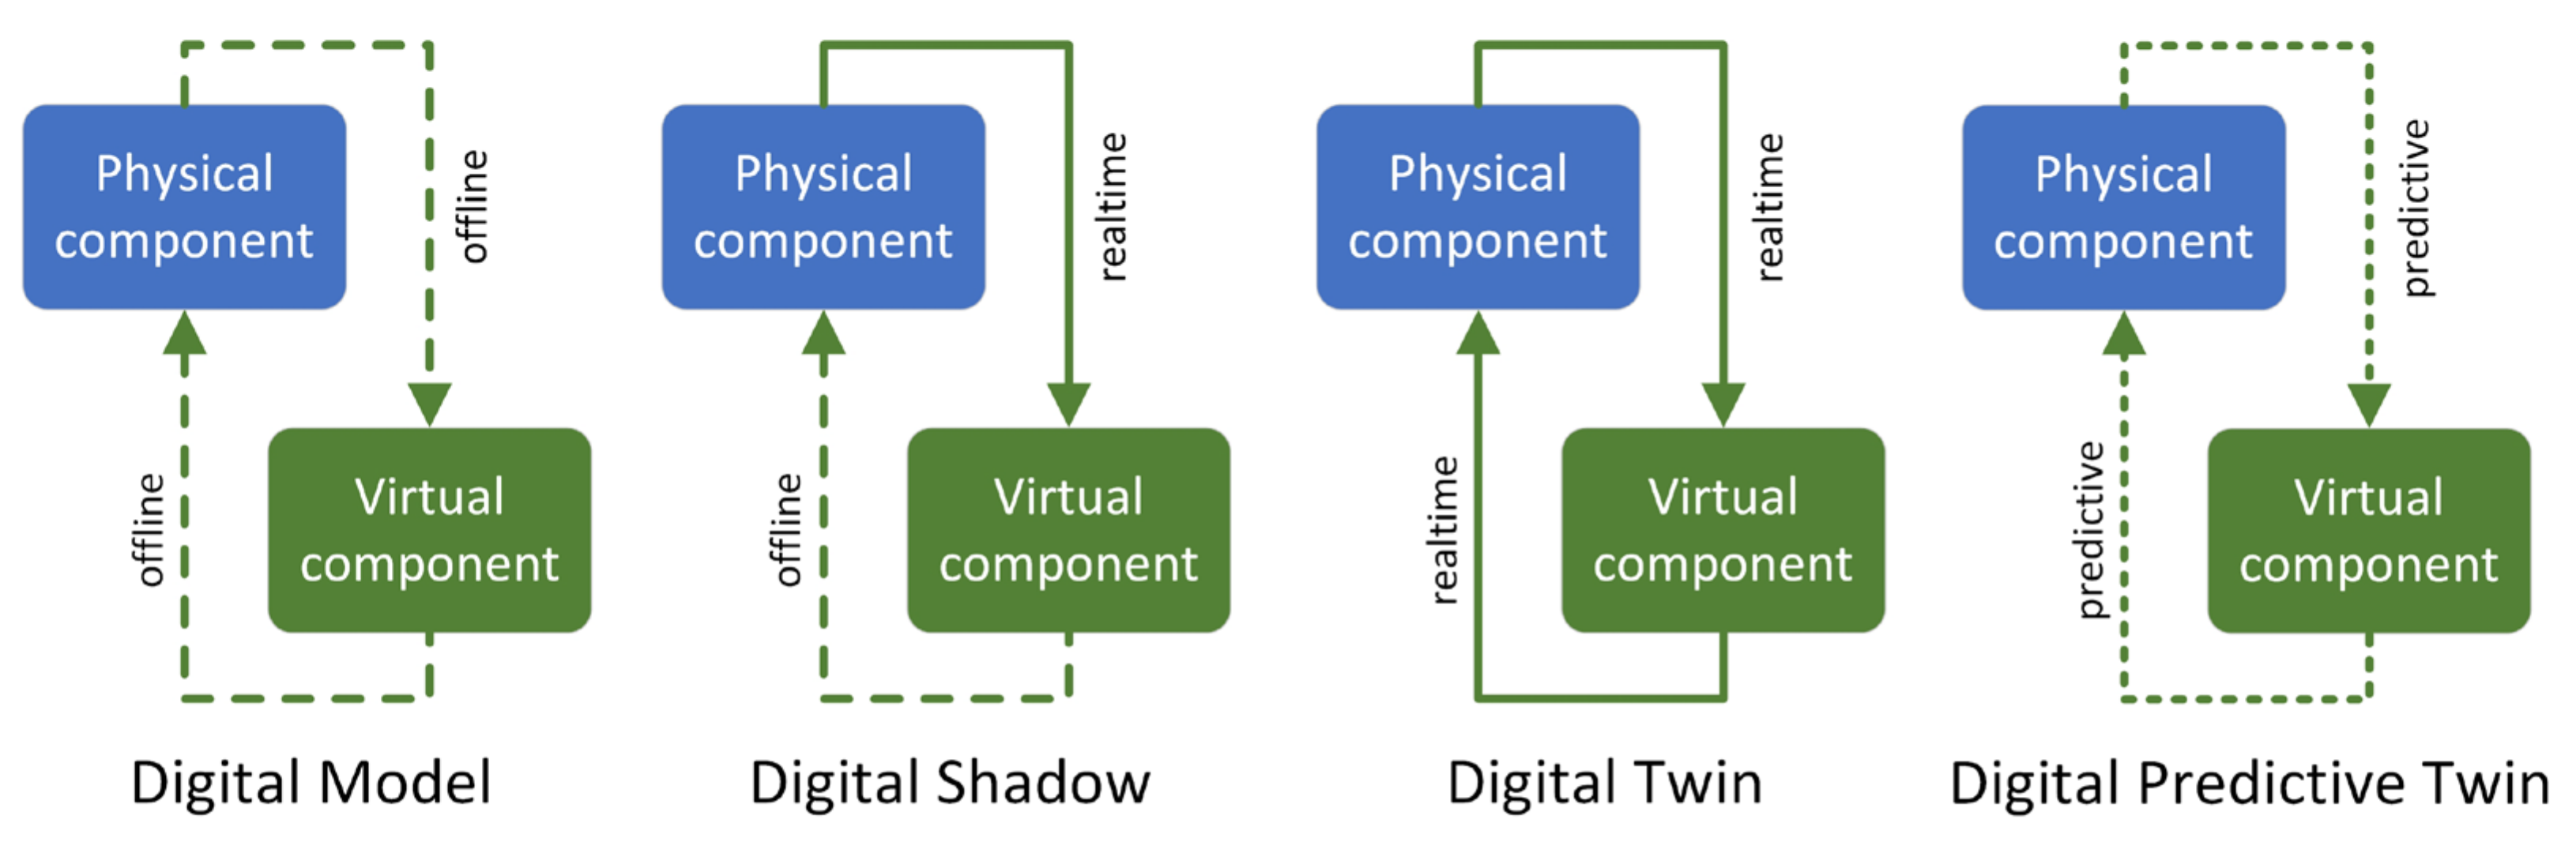
- The virtual representation is a digital reflection of the physical facility;
- The virtual component contains an abstracted model that is fitted as close as necessary to the physical component through the integration of measured values and domain knowledge;
- The level of integration and model abstraction can differ in each stage, depending on the application.
Author Contributions
Funding
Data Availability Statement
Conflicts of Interest
Abbreviations
| 3D | three-dimensional |
| 5D | five-dimensional |
| Bio-SNG | biomass-based synthetic natural gas produced via gasification and methanation |
| CH4 | methane |
| CO2 | carbon dioxide |
| CO2-eq | carbon dioxide equivalent |
| DT | digital twin |
| EU | European Union |
| FTP | file transfer protocol |
| GDP | gross domestic product |
| GRP | gross regional product |
| ISO | International Organization for Standardization |
| H2O | water |
| Horizon 2020 | framework program funding research, technological development and innovation |
| HTTP | hypertext transfer protocol |
| KPI | key performance indicators |
| LCA | lifecycle assessment |
| MRL | modeling readiness level |
| MQTT | message queuing telemetry transport |
| N2O | nitrous oxide |
| NASA | National Aeronautics and Space Administration |
| NOx | nitrous oxide (general form) |
| OPC UA | open platform communications unified architecture |
| OSI | open systems interconnection |
| P&ID | piping and instrumentation diagram |
| PAT | process analytical technology |
| PLC | programmable logic controller |
| PLM | product lifecycle management |
| RED II | Renewable Energy Directive |
| Ref. | reference |
| SCADA | supervisory control and data acquisition |
| SDG | sustainable development goals |
| SO2 | sulfur dioxide |
| SO2-eq | sulfur dioxide equivalent |
| SOx | sulfur oxide (general form) |
| TCP IP | transmission control protocol/internet protocol |
| TRL | technology readiness level |
| Symbols | |
| % | percent |
| a | number of years |
| FLH/a | full load hours per year |
| FU | functional unit |
| -eq | grams of phosphate equivalent |
| -eq | grams of sulfur dioxide equivalent |
| -DB-eq | kilograms of dichlorobenzene equivalent |
| -eq | kilograms of carbon dioxide equivalent |
| kilograms of water | |
| kilograms of non-methane volatile organic compounds | |
| -eq | kilograms of particulate matter equivalent with a particle size smaller than 10 μm |
| R-11-eq | kilograms of trichlorofluoromethane equivalent |
| -eq | kilograms of antimony equivalents |
| kilowatt hours of electrical energy | |
| square meter | |
| megajoule | |
| megawatt | |
References
- Mertens, P.; Barbian, D.; Baier, S. Digitalisierung und Industrie 4.0—Eine Relativierung; Springer: Wiesbaden, Germany, 2017. [Google Scholar] [CrossRef]
- Hofmann, R.; Halmschlager, V.; Knöttner, S.; Leitner, B.; Pernsteiner, D.; Prendl, L.; Sejkora, C.; Steindl, G.; Traupmann, A. Digitalization in Industry—An Austrian Perspective; TU Wien: Vienna, Austria, 2020. [Google Scholar]
- European Union. 2030 Climate and Energy Policy Framework. Brussels, Belgium. 2014. Available online: https://climate.ec.europa.eu/eu-action/climate-strategies-targets/2030-climate-energy-framework_en (accessed on 12 October 2022).
- European Union. Directive (EU) 2018/2001 of the European Parliament and of the Council of 11 December 2018 on the Promotion of the Use of Energy from Renewable Sources, RED II. Official Journal of the European Union. 2018. Available online: https://eur-lex.europa.eu/legal-content/DE/TXT/PDF/?uri=CELEX:32018L2001&from=EN (accessed on 12 October 2022).
- O’Dwyer, E.; Pan, I.; Acha, S.; Shah, N. Smart energy systems for sustainable smart cities: Current developments, trends and future directions. Appl. Energy 2019, 237, 581–597. [Google Scholar] [CrossRef] [Green Version]
- Liu, Q.; Chen, J.; Liao, Y.; Mueller, E.; Jentsch, D.; Boerner, F.; She, M. An Application of Horizontal and Vertical Integration in Cyber-Physical Production Systems. In Proceedings of the 2015 International Conference on Cyber-Enabled Distributed Computing and Knowledge Discovery, Xi’an, China, 17–19 September 2015; pp. 110–113. [Google Scholar] [CrossRef]
- Borowski, P.F. Digitization, Digital Twins, Blockchain, and Industry 4.0 as Elements of Management Process in Enterprises in the Energy Sector. Energies 2021, 14, 1885. [Google Scholar] [CrossRef]
- Bentolila, M.; Alshanski, I.; Novoa, R.; Gilon, C. Optimization of Chemical Processes by the Hydrodynamic Simulation Method (HSM). ChemEngineering 2018, 2, 21. [Google Scholar] [CrossRef] [Green Version]
- Kritzinger, W.; Karner, M.; Traar, G.; Henjes, J.; Sihn, W. Digital Twin in manufacturing: A categorical literature review and classification. IFAC PapersOnLine 2018, 51, 1016–1022. [Google Scholar] [CrossRef]
- Grafinger, M. Virtuelle Produktentwicklung: Lecture Notes LVA 307.414; TU Wien, Institute of Engineering Design and Product Development: Vienna, Austria, 2020. [Google Scholar]
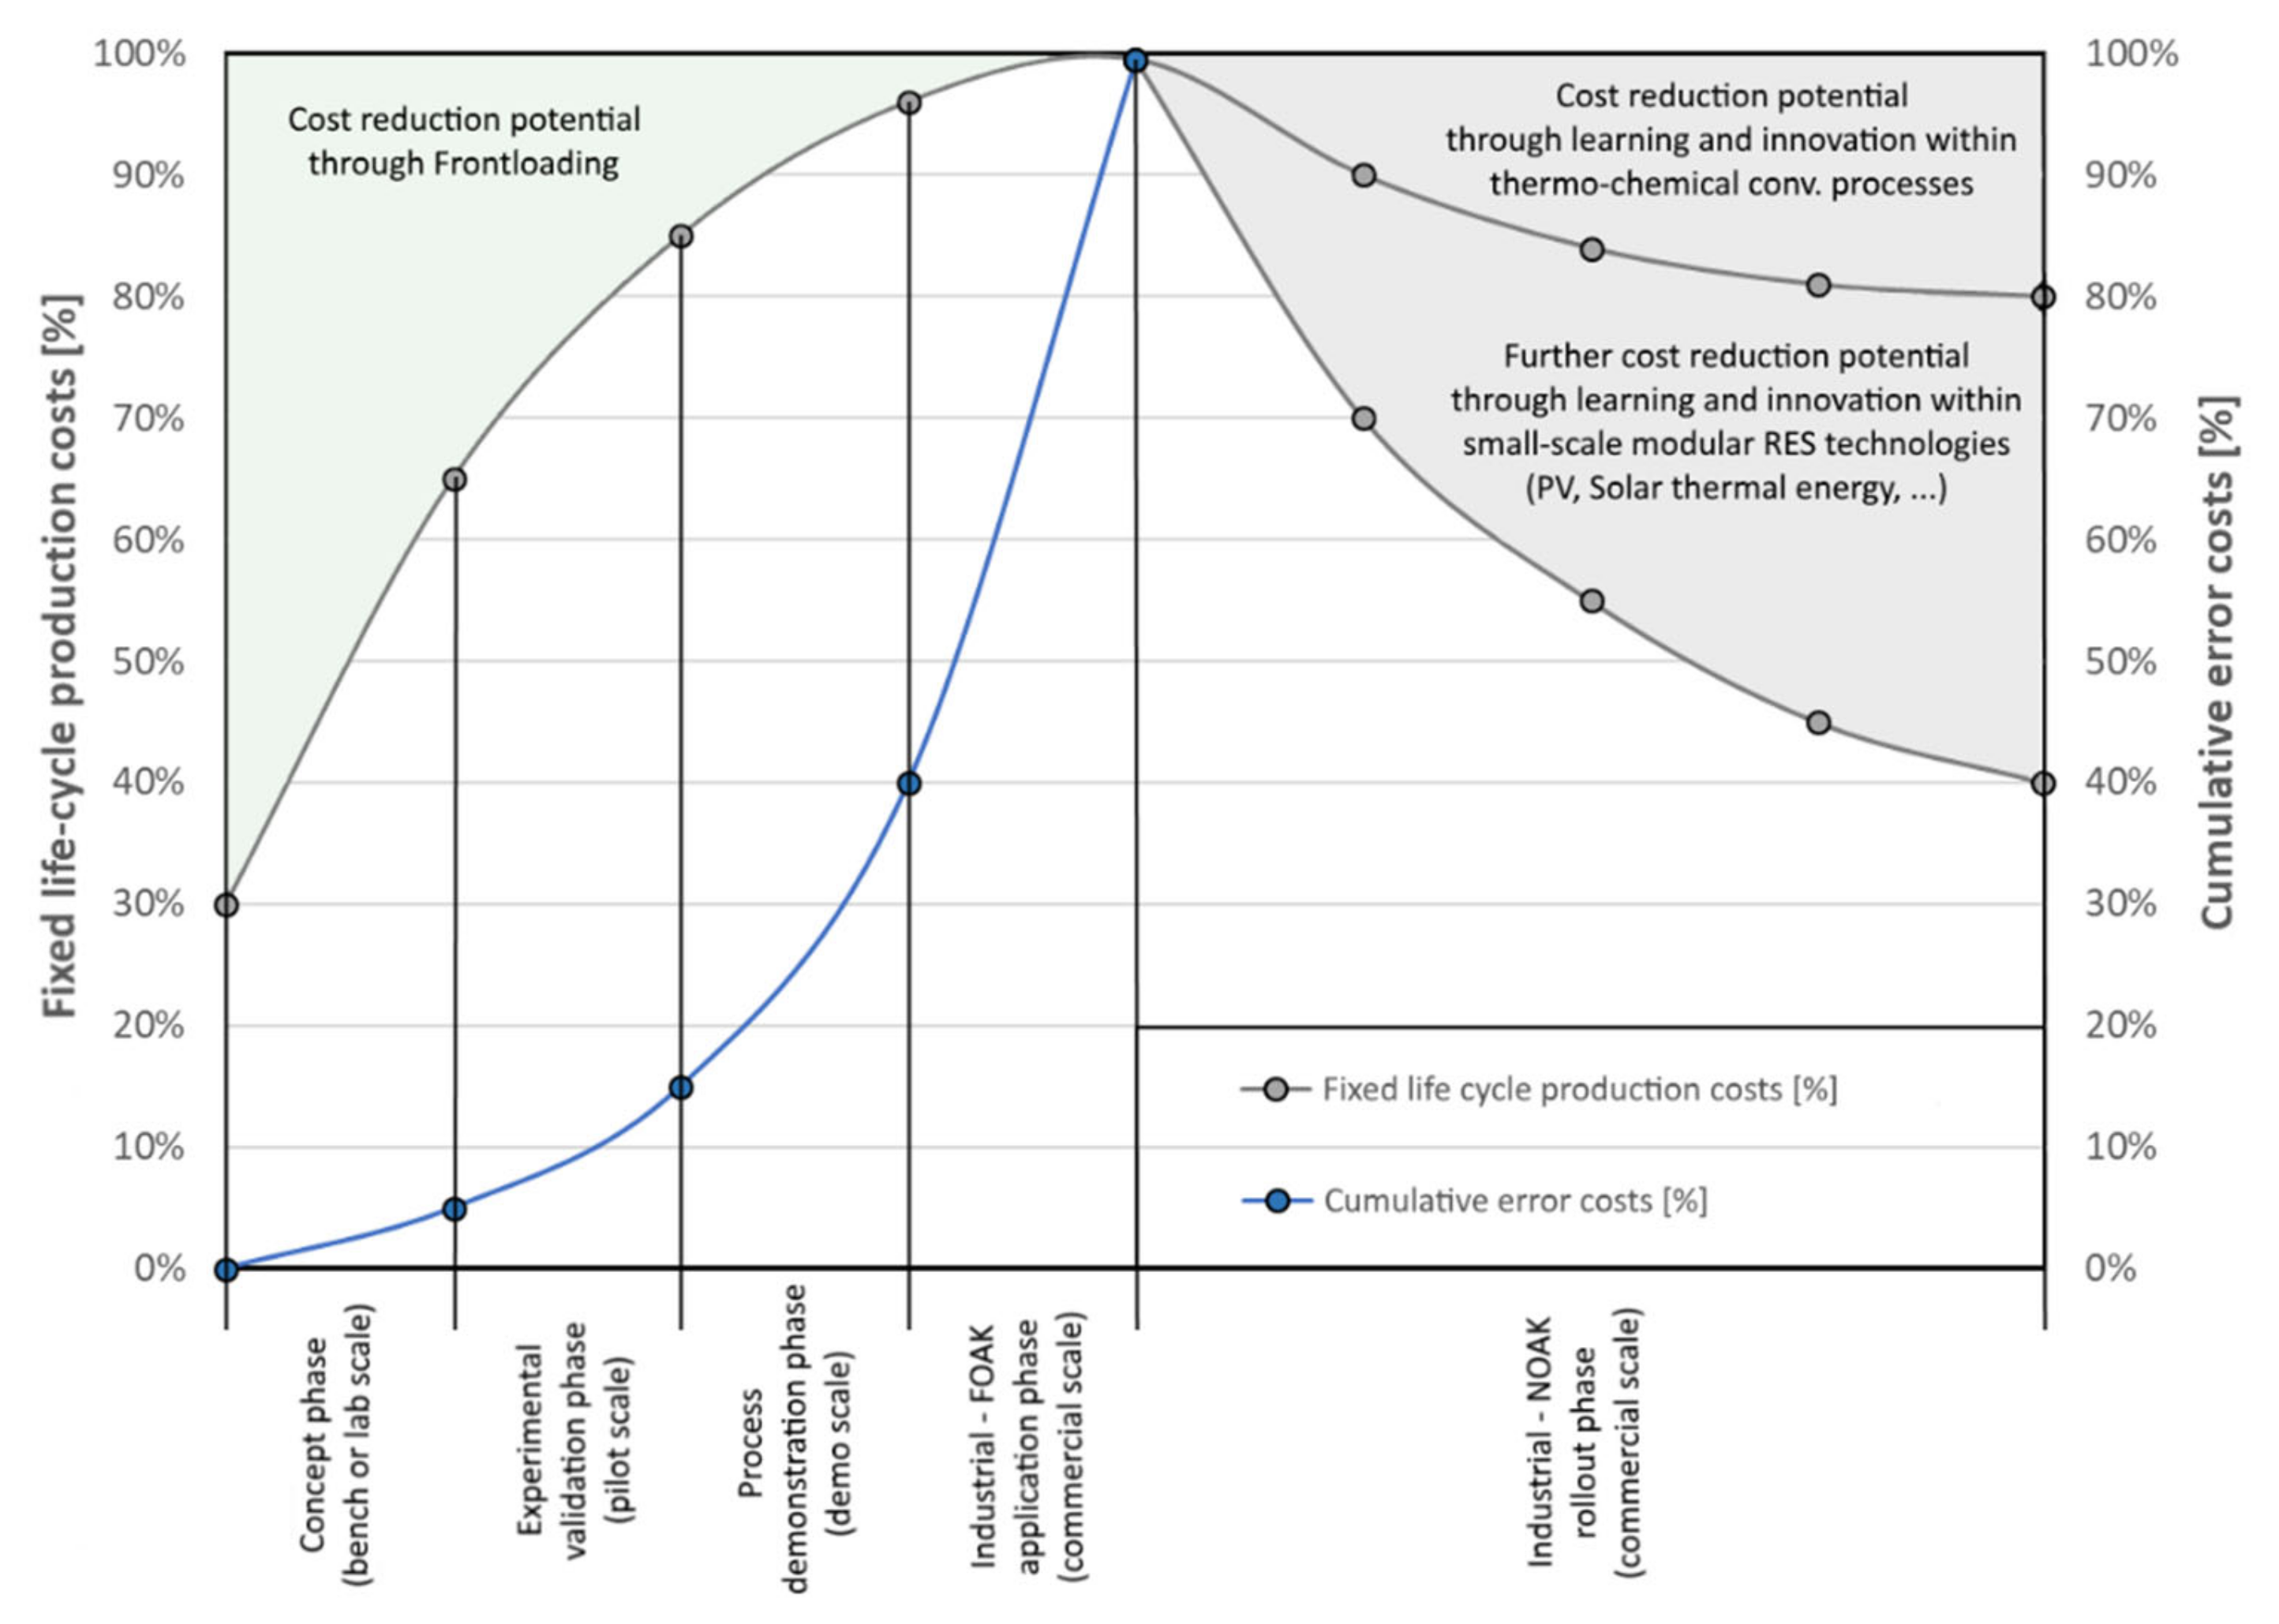
- Maniatis, K.; Landälv, I.; Waldheim, L.; van den Heuvel, E.; Kalligeros, S. Building Up the Future—Cost of Biofuel: Subgroup on Advanced Biofuels—Sustainable Transport Forum; European Commission: Brussels, Belgium, 2017. [Google Scholar] [CrossRef]
- Szeghő, K.; Bercsey, T. Kosten- und Risikomanagement in der frühen Phase der Produktentwicklung. In Proceedings of the 18th Symposium „Design for X“, Neukirchen/Erlangen, Germany, 11–12 October 2007. [Google Scholar]
- Ehrlenspiel, K.; Kiewert, A.; Lindemann, U.; Mörtl, M. Kostengünstig Entwickeln und Konstruieren: Kostenmanagement bei der Integrierten Produktentwicklung. Auflage; Springer: Berlin, Germany, 2020. [Google Scholar] [CrossRef]
- Schulte, R. Rechnergestütztes Normteilemanagement als Beitrag zu Einem Optimierten Produktionsplanungsprozess in der Automobilindustrie. Ph.D. Thesis, Fakultät für Maschinenbau, Helmut-Schmidt-Universität/Universität der Bundeswehr Hamburg, Hamburg, Germany, 2013. [Google Scholar]
- Leistner, B. Fahrwerkentwicklung und Produktionstechnische Integration ab der Frühen Produktentstehungsphase. In Wissenschaftliche Reihe Fahrzeugsystemdesign; Springer: Wiesbaden, Germany, 2019. [Google Scholar] [CrossRef]
- Weber, C.; Husung, S.; Cascini, G.; Cantamessa, M.; Marjanovic, D.; Rotini, F. Product Modularisation, Product Archi-tecture, Systems Engineering, Product Service Systems. In Proceedings of the 20th International Conference on Engineering Design (ICED15), Politecnico di Milano, Politecnico di Torino, Design Society, Milan, Italy, 27–30 July 2015; ISBN 978-1-904670-70-4. [Google Scholar]
- Resch, G.; Kranzl, L.; Faninger, G.; Geipel, J. Block 1: Introduction: Energy & Climate Challenge and Basics of Economic Assessment. Lecture Notes Economic Perspectives of Renewable Energy Systems; TU Wien, Institute of Energy Systems and Electrical Drives: Vienna, Austria, 2020. [Google Scholar]
- Chau, C.K.; Leung, T.M.; Ng, W.Y. A review on Life Cycle Assessment, Life Cycle Energy Assessment and Life Cycle Carbon Emissions Assessment on buildings. Appl. Energy 2015, 143, 395–413. [Google Scholar] [CrossRef]
- Tao, F.; Zhang, H.; Liu, A.; Nee, A.Y.C. Digital Twin in Industry: State-of-the-Art. IEEE Trans. Ind. Inform. 2018, 15, 2405–2415. [Google Scholar] [CrossRef]
- Liu, M.; Fang, S.; Dong, H.; Xu, C. Review of digital twin about concepts, technologies, and industrial applications. J. Manuf. Syst. 2021, 58, 346–361. [Google Scholar] [CrossRef]
- Chen, Y.; Yang, O.; Sampat, C.; Bhalode, P.; Ramachandran, R.; Ierapetritou, M. Digital Twins in Pharmaceutical and Biopharmaceutical Manufacturing: A Literature Review. Processes 2020, 8, 1088. [Google Scholar] [CrossRef]
- Jones, D.; Snider, C.; Nassehi, A.; Yon, J.; Hicks, B. Characterising the Digital Twin: A systematic literature review. CIRP J. Manuf. Sci. Technol. 2020, 29, 36–52. [Google Scholar] [CrossRef]
- Onile, A.E.; Machlev, R.; Petlenkov, E.; Levron, Y.; Belikov, J. Uses of the digital twins concept for energy services, intelligent recommendation systems, and demand side management: A review. Energy Rep. 2021, 7, 997–1015. [Google Scholar] [CrossRef]
- Aheleroff, S.; Xu, X.; Zhong, R.Y.; Lu, Y. Digital Twin as a Service (DTaaS) in Industry 4.0: An Architecture Reference Model. Adv. Eng. Inform. 2021, 47, 101225. [Google Scholar] [CrossRef]
- Qi, Q.; Tao, F. Digital Twin and Big Data Towards Smart Manufacturing and Industry 4.0: 360 Degree Comparison. IEEE Access 2018, 6, 3585–3593. [Google Scholar] [CrossRef]
- Liu, Q.; Liu, B.; Wang, G.; Zhang, C. A comparative study on digital twin models. AIP Conf. Proc. 2019, 2073, 020091. [Google Scholar] [CrossRef]
- Negri, E.; Fumagalli, L.; Macchi, M. A Review of the Roles of Digital Twin in CPS-based Production Systems. Procedia Manuf. 2017, 11, 939–948. [Google Scholar] [CrossRef]
- Holler, M.; Uebernickel, F.; Brenner, W. Digital Twin Concepts in Manufacturing Industries—A Literature Review and Avenues for Further Research. In Proceedings of the International Conference on Industrial Engineering, Seoul, Republic of Korea, 10–12 October 2016. [Google Scholar]
- Sharma, A.; Kosasih, E.; Zhang, J.; Brintrup, A.; Calinescu, A. Digital Twins: State of the art theory and practice, challenges, and open research questions. J. Ind. Inf. Integr. 2022, 30, 383. [Google Scholar] [CrossRef]
- Singh, M.; Fuenmayor, E.; Hinchy, E.P.; Qiao, Y.; Murray, N.; Devine, D. Digital Twin: Origin to Future. Appl. Syst. Innov. 2021, 4, 36. [Google Scholar] [CrossRef]
- Juarez, M.G.J.; Botti, V.J.; Giret, A.S. Digital Twins: Review and Challenges. J. Comput. Inf. Sci. Eng. 2021, 21, 030802. [Google Scholar] [CrossRef]
- Moreno, A.; Velez, G.; Ardanza, A.; Barandiaran, I.; de Infante, R.; Chopitea, R. Virtualisation process of a sheet metal punching machine within the Industry 4.0 vision. Int. J. Interact. Des. Manuf. 2017, 11, 365–373. [Google Scholar] [CrossRef]
- Lu, Y.; Liu, C.; Kevin, I.; Wang, K.; Huang, H.; Xu, X. Digital Twin-driven smart manufacturing: Connotation, reference model, applications and research issues. Robot. Comput. Integr. Manuf. 2020, 61, 101837. [Google Scholar] [CrossRef]
- Schluse, M.; Rossmann, J. From Simulation to Experimentable Digital Twins: Simulation-Based Development and Operation of Complex Technical Systems. In Proceedings of the 2016 IEEE International Symposium on Systems Engineering (ISSE), Edinburgh, UK, 3–5 October 2016; pp. 1–6. [Google Scholar] [CrossRef]
- Schluse, M.; Priggemeyer, M.; Atorf, L.; Rossmann, J. Experimentable Digital Twins—Streamlining Simulation-Based Systems Engineering for Industry 4. IEEE Trans. Ind. Inform. 2018, 14, 1722–1731. [Google Scholar] [CrossRef]
- Dahmen, U.; Rossmann, J. Experimentable Digital Twins for a Modeling and Simulation-Based Engineering Approach. In Proceedings of the 2018 IEEE International Systems Engineering Symposium (ISSE), Rome, Italy, 1–3 October 2018; pp. 1–8. [Google Scholar] [CrossRef]
- Uhlemann, T.H.-J.; Lehmann, C.; Steinhilper, R. The Digital Twin: Realizing the Cyber-Physical Production System for Industry 4. In Proceedings of the 24th CIRP Conference on Life Cycle Engineering, Kamakura, Japan, 8–10 March 2017; Volume 61, pp. 335–340. [Google Scholar] [CrossRef]
- Trabesinger, S.; Pichler, R.; Schall, D.; Gfrerer, R. Connectivity as a prior challenge in establishing CPPS on basis of heterogeneous IT-software environments. Procedia Manuf. 2019, 31, 370–376. [Google Scholar] [CrossRef]
- Yun, S.; Park, J.-H.; Kim, W.-T. Data-Centric Middleware Based Digital Twin Platform for Dependable Cyber-Physical Systems. In Proceedings of the 2017 Ninth International Conference on Ubiquitous and Future Networks (ICUFN), Milan, Italy, 4–7 July 2017; pp. 922–926. [Google Scholar]
- Smarslok, B.; Culler, A.; Mahadevan, S. Error Quantification and Confidence Assessment of Aerothermal Model Predictions for Hypersonic Aircraft. In Proceedings of the 53rd AIAA/ASME/ASCE/AHS/ASC Structures, Structural Dynamics and Materials Conference, Honolulu, Hawaii, 23–26 April 2012; p. 1817. [Google Scholar] [CrossRef] [Green Version]
- TU Wien. Pilotfabrik der TU Wien—Industrie 4.0. 2022. Available online: https://www.pilotfabrik.at/ (accessed on 13 October 2022).
- Pires, F.; Cachada, A.; Barbosa, J.; Moreira, A.P.; Leitao, P. Digital Twin in Industry 4.0: Technologies, Applications and Challenges. In Proceedings of the IEEE 17th International Conference on Industrial Informatics (INDIN), Helsinki, Finland, 22–25 July 2019; pp. 721–726. [Google Scholar] [CrossRef]
- Sierla, S.; Azangoo, M.; Fay, A.; Vyatkin, V.; Papakonstantinou, N. Integrating 2D and 3D Digital Plant Information Towards Automatic Generation of Digital Twins. In Proceedings of the 2020 IEEE 29th International Symposium on Industrial Electronics, Delft, The Netherlands, 17–19 June 2020; pp. 460–467. [Google Scholar] [CrossRef]
- Stark, R.; Damerau, T. Digital Twin. In CIRP Encyclopedia of Production Engineering; Springer: Berlin/Heidelberg, Germany, 2020. [Google Scholar] [CrossRef]
- Stark, R.; Fresemann, C.; Lindow, K. Development and operation of Digital Twins for technical systems and services. CIRP Ann. 2019, 68, 129–132. [Google Scholar] [CrossRef]
- Herwig, C.; Pörtner, R.; Möller, J. Digital twins: Applications to the Design and Optimization of Bioprocesses. In Advances in Biochemical Engineering, Biotechnology; Springer: Berlin/Heidelberg, Germany, 2021; Volume 177, ISBN 13:978-3030716554. [Google Scholar]
- Herwig, C.; Pörtner, R.; Möller, J. Tools and Concepts for Smart Biomanufacturing. In Advances in Biochemical Engineering, Biotechnology; Springer: Berlin/Heidelberg, Germany, 2021; Volume 176, ISBN 13:978-3030716592. [Google Scholar]
- Grieves, M. Digital Twin: Manufacturing Excellence through Virtual Factory Replication. White Paper. 2015. Available online: https://www.3ds.com/fileadmin/PRODUCTS-SERVICES/DELMIA/PDF/Whitepaper/DELMIA-APRISO-Digital-Twin-Whitepaper.pdf (accessed on 13 October 2022).
- Glaessgen, E.; Stargel, D. The Digital Twin Paradigm for Future NASA and U.S. Air Force Vehicles. In Proceedings of the 53rd AIAA/ASME/ASCE/AHS/ASC Structures, Structural Dynamics and Materials Conference, Honolulu, HI, USA, 23–26 April 2012. [Google Scholar] [CrossRef] [Green Version]
- Garetti, M.; Rosa, P.; Terzi, S. Life Cycle Simulation for the design of Product–Service Systems. Comput. Ind. 2012, 63, 361–369. [Google Scholar] [CrossRef]
- Rosen, R.; von Wichert, G.; Lo, G.; Bettenhausen, K.D. About The Importance of Autonomy and Digital Twins for the Future of Manufacturing. IFAC PapersOnLine 2015, 48, 567–572. [Google Scholar] [CrossRef]
- Gabor, T.; Belzner, L.; Kiermeier, M.; Beck, M.T.; Neitz, A. A Simulation-Based Architecture for Smart Cyber-Physical Systems. In Proceedings of the 2016 IEEE International Conference on Autonomic Computing (ICAC), Wuerzburg, Germany, 17–22 July 2016; pp. 374–379. [Google Scholar] [CrossRef]
- Liu, Z.; Meyendorf, N.; Mrad, N. The role of data fusion in predictive maintenance using digital twin. AIP Conf. Proc. 2018, 1949, 020023. [Google Scholar] [CrossRef]
- Vrabič, R.; Erkoyuncu, J.A.; Butala, P.; Roy, R. Digital twins: Understanding the added value of integrated models for through-life engineering services. Procedia Manuf. 2018, 16, 139–146. [Google Scholar] [CrossRef]
- Srai, J.; Settanni, E.; Tsolakis, N.; Aulakh, P. Supply Chain Digital Twins: Opportunities and Challenges Beyond the Hype. In Proceedings of the 23rd Cambridge International Manufacturing Symposium 2019, Cambridge, UK, 26–27 September 2019. [Google Scholar] [CrossRef]
- Tuegel, E.; Ingraffea, A.R.; Eason, T.G.; Spottswood, S.M. Reengineering Aircraft Structural Life Prediction Using a Digital Twin. Int. J. Aerosp. Eng. 2011, 2011, 154798. [Google Scholar] [CrossRef] [Green Version]
- Qi, Q.; Tao, F.; Hu, T.; Anwer, N.; Liu, A.; Wei, Y.; Wang, L.; Nee, A. Enabling technologies and tools for digital twin. J. Manuf. Syst. 2019, 58, 3–21. [Google Scholar] [CrossRef]
- Güntner, G.; Hoher, S.; Eberle, M.; Glachs, D.; Kranzer, S.; Schäfer, G.; Schranz, C. Digital Twins im Anlagen-Lebenszyklus. Digitales Transferzentrum Salzburg. 2020. Available online: https://www.salzburgresearch.at/wp-content/uploads/2020/09/Digital_Twin_WP-final-1.pdf (accessed on 13 October 2022).
- Boschert, S.; Heinrich, C.; Rosen, R. Next Generation Digital Twin. In Proceedings of the 12th International Symposium on Tools and Methods of Competitive Engineering (TMCE), Las Palmas de Gran Canaria, Spain, 7–11 May 2018; pp. 209–218, ISBN 978-94-6186-910-4. [Google Scholar]
- Boschert, S.; Rosen, R. Digital Twin—The Simulation Aspect. In Mechatronic Futures; Hehenberger, P., Bradley, D., Eds.; Springer International Publishing: Cham, Switzerland, 2016; pp. 59–74. [Google Scholar] [CrossRef]
- Müller, S.; Schmid, J.C.; Hofbauer, H. Holzgas—Wärme, Strom, Gas und Treibstoffe aus Biomasse. In Energie, Versorgung, Sicherheit; Pfemeter, C., Liptay, P., Eds.; Österreichischer Biomasse-Verband: Vienna, Austria, 2017; pp. 59–61. Available online: http://hdl.handle.net/20.500.12708/29656 (accessed on 13 October 2022).
- International Electrotechnical Commission. IEC 62264: Enterprise-Control System Integration. 2020. Available online: https://webstore.iec.ch/publication/59706 (accessed on 13 October 2022).
- Lamb, K. Principle-Based Digital Twins: A Scoping Review; Centre for Digital Built Britain: Cambridge, UK, 2019. [Google Scholar] [CrossRef]
- Bolton, A.; Blackwell, B.; Dabson, I.; Enzer, M.; Evans, M.; Fenemore, T.; Harradence, F.; Keaney, E.; Kemp, A.; Luck, A.; et al. The Gemini Principles: Guiding Values for the National Digital Twin and Information Management Framework; University of Cambridge: Cambridge, UK, 2018; p. 15. [Google Scholar] [CrossRef]
- Uhlenkamp, J.-F.; Hribernik, K.A.; Wellsandt, S.; Thoben, K.-D. Digital Twin Applications: A First Systemization of Their Dimensions. In Proceedings of the IEEE International Conference on Engineering, Technology and Innovation (ICE/ITMC), Valbonne Sophia-Antipolis, France, 17–19 June 2019; pp. 1–8. [Google Scholar] [CrossRef]
- Fuller, A.; Fan, Z.; Day, C.; Barlow, C. Digital Twin: Enabling Technologies, Challenges and Open Research. IEEE Access 2020, 8, 108952–108971. [Google Scholar] [CrossRef]
- Müller, S.; Fuchs, J.; Schmid, J.; Benedikt, F.; Hofbauer, H. Experimental development of sorption enhanced reforming by the use of an advanced gasification test plant. Int. J. Hydrogen Energy 2017, 42, 29694–29707. [Google Scholar] [CrossRef]
- Müller, S.; Groß, P.; Rauch, R.; Zweiler, R.; Aichernig, C.; Fuchs, M.; Hofbauer, H. Production of diesel from biomass and wind power—Energy storage by the use of the Fischer-Tropsch process. Biomass Convers. Biorefinery 2017, 8, 275–282. [Google Scholar] [CrossRef]
- Pratschner, S.; Hammerschmid, M.; Müller, F.J.; Müller, S.; Winter, F. Simulation of a Pilot Scale Power-to-Liquid Plant Producing Synthetic Fuel and Wax by Combining Fischer–Tropsch Synthesis and SOEC. Energies 2022, 15, 4134. [Google Scholar] [CrossRef]
- Lunzer, A.; Kraft, S.; Müller, S.; Hofbauer, H. CPFD simulation of a dual fluidized bed cold flow model. Biomass- Convers. Biorefinery 2021, 11, 189–203. [Google Scholar] [CrossRef]
- Hammerschmid, M.; Müller, S.; Fuchs, J.; Hofbauer, H. Evaluation of biomass-based production of below zero emission reducing gas for the iron and steel industry. Biomass Convers. Biorefinery 2021, 11, 169–187. [Google Scholar] [CrossRef]
- Müller, S.; Theiss, L.; Fleiß, B.; Hammerschmid, M.; Fuchs, J.; Penthor, S.; Rosenfeld, D.C.; Lehner, M.; Hofbauer, H. Dual fluidized bed based technologies for carbon dioxide reduction—Example hot metal production. Biomass Convers. Biorefinery 2021, 11, 159–168. [Google Scholar] [CrossRef]
- Joshi, R.; Didier, P.; Jimenez, J.; Carey, T. The Industrial Internet of Things Volume G5: Connectivity Framework, Technical Report IIC:PUB:G5:V1.01:PB. Industrial Internet Consortium. 2017. Available online: https://www.iiconsortium.org/pdf/IIC_PUB_G5_V1.0_PB_20170228.pdf (accessed on 13 October 2022).
- Schleich, B.; Anwer, N.; Mathieu, L.; Wartzack, S. Shaping the digital twin for design and production engineering. CIRP Ann. 2017, 66, 141–144. [Google Scholar] [CrossRef] [Green Version]
- International Electrotechnical Commission. IEC 61508: Functional Safety of Electrical/Electronic/Programmable Electronic Safety-Related Systems. Available online: https://webstore.iec.ch/publication/5515 (accessed on 13 October 2022).
- Sinnott, R.; Towler, G. Chemical Engineering Design, 6th ed.; Coulson & Richardson’s Chemical Engineering Series; Butterworth-Heinemann: Oxford, UK, 2020; ISBN 9780081026007. [Google Scholar]
- Harmsen, J. Industrial Process Scale-Up: A Practical Innovation Guide from Idea to Commercial Implementation, 2nd ed.; Elsevier: Amsterdam, The Netherlands, 2019. [Google Scholar] [CrossRef]
- ROI-EFESO. Management Consulting AG, Measurement and Evaluation of the Digitization Maturity Levels (IoT Scan) and Roadmap. 2021. Available online: https://www.roi-international.com/management-consulting/competences/increased-efficiency-through-digitisation-industry-40/digitization-maturity-levels (accessed on 30 December 2021).
- AUVA. Explosionsschutz—Sicherheitsinformation für Führungskräfte. Merkblatt, Vienna. 2017. Available online: https://www.auva.at/cdscontent/load?contentid=10008.647857&version=1519986334 (accessed on 13 October 2022).
- Common Criteria Editorial Board. Common Criteria for Information Technology Security Evaluation. CCMB-2006-09-001. 2006. Available online: https://www.commoncriteriaportal.org/files/ccfiles/CCPART1V3.1R1.pdf (accessed on 13 October 2022).
- European Commission. Information Technology Security Evaluation Criteria (ITSEC)—Provisional Harmonized Criteria; Directorate-General for the Information Society and Media, Document COM(90) Office for Official Publications of the European Communities: Brussels, Belgium, 1992; ISBN 92-826-3004-8. [Google Scholar]
- Department of Defense Computer Security Center. Department of Defense Trusted Computer System Evaluation Criteria. Orange Book. 1985. Available online: https://csrc.nist.gov/csrc/media/publications/conference-paper/1998/10/08/proceedings-of-the-21st-nissc-1998/documents/early-cs-papers/dod85.pdf (accessed on 13 October 2022).
- Global Compact Network Austria. Sustainable Development Goals—SDGs. 2016. Available online: https://globalcompact.at/sustainable-development-goals (accessed on 13 October 2022).
- European Commission. Regulation (EU) 2020/852 of the European Parliament and of the Council of 18 June 2020 on the Establishment of a Framework to Facilitate Sustainable Investment, and Amending Regulation (EU) 2019/2088. Official Journal of the European Union. 2020. Available online: https://eur-lex.europa.eu/eli/reg/2020/852/oj (accessed on 13 October 2022).
- Bardos, R.P.; Thomas, H.F.; Smith, J.W.N.; Harries, N.D.; Evans, F.; Boyle, R.; Howard, T.; Lewis, R.; Thomas, A.O.; Dent, V.L.; et al. Sustainability assessment framework and indicators developed by SuRF-UK for land remediation option appraisal. Remediat. J. 2020, 31, 5–27. [Google Scholar] [CrossRef]
- DIN EN ISO 14040:2021-02; Umweltmanagement_-Ökobilanz_-Grundsätze und Rahmenbedingungen (ISO_14040:2006_+ Amd_1:2020); Deutsche Fassung EN_ISO_14040:2006_+ A1:2020. Beuth Verlag GmbH: Berlin, Germany, 2021. [CrossRef]
- DIN EN ISO 14044:2021-02; Umweltmanagement_-Ökobilanz_-Anforderungen und Anleitungen (ISO_14044:2006_+ Amd_1:2017_+ Amd_2:2020); Deutsche Fassung EN_ISO_14044:2006_+ A1:2018_+ A2:2020. Beuth Verlag GmbH: Berlin, Germany, 2021. [CrossRef]
- Bartik, A.; Benedikt, F.; Lunzer, A.; Walcher, C.; Müller, S.; Hofbauer, H. Thermodynamic investigation of SNG production based on dual fluidized bed gasification of biogenic residues. Biomass Convers. Biorefinery 2020, 11, 95–110. [Google Scholar] [CrossRef]
- Hofbauer, H. Bewertung von Energiebereitstellungssystemen; Lecture Notes LVA 159.830 Brennstoff- und Energie-Technologie; TU Wien, Institute of Chemical, Environmental and Bioscience Engineering: Vienna, Austria, 2018. [Google Scholar]
- Pröll, T. Potenziale der Wirbelschichtdampfvergasung fester Biomasse—Modellierung und Simulation auf Basis der Betriebserfahrungen am Biomassekraftwerk Güssing. Ph.D. Thesis, TU Wien, Institute of Chemical, Environmental and Bioscience Engineering, Vienna, Austria, 2004. [Google Scholar]
- Kost, C.; Shammugam, S.; Jülch, V.; Nguyen, H.-T.; Schlegl, T. Stromgestehungskosten Erneuerbare Energien, Fraunhofer-Institut für solare Energiesysteme (ISE), Freiburg. 2018. Available online: https://www.ise.fraunhofer.de/content/dam/ise/de/documents/publications/studies/DE2018_ISE_Studie_Stromgestehungskosten_Erneuerbare_Energien.pdf (accessed on 13 October 2022).
- TEPPFA. Life Cycle Assessment: Polypropylene (PP-r) Pipe Systems vs. Copper Environmental Impact Comparison. Technical Report, Brussels. 2020. Available online: https://www.teppfa.eu/wp-content/uploads/LCA16_HC-Leaflet-PP-r-vs-Cu.pdf (accessed on 13 October 2022).
- Koch, D.; Paul, M.; Beisl, S.; Friedl, A.; Mihalyi, B. Life cycle assessment of a lignin nanoparticle biorefinery: Decision support for its process development. J. Clean. Prod. 2020, 245, 118760. [Google Scholar] [CrossRef]
- Bauer, C.; Hofer, J.; Althaus, H.-J.; Del Duce, A.; Simons, A. The environmental performance of current and future passenger vehicles: Life cycle assessment based on a novel scenario analysis framework. Appl. Energy 2015, 157, 871–883. [Google Scholar] [CrossRef]
- Wulf, C.; Kaltschmitt, M. Hydrogen Supply Chains for Mobility—Environmental and Economic Assessment. Sustainability 2018, 10, 1699. [Google Scholar] [CrossRef] [Green Version]
- Dreyer, L.C.; Niemann, A.L.; Hauschild, M.Z. Comparison of Three Different LCIA Methods: EDIP97, CML2001 and Eco-indicator. Int. J. Life Cycle Assess. 2003, 8, 191–200. [Google Scholar] [CrossRef]
- Rosenfeld, D.C.; Lindorfer, J.; Fazeni-Fraisl, K. Comparison of advanced fuels—Which technology can win from the life cycle perspective? J. Clean. Prod. 2019, 238, 117879. [Google Scholar] [CrossRef]
- Van Zelm, R.; Preiss, P.; van Goethem, T.; Van Dingenen, R.; Huijbregts, M. Regionalized life cycle impact assessment of air pollution on the global scale: Damage to human health and vegetation. Atmospheric Environ. 2016, 134, 129–137. [Google Scholar] [CrossRef] [Green Version]
- Sphera. GaBi Software with Built-In Database (DB). Chicago. 2022. Available online: https://gabi.sphera.com/austria/index/ (accessed on 13 October 2022).
- Mauerhofer, A.M. Carbon Utilization by Application of CO2 Gasification. Ph.D. Thesis, TU Wien, Institute of Chemical, Environmental and Bioscience Engineering, Vienna, Austria, 2020. [Google Scholar]
- Mauerhofer, A.M.; Müller, S.; Bartik, A.; Benedikt, F.; Fuchs, J.; Hammerschmid, M.; Hofbauer, H. Conversion of CO2 during the DFB biomass gasification process. Biomass Convers. Biorefinery 2021, 11, 15–27. [Google Scholar] [CrossRef]
- Hofbauer, H.; Mauerhofer, A.; Benedikt, F.; Hammerschmid, M.; Bartik, A.; Veress, M.; Haas, R.; Siebenhofer, M.; Resch, G. Reallabor zur Herstellung von Holzdiesel und Holzgas aus Biomasse und biogenen Reststoffen für die Land- und Forstwirtschaft; Technical Report; TU Wien, Institute of Chemical, Environmental and Bioscience Engineering: Vienna, Austria, 2020; Available online: https://dafne.at/projekte/ftsng-reallabor (accessed on 13 October 2022).
- Brown, D.R. Levelized Production Cost. An Alternative Form of Discounted Cash Flow Analysis. Cost Eng. 1994, 36, 13. Available online: https://www.researchgate.net/publication/255933212_Levelized_production_cost_An_alternative_form_of_discount-ed_cash_flow_analysis/citations (accessed on 13 October 2022).
- Brennan, D.J. Process Industry Economics: Principles, Concepts and Applications, 2nd ed.; Elsevier: San Diego, CA, USA, 2020; ISBN 9780128194669. [Google Scholar]
- Piazzi, S.; Zhang, X.; Patuzzi, F.; Baratieri, M. Techno-economic assessment of turning gasification-based waste char into energy: A case study in South-Tyrol. Waste Manag. 2020, 105, 550–559. [Google Scholar] [CrossRef]
- Goers, S.; Baresch, M.; Tichler, R.; Schneider, F. MOVE2—Simulation Model of the (Upper) Austrian Economy with a Special Focus on Energy Including the Socio-Economic Module MOVE2social: Integration of Income, Age and Gender; Technical Report; Energieinstitut an der Johannes-Keppler-Universität Linz: Linz, Austria, 2015; Available online: https://energieinstitut-linz.at/wp-content/uploads/2016/06/Macroeconometric-Simulation-Tool-MOVE2_MOVE2social_1.pdf (accessed on 13 October 2022).
- Arzoumanidis, I.; D’Eusanio, M.; Raggi, A.; Petti, L. Functional Unit Definition Criteria in Life Cycle Assessment and Social Life Cycle Assessment: A Discussion. In Perspectives on Social LCA: Contributions from the 6th International Conference; Traverso, M., Petti, L., Zamagni, A., Eds.; Springer: Berlin, Germany, 2019; pp. 1–10. [Google Scholar] [CrossRef]
- Héder, M. From NASA to EU: The evolution of the TRL scale in Public Sector Innovation. Innov. J. 2017, 22, 3. Available online: https://www.innovation.cc/discussion-papers/2017_22_2_3_heder_nasa-to-eu-trl-scale.pdf (accessed on 13 October 2022).
- Müller, S. Energy Technology Development for Industrial Application: Modelling-Based Development of Processes Enabling Reduced Fossil Carbon Dioxide Emissions by Advanced Digital Methods; Habilitationsschrift; TU Wien, Institute of Chemical, Environmental and Bioscience Engineering: Vienna, Austria, 2022. [Google Scholar]
- Bartik, A.; Fuchs, J.; Müller, S.; Hofbauer, H. Development of an Internally Circulating Fluidized Bed for Catalytic Methanation of Syngas. In Proceedings of the 16th Minisymposium Verfahrenstechnik and 7th Partikelforum 2020; Jordan, C., Ed.; TU Wien, Institute of Chemical, Environmental and Bioscience Engineering: Vienna, Austria, 2020. [Google Scholar] [CrossRef]
- Diem, R. Design, Construction and Startup of an Advanced 100 kW Dual Fluidized Bed System for Thermal Gasification. Ph.D. Thesis, TU Wien, Institute of Chemical, Environmental and Bioscience Engineering, Vienna, Austria, 2015. [Google Scholar]
- Mohan, C.; Alonso, G.; Gunthoer, R.; Mohan, K.; Reinwald, B. An Overview of the Exotica Research Project on Workflow MANAGEMENT Systems. 1995. Available online: https://www.semanticscholar.org/paper/An-Overview-of-the-Exotica-Research-Project-on-Mohan-Alonso/78df876ac42a772b52686353f8bb89b58244d444 (accessed on 13 October 2022).
- Pröll, T. Applied Modelling in Process Engineering and Energy Technology; Lecture Notes LVA 166.198; TU Wien, Institute of Chemical, Environmental and Bioscience Engineering: Vienna, Austria, 2020. [Google Scholar]
- Helal, S.; Hammer, J.; Zhang, J.; Khushraj, A. A Three-Tier Architecture for Ubiquitous Data Access. In Proceedings of the ACS/IEEE International Conference on Computer Systems and Applications, Beirut, Lebanon, 25–29 June 2002. [Google Scholar] [CrossRef] [Green Version]
- Heidrich, M.; Luo, J.J. Industrial Internet of Things: Referenzarchitektur für die Kommunikation; Whitepaper; Fraunhofer-Institut für Eingebettete Systeme und Kommunikationstechnik ESK: Munich, Germany, 2016; Available online: https://www.iks.fraunhofer.de/content/dam/iks/documents/whitepaper-iot.pdf (accessed on 13 October 2022).
- Ala-Laurinaho, R. Sensor Data Transmission from a Physical Twin to a Digital Twin. Master Thesis, School of Engineering, Aalto University, Aalto, Finland, 2019. Available online: https://www.researchgate.net/publication/343474433_Sensor_Data_Transmission_from_a_Physical_Twin_to_a_Digital_Twin (accessed on 13 October 2022).
- Rehling, B. Development of the 1 MW Bio-SNG Plant, Evaluation on Technological and Economical Aspects and Upscaling Considerations. Ph.D. Thesis, TU Wien, Institute of Chemical, Environmental and Bioscience Engineering, Vienna, Austria, 2012. [Google Scholar]
- Bakosch, C. Automatisierung des Basic Engineering einer Produktgasaufbereitungsstrecke für die Weitere Verwertung. Master Thesis, TU Wien, Institute of Chemical, Environmental and Bioscience Engineering, Vienna, Austria, 2021. [Google Scholar]
- Thunman, H.; Seemann, M.; Vilches, T.B.; Maric, J.; Pallares, D.; Ström, H.; Berndes, G.; Knutsson, P.; Larsson, A.; Breitholtz, C.; et al. Advanced biofuel production via gasification—Lessons learned from 200 man-years of research activity with Chalmers’ research gasifier and the GoBiGas demonstration plant. Energy Sci. Eng. 2018, 6, 6–34. [Google Scholar] [CrossRef]
- FFG. ADORe-SNG: Comprehensive Automation, Digitalisation & Optimization of Renewable & Sustainable SNG-Production. 2021. Available online: https://projekte.ffg.at/projekt/3862075 (accessed on 13 October 2022).
- Stanger, L.; Schirrer, A.; Benedikt, F.; Bartik, A.; Jankovic, S.; Müller, S.; Kozek, M. Dynamic modeling of dual fluidized bed steam gasification for control design. Energy 2023, 265, 126378. [Google Scholar] [CrossRef]
- Jankovic, S.; Hammerschmid, M.; Stanger, L.; Bartik, A.; Benedikt, F.; Müller, S. Design of a Digital Twin for a Pilot Plant for Synthetic Natural Gas Production. In Proceedings of the 7th Central European Biomass Conference (CEBC), Graz, Austria, 18–20 January 2023. [Google Scholar]
- Hammerschmid, M.; Aguiari, C.; Kirnbauer, F.; Zerobin, E.; Brenner, M.; Eisl, R.; Nemeth, J.; Buchberger, D.; Ogris, G.; Kolroser, R.; et al. Thermal Twin 4.0: Digital Support Tool for Optimizing Hazardous Waste Rotary Kiln Incineration Plants. Waste Biomass Valorization 2023, 1–22. [Google Scholar] [CrossRef]
- Nigitz, T.; Gölles, M.; Aichernig, C.; Schneider, S.; Hofbauer, H.; Horn, M. Increased efficiency of dual fluidized bed plants via a novel control strategy. Biomass Bioenergy 2020, 141, 105688. [Google Scholar] [CrossRef]
- Center for Future Energy Technologies, Pilotanlage für Wasserstoff aus Holz. 2022. Available online: https://www.cefet-strem.com/pilotanlage (accessed on 13 October 2022).


| Databases | ScienceDirect, Scopus, and Google Scholar |
|---|---|
| Article Type | Scientific articles published in peer-reviewed journals or conferences, white papers, and books |
| Search Strings | “digital twin”, “digital shadow”, “digital model“, “virtual representation”, “product avatar”, “cyber-physical equivalence”, “cyber-physical production system”, “virtual testbed” |
| Search Period | From January 2015 to June 2022 |
| Screening Procedure | The relevance of the articles examined was determined by reviewing the title, abstract, introduction, and conclusion. |
| Exclusion Criteria | Several publications were excluded for the following reasons:
|
| Classification Scheme | The selected publications were divided into five groups:
|
| No. | Year | Definition of Virtual Representation | Key Points | Field of Application | Ref. |
|---|---|---|---|---|---|
| 1 | 2003 | “The digital twin is a digital informational construct of a physical system, created as an entity on its own and linked with the physical system.” | Digital and physical system linked | Product lifecycle management | [21,48] |
| 2 | 2012 | “A Digital Twin is an integrated multi-physics, multi-scale, probabilistic simulation of a vehicle or system that uses the best available physical models, sensor updates, fleet history, etc., to mirror the life of its corresponding flying twin.” | Best available physical models | Aeronautics | [27,49] |
| 3 | 2012 | “The digital twin consists of a virtual representation of a production system that is able to run on different simulation disciplines that is characterized by the synchronization between the virtual and real system, thanks to sensed data and connected smart devices, mathematical models and real time data elaboration. The topical role within Industry 4.0 manufacturing systems is to exploit these features to forecast and optimize the behavior of the production system at each life cycle phase in real time.” | Different simulation disciplines, connected smart devices and real-time data elaboration, enabling forecasting and optimization of the system behavior within each lifecycle phase | Manufacturing | [27,50] |
| 4 | 2015 | “Very realistic models of the process current state and its behavior in interaction with the environment in the real world” | Realistic models to monitor the current state | Manufacturing | [27,51] |
| 5 | 2016 | “Virtual substitutes of real-world objects consisting of virtual representations and communication capabilities making up smart objects acting as intelligent nodes inside the internet of things and services” | Virtual substitutes with communication capabilities | Robotics | [34] |
| 6 | 2016 | “The simulation of the physical object itself to predict future states of the system.” | Prediction of future states of the system | Manufacturing | [52] |
| 7 | 2018 | “The digital twin is actually a living model of the physical asset or system, which continually adapts to operational changes based on the collected online data and information, and can forecast the future of the corresponding physical counterpart.” | Living model with continual adaptation to operational changes | Aircraft maintenance | [53] |
| 8 | 2018 | “A digital twin is a digital representation of a physical item or assembly using integrated simulations and service data. The digital representation holds information from multiple sources across the product life cycle. This information is continuously updated and is visualized in a variety of ways to predict current and future conditions, in both design and operational environments, to enhance decision making.” | Multiple sources across the lifecycle deliver information, enhancing decision-making by predicting functions | Product lifecycle management | [54] |
| 9 | 2019 | “Themes related to the Digital Twin are the decoupling between physical and cyber entity, the presence and frequency of sensorial data flows, the use of computer simulation, the control of cyber over physical entity, the co-evolution of physical and cyber entity as well as the co-existence of physical and cyber entity.” | Presence of sensorial data flows and co-evolution of physical and cyber entities | Manufacturing | [55] |
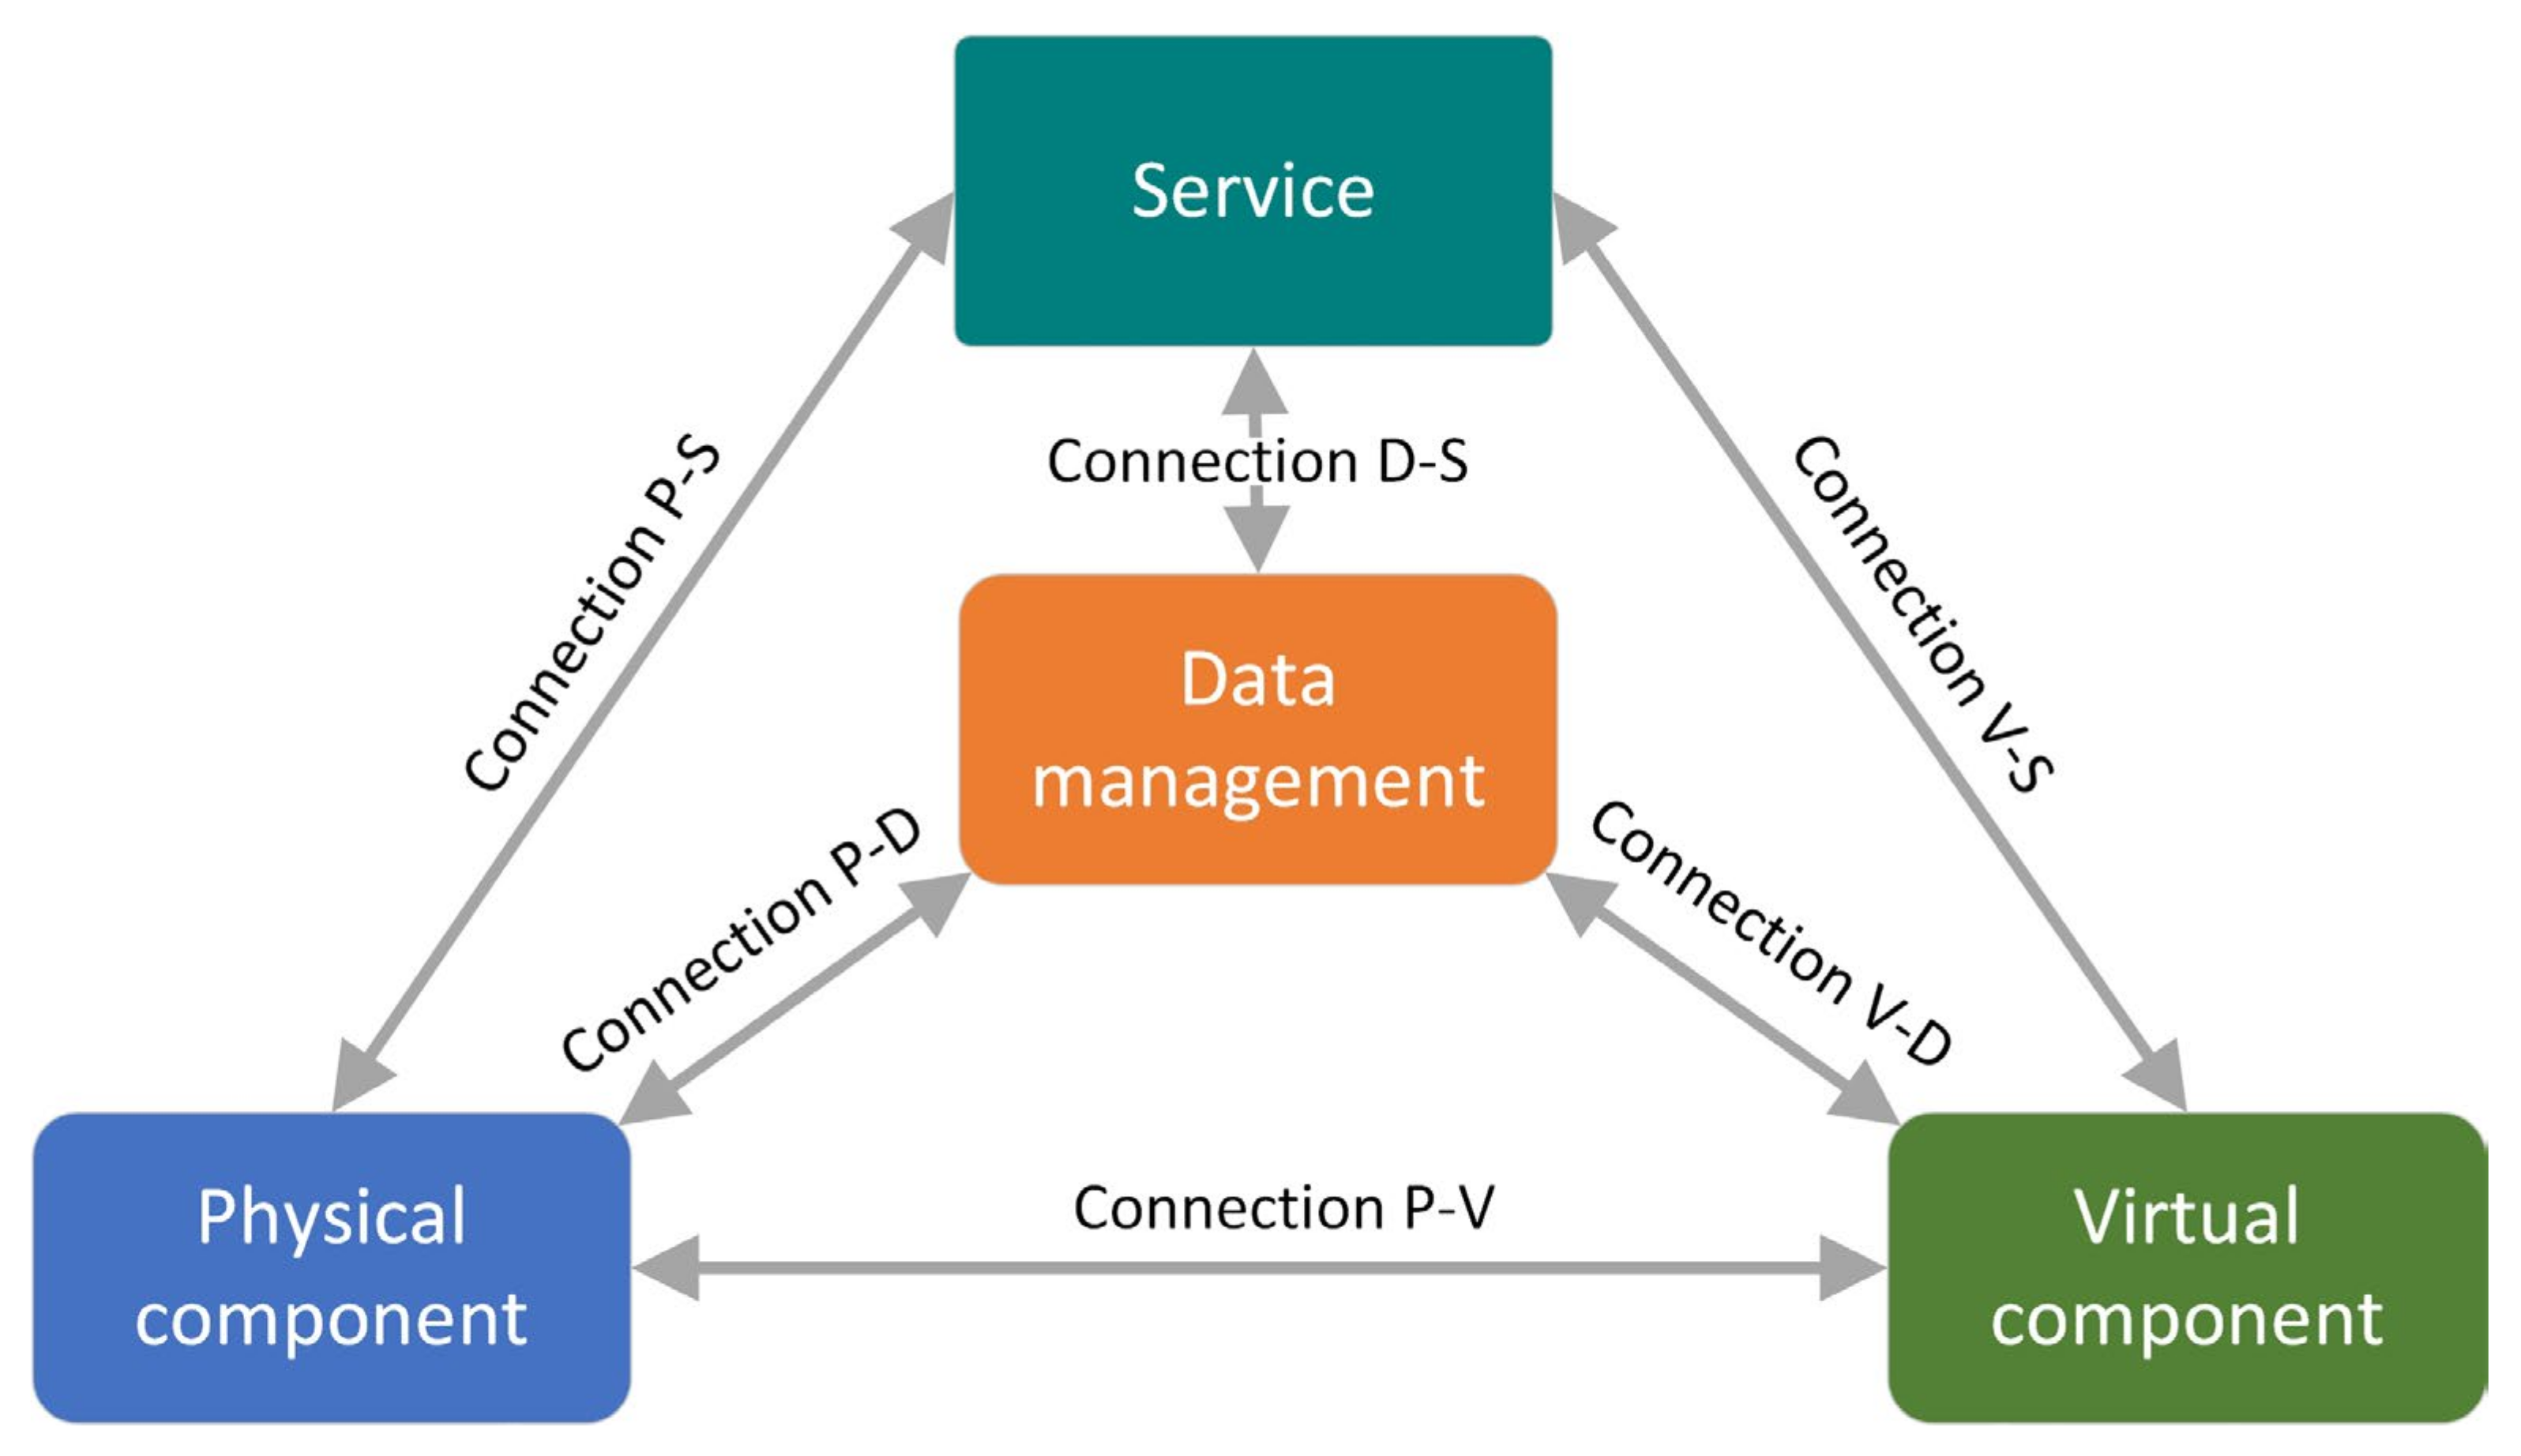
| 10 | 2019 | “A complete Digital Twin should include five dimensions: physical part, virtual part, connection, data, and service.” | Five digital twin dimensions | Industry | [19] |
| Virtual Representation Applications | Conceptual Design and Engineering | Construction and Commissioning | Operation | Maintenance | Optimization | Decommissioning | Ref. |
|---|---|---|---|---|---|---|---|
| Collaboration | cooperation with suppliers, experts and inter-divisional coordination | coordination supplier | coordination logistics | coordination of spare parts supply and supplier | collaboration with external experts | coordination reuse and disposal | [2,20,58,65] |
| Documentation | process lifecycle management for the state-of-the-art documentation | [20,28,30,58] | |||||
| Simulation and Monitoring | assistant for constructive and technical process design and construction | real-time performance | condition monitoring | reconfiguration and reconditioning | design of reuse | [2,22,27,58,66] | |
| Evaluation and Verification | holistic evaluation of process design and construction | quality control | fault diagnosis/anomaly detection | holistic optimization | evaluation of reuse and disposal | [2,20,25,58] | |
| Visualization | collision check and merchandising | construction assistant | support process understanding | visualization of 3D model or servicing plan | visualization of sustainability indicators | merchandising for reuse | [28,58] |
| Planning and Decision making | scheduling and support from design to commissioning | scheduling of operation and utility handling | proactive services | economic and ecologic dispatching | schedule for plant lifetime | [2,25,27,58] | |
| Emulation | risk assessment | virtual commissioning | support and training of plant operators and maintenance engineers | virtual decommissioning | [22,30,42,58] | ||
| Orchestration | automation of process design and construction | process automation | automated maintenance services | advanced control strategies | - | [2,20,21,58] | |
| Prediction | demand analysis and market prediction | stage of completion prediction | future performance | predictive maintenance | fault prediction of physical entities | prediction of a lifetime and residual value of physical entities | [20,21,25,58] |
| Property Classes | Focus | Property Levels | Ref. | |||
|---|---|---|---|---|---|---|
| Level 0: | Level 1: | Level 2: | Level 3: | |||
| Scalability | Overall | Equipment level | Plant level | Enterprise level | Energy system level | [73,74] |
| Interoperability | Comparable | Convertible | Standardized | [73,74] | ||
| Expansibility | Fixed layout | Adaptable layout | Automated layout | [74] | ||
| Functional safety | Systematic capability | Implemented redundancies | Predictable failure analysis | Automated replacement | [73,75] | |
| Technological scale-up possibility | Physical component | Modular | Partly scalable | Fully scalable | [76,77] | |
| Degree of automation | Manual | Semi-automated | Fully automated | [78] | ||
| Physical safety | Primary safety measures | Secondary safety measures | Tertiary safety measures | [79] | ||
| Virtual representation capability | Virtual component | Static/Quasistatic | Dynamic | Ad hoc | Predictive | [45,63] |
| Virtual representation fidelity | Black box | Gray box | White box | [45,74] | ||
| Virtual representation intelligence | Human triggered | Automated | Partial Autonomous | Autonomous (self-evolving) | [45,63] | |
| Connectivity mode | Data management and connection | Manual | Unidirectional | Bidirectional | Automatic | [45,63] |
| Data integration level | Manual | Semi-automated | Fully automated | [65] | ||
| Update frequency | Yearly/Monthly | Weekly/Daily | Hourly/every minute | Immediate real-time/event driven | [45,63,73] | |
| Cybersecurity | Role-based access control | Discretionary access protection | Mandatory access control | Verified access control | [73,80,81,82] | |
| Human interaction | Service | Smart devices | Virtual and Augmented Reality | Smart hybrid | [45,63] | |
| User focus | Single | Multiple without interaction of energy plant hierarchy layers | Multiple with fully interaction of energy plant hierarchy layers | [65] | ||
| Sustainability Indicators | Unit | Description | Ref. | ||
|---|---|---|---|---|---|
| Technical indicators | Conversion rate ** | % | Measuring the performance of a reactor or plant by observing the converted amount of a specific chemical compound during a reaction. | [76,88] | |
| Energetic efficiency | % | Measuring the performance of a technology by comparing the energy content of input and output streams. | [89] | ||
| Exergetic efficiency | % | Measuring the performance of a technology by considering the irreversibility of a process. | [90] | ||
| Plant lifetime | a | Measuring the usability period of a plant. | [89] | ||
| Plant availability | FLH/a | Measuring the degree of utilization per year of a reactor or plant by referring to an operation at nominal power. | [89,91] | ||
| Environmental indicators | Emissions to air | Global warming potential (e.g., CO2, CH4, N2O, etc.) | kg CO2-eq/FU * | Measuring the insulating effect of greenhouse gases in the atmosphere preventing the earth from losing heat gained from the sun. | [85,92,93,94,95,96,97] |
| Acidification potential (e.g., NOx, SOx, etc.) | g SO2-eq/FU * | Measuring emissions resulting in acid rain, which harms soil, water supplies, human and animal organisms, and the ecosystem. | [85,92,94,95,96] | ||
| Ground air quality (particulates, photochemical oxidants) | kg PM10-eq/FU * kg NMVOC/FU * | Measuring gaseous and solid emissions which affect the ground level atmosphere. | [85,92,94,95,96,98] | ||
| Ozone-depleting potential | kg R-11-eq/FU * | Measuring the depletion of the ozone layer in the atmosphere caused by the emission of, e.g., chemical foaming and cleaning agents. | [85,92,94,95,96] | ||
| Soil, ground and water conditions | Eutrophication | g PO42−-eq/FU * | Measuring concentrations of nitrates and phosphates, which can encourage excessive growth of algae and reduce oxygen levels within freshwater and marine water. | [92,93,94,95,96] | |
| Ecotoxicity | kg1,4-DB-eq/FU * | Measuring the potential for biological, chemical or physical stressors within freshwater, marine, or terrestrial ecosystems. | [94,96] | ||
| Water consumption | kg H2O/FU * | Measuring the amount of water consumed within a process. | [85,93,94] | ||
| Natural resources, utility consumption and waste production | Primary energy consumption—fossil | MJ/FU * | Measuring the total fossil energy demand of a process. | [97,99] | |
| Primary energy consumption—renewable | MJ/FU * | Measuring the total renewable energy demand of a process. | [97,99] | ||
| Electricity consumption | kWhel/FU * | Measuring the total electricity demand of a process. | [85,97] | ||
| Carbon utilization factor ** | % | Measuring the amount of carbon converted from the fuel to the product within a process. | [88,100,101] | ||
| Abiotic depletion | kg Sb-eq | Measuring the over-extraction of minerals, fossil fuels and other non-living, non-renewable materials which can lead to the exhaustion of natural resources. | [85,92,94] | ||
| Wastewater amount | kg H2O/FU * | Measuring the amount of wastewater produced within a process. | [85] | ||
| Solid waste amount (disposal) ** | kg ash/FU * | Measuring the amount of disposable waste produced within a process. | [85] | ||
| Land use | m2/FU * | Measuring the amount of land needed for the construction of a plant. | [85,94] | ||
| Economic indicators | Levelized production costs | EUR/FU * | Measuring the price that would be charged per functional unit to achieve a net present value of zero for an investment. | [17,71,95,102,103] | |
| Operating cash flow | EUR/a | Measuring the profit/losses generated over a specific time period during regular operation. | [17,71,102,104] | ||
| Net present value | EUR | Evaluates the technology investment by considering the time value of money. | [17,71,102,104] | ||
| Payback time | a | Measuring the time required for return of the technology investment by revenues. | [17,71,105] | ||
| Return on investment | % | Measuring the return of an investment by comparing profit and investment. | [104] | ||
| Gross domestic/regional product (GDP/GRP) | EUR | Measuring the added value created through energy production in a country (GDP) or considered region (GRP) within a certain period. | [85,106] | ||
| Social indicators | Human toxicity | kg1,4-DB-eq/FU * | Measuring the quantity of substances emitted to the environment that harm humans. | [85,93,94,95,96] | |
| Job creation | - | Measuring the number of jobs created by the erection of a new plant. | [85,106] | ||
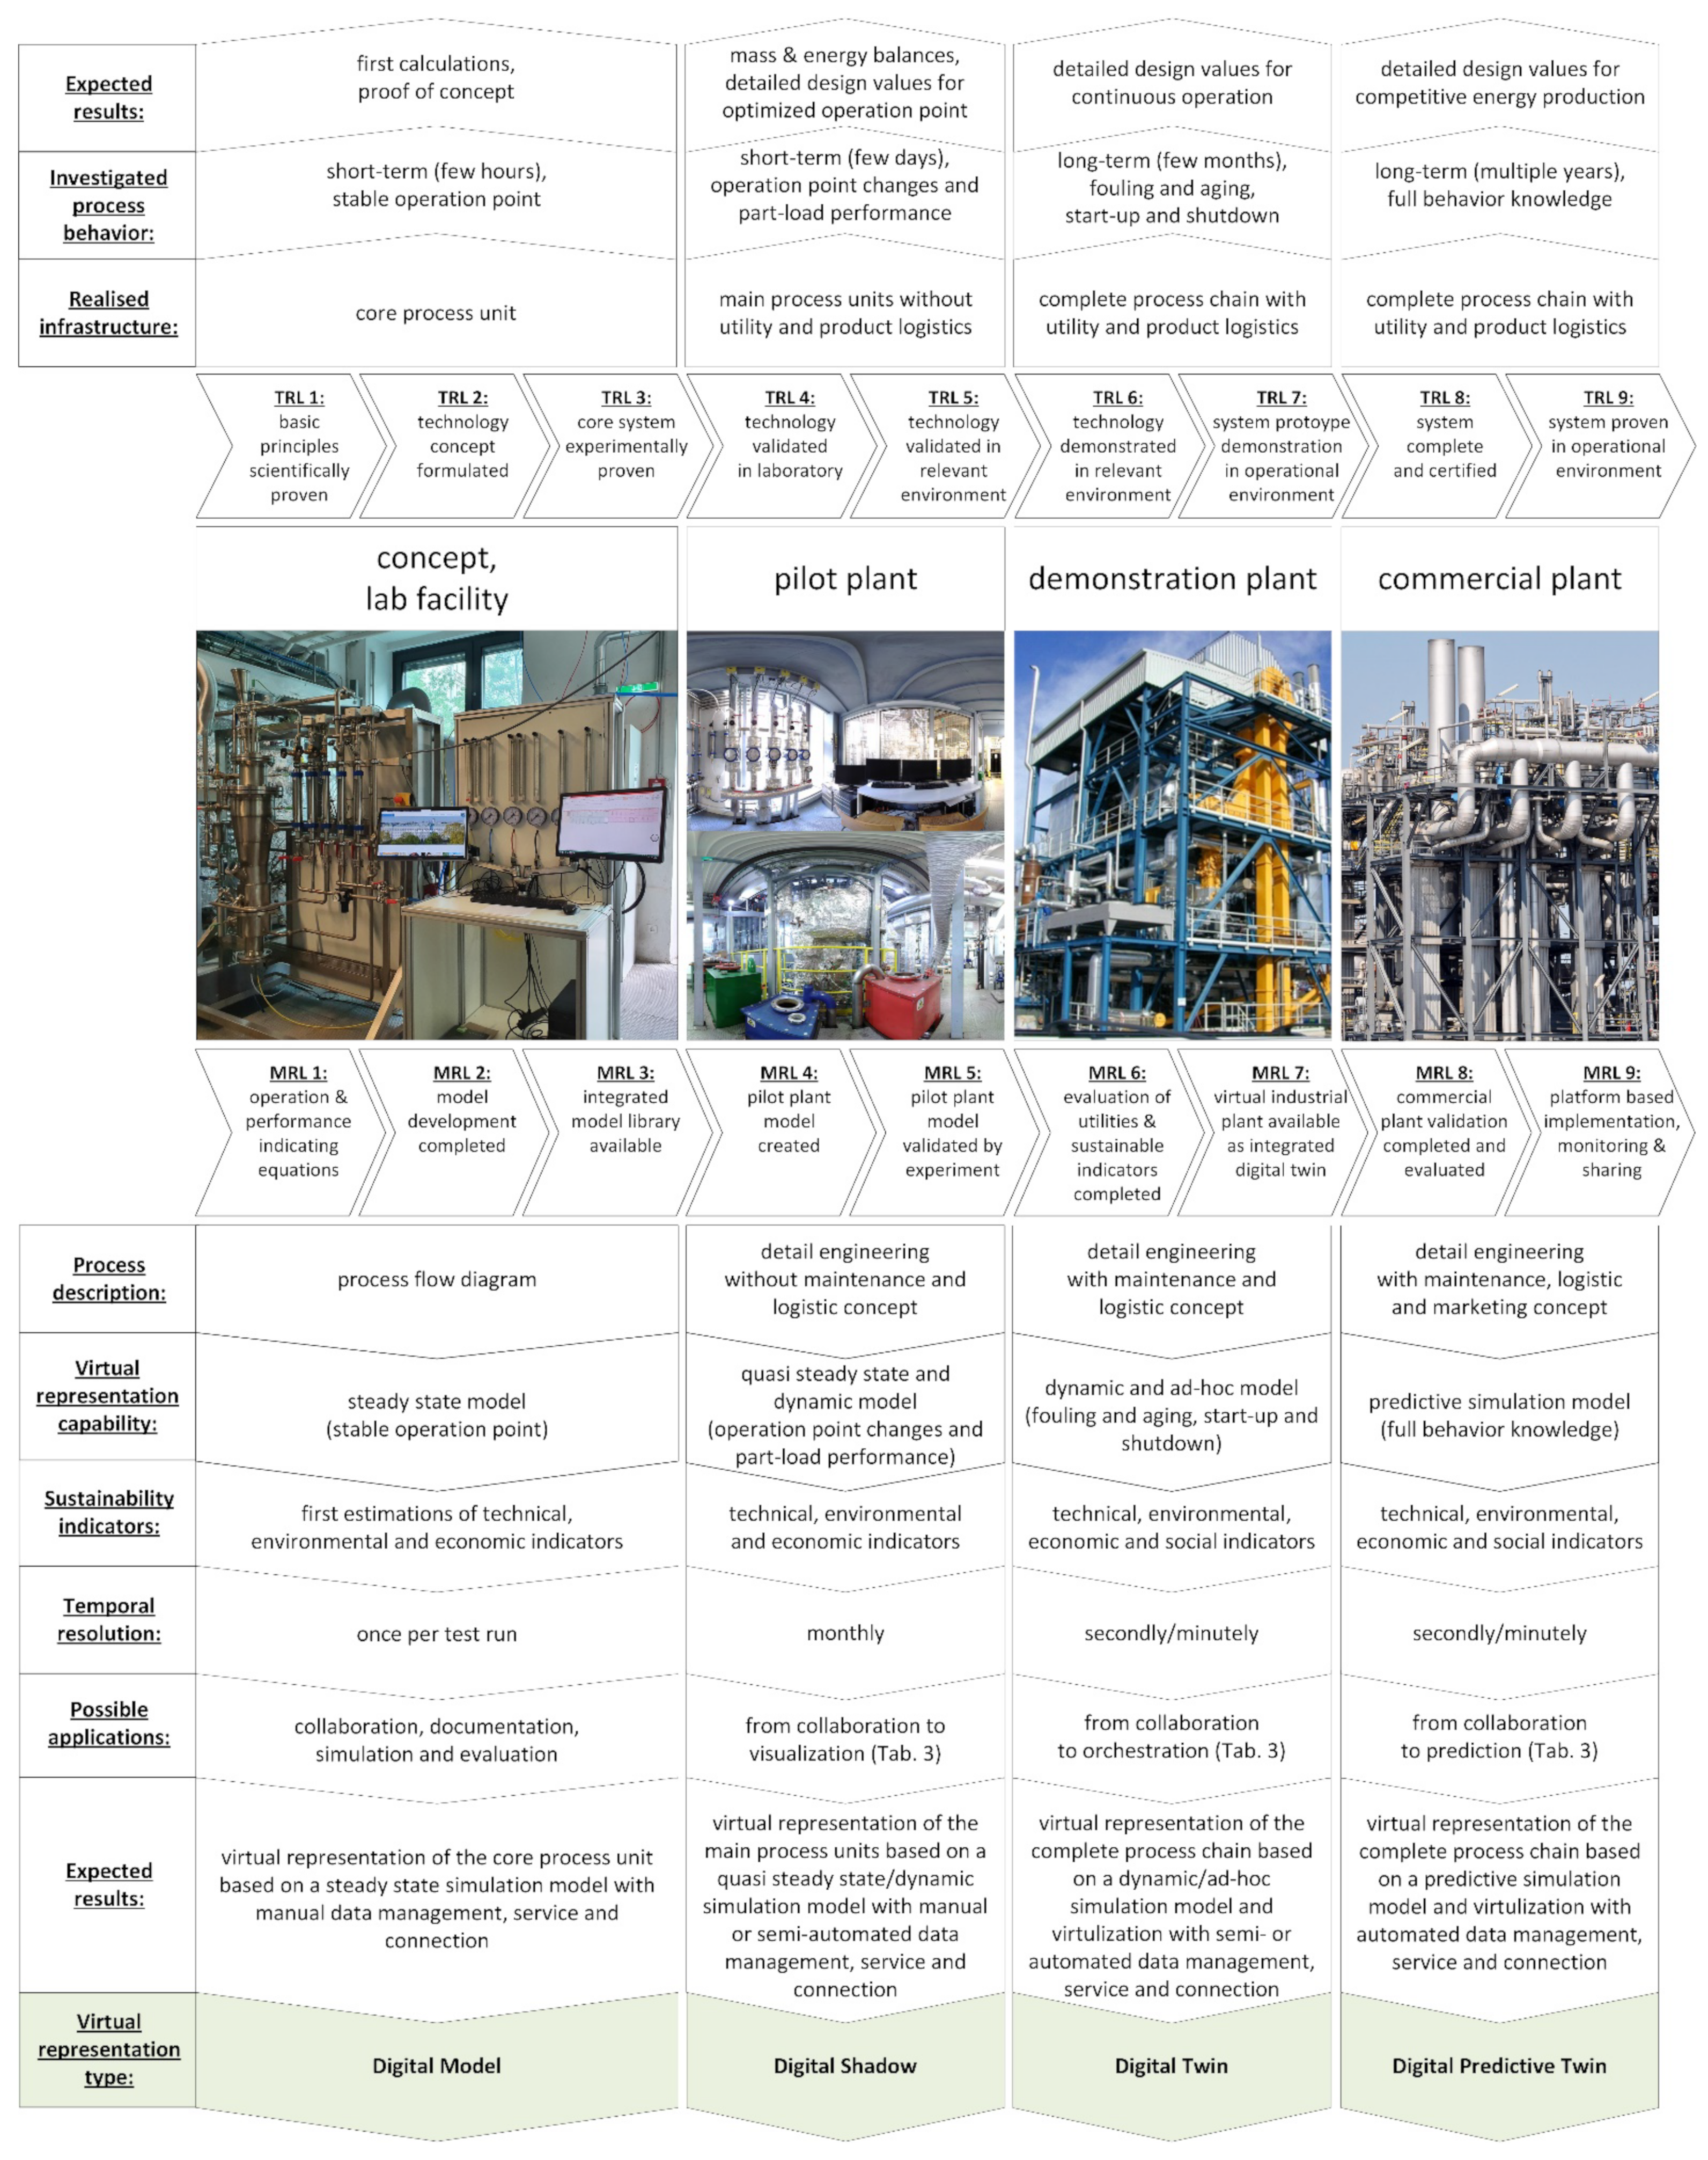
| Property Classes and Components | Focus | Concept, Lab Facility | Pilot Plant | Demonstration Plant | Commercial Plant |
|---|---|---|---|---|---|
| Scalability | Overall properties | Level 0: Equipment level | Level 1: Plant level | Level 2: Enterprise level | Level 3: Energy system level |
| Interoperability | Level 0: Comparable | Level 1: Convertible | Level 2: Standardized | ||
| Expansibility | Level 0: Fixed layout | Level 1: Adaptable layout | Level 2: Automated layout | ||
| Functional safety | Level 0: Systematic capability | Level 1: Implemented redundancies | Level 2: Predictable failure analysis | Level 3: Automated replacement | |
| Physical component | Virtual representation dimensions (5D) | Core process unit with decentral utility supply and automation system | Main process units with decentral utility supply and process control system | Complete process chain with central utility supply, product use and process control system | Complete process chain with fully integrated utility supply, product logistics and process control system |
| Virtual component | Steady-state simulation model of core process unit available | Quasi-steady-state simulation model of main process units available | Dynamic simulation model and virtualization of complete process chain available | Predictive simulation model and virtualization of complete process chain available | |
| Data management | Manual data processing and storage approaches | Manual or semi-automated data processing and storage approaches | Semi- or automated data processing and storage approaches | Automated data processing and storage approaches with integrated workflow management | |
| Service | Manual service application | Manual or semi-automated service application | Semi- or automated service application | Automated service application | |
| Connection | Manual data communication | Manual or semi-automated data communication | Semi- or fully automated data communication | Automated data communication | |
| Virtual representation type | Digital Model (MRL 1–3) | Digital Shadow (MRL 4–5) | Digital Twin (MRL 6–7) | Digital Predictive Twin (MRL 8–9) | |
Disclaimer/Publisher’s Note: The statements, opinions and data contained in all publications are solely those of the individual author(s) and contributor(s) and not of MDPI and/or the editor(s). MDPI and/or the editor(s) disclaim responsibility for any injury to people or property resulting from any ideas, methods, instructions or products referred to in the content. |
© 2023 by the authors. Licensee MDPI, Basel, Switzerland. This article is an open access article distributed under the terms and conditions of the Creative Commons Attribution (CC BY) license (https://creativecommons.org/licenses/by/4.0/).
Share and Cite
Hammerschmid, M.; Rosenfeld, D.C.; Bartik, A.; Benedikt, F.; Fuchs, J.; Müller, S. Methodology for the Development of Virtual Representations within the Process Development Framework of Energy Plants: From Digital Model to Digital Predictive Twin—A Review. Energies 2023, 16, 2641. https://doi.org/10.3390/en16062641
Hammerschmid M, Rosenfeld DC, Bartik A, Benedikt F, Fuchs J, Müller S. Methodology for the Development of Virtual Representations within the Process Development Framework of Energy Plants: From Digital Model to Digital Predictive Twin—A Review. Energies. 2023; 16(6):2641. https://doi.org/10.3390/en16062641
Chicago/Turabian StyleHammerschmid, Martin, Daniel Cenk Rosenfeld, Alexander Bartik, Florian Benedikt, Josef Fuchs, and Stefan Müller. 2023. "Methodology for the Development of Virtual Representations within the Process Development Framework of Energy Plants: From Digital Model to Digital Predictive Twin—A Review" Energies 16, no. 6: 2641. https://doi.org/10.3390/en16062641