

Evaluation of Empirical Daily Solar Radiation Models for the Northeast Coast of the Iberian Peninsula

Department of Mechanical Engineering, Universitat Rovira i Virgili, Av. Països Catalans 26, 43007 Tarragona, Spain
*
Author to whom correspondence should be addressed.
Energies 2023, 16(6), 2560; https://doi.org/10.3390/en16062560
Submission received: 5 February 2023
/
Revised: 2 March 2023
/
Accepted: 7 March 2023
/
Published: 8 March 2023
(This article belongs to the Topic Concentrated Solar Technologies and Applications)
Abstract
:The ability to accurately predict daily solar radiation reaching the earth’s surface is essential in applications such as solar power generation. Given their ease of use, many empirical models have been proposed based on different dependent variables such as cloud cover, daily temperature range, etc. In this study we evaluate 23 of these models for the prediction of daily solar radiation in the northern coastal zone of the Iberian Peninsula. Daily measurements during the period 2000–2018 from 16 meteorological stations spread over this area are used to adjust the parameters of each model, whose predictive capacity is then evaluated using measurements made between 2019 and 2022. Using different statistical metrics to assess their predictive performance, it was found that models based on hours of sunshine and level of cloudiness are significantly more accurate than those based on maximum and minimum daily temperature and day of the year. Specifically, the sunshine-based model by SBM3 obtained the highest Global Performance Indicator at 5.05. The results offer insight on the ability of each type of empirical model to accurately predict daily solar radiation in the Mediterranean region.
1. Introduction
In a context of growing global energy demand, the sun is a clean and inexhaustible energy source that plays a central role in the generation of renewable power in relation to global warming mitigation and sustainable development. The harnessing of solar radiation, usually measured as the amount of radiant energy from the sun per square meter of the earth’s surface, has driven major technological efforts in recent decades. The capacity to accurately predict the local solar radiation reaching the earth’s surface is not only of interest for energy generation purposes but is also relevant in other fields, including architecture, urban development and agriculture. The understanding and modeling of many of the natural processes that take place in the troposphere, such as photosynthesis, evapotranspiration and cloud formation, depend on our ability to include correct estimates of solar radiation intensity in hydrological and plant growth models [1], and are also crucial in the design of new energy facilities. Remote satellite sensing makes it possible to obtain detailed information on solar irradiance, which is used, in combination with surface measurements, to develop mathematical models for estimating local surface radiation fluxes [2]. Due to significant maintenance costs and the need for frequent calibration, most meteorological stations do not have solar radiation measurement equipment, and direct measurements are scarce. In addition, data validity decays as distance from the measurement location increases, and data is considered unusable at distances greater than 50 km [3]. Over the years, different empirical mathematical models have been proposed to predict the solar radiation reaching a certain geographical area, depending on different factors such as the day of the year and/or meteorological parameters [4,5]. Extraterrestrial solar radiation can be accurately estimated using geometrical parameters, namely, the relative distance between the sun and the earth (which depends on the day of the year) and the geographical location of the measurement point [6]. Obtaining the percentage of this radiative flux that travels through the atmosphere and reaches the earth’s surface at a given time is somewhat more complicated, since it strongly depends on local atmospheric conditions. Therefore, models that uniquely depend on the day of the year, i.e., on the relative earth–sun position, typically fall short in providing reasonable estimations of surface solar radiation, and corrections accounting for local meteorological parameters are generally required. Regardless of their specific form and independent predictors, the goal of the empirical models is to provide reasonably accurate predictions of surface solar radiation using a small set of easily measured atmospheric variables. Although some global models provide acceptable results for large geographical areas [7], the applicability of most empirical models is restricted to relatively small regions. Some authors have carried out an exhaustive analysis of the multiple solar radiation models available in the literature. For instance, Mirzabe et al. [8] analyzed and classified up to 191 different models. By comparing different models for the estimation of solar radiation collected from around 90 scientific articles, Teke et al. [9] ranked them according to their accuracy. Similarly, Prieto and Garcia [10] reviewed a selection of 165 parametric models and quantified the solar prediction variability among them. These authors concluded that a high degree of complexity was not linked to increased accuracy. One of the most comprehensive reviews, conducted by Chen et al. [11], analyzed the predictive capabilities of 294 models and concluded that a universal model capable of accurately predicting local solar radiation for any location and environmental conditions is not yet available. Exploring further this trade-off between accuracy and complexity, which depends mainly on the purpose of the model and the availability of data, Besharat et al. [4] analyzed the performance of 78 different models and classified them into four categories according to meteorological input parameters, namely, sunshine-based, cloud-based, temperature-based and other meteorological-parameter-based models. A common feature of these four types of models is that they take into account latitude, solar declination, elevation, day length and atmospheric transmissivity by including extraterrestrial radiation in the model.
- Sunshine-based models. These models are based on daily sunshine duration. Although they allow accurate predictions of solar radiation, these models require data from specific equipment not present at many meteorological stations. Despotovic et al. [12] carried out an exhaustive analysis using 101 different sunshine-based models using data from 924 sites around the world. The authors concluded that although they could be used anywhere on the planet, their versatility was hindered by their limited accuracy.
- Cloud-based models. These models are based on daily measurements of average cloudiness. As with the sunshine-based models, many meteorological stations are not equipped with specific apparatus to measure cloudiness, and furthermore, such instruments are usually regarded as highly subjective. Ahamed et al. [13] made an exhaustive review of this type of model, concluding that they could be a good alternative for estimating solar radiation when sunshine hour data are not available.
- Temperature-based models. These models are usually based on daily maximum and minimum temperature values. Their major advantage is that these two quantities are measured by most meteorological stations.
- Other meteorological-parameter-based models. These models use a combination of several meteorological variables that often include the ratio of daily and maximum daily sunshine duration, relative humidity, air water content, average temperature, precipitation, etc.
- Day-of-year-based models. In addition to the four previous groups, there is a family of models based only on the day of the year. As they do not require meteorological data to characterize the atmospheric conditions, they are readily usable, although they offer predictions of limited accuracy compared to other model types.
The objectives of this study are to calibrate, validate and compare the daily solar radiation predictions obtained from a collection of methods representative of the different types described above. For each model, the empirical coefficients will be fitted with data obtained from several meteorological stations scattered across the northeast of the Iberian Peninsula along the Mediterranean basin coast and the Balearic Islands. Models are categorized according to the classifications of Besharat et al. [4].
2. Materials and Methods
2.1. Study Area and Data
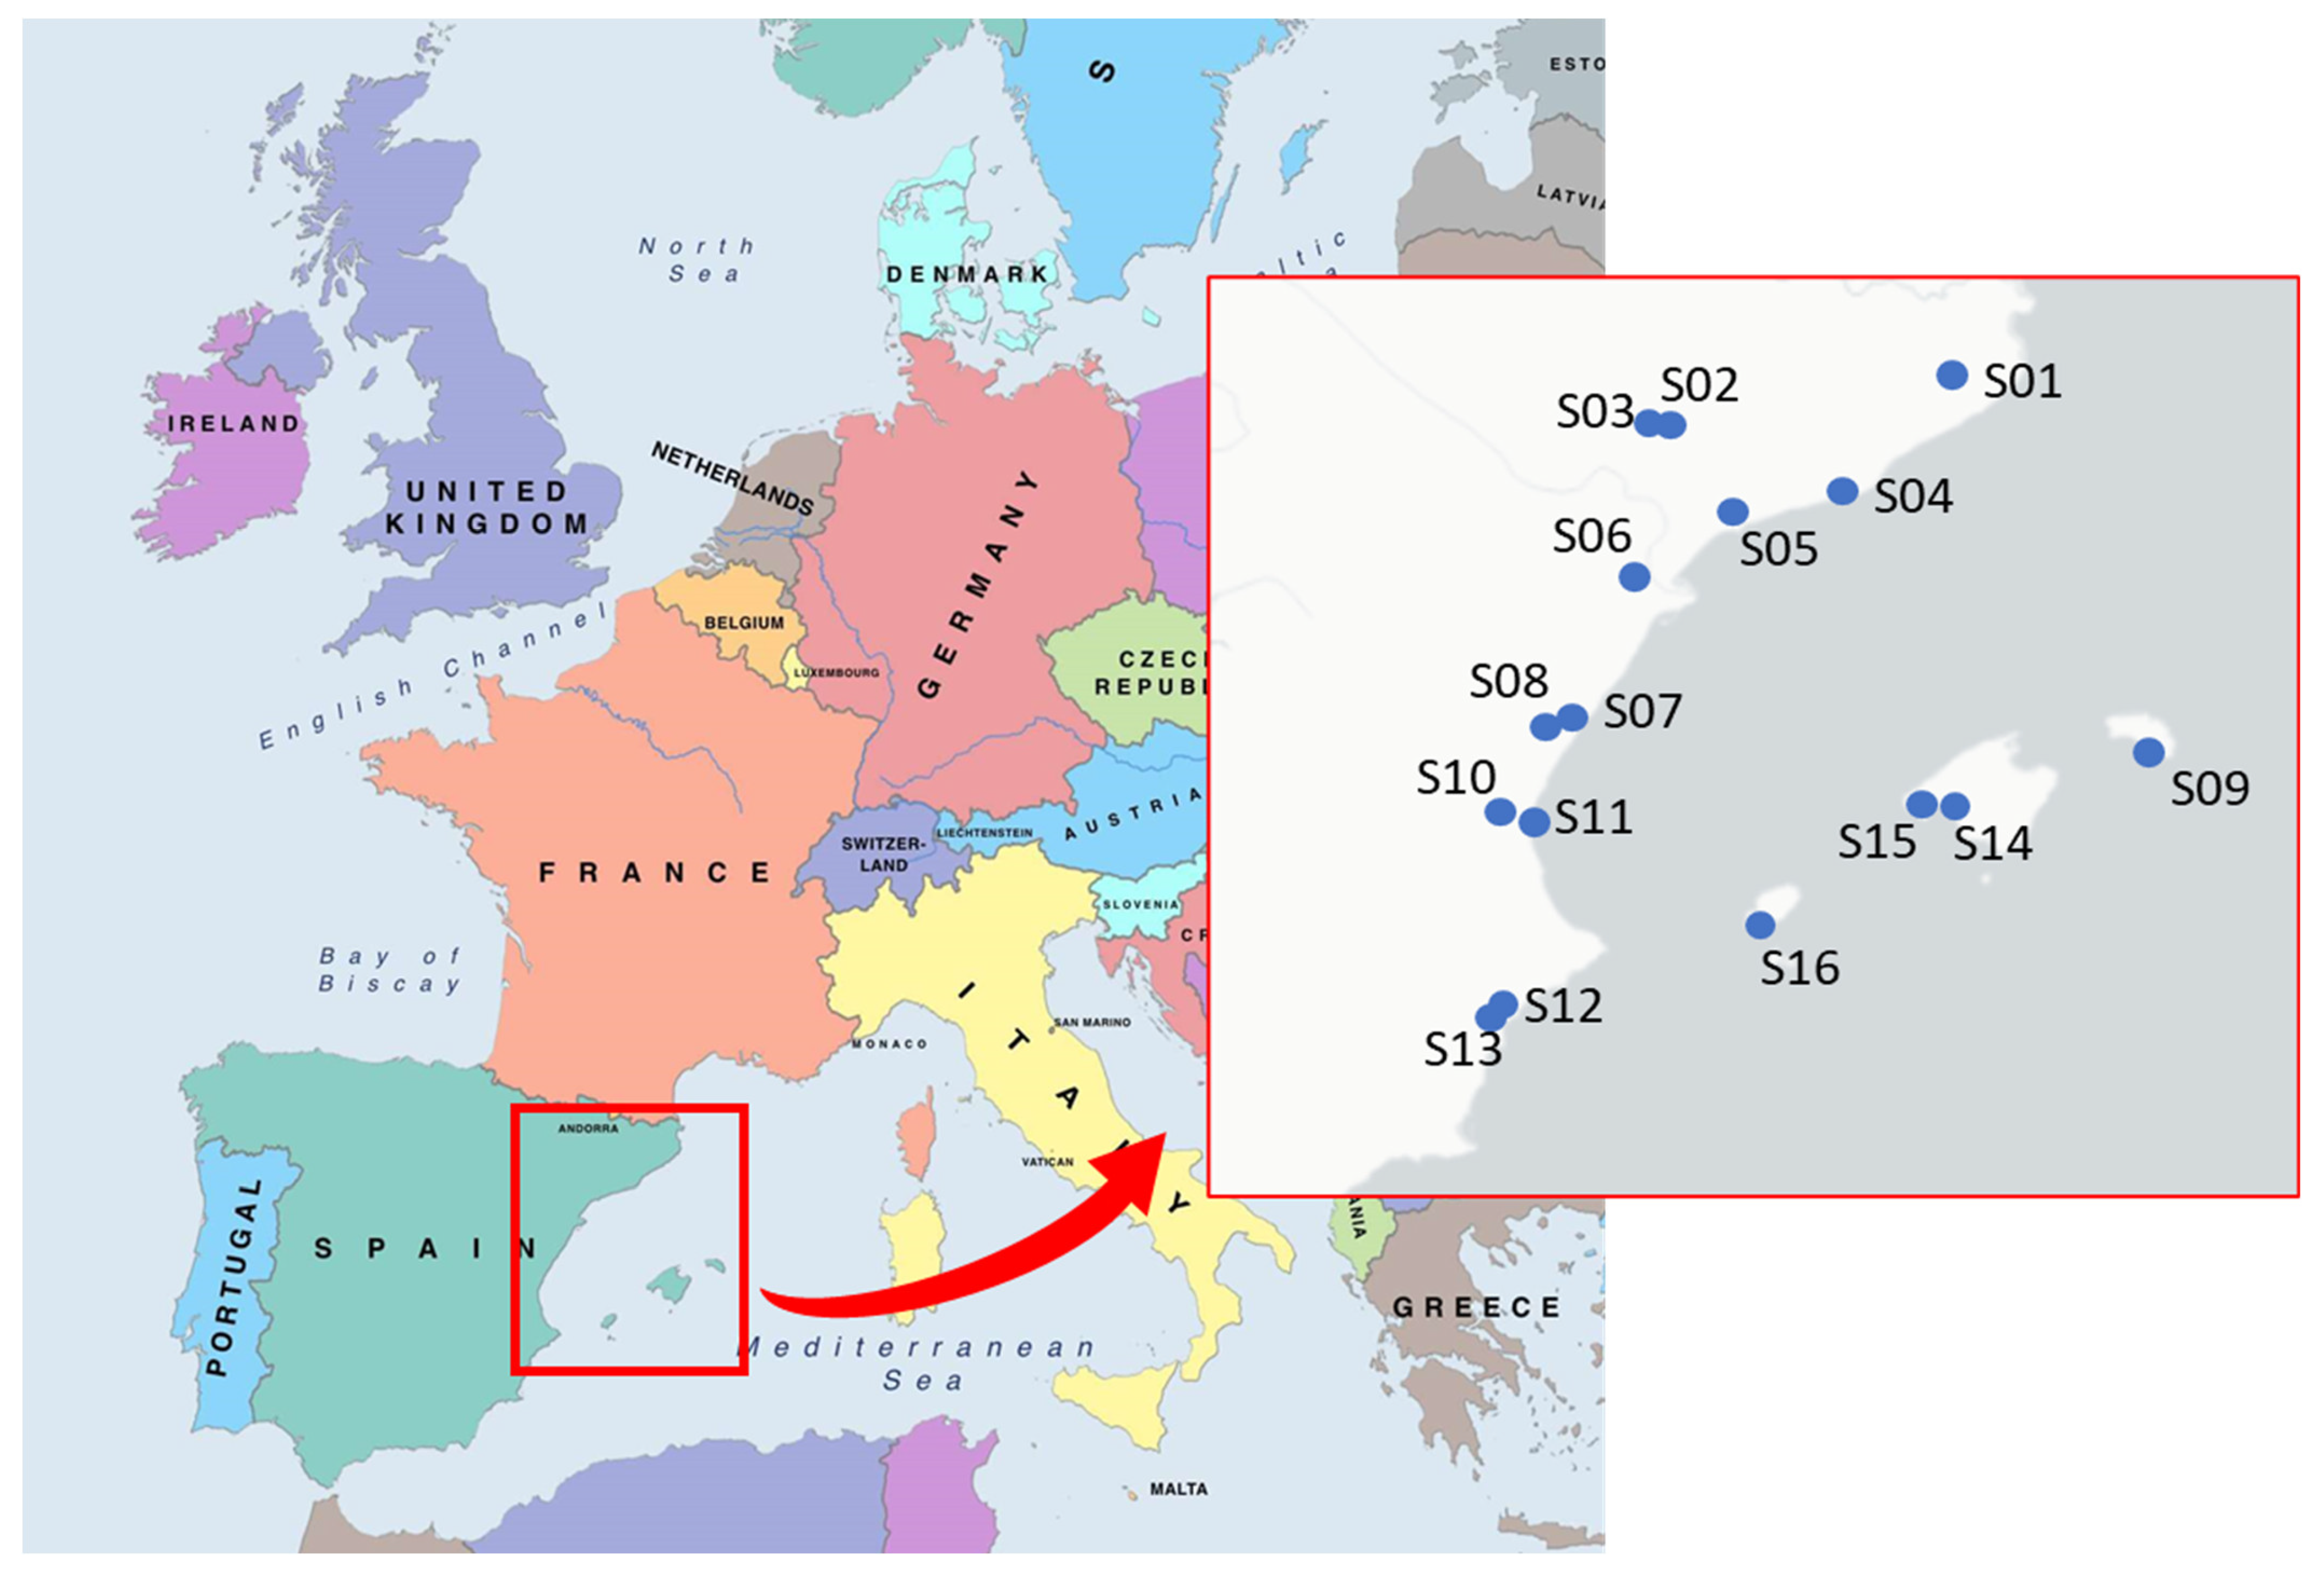
The region of interest spans the eastern part of the Iberian Peninsula, including the Catalan coast and the Balearic Islands, with local climates that are highly influenced by the proximity of the Mediterranean Sea. Data is retrieved from several meteorological stations scattered across this area, located at altitudes that, at most, barely exceed 1000 m above sea level, with an average value of 200 m. The climate is temperate and warm, with little rainfall in summer. The Köppen–Geiger climate classification of the area is mainly Csa, which corresponds to the Mediterranean climate [14]. Data from 12 meteorological stations located along 500 km of the Mediterranean coast of the Iberian Peninsula and 4 stations in the Balearic Islands were analyzed. Table 1 lists the name and location of the 16 stations, which are depicted on a map in Figure 1. In this study we considered meteorological data between the years 2000 to 2022, retrieved from the European Climate Assessment & Dataset project database [15].
Table 2 shows the annual daily mean values of some of the key meteorological variables used in the calculation of solar radiation for each station for the period between 2000 and 2022. The average annual temperature is 16.5 °C, with values ranging from slightly negative to over 36 °C in the summertime. The observed average annual rainfall is slightly less than 300 mm and the average relative humidity is 68%. The mean daily global solar irradiation is 16.5 MJ·m−2·day−1. The mean annual daily sunshine hours of the region is 7.9 h, with a maximum around 14 h occurring in summer.
2.2. Data Quality
To ensure the quality of the meteorological data (temperature, relative humidity, precipitation), all observations with invalid or spurious values were first removed. In the case of surface solar radiation values, the daily sky brightness index (KT) has been used as a quality indicator. This parameter is defined as the ratio between the measured daily radiation and the extraterrestrial solar radiation. Jiang [16] recommends KT values between 0.015 and 1.0. A value of KT = 0.015 corresponds to a day with very intense cloudiness maintained throughout the day, while a value of KT = 1 corresponds to a completely clear day with surface radiation equal to extraterrestrial radiation. Only data within the interval 0.015 ≤ KT ≤ 1.0 were considered. In addition, data with a daily insolation duration longer than the theoretical maximum duration have also been removed.
3. Modeling of Global Solar Radiation
3.1. Extraterrestrial Daily Global Solar Radiation
The amount of solar radiation reaching the upper layers of the atmosphere is well defined and can be calculated quite accurately from the relative positions of the sun and the earth (Julian day) and the geographic location of the point where the value of solar radiation is calculated. According to Duffie and Beckman [6], extraterrestrial solar radiation can be calculated as
where is the solar constant, is the latitude (rad), dr is the inverse of the relative distance between the sun and the earth, δ is the solar declination and ws is the sunset hour angle calculated as
where J is the Julian day.
Additionally, the maximum possible sunshine duration of the day is calculated as
Due to absorption, reflection and scattering processes during its travel through the earth’s atmosphere, the radiation that ultimately reaches the earth’s surface is a fraction of the incoming solar radiation at the upper layers of the atmosphere. Figure 2 compares the variation of solar radiation at the earth’s surface with extraterrestrial radiation at the REUS/AEROPORT site for the year 2018. It is observed that 20–30% of the extraterrestrial radiation does not reach the earth’s surface. This reduction of radiation increases under adverse meteorological conditions, especially in the presence of high cloud cover. Since it accounts for the variability due to the relative positions of the earth and the sun through the year, the value of extraterrestrial solar radiation is an input parameter of most empirical models.
3.2. Empirical Models for Estimation of Solar Radiation
In recent years, many empirical correlations have been developed to determine the amount of solar radiation reaching the earth’s surface based on different geographical and atmospheric parameters. Several publications exhaustively collect and classify a vast number of models according to the variables used in the calculation of daily solar radiation [4,8,10]. In this study, we compared the accuracy of some of the most well-known methodologies to compute local solar radiation in the Mediterranean area of the north-east region of the Iberian Peninsula. The models considered here belong to any of the following five categories: (1) day-of-the-year models, (2) sunshine-based models, (3) cloud-based models, (4) temperature-based models and (5) other meteorological-parameter-based models. The selection criteria took into account measurement availability, model simplicity, and previously reported performance. Except for the model of Gariepy [17], all 23 models considered here depend on several coefficients fitted using measurements of meteorological variables. Gariepy’s model directly uses precipitation and temperature information to calculate daily solar radiation with no need to fit any parameters by regression. As stated, all models except day-of-the-year-based ones include extraterrestrial radiation as an input, and therefore implicitly account for site latitude, solar declination and day length [4].
3.2.1. Day-of-the-Year-Based Models (DYBs)
As Figure 2 shows, daily solar radiation is a quasi-periodic yearly phenomenon [18]. Thus, these models assume that solar radiation can be readily estimated for each day of the year. This methodology is thought to be the simplest approach, with only one parameter required to get an estimation of the daily average solar radiation for a given location on the earth’s surface. Despite their simplicity, the impact of local meteorological conditions that may significantly affect the amount of radiation reaching the surface is not accounted for, and their accuracy often decreases under cloudy conditions. Table 3 lists the five models based on the day of the year considered in this study.
3.2.2. Sunshine-Based Models (SBMs)
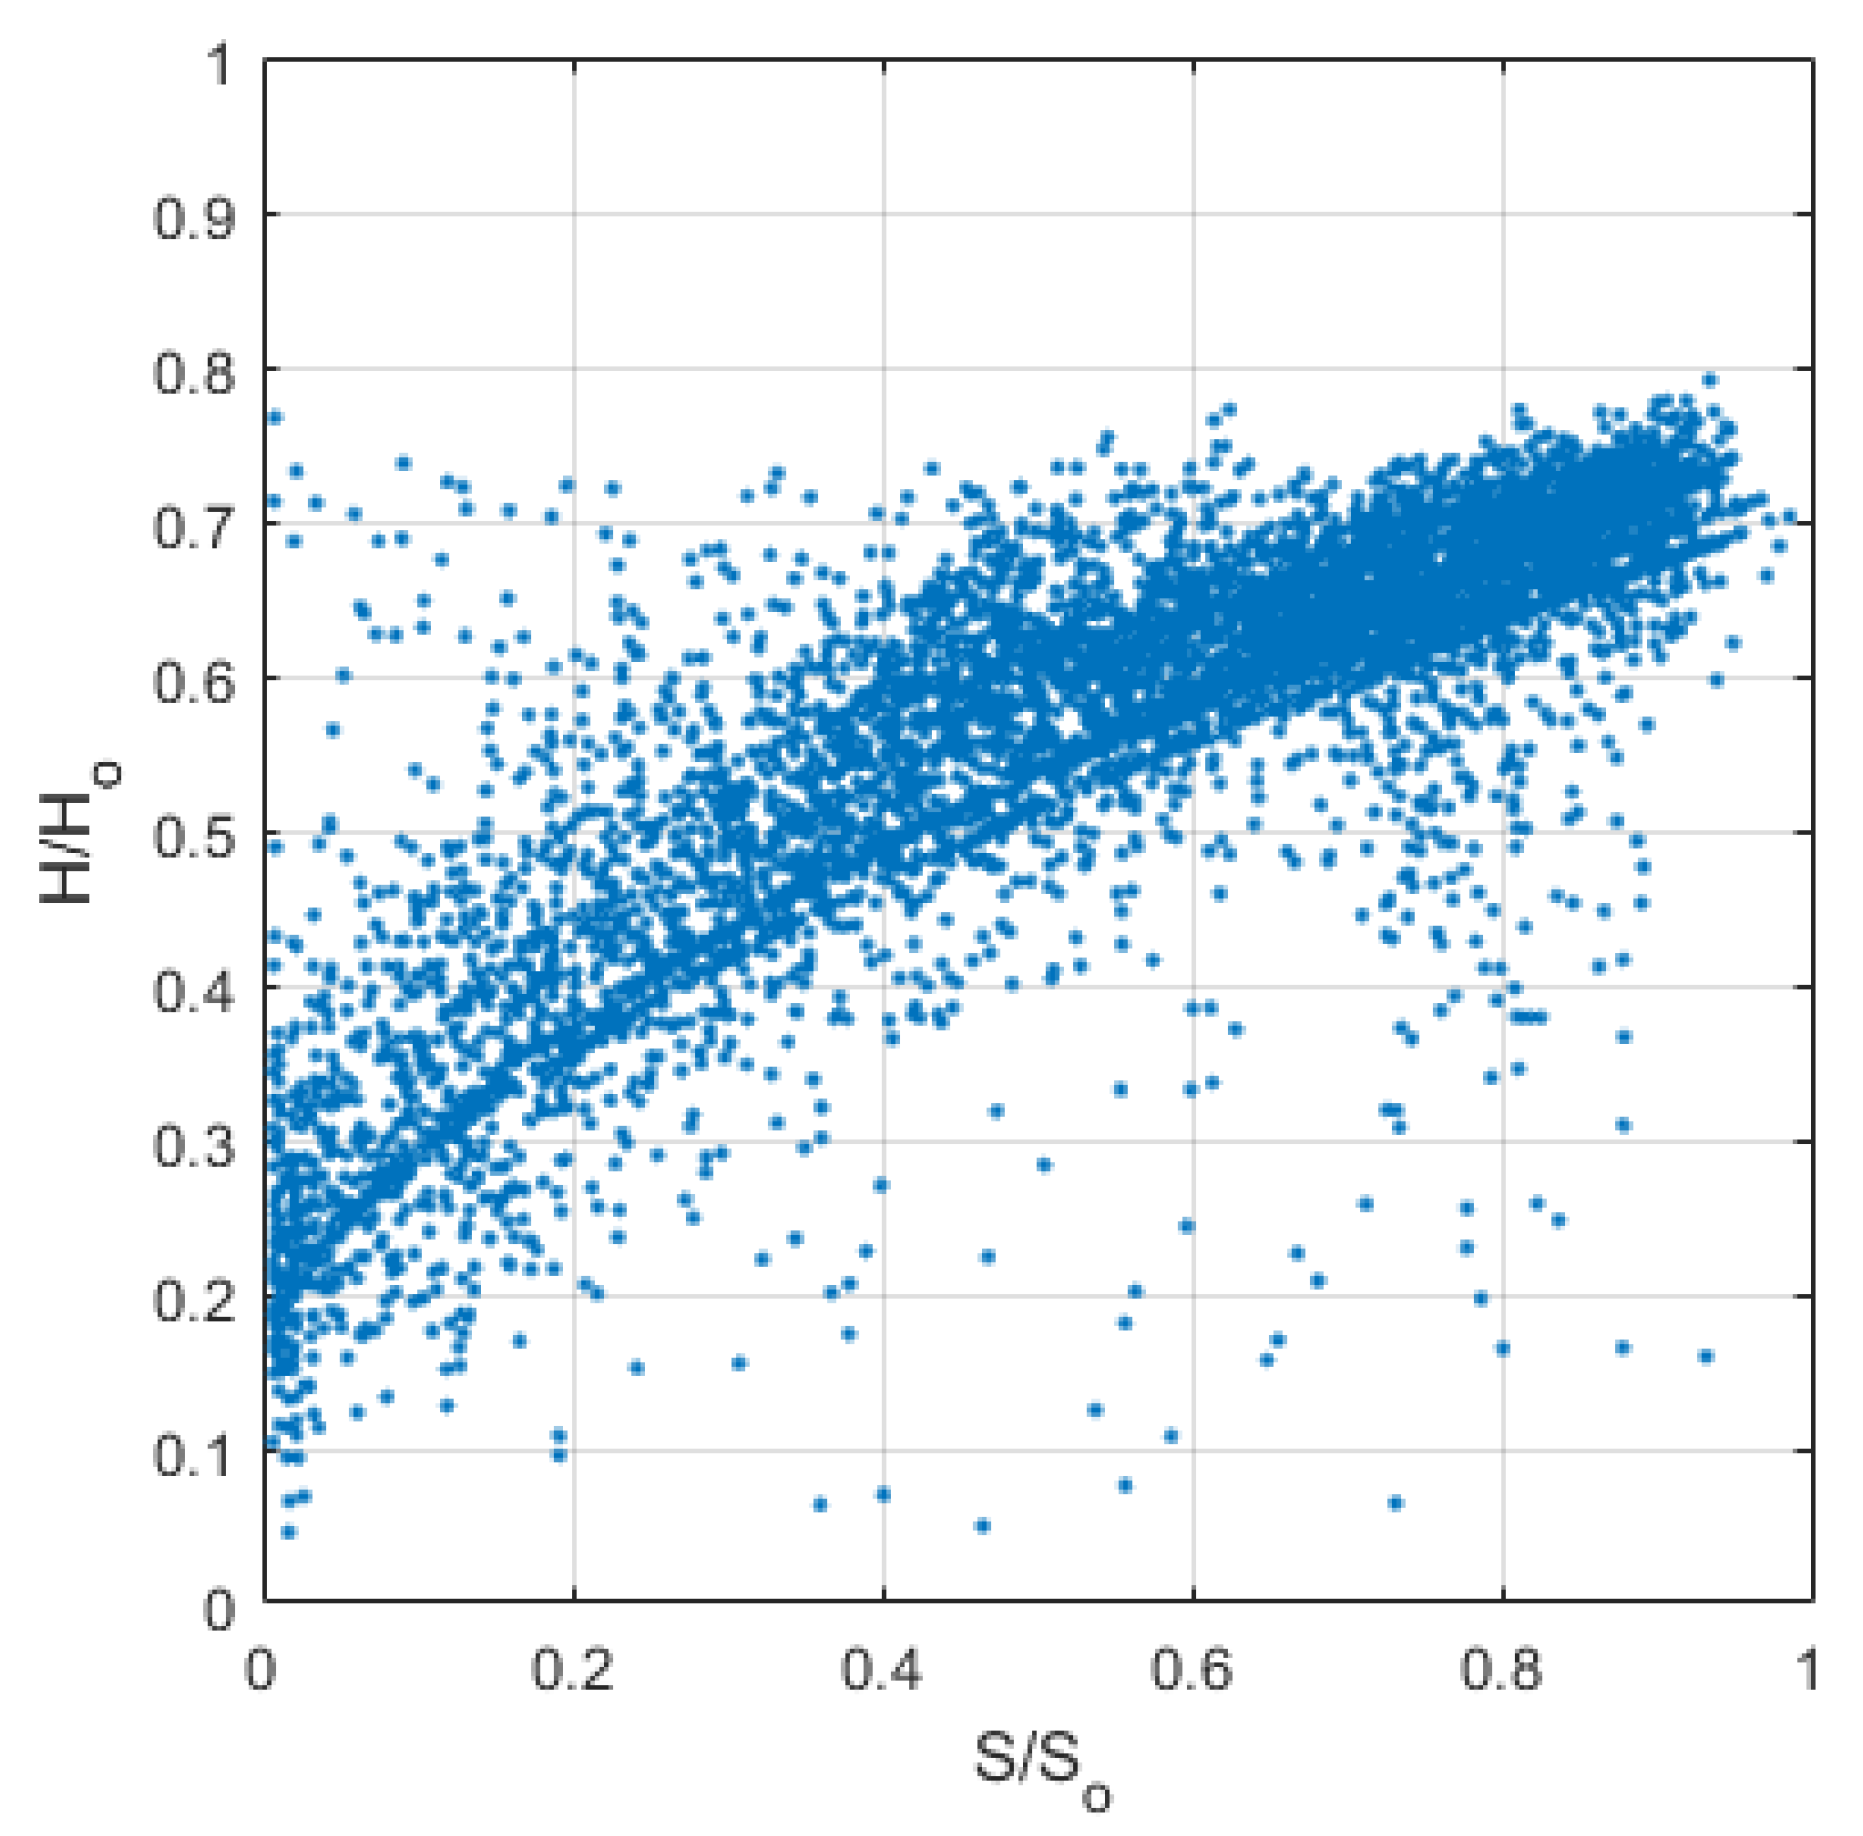
As shown in Figure 3, solar radiation is highly correlated with hours of sunshine. This figure shows radiation at the earth’s surface, normalized by extraterrestrial radiation (H/Ho) as a function of normalized sunshine hours and S/So for an arbitrary location in the region of interest. The significant correlation between the variables suggests that under unfavorable meteorological conditions (for example, high humidity or a cloudy day) associated with low values of S/So, the amount of radiative energy arriving at the earth’s surface decreases.
Solar radiation calculation models based on the S/So ratio exploit this relatively strong correlation and are among the most popular, along with those based on temperature [24]. The Angstrom-Prescott model [25] is one of the simplest and most widely used methods. This model is a modification of the Angstrom model [26] in which the use of clear sky radiation is replaced by extraterrestrial radiation. Several authors have modified the basic linear form of this model by extending it with higher order polynomial terms and also exponential and logarithmic forms.
The main drawback of this type of model (see the list of those considered in this study in Table 4) is the need to know the length of the solar day, the measurement of which requires specific equipment not available at all weather stations.
3.2.3. Cloud-Based Models (CBMs)
As discussed above, the number of daily hours of sunshine is a meteorological parameter that is highly correlated with total daily solar irradiance. When insolation measurements are not available, CBMs estimate the solar radiation using the cloud cover. The total cloud cover index is often estimated by eye and reported in octas, with 0 corresponding to clear sky and 8 to overcast conditions [31]. Ahamed et al. [13] presented a comprehensive review of cloud-cover-based models and analyzed the hourly variation of solar radiation. Table 5 shows the cloud-cover-based models considered in this study.
3.2.4. Temperature-Based Models (TBMs)
Temperature-based models use maximum and minimum daily temperatures to estimate the daily solar radiation for a specific site. This type of methodology assumes that temperature difference can be used as a proxy for cloudiness [34]. Clear skies increase maximum temperature due to higher shortwave radiation, and the temperature minimum is lower due to higher transmissivity [35]. Thus, clear skies indicate higher temperature differences, while cloudy skies imply lower values for temperature changes. Notably, variations in temperature are also affected by many other factors than cloudiness, such as precipitation, wind velocity, elevation, soil evaporation, etc. Therefore, this type of method can exhibit significant levels of uncertainty and prediction error [34]. Recently, Qiu et al. [36] presented an extensive review of 82 models for computing daily solar radiation based solely on temperature data, along with 4 new proposed models. Their results were found to provide reasonable accuracy when used in different geographical zones across China. Mohammadi and Moazenzadeh [37] analyzed daily solar radiation estimates from 13 Peruvian meteorological stations using 7 empirical temperature-based models and proposed a new model for the stations using precipitation and relative humidity as additional variables. These models were developed on the basis of multiple linear regression analysis. They found that the empirical temperature-based models usually overestimate solar radiation at most of the stations. In the present study, the TBMs considered are listed in Table 6.
3.2.5. Other Meteorological-Parameter-Based Models (OPMs)
Unlike the previous models, which are based on a single meteorological parameter, the five methods in Table 7 combine several parameters in an attempt to improve the prediction of solar radiation. The two first models (OPM1 and OPM2) combine daily sunshine hour duration and relative humidity data. Methods OPM3 and OPM5 use daily sunshine hour duration along with mean daily temperature. OPM3 also combines relative humidity to estimate the atmospheric precipitable water vapor per unit volume of air using the expression presented by [43]. OPM5 is a modification of the Angström-Prescott model [25] that adds data on mean temperature and precipitation. OPM4 uses only the maximum and minimum daily temperature and precipitation.
3.3. Statistical Performance Validation
To assess the performance of the models in Table 3, Table 4, Table 5, Table 6 and Table 7 on the dataset described in Section 2.1, we used up to nine statistical quantitative indicators. It should be noted that to ensure independent validation of the models, they were fitted using meteorological data from 2000 to 2018 and then tested with measurements taken between 2019 and 2022. The quantitative indicators used were:
- Mean absolute error or MAE (MJ m−2 day−1) is a statistical indicator used to determine how close the calculated values are to the measurements. It is the sum of the absolute value of the differences between the measured values and the calculated values, divided by the number of measures. Performance increases as this metric tends toward zero.
- 2.
- Root mean square error or RMSE (MJ m−2 day−1) is often used in the literature, although some authors have expressed concerns about its suitability for this type of analysis given the large impact that a small set of large-discrepancy measurements can have on this metric, which uses the square of the difference between observed and predicted values [46].
- 3.
- The mean absolute relative error or MARE is calculated as the sum of the absolute value of the relative differences between the measured and calculated data. Some authors express it as a percentage. The lower this value is, the better the model performance.
- 4.
- Uncertainty at 95% or U95 puts the emphasis on model deviation. For the standard normal distribution, a value of 1.96 implies that there is a 95% probability that a standard normal variable will fall between −1.96 and 1.96 [47]. SD is the standard deviation of the difference between calculated and measured solar radiation data.
- 5.
- Root mean squared relative error or RMSRE is often preferred over the RMSE, although it is more sensitive to very low observation values [48]. This metric score decreases as model performance improves.
- 6.
- 7.
- Mean bias error or MBE is used to quantify the tendency of the model to overestimate or underestimate the measured values. This indicator may not be an appropriate metric when simultaneously overestimated and underestimated values can cancel each other out.
- 8.
- The coefficient of determination or R2 is frequently used in statistics to estimate how well model predictions capture trends in the observed data. Bounded between 0 and 1, the larger the value of R2 the better the model performance.
- 9.
- The maximum absolute relative error or errMAX uses the largest relative difference between predicted and observed values.
Each of the indicators listed above can measure different aspects of the similarity between modeled and observed data. For this reason, it may be difficult to rank the different models using each of the indicators separately [8]. To ameliorate the limitations of model assessment based on individual scores, Behar et al. [47] defined the Global Performance Indicator (GPI), which Despotovic et al. [12] later modified and expressed as
where αj is equal to 1 for all indicators except for R2, for which it takes the value of −1, is the median of scaled values of indicator j, and is the scaled value of indicator j for model i. The higher the value of GPI, the better the model performance in predicting daily terrestrial solar radiation.
4. Results and Discussion
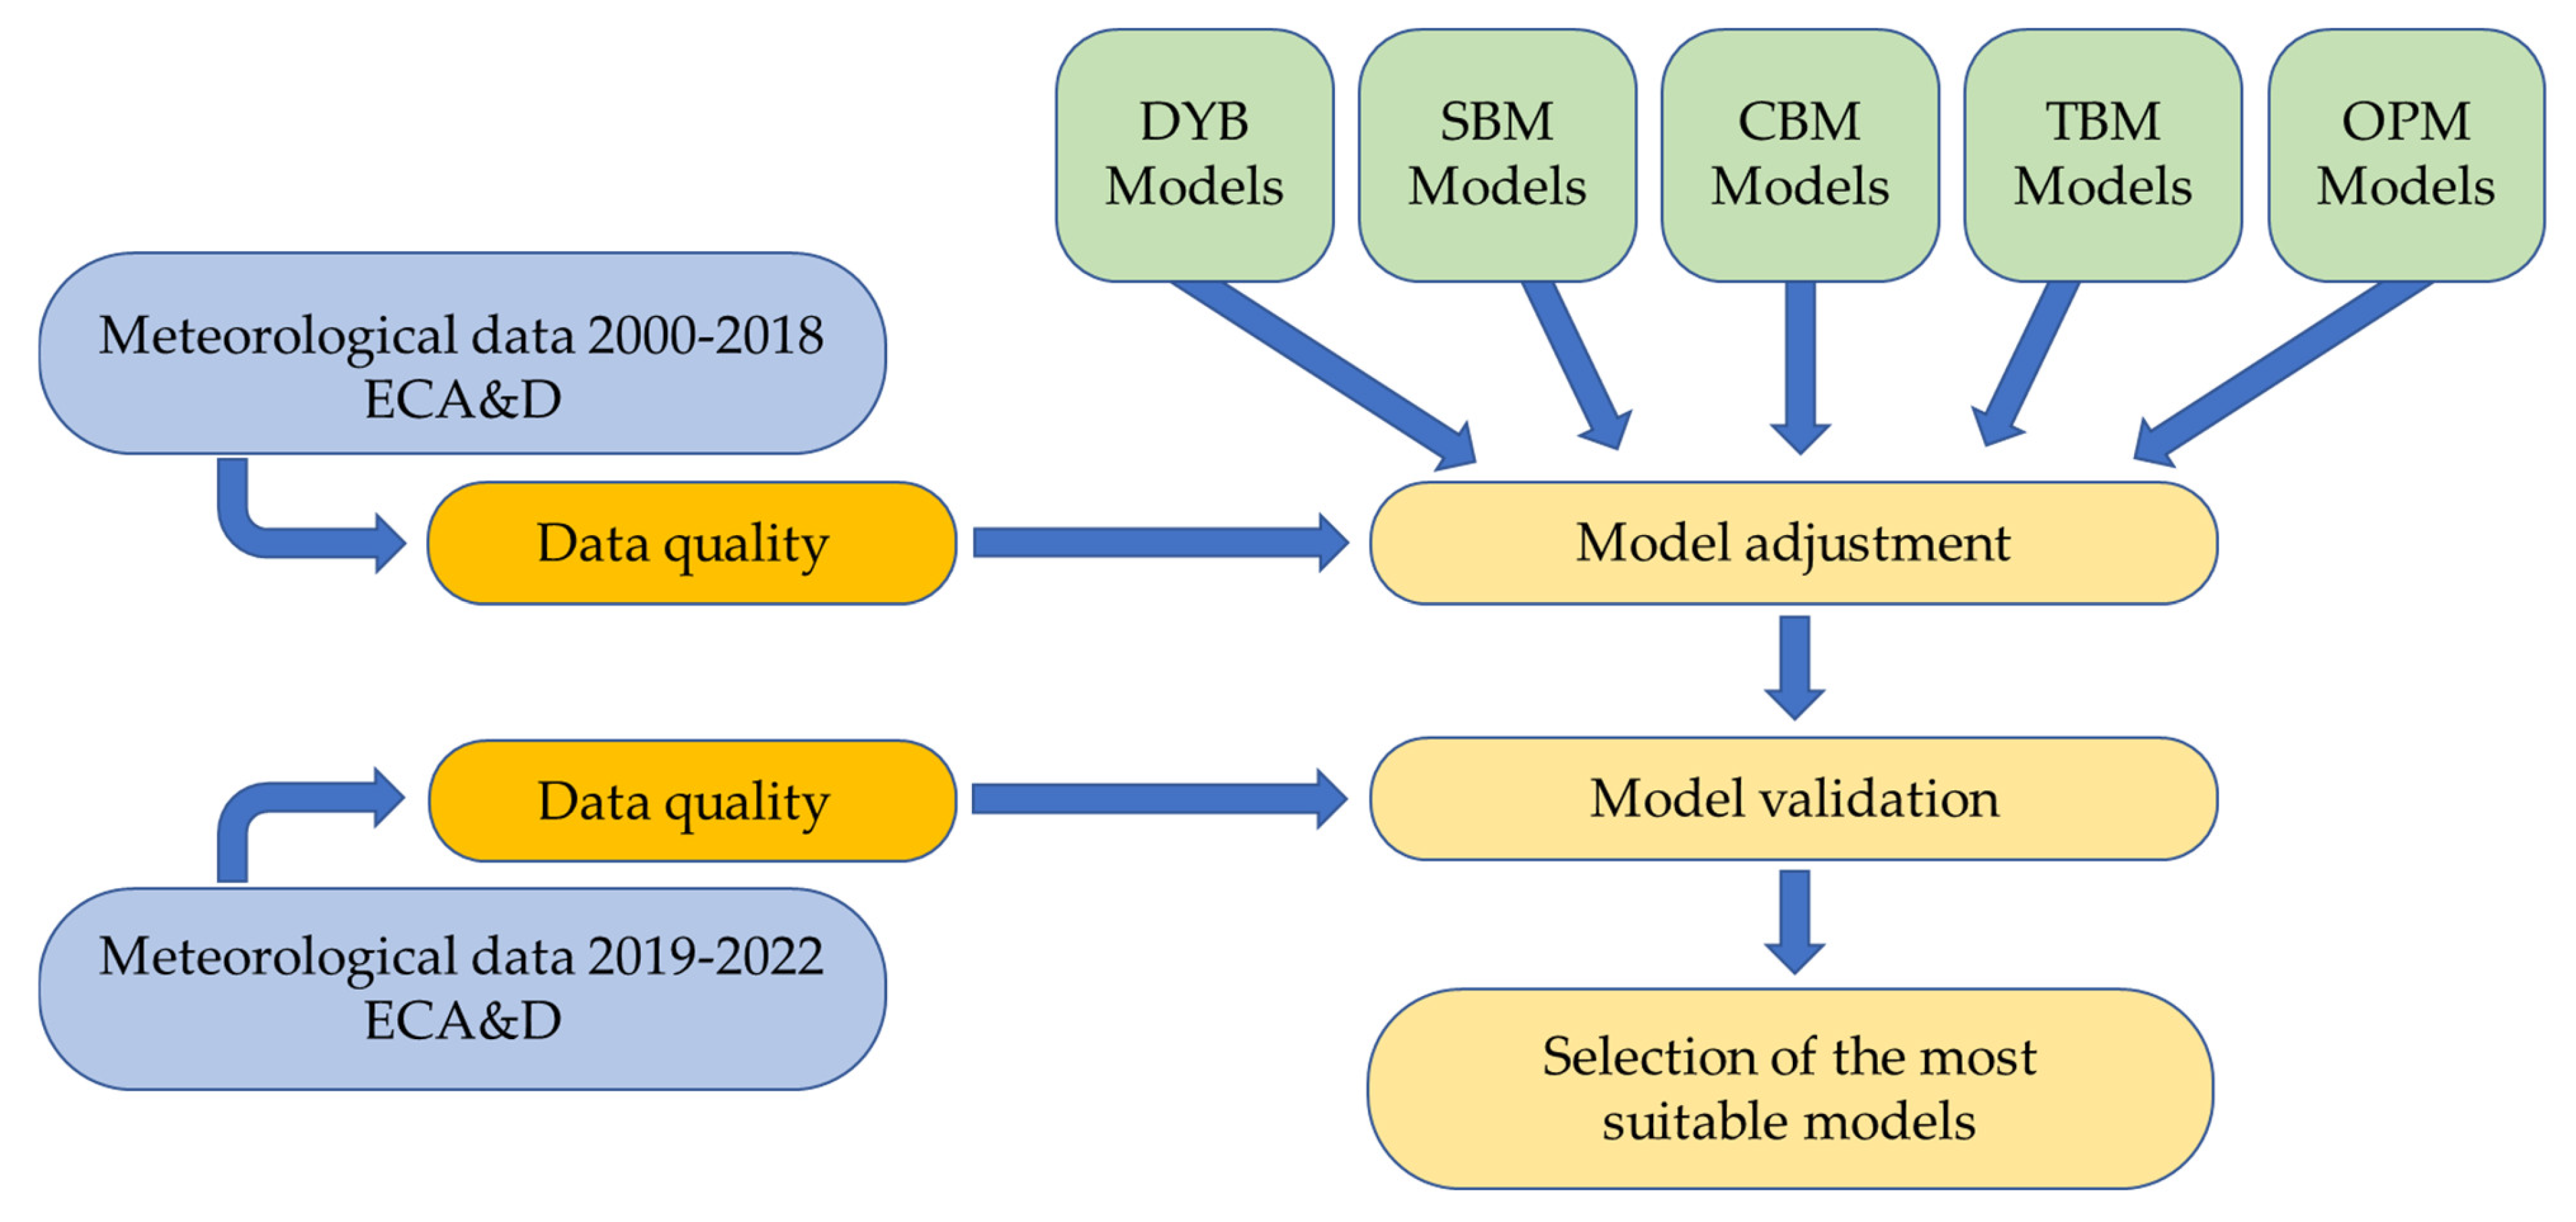
Figure 4 schematically shows the methodology of the present study. The fitting parameters of the 23 models selected in this study were adjusted to obtain the best prediction of daily solar radiation in the Mediterranean area of the Iberian Peninsula using daily meteorological data obtained between 2000 and 2018 from 16 measurement stations. The entire dataset for all the stations was used to determine each model regression coefficient. Separate fits for each station were not considered.
Table 8 shows the results for each model. Predictive accuracy is similar to that reported in the literature [4,12].
The coefficients obtained for each model cannot be compared directly with those existing in the literature, since most authors adjust the models to a specific geographical area that does not coincide with the one studied in this study. However, a comparison has been made between the values obtained by other authors and those found in this study. For some of the models based on sunshine hours, Besharat et al. [4] collected values of the coefficients obtained for different worldwide geographical locations. For example, for the Angstrom-Prescott model (SBM1), these authors report 36 results, of which 2 present negative values of the coefficient a that do not conform to those obtained by the majority of authors. For the rest of the cases analyzed, the values of coefficient a are between 0.133 and 0.367, with a mean value of 0.256, while the values of coefficient b are between 0.311 and 0.696, with a mean value of 0.495. The mean values for this model are very close to those obtained in our study (a = 0.283 and b = 0.457). These results are also in good agreement with those reported by Page [49], who claimed the model to be usable anywhere in the world with regression coefficients a = 0.23 and b = 0.48. For the other models studied, it has been found that the value of the regression coefficients calculated in this study is of the same order of magnitude as that observed in most of the literature consulted.
Each model and their respective parameters in Table 8 was used to predict the daily solar radiation for the years 2019 to 2022. Table 9 shows, for each model, all the performance scores computed using the predicted and measured values of daily solar radiation. The most accurate scores are highlighted in bold type. Smaller values of each score are associated with improved predictive capabilities, except for R2 and GPI. A value of 0 for the coefficient of determination (R2) indicates no linear relationship between the predicted and observed values, while a value of 1 corresponds to a perfect linear relationship. Regarding the upper unbounded Global Performance Indicator (GPI), the higher the GPI the better the model’s predictive capabilities.
Although, as shown in Figure 3, the relationship between solar radiation and the fraction of sunshine hours has been found to be non-linear [50], the performance score results suggest that the linear Angstrom-Prescott model (SBM1) provides reasonably good estimates, as do the rest of the SBMs. Regarding MAE, RMSE and U95, the best model for this geographical region is OPM2, with values of MAE = 1.12 MJ·m−2·day−1, RMSE = 2.22 MJ·m−2·day−1 and U95 = 6.36 MJ·m−2·day−1. This model is an Angstrom-Prescott model with an additional parameter accounting for relative humidity. The models OPM2 and SBM3 are the best according to the values of the mean absolute relative error (MARE = 0.092) but are very close to OPM3 and SBM2 (MARE = 0.093). The smallest root mean squared relative error (RMSRE = 0.245) and the maximum absolute relative error (errMax = 3.365) correspond to OPM1, a model that also uses daily sunshine hours and relative humidity as input parameters. The third order equation based on daily sunshine hours (SBM3) is considered the best regarding RRMSE (13.73%) and R2 (0.91). The only statistical indicator that points to a model not based on sunshine hours is the mean bias error. In this case, the model with an MBE close to zero is TBM4 (MBE = 0.128 MJ·m−2·day−1). Several models might seem to offer good predictions of solar radiation given the near-zero values of this metric, but this statistical parameter does not allow discriminating between small deviations and large deviations of similar magnitude but opposite sign.
The value of the GPI also indicates that sunshine-based models perform best for values ranging between 3.82 and 5.04. Good performance is also found for OPM1, OPM2 and OPM3. While OPM2 and OPM3 are modified versions of the Angstrom-Prescott model that include relative humidity and atmospheric precipitable water per unit volume of air, respectively, the OPM1 model uses the fraction of sunshine hours and relative humidity. This suggests that adding other meteorological variables to the models based on sunshine hours has a limited impact on model performance. Cloud-cover-based models perform slightly worse than SBMs, but still offer better predictions than the rest of the methods considered in this study. As previously reported [51], the models based on temperature (TBMs) and day of the year (DYBs) are found to be less accurate. The GPI values for this type of models are all negative, since for all statistical indicators it was found that their performance is worse than the median of the rest of the models. Among these, the present results found TBM3 [40] to be the best-performing temperature-based model. The models based on the day of the year (DYBs), with no input from local meteorology, exhibit the overall worst performance.
Despite differences between scores among all models considered in this study, the overall differences between them are relatively narrow. For instance, the R2 score ranges between 0.72 and 0.91, suggesting that even the worst-performing model can provide reasonably good estimates of solar radiation depending on the trade-off between accuracy and data availability of the specific application.
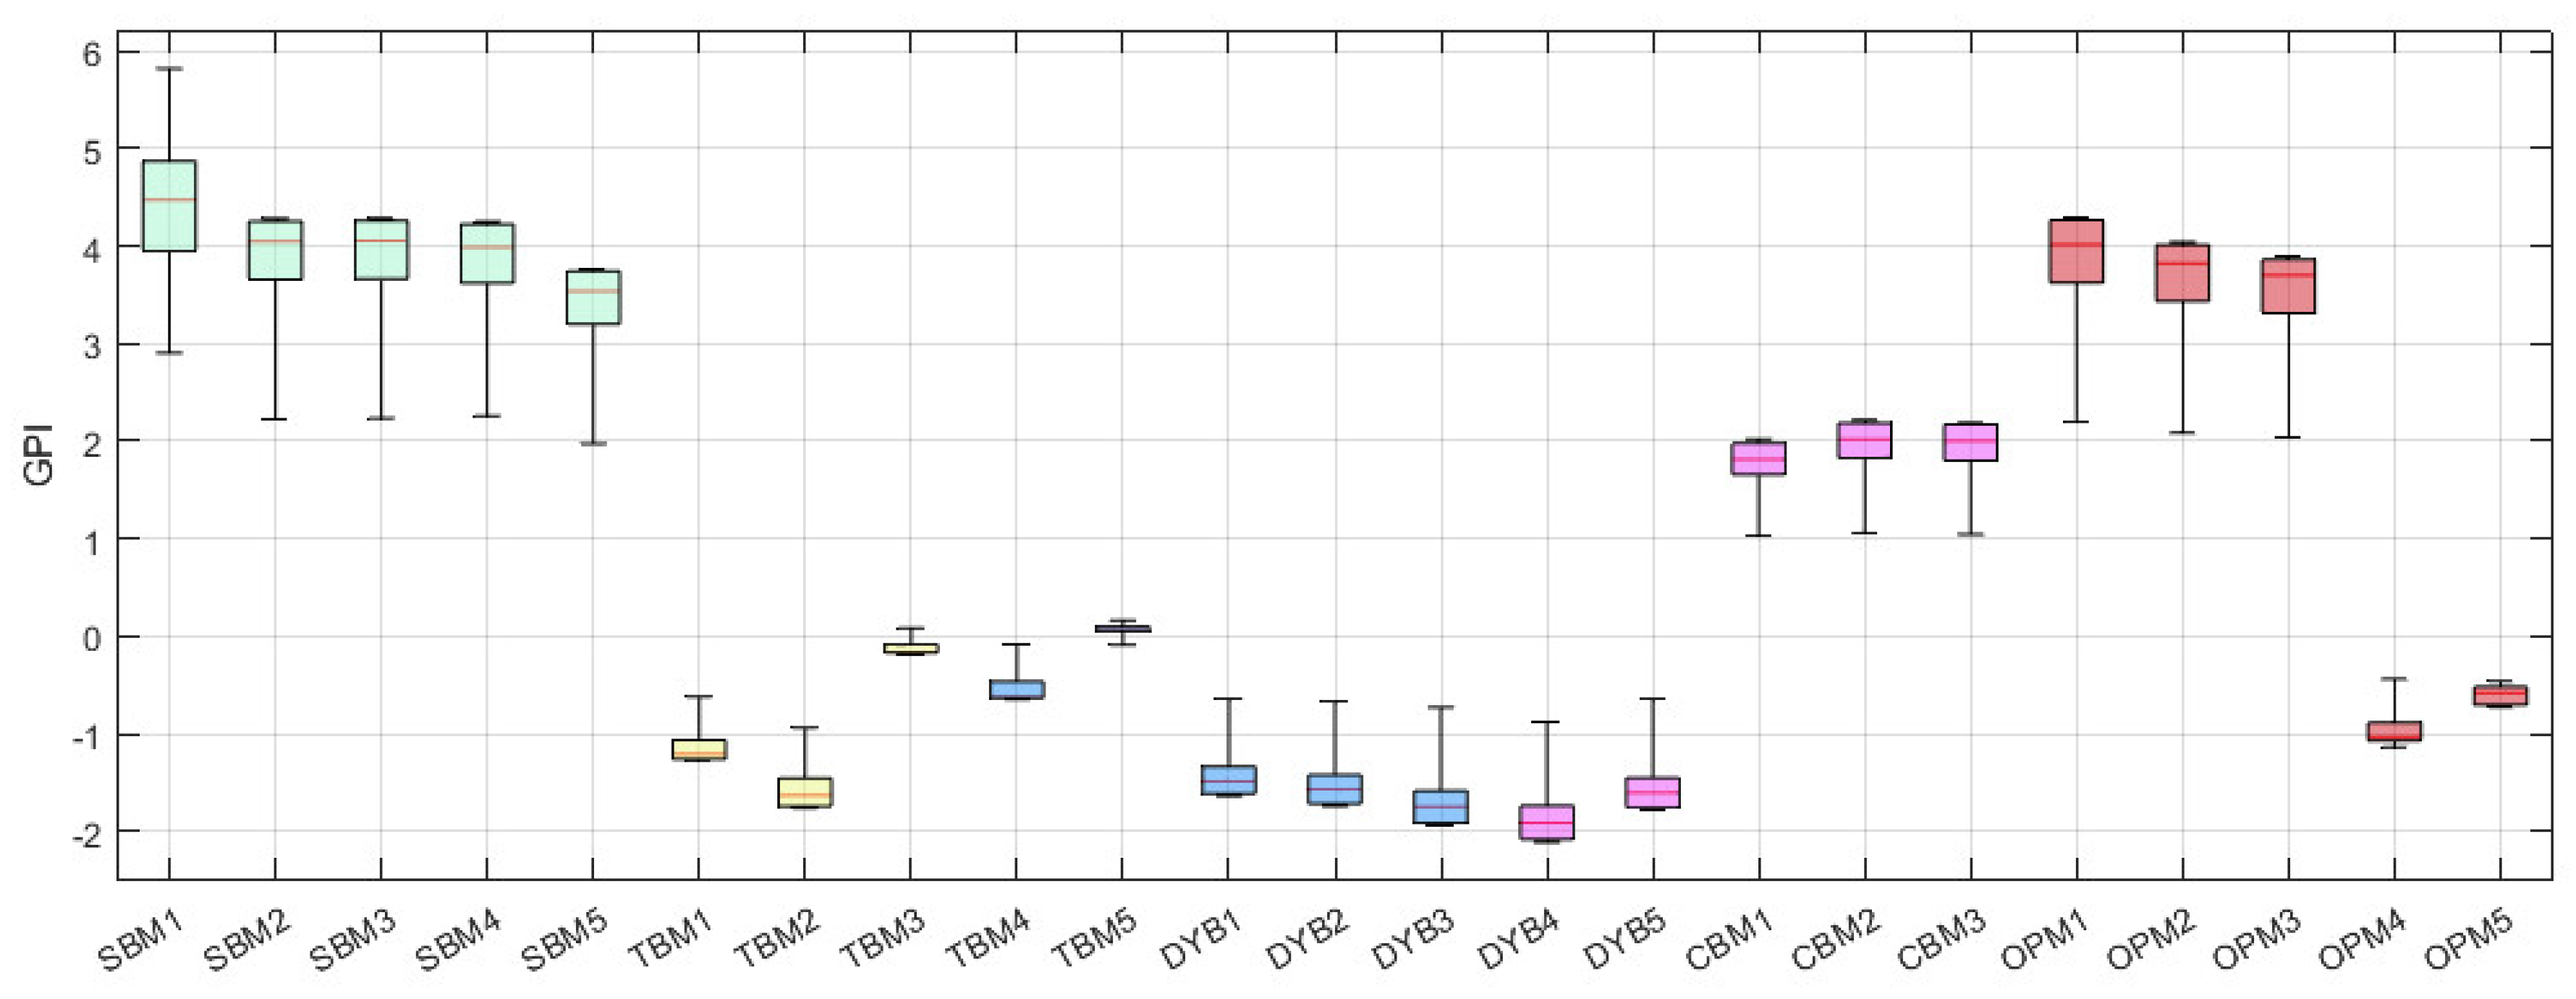
To investigate model performance for each data collection site, we determined the GPI score for each meteorological station. The results in Figure 5 confirm that when analyzed separately, SBMs offer the best predictive capabilities, with the Angstrom-Prescott model (SBM1) offering the best predictions.
5. Conclusions
Solar energy is a clean, renewable energy source that offers a sustainable alternative to the use of fossil fuels. Knowing the amount of solar radiation available in each geographical area is important for the design of solar energy production systems. Empirical models are the most widely used methods for obtaining such estimates of the solar radiation available at the earth’s surface.
In this article, we focus on the area located on the Mediterranean slope of the Iberian Peninsula and the Balearic Islands. The accuracy of 23 different models for predicting daily solar radiation was analyzed. Depending on the variables used in the models, these were grouped into five different types, namely: (1) day of the year, (2) hours of sunshine, (3) cloudiness, (4) temperature and (5) other meteorological parameters. Based on meteorological data measured at 16 different sites between the years 2000 and 2018, the coefficients of each model were fitted by regression. The data set used to fit the models included all stations simultaneously to obtain unique coefficients for the entire geographical region of interest. The adjusted coefficients obtained were used to calculate daily solar radiation for the years 2019 to 2022. The predictive ability of each model was estimated using several scores quantifying the differences between the observed and predicted values. The Global Performance Indicator (GPI) was used to rank the models according to overall accuracy.
The models based on sunshine hours were found to be the most accurate, both when all stations were considered together and individually. In the latter case, we found that the classical Angstrom-Prescott model offers the best accuracy. The results suggest that adding other meteorological parameters such as relative humidity or precipitation to the models based on sunshine hours does not notably improve their performance. The OPM1, OPM2 and OPM3 models exhibit similar performance to those found for sunshine hour models. The models based on cloudiness offer slightly lower accuracy than those based on sunshine hours, with R2 values around 0.85. The models based on temperature and day of the year exhibit the worst performance.
The analysis suggests that, when sunshine hour data are not available, cloudiness-based models should be used. In cases where cloudiness data are not available, models based on temperature or day of the year could be an alternative that would provide an acceptable estimate of solar radiation. Although not all the models available in the literature have been reviewed, the considered sample includes some of the most popular models that have been found to offer reasonably good predictions of daily solar radiation in the studied area.
The use of artificial intelligence and machine learning is an aspect to be considered in future research. The availability of massive data sets on meteorological conditions (cloudiness, temperature, relative humidity) for a large number of locations opens the possibility of using machine learning and artificial intelligence techniques to develop new modelling tools for the prediction of local radiative energy. Moazenzadeh et al. [52] compared different Support Vector Machine (SVM) algorithms for predicting daily solar radiation at seven meteorological stations in Iran. Almizamir et al. [53] conducted a comparative study of different machine learning models for solar radiation estimation in two geographical areas: the United States and Turkey. Geshnigan et al. [54] used 7 different artificial intelligence approaches for estimating daily solar radiation at 11 meteorological stations in Illinois (USA). Satellite measurements have also been used to derive new data-driven models for predicting local surface radiative energy flux. Mohammadi et al. [55] used ERA-Interim (ECMWF) datasets in the three geographical locations in Iran with promising results in terms of predictive accuracy.
Regarding our ongoing and future efforts, we want to take a step further and try to replace both the empirical and the standard ML-based approaches with interpretable closed-form mathematical models. To obtain them, we will feed massive datasets of daily solar radiation measurements into a “machine scientist” [56] tool to obtain models capable of capturing the physics of the problem without resorting to empirical approximations of limited generalization.
Author Contributions
A.V. and A.F. have contributed equally to the completion of the work presented and to the preparation, writing, and revision of the article. All authors have read and agreed to the published version of the manuscript.
Funding
This research has been financially supported by the Generalitat de Catalunya—AGAUR under the 2017 SGR 01234 project.
Data Availability Statement
The meteorological data for the years 2000 to 2022 used in this study are publicly available from the European Climate Assessment & Dataset project (https://www.ecad.eu/ accessed on 6 March 2023) [15].
Conflicts of Interest
The authors declare no conflict of interest. The funders had no role in the design of the study, in the collection, analyses, or interpretation of data, in the writing of the manuscript, or in the decision to publish the results.
Nomenclature
| a–g | Model regression coefficients |
| CC | Cloud cover index |
| The inverse of the relative distance between the sun and the earth | |
| Solar constant (0.0820 MJ·m−2·min−1) | |
| H | Daily global solar radiation (MJ m−2 day−1) |
| Hm | Measured daily global solar radiation (MJ m−2 day−1) |
| Hc | Calculated daily global solar radiation (MJ m−2 day−1) |
| Ho | Daily extraterrestrial radiation (MJ m−2 day−1) |
| J | Day of the year starting 1 January |
| KT | Daily sky clearness index |
| PPT | Accumulated precipitation (mm) |
| R2 | Coefficient of determination |
| RH | Relative humidity |
| S | Daily sunshine duration (h) |
| So | Maximum possible daily sunshine duration (h) |
| Tmax | Daily maximum temperature |
| Tmin | Daily minimum temperature |
| Tmean | Daily mean temperature |
| U95 | Uncertainty at 95% (MJ m−2 day−1) |
| W | Atmospheric precipitable water per unit volume of air |
| Sunset hour angle (rad) | |
| Greek Symbols | |
| Solar declination (rad) | |
| Latitude (rad) | |
| Acronyms | |
| ECMWF | European Centre for Medium-Range Weather Forecasts |
| errMAX | Maximum absolute relative error (MJ m−2 day−1) |
| GPI | Global Performance Indicator |
| MAE | Mean absolute error (MJ m−2 day−1) |
| MARE | Mean absolute relative error |
| MBE | Mean bias error. (MJ m−2 day−1) |
| RMSE | Root mean square error (MJ m−2 day−1) |
| RMSRE | Root mean squared relative error |
| RRMSE | Relative root mean squared error (%) |
| SD | Standard deviation |
References
- Allen, R.G.; Pereira, L.S.; Raes, D.; Smith, M. Crop Evapotranspiration. Guidelines for Computing Crop Water Requirements; FAO Irrigation and Drainage Paper 56; Food and Agriculture Organization of the United Nations: Rome, Italy, 1998. [Google Scholar]
- Chen, Q.; Li, X.; Zhang, Z.; Zhou, C.; Guo, Z.; Liu, Z.; Zhang, H. Remote sensing of photovoltaic scenarios: Techniques, applications and future directions. Appl. Energy 2023, 333, 120579. [Google Scholar] [CrossRef]
- Younes, S.; Muneer, T. Comparison between solar radiation models based on cloud information. Int. J. Sustain. Energy 2007, 26, 121–147. [Google Scholar] [CrossRef]
- Besharat, F.; Dehghan, A.A.; Faghih, A.R. Empirical models for estimating global solar radiation: A review and case study. Renew. Sustain. Energy Rev. 2013, 21, 798–821. [Google Scholar] [CrossRef]
- Jahani, B.; Dinpashoh, Y.; Nafchi, A.R. Evaluation and development of empirical model for estimating daily solar radiation. Renew. Sustain. Energy Rev. 2017, 73, 878–891. [Google Scholar] [CrossRef]
- Duffie, J.A.; Beckman, W.A. Solar Engineering of Thermal Processes, 4th ed.; John Wiley & Sons: New York, NY, USA, 2013. [Google Scholar]
- Kaplanis, S.; Kumar, J.; Kaplani, E. On a universal model for the prediction of the daily global solar radiation. Renew. Energy 2016, 91, 178–188. [Google Scholar] [CrossRef] [Green Version]
- Mirzabe, A.H.; Hajiahmad, A.; Keyhani, A.; Mirzaei, N. Approximation of daily solar radiation: A comprehensive review on employing of regression models. Renew. Energy Focus 2022, 41, 143–159. [Google Scholar] [CrossRef]
- Teke, A.; Yıldırımb, H.B.; Çelik, O. Evaluation and performance comparison of different models for the estimation of solar radiation. Renew. Sustain. Energy Rev. 2015, 50, 1097–1107. [Google Scholar] [CrossRef]
- Prieto, J.I.; Garcia, D. Global solar radiation models: A critical review from the point of view of homogeneity and case study. Renew. Sustain. Energy Rev. 2022, 155, 111856. [Google Scholar] [CrossRef]
- Chen, J.L.; He, L.; Yang, H.; Ma, M.H.; Chen, Q.; Wu, S.L.; Xiao, Z.L. Empirical models for estimating monthly global solar radiation: A most comprehensive review and comparative case study in China. Renew. Sustain. Energy Rev. 2019, 108, 91–111. [Google Scholar] [CrossRef]
- Despotovic, M.; Nedic, V.; Despotovic, D.; Cvetanovic, S. Review and statistical analysis of different global solar radiation sunshine models. Renew. Sustain. Energy Rev. 2015, 52, 1869–1880. [Google Scholar] [CrossRef]
- Ahamed, M.S.; Guo, H.; Tanino, K. Cloud cover-based models for estimation of global solar radiation: A review and case study. Int. J. Green Energy 2021, 19, 175–189. [Google Scholar] [CrossRef]
- Beck, H.E.; Zimmermann, N.E.; McVicar, T.R.; Vergopolan, N.; Berg, A.; Wood, E.F. Present and future Köppen-Geiger climate classification maps at 1-km resolution. Sci. Data 2018, 5, 180214. [Google Scholar] [CrossRef] [PubMed] [Green Version]
- Klein Tank, A.M.G.; Wijngaard, J.B.; Können, G.P.; Böhm, R.; Demarée, G.; Gocheva, A.; Mileta, M.; Pashiardis, S.; Hejkrlik, L.; Kern-Hansen, C.; et al. Daily dataset of 20th-century surface air temperature and precipitation series for the European Climate Assessment. Int. J. Climatol. 2002, 22, 1441–1453. [Google Scholar] [CrossRef]
- Jiang, Y. Estimation of monthly mean daily diffuse radiation in China. Appl. Energy 2009, 86, 1458–1646. [Google Scholar] [CrossRef]
- Gariepy, J. Estimation of Global Solar Radiation; International Report; Service of Meteorology, Government of Quebec: Montreal, QC, Canada, 1980. [Google Scholar]
- Zeroual, A.; Ankrim, M.; Wilkinson, A.J. Stochastic modelling of daily global solar radiation measured in Marrakesh, Morocco. Renew. Energy 1995, 6, 787–793. [Google Scholar] [CrossRef]
- Kaplanis, S.; Kaplani, E. A model to predict expected mean and stochastic hourly global solar radiation I(h; nj) values. Renew. Energy 2007, 32, 1414–1425. [Google Scholar] [CrossRef]
- Li, H.; Ma, W.; Lian, Y.; Wang, X. Estimating daily global solar radiation by day of year in China. Appl. Energy 2010, 87, 3011–3017. [Google Scholar] [CrossRef]
- Quej, V.H.; Almorox, J.; Ibrakhimov, M.; Saito, L. Estimating daily global solar radiation by day of the year in six cities located in the Yucatán Peninsula, Mexico. J. Clean. Prod. 2017, 141, 75–82. [Google Scholar] [CrossRef] [Green Version]
- Bulut, H.; Büyükalaca, O. Simple model for the generation of daily global solar-radiation data in Turkey. Appl. Energy 2007, 54, 477–491. [Google Scholar] [CrossRef]
- Rahoma, U.A.; Hassan, A.H. Fourier transforms investigation of global solar radiation at true noon: In the desert climatology. Am. J. Appl. Sci. 2007, 4, 902–907. [Google Scholar] [CrossRef] [Green Version]
- Benti, N.E.; Aneseyee, A.B.; Asfaw, A.A.; Geffe, C.A.; Tiruye, G.A.; Mekonnen, Y.S. Estimation of global solar radiation using sunshine-based models in Ethiopia. Cogent Eng. 2022, 9, 2114200. [Google Scholar] [CrossRef]
- Prescott, J.A. Evaporation from water Surface in relation to solar radiation. Trans. R. Soc. Aust. 1940, 46, 114–118. [Google Scholar]
- Ångström, A. Solar and terrestrial radiation. Q. J. R. Meteorol. Soc. 1924, 50, 121–125. [Google Scholar] [CrossRef]
- Ogelman, H.; Ecevit, A.; Tasdemiroglu, E. A new method for estimating solar radiation from bright sunshine data. Sol. Energy 1984, 33, 19–25. [Google Scholar] [CrossRef]
- Bahel, V.; Bakhsh, H.; Srinivasan, R. A correlation for estimation of global solar radiation. Energy 1987, 12, 131–135. [Google Scholar] [CrossRef]
- Coppolino, S. A new correlation between clearness index and relative sunshine. Renew. Energy 1994, 4, 417–423. [Google Scholar] [CrossRef]
- Ampratwum, D.B.; Dorvlo, A.S.S. Estimation of solar radiation from the number of sunshine hours. Appl. Energy 1999, 63, 161–167. [Google Scholar] [CrossRef]
- Badescu, V.; Dumitrescu, A. Simple solar radiation modelling for different cloud types and climatologies. Theor. Appl. Clim. 2016, 124, 141–160. [Google Scholar] [CrossRef]
- Badescu, V. Correlations to estimate monthly mean daily solar global irradiation: Application to Romania. Energy 1999, 24, 883–893. [Google Scholar] [CrossRef]
- Black, J.N. The Distribution of solar radiation over the earth’s surface. Arch. Meteorol. Geophys. Bioclimatol. Ser. B 1956, 7, 165–1889. [Google Scholar]
- Allen, R.G. Self-calibrating method for estimating solar radiation from air temperature. J. Hydrol. Eng. 1997, 2, 56–67. [Google Scholar] [CrossRef]
- Almorox, J.; Bocco, M.; Willington, E. Estimation of daily global solar radiation from measured temperatures at Cañada de Luque, Cordoba, Argentina. Renew. Energy 2013, 60, 382–387. [Google Scholar] [CrossRef] [Green Version]
- Qiu, R.J.; Li, L.A.; Wu, L.F.; Agathokleous, E.; Liu, C.W.; Zhang, B.Z.; Luo, Y.F.; Sun, S.L. Modeling daily global solar radiation using only temperature data: Past, development, and future. Renew. Sustain. Energy Rev. 2022, 163, 112511. [Google Scholar] [CrossRef]
- Mohammadi, B.; Moazenzadeh, R. Performance Analysis of Daily Global Solar Radiation Models in Peru by Regression Analysis. Atmosphere 2021, 12, 389. [Google Scholar] [CrossRef]
- Hargreaves, G.L.; Hargreaves, G.H.; Riley, P. Irrigation water requirement for the Senegal River Basin. J. Irrig. Drain. Eng. 1985, 111, 265–275. [Google Scholar] [CrossRef]
- Hunt, L.A.; Kuchar, L.; Swanton, C.J. Estimation of solar radiation for use in crop modeling. Agric. For. Meteorol. 1998, 91, 293–300. [Google Scholar] [CrossRef]
- Li, M.F.; Liu, H.B.; Guo, P.T.; Wu, W. Estimation of daily solar radiation from routinely observed meteorological data in Chongqing, China. Energy Convers. Manag. 2010, 51, 2575–2579. [Google Scholar] [CrossRef]
- Li, M.-F.; Fan, L.; Liu, H.-B.; Guo, P.-T.; Wu, W. A general model for estimation of daily global solar radiation using air temperatures and site geographic parameters in Southwest China. J. Atmos. Solar-Terr. Phys. 2013, 92, 145–150. [Google Scholar] [CrossRef]
- Bristow, C.L.; Campbell, G.S. On the relationship between incoming solar radiation and daily maximum and minimum temperature. Agric. For. Meteorol. 1984, 31, 159–166. [Google Scholar] [CrossRef]
- Leckner, B. The spectral distribution of solar radiation at the earth’s surface elements of a model. Sol. Energy 1978, 20, 143–150. [Google Scholar] [CrossRef]
- Swartman, R.K.; Ogunlade, O. Solar radiation estimates from common parameters. Sol. Energy 1967, 11, 170–172. [Google Scholar] [CrossRef]
- Garg, H.P.; Garg, S.T. Prediction of global solar radiation from bright sunshine hours and other meteorological parameters. In Solar-India, Proceedings on National Solar Energy Convention; Allied Publishers: New Delhi, India, 1982; pp. 1.004–1.007. [Google Scholar]
- Willmott, C.J.; Matsuura, K. Advantages of the mean absolute error (MAE) over the root mean square error (RMSE) in assessing average model performance. Clim. Res. 2005, 30, 79–82. [Google Scholar] [CrossRef]
- Behar, O.; Khellaf, A.; Mohammedi, K. Comparison of solar radiation models and their validation under Algerian climate—The case of direct irradiance. Energy Convers. Manag. 2015, 98, 236–251. [Google Scholar] [CrossRef]
- Webber, H.; Martre, P.; Asseng, S.; Kimball, B.; White, J.; Ottman, M.; Wall, G.W.; De Sanctis, J.; Grant, R.; Kassie, B.; et al. Canopy temperature for simulation of heat stress in irrigated wheat in a semi-arid environment: A multi-model comparison. Field Crops Res. 2017, 202, 21–35. [Google Scholar] [CrossRef]
- Page, J.K. The estimation of monthly mean values of daily total short-wave radiation on vertical and inclined surfaces from sunshine records for latitudes 40N–40S. In Proceedings of the UN Conference on New Sources of Energy, Rome, Italy, 16 May 1961; Volume 4, pp. 378–390. [Google Scholar]
- Suehrcke, H.; Bowden, R.S.; Hollands, K.G.T. Relationship between sunshine duration and solar radiation. Sol. Energy 2013, 92, 160–171. [Google Scholar] [CrossRef]
- Quej, V.H.; Almorox, J.; Ibrakhimov, M.; Saito, L. Empirical models for estimating daily global solar radiation in Yucatán Peninsula, Mexico. Energy Convers. Manag. 2016, 110, 448–456. [Google Scholar] [CrossRef]
- Moazenzadeh, R.; Mohammadi, B.; Duan, Z.; Delghandi, M. Improving generalisation capability of artificial intelligence-based solar radiation estimator models using a bio-inspired optimisation algorithm and multi-model approach. Environ. Sci. Pollut. Res. 2022, 29, 27719–27737. [Google Scholar] [CrossRef]
- Alizamir, M.; Kim, S.; Kisi, O.; Zounemat-Kermani, M. A comparative study of several machine learning based non-linear regression methods in estimating solar radiation: Case studies of the USA and Turkey regions. Energy 2020, 197, 117239. [Google Scholar] [CrossRef]
- Geshnigani, F.S.; Golabi, M.R.; Mirabbasi, R.; Tahroudi, M.N. Daily solar radiation estimation in Belleville station, Illinois, using ensemble artificial intelligence approaches. Eng. Appl. Artif. Intell. 2023, 120, 105839. [Google Scholar] [CrossRef]
- Mohammadi, B.; Moazenzadeh, R.; Pham, Q.B.; Al-Ansari, N.; Rahman, K.U.; Anh, D.T.; Duan, Z. Application of ERA-Interim, empirical models, and an artificial intelligence-based model for estimating daily solar radiation. Ain Shams Eng. J. 2022, 13, 101498. [Google Scholar] [CrossRef]
- Guimerà, R.; Reichardt, I.; Aguilar-Mogas, A.; Massucci, F.A.; Miranda, M.; Pallarès, J.; Sales-Pardo, M. A Bayesian machine scientist to aid in the solution of challenging scientific problems. Sci. Adv. 2020, 13, 101498. [Google Scholar] [CrossRef] [PubMed] [Green Version]
Figure 1.
Geographical area studied and location of measuring stations. Map obtained from https://mapswire.com/ (accessed on 6 March 2023).
Figure 1.
Geographical area studied and location of measuring stations. Map obtained from https://mapswire.com/ (accessed on 6 March 2023).

Figure 2.
Comparison between the extraterrestrial radiation and the radiation registered on the earth’s surface at the REUS/AIRPORT station (S05) during 2018.
Figure 2.
Comparison between the extraterrestrial radiation and the radiation registered on the earth’s surface at the REUS/AIRPORT station (S05) during 2018.

Figure 3.
Variation of measured solar radiation and sunshine hours of the day at BARCELONA/AIRPORT station (S04) for the period 2000 to 2018.
Figure 3.
Variation of measured solar radiation and sunshine hours of the day at BARCELONA/AIRPORT station (S04) for the period 2000 to 2018.

Figure 4.
Working process followed in this study.

Figure 5.
Distribution of GPI for each model, computed individually for each meteorological station.
Figure 5.
Distribution of GPI for each model, computed individually for each meteorological station.


Table 1.
Weather stations used and their location.
| Station Name | Station ID | Latitude | Longitude | Elevation (m) |
|---|---|---|---|---|
| GIRONA/COSTA BRAVA | S01 | 41.91167 | 2.763056 | 143 |
| LLEIDA | S02 | 41.62556 | 0.595 | 192 |
| LLEIDA-AJUNTAMENT | S03 | 41.61639 | 0.583056 | 169 |
| BARCELONA/AIRPORT | S04 | 41.29278 | 2.069722 | 4 |
| REUS/AIRPORT | S05 | 41.14944 | 1.178889 | 71 |
| TORTOSA—OBSERVATORIO DEL EBRO | S06 | 40.82056 | 0.491389 | 44 |
| CASTELLON DE LA PLANA | S07 | 39.98917 | 0.040556 | 25 |
| CASTELLON | S08 | 39.95 | 0.071389 | 35 |
| MENORCA/MAO | S09 | 39.85444 | 4.215556 | 91 |
| VALENCIA/AEROPUERTO | S10 | 39.48667 | 0.473056 | 69 |
| VALENCIA | S11 | 39.48056 | 0.366389 | 11 |
| ALICANTE | S12 | 38.3725 | 0.494167 | 81 |
| ALICANTE EL ALTET | S13 | 38.28278 | 0.570556 | 43 |
| PALMA DE MALLORCA/SON SAN JUAN | S14 | 39.56056 | 2.736667 | 8 |
| PALMA DE MALLORCA CMT | S15 | 39.55556 | 2.626389 | 3 |
| IBIZA/ESCODOLA | S16 | 38.87639 | 1.384167 | 6 |
Table 2.
Annual meteorological averages of some variables at each study station.
| Station ID | T Max (°C) | T Min (°C) | T Mean (°C) | Precipitation (mm) | Humidity (%) | Daily Solar Radiation (MJ m−2 Day−1) | Sunshine Hours (h) |
|---|---|---|---|---|---|---|---|
| S01 | 37.0 | −5.9 | 15.3 | 405.5 | 71.3 | 14.8 | 7.2 |
| S02 | 38.8 | −5.6 | 16.2 | 227.2 | 66.5 | 17.0 | 8.4 |
| S03 | 38.0 | −5.6 | 15.9 | 217.6 | --- | 17.0 | 8.4 |
| S04 | 33.1 | −0.1 | 17.1 | 315.8 | 68.1 | 15.8 | 6.8 |
| S05 | 35.8 | −4.0 | 16.6 | 269.4 | 66.5 | 16.0 | 7.7 |
| S06 | 38.4 | −0.8 | 18.5 | 315.8 | 64.6 | 15.9 | 7.9 |
| S07 | 35.8 | 1.5 | 18.2 | 263.9 | --- | 16.7 | 8.2 |
| S08 | 35.8 | 1.5 | 18.2 | 261.1 | 63.4 | 16.7 | 8.2 |
| S09 | 34.3 | 1.9 | 17.6 | 412.9 | 74.1 | 15.9 | 7.4 |
| S10 | 38.5 | −1.8 | 18.1 | 239.1 | 63.0 | 16.9 | 8.2 |
| S11 | 36.7 | 1.9 | 18.8 | 246.6 | 65.3 | 16.5 | 7.8 |
| S12 | 36.5 | 0.6 | 18.7 | 212.7 | 67.4 | 17.7 | 8.5 |
| S13 | 36.9 | 0.2 | 18.5 | 202.2 | 62.9 | 17.4 | 8.1 |
| S14 | 37.7 | −2.2 | 17.3 | 298.6 | 73.2 | 16.4 | 7.8 |
| S15 | 35.0 | 3.2 | 18.8 | 342.1 | 73.6 | 16.6 | 8.0 |
| S16 | 34.2 | 1.5 | 18.4 | 279.6 | 72.6 | 16.8 | 7.8 |
| Mean | 36.4 | −0.8 | 17.6 | 281.9 | 68.0 | 16.5 | 7.9 |
Table 3.
Models based on day of the year used in this study.
| Model ID | Model Equations | Reference |
|---|---|---|
| DYB1 | [19] | |
| DYB2 | [20] | |
| DYB3 | [21] | |
| DYB4 | [22] | |
| DYB5 | [23] |
Table 4.
Sunshine-based models used in this study.
| Model ID | Model Equations | Reference |
|---|---|---|
| SBM1 | [25] | |
| SBM2 | [27] | |
| SBM3 | [28] | |
| SBM4 | [29] | |
| SBM5 | [30] |
Table 5.
Cloud-cover-based models used in this study.
| Model ID | Model Equations | References |
|---|---|---|
| CBM1 | [32] | |
| CBM2 | [32,33] | |
| CBM3 | [32] |
Table 6.
Temperature-based models used in this study.
| Model ID | Model Equations | Reference |
|---|---|---|
| TBM1 | [38] | |
| TBM2 | [39] | |
| TBM3 | [40] | |
| TBM4 | [41] | |
| TBM5 | [42] |
Table 7.
Other meteorological-parameter-based models used in this study.
| Model ID | Model Equations | References |
|---|---|---|
| OPM1 | [44] | |
| OPM2 | [44] | |
| OPM3 | [43,45] | |
| OPM4 | [39] | |
| OPM5 | (PPT in cm) | [17] |
Table 8.
Regression coefficients for each of the models tested.
| Model ID | Model Equations | a | b | c | d | e | f | g |
|---|---|---|---|---|---|---|---|---|
| SBM1 | 0.283 | 0.457 | ||||||
| SBM2 | 0.233 | 0.714 | −0.238 | |||||
| SBM3 | 0.223 | 0.829 | −0.508 | 0.173 | ||||
| SBM4 | −0.378 | 0.333 | ||||||
| SBM5 | 0.670 | 0.147 | ||||||
| TBM1 | 0.182 | |||||||
| TBM2 | 0.174 | 0.986 | ||||||
| TBM3 | 0.019 | −0.015 | 0.339 | |||||
| TBM4 | 0.026 | −0.013 | 4.14 | |||||
| TBM5 | 0.673 | 0.220 | 0.990 | |||||
| DYB1 | 16.60 | −8.970 | 0.159 | |||||
| DYB2 | 16.08 | −9.259 | −0.95 | −5.03 | 0.21 | −11.03 | 7.88 | |
| DYB3 | 31.16 | −140.20 | 164.15 | 164.06 | 134.50 | 165.93 | −131.34 | |
| DYB4 | 6.16 | 18.69 | ||||||
| DYB5 | 16.57 | −8.862 | 1.509 | −0.356 | 0.503 | |||
| CBM1 | 0.724 | −0.042 | ||||||
| CBM2 | 0.675 | 0.00305 | −0.00621 | |||||
| CBM3 | 0.673 | 0.00751 | −0.00777 | 0.00014 | ||||
| OPM1 | 1.007 | 0.324 | −0.094 | |||||
| OPM2 | 0.321 | 0.445 | −0.00046 | |||||
| OPM3 | 0.285 | 0.453 | −0.00032 | |||||
| OPM4 | 0.148 | 0.184 | −0.290 | 0.002 | −0.694 | |||
| OPM5 | Parameters do not need to be adjusted and are a function of Tmean and PPT | |||||||
Table 9.
Statistical indicators for the empirical models. The most accurate scores are highlighted in bold type.
Table 9.
Statistical indicators for the empirical models. The most accurate scores are highlighted in bold type.
| MAE | RMSE | MARE | U95 | MRSRE | RRMSE | MBE | R2 | errMax | GPI | |
|---|---|---|---|---|---|---|---|---|---|---|
| SBM1 | 1.23 | 2.32 | 0.101 | 6.42 | 0.268 | 13.78 | 0.050 | 0.909 | 6.264 | 4.814 |
| SBM2 | 1.20 | 2.31 | 0.093 | 6.40 | 0.260 | 13.75 | 0.120 | 0.909 | 5.061 | 5.002 |
| SBM3 | 1.19 | 2.31 | 0.092 | 6.39 | 0.259 | 13.73 | 0.110 | 0.910 | 4.827 | 5.048 |
| SBM4 | 1.46 | 2.40 | 0.108 | 6.62 | 0.258 | 14.30 | 0.369 | 0.902 | 3.393 | 4.673 |
| SBM5 | 1.70 | 2.61 | 0.134 | 7.22 | 0.293 | 15.54 | 0.287 | 0.884 | 3.737 | 3.822 |
| TBM1 | 3.01 | 3.98 | 0.226 | 10.97 | 0.399 | 23.68 | 0.568 | 0.731 | 13.410 | −1.752 |
| TBM2 | 2.97 | 3.94 | 0.233 | 10.93 | 0.422 | 23.50 | 2.64 × 10⁻¹ | 0.735 | 13.620 | −1.722 |
| TBM3 | 2.74 | 3.62 | 0.224 | 10.03 | 0.421 | 21.59 | 0.304 | 0.776 | 13.734 | −0.827 |
| TBM4 | 2.88 | 3.83 | 0.232 | 10.61 | 0.425 | 22.80 | 1.28 × 10⁻¹ | 0.751 | 13.584 | −1.353 |
| TBM5 | 2.80 | 3.69 | 0.223 | 10.17 | 0.419 | 21.97 | 0.548 | 0.769 | 13.991 | −1.080 |
| DYB1 | 3.13 | 3.99 | 0.261 | 11.01 | 0.489 | 23.73 | 5.10 × 10⁻¹ | 0.729 | 14.093 | −2.437 |
| DYB2 | 3.13 | 4.00 | 0.261 | 11.05 | 0.489 | 23.82 | 5.14 × 10⁻¹ | 0.728 | 14.123 | −2.478 |
| DYB3 | 3.15 | 4.03 | 0.264 | 11.12 | 0.495 | 23.95 | 0.478 | 0.724 | 13.922 | −2.556 |
| DYB4 | 3.20 | 4.07 | 0.267 | 11.24 | 0.492 | 24.23 | 5.34 × 10⁻¹ | 0.718 | 15.072 | −2.813 |
| DYB5 | 3.12 | 4.00 | 0.260 | 11.05 | 0.490 | 23.80 | 4.79 × 10⁻¹ | 0.728 | 14.583 | −2.494 |
| CBM1 | 1.90 | 2.87 | 0.157 | 8.19 | 0.335 | 19.58 | 0.385 | 0.841 | 11.011 | 1.821 |
| CBM2 | 1.86 | 2.85 | 0.149 | 8.10 | 0.318 | 19.42 | 0.472 | 0.844 | 10.910 | 2.000 |
| CBM3 | 1.86 | 2.85 | 0.149 | 8.10 | 0.318 | 19.42 | 0.470 | 0.844 | 10.872 | 2.000 |
| OPM1 | 1.30 | 2.28 | 0.097 | 6.50 | 0.245 | 15.48 | 0.297 | 0.899 | 3.365 | 4.855 |
| OPM2 | 1.12 | 2.22 | 0.092 | 6.36 | 0.258 | 15.06 | 0.043 | 0.904 | 6.263 | 4.881 |
| OPM3 | 1.13 | 2.22 | 0.093 | 6.37 | 0.259 | 15.10 | 0.061 | 0.904 | 6.293 | 4.847 |
| OPM4 | 2.83 | 3.77 | 0.220 | 10.46 | 0.386 | 22.48 | 1.80 × 10⁻¹ | 0.758 | 7.444 | −0.479 |
| OPM5 | 2.84 | 3.65 | 0.209 | 8.86 | 0.356 | 21.73 | −2.486 | 0.774 | 4.792 | 1.348 |
Disclaimer/Publisher’s Note: The statements, opinions and data contained in all publications are solely those of the individual author(s) and contributor(s) and not of MDPI and/or the editor(s). MDPI and/or the editor(s) disclaim responsibility for any injury to people or property resulting from any ideas, methods, instructions or products referred to in the content. |
© 2023 by the authors. Licensee MDPI, Basel, Switzerland. This article is an open access article distributed under the terms and conditions of the Creative Commons Attribution (CC BY) license (https://creativecommons.org/licenses/by/4.0/).
Share and Cite
MDPI and ACS Style
Vernet, A.; Fabregat, A. Evaluation of Empirical Daily Solar Radiation Models for the Northeast Coast of the Iberian Peninsula. Energies 2023, 16, 2560. https://doi.org/10.3390/en16062560
AMA Style
Vernet A, Fabregat A. Evaluation of Empirical Daily Solar Radiation Models for the Northeast Coast of the Iberian Peninsula. Energies. 2023; 16(6):2560. https://doi.org/10.3390/en16062560
Chicago/Turabian StyleVernet, Anton, and Alexandre Fabregat. 2023. "Evaluation of Empirical Daily Solar Radiation Models for the Northeast Coast of the Iberian Peninsula" Energies 16, no. 6: 2560. https://doi.org/10.3390/en16062560
Note that from the first issue of 2016, this journal uses article numbers instead of page numbers. See further details here.