
Evaluation of a Three-Parameter Gearshift Strategy for a Two-Speed Transmission System in Electric Vehicles

1
Department of Mechanical Engineering and Product Design Engineering, Swinburne University of Technology, Hawthorn, VIC 3122, Australia
2
School of Software and Electrical Engineering, Swinburne University of Technology, Hawthorn, VIC 3122, Australia
3
School of Engineering, Deakin University, Waurn Ponds, Geelong, VIC 3216, Australia
*
Authors to whom correspondence should be addressed.
Energies 2023, 16(5), 2496; https://doi.org/10.3390/en16052496
Submission received: 23 February 2023
/
Revised: 3 March 2023
/
Accepted: 4 March 2023
/
Published: 6 March 2023
Abstract
:This paper proposes a three-parameter gearshift scheduling strategy that has been implemented on both large and small electric vehicles with two-speed transmission systems. The new strategy evaluates vehicle performance under varying driving conditions on flat and hilly roads by assessing the vehicle speed, acceleration, and road grade. A heuristic approach is used to develop two gearshift schedules for vehicle acceleration and road grade, and gradient descent and pattern search methods are applied to optimize the gear ratios and primary gearshift schedules. The results show that the proposed gearshift strategy saves 16.5% of energy on hilly roads compared to conventional approaches. Optimal gearshift schedules for acceleration provide more room for second gear operation, while optimized gearshift schedules for the road grade increase the buffer zone for larger vehicles and allow more space for the second gear operating area. The experimental results validate the proposed approach’s performance for both large and small electric vehicles.
1. Introduction
In many studies [1,2,3], it has been shown that introducing a multi-speed transmission system in the electric vehicle (EV) powertrain could be an effective solution to improve both the economic and dynamic performances. Adding more gears in the transmission system [4,5,6] offers the opportunity to select an appropriate gear depending on various vehicle requirements, i.e., faster acceleration, a higher maximum speed, driving on steep roads, etc. In addition, a multi-gear system can ensure the efficient operation of the traction motor in all driving conditions and, thus, save energy consumption [7,8]. Having these benefits, several difficulties, i.e., choosing an accurate gear ratio, switching to a suitable gear, torque interruption during gearshift, transmission loss, etc., in the multi-gear transmission system have been demonstrated in a review paper by Ahssan et al. [1].
Over the last few years, substantial studies have been carried out in relation to the gear ratio and gear shifting strategy. While several methods, i.e., the multi-objective genetic algorithm [9], non-dominated sorting genetic algorithm (NSGA-II) [10], NSGA-III [5], dynamic programming [11], genetic algorithm [12,13], brute force iterative algorithm [14,15], simulated-annealing particle-swarm-optimization (SAPSO) algorithm [16], etc., have focused on gear ratio optimization, other researchers [4,17,18,19,20,21] have focused on the gear ratio and gearshift strategy both separately or combinedly. In these studies, a rule-based gearshift schedule strategy (i.e., throttle demand vs. vehicle speed) has been used during the optimization of the gear ratios. Although this type of gearshift schedule is generated based on targeting the motor efficiency, it remains fixed during the vehicle operation. Therefore, the rule-based gearshift strategy suffers from a drawback in selecting the appropriate gear at different driving conditions and, thus, the vehicle performances are compromised.
Recently, Ahssan et al. [22] offered a gearshift strategy that considers both the vehicle speed, acceleration and road grade to select the most appropriate gear. It has been shown that all possible driving conditions can be addressed with this proposed gearshift schedule. It was found that the energy consumption on a flat road considering this proposed strategy was 3.0–5.0% higher compared to that with conventional approaches while this strategy can save around 18% energy on hilly road conditions. It was noticed that the results in [22] were based on a simulation considering large-size electric vehicles. As a relatively novel approach, the three parameter-based gearshift strategy for a two-speed transmission system will be investigated considering both large size and small size electric vehicles under two different traction motors with experimental evidence. On that note, the next section will briefly demonstrate a further review of the guidelines in [22] to develop the primary gearshift schedule considering the multiple combinations of EV powertrains. A simulation as well as experimental results are presented in Section 3. Section 4 is about analyzing the experimental data to validate the simulation results followed by a conclusion in Section 5.
2. Gearshift Strategy for Two-Speed EV
The gearshift strategy in [22] is further reviewed considering two different size vehicles and two electric motors to build up a comprehensive understanding on the proposed gearshift schedule for a two-speed transmission system. Along with the new work, only the critical information from [22] has been presented in this paper.
2.1. EV Powertrain Components
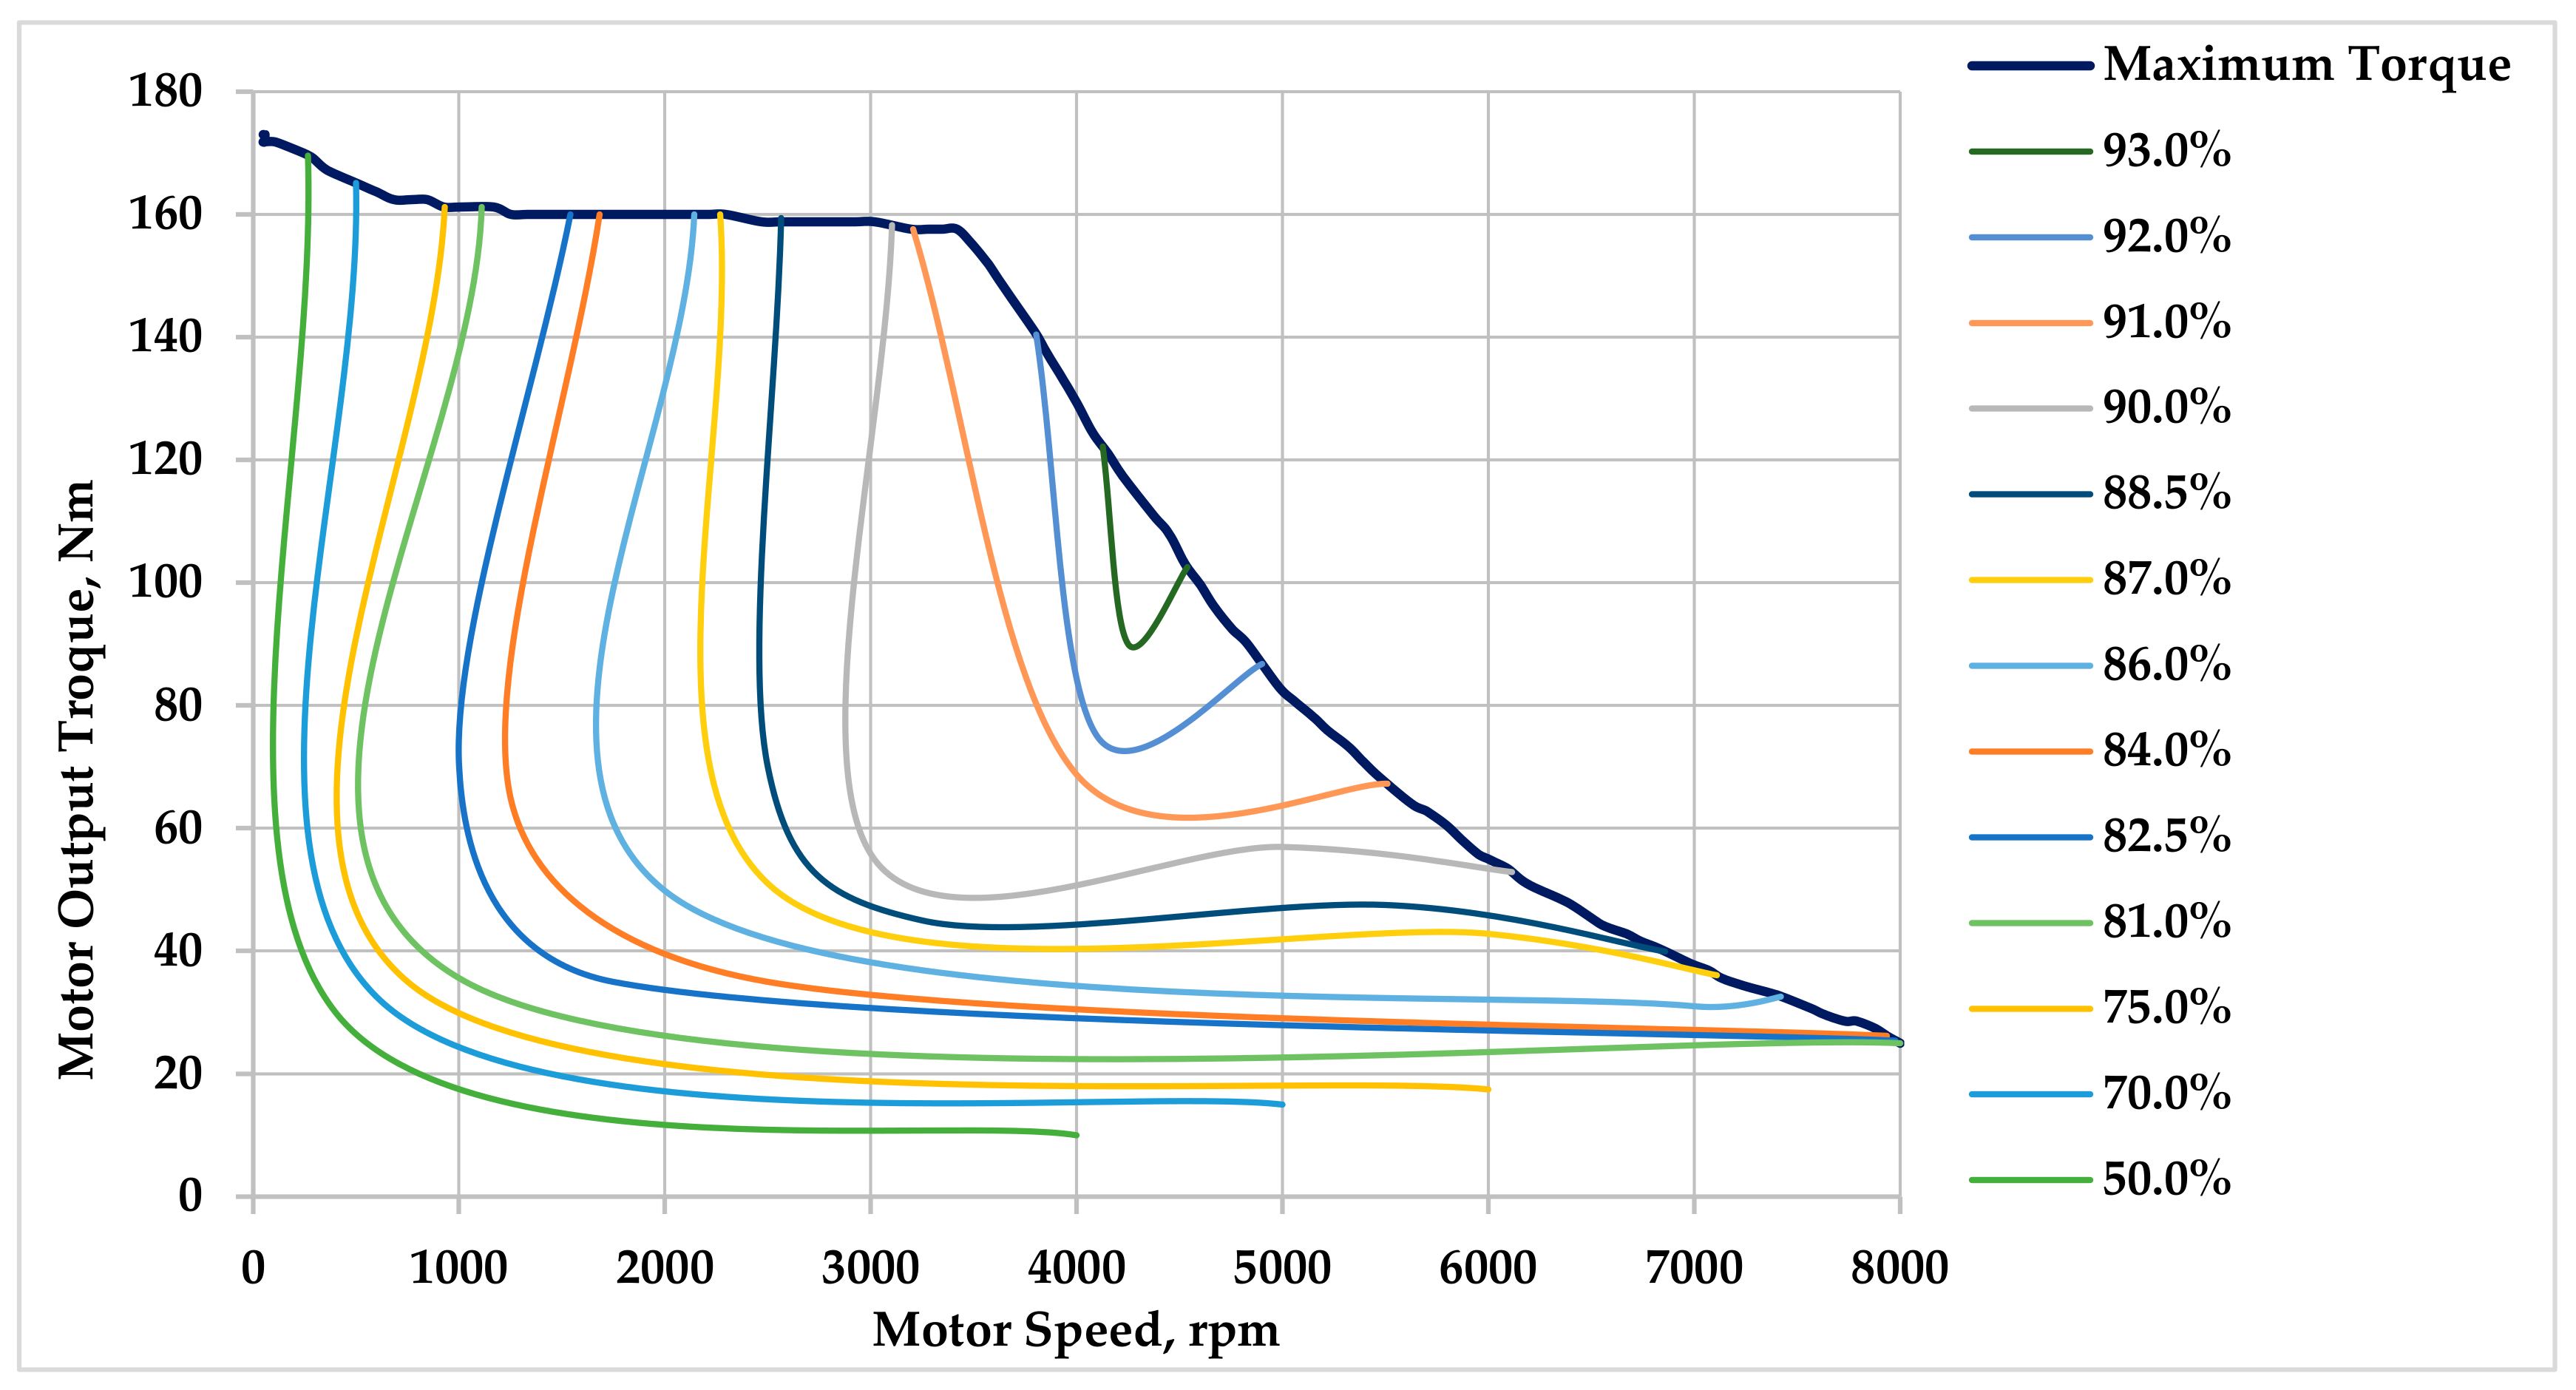
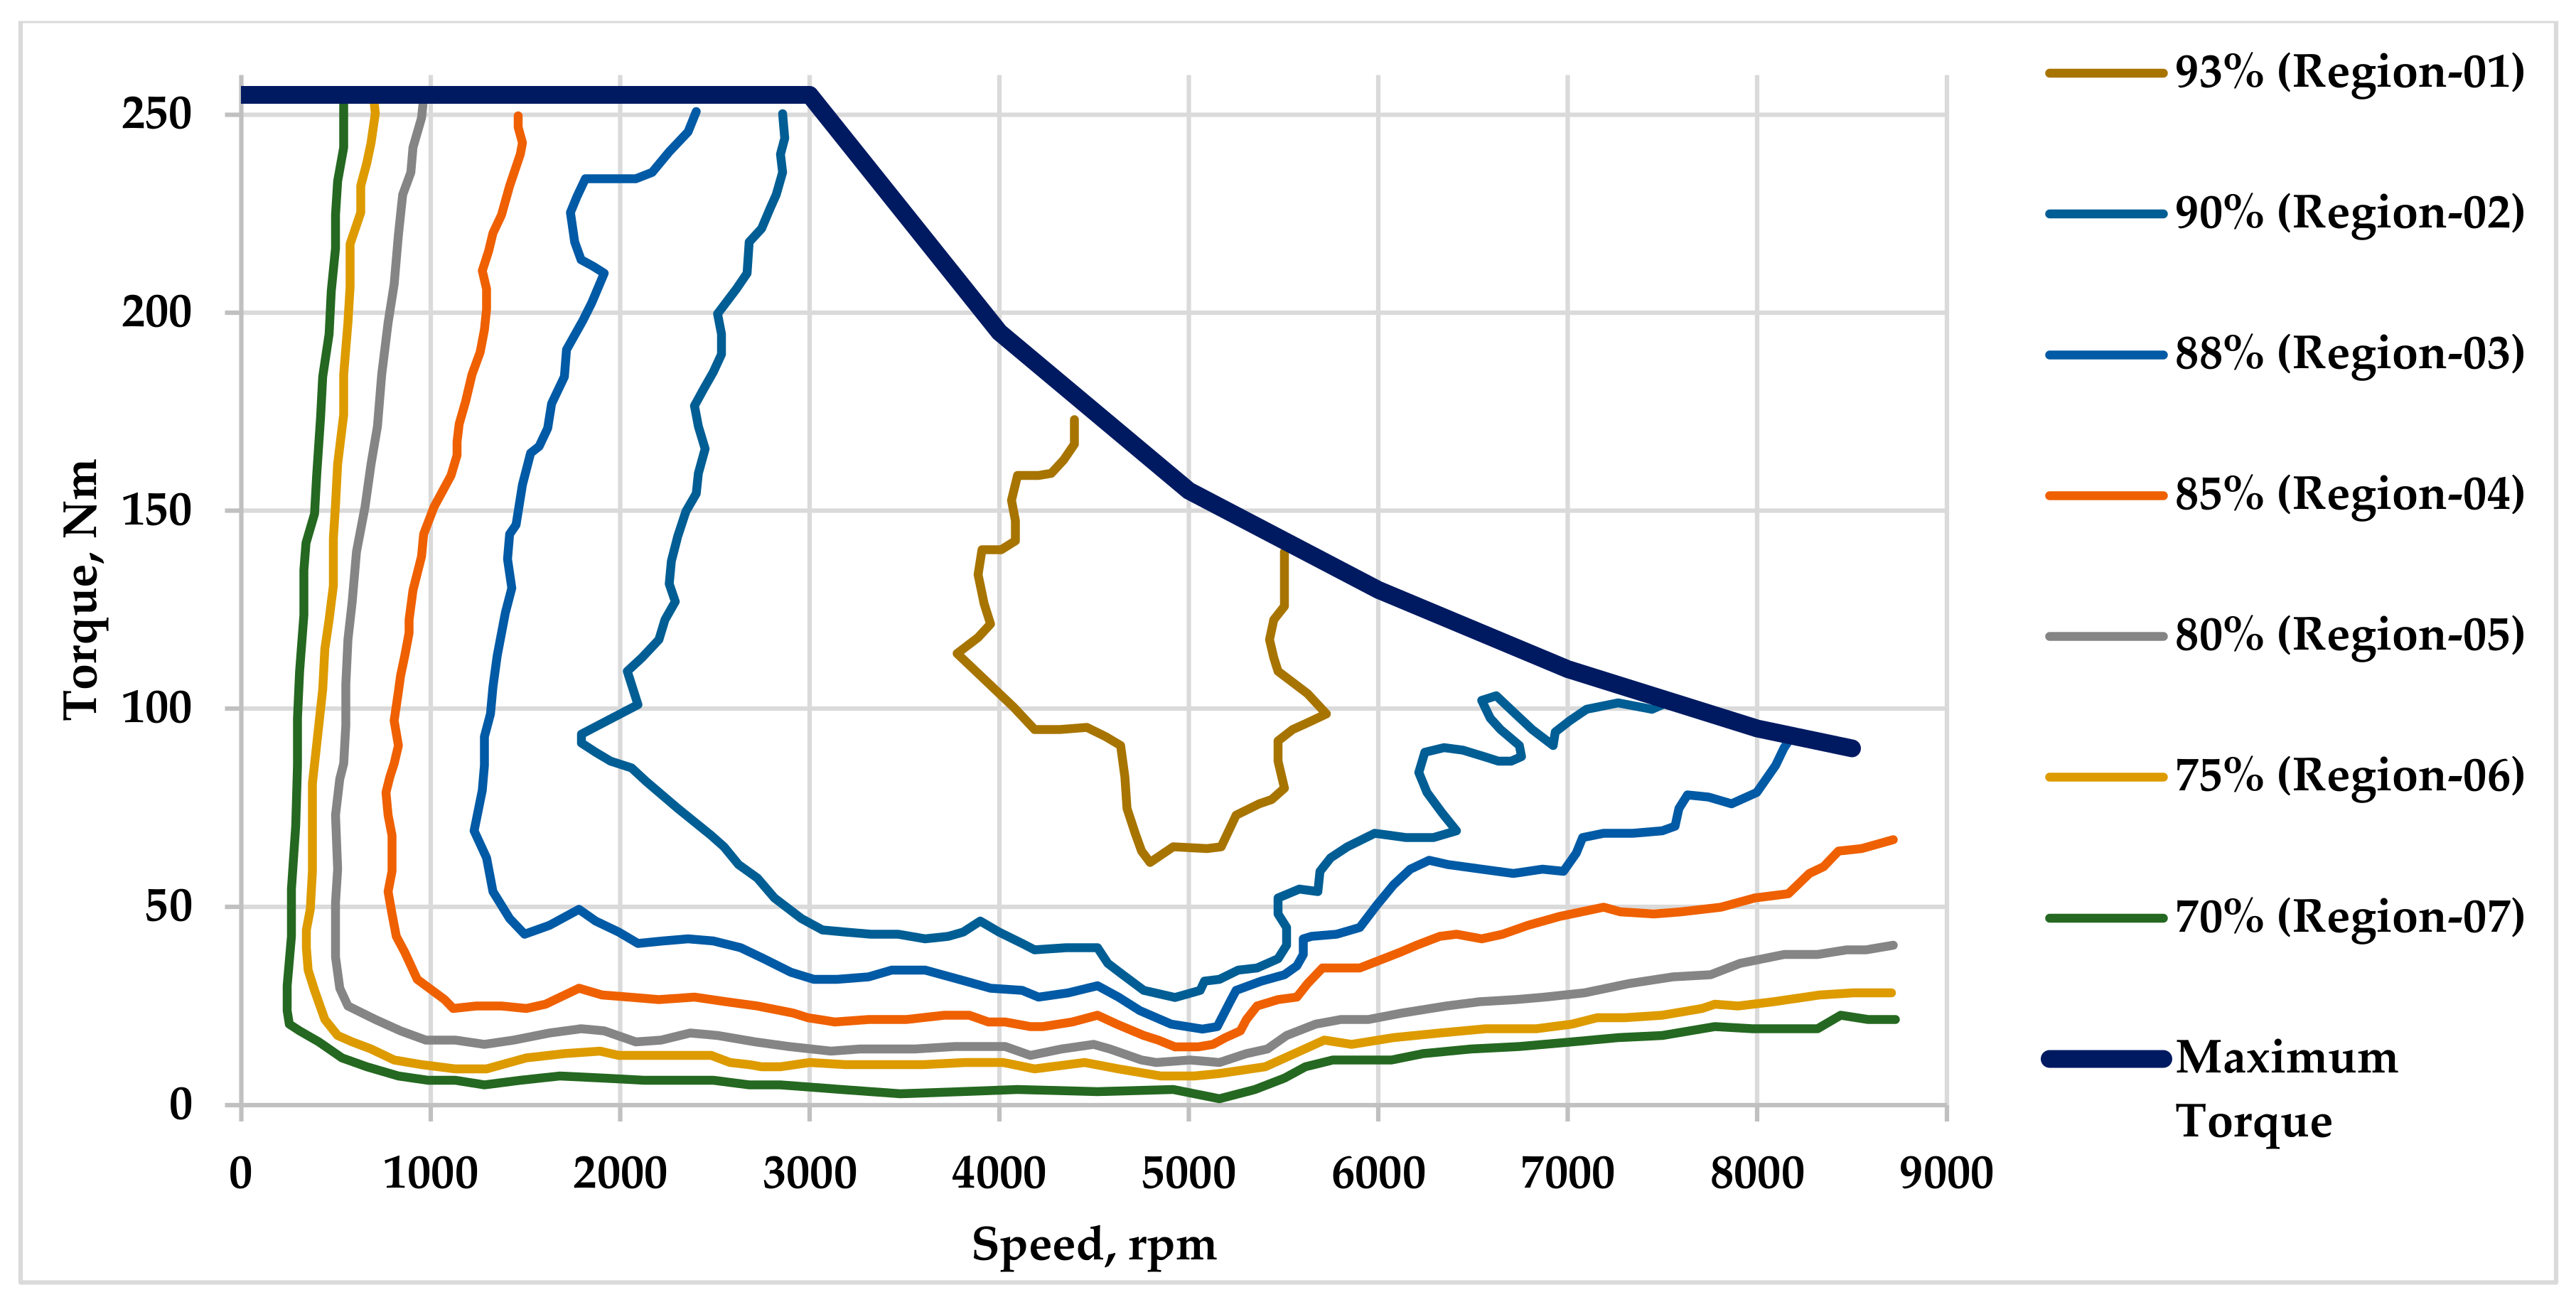
Table 1 shows the parameters of small and large size vehicles that have been considered to evaluate the performances of the two-speed transmission system in EV. The electric motor EM-A in Table 2 is the one that was installed in the test EV. The efficiency map of EM-A (Figure 1) was generated based on the supplied data from the manufacturer while the map for EM-B (Figure 2) was collected from [17]. The majority of EVs do not have multi-speed transmissions. Instead, a single-speed transmission is provided. Electric motors can produce a high torque from zero speed. Moreover, they have the capability to rotate at a high speed higher than 10,000 rpm. These two efficiency maps (Figure 1 and Figure 2), however, indicate that through employing two or more gears in the transmission system, it is possible to operate an electric motor around the most efficient region at various driving conditions, thus, saving energy consumption.
A similar battery capacity and the two-speed automatic manual transmission (AMT) system were used in this study. For simulation purposes, the transmission efficiency was considered as 90% on the first gear and 95% on the second gear. Reviewing multiple literatures [5,10,23,24], this study was carried out considering the vehicle dynamic performance targets (Table 3) from [22]. It is expected that the two-speed EV with the proposed gearshift strategy will maintain these targets at a minimum possible energy consumption.
2.2. Developing Gearshift Schedule
Because of the novelty in the three-parameter gearshift strategy compared to the conventional rule-based approaches, further investigation was made in this section considering both the small and large size EV. The first parameter, i.e., the vehicle speed, was set around the electric motor rated speed (i.e., 3200 rpm for the EM-A and 3000 rpm for the EM-B), that was relatively simple compared to that with the other two parameters. Therefore, following the guidelines in [22], the development of the primary gearshift maps for the vehicle acceleration and road grade are briefly demonstrated in this section.
2.2.1. Analyzing Motor Output Requirements during Vehicle Acceleration
While the lower gear, i.e., gear 1, is the only option in the low-speed region and the higher gear, i.e., gear 2, is the option in the higher speed region, any gear could meet the torque demand at the vehicle speed range between 20 km/h to 45–55 km/h. Several transition points within this speed range were spotted based on the motor capacity following the steps in Figure 3. An imaginary separation line was drawn by connecting these points. To identify these transition points, the motor torque and power requirements for multiple driving scenarios will be drawn and analyzed in the next few paragraphs.
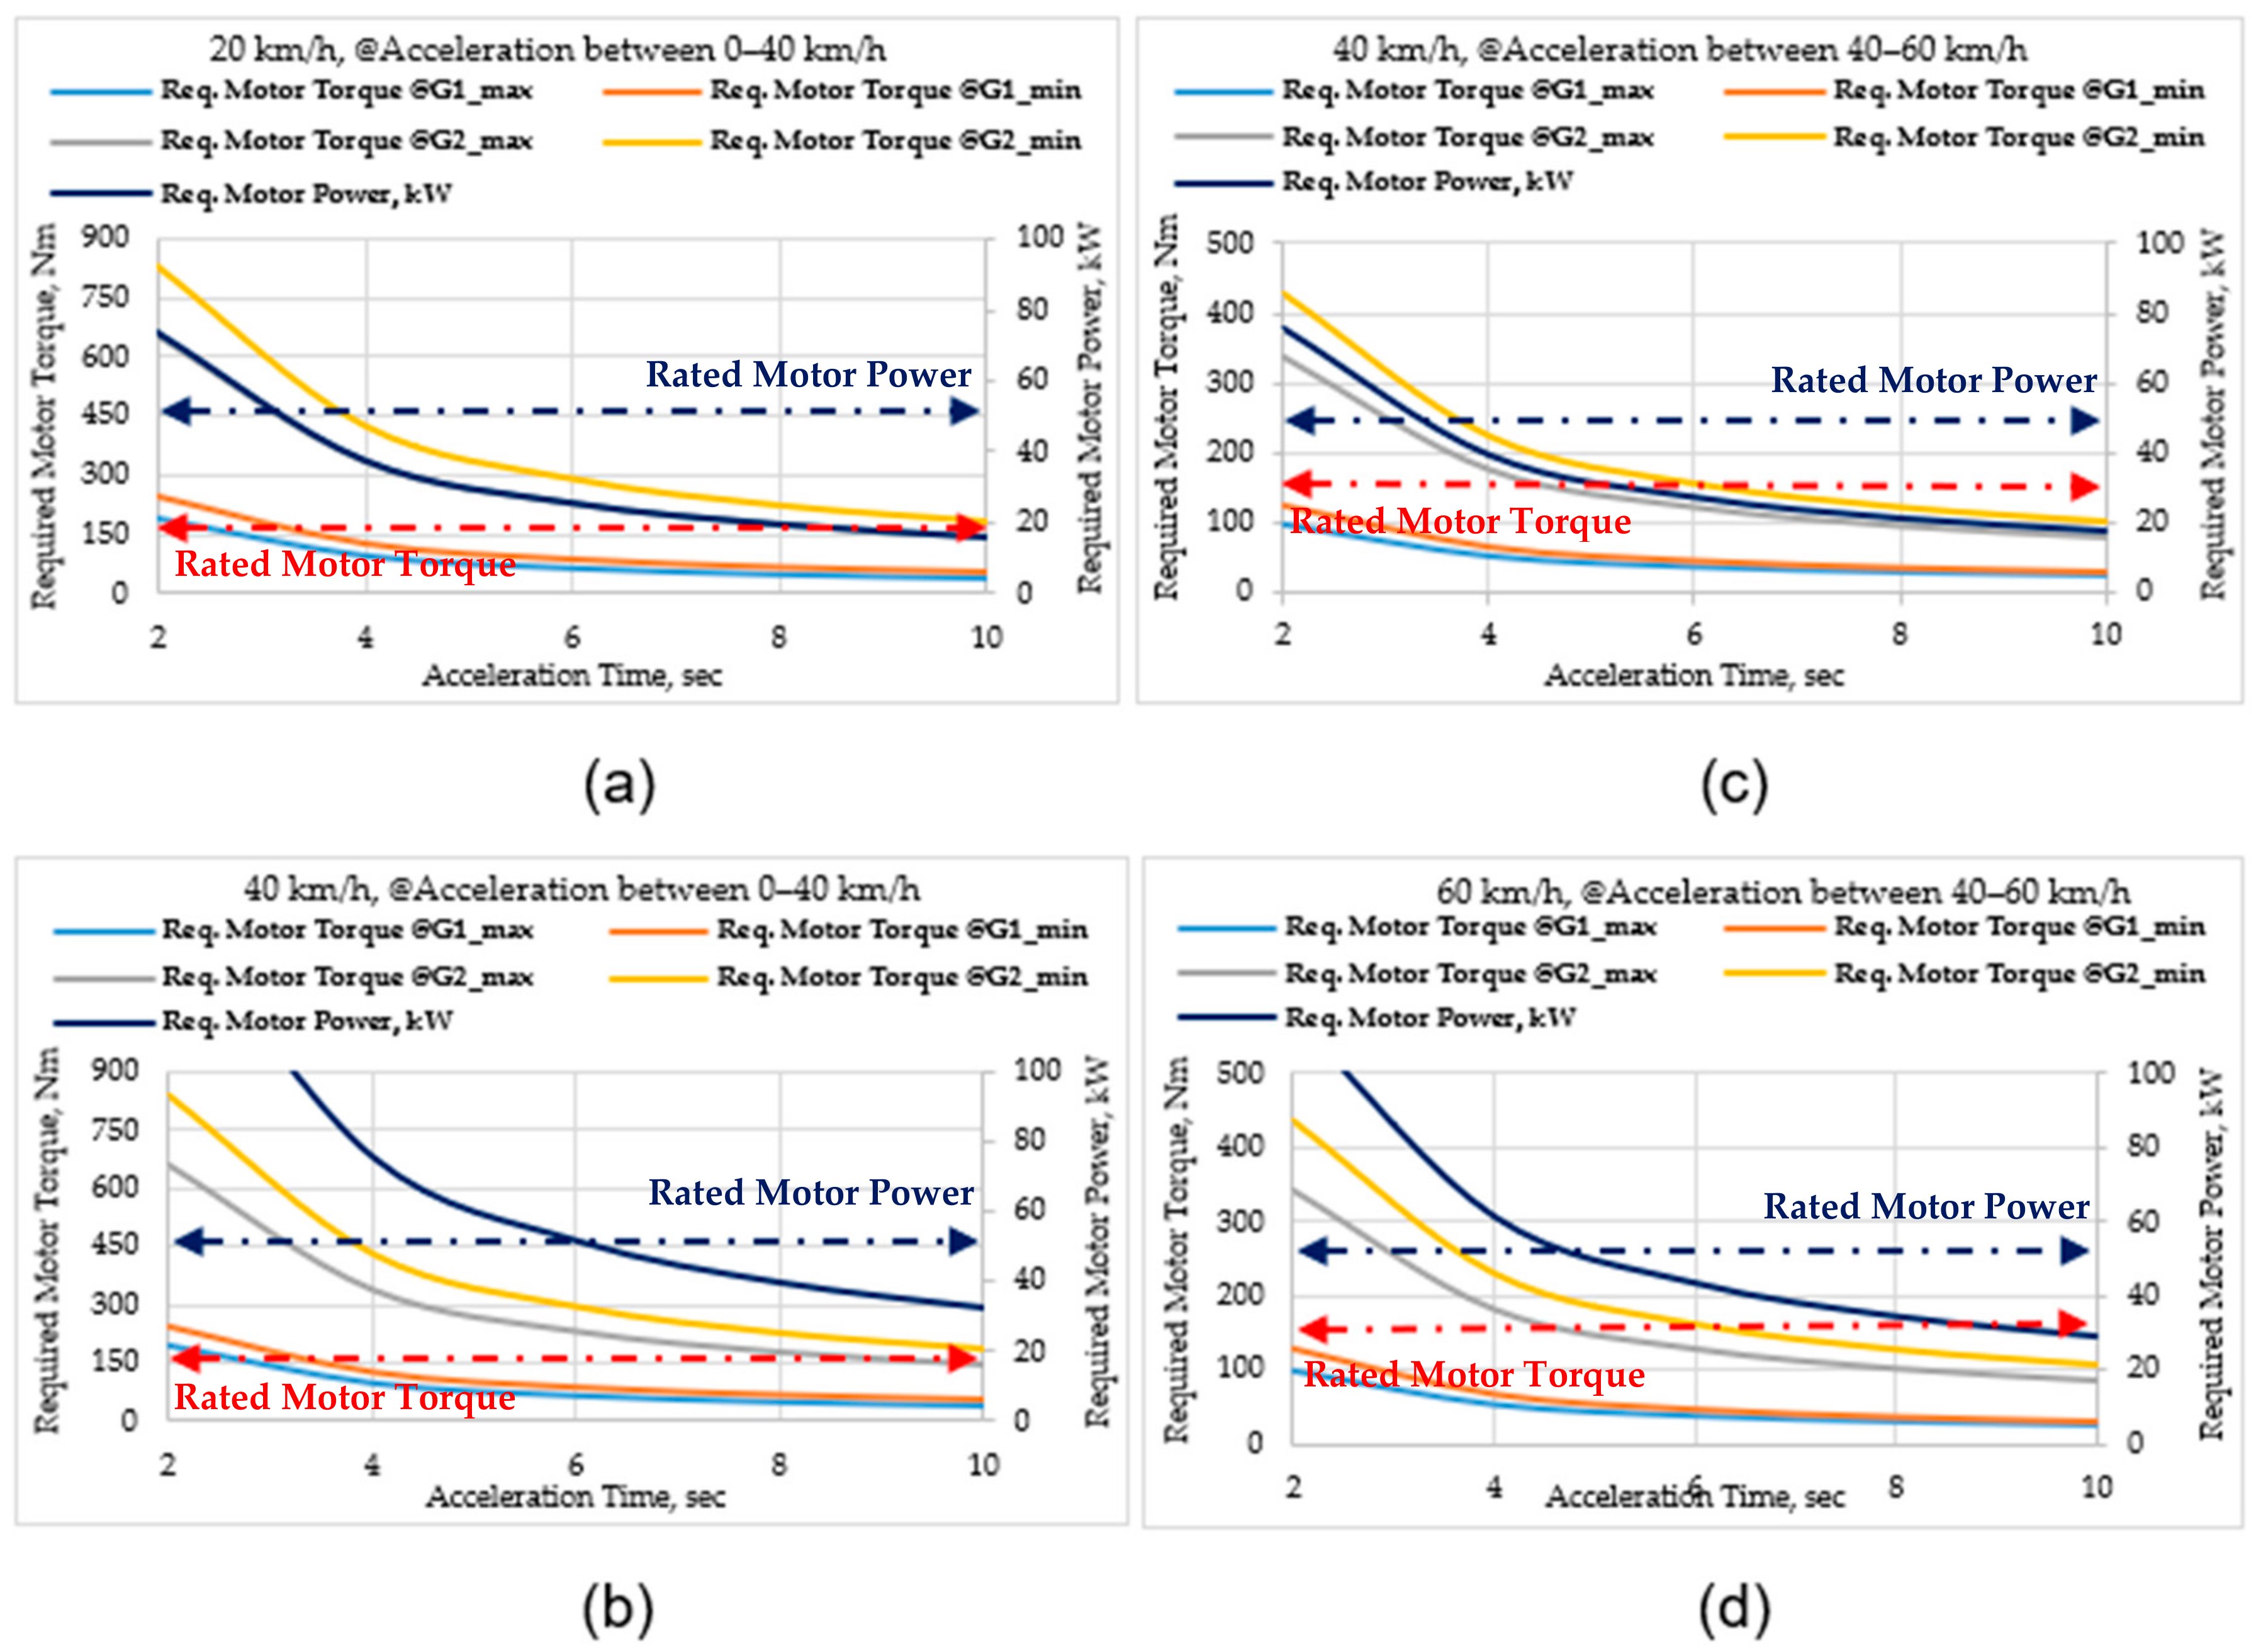
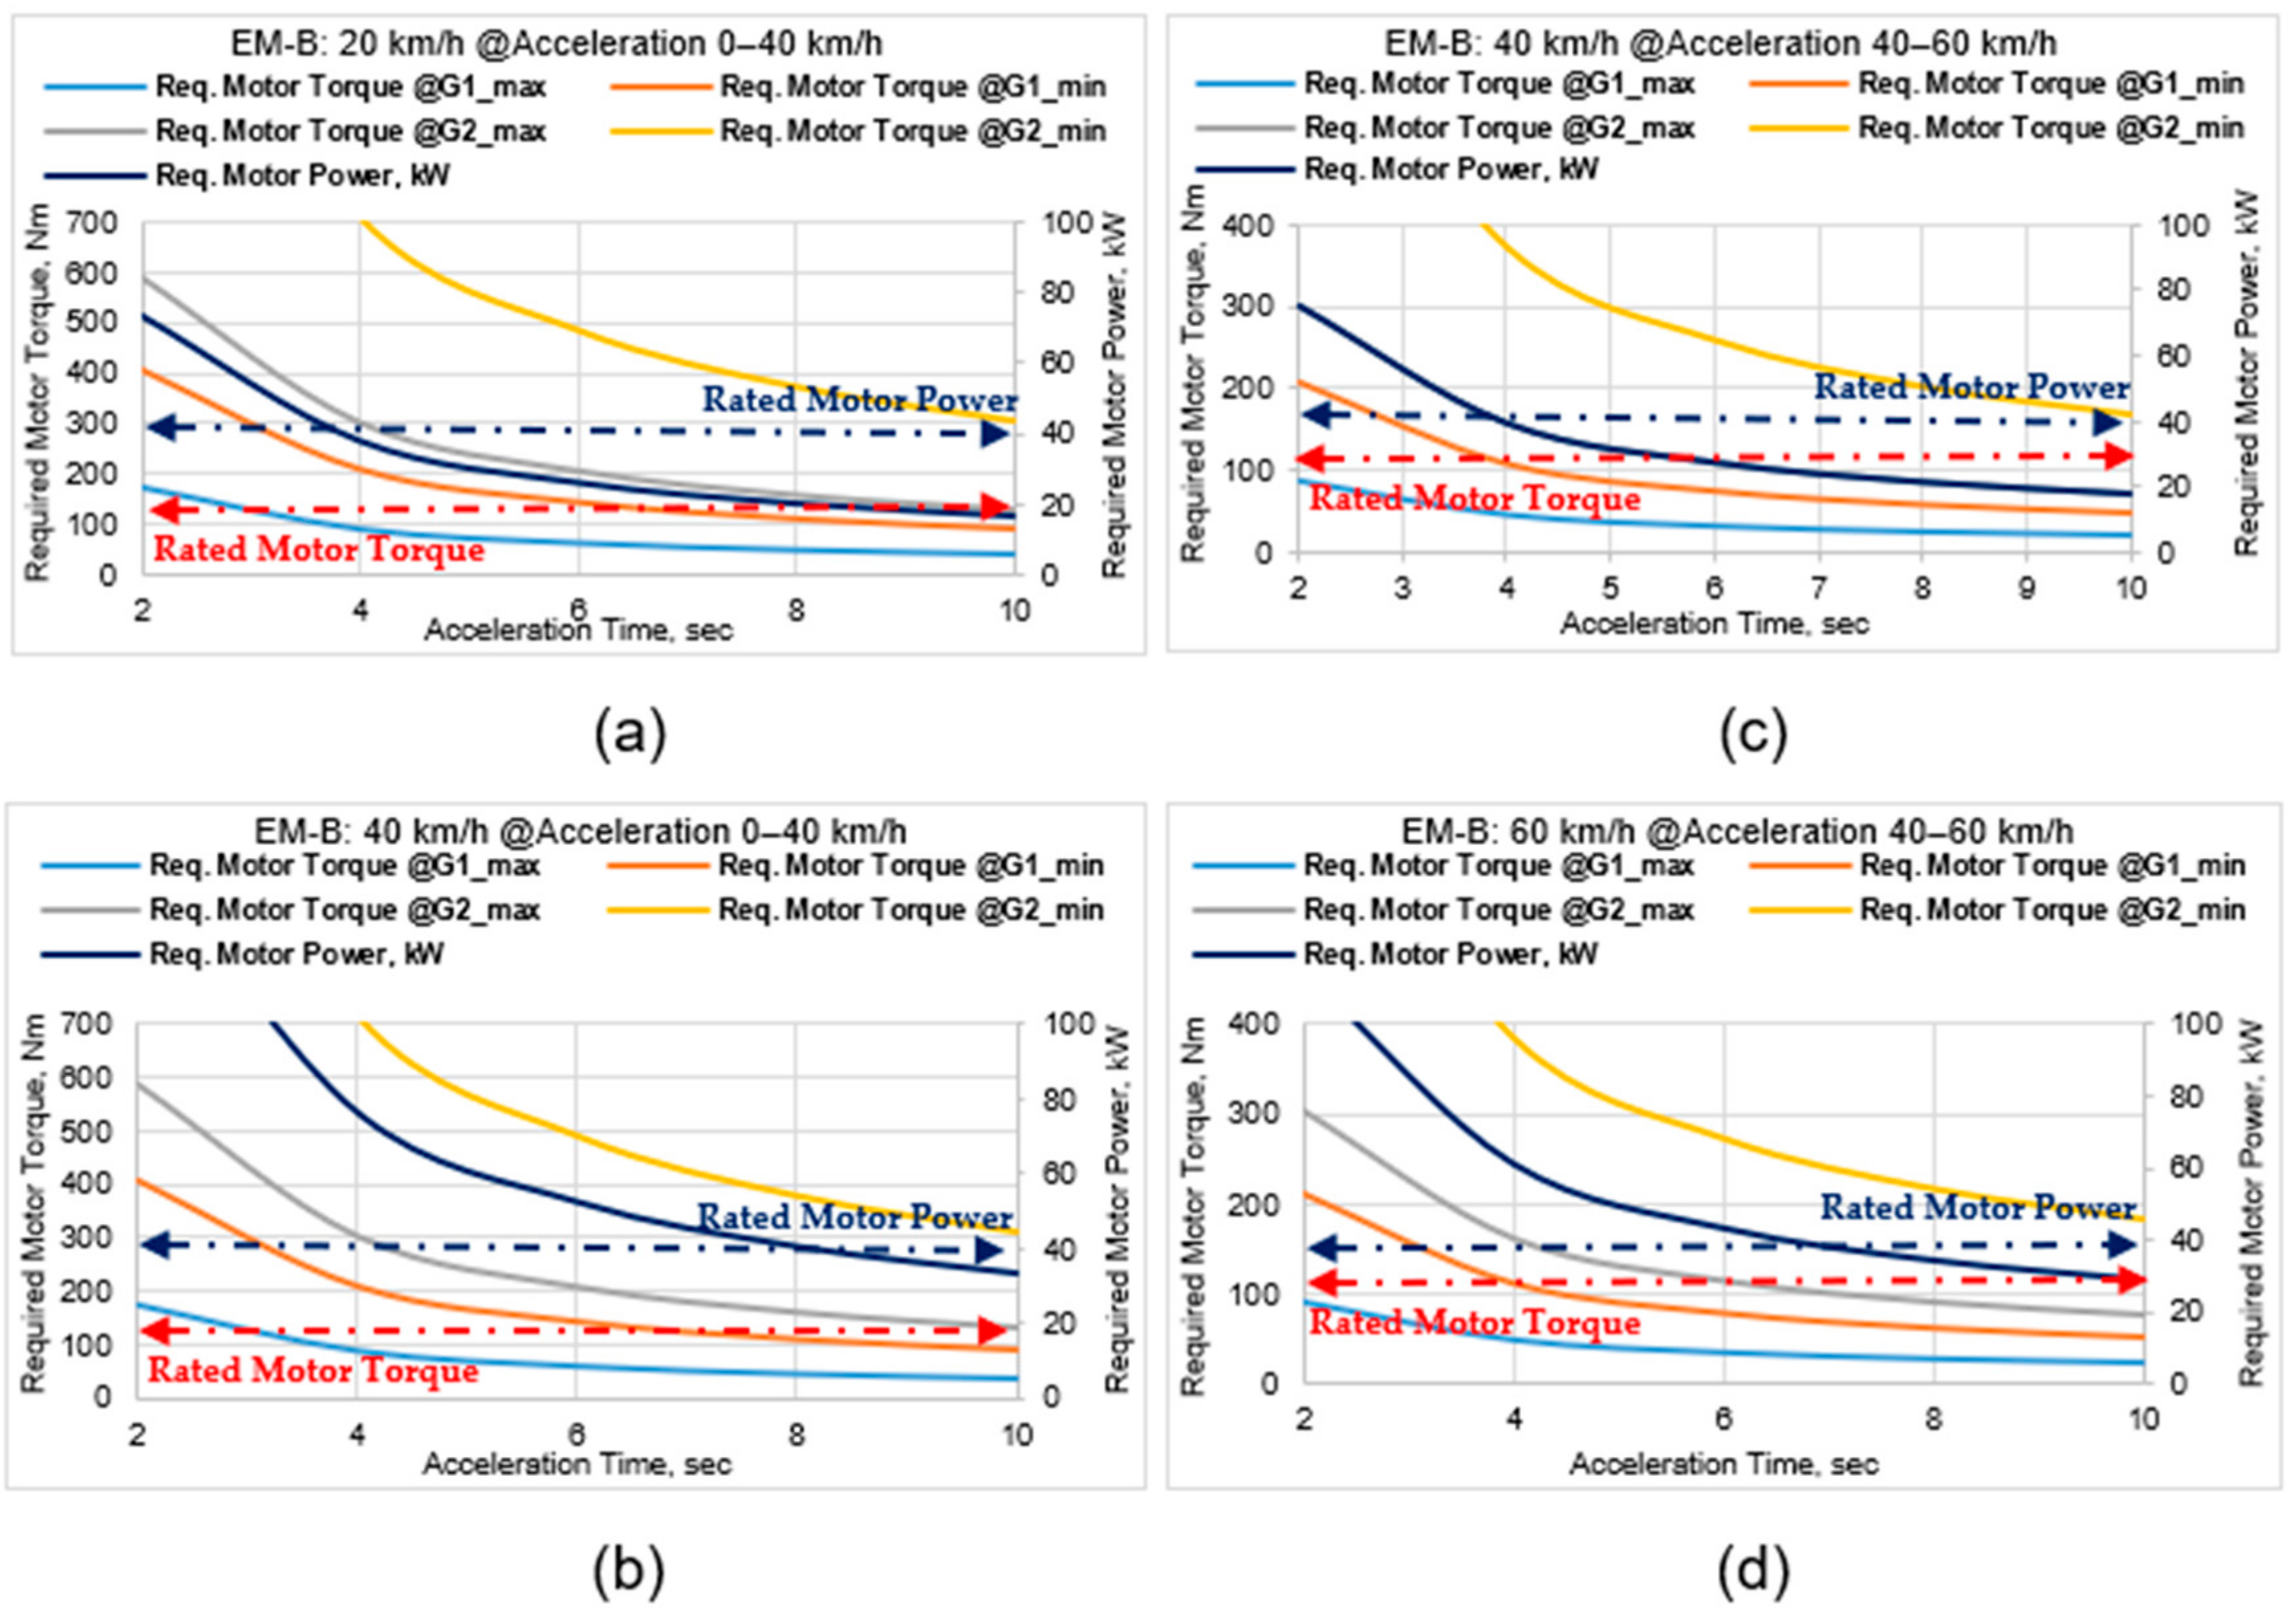
The charts in Figure 4 and Figure 5 show the motor torque and power requirements on two different electric powertrains on both gears following Equation (1) [13] and Equation (2), respectively, where the symbols can be described as the powertrain efficiency, ; gear ratios, ; mechanical power of motor, ; loss of motor power, ; motor speed, ; and motor efficiency, . The acceleration from the vehicle stop condition or 0 km/h to 40 km/h and the acceleration from 40 km/h to 60 km/h were considered as the critical phase for the gearshift decision because of their frequent appearance in the urban driving scenario. To identify the transition points in relation to the vehicle acceleration, it was necessary to analyze the torque as well as the power demand behavior in all four driving scenarios:
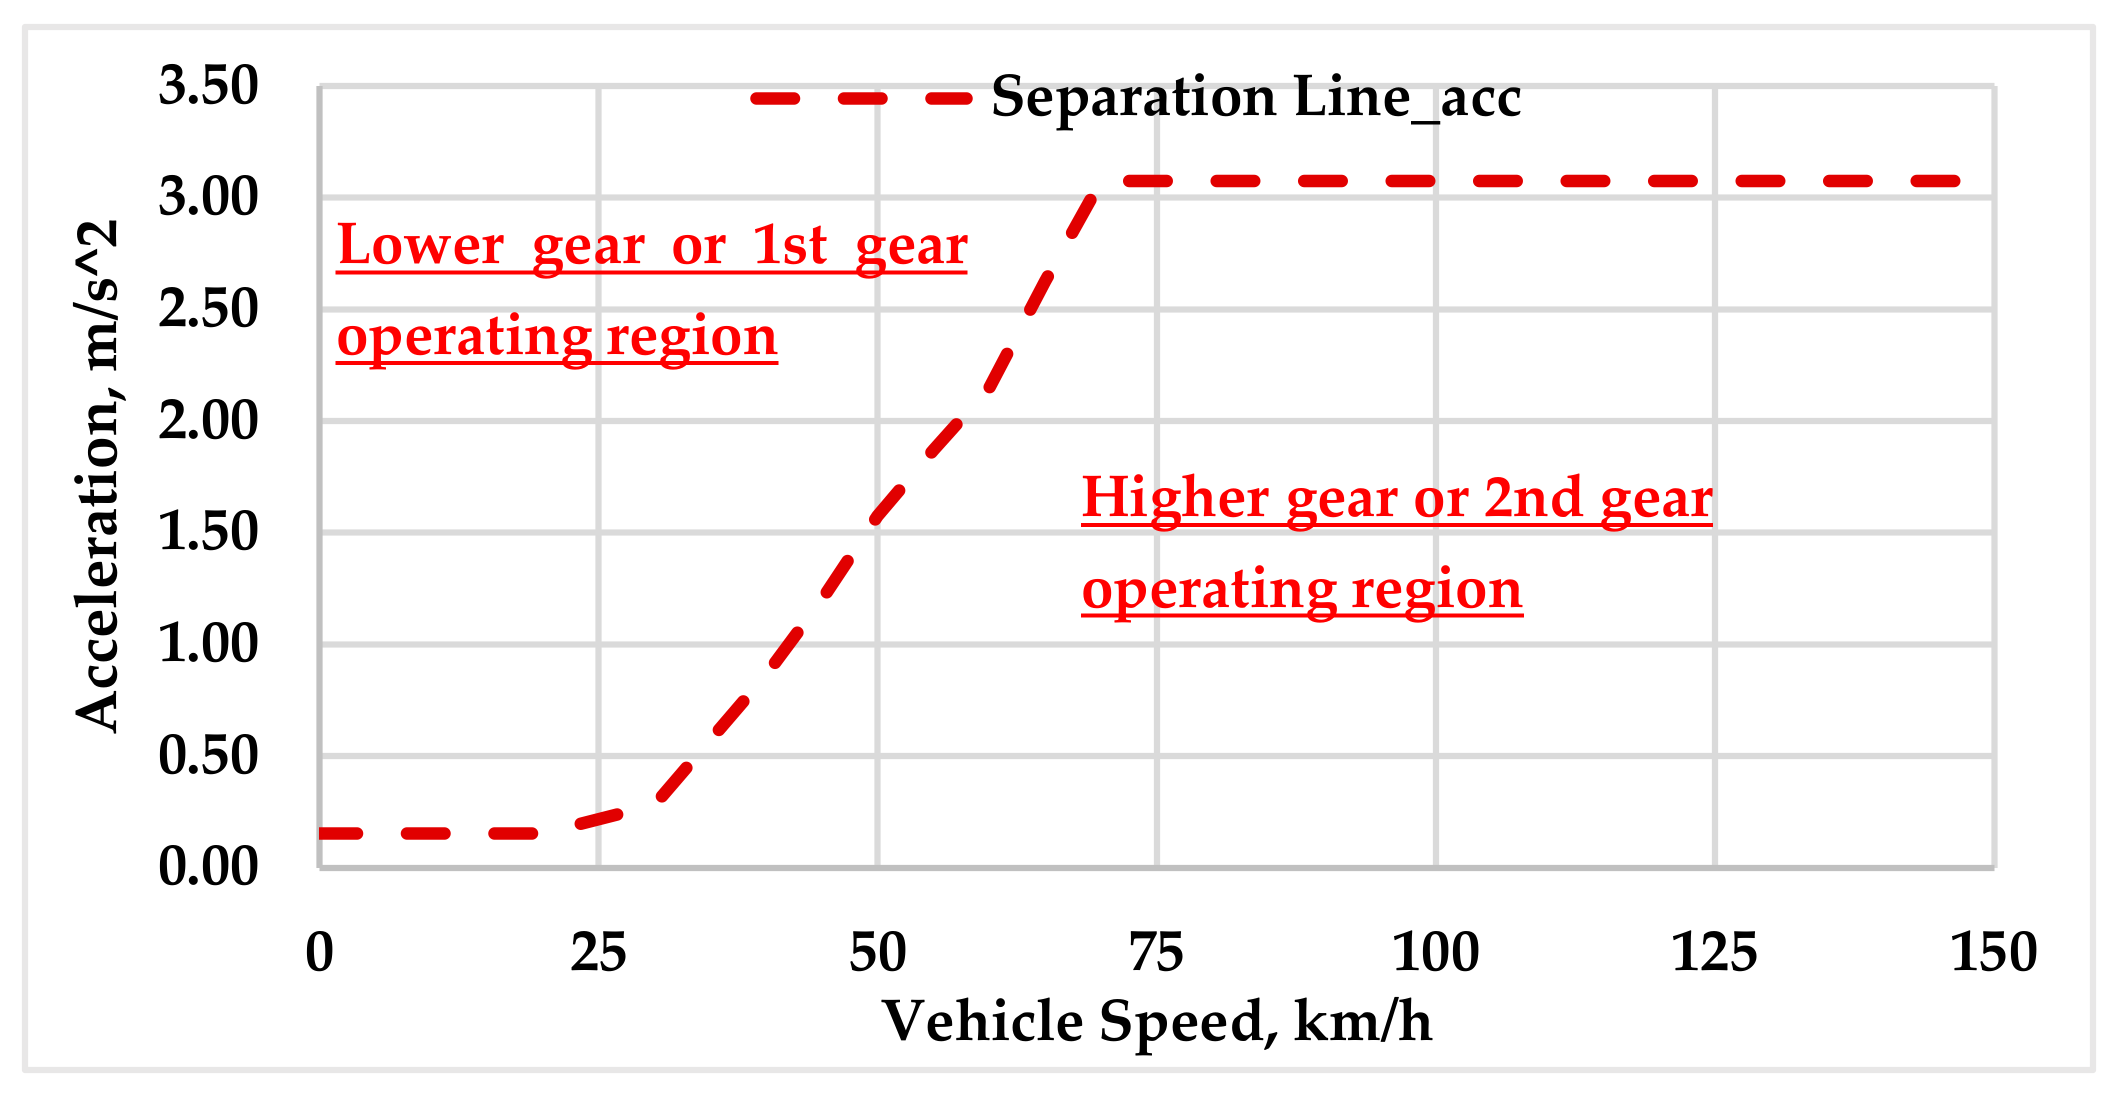
In Figure 4 and Figure 5, the speed difference as well as the acceleration time for an acceleration range played a major role in how much torque would be necessary to achieve the desired acceleration. Being similar power requirements in both figures, focus was made on analyzing the torque demand behavior. During a faster acceleration (i.e., an acceleration time up to 4 s), the torque requirement in gear 1 could be met mostly because of the torque demand around the rated motor torque capacity. To the other end, a sky-high torque requirement could be noticed in gear 2 during a faster acceleration making this gear not an option during rapid acceleration. A steep drop in the torque demand for the acceleration time from 2 s to 4 s could be spotted in gear 2. For the smooth or gradual acceleration (i.e., an acceleration time over 4 s), a slow drop in the motor torque demand for any gear could be noted This torque demand behavior in gear 2 brought forward the issue of what gear would be the most appropriate choice in this gradual acceleration phase. Unlike the case with the torque demand lines related to gear 2 in the acceleration range from 0 km/h to 40 km/h, the torque lines for gear 2 in the acceleration range from 40 km/h to 60 km/h appeared mostly close to the rated motor torque capacity. For the acceleration scenario in this mid-speed range, the power requirements could be easily met with the existing motor rated power capacity. With gear 2 being the obvious selection at the higher speed range, it can be surmised that a transition region of a gearshift might exist between the speed range of 35 km/h to 50–55 km/h. Based on a visual observation of the distribution of the motor torque as well as the power demand on each gear, several transition points could be identified. These transition points would lead to generating the gearshift transition line or gear separation line in relation to the vehicle acceleration as shown in Figure 6.
Next, the charts in Figure 7 represent the motor output requirements for a small vehicle considering the electric motor, EM-A. For different combinations of vehicle size and electric motor, the motor output requirements were varied because of the different upper and lower bound of each gear. Several factors, i.e., the vehicle mass, wheel radius, motor maximum capacities (i.e., torque and speed) and step ratio were the major contributors behind these differences. An initial observation shown in Figure 4, Figure 5 and Figure 7 was that similar patterns on both the torque and power behavior could be perceived in all three combinations of the vehicle size and electrical motor; however, both the torque and power demands in the small vehicle stayed widely within the rated motor torque and power capacities compared to those in the other two cases. This leads to an understanding that the electric motor could be operated on a second or higher gear in a wider region when the vehicle size is small. Therefore, the gear transition phase of the gear separation line as drawn in Figure 6 could be shifted upwards for a small size vehicle allowing more operating area for a higher gear or gear 2. Next, the shifting of the gear separation line will be demonstrated here through an optimization in a simulation environment.
2.2.2. Analyzing Motor Output Requirements on a Hilly Road
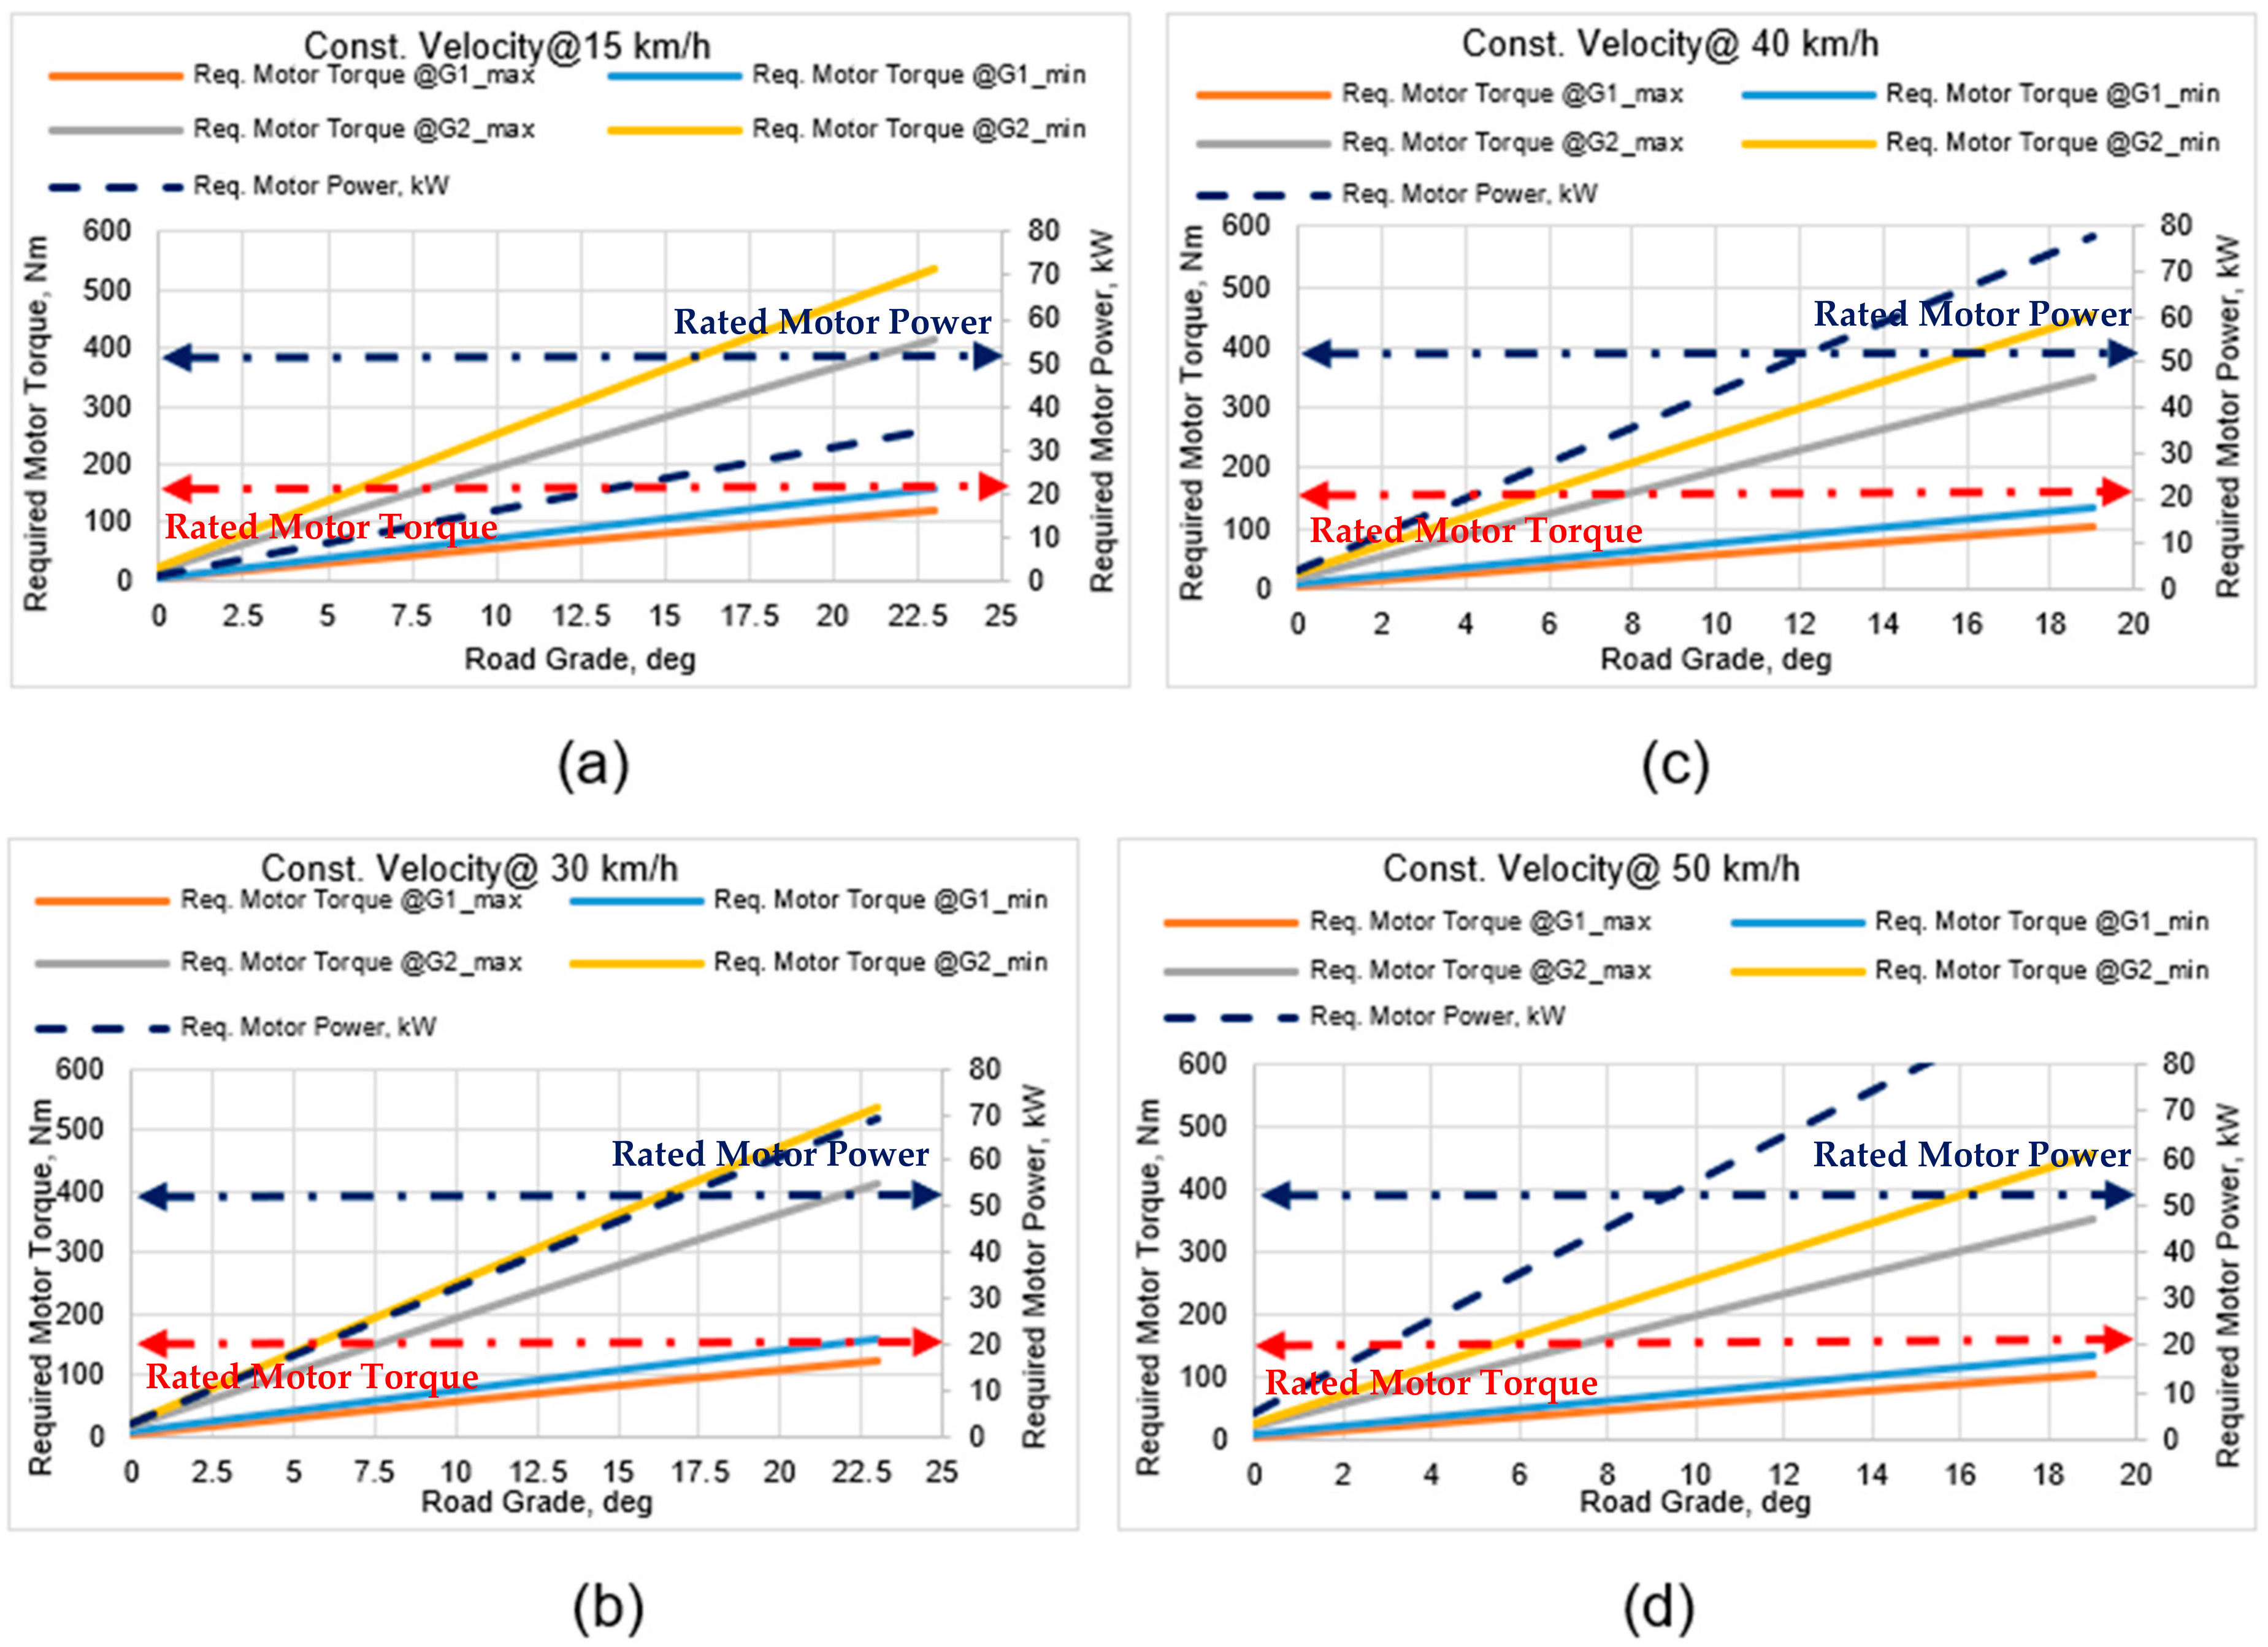
As in the previous section, three different electric powertrains were reviewed. Being similar in their trends, the electric motor torque and power requirements on an inclined road are presented in Figure 8, considering a large vehicle and electric motor, EM-A. Above the vehicle speed of 40 km/h, the motor output demands were plotted for the road grade up to 19 degrees because the torque and power demands went over the maximum motor capacities earlier than reaching the maximum road grade.
Two major observations can be brought forward based on the torque and power demand behavior from the charts in Figure 8 to identify the gear transition phase in relation to the road grade:
- All the four charts show almost similar motor torque requirements on each gear; however, at a lower road grade up to 8 degrees, the torque demand in gear 2 seems closer to the rated motor torque compared to that required in gear 1. On the other hand, during increasing uphill driving conditions, the torque requirement in gear 1 moves closer to the rated motor torque as opposed to that in gear 2. This reflects that the lower gear should be preferred on a higher road elevation while a higher gear could be selected on a road with a lower gradeability.
- With increasing the vehicle speed on elevated road conditions, the motor power demand soars rapidly. While the motor power demand at a vehicle speed of 15 km/h in both gears remained below the rated motor power capacity, it crossed the rated power line at 16 degrees or earlier when increasing the vehicle speed.
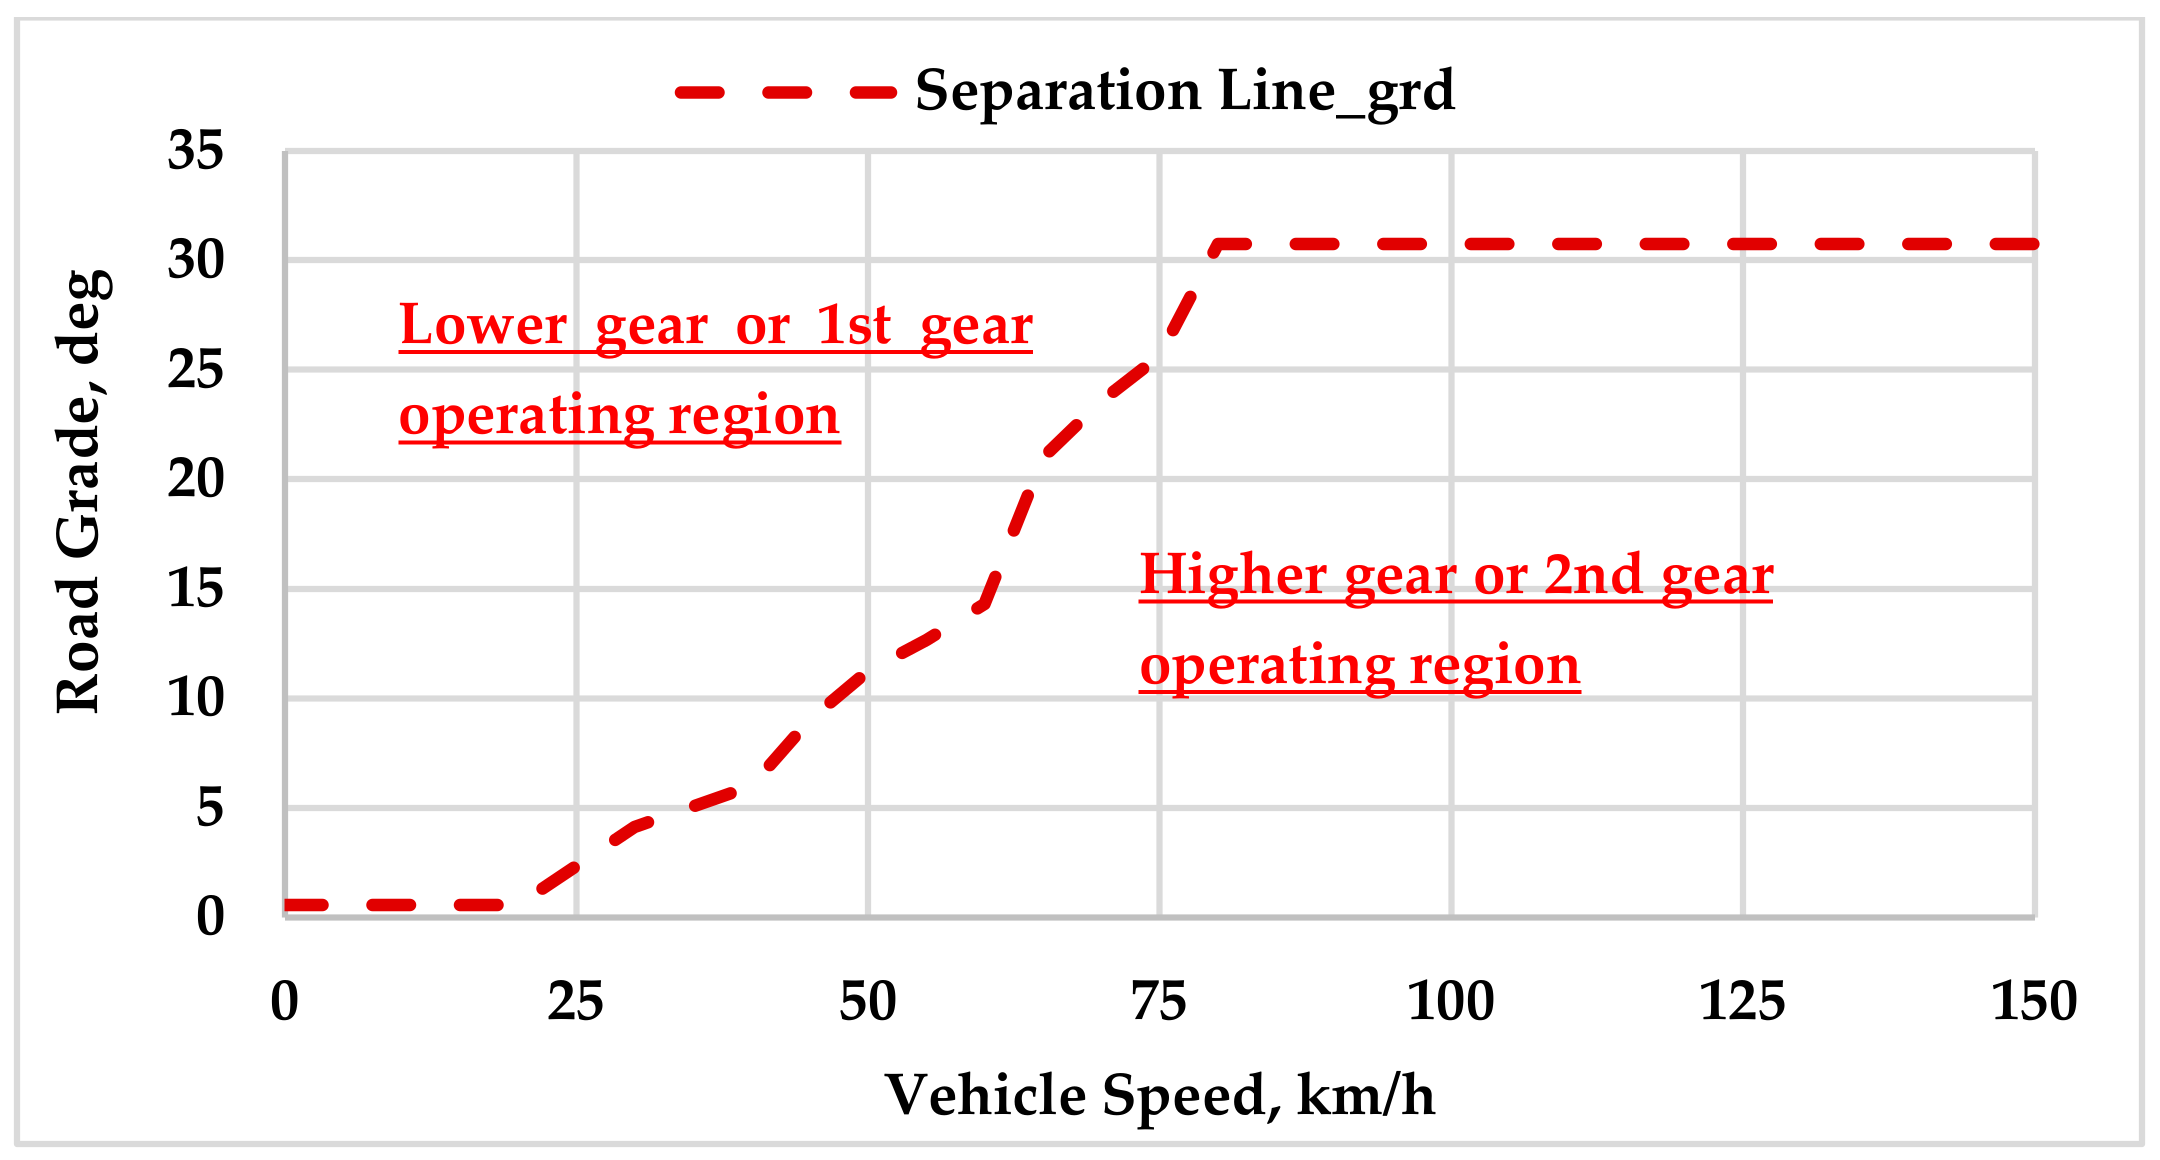
Based on the above analysis, it is possible to draw an imaginary gear separation line in relation to the road grade as shown in Figure 9. The pattern is similar to that in Figure 6. In this case of the road grade, a critical gearshift transition phase exists in the vehicle speed range of 25–30 km/h to 50–55 km/h and in the road grade range of approximately 4 degrees to 13 degrees.
For the second electric powertrain (i.e., a large vehicle and electric motor, EM-B), a similar power demand as in Figure 8 was noted because of a similar vehicle size. Despite the larger gap between the upper and lower bounds of each gear, an analogous behavior in the torque demand can be observed. Because of the larger gap between the upper and lower bound of each gear and the relatively-rated capacity, gear 1 might be the preferred choice over a slightly wider region compared to that with the electric motor EM-A; however, based on the analogous torque behavior, it is perceived that the separation line shown in Figure 9 can be considered for this EV powertrain as well. On the other hand, the motor output requirements for the third EV powertrain (i.e., a small vehicle and EM-A) were significantly lower compared to those for the first two powertrains that suggested gear 2 as the preferred choice over a wider operating region. In line with this, the gear separation line in Figure 9 could be pushed upward allowing more room for selecting the second gear for a small vehicle driving on a hilly road. Because it needs further scrutinization through a simulation and optimization process, the primary gearshift schedule for two-speed transmission system can be drawn based on the gear separation lines shown in Figure 6 and Figure 9.
2.2.3. Primary Gearshift Schedule
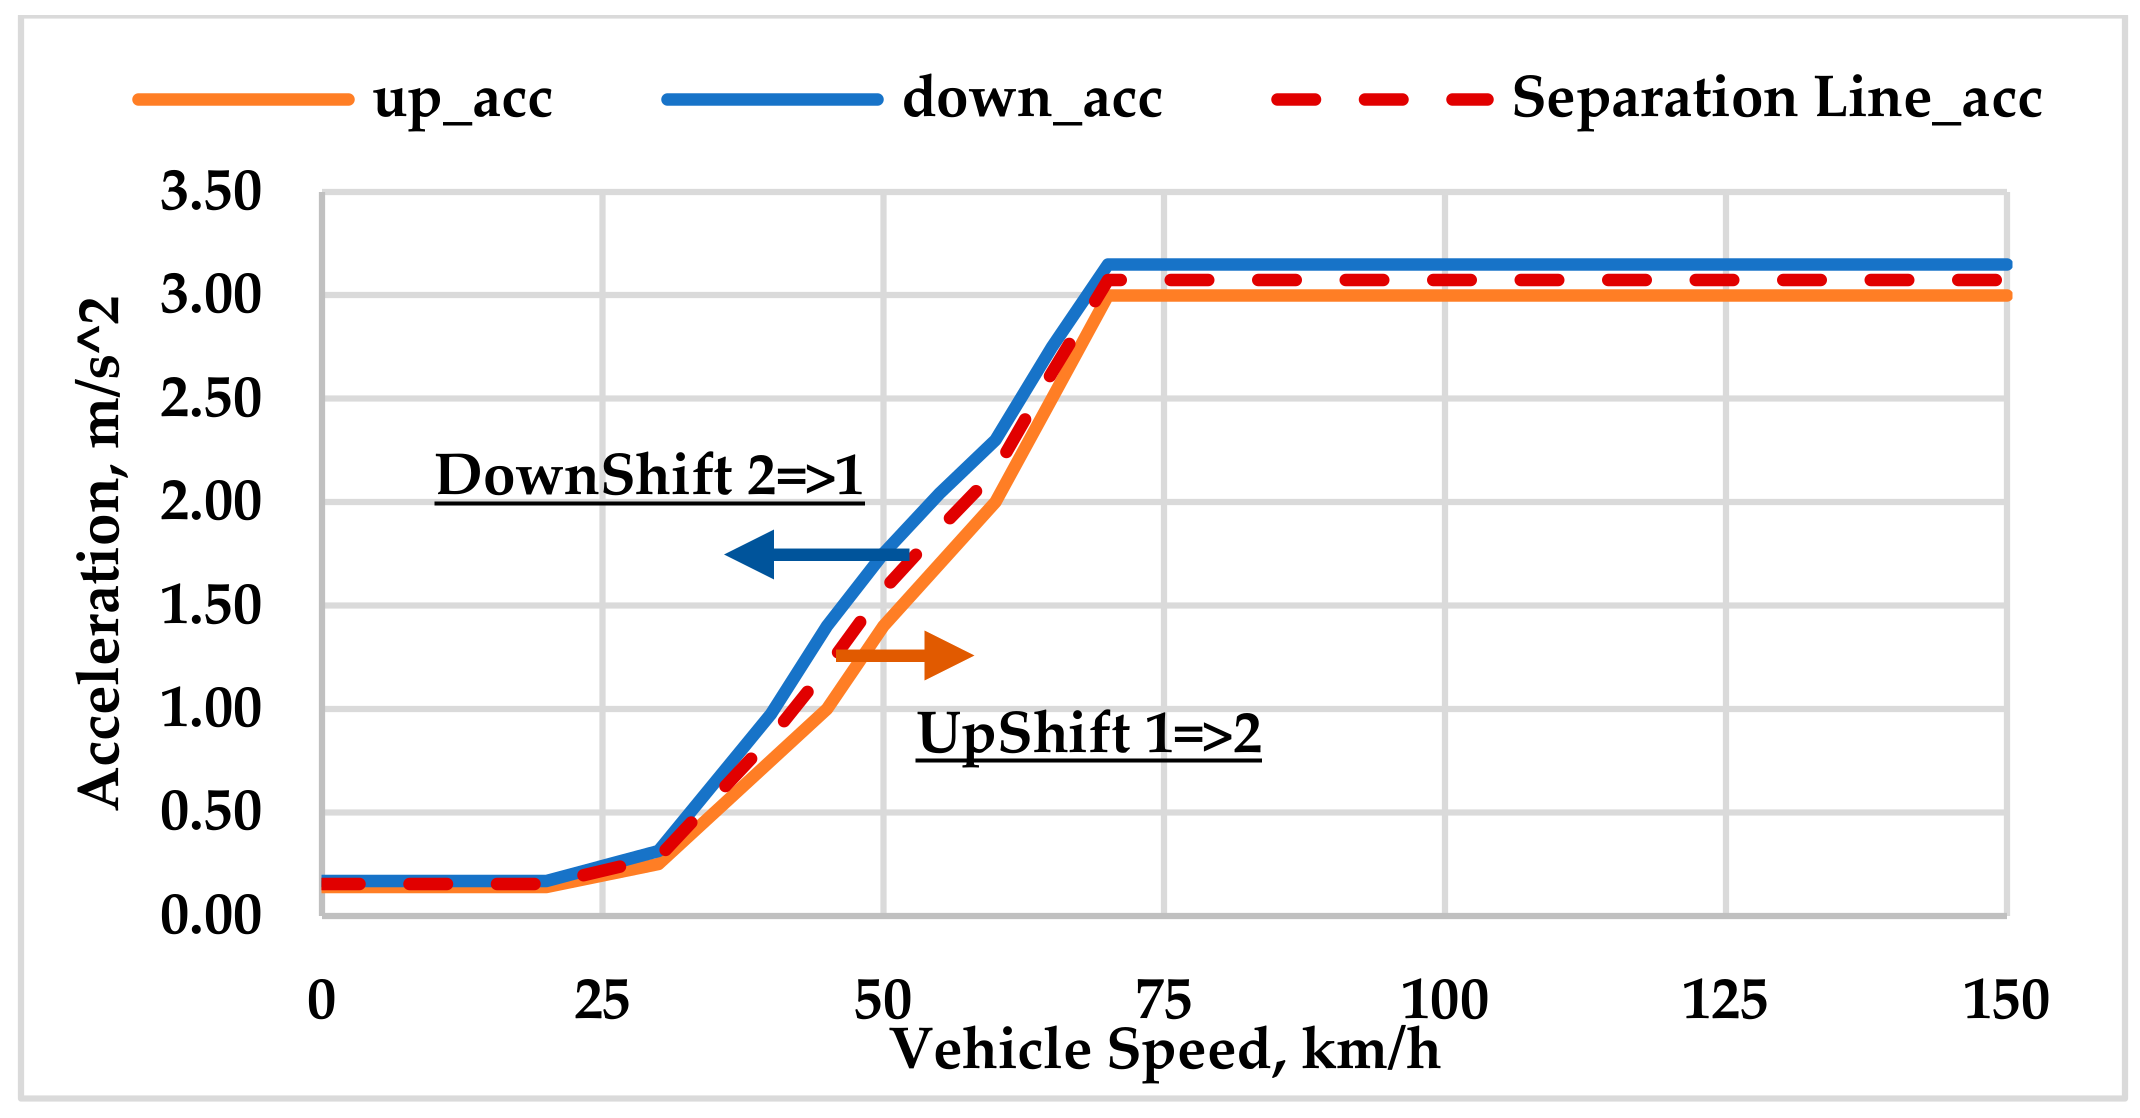
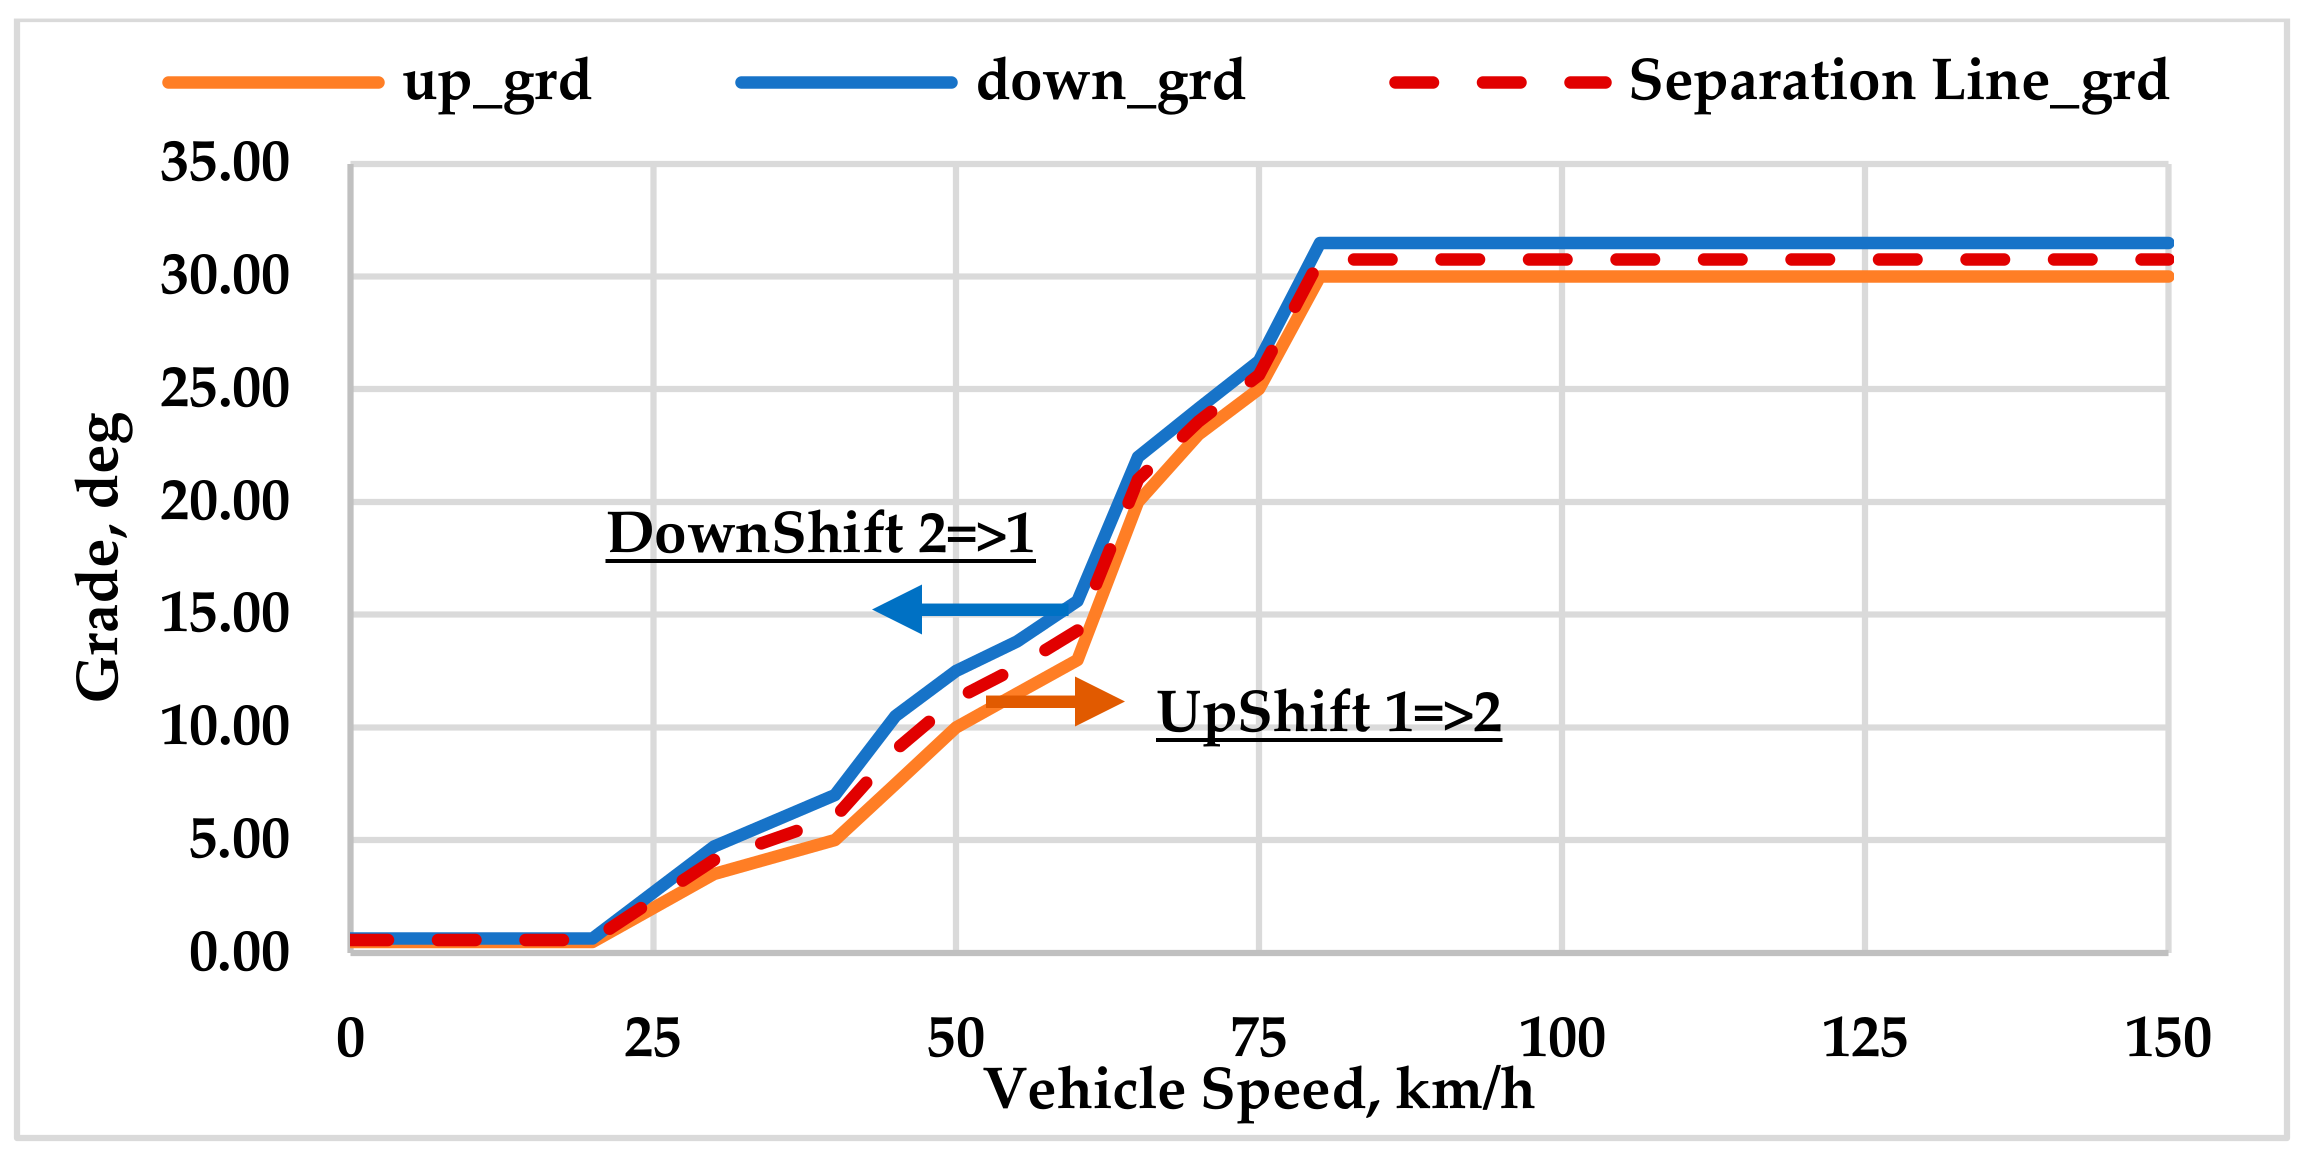
It was necessary to split the gear separation lines in Figure 6 and Figure 9 into downshift and upshift lines because of multiple reasons, such as improving the fuel economy [25], reducing discomfort for the drivability [25,26], minimizing oscillations of the drivetrain components [27], etc.; therefore, a guideline in relation to the allowable gap or buffer zone between the upshift and downshift lines would help generate an acceptable gearshift schedule. Among some research work, a hysteresis strategy [28], or applying a penalty factor within the optimization algorithm [29,30], etc. is now mentioned regarding this issue. Although these techniques are implemented on a conventional approach (i.e., the throttle demand vs. a vehicle speed-based gearshift schedule), these could be considered as a general guideline for the proposed gearshift strategy. In line with that, two factors [31], i.e., avoiding a frequent gearshift to ensure rider comfort and kick-downshifting during high acceleration demand were considered while a weighting factor was applied to create a buffer zone between the downshift and upshift lines. Following these steps, primary gearshift schedules in relation to the vehicle acceleration and road grade were drawn allowing a 10–40% buffer zone as shown in Figure 10 and Figure 11, respectively. The horizontal parts in the lower and higher speed region of the gearshift map have been drawn for simulation requirements.
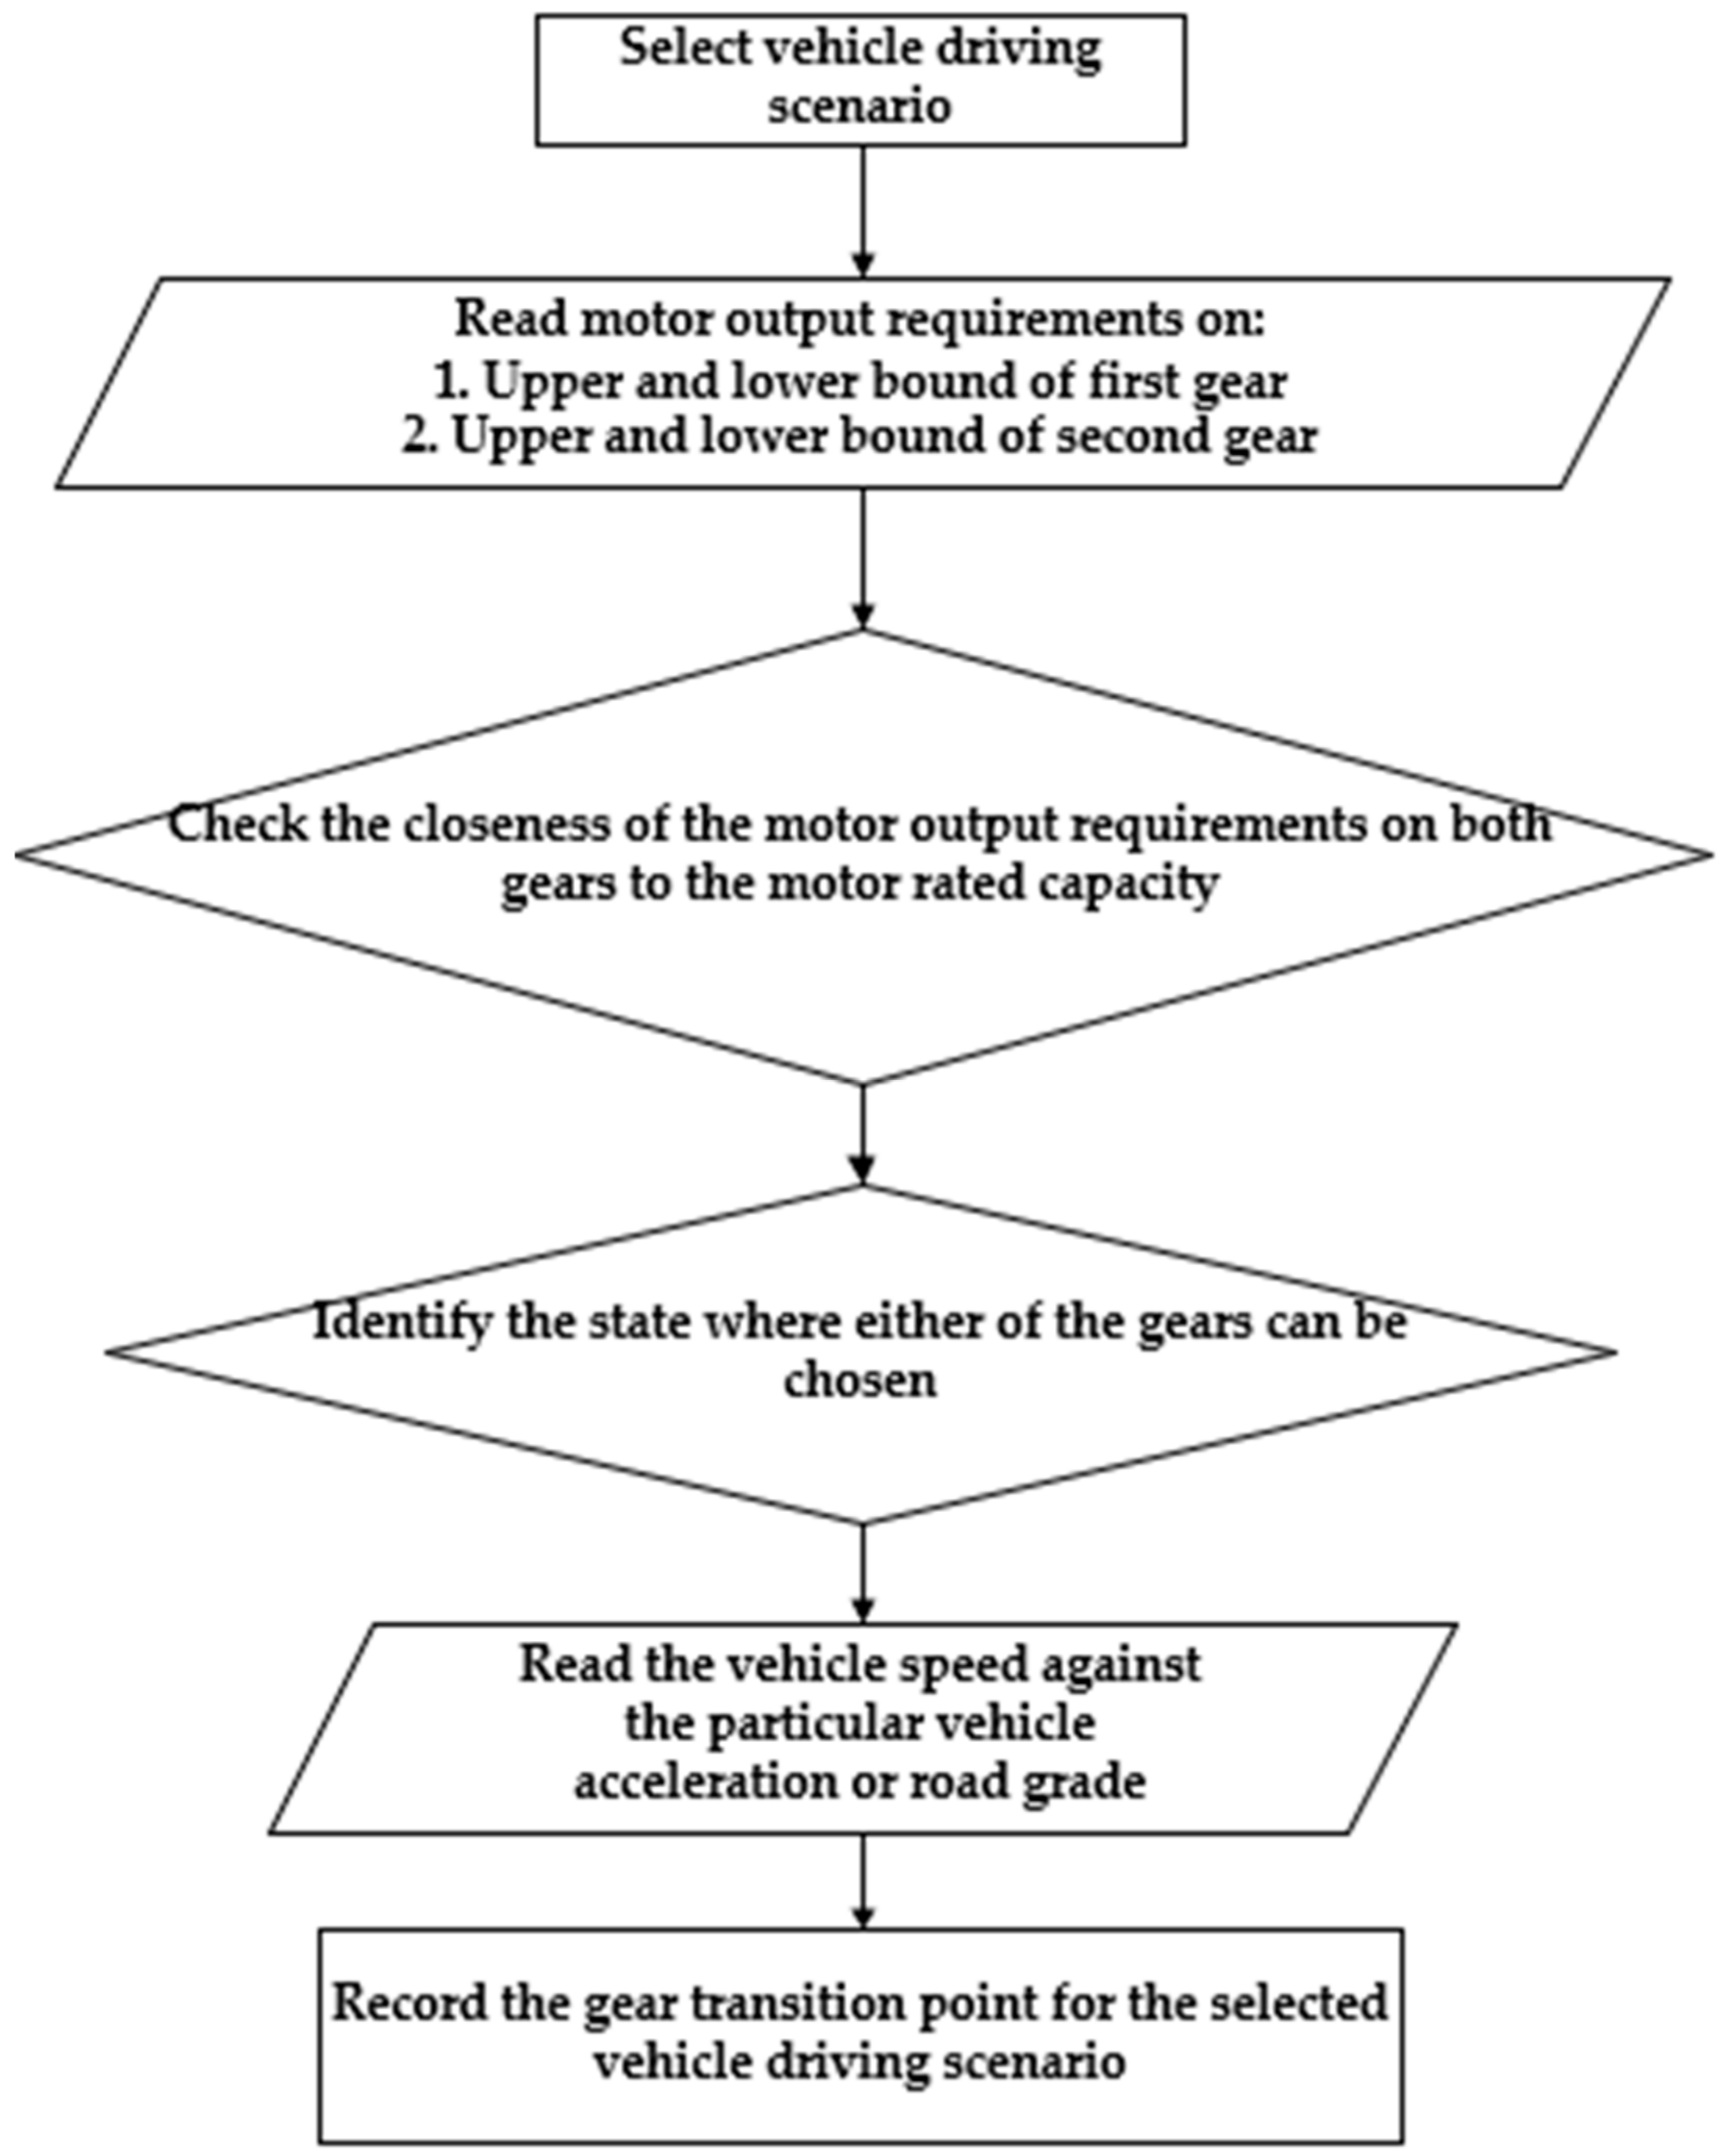
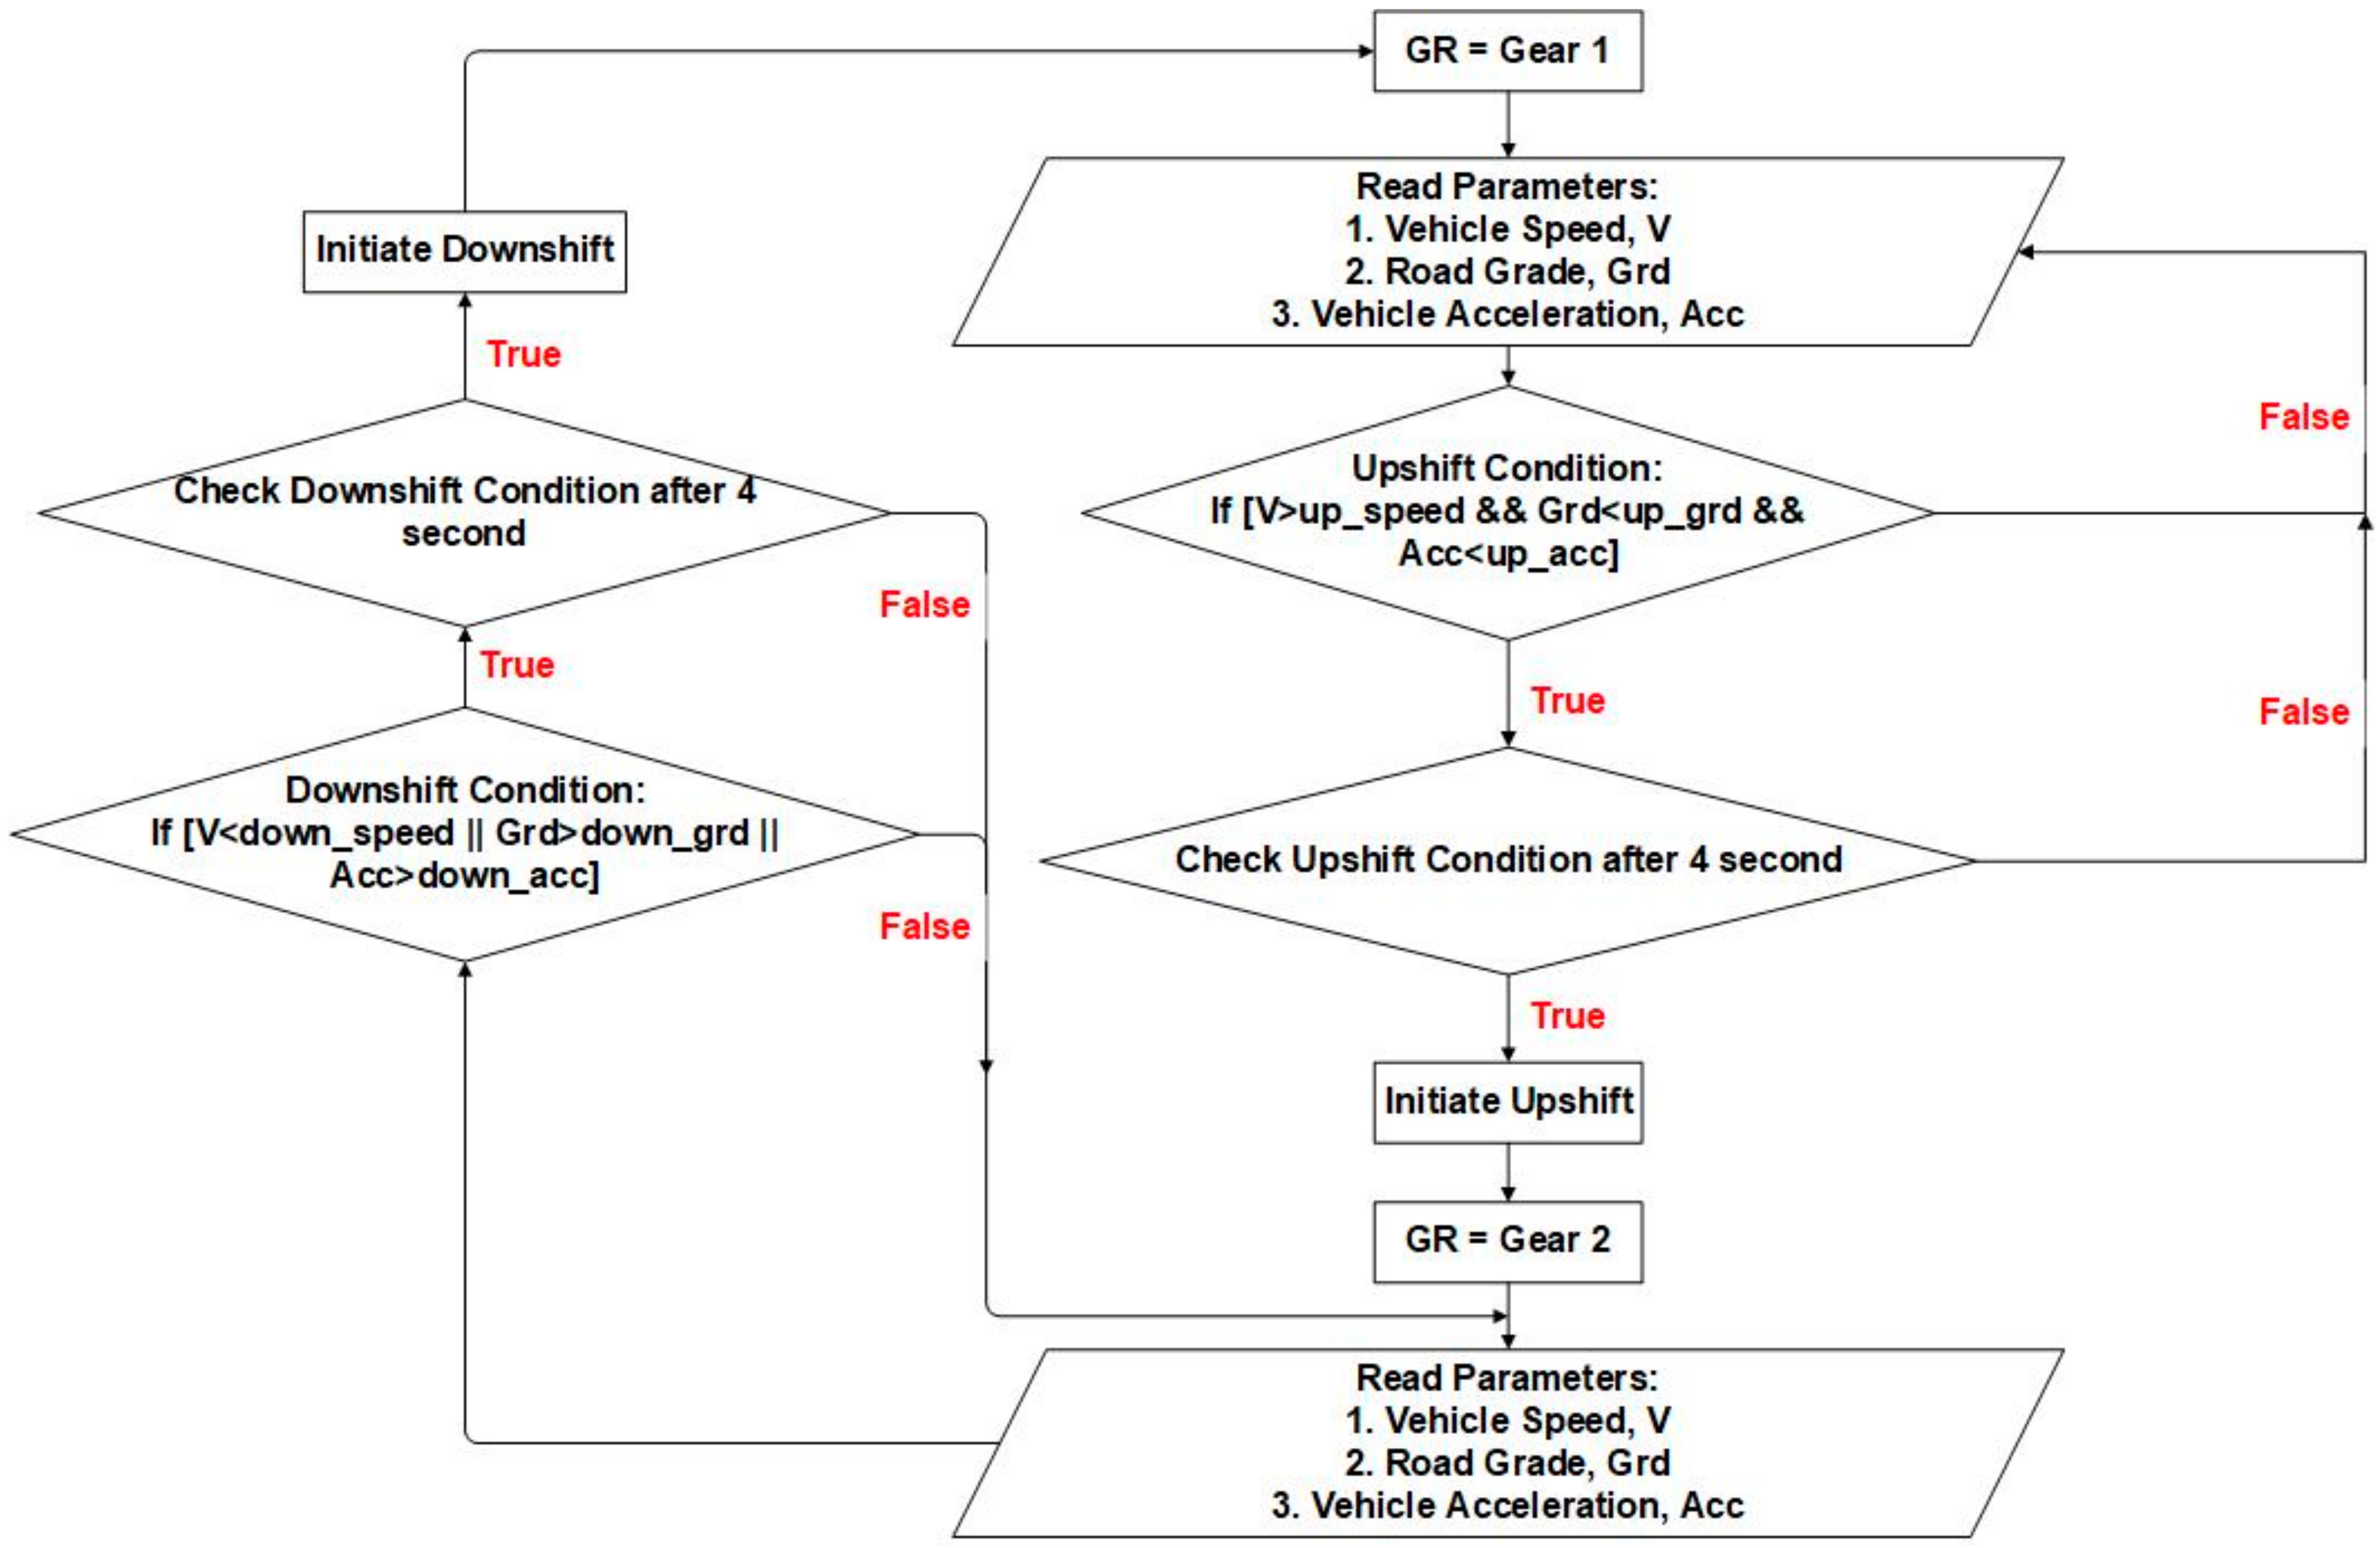
Gearshift logic is developed in such a way that a gearshift decision will be regulated by only the motor rpm parameter in the lower and higher speed region while the transition phase of the gearshift maps along with the motor rpm play a role in the gear selection decision during the mid-range of a vehicle’s speed. An explanation about the gearshift logic has been demonstrated in the previous published paper [22]; however, the flowchart of the gearshift logic in Figure 12 has been shown here for the readers’ convenience. In the next stage, the upshift and downshift lines will be optimized in the simulation environment.
3. Simulation and Experimental Results
An EV powertrain with multiple combinations of vehicle mass and electric motor (as listed in Table 4) was simulated in a Matlab/Simulink environment. The simulation results were analyzed to evaluate the performances of the proposed gearshift schedule. Next, an experimental setup was organized to validate the simulation results.
3.1. Optimization in Simulation Environment
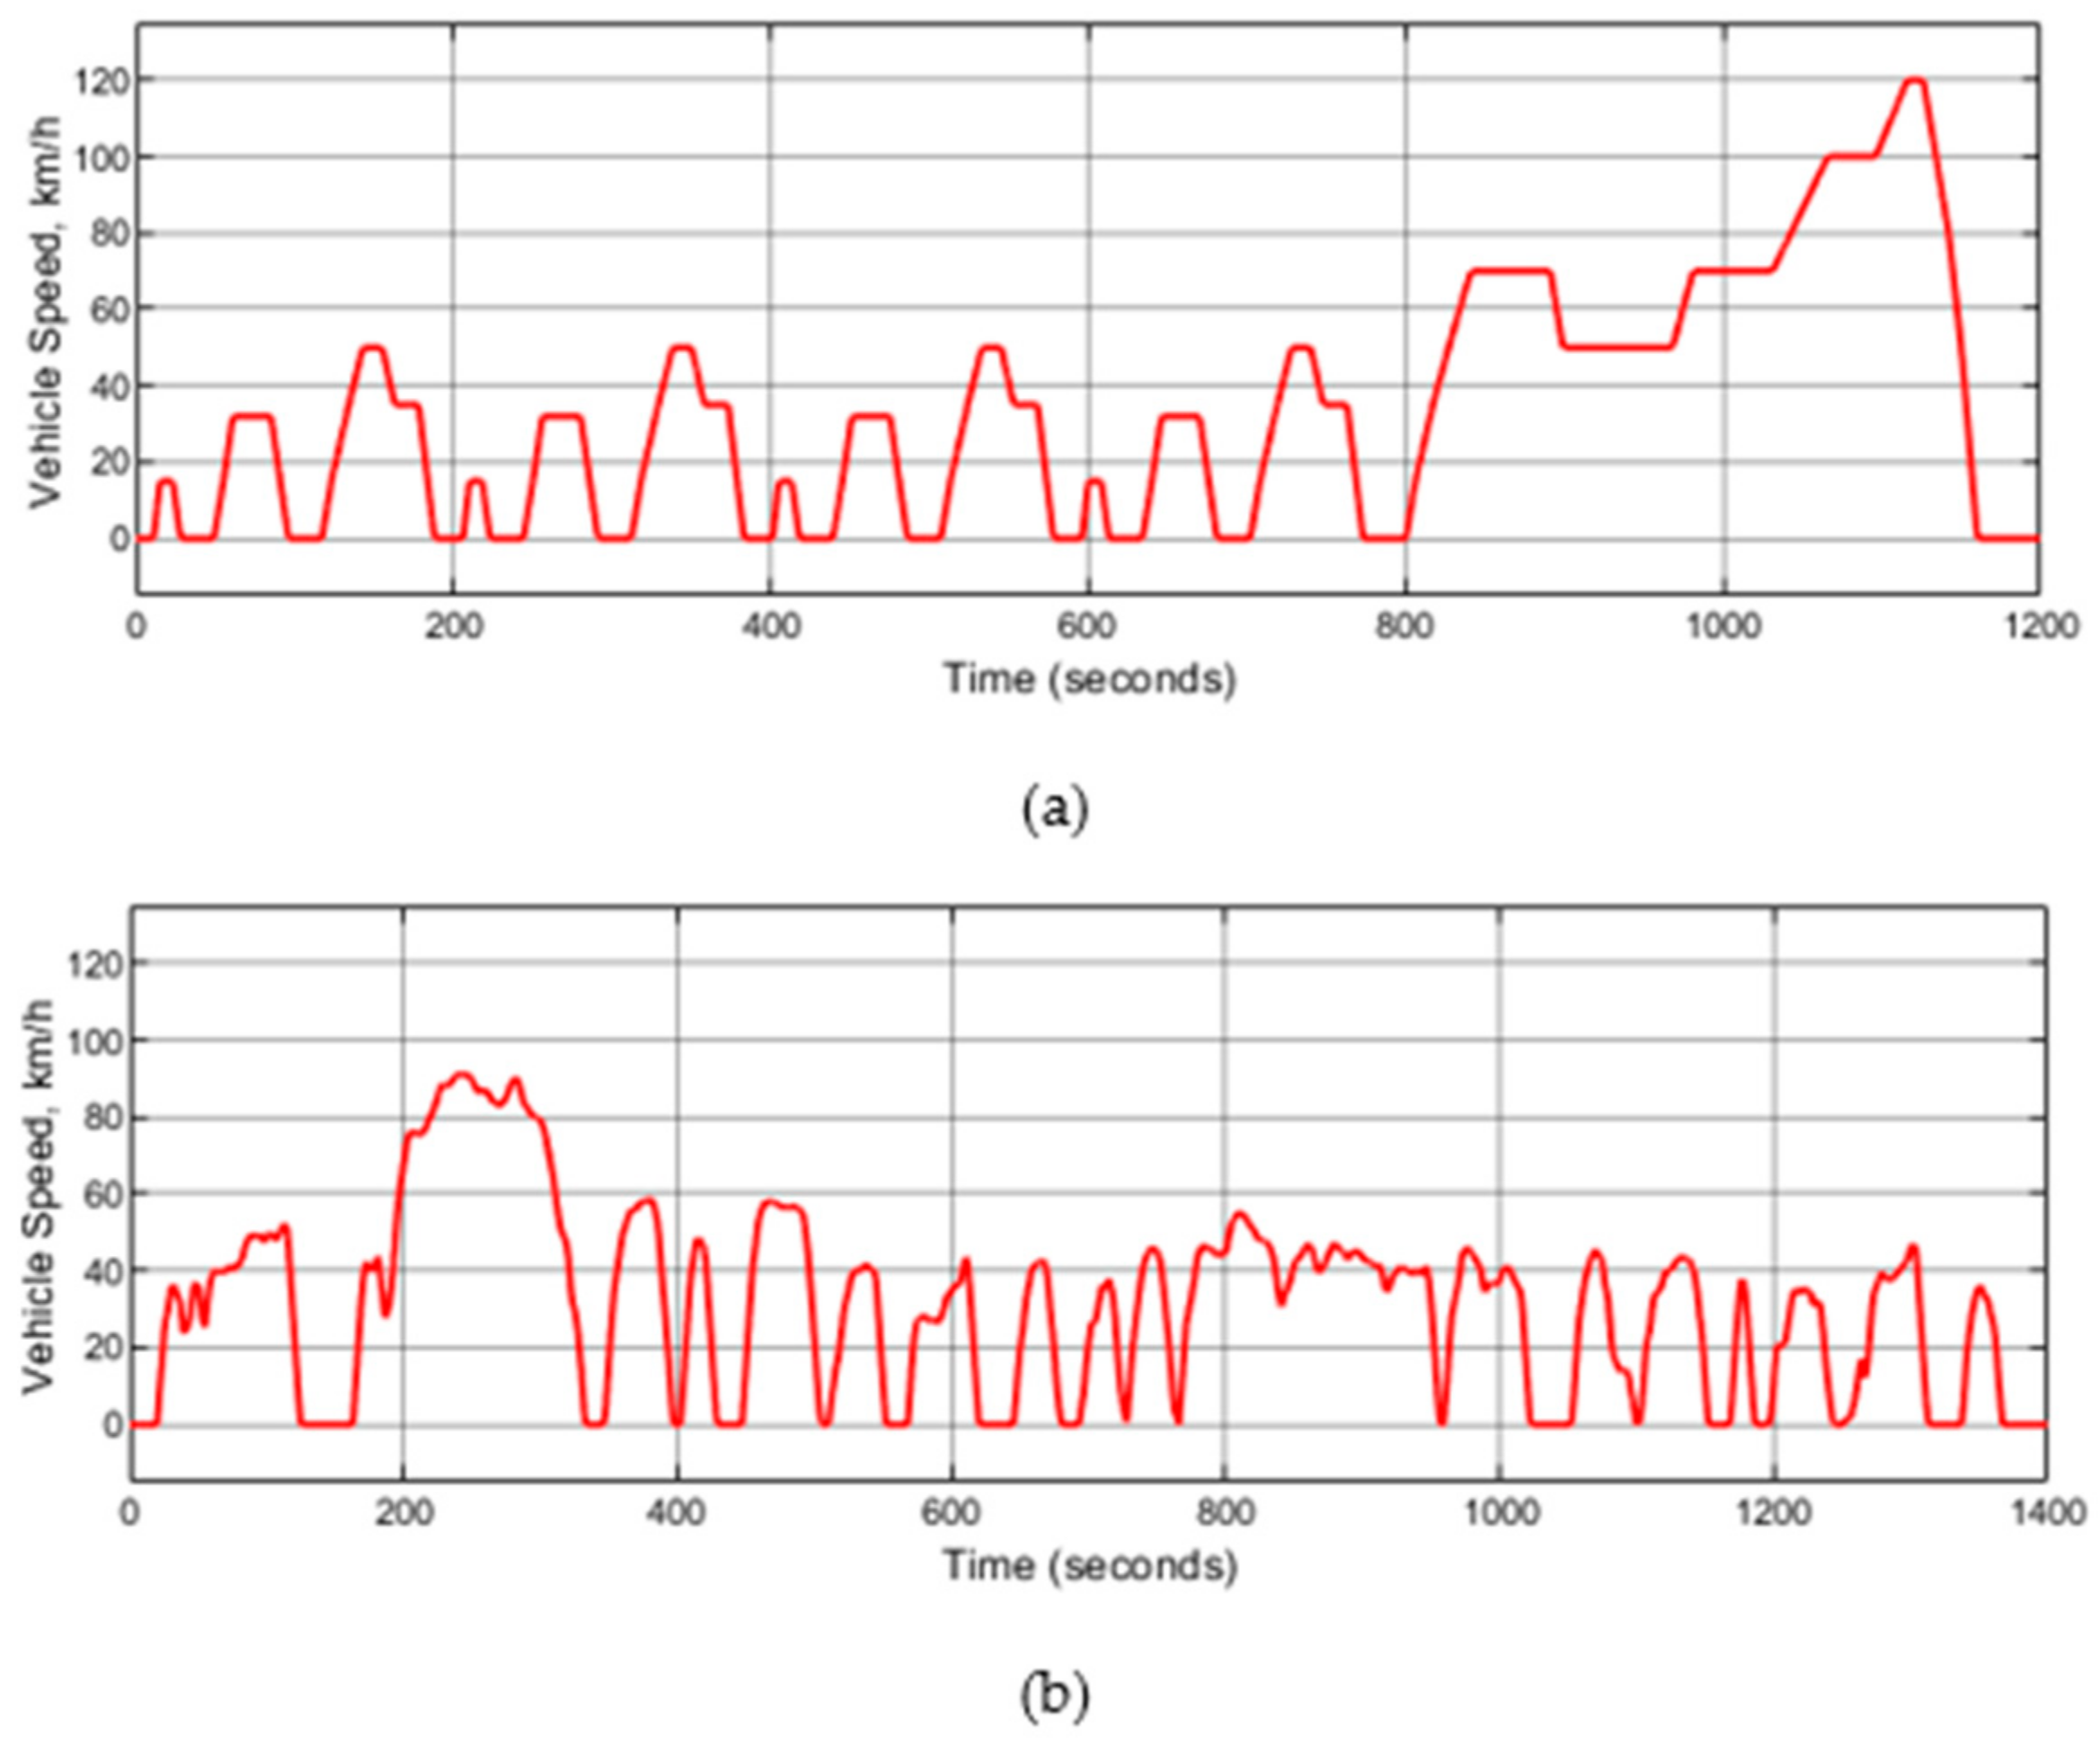
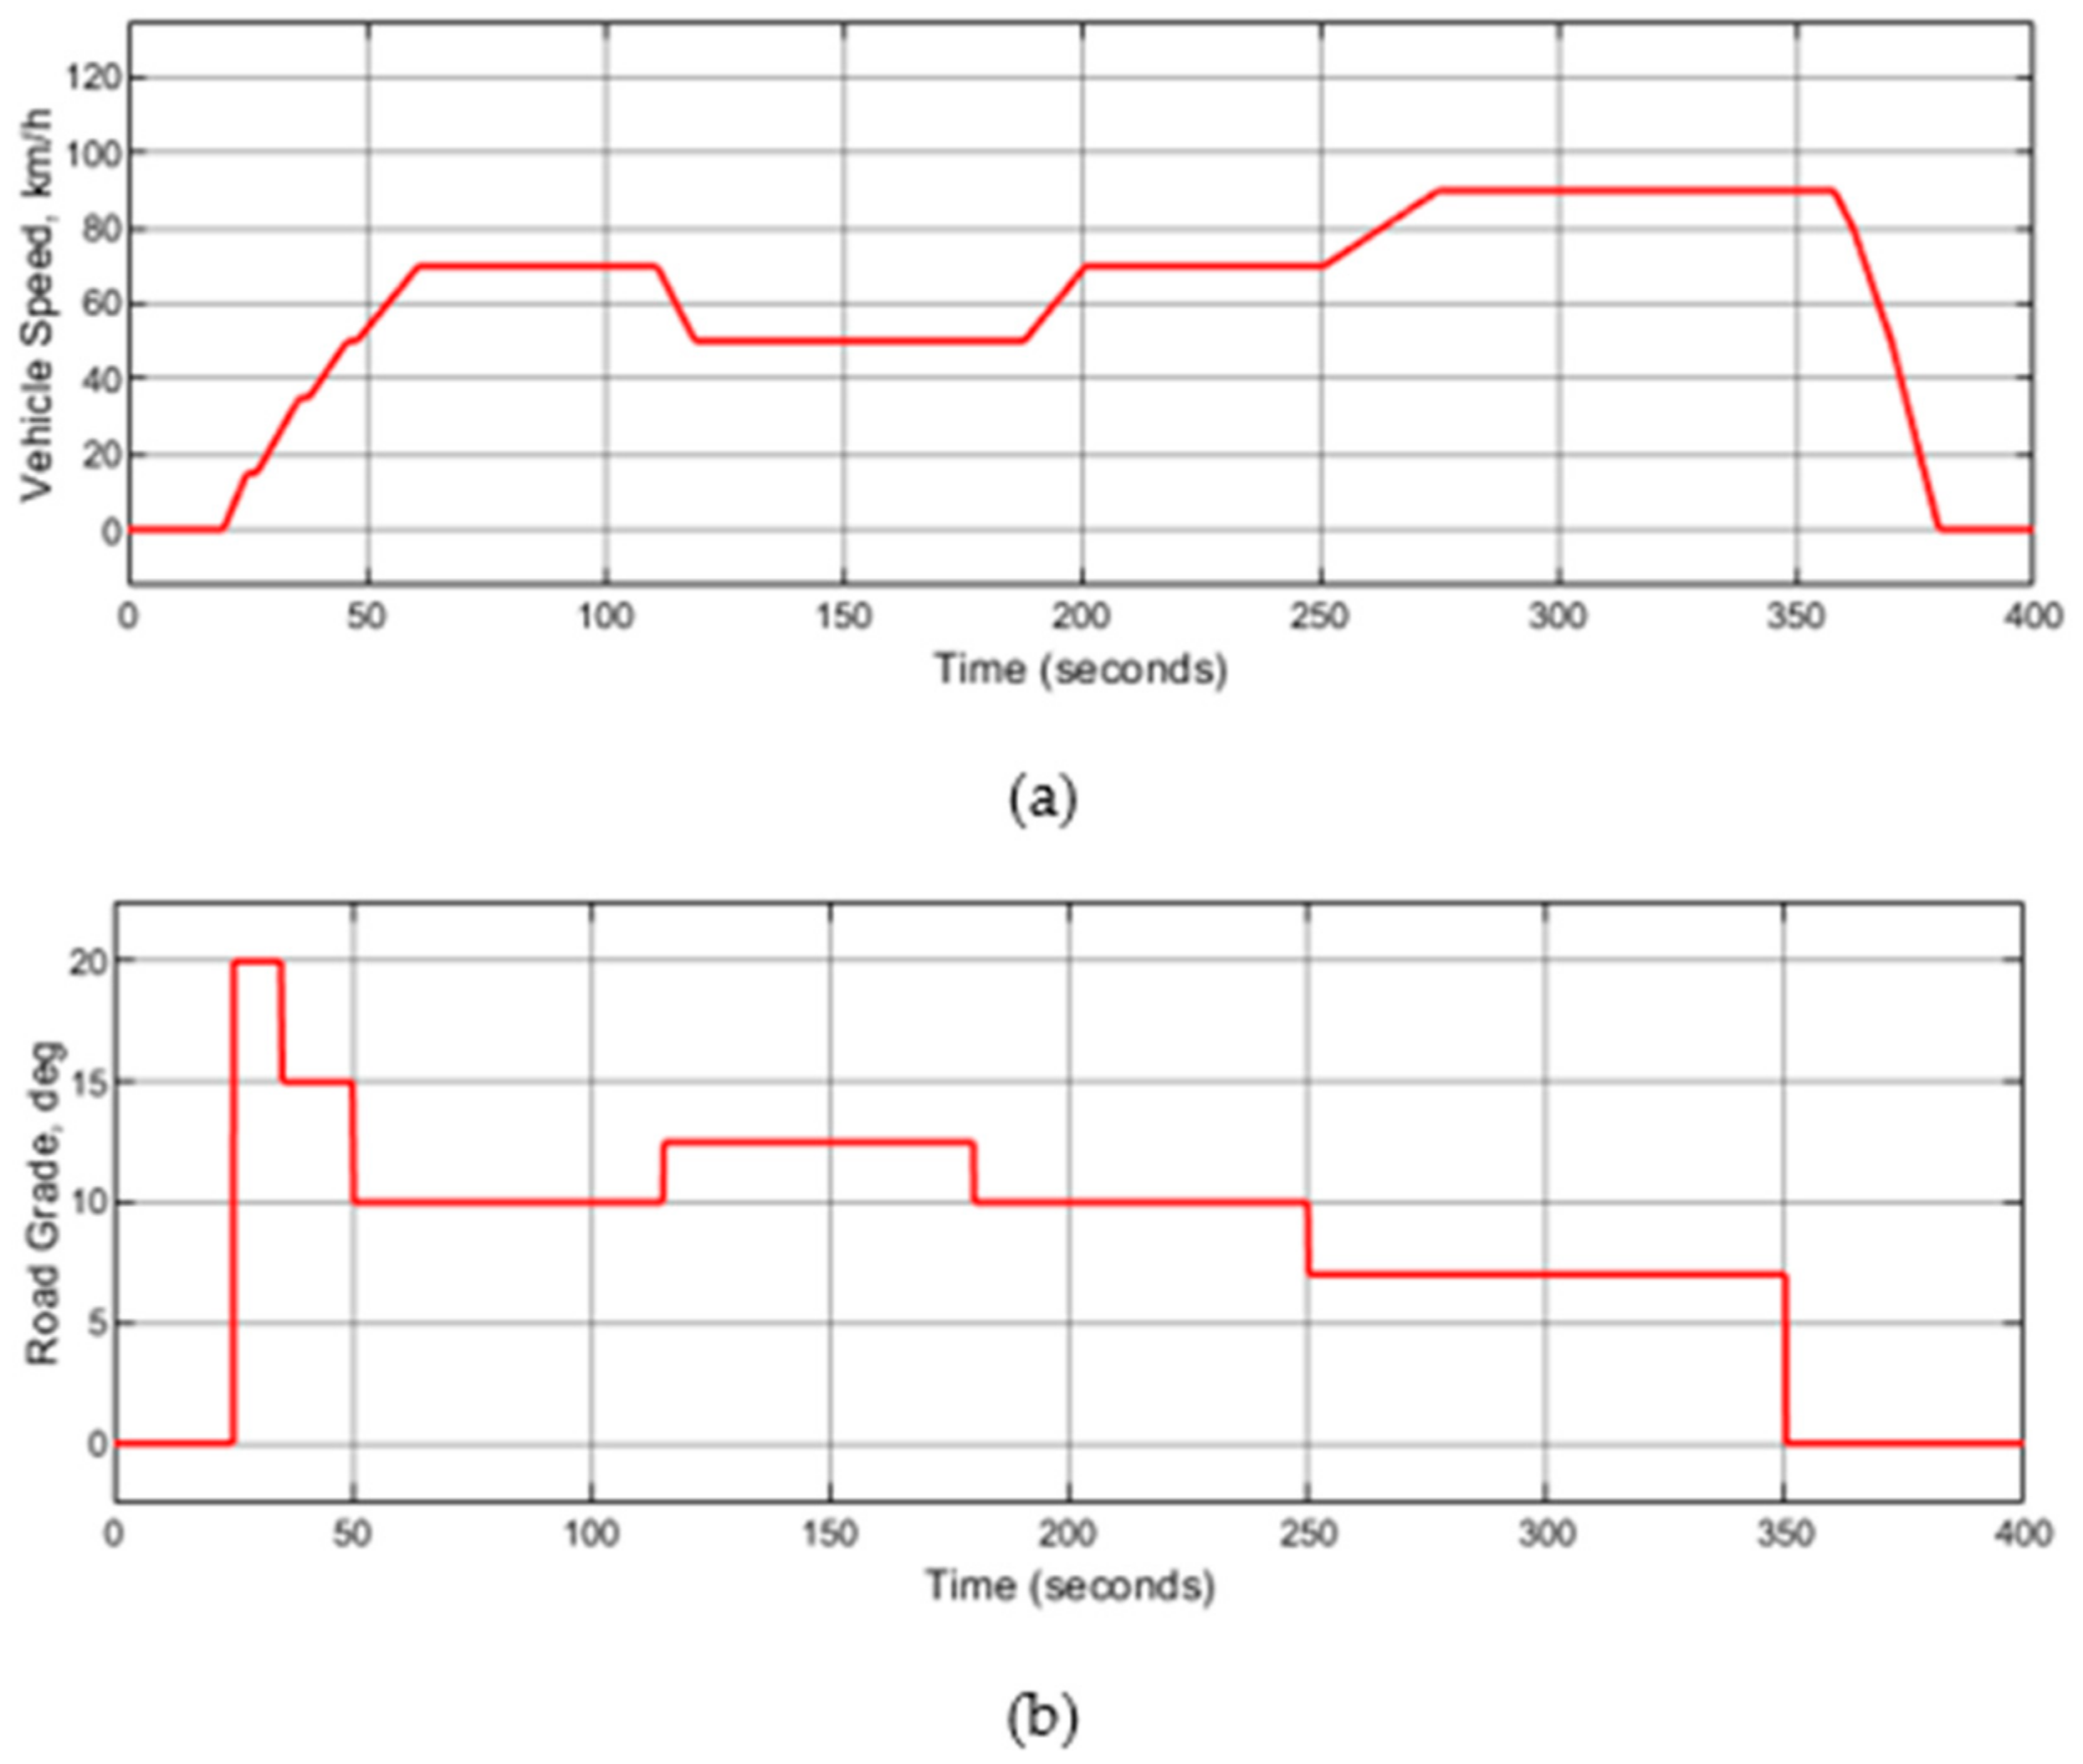
In the simulation model, all the EV powertrain components were connected following the forward-facing model while the battery unit was linked to the motor as a backward-facing module. As the input to the EV powertrain, the New European Driving Cycle (NEDC) and Urban Dynamometer Driving Schedule (UDDS), as shown in Figure 13, were used to evaluate the proposed gearshift schedule strategy. Because the NEDC and UDDS are based on a flat road, a customized road grade scenario (Figure 14b) was implemented on another standard drive cycle, namely, the Economic Commission for Europe (ECE) Extra-Urban driving cycle (Figure 14a) to evaluate the primary gearshift schedule in relation to the road grade for the two-speed transmission system in the EV model.
Gradient descent (GD) and pattern search (PS) methods were implemented to optimize the gear ratios as well as the gearshift schedules. Equations (3) and (4) represent the two objectives of the optimization, i.e., minimizing the energy consumption throughout the drive cycles and minimizing the track error between the input and output vehicle speeds, respectively. Four different EV powertrains were investigated; therefore, there were four sets of upper and lower bounds for each gear ratio (as shown in Table 5) during the optimization process:
While all the associated equations in [22] were followed to estimate the upper and lower bounds of the gear ratios, an heuristic adjustment was made with the lower bound of the 1st gear ratio for each EV powertrain except the fourth one, i.e., EV powertrain 04. It was learned through the simulation that the lower value of the first gear ratio was related to a lower energy consumption. Moreover, the traction motor did not necessarily need to supply a peak torque continuously, rather it was required to supply a significantly lower torque when the vehicle was in motion. Following this, the lower bound of the 1st gear ratio was reduced to 50%, 75% and 75% from the theoretical estimation for the first three EV powertrains, in order, as in Table 4. While incorporating this adjustment, it was ensured that the vehicle dynamic performances were not compromised in the optimization process through imposing necessary constraints. The idea behind the heuristic adjustment was to explore how much energy consumption could be minimized while ensuring the dynamic performances.
For the large size vehicle, both the downshift line and upshift line of the primary gearshift schedule could move a maximum of 20% both ways during the optimization process without decreasing the buffer zone; however, for the small size vehicle, the constraint for the primary gearshift lines was set to a maximum of 60% both ways because of its lower motor output requirements.
3.1.1. Optimized Gear Ratios and Gearshift Schedule for Acceleration
Considering the mass of the large vehicle and small vehicle upper and lower bounds of the gear ratios, an initial set of gear ratios was chosen as 14.00 for and 5.00 for . The other steps in the optimization process were followed as outlined in [22]. The simulation results have been demonstrated below through several tables and graphs.
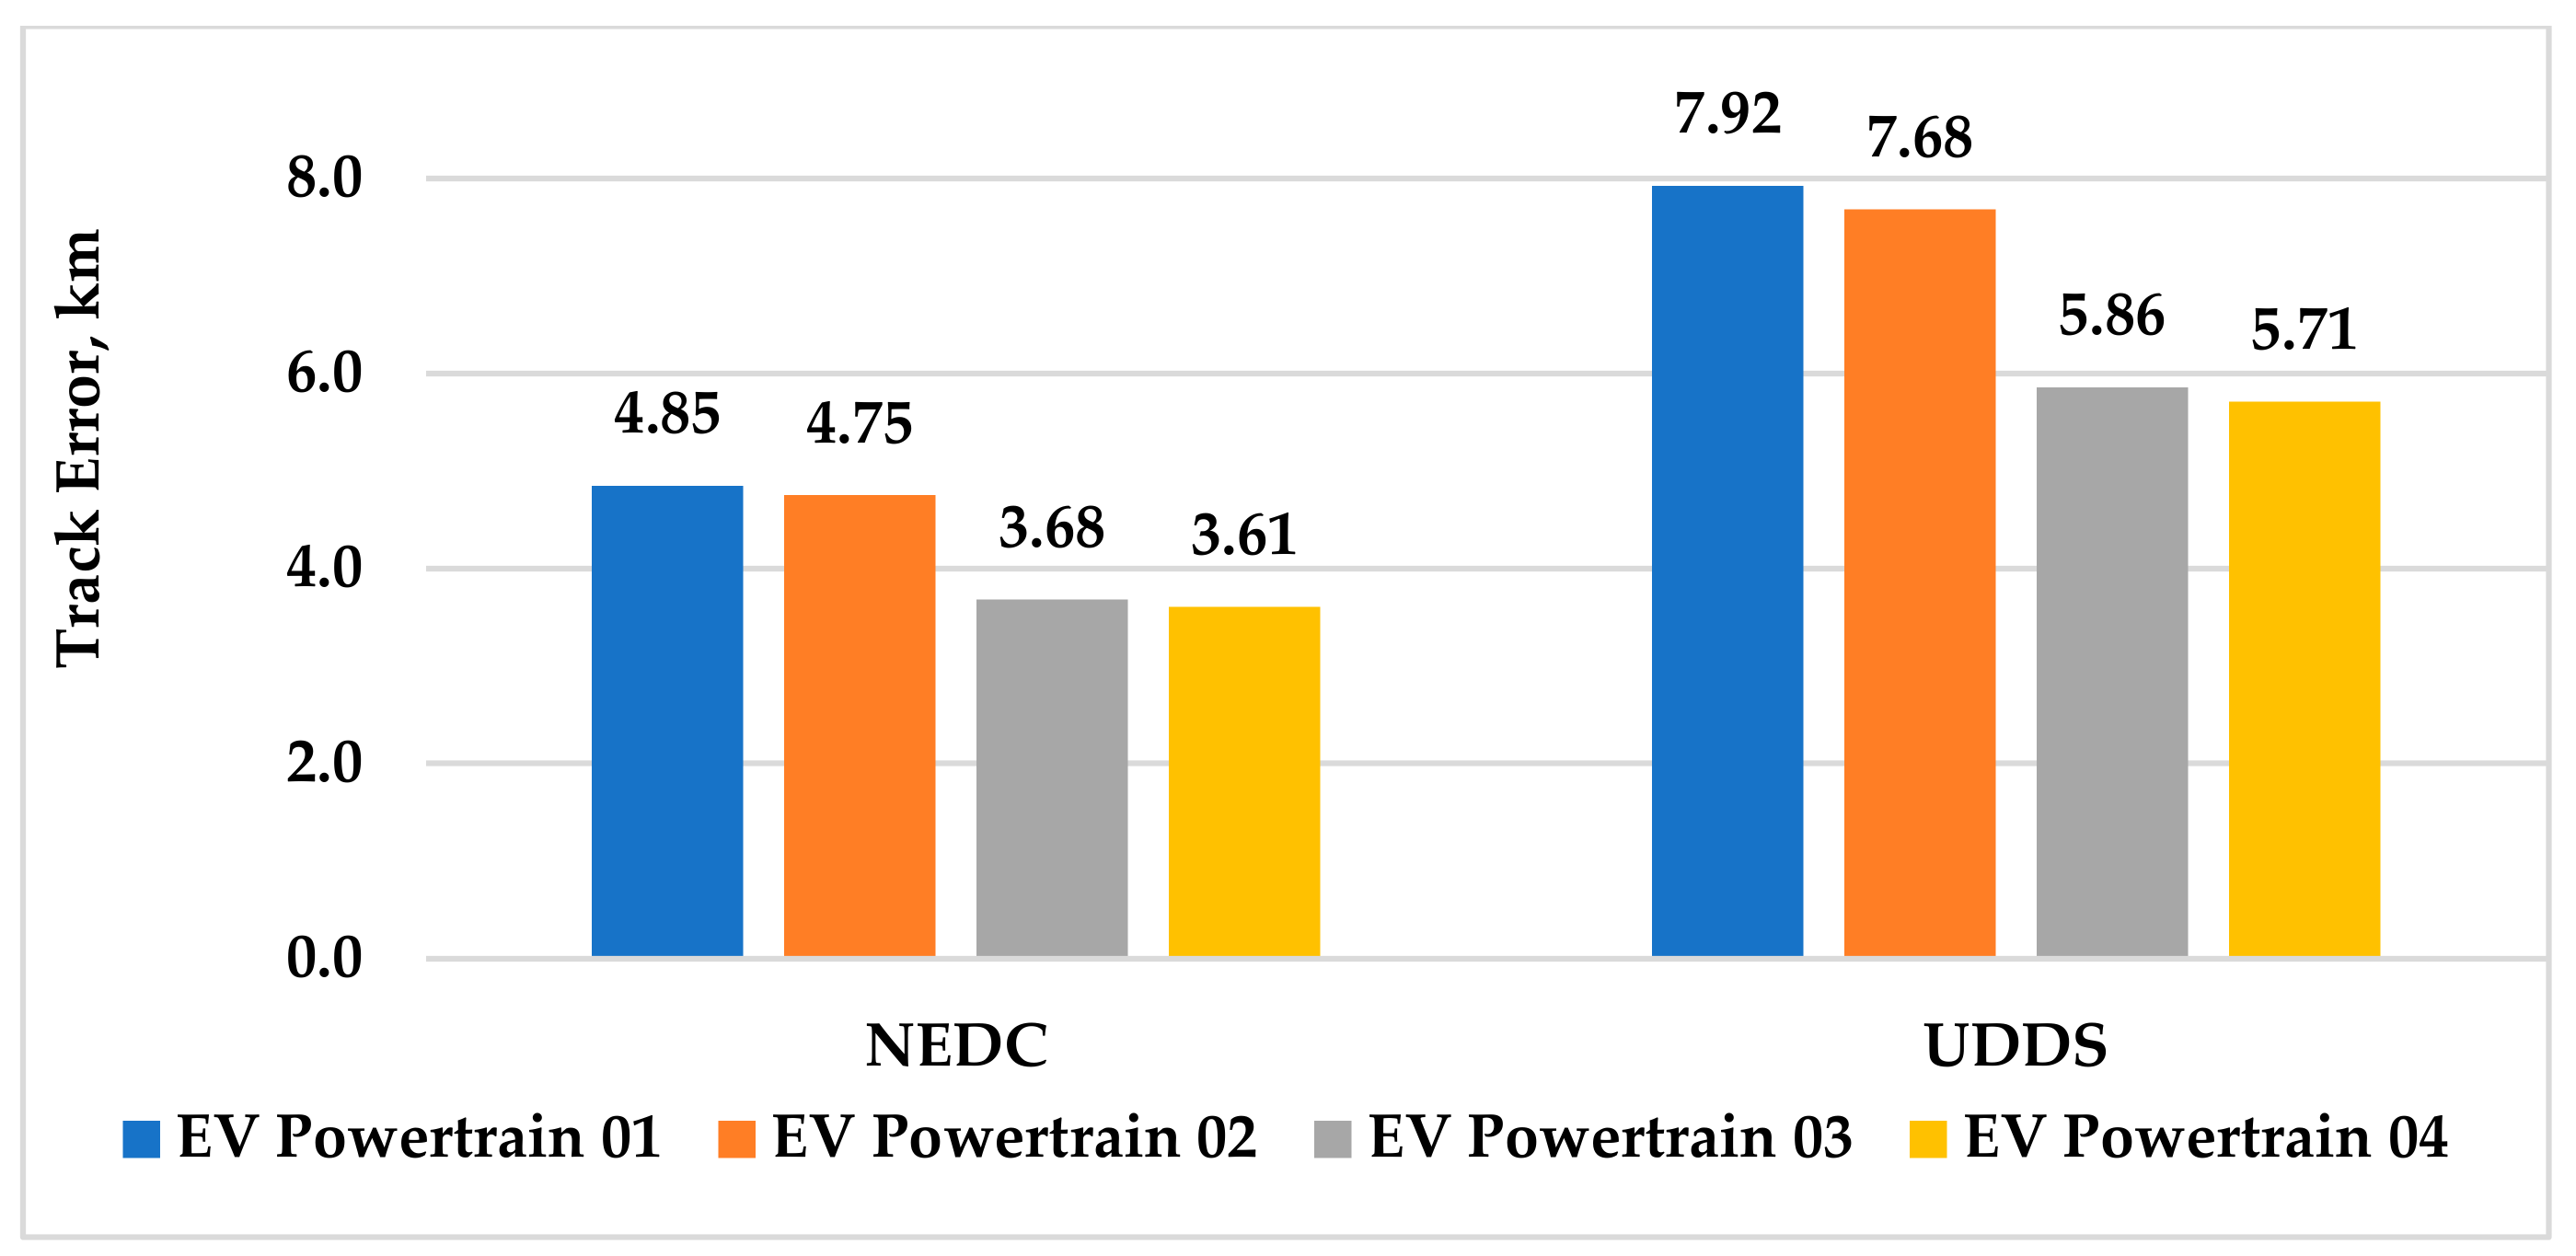
It can be found in Figure 15 that a maximum track error was approximately 62% and 58% higher under the UDDS driving scenario compared to that under the NEDC for the large size and small size vehicles, respectively. As expected, the track error with the small size vehicle was lower. Another observation from Figure 15 is that compared to the traction motor capacity, the vehicle mass reflected a more dominating role behind the difference between the input speed and output speed.
The data in the next four tables, i.e., Table 6, Table 7, Table 8 and Table 9, are in relation to the vehicle economic performance of EV powertrains through optimization. The outcome of the analysis of these data could lead to an optimized gearshift schedule for both large size and small size vehicles.
Furthermore, the economic performance with the small size vehicle (Table 8 and Table 9) was relatively higher than that of the large size vehicle (Table 6 and Table 7). In addition, two major observations are explained here from the results of the optimization process:
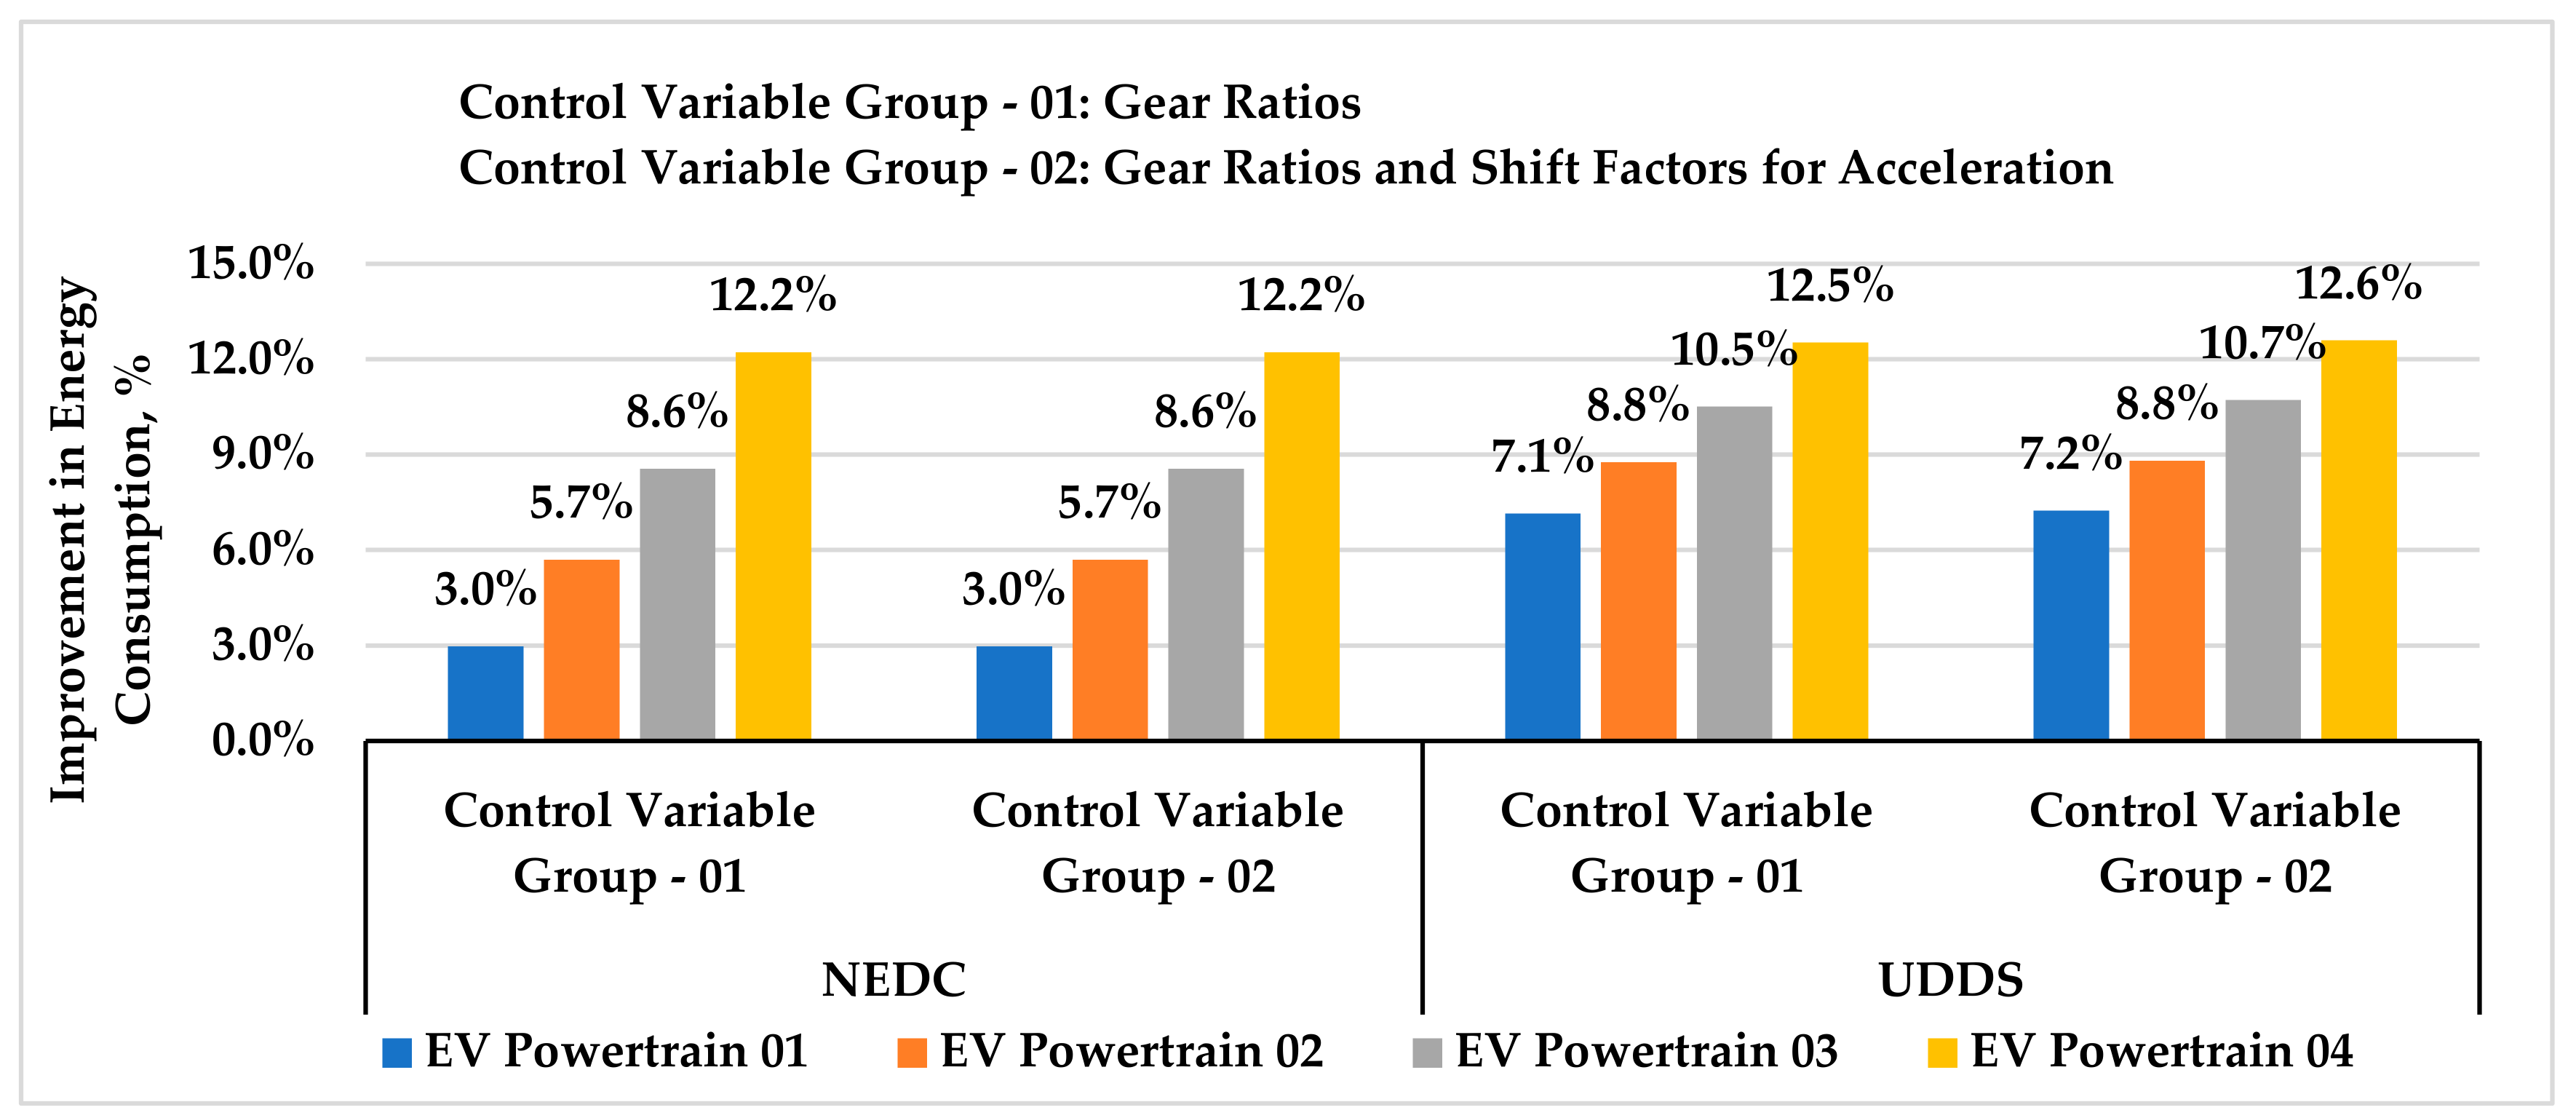
- Figure 16 has been plotted based on the lowest energy consumption for each driving cycle as noted from the data in Table 6, Table 7, Table 8 and Table 9. Apart from the economic performance behavior, the bar charts in Figure 16 indicate that the EV powertrain with a higher motor torque capacity, i.e., EV powertrain 02 and EV powertrain 04, show more potential for saving energy during vehicle operation compared to the EV powertrain with a lower motor torque capacity. This is an indication that through having different efficiency maps, the traction motor EM-B was more efficient than EM-A.
- Both optimization methods pushed the gear ratios towards the lower bound of each gear, which means that a lower value of the gear ratio is associated with energy saving during vehicle operation. Unlike the case with the NEDC drive cycle, some improvement could be noticed when the vehicle was operating on the UDDS drive cycle. Here, for the large size vehicle, a 20% upward move for both the upshift and downshift lines could be marked under the GD method without affecting the buffer zone in the primary gearshift schedule. On the other hand, the gearshift lines were lifted approximately 60% for the small size vehicle under the same optimization method, allowing more room for the 2nd gear operating area. The outcome of the PS method, however, could be set aside because of having less impact on the economy performance compared to that with the GD method.
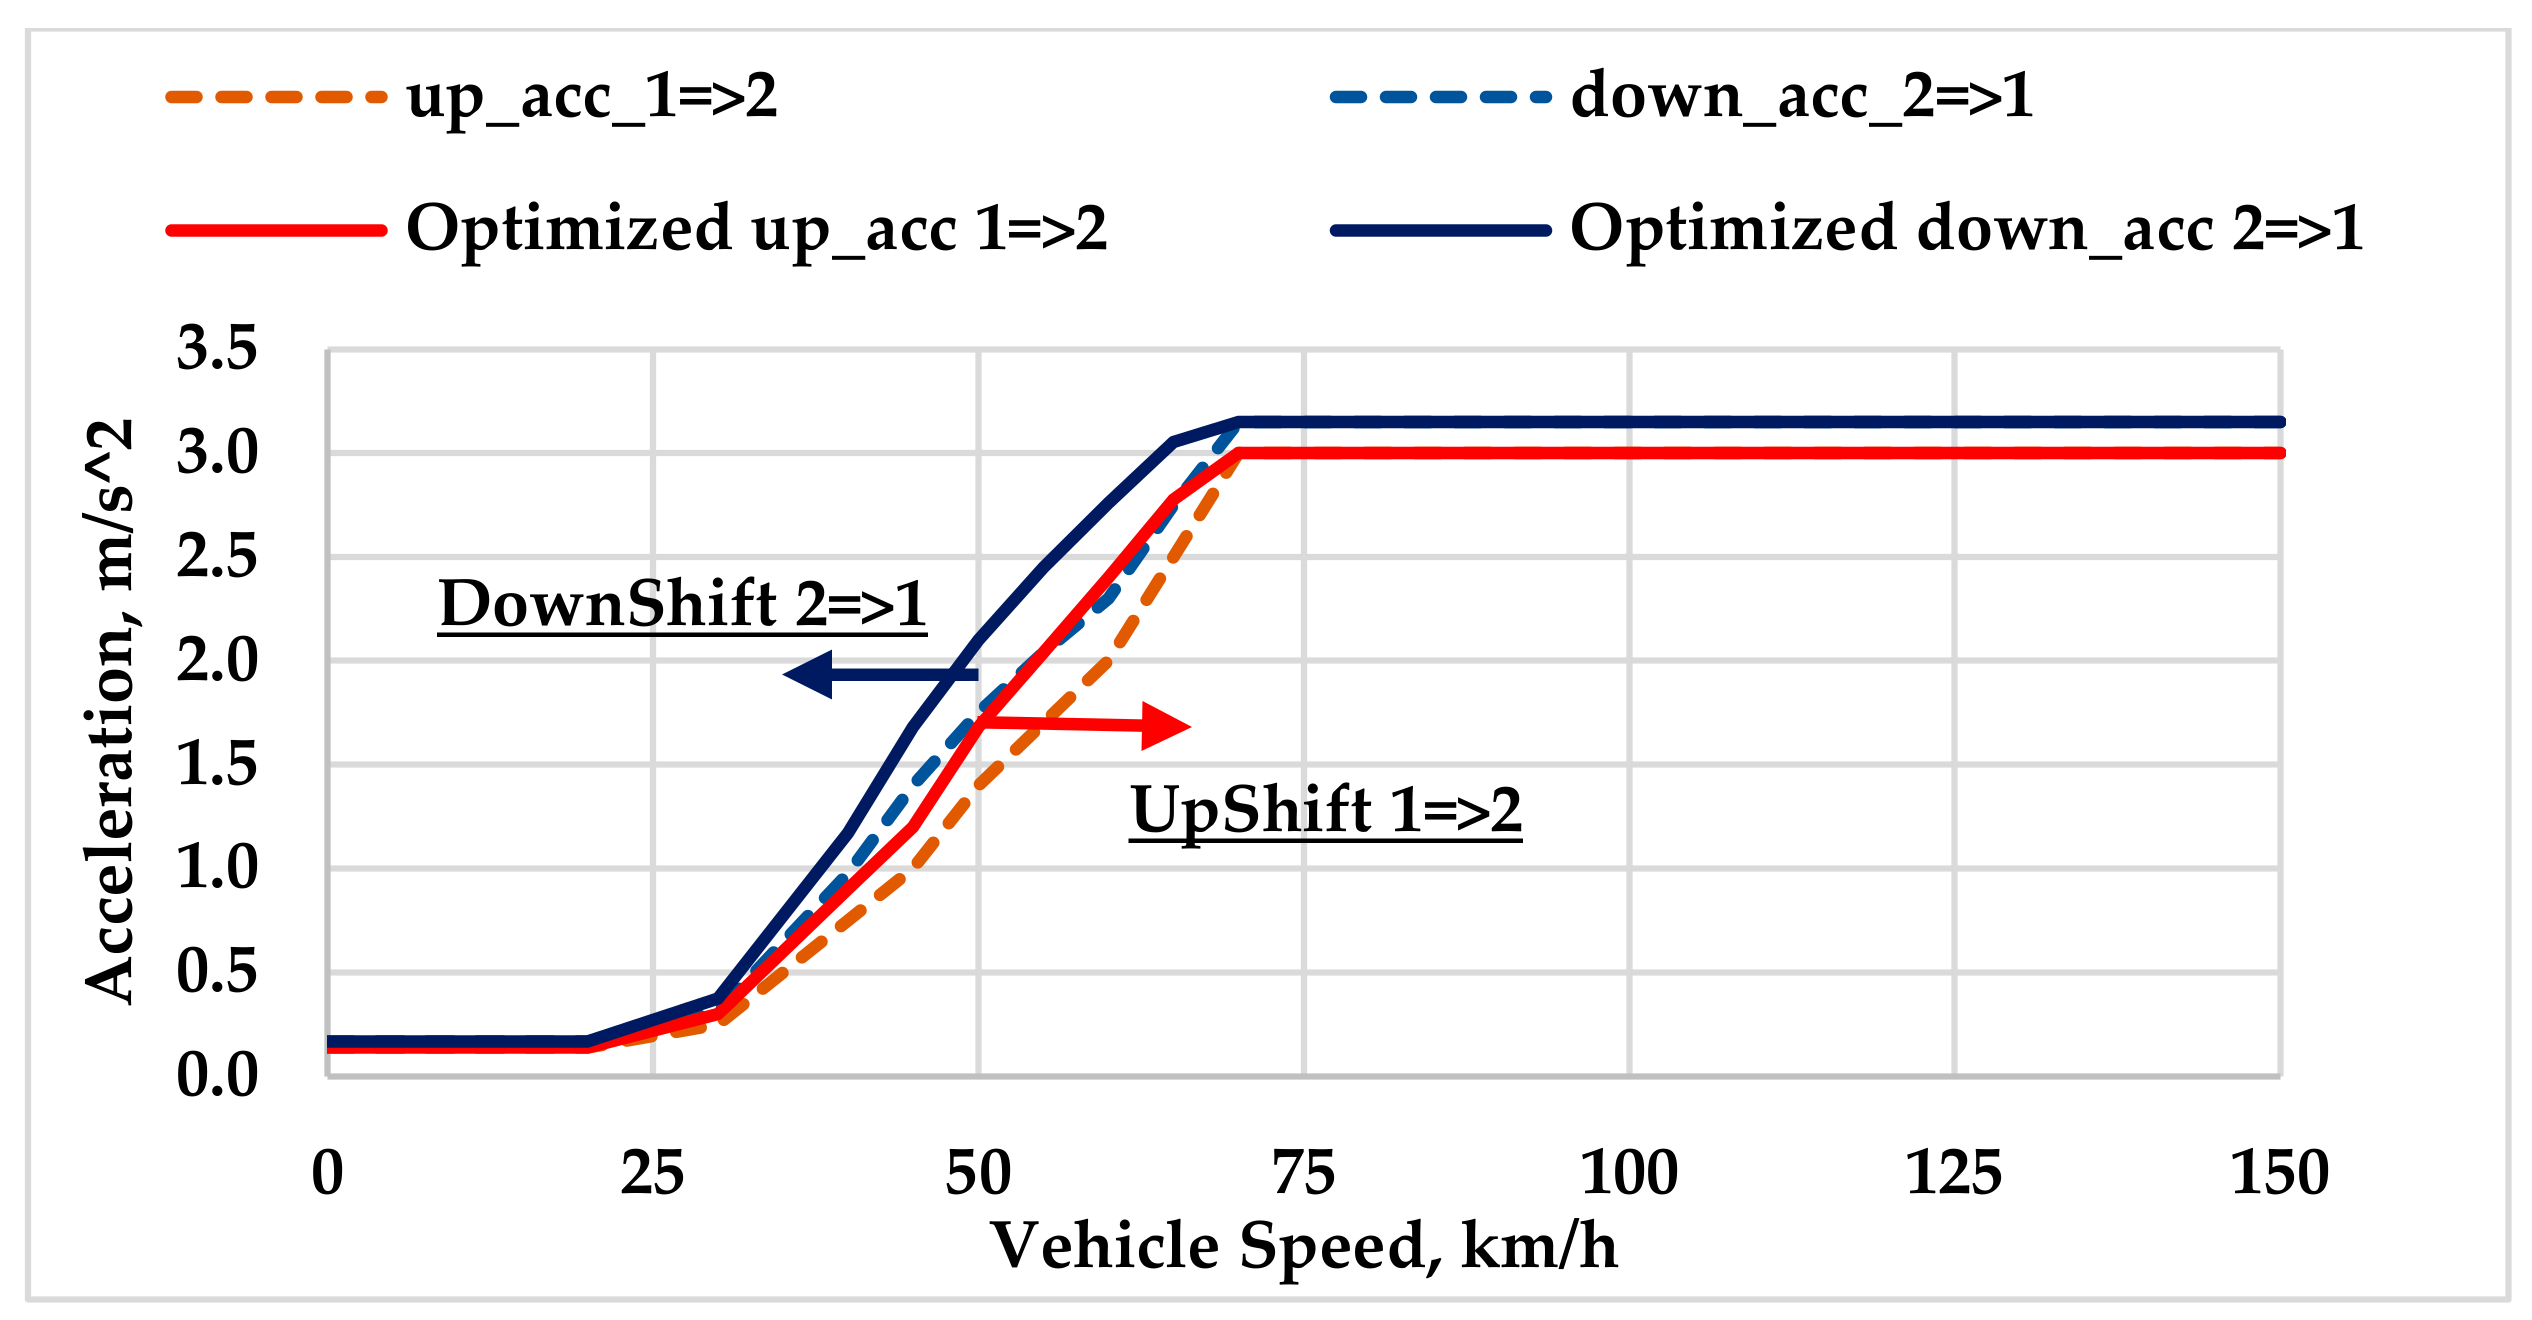
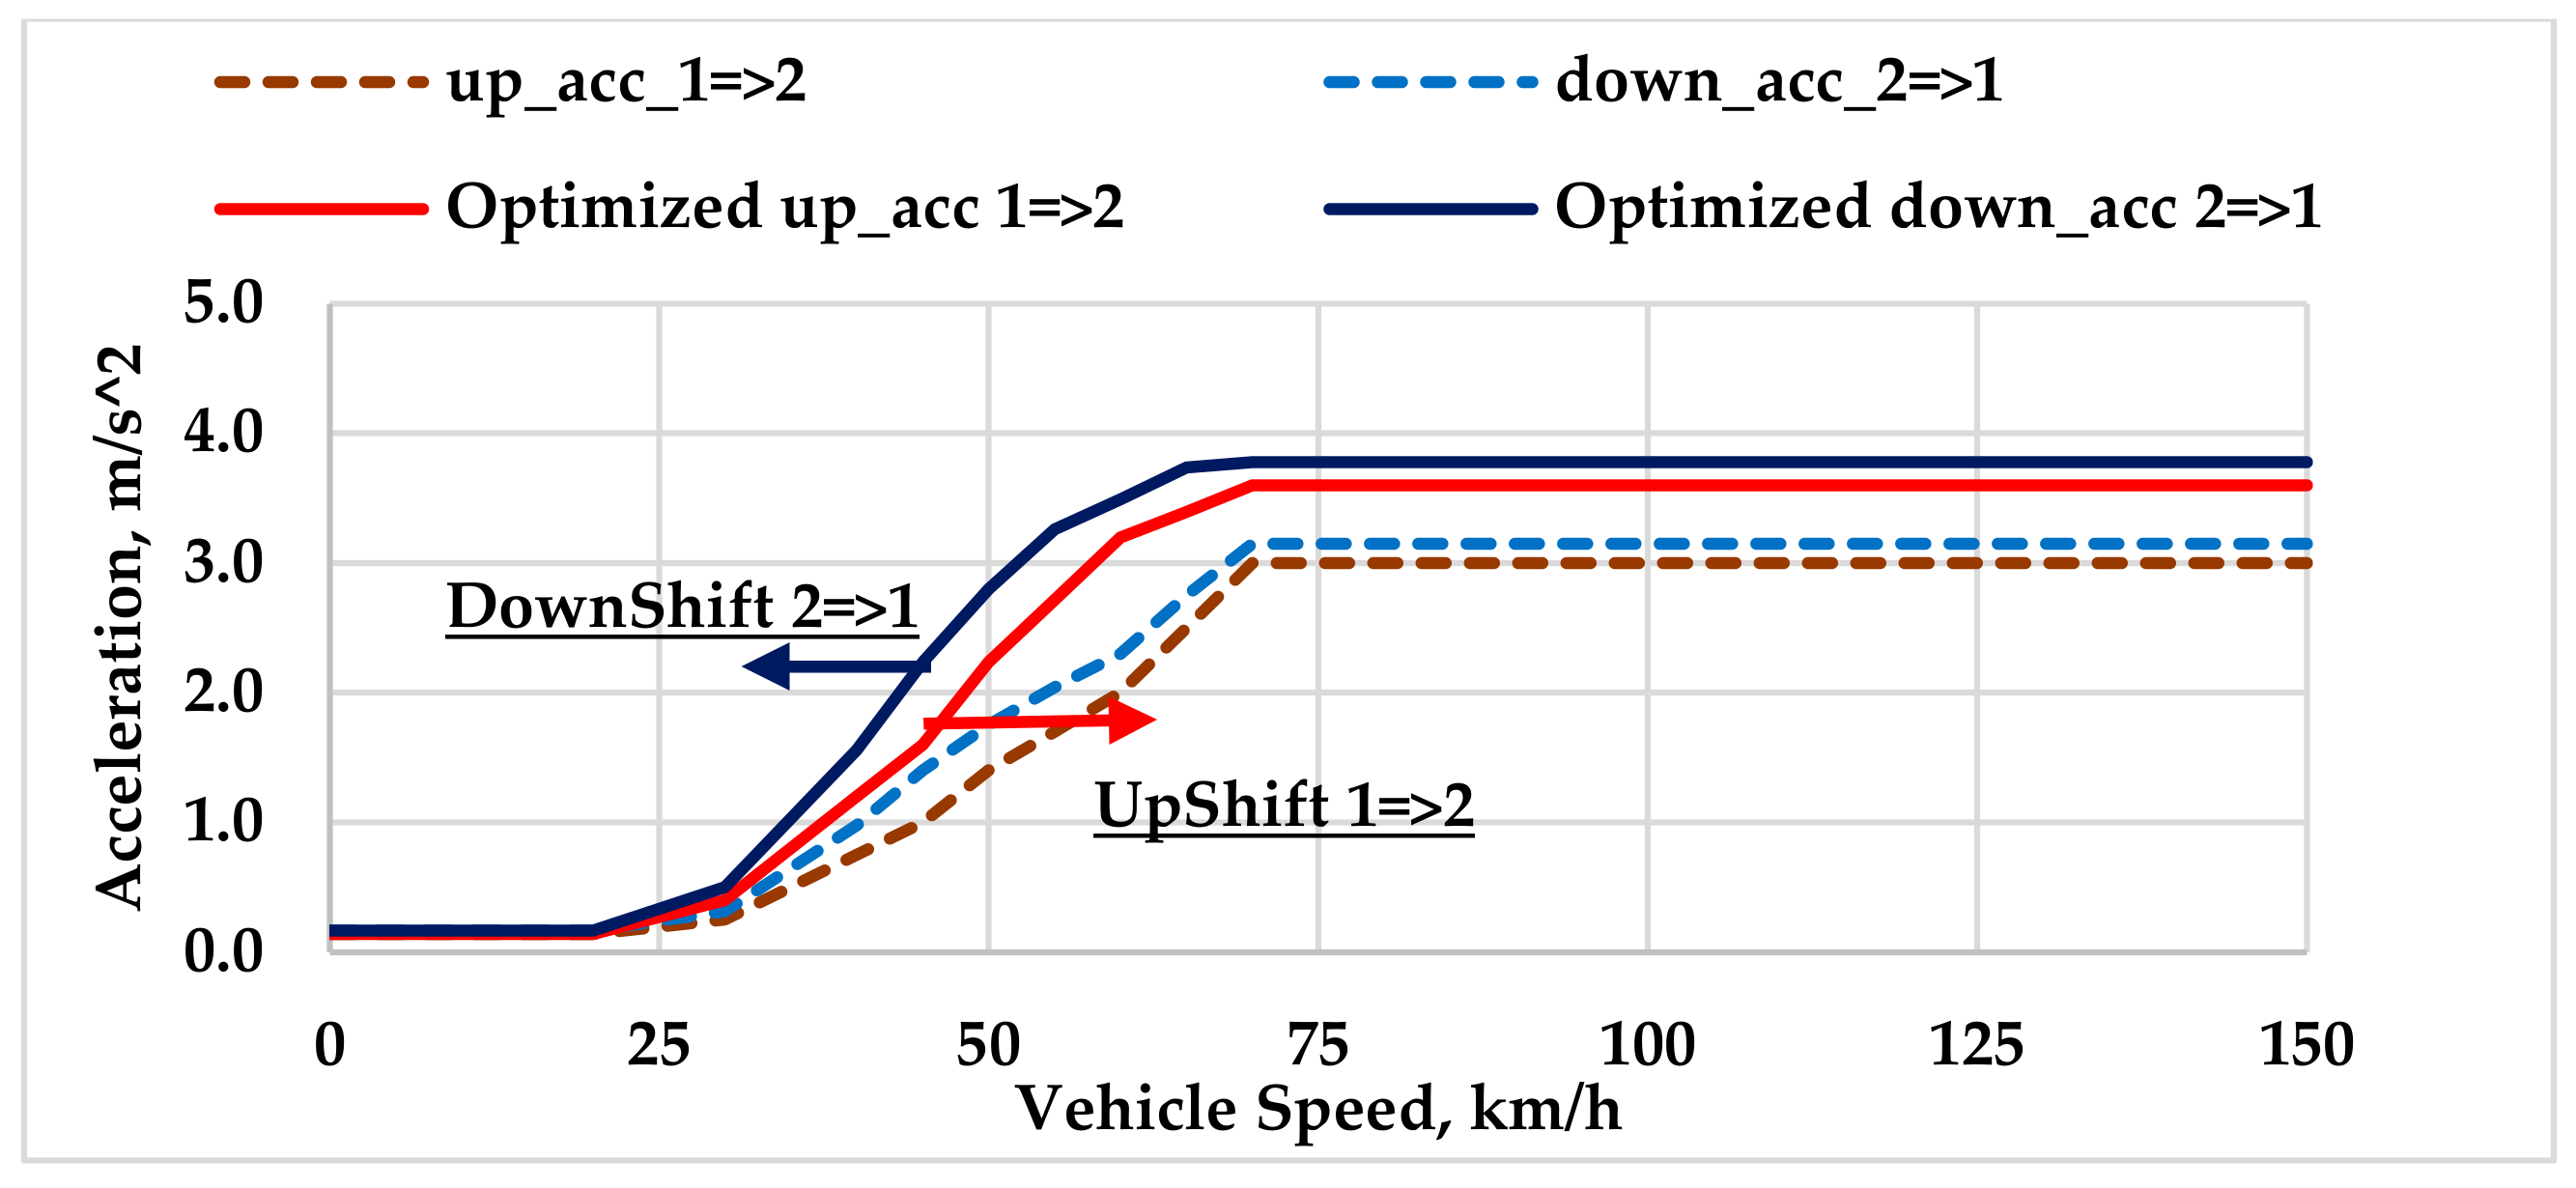
Based on the above analysis, two optimized gearshift schedules in relation to vehicle acceleration have been proposed for large and small size vehicles as shown in Figure 17 and Figure 18, respectively. A primary gearshift map for the large and small size vehicle was moved up to 20% and 60%, respectively, with some adjustment at the top above 60 km/h.
It can be said that the impact of the gearshift schedule in relation to acceleration was less compared to that with the gear ratios; however, this analysis could be more helpful when an EV powertrain is implemented on larger or heavy-duty vehicles [6,32]. Therefore, these findings could be viewed as a guideline that could be applied heuristically depending on the size of a vehicle.
3.1.2. Optimized Gearshift Schedule for a Hilly Road
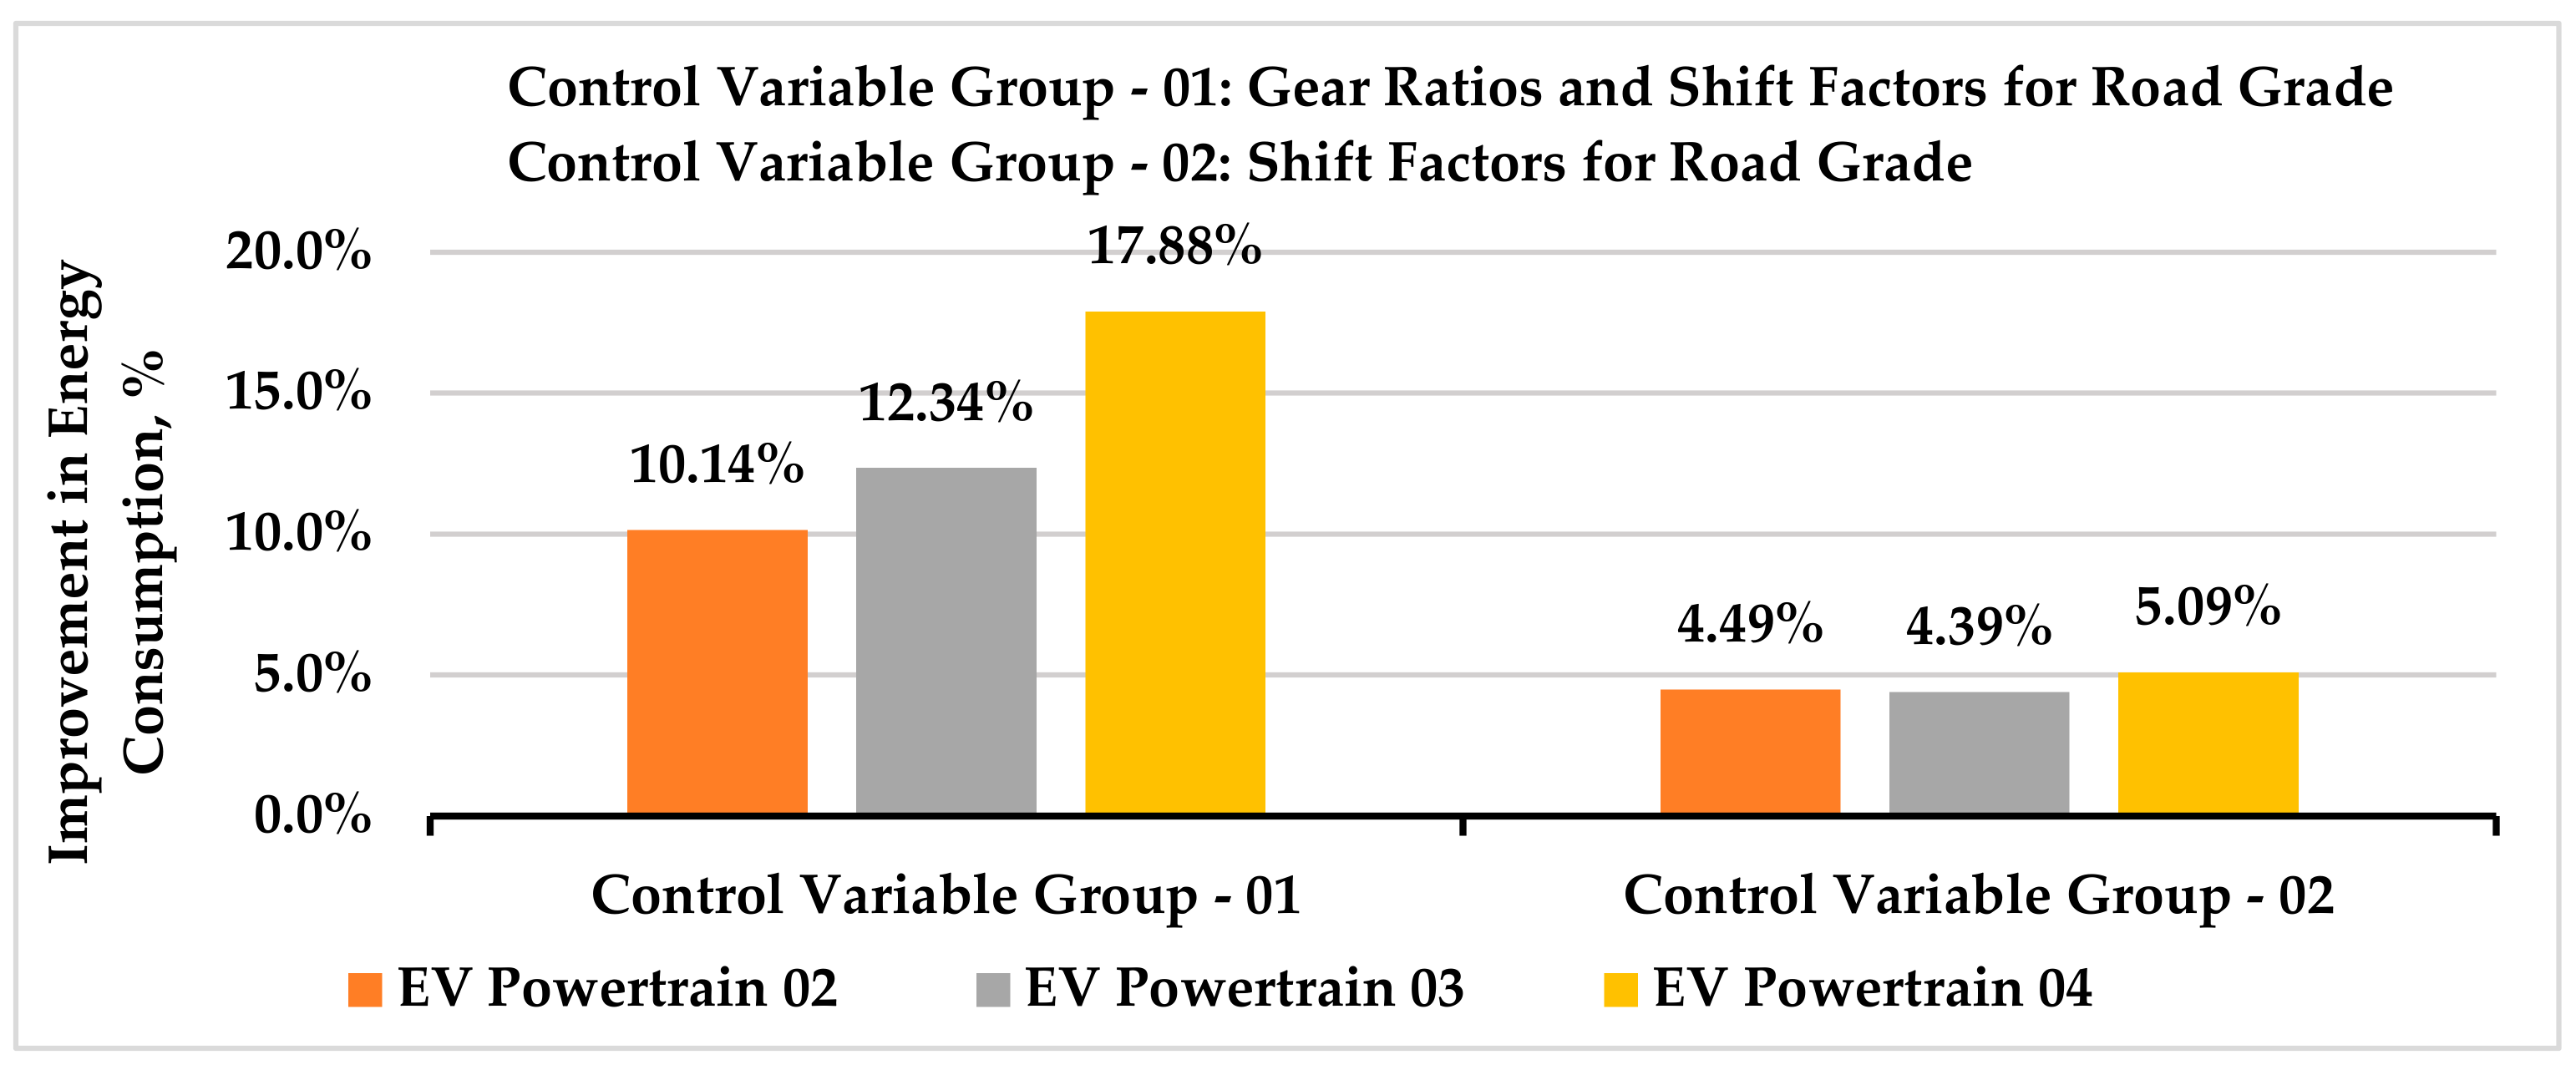
The optimization of the gearshift schedule for the road grade was carried out over the driving conditions presented in Figure 14. It was revealed that the traction motor EM-A, with a relatively lower torque capacity, could not be considered to run the large size vehicle. Under the proposed road grade distribution, the simulation results showed that the maximum track error was above 30 km with the EV powertrain 01, while it was below 7 km with the other three EV powertrains; therefore, the simulation results of the EV powertrain 01 on inclined road conditions are not presented in this analysis. Table 10 shows the energy consumption after the optimization of the EV powertrains considering two groups of control variables separately. In this way, the individual contribution of each variable could be assessed on the energy consumption of the EV powertrain.
Figure 19 shows the highest potential of energy saving based on the data in Table 10. For the EV powertrain 02 and EV powertrain 03, the individual contribution of the gearshift map for the road grade to the vehicle economy was almost similar. For the EV powertrain 04, although the contribution of the gear ratio on energy saving was around three times, the contribution of the gearshift map for the road grade was still higher. In addition, the simulation results in Figure 19 reflect that the traction motor with a higher torque capacity showed more potential for energy savings.
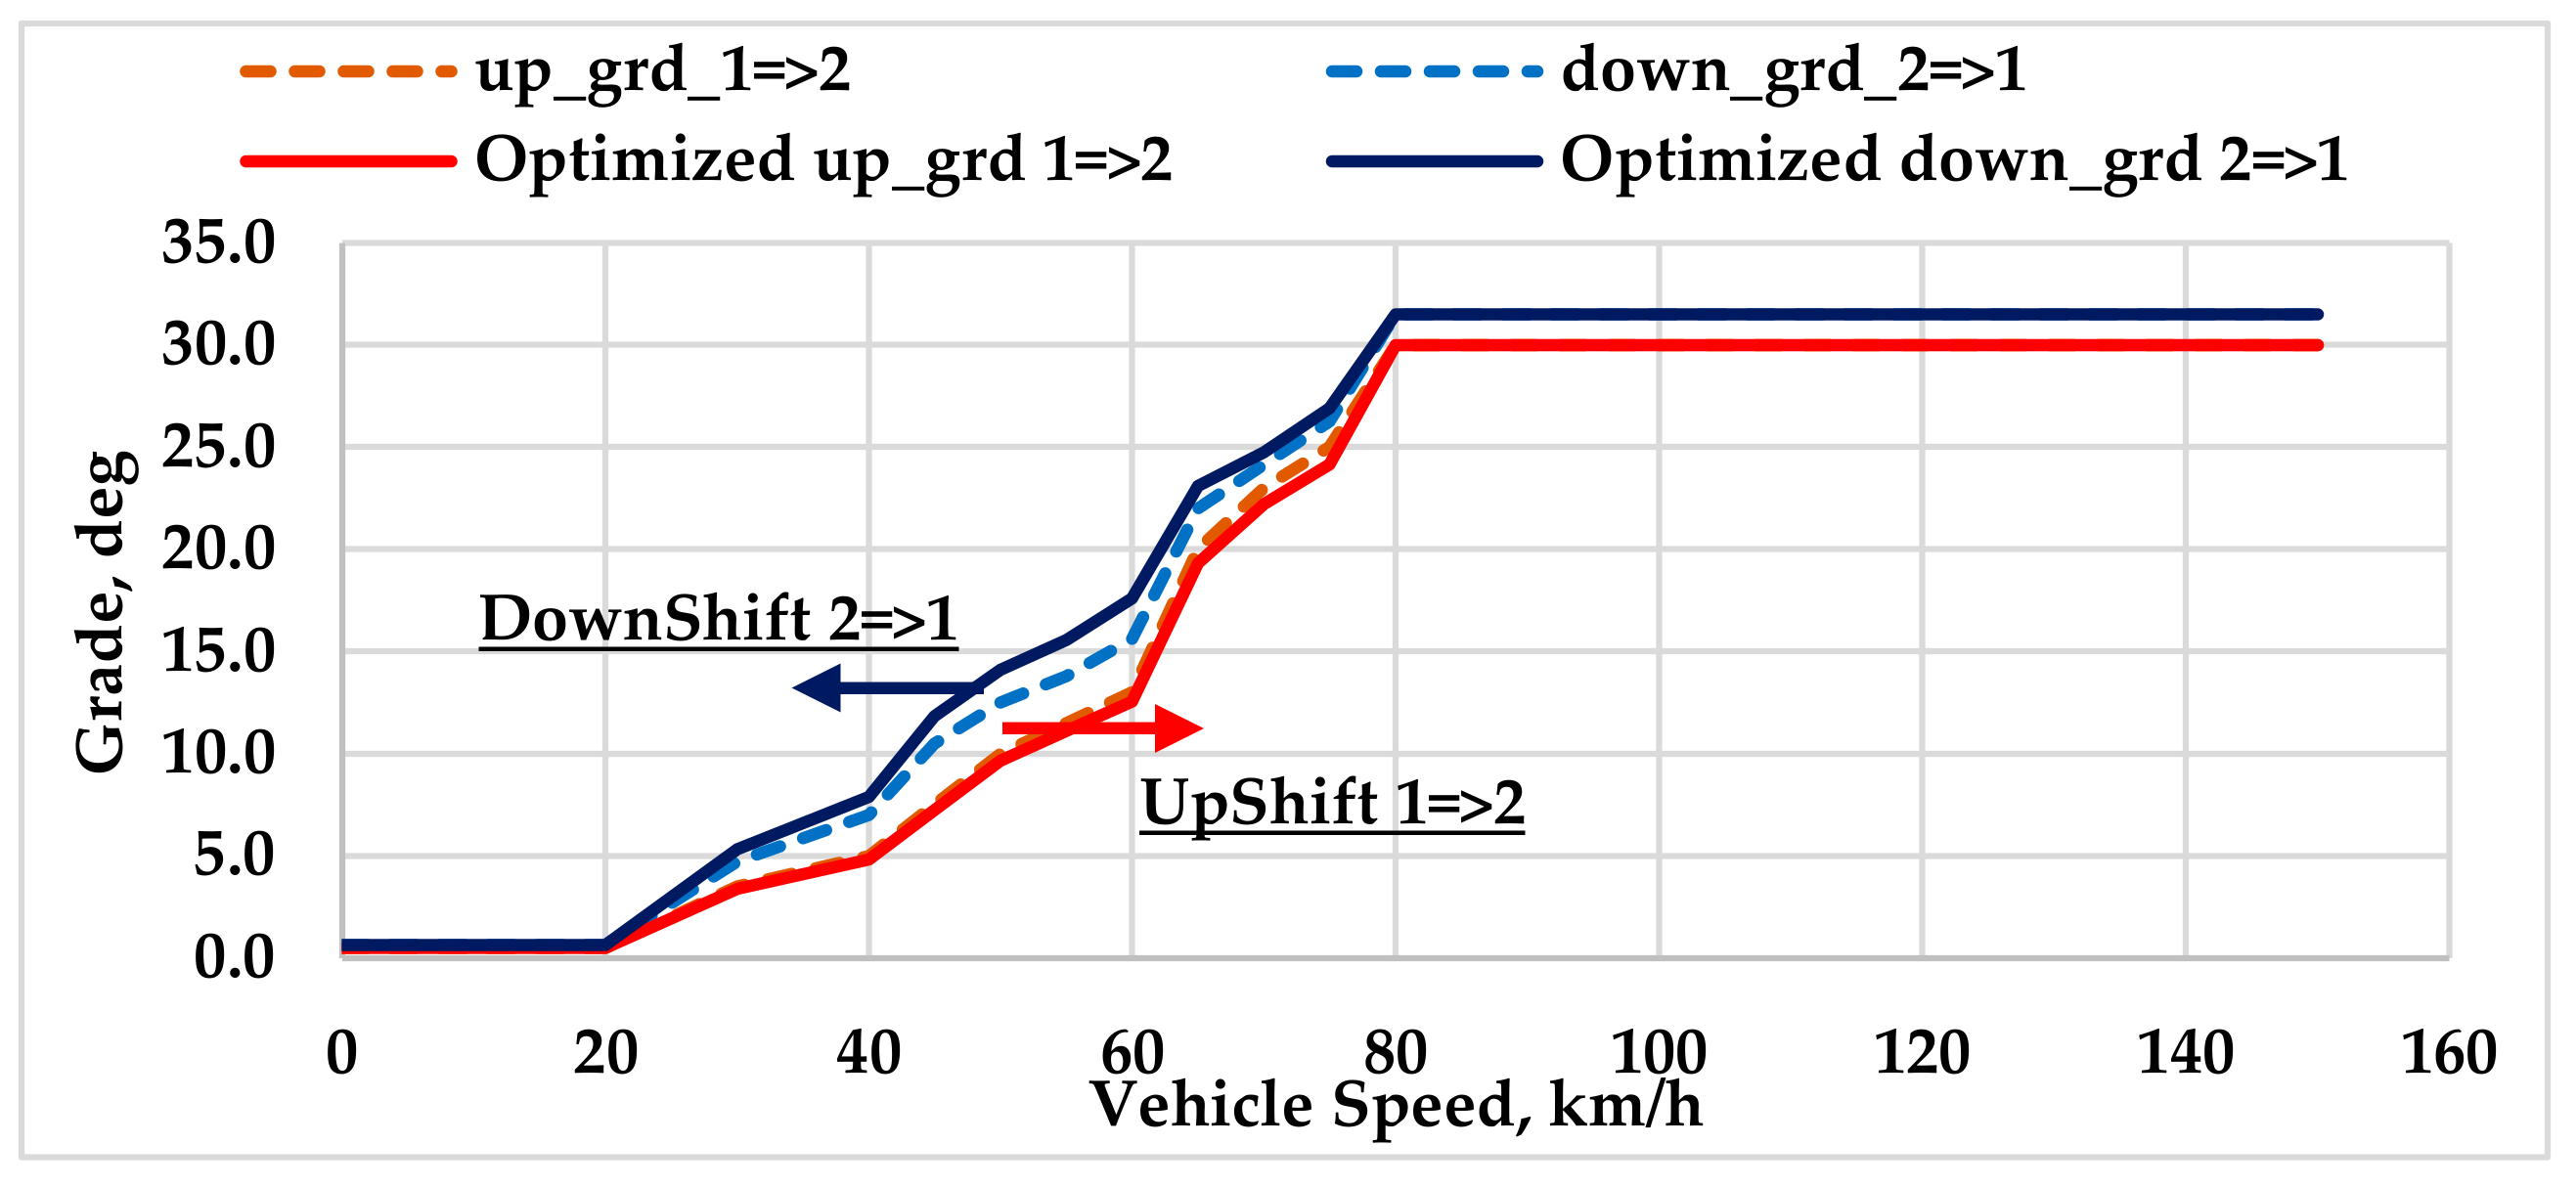
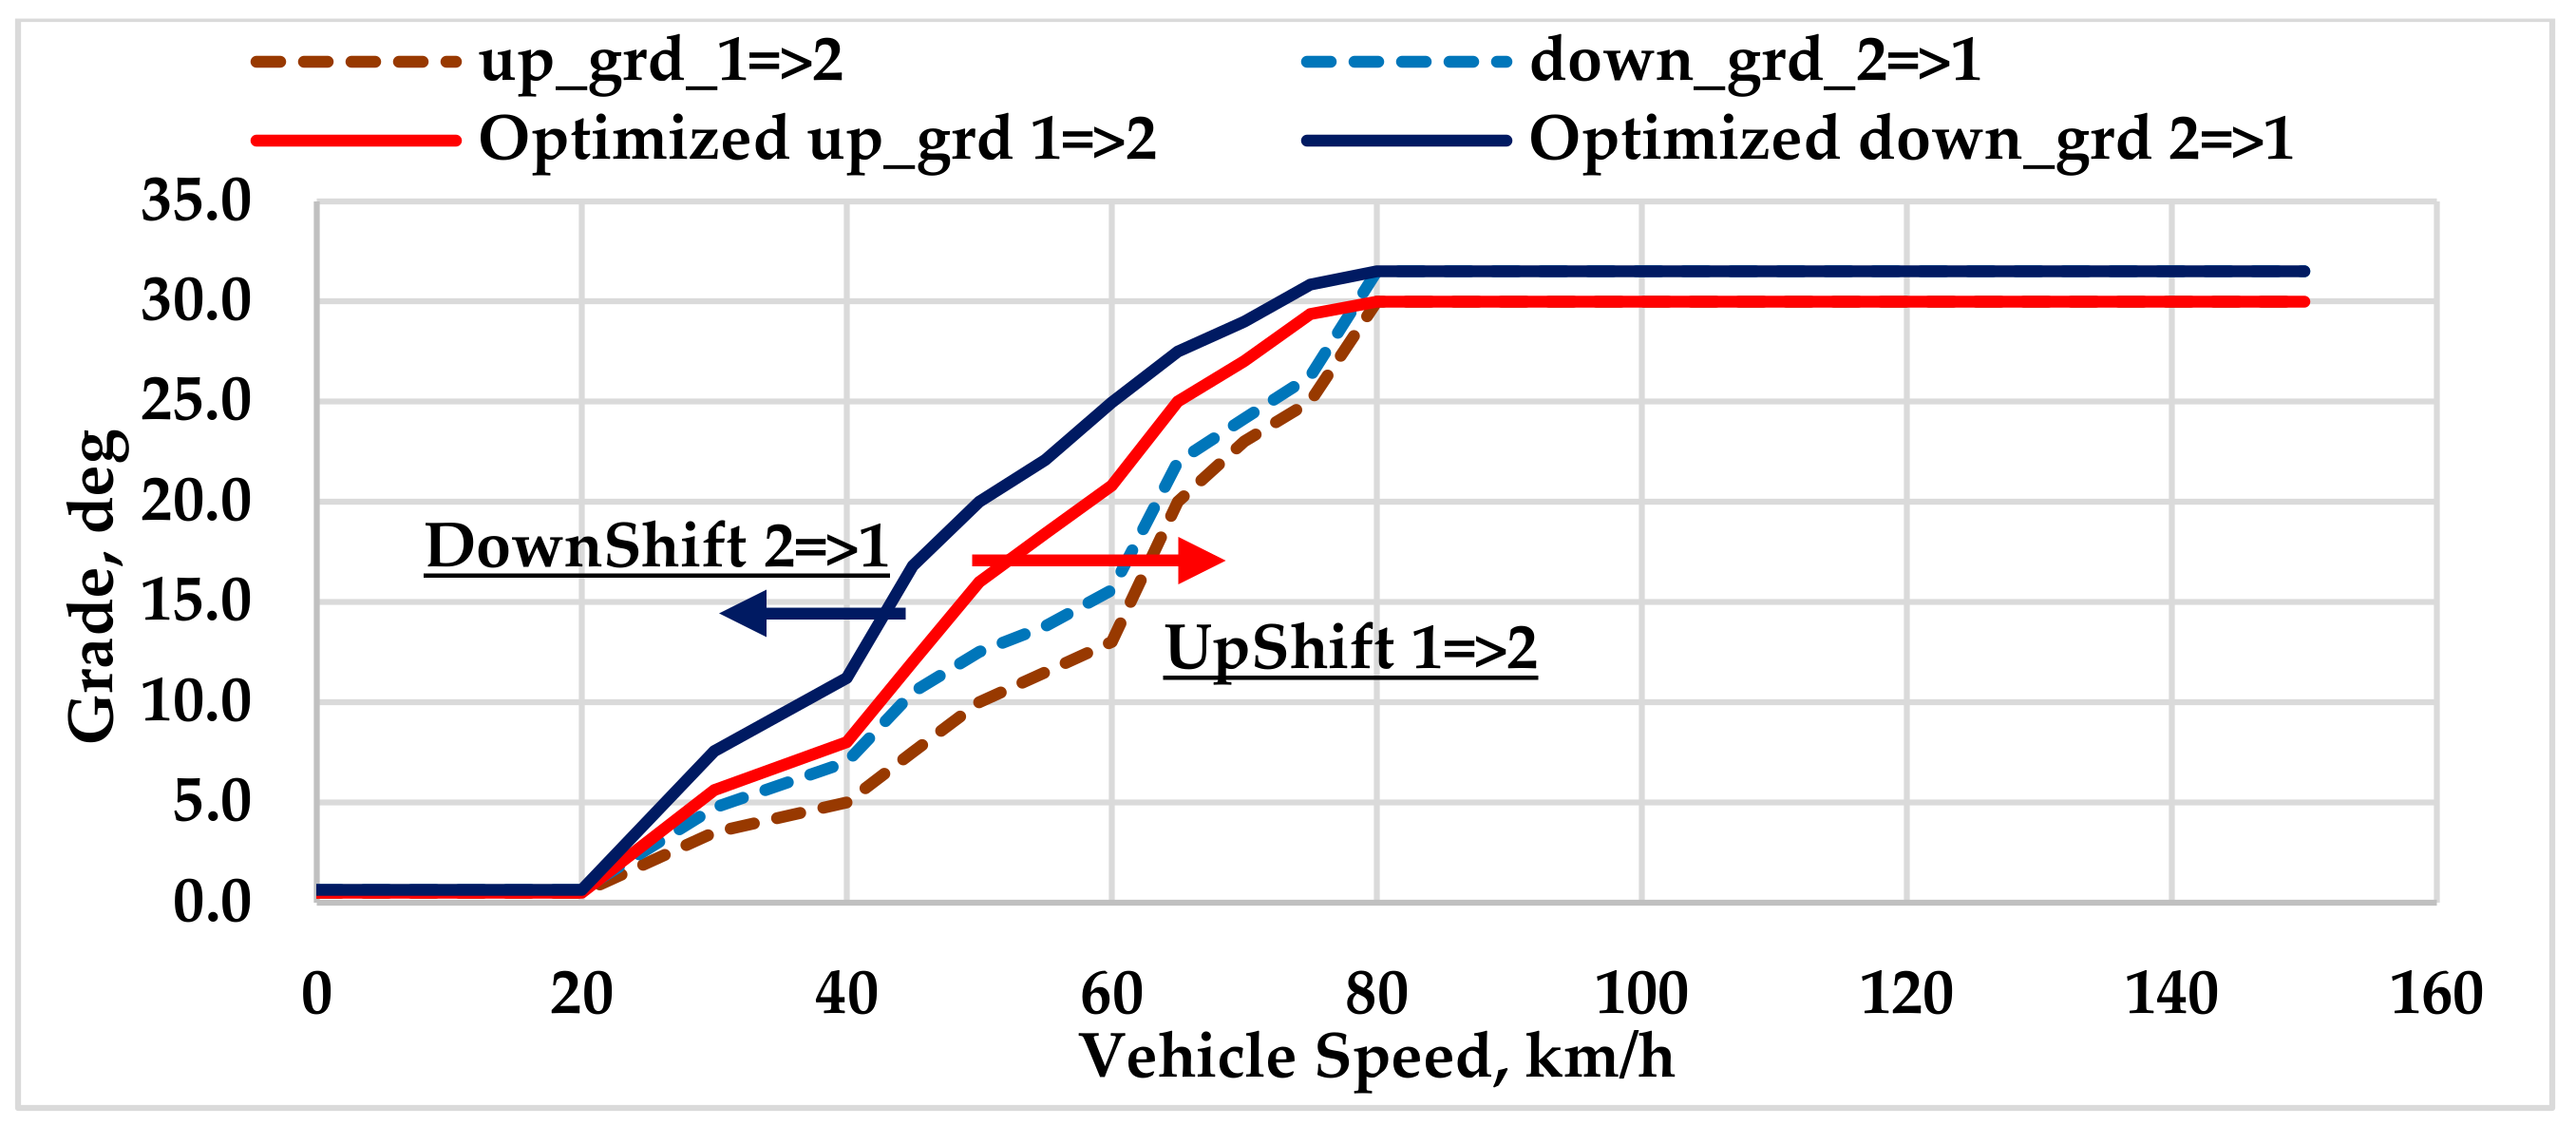
For the large size vehicle, the optimized results of the gearshift factors for the gearshift map on a hilly road following the PS method offered slightly more energy savings compared to that with the GD method. While the GD method was pushing the primary gearshift map 20% upwards, the PS method was widening the buffer zone instead of pushing the gearshift map in any direction. These trends are similar to the findings in the previous study of [22]. To broaden the understanding in this study, it was implemented on a small size vehicle to evaluate the performance of this proposed gearshift schedule. After optimization, the simulation results showed that the primary gearshift lines for both the upshift and downshift were pushed upward to the maximum limit, i.e., 60% up, allowing for more room for the second gear in operation. This analysis led to the following two gearshift maps for the large size and small size vehicle as shown in Figure 20 and Figure 21, respectively. Without any alteration to the main transition region for the gearshift, a small adjustment was made at the top end of the optimized gearshift lines to align with the upper limit of the primary gearshift lines.
It should be mentioned that the behavioral pattern of the performances of the EV powertrains under the proposed gearshift schedule was the focus of this study instead of establishing how much improvement can be achieved. For example, with a different set of initial gear ratios, the numerical improvement in the vehicle economy will vary; however, the trend of widening the buffer zone between the downshift and upshift lines for a large size vehicle on hilly road conditions would be the same. For a small size vehicle, an upward move of both the gearshift maps in relation to the acceleration and road grade would be more beneficial compared to that with widening the buffer zone. Not to mention, the impact of the gearshift schedule in relation to the road grade on the vehicle economic performance would be substantially higher compared to that with the gearshift map for acceleration.
3.1.3. Comparison of Results with a Conventional Approach
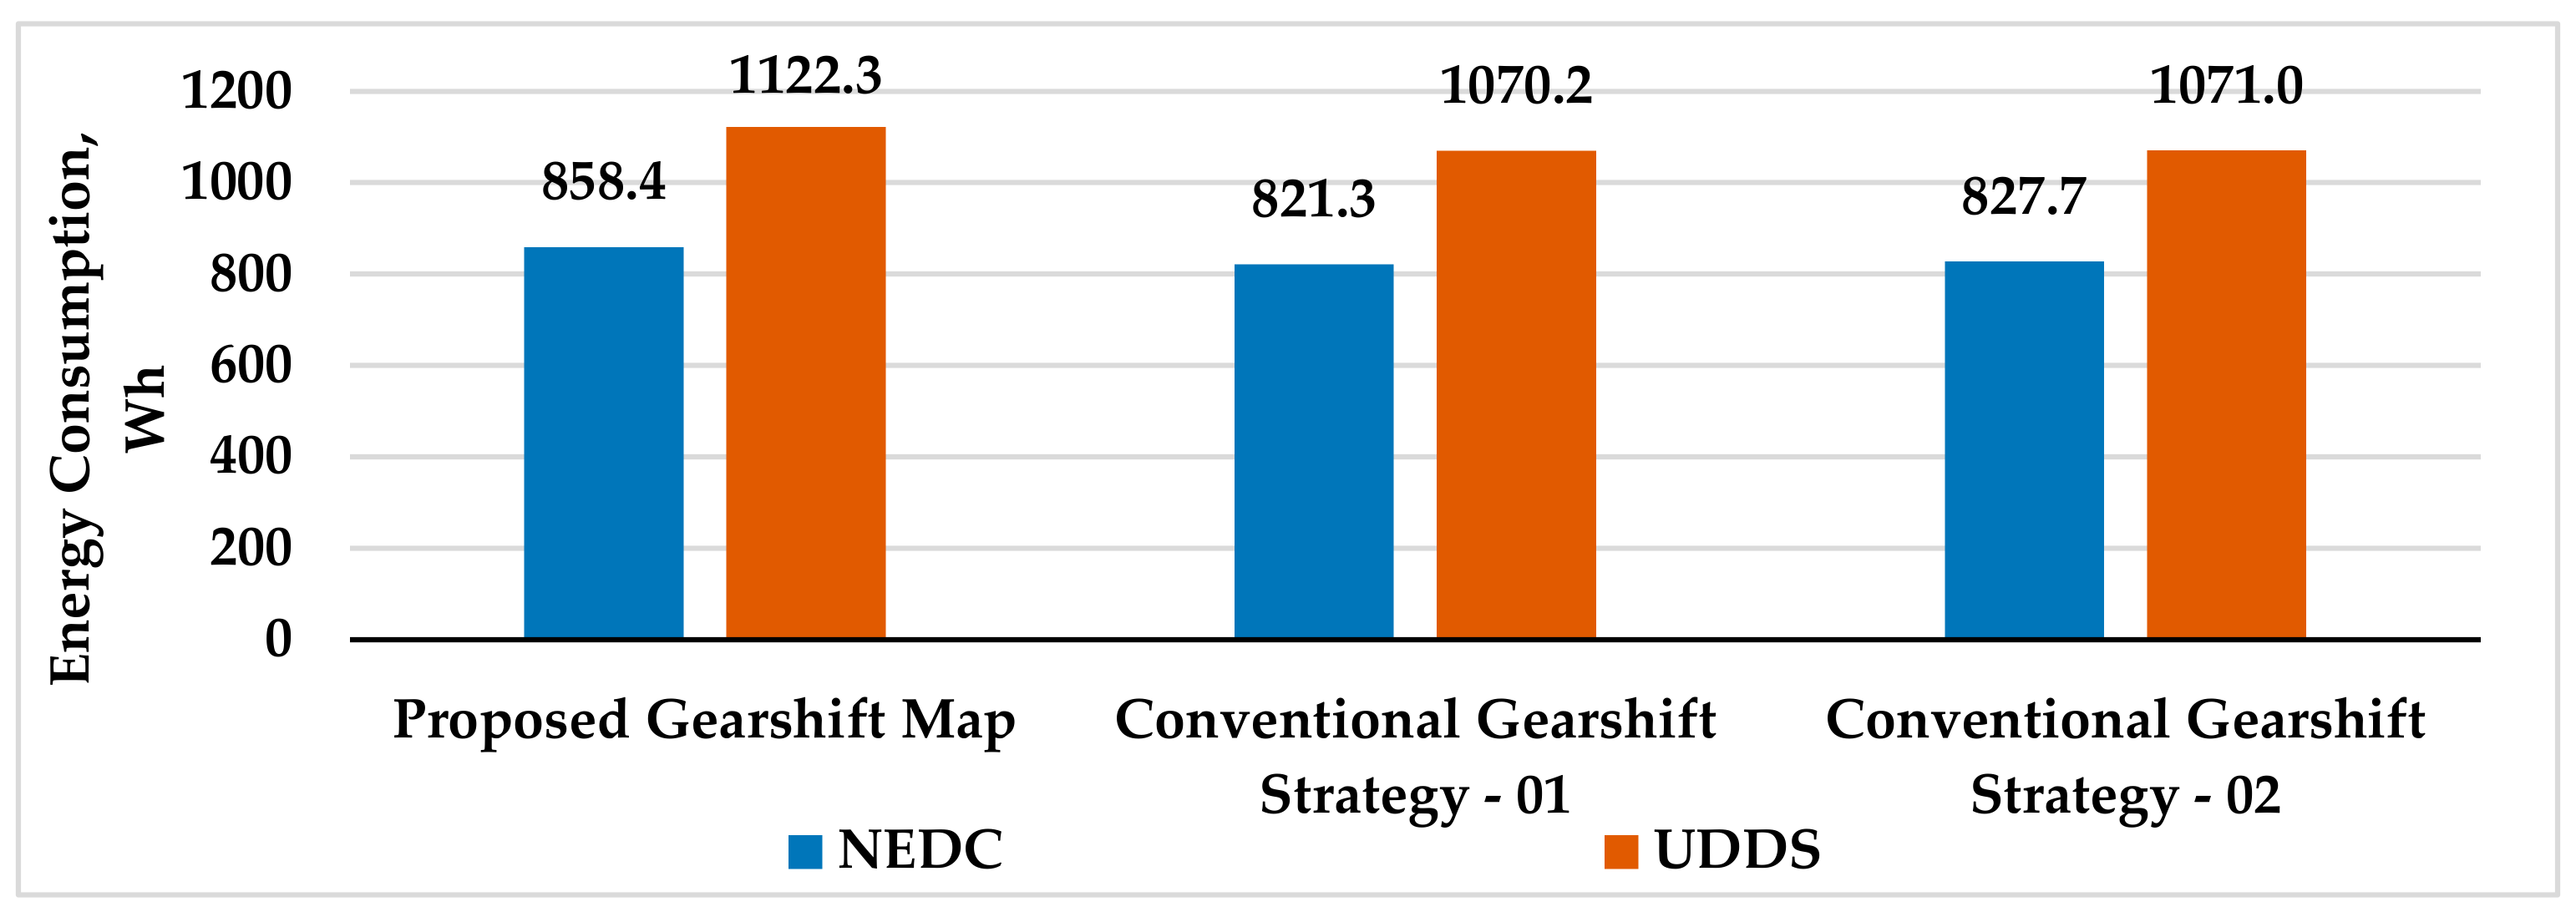
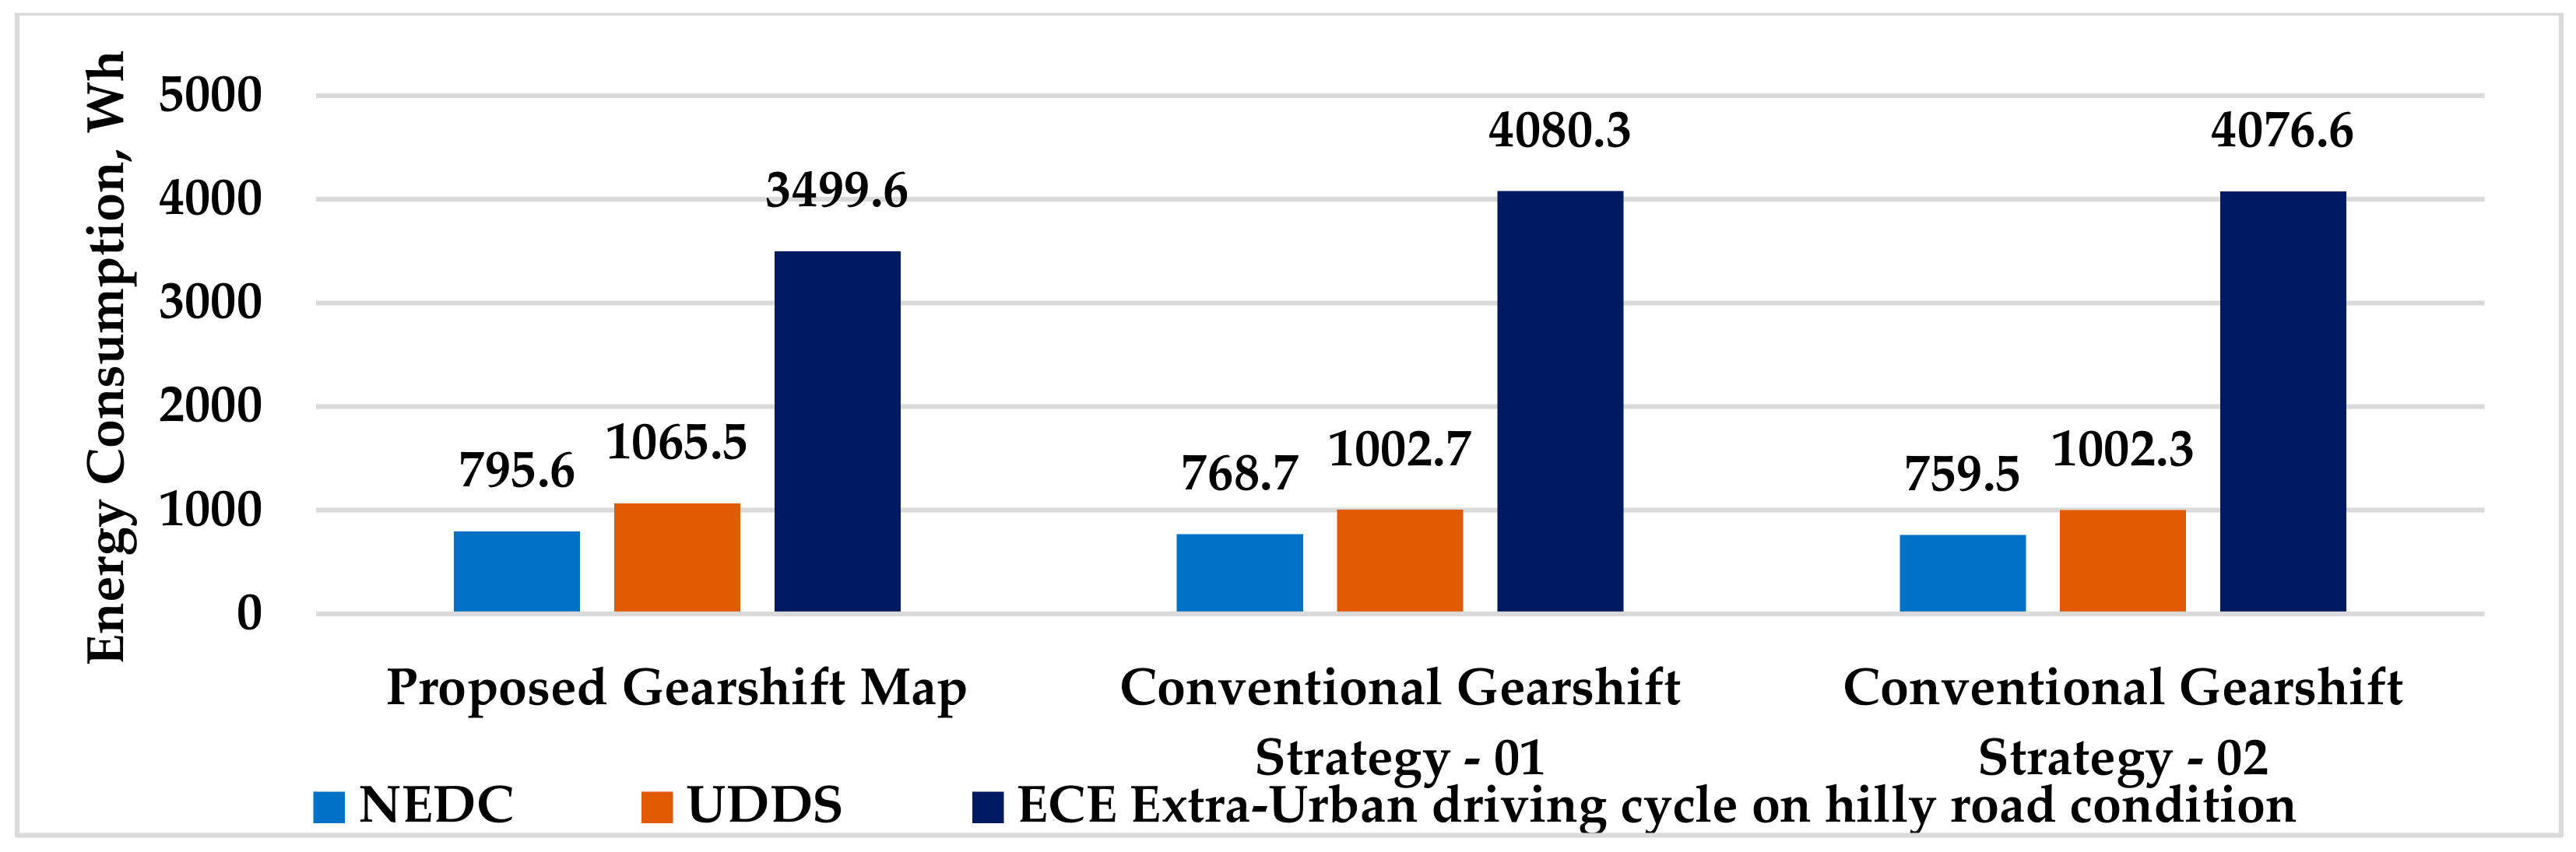
Energy consumption following the proposed gearshift schedule considering the EV powertrain 01 and EV powertrain 02 was compared to that based on two conventional approaches, i.e., gearshift strategy 01 [24] and gearshift strategy 02 [17], as shown in Figure 22 and Figure 23, respectively. During the simulation, it appeared that the EV powertrain 01 was not capable of providing the required torque on a hilly road because of the traction motor with a relatively lower torque capacity; however, evaluating the performance of this powertrain against the conventional approaches was necessary because the traction motor in the EV powertrain 01 was installed in the experimental vehicle.
Figure 23 reflects that the energy consumption following the proposed gearshift strategy was around 3.3–4.5% and 5.8–5.9% more on the NEDC and UDDS, respectively, compared to that with the conventional approaches. A similar pattern of energy consumption can be found in Figure 22; however, there is the potential of approximately 16.5% less energy consumption with the proposed gearshift schedule within the EV powertrain 02. This indicates that through a conventional gearshift strategy, the vehicle economic performance could be compromised when the driving scenario changes from a flat road to hilly conditions. As proposed, it would be effective to introduce two separate gearshift maps in relation to the vehicle acceleration and road grade, instead of a single rule-based gearshift schedule. Although the energy consumption with the proposed gearshift strategy on flat road conditions was more than that with the conventional approaches, further research could be carried out to improve the economic performance of the proposed strategy in a flat road scenario.
3.2. Experimental Results
The purpose of the experiment was to evaluate the proposed gearshift schedule for the multi-speed transmission system in EVs. In the ideal scenario, it would have been better if the experiment could be carried out on an electric powertrain with a multi-speed AMT under various driving conditions, i.e., NEDC, UDDS, HWFET, etc.; however, the electric powertrain in the lab came with a four-speed manual transmission system. No facility of generating the standard driving cycle appears as another major challenge. Under these circumstances, it was decided to determine the unit energy consumption data, i.e., the Wh/km for the electric powertrain, on each gear that could be used to validate the proposed gearshift schedule strategy for the two-speed transmission system in the EV powertrain.
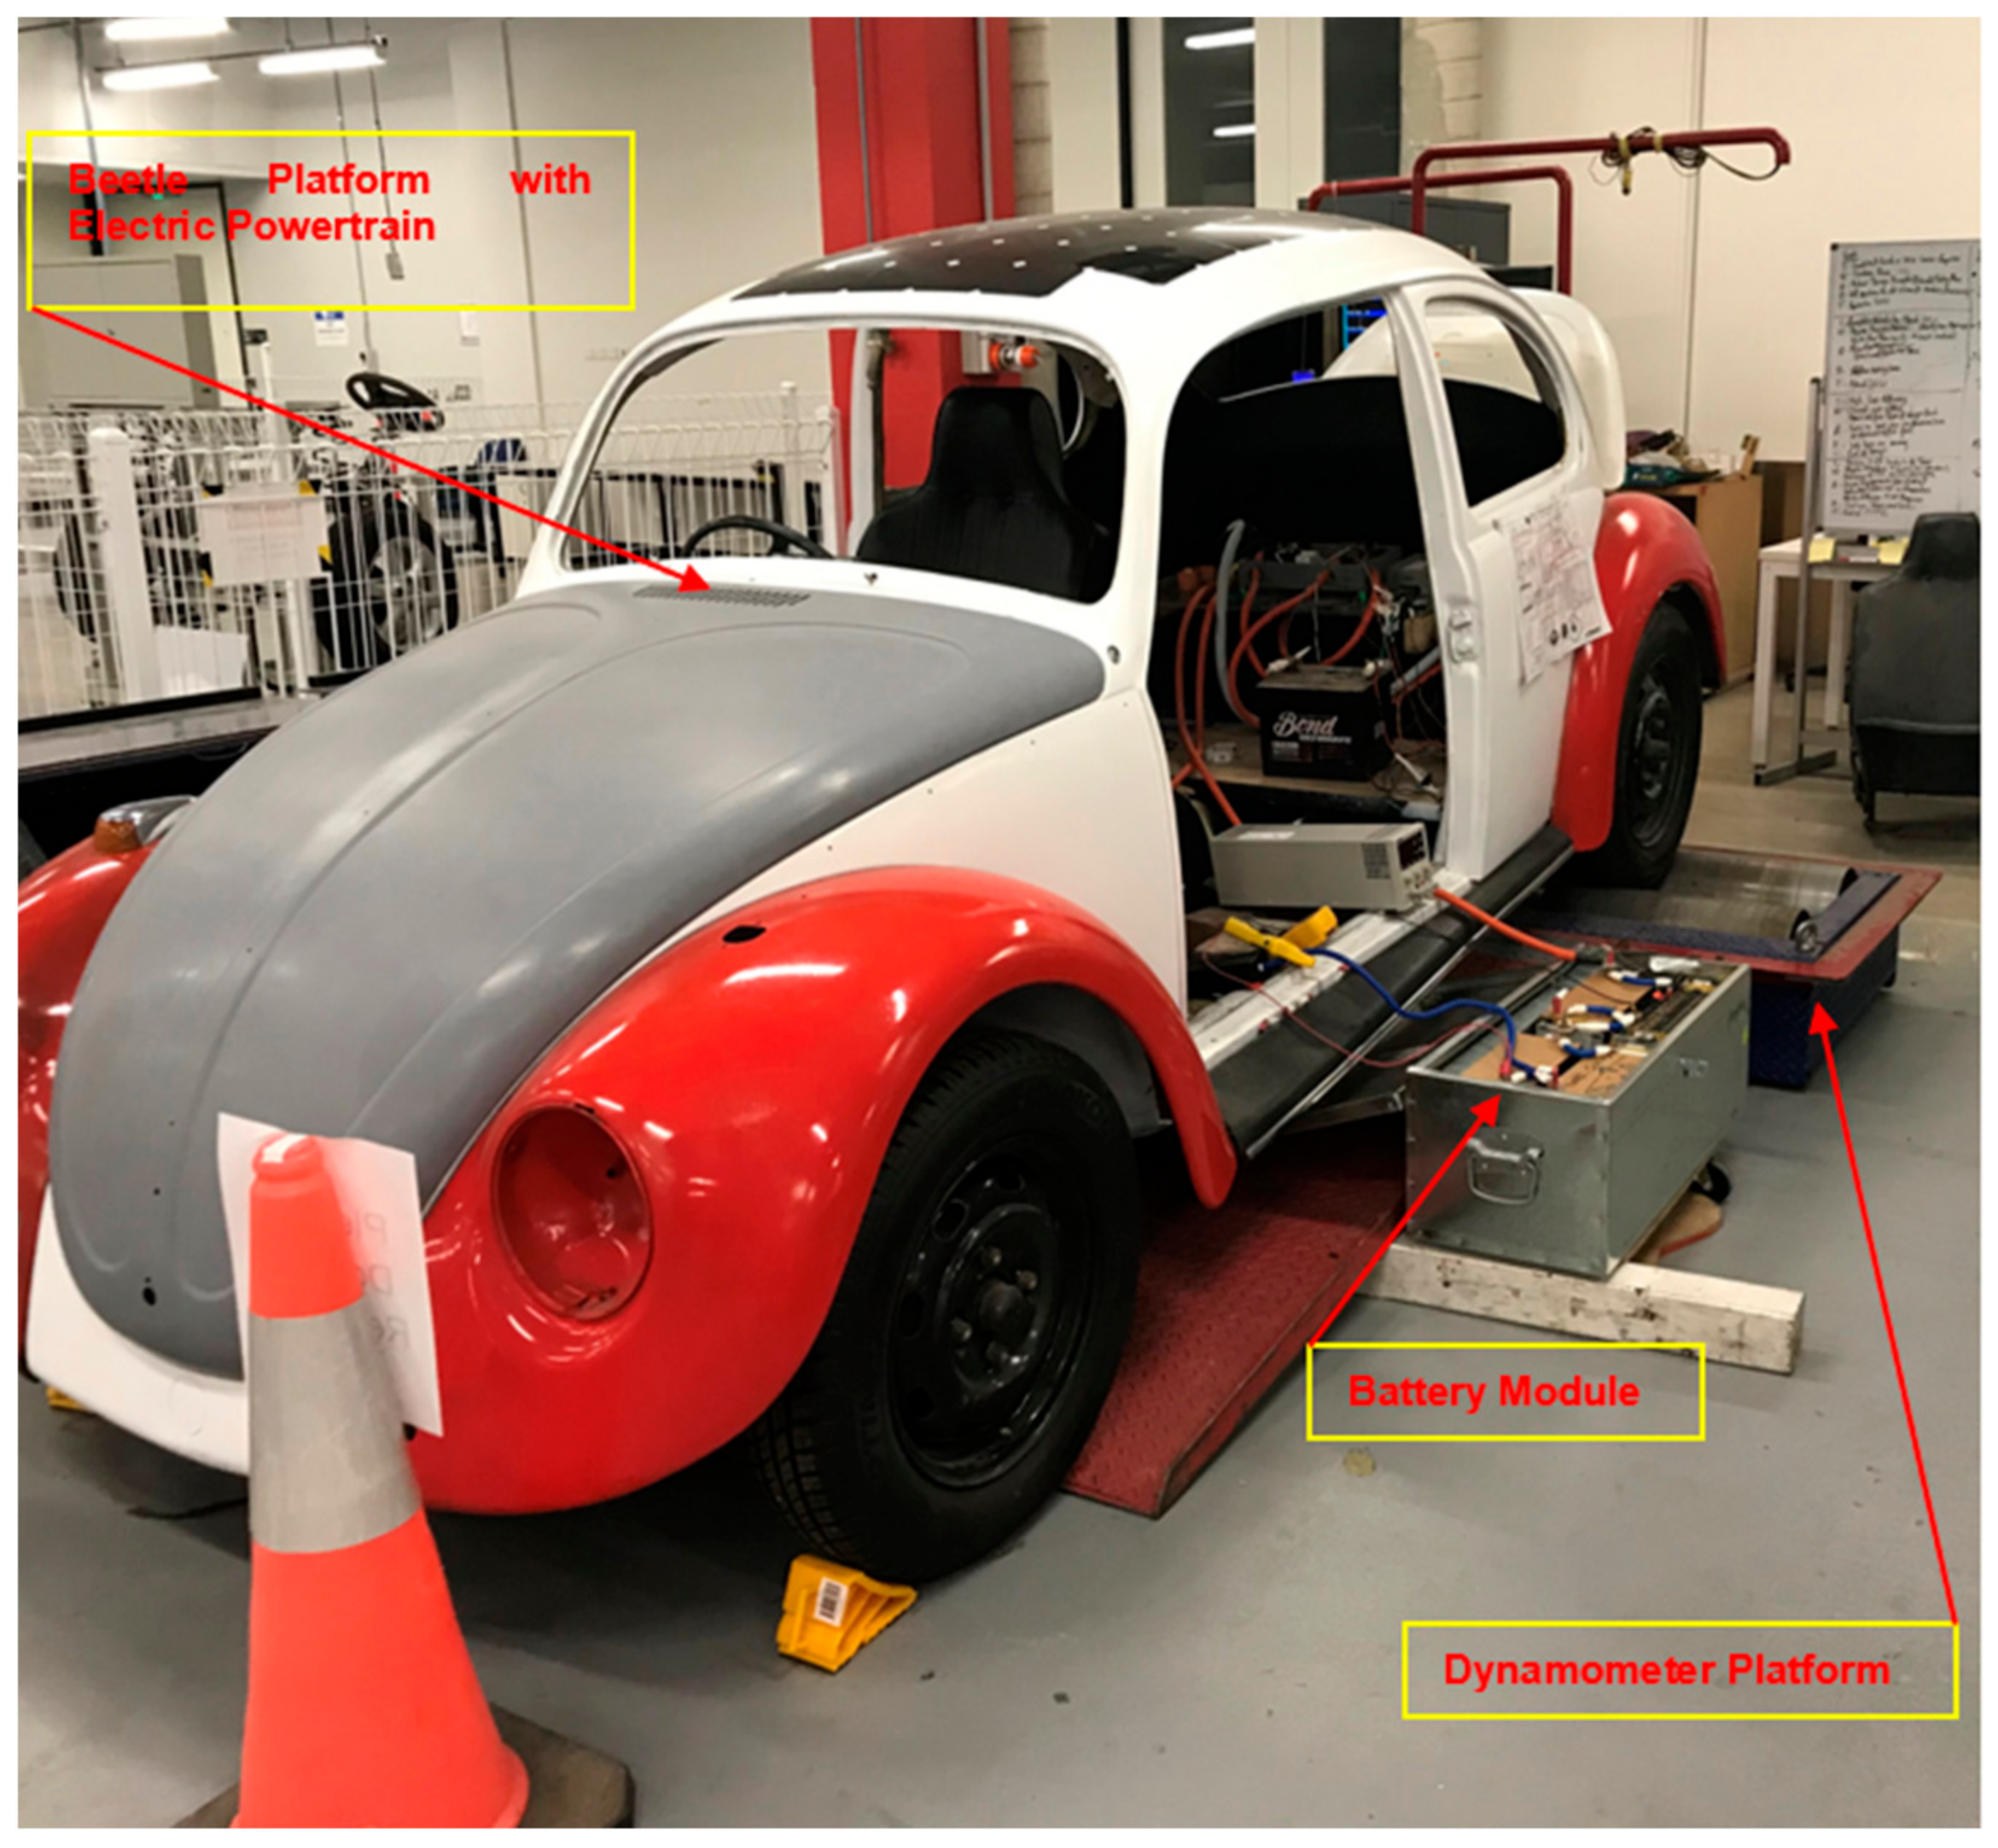
The experimental setup in the lab included an electric powertrain with a four-speed manual transmission system within a VW Beetle platform, a lithium-titanate battery module, and a dynamometer. An overview of the experimental arrangement has been presented in Figure 24.
While reviewing the lab facilities, the vehicle platform, traction motor, transmission system, battery module, and the dynamometer were identified as the key equipment for this experiment. In line with that, Table 11, Table 12 and Table 13 show the estimation of the vehicle load on the dyno, gear ratio of the four-speed manual transmission system, and battery parameters, respectively. The parameters of the installed HPEVS AC-50 brushless AC motor in the test vehicle, i.e., EM-A, are presented in Table 2. The operating voltage and maximum current of this motor were noted as 96 V and 650 A, respectively. To drive this electric motor, an H-bridge DC-AC (Curtis 1238–7601) inverter was used with a PWM switching technique. The frequency of this switching was 15 KHz.
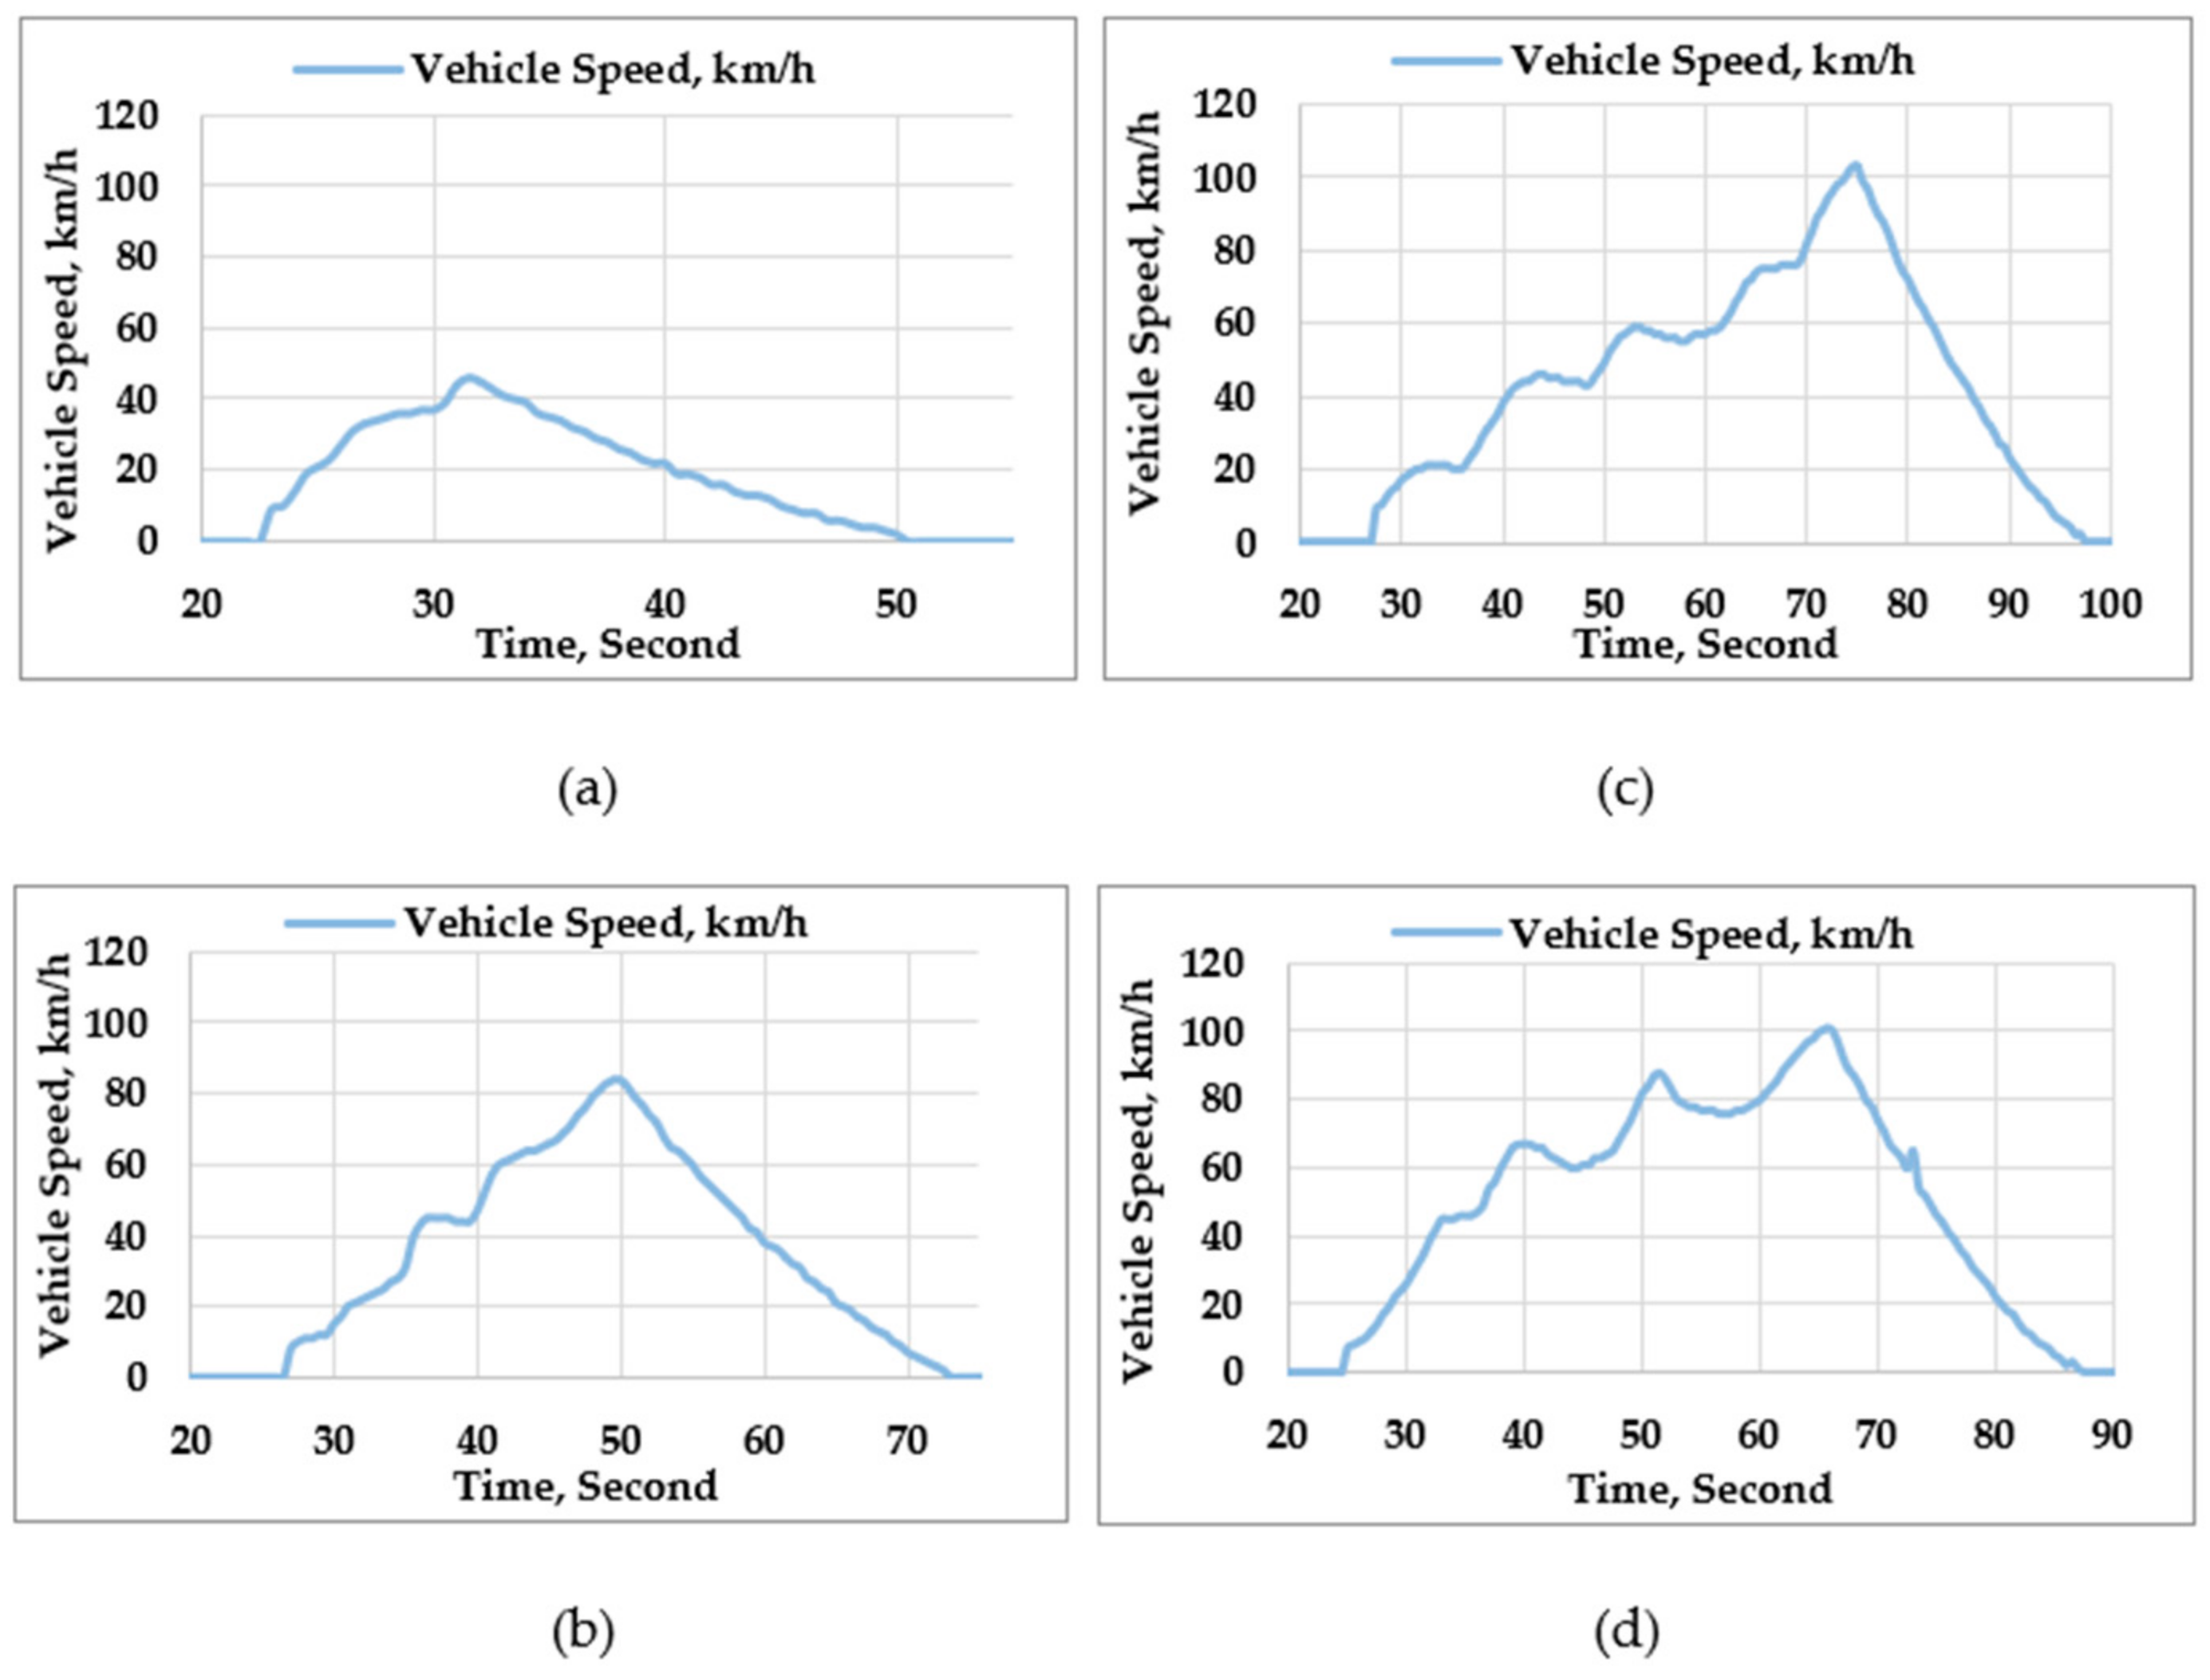
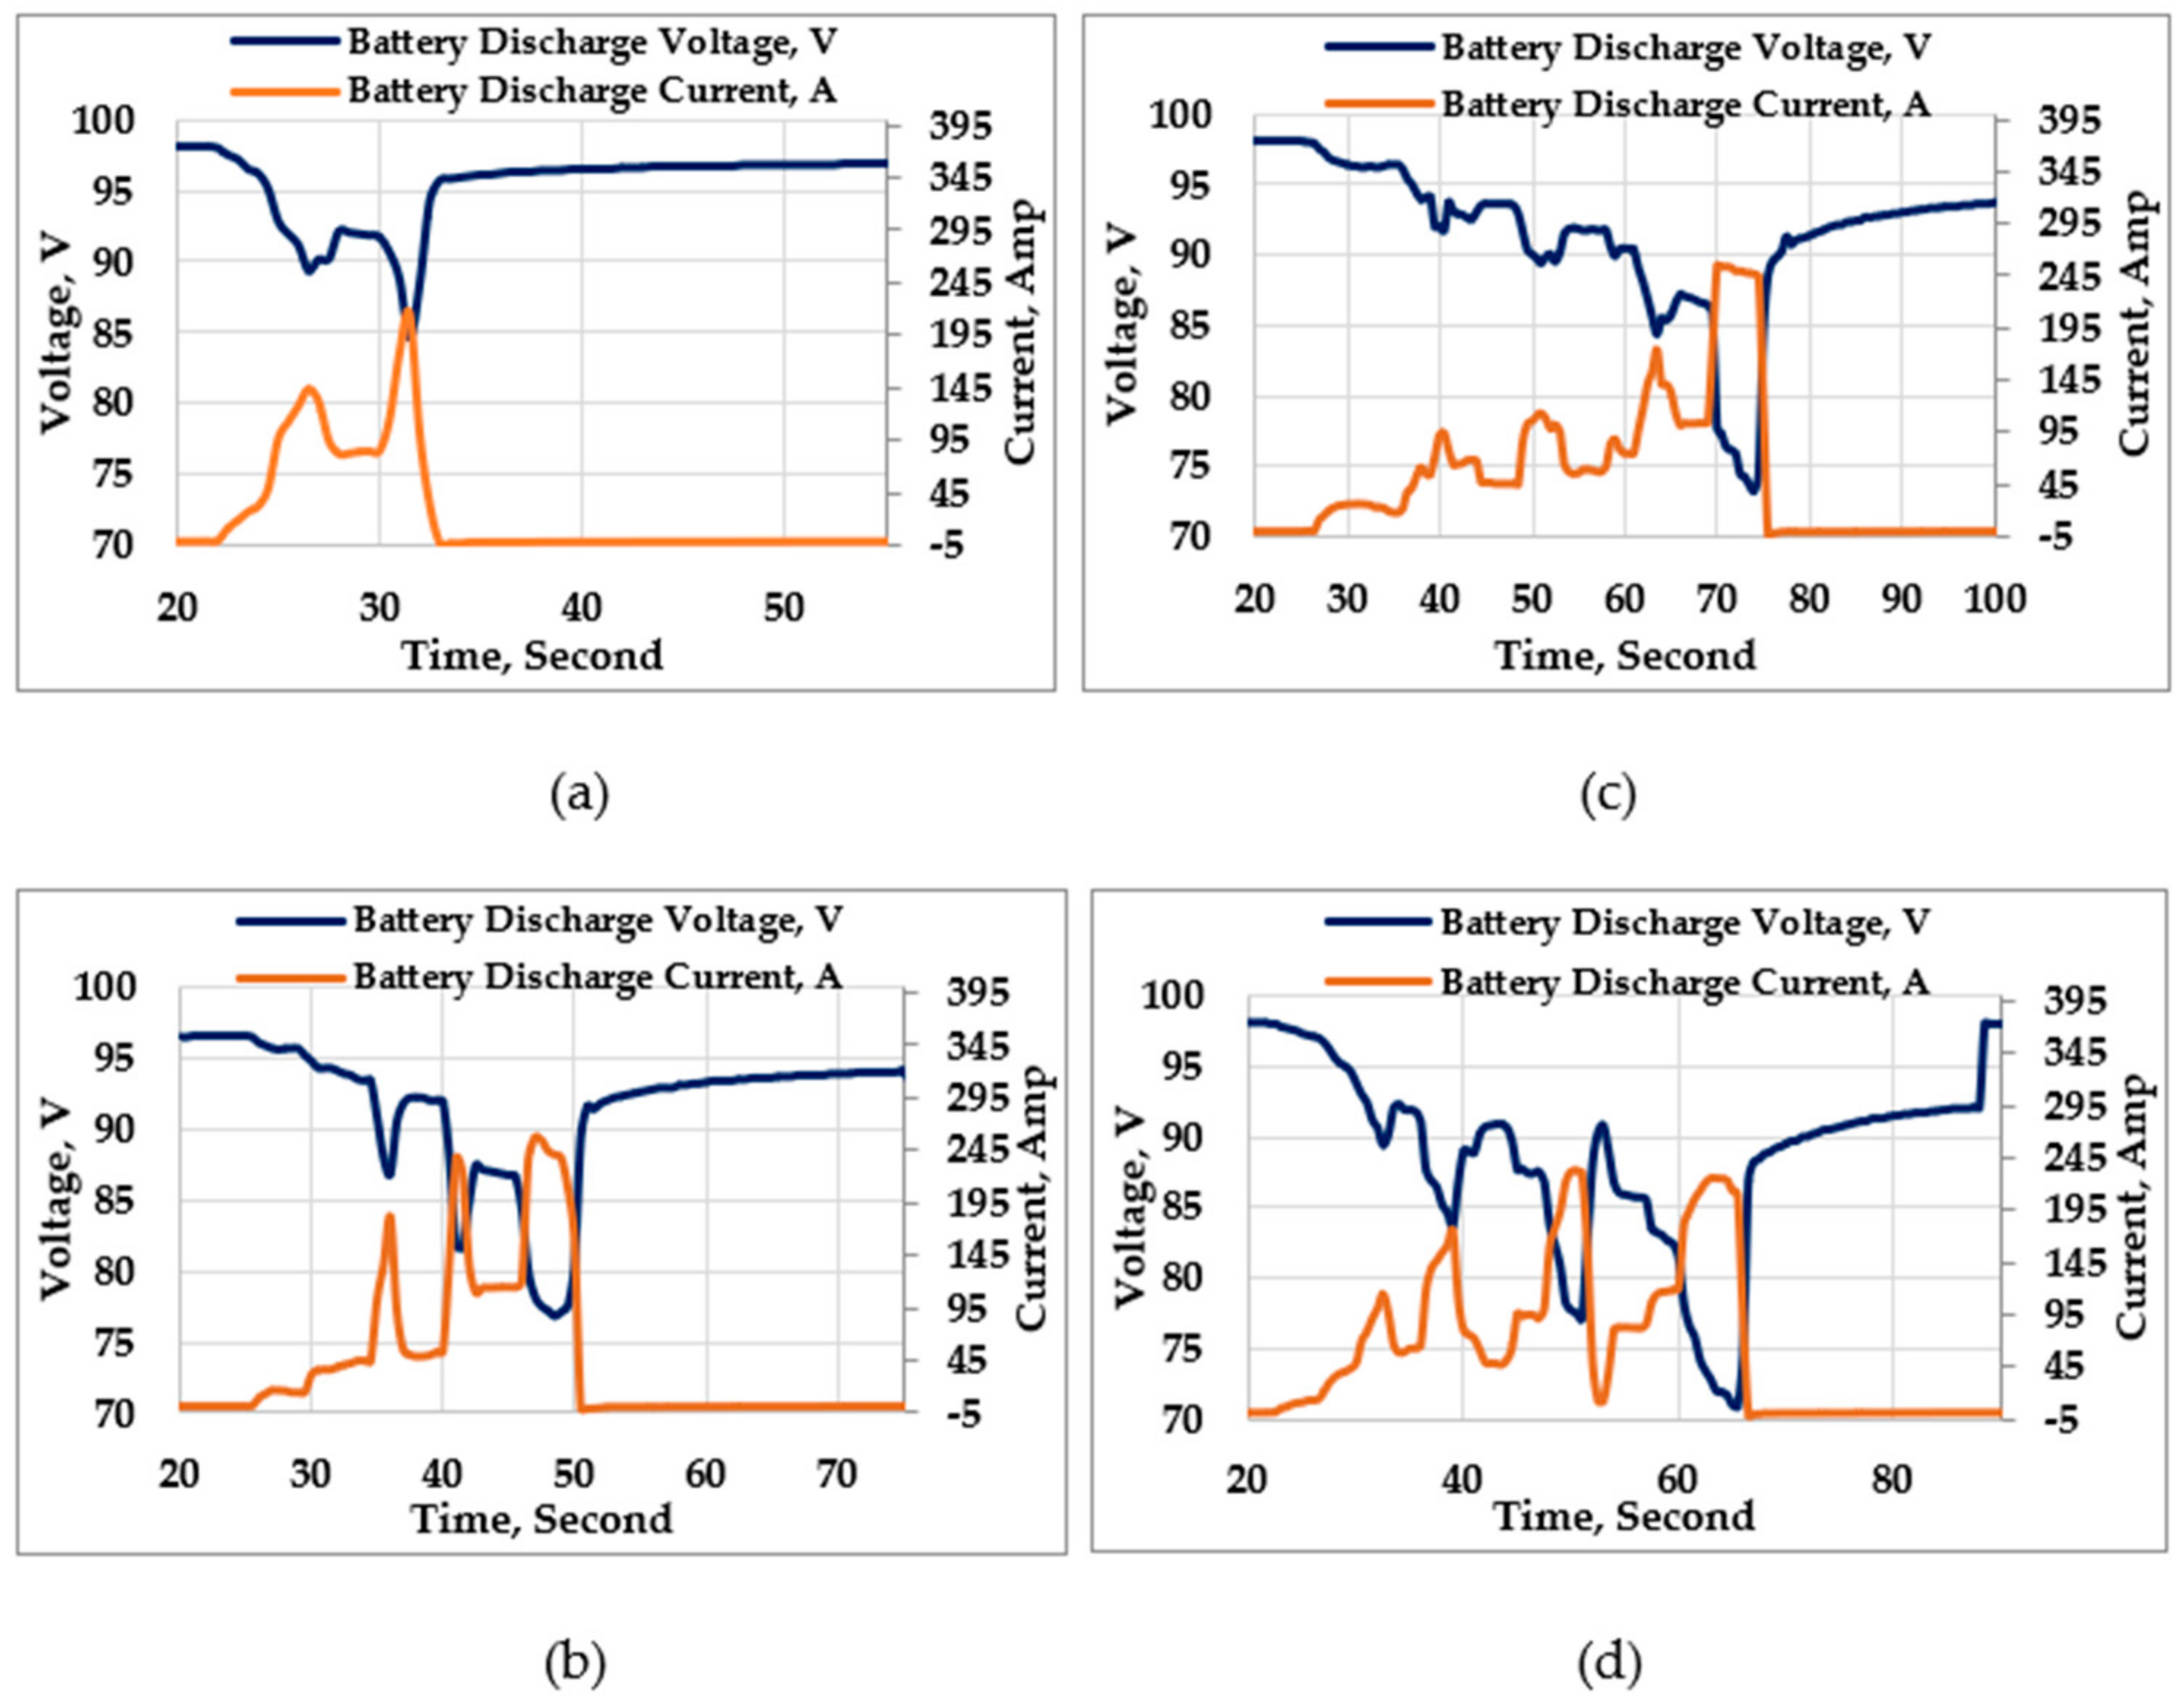
Having the data recorded from all ends, i.e., battery, dyno display, etc., the experimental driving profile and battery discharge profile was generated for each gear as shown in Figure 25 and Figure 26, respectively.
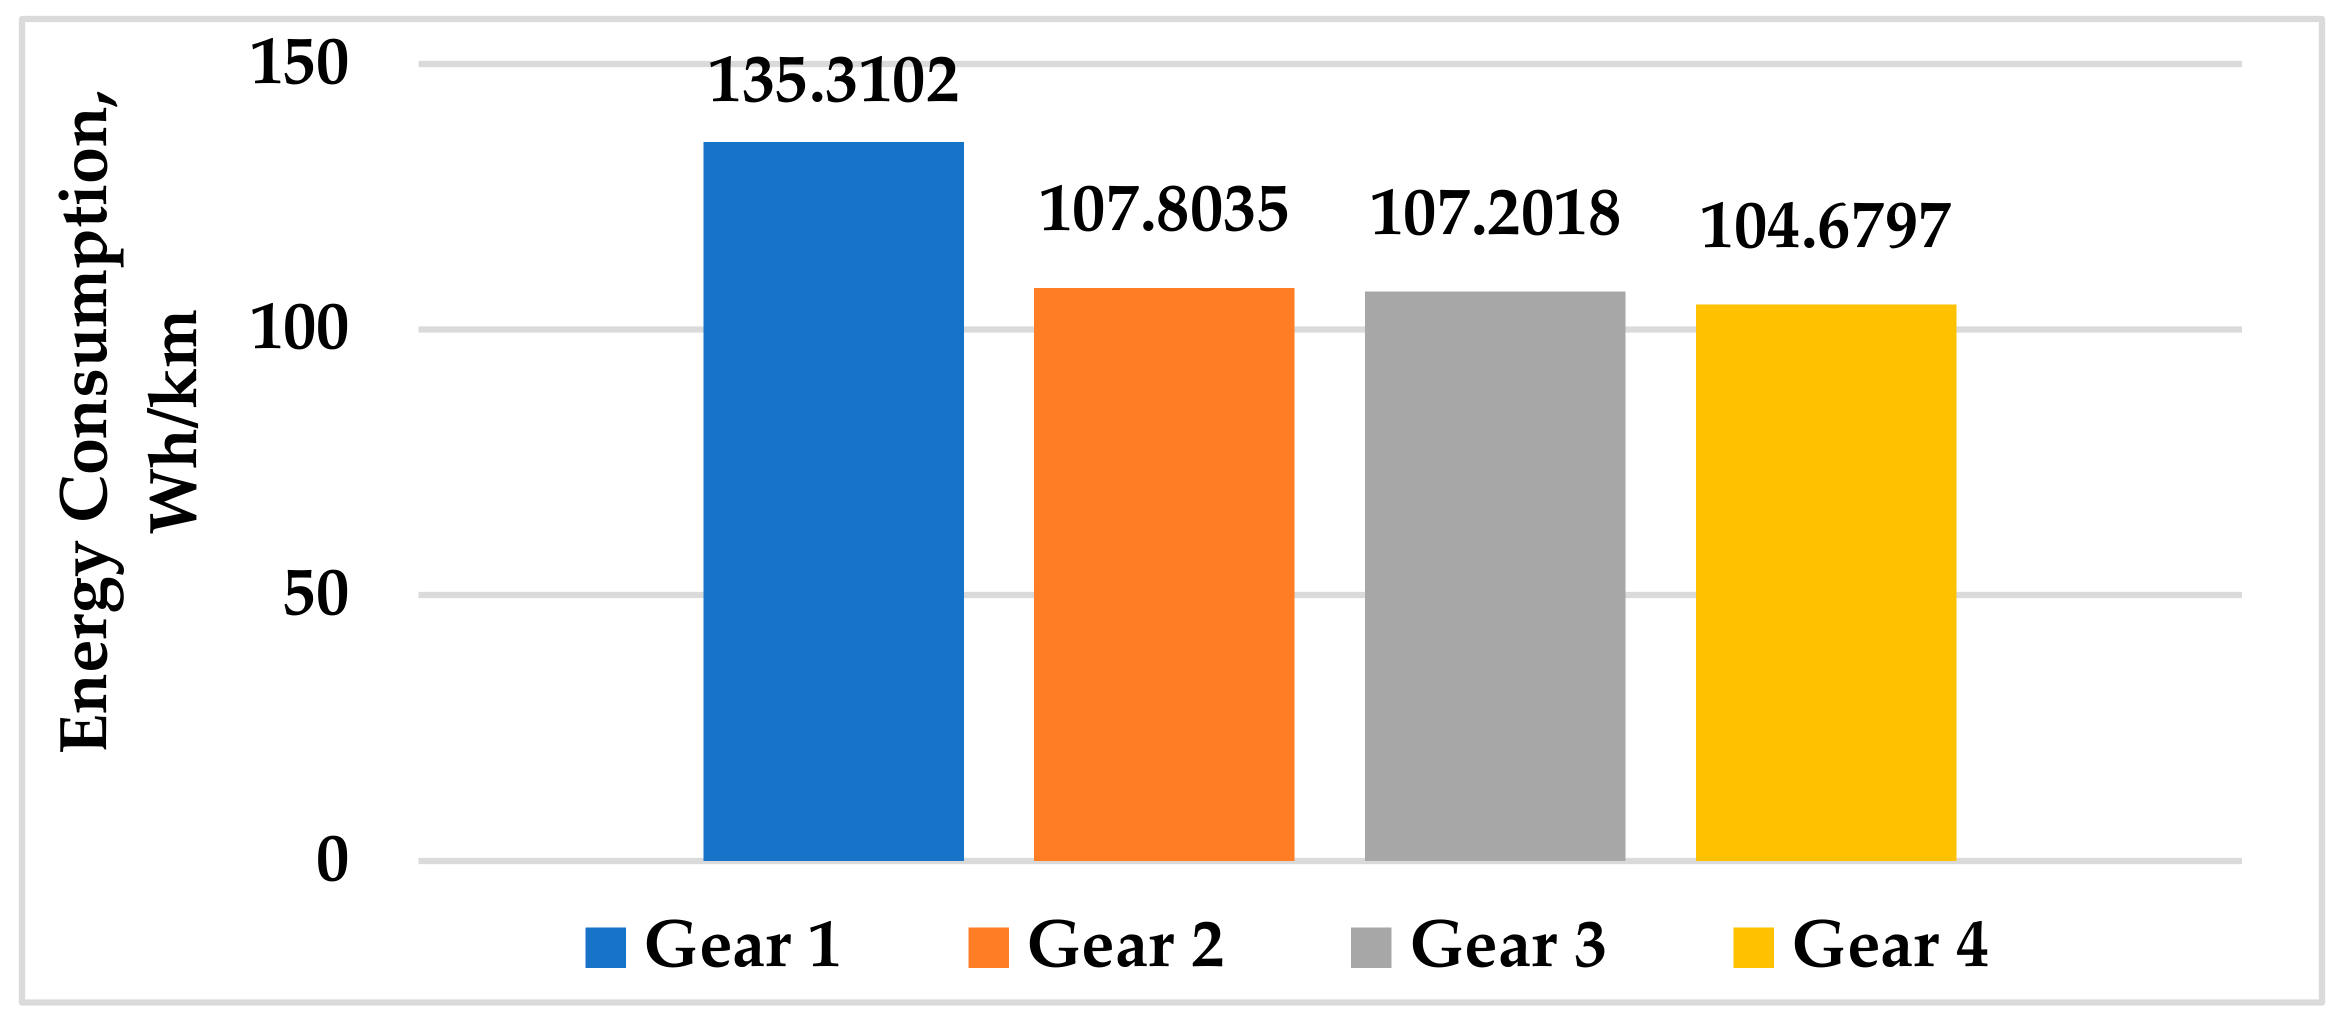
The unit energy consumption on each gear was estimated following the simple mathematics in Equations (5)–(7). Figure 27 shows that the unit energy consumption in Wh/km for the four gears were estimated based on the associated data of the battery discharge voltage and current.
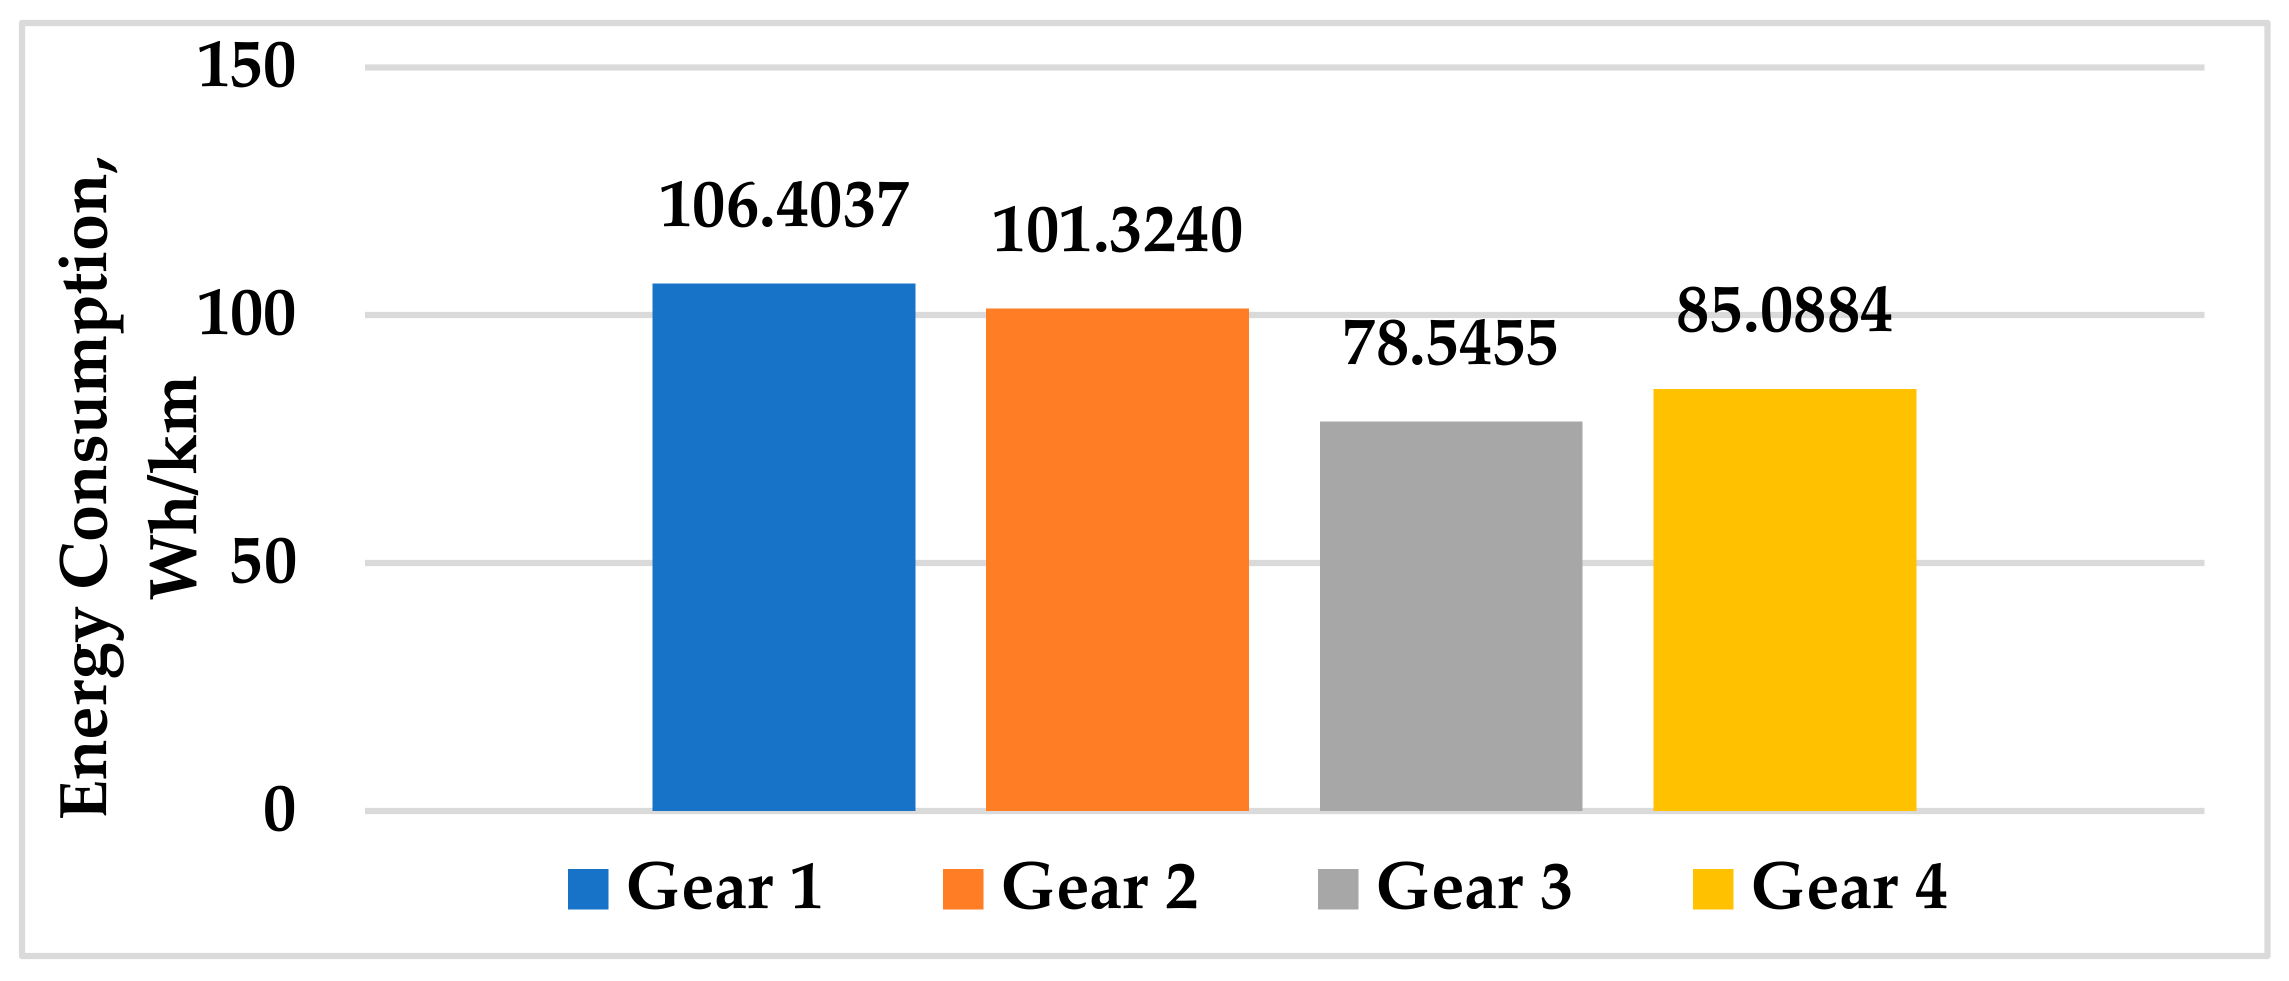
The simulation model of the two speed EV powertrains was transformed into a single-speed EV model to replicate the test vehicle that was simulated over the experimental driving profile associated to each gear of the test vehicle. Being manual, a 98% transmission efficiency [33,34] was considered during the simulation. Next, conducting the required number of simulations, the unit energy consumption in Wh/km of each gear was determined based on the simulation (Figure 28) following Equations (1)–(3).
The above two figures provide the unit energy consumption based on both the simulation as well as the experiment that is further examined in the next section to evaluate the performance of the proposed gearshift strategy.
4. Data Analysis and Discussion
Acknowledging the limitations of the experimental facilities, an alternative solution was formulated to validate the simulation results based on the proposed gearshift strategy. The distance travelled by each gear was determined while the two-speed EV model was simulated over standard driving cycles following both the proposed gearshift schedule and conventional rule-based approaches. Based on the unit energy consumption of each gear, the energy consumption of the EV model with a two-speed transmission system following any selected gearshift schedule was estimated. Eventually, the performance of these gearshift schedules was compared accordingly.
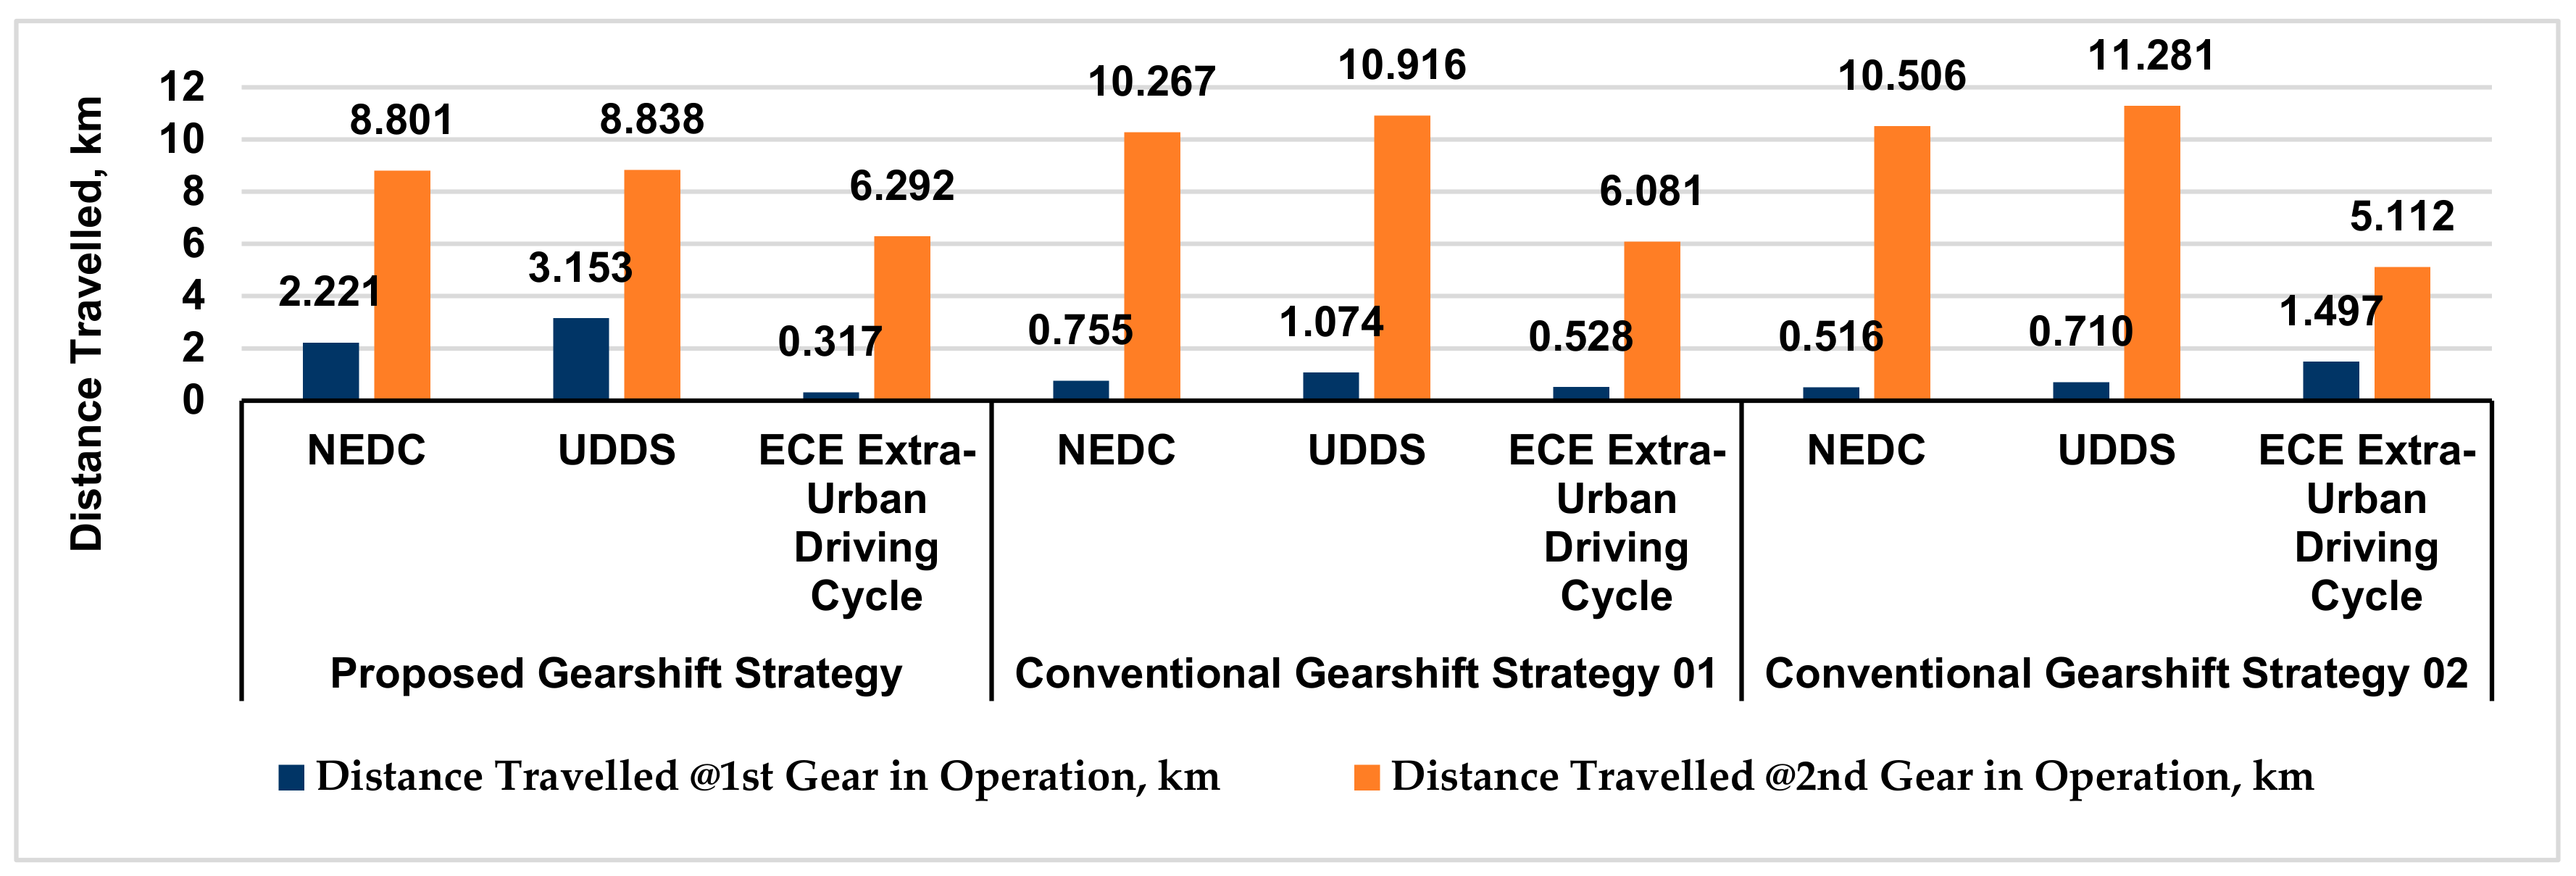
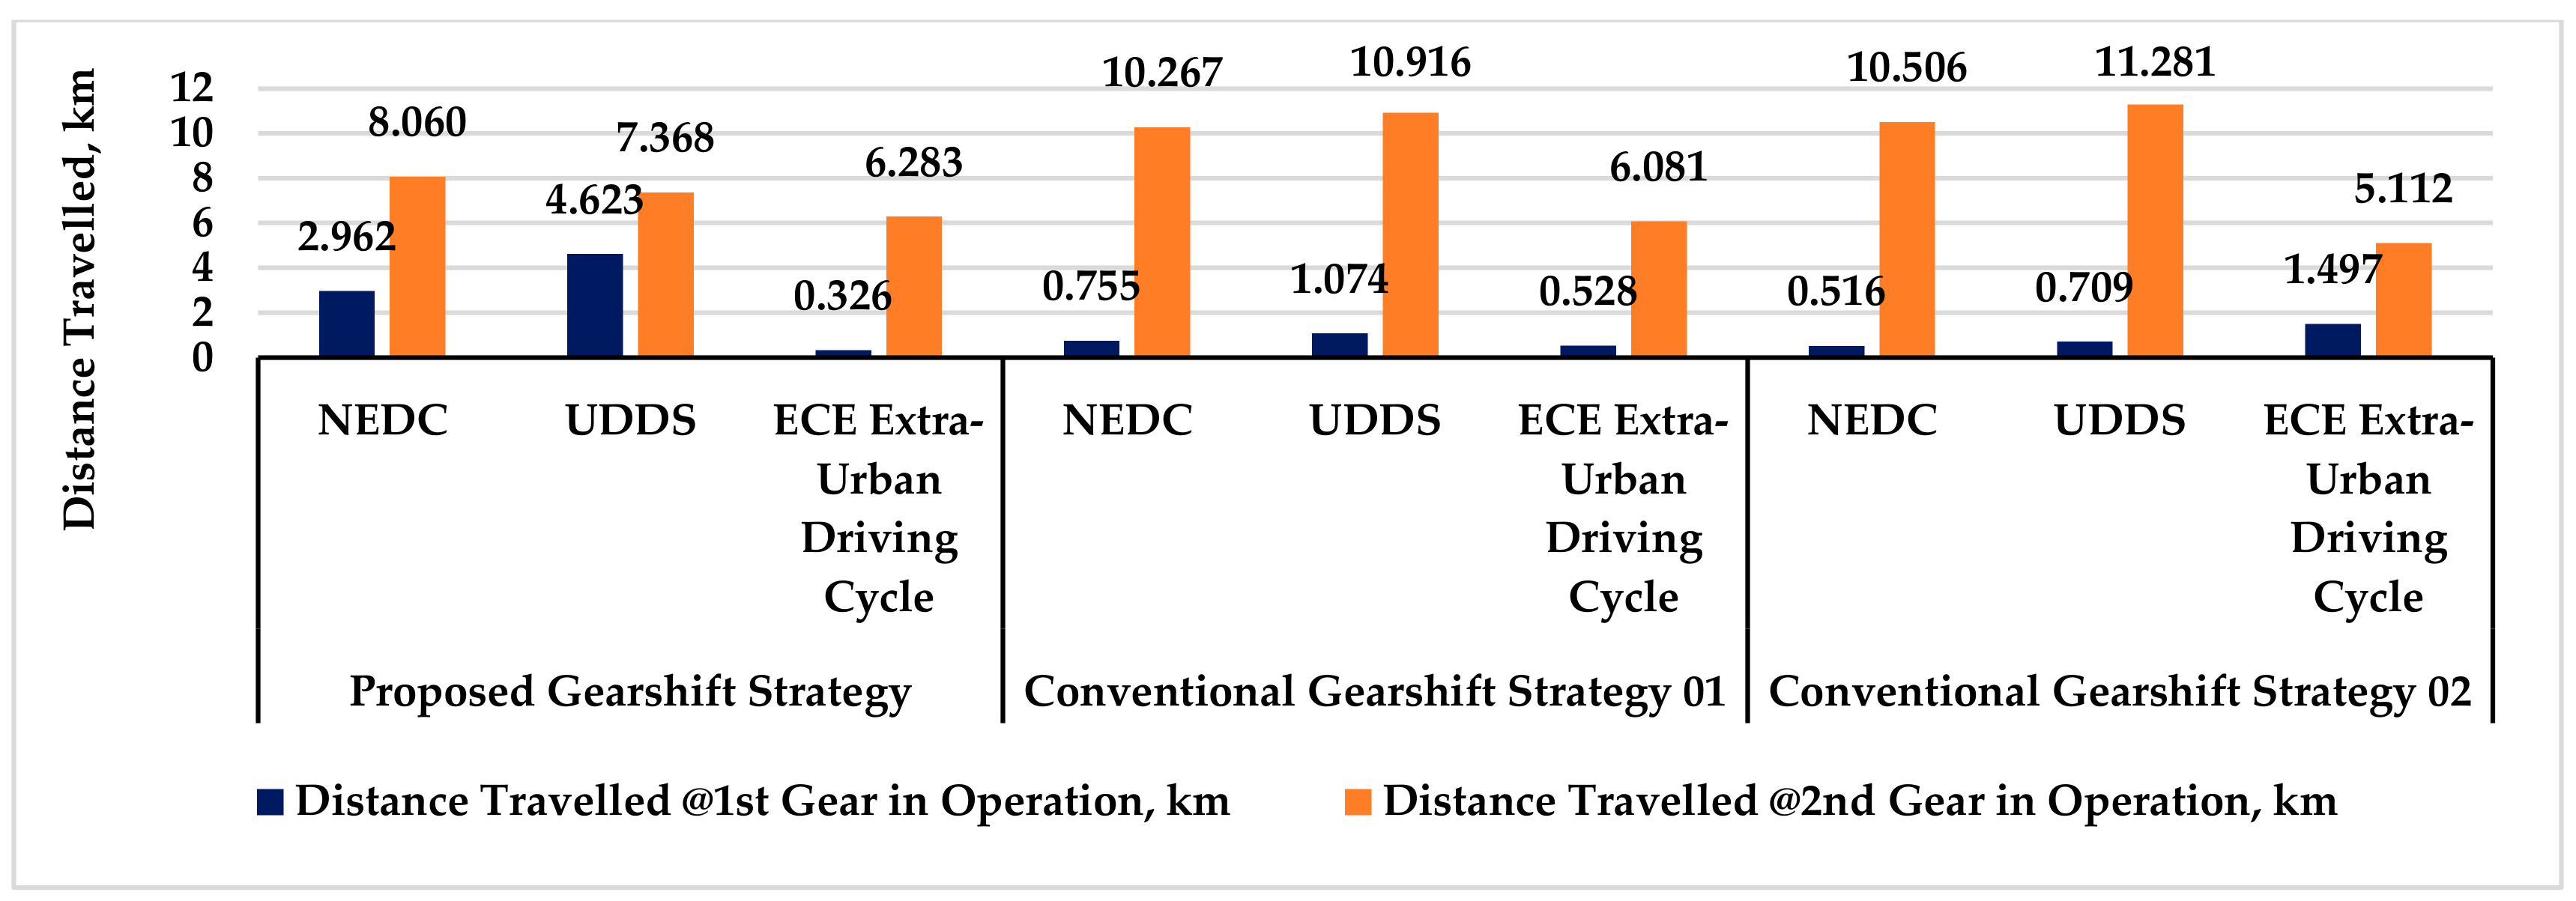
Comparing the gear ratios in the experimental gearbox (Table 12) to the optimized ratio of the first as well as the second gear through simulation, two gear pairs were selected. In line with this, a simulation of the EV model with a two-speed transmission over standard driving cycles was conducted considering the gear pair 9.227/5.696 and 9.227/4.259, based on different gearshift schedules. As the next step of the validation procedure, the vehicle mass in the simulation model of the two-speed EV powertrain 01 was changed to 375 kg, replicating the test vehicle load on the rear wheels. The new two-speed EV powertrain was simulated over the NEDC, UDDS and ECE Extra Urban Driving Cycle. Having simulations for each gear pair following the proposed, as well as the two conventional, gearshift strategies, the distance travelled on each gear was determined and is shown in Figure 29 and Figure 30. It should be mentioned that the simulation over the ECE Extra Urban Driving Cycle was associated with the road grade condition.
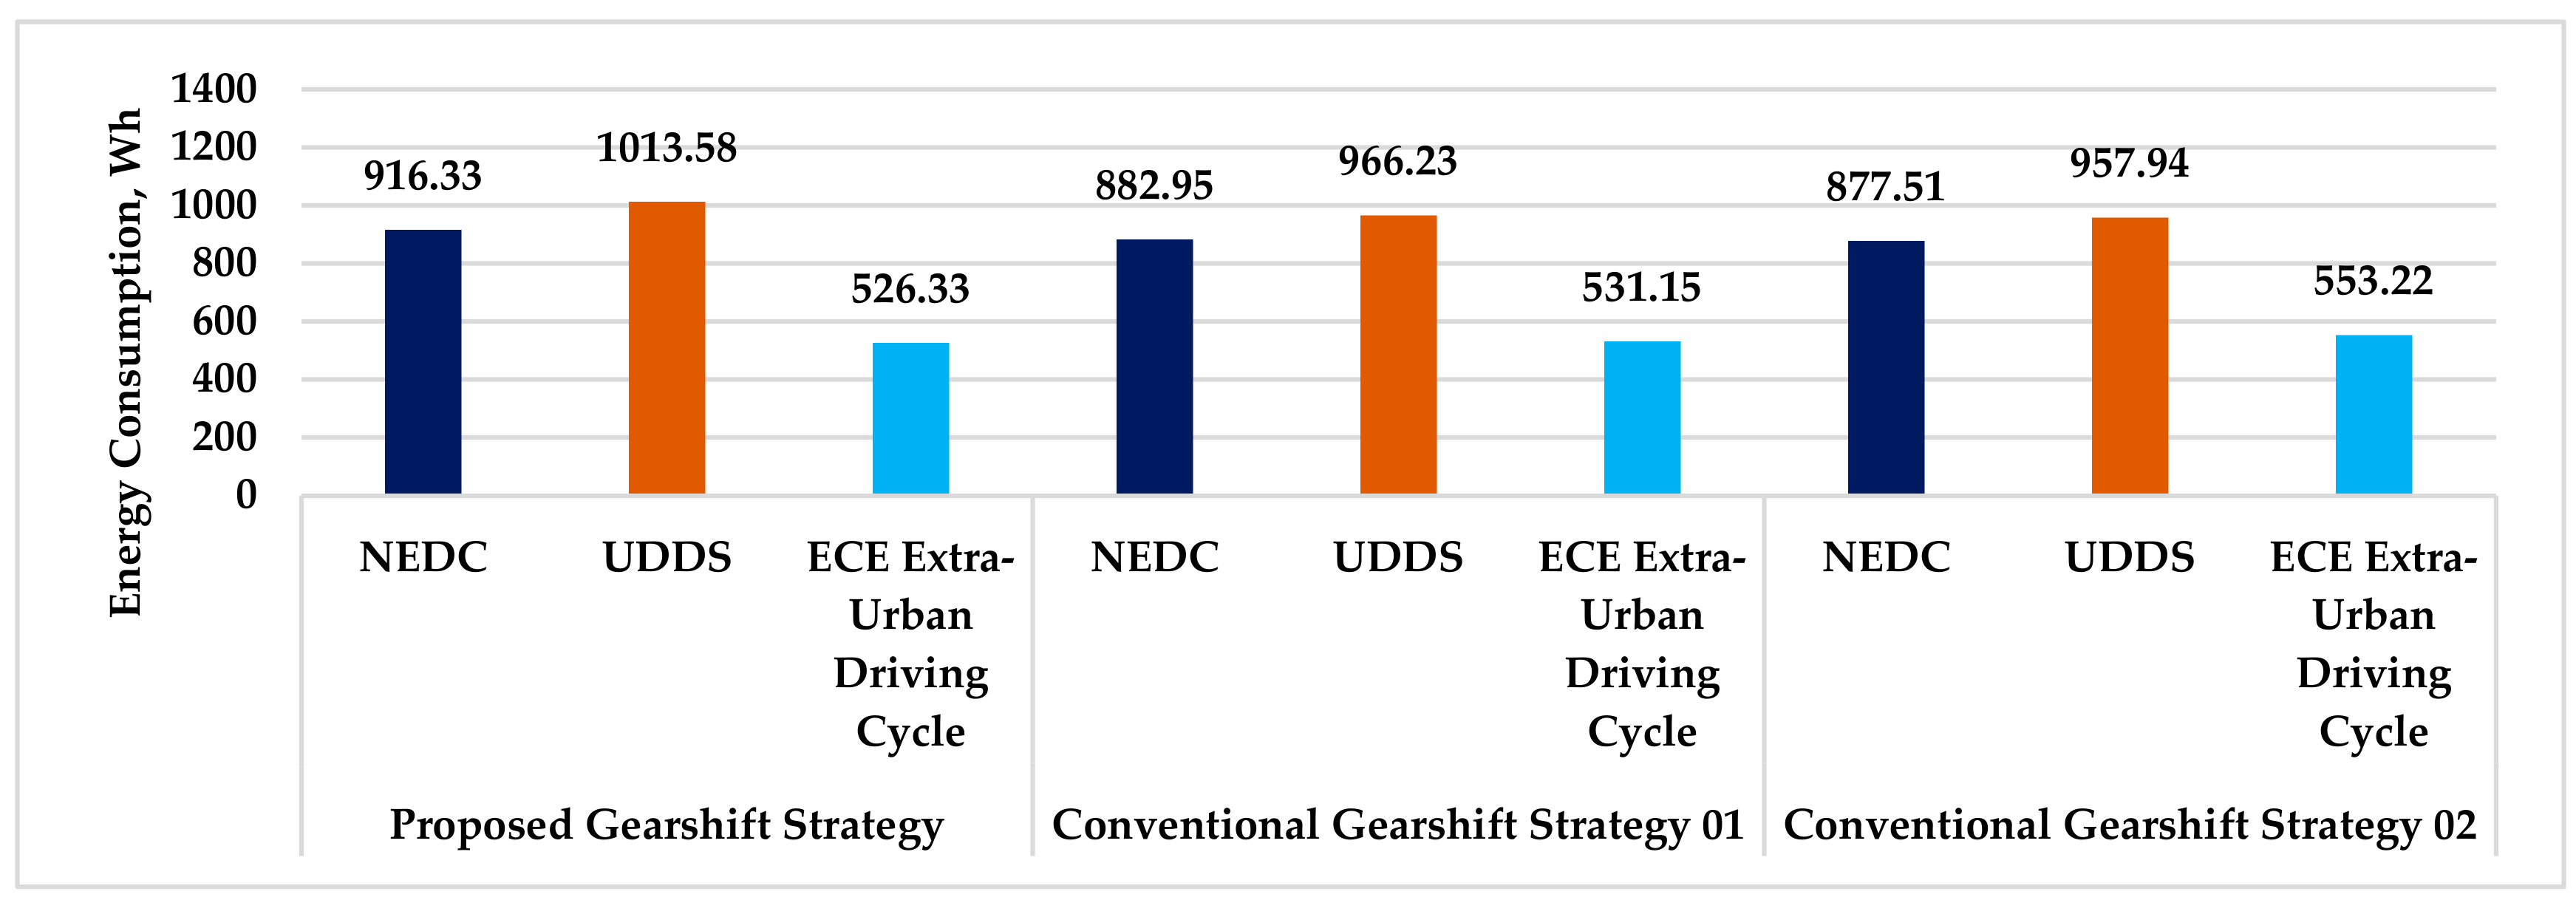
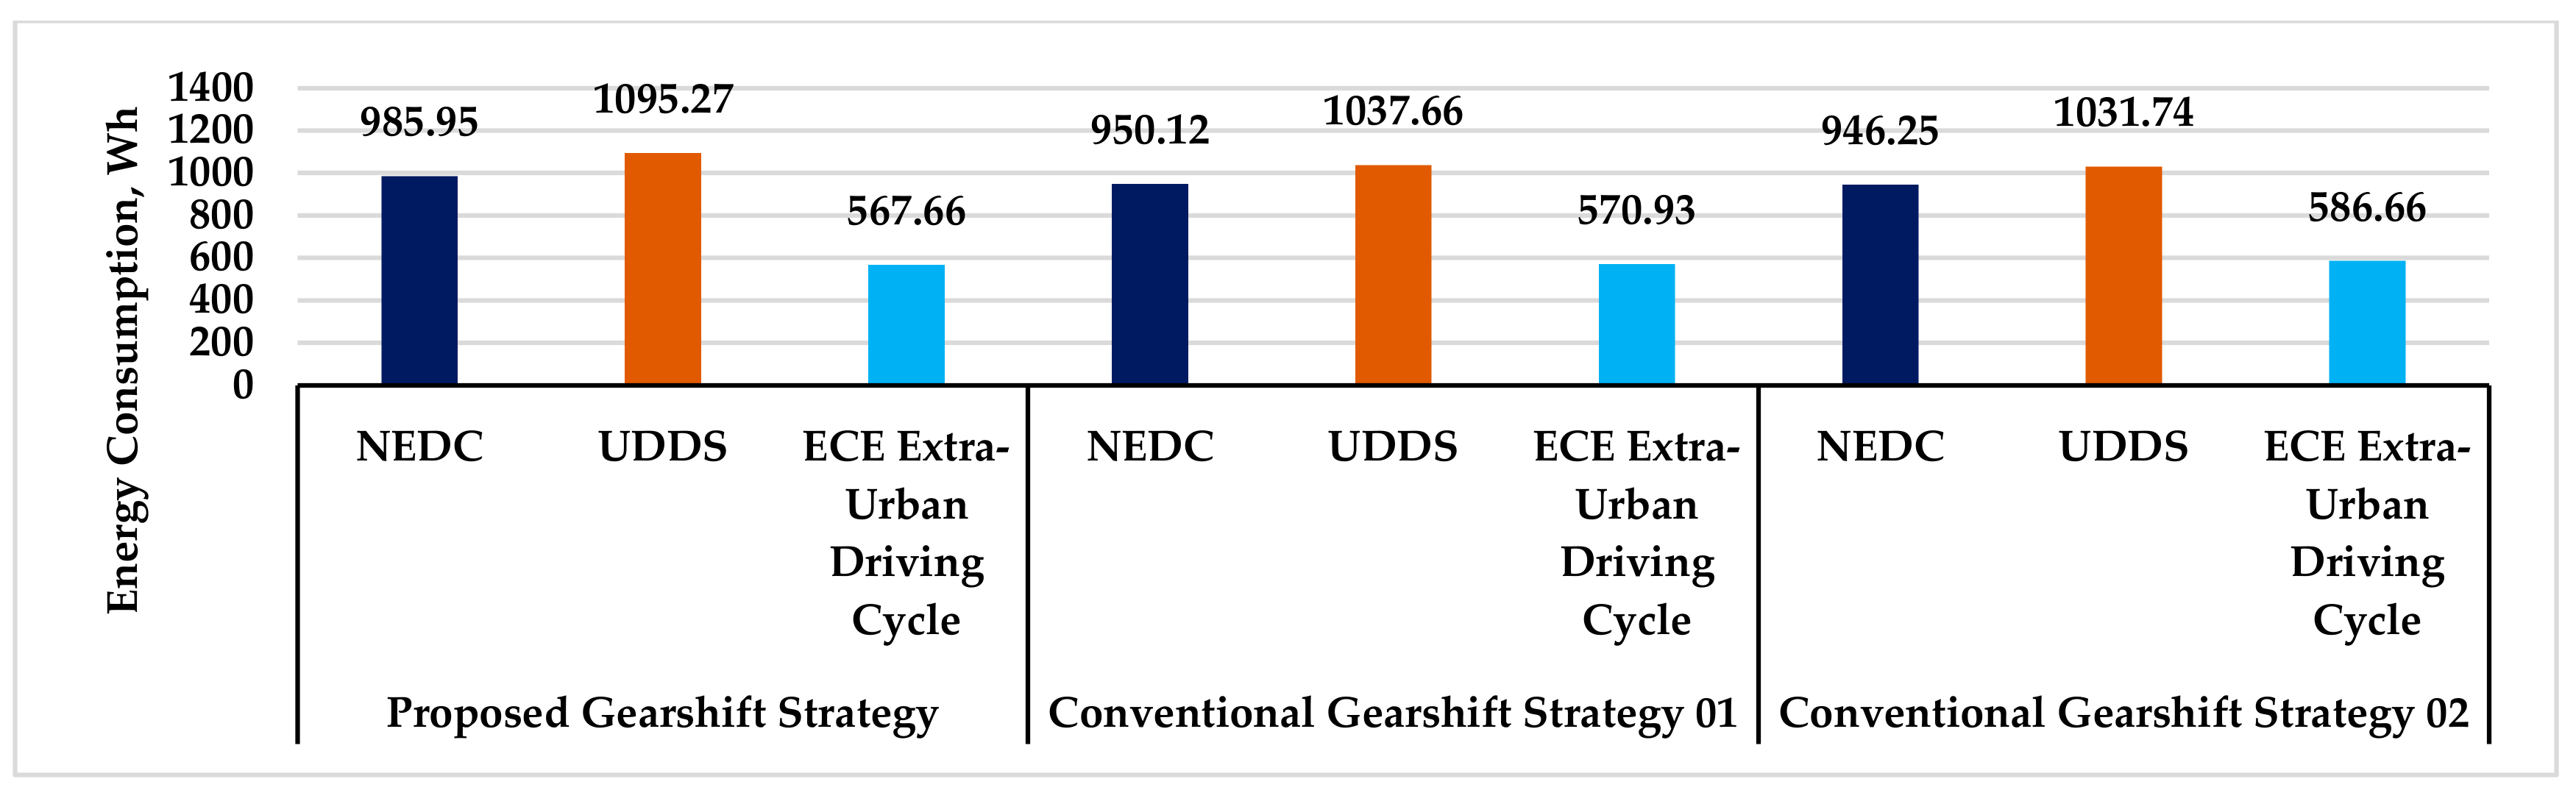
At this stage, the distance travelled on each gear was available; therefore, the total energy consumption was estimated based on the unit energy consumption in Figure 28 and Figure 27, drawn from the simulation results and experimental data, respectively. On that note, Figure 31, Figure 32, Figure 33 and Figure 34 have been produced following three different gearshift schedules over three different standard driving cycles.
Two major observations have been made from the above figures and are demonstrated accordingly:
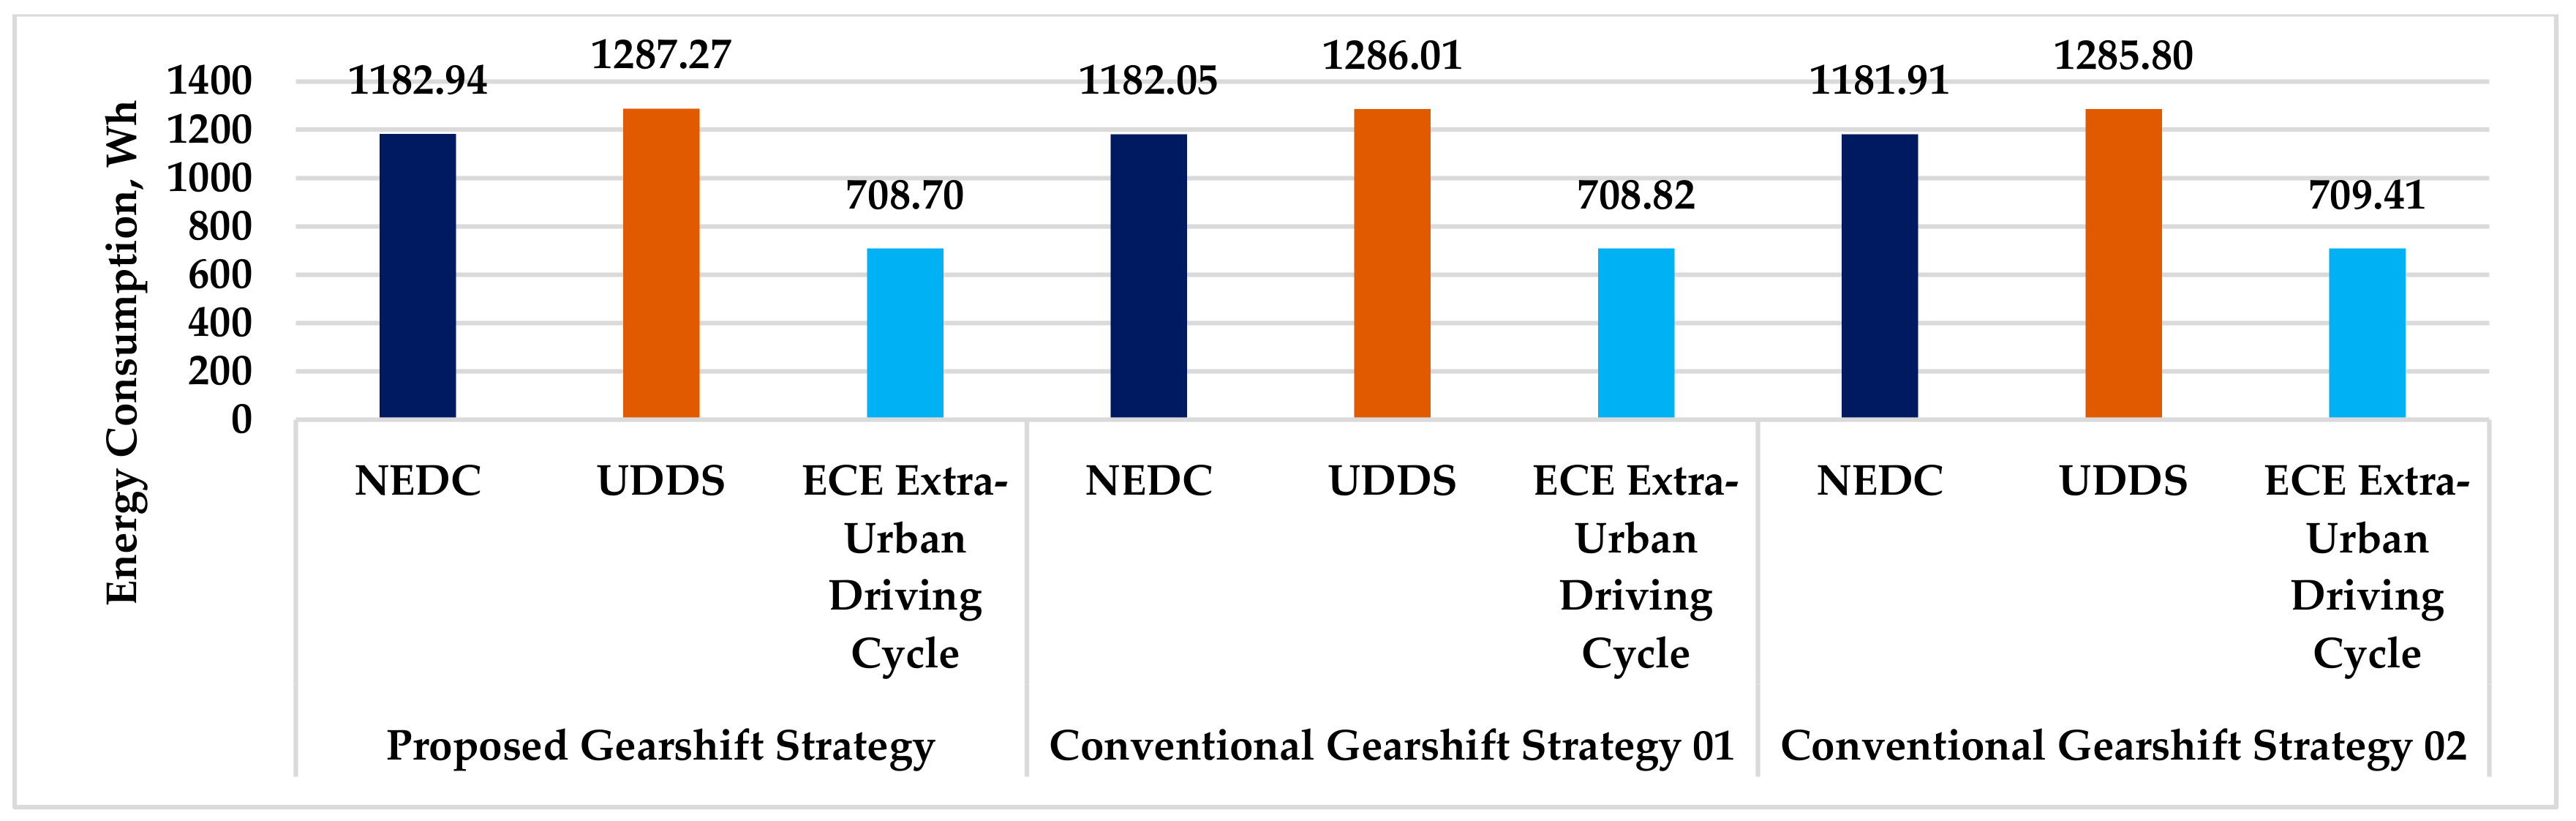
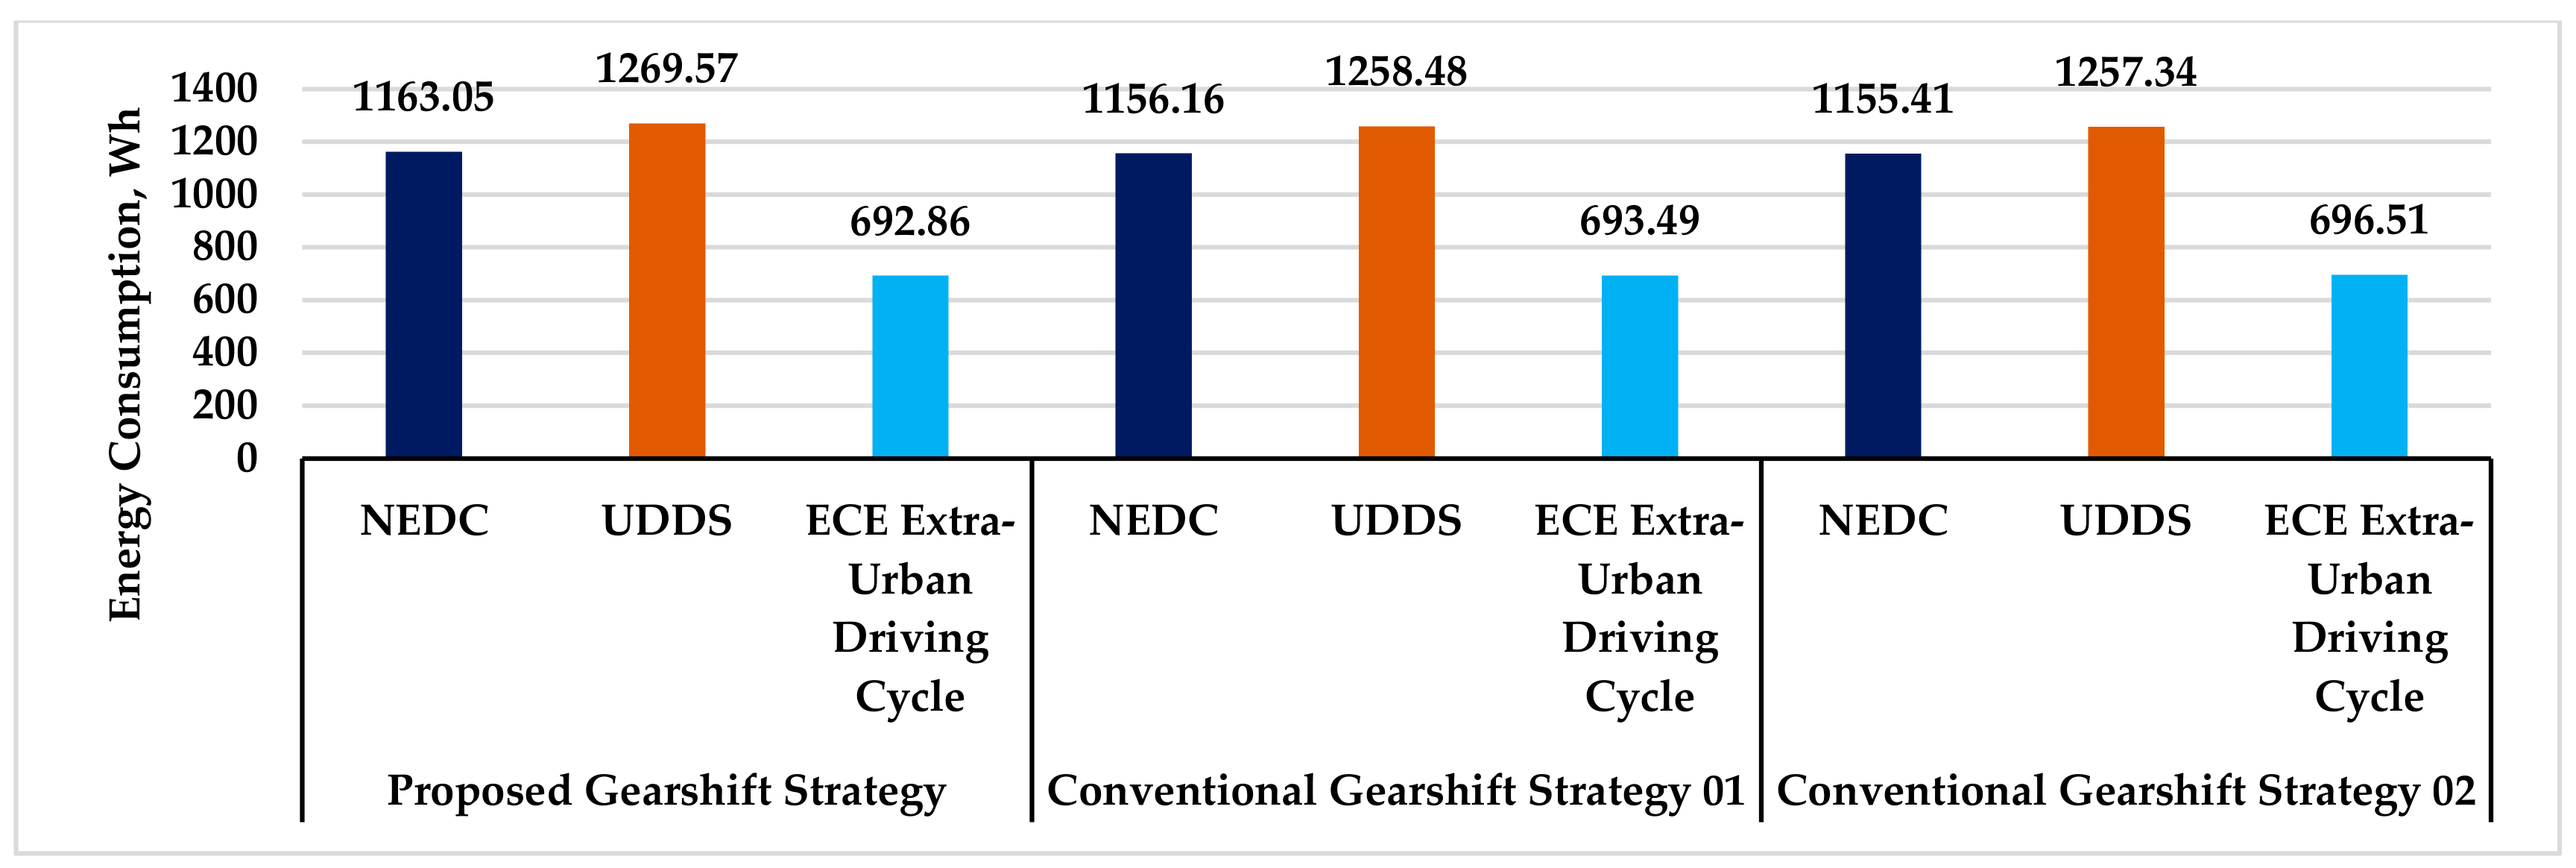
- Being that the NEDC and UDDS driving cycles were based on flat road conditions, the performance of these two driving scenarios can be compared. In Figure 31, the energy consumption through the proposed gearshift strategy is 3.643% and 4.237% more than that with the convention gearshift strategies 01 and 02 over the NEDC, while it is 4.672% and 5.490% more energy consumption over the UDDS driving cycles, respectively. Similar behavior can be noted in Figure 33. It is understandable that the total energy consumption as found in Figure 31 and Figure 33 could not be directly compared to the findings in Figure 22 and Figure 23, because of the different vehicle mass, gear ratios and traction motor; however, the behavioral pattern and percentage increase in the energy consumption through the proposed gearshift strategy was found to be similar. On the other hand, in Figure 32 and Figure 34 as drawn using the experimental data, although a lower percentage increase in the energy consumption through the proposed gearshift approach can be observed, the behavioral pattern is similar to those in Figure 22 and Figure 23.
- The second observation is about the energy consumption over the ECE Extra Urban Driving Cycle associated with the road grade conditions. In Figure 31 and Figure 33, 0.5–5.1% less energy consumption through the proposed gearshift strategy can be noted compared to that with the conventional strategies 01 and 02, respectively. On the other hand, based on the experimental data, in Figure 32 and Figure 34, 0.02–0.53% less energy consumption can be estimated through the proposed strategy compared to that with the two conventional approaches. As in Figure 23, the potential scope of energy saving on a hilly road through the proposed gearshift strategy is around 16–17% over the conventional approaches. While the findings in Figure 31 and Figure 33 based on the unit energy consumption from the simulation results show a trend towards the findings in Figure 23, the experimental-based findings as in Figure 32 and Figure 34 remain significantly away from that shown in Figure 23.
Although similar, the behavioral pattern of the energy consumption between the findings of the simulation results and experimental data can be noticed, a closer performance is expected. Therefore, it was necessary to identify the possible shortcomings while carrying out the experiment. Some of these limitations are listed here:
- The efficiency map of the traction motor EM-A is not available in the company website. Based on the information received from the manufacturer, several efficiency points could be identified in the motor torque-speed curve. Considering these efficiency points as a reference, an entire motor efficiency map was drawn. Acknowledging this fact, there might be some impact on the deviation between the simulation results and the experimental findings; however, it is believed that this issue would have a minor impact on the validation process.
- Another issue can be mentioned with the electrical connections within the powertrain. For example, the consistency of the cable diameter was not maintained at both terminals of the battery that needs to be maintained to comply with a standard requirement of connection.
- The quality of the individual battery cell was not so good. Moreover, the battery module was used without the battery management system. Because of a limited battery capacity, the duration of each test run was needed to be kept below two minutes. Moreover, the demand of the battery discharge current was noted as significantly high during the acceleration phase while the battery voltage was dropping rapidly, and that might have been associated with the poor battery discharge efficiency [35]. Considering these multiple issues with the battery, it can be assumed that the battery module would play a major role behind the gap in the validation process.
- This point is related the second observation. While estimating the distance travelled on each gear, a simulation over the ECE Extra Urban Driving Cycle was conducted considering the road grade conditions; however, the experimental driving profile on each gear was generated based on flat road conditions. Therefore, in the process of estimating the unit energy consumption based on both the simulation results and the experimental data, the road grade could not be associated with the experimental driving profile. Consequently, it is expected that there would be some gap in the validation of the proposed gearshift strategy in hilly road conditions.
It is believed that by having a good quality battery module, the unit energy consumption based on the experimental data in Figure 27 would have followed the unit energy consumption in Figure 28, and that could have helped validate the performance of the proposed gearshift schedule in an effective manner.
5. Conclusions
The effectiveness of the three-parameter gearshift strategy was evaluated for both large and small electric vehicles with two-speed transmission systems using two different electric motors. During the review of the guidelines to develop the primary gearshift schedule, it was discovered that the vehicle’s mass plays a significant role in identifying the gear transition phase as compared to switching to a different electric motor. The optimization process revealed that the second gear operating region increased after optimizing the gearshift map for acceleration. The same trend was observed for the gearshift map for the road grade with small size vehicles; however, for large size vehicles, a widening buffer zone offered more economic performance than increasing the operating region of the second gear.
Compared to the conventional rule-based gearshift strategy, the proposed three-parameter-based gearshift strategy addressed the trade-off in vehicle economic performance. Although the proposed gearshift strategy displayed an excellent response to hilly road conditions, it consumed approximately 3–6% more energy on flat roads, depending on the driving scenario. To validate the simulation results, a multi-speed AMT system was required. A unique solution was presented where the performance of the proposed gearshift strategy could be evaluated through a simple manual transmission system. The energy consumption based on the experimental data indicated similar behavioral patterns to those from the simulation outcomes, albeit with some limitations.
Author Contributions
Conceptualization, M.E. and M.R.A.; methodology, M.E., S.G. and M.R.A.; software, M.R.A.; optimization and result analysis, M.R.A.; experiment, M.E. and M.R.A.; writing—original draft preparation, M.R.A.; writing—review and editing, M.E., S.G. and M.R.A.; supervision, M.E. and S.G. All authors have read and agreed to the published version of the manuscript.
Funding
The Australian Government Research Training Program (RTP) supported this research.
Data Availability Statement
The data presented in this study are available on request from the corresponding author. The data are not publicly available due to privacy.
Conflicts of Interest
The authors declare no conflict of interest.
Abbreviations
The following abbreviations are used in this manuscript.
| AMT | Automatic Manual Transmission |
| ECE | Economic Commission for Europe |
| EV | Electric Vehicle |
| GD | Gradient Descent |
| NED | New European Driving Cycle |
| PS | Pattern Search |
| UDDS | Urban Dynamometer Driving Schedule |
References
- Ahssan, M.R.; Ektesabi, M.M.; Gorji, S.A. Electric vehicle with multi-speed transmission: A review on performances and complexities. SAE Int. J. Altern. Powertrains 2018, 7, 169–181. [Google Scholar] [CrossRef]
- Gao, B.; Meng, D.; Shi, W.; Cai, W.; Dong, S.; Zhang, Y.; Chen, H. Topology optimization and the evolution trends of two-speed transmission of EVs. Renew. Sustain. Energy Rev. 2022, 161, 112390. [Google Scholar] [CrossRef]
- Nguyen, C.T.; Walker, P.D.; Zhou, S.; Zhang, N. Optimal sizing and energy management of an electric vehicle powertrain equipped with two motors and multi-gear ratios. Mech. Mach. Theory 2022, 167, 104513. [Google Scholar] [CrossRef]
- Kwon, K.; Jo, J.; Min, S. Multi-objective gear ratio and shifting pattern optimization of multi-speed transmissions for electric vehicles considering variable transmission efficiency. Energy 2021, 236, 121419. [Google Scholar] [CrossRef]
- Wu, P.; Qiang, P.; Pan, T.; Zang, H. Multi-objective optimization of gear ratios of a seamless three-speed automated manual transmission for electric vehicles considering shift performance. Energies 2022, 15, 4149. [Google Scholar] [CrossRef]
- Vehviläinen, M.; Rahkola, P.; Keränen, J.; Pippuri-Mäkeläinen, J.; Paakkinen, M.; Pellinen, J.; Tammi, K.; Belahcen, A. Simulation-based comparative assessment of a multi-speed transmission for an E-retrofitted heavy-duty truck. Energies 2022, 15, 2407. [Google Scholar] [CrossRef]
- Rențea, C.; Oprean, M.; Bățăuș, M.; Frățilă, G. The Influence of Multi-Speed Transmissions on Electric Vehicles Energy Consumption. In Proceedings of the IOP Conference Series: Materials Science and Engineering, Pitesti, Romania, 22–24 May 2019; p. 012107. [Google Scholar] [CrossRef]
- Hinov, N.; Punov, P.; Gilev, B.; Vacheva, G. Model-based estimation of transmission gear ratio for driving energy consumption of an EV. Electronics 2021, 10, 1530. [Google Scholar] [CrossRef]
- Morozov, A.; Humphries, K.; Zou, T.; Martins, S.; Angeles, J. Design and Optimization of a Drivetrain with Two-Speed Transmission for Electric Delivery Step Van. In Proceedings of the 2014 IEEE International Electric Vehicle Conference, Florence, Italy, 17–19 December 2014; pp. 1–8. [Google Scholar] [CrossRef]
- Kwon, K.; Seo, M.; Min, S. Efficient multi-objective optimization of gear ratios and motor torque distribution for electric vehicles with two-motor and two-speed powertrain system. Appl. Energy 2020, 259, 114190. [Google Scholar] [CrossRef]
- Gao, B.; Liang, Q.; Xiang, Y.; Guo, L.; Chen, H. Gear ratio optimization and shift control of 2-speed I-AMT in electric vehicle. Mech. Syst. Signal Process. 2014, 50–51, 615–631. [Google Scholar] [CrossRef]
- Yin, Q.; Wu, Z.; Rui, X. Parameter Design and Optimization of Electric Vehicle. In Proceedings of the 2014 IEEE Conference and Expo Transportation Electrification Asia-Pacific, Beijing, China, 31 August–3 September 2014; pp. 1–7. [Google Scholar] [CrossRef]
- Walker, P.D.; Rahman, S.A.; Zhu, B.; Zhang, N. Modelling, simulations, and optimisation of electric vehicles for analysis of transmission ratio selection. Adv. Mech. Eng. 2013, 5, 340435. [Google Scholar] [CrossRef]
- Di Nicola, F.; Sorniotti, A.; Holdstock, T.; Viotto, F.; Bertolotto, S. Optimization of a multiple-speed transmission for downsizing the motor of a fully electric vehicle. SAE Int. J. Altern. Powertrains 2012, 1, 134–143. [Google Scholar] [CrossRef]
- Sorniotti, A.; Boscolo, M.; Turner, A.; Cavallino, C. Optimization of a Multi-Speed Electric Axle as a Function of the Electric Motor Properties. In Proceedings of the 2010 IEEE Vehicle Power and Propulsion Conference, Lille, France, 1–3 September 2010; pp. 1–6. [Google Scholar] [CrossRef]
- Sun, G.-B.; Chiu, Y.-J.; Zuo, W.-Y.; Zhou, S.; Gan, J.-C.; Li, Y. Transmission ratio optimization of two-speed gearbox in battery electric passenger vehicles. Adv. Mech. Eng. 2021, 13, 16878140211022869. [Google Scholar] [CrossRef]
- Zhu, B.; Zhang, N.; Walker, P.; Zhou, X.; Zhan, W.; Wei, Y.; Ke, N. Gear shift schedule design for multi-speed pure electric vehicles. Proc. Inst. Mech. Eng. Part. D Int. J. Automot. Mech. Eng. 2015, 229, 70–82. [Google Scholar] [CrossRef]
- Zhou, X.; Walker, P.; Zhang, N.; Zhu, B. Performance Improvement of a Two Speed EV through Combined Gear Ratio and Shift Schedule Optimization. In Proceedings of the SAE 2013 World Congress & Exhibition, Detroit, MI, USA, 16–18 April 2013. [Google Scholar] [CrossRef]
- Han, P.; Cheng, X.S.; Huang, Y.; Gu, Q.; Hu, H.B. Research on the shift schedule of dual clutch transmission for pure electric vehicle. Appl. Mech. Mater. 2014, 496–500, 1318–1321. [Google Scholar] [CrossRef]
- Han, K.; Wang, Y.; Filev, D.; Dai, E.; Kolmanovsky, I.; Girard, A. Optimized Design of Multi-Speed Transmissions for Battery Electric Vehicles. In Proceedings of the 2019 American Control Conference (ACC), Philadelphia, PA, USA, 10–12 July 2019; pp. 816–821. [Google Scholar] [CrossRef]
- Lin, X.; Li, Y.; Xia, B. An online driver behavior adaptive shift strategy for two-speed AMT electric vehicle based on dynamic corrected factor. Sustain. Energy Technol. Assess. 2021, 48, 101598. [Google Scholar] [CrossRef]
- Ahssan, M.R.; Ektesabi, M.; Gorji, S. Gear ratio optimization along with a novel gearshift scheduling strategy for a two-speed transmission system in electric vehicle. Energies 2020, 13, 5073. [Google Scholar] [CrossRef]
- Tan, S.; Yang, J.; Zhao, X.; Hai, T.; Zhang, W. Gear ratio optimization of a multi-speed transmission for electric dump truck operating on the structure route. Energies 2018, 11, 1324. [Google Scholar] [CrossRef] [Green Version]
- Ruan, J.; Walker, P.; Zhang, N. A comparative study energy consumption and costs of battery electric vehicle transmissions. Appl. Energy 2016, 165, 119–134. [Google Scholar] [CrossRef] [Green Version]
- Wu, H.; Walker, P.; Wu, J.; Liang, J.; Ruan, J.; Zhang, N. Energy management and shifting stability control for a novel dual input clutchless transmission system. Mech. Mach. Theory 2019, 135, 298–321. [Google Scholar] [CrossRef]
- Miro-Padovani, T.; Colin, G.; Ketfi-Chérif, A.; Chamaillard, Y. Implementation of an energy management strategy for hybrid electric vehicles including drivability constraints. IEEE Trans. Veh. Technol. 2015, 65, 5918–5929. [Google Scholar] [CrossRef]
- Nüesch, T.; Elbert, P.; Flankl, M.; Onder, C.; Guzzella, L. Convex optimization for the energy management of hybrid electric vehicles considering engine start and gearshift costs. Energies 2014, 7, 834–856. [Google Scholar] [CrossRef] [Green Version]
- Zhang, Z.; Zuo, C.; Hao, W.; Zuo, Y.; Zhao, X.; Zhang, M. Three-speed transmission system for purely electric vehicles. Int. J. Automot. Technol. 2013, 14, 773–778. [Google Scholar] [CrossRef]
- Shen, W.; Yu, H.; Hu, Y.; Xi, J. Optimization of shift schedule for hybrid electric vehicle with automated manual transmission. Energies 2016, 9, 220. [Google Scholar] [CrossRef] [Green Version]
- Xiang, Y.; Guo, L.; Gao, B.; Chen, H. A Study on Gear Shifting Schedule for 2-Speed Electric Vehicle using Dynamic Programming. In Proceedings of the 2013 25th Chinese Control and Decision Conference (CCDC), Guiyang, China, 25–27 May 2013; pp. 3805–3809. [Google Scholar] [CrossRef]
- Lin, C.; Zhao, M.; Pan, H.; Yi, J. Blending gear shift strategy design and comparison study for a battery electric city bus with AMT. Energy 2019, 185, 1–14. [Google Scholar] [CrossRef]
- Uerlich, R.; Köller, S.; Witham, G.; Koch, T.; Eckstein, L. Experimental validation of an automated approach for estimating the efficiency and heat balance of gearboxes based on an electrified heavy commercial vehicle axle. World Electr. Veh. J. 2022, 13, 142. [Google Scholar] [CrossRef]
- Schaffner, T.; Allmaier, H.; Girstmair, J.; Reich, F.M.; Tangasawi, O. Investigating the efficiency of automotive manual gearboxes by experiment and simulation. Proc. Inst. Mech. Eng. Part K J. Multi-Body Dyn. 2014, 228, 341–354. [Google Scholar] [CrossRef]
- Xu, H.; Kahraman, A.; Anderson, N.; Maddock, D. Prediction of mechanical efficiency of parallel-axis gear pairs. J. Mech. Des. 2007, 129, 58–68. [Google Scholar] [CrossRef]
- Madani, S.S.; Schaltz, E.; Knudsen Kær, S. Heat loss measurement of lithium titanate oxide batteries under fast charging conditions by employing isothermal calorimeter. Batteries 2018, 4, 59. [Google Scholar] [CrossRef] [Green Version]
Figure 1.
Maximum torque capacity and efficiency maps of the HPEVS AC-50 motor, EM-A.

Figure 2.
Maximum torque capacity and efficiency maps of the electric motor, EM-B [17].
Figure 2.
Maximum torque capacity and efficiency maps of the electric motor, EM-B [17].

Figure 3.
Steps to identify the gear transition points.

Figure 4.
Motor torque and power requirements in first and second gear considering the electric motor, EM-A and a large size vehicle on acceleration scenario (a) 20 km/h @0–40 km/h, (b) 40 km/h @0–40 km/h, (c) 40 km/h @40–60 km/hm, and (d) 60 km/h @40–60 km/h.
Figure 4.
Motor torque and power requirements in first and second gear considering the electric motor, EM-A and a large size vehicle on acceleration scenario (a) 20 km/h @0–40 km/h, (b) 40 km/h @0–40 km/h, (c) 40 km/h @40–60 km/hm, and (d) 60 km/h @40–60 km/h.

Figure 5.
Motor torque and power requirements in first and second gear considering the electric motor, EM-B and a large size vehicle on acceleration scenario (a) 20 km/h @0–40 km/h, (b) 40 km/h @0–40 km/h, (c) 40 km/h @40–60 km/hm, and (d) 60 km/h @40–60 km/h.
Figure 5.
Motor torque and power requirements in first and second gear considering the electric motor, EM-B and a large size vehicle on acceleration scenario (a) 20 km/h @0–40 km/h, (b) 40 km/h @0–40 km/h, (c) 40 km/h @40–60 km/hm, and (d) 60 km/h @40–60 km/h.

Figure 6.
Imaginary gear separation line in relation to the vehicle acceleration.

Figure 7.
Motor torque and power requirements in first and second gear considering the electric motor, EM-A and a small size vehicle on acceleration scenario (a) 20 km/h @0–40 km/h, (b) 40 km/h @0–40 km/h, (c) 40 km/h @40–60 km/hm, and (d) 60 km/h @40–60 km/h.
Figure 7.
Motor torque and power requirements in first and second gear considering the electric motor, EM-A and a small size vehicle on acceleration scenario (a) 20 km/h @0–40 km/h, (b) 40 km/h @0–40 km/h, (c) 40 km/h @40–60 km/hm, and (d) 60 km/h @40–60 km/h.

Figure 8.
Motor torque and power requirements in first and second gear considering the electric motor, EM-A and a large size vehicle on an inclined road at a constant vehicle speed of (a) 15 km/h, (b) 30 km/h, (c) 40 km/h, and (d) 50 km/h.
Figure 8.
Motor torque and power requirements in first and second gear considering the electric motor, EM-A and a large size vehicle on an inclined road at a constant vehicle speed of (a) 15 km/h, (b) 30 km/h, (c) 40 km/h, and (d) 50 km/h.

Figure 9.
Imaginary gear separation line in relation to the road grade.

Figure 10.
Gearshift schedule map based on the vehicle acceleration.

Figure 11.
Gearshift schedule map based on the road grade.

Figure 12.
Flowchart of gearshift control logic for two-speed transmission system in the electric powertrain [22].
Figure 12.
Flowchart of gearshift control logic for two-speed transmission system in the electric powertrain [22].

Figure 13.
Vehicle driving conditions of (a) NEDC; and (b) UDDS.

Figure 14.
Vehicle input speed associated with road grade information for (a) ECE Extra-Urban driving cycle; and (b) road grade distribution.
Figure 14.
Vehicle input speed associated with road grade information for (a) ECE Extra-Urban driving cycle; and (b) road grade distribution.

Figure 15.
Maximum track error after optimization of each type of EV powertrain over the NEDC and UDDS drive cycles.
Figure 15.
Maximum track error after optimization of each type of EV powertrain over the NEDC and UDDS drive cycles.

Figure 16.
Energy-saving through optimization of gear ratios and shift factors of gearshift schedule for acceleration for a two-speed transmission system in four different EV powertrains.
Figure 16.
Energy-saving through optimization of gear ratios and shift factors of gearshift schedule for acceleration for a two-speed transmission system in four different EV powertrains.

Figure 17.
Gearshift schedule in relation to acceleration for a large size vehicle before and after optimization.
Figure 17.
Gearshift schedule in relation to acceleration for a large size vehicle before and after optimization.

Figure 18.
Gearshift schedule in relation to acceleration for a small size vehicle before and after optimization.
Figure 18.
Gearshift schedule in relation to acceleration for a small size vehicle before and after optimization.

Figure 19.
Maximum energy saving through optimized gear ratios and gearshift schedule for road grade for a two-speed transmission system in three EV powertrains on the ECE Extra-Urban driving cycle with a varied road grade.
Figure 19.
Maximum energy saving through optimized gear ratios and gearshift schedule for road grade for a two-speed transmission system in three EV powertrains on the ECE Extra-Urban driving cycle with a varied road grade.

Figure 20.
Gearshift schedule in relation to road grade before and after optimization of a large size EV.
Figure 20.
Gearshift schedule in relation to road grade before and after optimization of a large size EV.

Figure 21.
Gearshift schedule in relation to road grade before and after optimization of a small size EV.
Figure 21.
Gearshift schedule in relation to road grade before and after optimization of a small size EV.

Figure 22.
Comparison of energy consumption between proposed and conventional gearshift strategies considering the EV Powertrain 01 using optimized gear ratios of the EV Powertrain 02.
Figure 22.
Comparison of energy consumption between proposed and conventional gearshift strategies considering the EV Powertrain 01 using optimized gear ratios of the EV Powertrain 02.

Figure 23.
Comparison of energy consumption between proposed and conventional gearshift strategies considering the EV Powertrain 02.
Figure 23.
Comparison of energy consumption between proposed and conventional gearshift strategies considering the EV Powertrain 02.

Figure 24.
Arrangement of the experimental setup in the EV lab.

Figure 25.
Experimental driving profile associated to (a) Gear 1–17.044, (b) Gear 2–9.227, (c) Gear 3–5.696, and (d) Gear 4–4.259.
Figure 25.
Experimental driving profile associated to (a) Gear 1–17.044, (b) Gear 2–9.227, (c) Gear 3–5.696, and (d) Gear 4–4.259.

Figure 26.
Battery discharge profile associated to (a) Gear 1−17.044, (b) Gear 2−9.227, (c) Gear 3−5.696, and (d) Gear 4−4.259.
Figure 26.
Battery discharge profile associated to (a) Gear 1−17.044, (b) Gear 2−9.227, (c) Gear 3−5.696, and (d) Gear 4−4.259.

Figure 27.
Unit energy consumption on each gear in the test vehicle gearbox based on experimental data following the associated experimental driving profile.
Figure 27.
Unit energy consumption on each gear in the test vehicle gearbox based on experimental data following the associated experimental driving profile.

Figure 28.
Unit energy consumption in each gear in the test vehicle gearbox based on simulation results following the associated experimental driving profile.
Figure 28.
Unit energy consumption in each gear in the test vehicle gearbox based on simulation results following the associated experimental driving profile.

Figure 29.
Distance travelled on each gear following three different gearshift schedules considering two-speed EV model with gear ratios of 9.227/5.696.
Figure 29.
Distance travelled on each gear following three different gearshift schedules considering two-speed EV model with gear ratios of 9.227/5.696.

Figure 30.
Distance travelled on each gear following three different gearshift schedules considering two-speed EV model with gear ratios of 9.227/4.259.
Figure 30.
Distance travelled on each gear following three different gearshift schedules considering two-speed EV model with gear ratios of 9.227/4.259.

Figure 31.
Based on simulation results, the energy consumption of two-speed EV model with gear ratio of 9.227/5.696 over standard driving cycles following proposed gearshift strategy, conventional gearshift stragegy 01 and conventional gearshift strategy 02.
Figure 31.
Based on simulation results, the energy consumption of two-speed EV model with gear ratio of 9.227/5.696 over standard driving cycles following proposed gearshift strategy, conventional gearshift stragegy 01 and conventional gearshift strategy 02.

Figure 32.
Based on experimental data, energy consumption of two-speed EV model with gear ratio of 9.227/5.696 over standard driving cycles following proposed gearshift strategy, conventional gearshift stragegy 01 and conventional gearshift strategy 02.
Figure 32.
Based on experimental data, energy consumption of two-speed EV model with gear ratio of 9.227/5.696 over standard driving cycles following proposed gearshift strategy, conventional gearshift stragegy 01 and conventional gearshift strategy 02.

Figure 33.
Based on simulation results, energy consumption of two-speed EV model with gear ratio of 9.227/4.259 over standard driving cycles following proposed gearshift strategy, conventional gearshift stragegy 01 and conventional gearshift strategy 02.
Figure 33.
Based on simulation results, energy consumption of two-speed EV model with gear ratio of 9.227/4.259 over standard driving cycles following proposed gearshift strategy, conventional gearshift stragegy 01 and conventional gearshift strategy 02.

Figure 34.
Based on experimental data, energy consumption of two-speed EV model with gear ratio of 9.227/4.259 over standard driving cycles following proposed gearshift strategy, conventional gearshift stragegy 01 and conventional gearshift strategy 02.
Figure 34.
Based on experimental data, energy consumption of two-speed EV model with gear ratio of 9.227/4.259 over standard driving cycles following proposed gearshift strategy, conventional gearshift stragegy 01 and conventional gearshift strategy 02.


Table 1.
Vehicle parameters for two different size vehicles.
| Vehicle Parameter | Symbol | Small Vehicle | Large Vehicle | Unit |
|---|---|---|---|---|
| Vehicle Mass | 1288 | 1878 | kg | |
| Frontal Area | 2.17 | 2.26 | m2 | |
| Wheel Radius | 0.310 | 0.334 | m | |
| Final Drive Ratio | 4.0 | - | ||
| Wind Velocity | 0 | km/h | ||
| Drag Coefficient | 0.28 | - | ||
| Air Density | 1.27 | kg/m3 | ||
| Rolling Coefficient | 0.016 | - | ||
| Gravity | 9.81 | m/s2 | ||
| Pi | 3.141592 | - | ||
| Road Incline | 0 | deg | ||
| 0 | rad | |||
Table 2.
Traction Motor parameter.
| Traction Motor Parameter | Symbol | EM-A | EM-B [17] | Unit |
|---|---|---|---|---|
| Motor Type | - | AC Induction | - | - |
| Rated Power | 52.81 | 40 | kW | |
| Rated Torque | 157.6 | 127 | Nm | |
| Base Speed | 3200 | 3000 | rpm | |
| Maximum Power | 57.97 | 80 | kW | |
| Maximum Torque | 173 | 255 | Nm | |
| Maximum Speed | 8000 | 9000 | rpm |
Table 3.
Targets for vehicle dynamic performances [22].
Table 3.
Targets for vehicle dynamic performances [22].
| Vehicle Performances | Symbol | Target | Unit | |
|---|---|---|---|---|
| Maximum Gradeability | 23 | deg | ||
| 0.401587302 | rad | |||
| Velocity at Maximum Grade | 15 | km/h | ||
| Maximum Vehicle Velocity | 150 | km/h | ||
| Acceleration Time | 0–60 km/h | 5.5 | s | |
| 60–80 km/h | 3.5 | |||
| 0–100 km/h | 13 | |||
Table 4.
Four different combinations of EV powertrains considered for simulation.
| Simulation Model | Vehicle Size | Electric Motor |
|---|---|---|
| EV Powertrain 01 | Large | EM-A |
| EV Powertrain 02 | Large | EM-B |
| EV Powertrain 03 | Small | EM-A |
| EV Powertrain 04 | Small | EM-B |
Table 5.
Range of gear ratios for optimization purposes.
| Simulation Model | |
|---|---|
| EV Powertrain 01 | |
| EV Powertrain 02 | |
| EV Powertrain 03 | |
| EV Powertrain 04 | |
Table 6.
Impact on energy consumption after optimization of gear ratios and gearshift schedule in relation to vehicle acceleration for EV powertrain 01.
Table 6.
Impact on energy consumption after optimization of gear ratios and gearshift schedule in relation to vehicle acceleration for EV powertrain 01.
| Drive Cycle | Optimization Method | Control Variables and Objective Function before/after Optimization | ||||||
|---|---|---|---|---|---|---|---|---|
| Gear Ratios | Shift Factor for Acceleration (Down/Up) | Energy Consumption, Wh | ||||||
| Before | After | Before | After | Before | After | Improvement | ||
| NEDC | Gradient Decent | 14.00/5.00 | 9.04/5.35 | 1.0/1.0 | - | 884.64 | 858.39 | 2.9673% |
| Pattern Search | 9.04/5.35 | - | 858.42 | 2.9642% | ||||
| Gradient Decent | 14.00/5.00 | 9.04/5.35 | 1.0/1.0 | 1.1015/1.0623 | 884.64 | 858.39 | 2.9673% | |
| Pattern Search | 9.04/5.35 | - | 1.2/0.8 | 858.39 | 858.39 | 0.0000% | ||
| UDDS | Gradient Decent | 14.00/5.00 | 9.04/5.35 | 1.0/1.0 | - | 1209.83 | 1123.36 | 7.1474% |
| Pattern Search | 9.04/5.35 | - | 1123.33 | 7.1497% | ||||
| Gradient Decent | 14.00/5.00 | 9.04/5.35 | 1.0/1.0 | 1.2/1.2 | 1209.83 | 1122.22 | 7.2416% | |
| Pattern Search | 9.04/5.35 | - | 1.1377/1.1328 | 1123.36 | 1122.53 | 0.0742% | ||
Table 7.
Impact on energy consumption after optimization of gear ratios and gearshift schedule in relation to vehicle acceleration for EV powertrain 02.
Table 7.
Impact on energy consumption after optimization of gear ratios and gearshift schedule in relation to vehicle acceleration for EV powertrain 02.
| Drive Cycle | Optimization Method | Control Variables and Objective Function before/after Optimization | ||||||
|---|---|---|---|---|---|---|---|---|
| Gear Ratios | Shift Factor for Acceleration (Down/Up) | Energy Consumption, Wh | ||||||
| Before | After | Before | After | Before | After | Improvement | ||
| NEDC | Gradient Decent | 14.00/5.00 | 8.16/4.7896 | 1.0/1.0 | - | 843.64 | 795.56 | 5.6995% |
| Pattern Search | 8.1664/4.7948 | - | 795.89 | 5.6600% | ||||
| Gradient Decent | 14.00/5.00 | 8.16/4.7896 | 1.0/1.0 | 1.1393/1.1337 | 843.64 | 795.56 | 5.6995% | |
| Pattern Search | 8.16/4.7896 | - | 1.2/0.8 | 795.56 | 795.56 | 0.0000% | ||
| UDDS | Gradient Decent | 14.00/5.00 | 8.16/4.7896 | 1.0/1.0 | - | 1168.33 | 1066.03 | 8.7565% |
| Pattern Search | 8.796/5.2536 | - | 1075.75 | 7.9244% | ||||
| Gradient Decent | 14.00/5.00 | 8.16/4.7896 | 1.0/1.0 | 1.2/1.2 | 1168.33 | 1065.47 | 8.8041% | |
| Pattern Search | 8.16/4.7896 | - | 1.0674/1.0665 | 1066.06 | 1065.83 | 0.0208% | ||
Table 8.
Impact on energy consumption after optimization of gear ratios and gearshift schedule in relation to vehicle acceleration for EV powertrain 03.
Table 8.
Impact on energy consumption after optimization of gear ratios and gearshift schedule in relation to vehicle acceleration for EV powertrain 03.
| Drive Cycle | Optimization Method | Control Variables and Objective Function before/after Optimization | ||||||
|---|---|---|---|---|---|---|---|---|
| Gear Ratios | Shift Factor for Acceleration (Down/Up) | Energy Consumption, Wh | ||||||
| Before | After | Before | After | Before | After | Improvement | ||
| NEDC | Gradient Decent | 14.00/5.00 | 7.68/4.5128 | 1.0/1.0 | - | 730.36 | 667.91 | 8.5506% |
| Pattern Search | 7.6808/4.5212 | - | 668.26 | 8.5032% | ||||
| Gradient Decent | 14.00/5.00 | 7.68/4.5128 | 1.0/1.0 | 1.1974/1.1964 | 730.36 | 667.90 | 8.5515% | |
| Pattern Search | 7.68/4.5128 | - | 0.8107/0.7980 | 667.91 | 667.91 | 0.0000% | ||
| UDDS | Gradient Decent | 14.00/5.00 | 7.68/4.5124 | 1.0/1.0 | - | 935.97 | 837.60 | 10.5096% |
| Pattern Search | 8.43/4.992 | - | 850.03 | 9.1825% | ||||
| Gradient Decent | 14.00/5.00 | 7.68/4.5124 | 1.0/1.0 | 1.6/1.6 | 936.06 | 835.65 | 10.7185% | |
| Pattern Search | 7.68/4.5124 | - | 1.3888/1.3840 | 837.58 | 836.40 | 0.1414% | ||
Table 9.
Impact on energy consumption after optimization of gear ratios and gearshift schedule in relation to vehicle acceleration for EV powertrain 04.
Table 9.
Impact on energy consumption after optimization of gear ratios and gearshift schedule in relation to vehicle acceleration for EV powertrain 04.
| Drive Cycle | Optimization Method | Control Variables and Objective Function before/after Optimization | ||||||
|---|---|---|---|---|---|---|---|---|
| Gear Ratios | Shift Factor for Acceleration (Down/Up) | Energy Consumption, Wh | ||||||
| Before | After | Before | After | Before | After | Improvement | ||
| NEDC | Gradient Decent | 14.00/5.00 | 6.92/4.0352 | 1.0/1.0 | - | 686.67 | 602.78 | 12.2168% |
| Pattern Search | 6.9268/4.0476 | - | 603.42 | 12.1238% | ||||
| Gradient Decent | 14.00/5.00 | 6.92/4.0352 | 1.0/1.0 | 1.1803/1.1653 | 686.67 | 602.78 | 12.2168% | |
| Pattern Search | 6.92/4.0352 | - | 0.8108/0.7980 | 602.78 | 602.78 | 0.0000% | ||
| UDDS | Gradient Decent | 14.00/5.00 | 6.92/4.0352 | 1.0/1.0 | - | 889.33 | 777.94 | 12.5250% |
| Pattern Search | 7.0128/4.0984 | - | 777.17 | 12.6124% | ||||
| Gradient Decent | 14.00/5.00 | 6.92/4.0352 | 1.0/1.0 | 1.5976/1.5976 | 889.33 | 777.30 | 12.5976% | |
| Pattern Search | 6.92/4.0352 | - | 1.3888/1.3137 | 778 | 777.31 | 0.0893% | ||
Table 10.
Economic performance of EV powertrains after optimization of gear ratios and gearshift schedule in relation to road grade considering the ECE Extra-Urban driving cycle associated with road grade information.
Table 10.
Economic performance of EV powertrains after optimization of gear ratios and gearshift schedule in relation to road grade considering the ECE Extra-Urban driving cycle associated with road grade information.
| EV Powertrain | Optimization Method | Control Variables and Objective Functions before/after Optimization | ||||||
|---|---|---|---|---|---|---|---|---|
| Gear Ratios | Shift Factor for Grade (Down/Up) | Energy Consumption, Wh | ||||||
| Before | After | Before | After | Before | After | Improvement | ||
| EV Powertrain 02 | Gradient Descent | 14.00/5.00 | 8.16/4.7896 | 1.0/1.0 | 1.2/1.2 | 3895.39 | 3500.53 | 10.1366% |
| Gradient Descent | 8.16/4.7896 | - | 1.0/1.0 | 1.2/1.2 | 3664.03 | 3500.53 | 4.4623% | |
| Pattern Search | - | 1.1273/0.9658 | 3499.64 | 4.4866% | ||||
| EV Powertrain 03 | Gradient Descent | 14.00/5.00 | 7.68/4.5124 | 1.0/1.0 | 1.6/1.6 | 2767.14 | 2425.67 | 12.3402% |
| Gradient Descent | 7.68/4.5124 | - | 1.0/1.0 | 1.6/1.6 | 2537.08 | 2425.67 | 4.3915% | |
| Pattern Search | - | 1.1661/0.9739 | 2432.53 | 4.1209% | ||||
| EV Powertrain 04 | Gradient Descent | 14.00/5.00 | 6.92/4.0352 | 1.0/1.0 | 1.6/1.6 | 2767.86 | 2272.97 | 17.8798% |
| Gradient Descent | 6.92/4.0352 | - | 1.0/1.0 | 1.6/1.6 | 2394.86 | 2273.00 | 5.0884% | |
| Pattern Search | - | 1.4786/1.4660 | 2278.42 | 4.8623% | ||||
Table 11.
Load estimation of the test vehicle on the dyno platform.
| Vehicle Component | Estimated Mass, kg |
|---|---|
| Estimated test vehicle mass | 682 |
| Estimated test vehicle load on dyno platform (55% of estimated vehicle mass) | 375 |
Table 12.
Gear ratio of each gear within the four-speed manual transmission system in the test vehicle.
Table 12.
Gear ratio of each gear within the four-speed manual transmission system in the test vehicle.
| Gear Number | Gear Ratio |
|---|---|
| Gear 1 | 17.044 |
| Gear 2 | 9.227 |
| Gear 3 | 5.696 |
| Gear 4 | 4.259 |
Table 13.
Capacity of the battery module connected to the electric powertrain of the test vehicle.
| Battery Parameter | Symbol | Value | Unit |
|---|---|---|---|
| Voltage | 98 | Volt | |
| Capacity | 32 | Ah |
Disclaimer/Publisher’s Note: The statements, opinions and data contained in all publications are solely those of the individual author(s) and contributor(s) and not of MDPI and/or the editor(s). MDPI and/or the editor(s) disclaim responsibility for any injury to people or property resulting from any ideas, methods, instructions or products referred to in the content. |
© 2023 by the authors. Licensee MDPI, Basel, Switzerland. This article is an open access article distributed under the terms and conditions of the Creative Commons Attribution (CC BY) license (https://creativecommons.org/licenses/by/4.0/).
Share and Cite
MDPI and ACS Style
Ahssan, M.R.; Ektesabi, M.; Gorji, S. Evaluation of a Three-Parameter Gearshift Strategy for a Two-Speed Transmission System in Electric Vehicles. Energies 2023, 16, 2496. https://doi.org/10.3390/en16052496
AMA Style
Ahssan MR, Ektesabi M, Gorji S. Evaluation of a Three-Parameter Gearshift Strategy for a Two-Speed Transmission System in Electric Vehicles. Energies. 2023; 16(5):2496. https://doi.org/10.3390/en16052496
Chicago/Turabian StyleAhssan, Md Ragib, Mehran Ektesabi, and Saman Gorji. 2023. "Evaluation of a Three-Parameter Gearshift Strategy for a Two-Speed Transmission System in Electric Vehicles" Energies 16, no. 5: 2496. https://doi.org/10.3390/en16052496
Note that from the first issue of 2016, this journal uses article numbers instead of page numbers. See further details here.