
Two-Outputs Nonlinear Grey Box Model for Lithium-Ion Batteries
by
 , , , and
Cynthia Thamires da Silva
1 ,
,
Bruno Martin de Alcântara Dias
1 ,
,
Rui Esteves Araújo
2,*,
Eduardo Lorenzetti Pellini
1 and
Armando Antônio Maria Laganá
1 1
PEA—Polytechnic School (POLI-USP), University of São Paulo, São Paulo 05508-010, Brazil
2
INESC TEC and Faculty of Engineering, University of Porto, 4200-465 Porto, Portugal
*
Author to whom correspondence should be addressed.
Energies 2023, 16(5), 2218; https://doi.org/10.3390/en16052218
Submission received: 7 January 2023
/
Revised: 21 February 2023
/
Accepted: 23 February 2023
/
Published: 24 February 2023
Abstract
:Storing energy efficiently is one of the main factors of a more sustainable world. The battey management system in energy storage plays an extremely important role in ensuring these systems’ efficiency, safety, and performance. This battery management system is capable of estimating the battery states, which are used to give better efficiency, a long life cycle, and safety. However, these states cannot be measured directly and must be estimated indirectly using battery models. Therefore, accurate battery models are essential for battery management systems implementation. One of these models is the nonlinear grey box model, which is easy to implement in embedded systems and has good accuracy when used with a good parameter identification method. Regarding the parameter identification methods, the nonlinear least square optimization is the most used method. However, to have accurate results, it is necessary to define the system’s initial states, which is not an easy task. This paper presents a two-outputs nonlinear grey box battery model. The first output is the battery voltage, and the second output is the battery state of charge. The second output was added to improve the system’s initial states identification and consequently improve the identified parameter accuracy. The model was estimated with the best experiment design, which was defined considering a comparison between seven different experiment designs regarding the fit to validation data, the parameter standard deviation, and the output variance. This paper also presents a method for defining a weight between the outputs, considering a greater weight in the output with greater model confidence. With this approach, it was possible to reach a value 1000 times smaller in the parameter standard deviation with a non-biased and little model prediction error when compared to the commonly used one-output nonlinear grey box model.
1. Introduction
The battery’s development advance is a historically slow process. However, it has been remarkably driven by demands from the electric mobility sector as never before. So, since battery invention, the search for rechargeable batteries with greater capacity and smaller size and weight has become the purpose of many researchers from different areas [1]. In [2], they presented a new approach for a lithium metal battery electrolyte. This approach results in better energy density and safety when compared to lithium-ion batteries. Another example is the work in [3], in which a new battery design allows high-speed charging. Regardless of the battery type, to ensure safe and efficient battery operation, a battery management system (BMS) is required. The BMS has many tasks, but battery state estimation is the most important. Accurate state estimation improves the battery autonomy and prolongs its lifespan. In practice, the battery state is a non-measurable variable, which can only be indirectly estimated through the continuous measurement of battery temperature, voltage, and current. Furthermore, the batteries have nonlinearities; due to this, accurate state estimation is a difficult task, and relies, essentially, on a proper mathematical battery model [4].
Based on some batteries’ internal physical and chemical understanding mechanisms, a mathematical model allows for simulating and observing battery behavior under controlled and specific operating conditions. Several physical phenomena (electrical, electrochemical, thermal, and mechanical) occur in different perspectives in the battery system, from an atomistic context of its constitution to a macroscopic one in the application system [5]. The mathematical model must also be chosen to describe the battery dynamic, and this dynamic can be totally different regarding the application [4].
As a basic feature, all models have the ability to transform information into certain patterns. The system identification theory deals with building mathematical models of dynamic systems based on observed system data [6]. In system identification, models can be separated into three groups: white box models, black box models, and grey box models. Electrochemical models are considered white box models, empirical models are considered black box models, and equivalent circuit models (ECMs) are considered grey box models. The difference is based on the amount of prior physical system knowledge required to generate their algebraic-differential-transcendental mathematical equations [7].
In this paper, we will focus on nonlinear grey box models. The grey box modeling technique emerged as a “middle ground” between white box and black box models. This model assumes that some information in the dynamics of certain physical parameters is known, and the parameters may have certain restrictions or operational limits. In other words, it uses known information to infer unknown information, which would be difficult or impossible to measure. This technique combines prior physical knowledge with experimental data to perform a physical interpretation to assign numerical values to model parameters [8,9,10]. Here, we explore a new approach: we combine the battery’s physical knowledge with knowledge about the battery application. This way, we define the most suitable experiment data that can perform a better physical interpretation focusing on the battery application.
When a complex system is modeled, the model contains some unknown parameters. For example, considering a lithium battery, its internal impedance is greatly affected by temperature and state of charge (SOC), but its exact relationship is not well defined. These parametric values are estimated using statistical correlations (system identification) from experimental data [8]. Such battery designs fail to reflect the effects of current, SOC, SOH, temperature, or self-discharge on the internal characteristics of the battery. These models are less accurate than white-box models, due to the lack of a more faithful and accurate representation of internal electrochemical processes and nonlinearities [11]. Therefore, models that should be able to achieve optimal performance are difficult to obtain only with algorithms based on grey box and black box models [12].
In this context, while equivalent circuit models (grey box models) are not as accurate as electrochemical models (white box models), the ECMs are generally much simpler in their structure, making them feasible to be used and processed in the embedded computing environment (with restrictions processing speed, type of arithmetic, and memory capacity). Equivalent circuit models are called grey boxes due to a physical analogy between the components used in the modeling and the real battery components and phenomena. In other words, they are not white boxes because they do not use partial differential equations related to physical-chemical fundamentals, and they are not black boxes either, because they are not based only on experimental data. When the ECM is operated under specific conditions (for example, within a certain range of temperature and SOC), the accuracy of these models can be more than 90% and, when treated appropriately, can produce useful results for the energy storage management, in any application [4,13].
There are several papers that perform the battery mathematical modeling through an ECM, each paper with a different approach to parameter identification [14,15,16,17,18,19,20,21]. In [14], they add a moving average noise to the ECM and use the recursive extended least squares algorithm to identify the battery parameters. In [15], they propose an adaptive forgetting factor recursive least square for online parameters identification of an ECM. The authors of [16] make an observability analysis in an extended equivalent circuit model; this work decomposes the traditional ECM into two sub-models mathematically and the output of one sub-model is the battery voltage and the output of the second sub-model is the state of charge. They used two sub-models to avoid applying the nonlinear observability method directly to the extended battery model. In [17], they made experimental procedures for model parameter identification of an ECM optimized by orthogonal analysis. Most recently, in [18], they developed a combined fixed memory recursive least square and a fading extended Kalman filter to obtain the parameters of an ECM.
This shows that the parameter identification approach becomes as important as the battery modeling itself. Developing an approach that is easy to apply and allows accurate results is not an easy task. In this context, this work presents a different strategy that has not yet been found in the literature as far as our research has led us to conclude. We add a second output to the battery equivalent circuit model equations and perform parameter identification through a nonlinear grey box model with a different weighting strategy between the outputs. This strategy allows the model’s initial states to be correctly identified by the nonlinear least squares optimization method and places a greater weight on the output that the model has greater confidence in. This makes the identified parameters more accurate and less biased when compared to the traditional one-output model.
1.1. Objectives and Contributions
The purpose of this paper is to present a new approach to develop a grey box model based on a battery ECM that will be used for a state of charge estimation, in a battery applied in an electric forklift. To achieve this purpose, the previous work in [4] will be used as a basis and result comparison. In [4], a nonlinear grey box model was developed. However, there was an inconsistency in the model’s initial state estimations; thus, in this work, a new nonlinear grey box model was developed to correct this inconsistency and to achieve better parameter estimation accuracy. This new model uses two outputs, considering the state of charge as one of its outputs instead of only using the battery voltage as an output.
In addition, this paper also compares the new model with seven different experiment designs, presented in [4]. Focusing on an electric forklift application, the experiment type and the resulting data sets were tested against this new model, to select the best-suited method that provides information for BMS algorithm evaluation and certification.
1.2. Paper Organization
Section 2 presents the battery modeling with the ECM and the state-space equations. This section also presents the system identification methodology and the studied battery cell characteristics. Section 3 compares seven different experiment designs and analyzes the best experiment designs for the two-outputs nonlinear grey box model applied in the state of charge estimation in electric forklift applications. Section 4 presents the two-output nonlinear grey box model result, estimated with the best experiment design defined in Section 3. Section 5 presents the conclusions.
2. System Statement
The battery model representation by an equivalent electrical circuit is one of the most popular, since it has a good compromise between accuracy and usability. Circuit-based models are also simple and practical because they allow complex electrochemical processes to be replaced by a simple electrical circuit, with similar dynamics [22]. Equivalent circuits, such as the Thèvenin type or a variable impedance model, are often used. In this model, the correlation with the dynamics of the real battery can be preserved (or emulated), without greatly compromising its accuracy. However, the accuracy of these models is highly dependent on the structure and topology of the circuit [13,23,24].
2.1. Lithium-Ion Battery Model
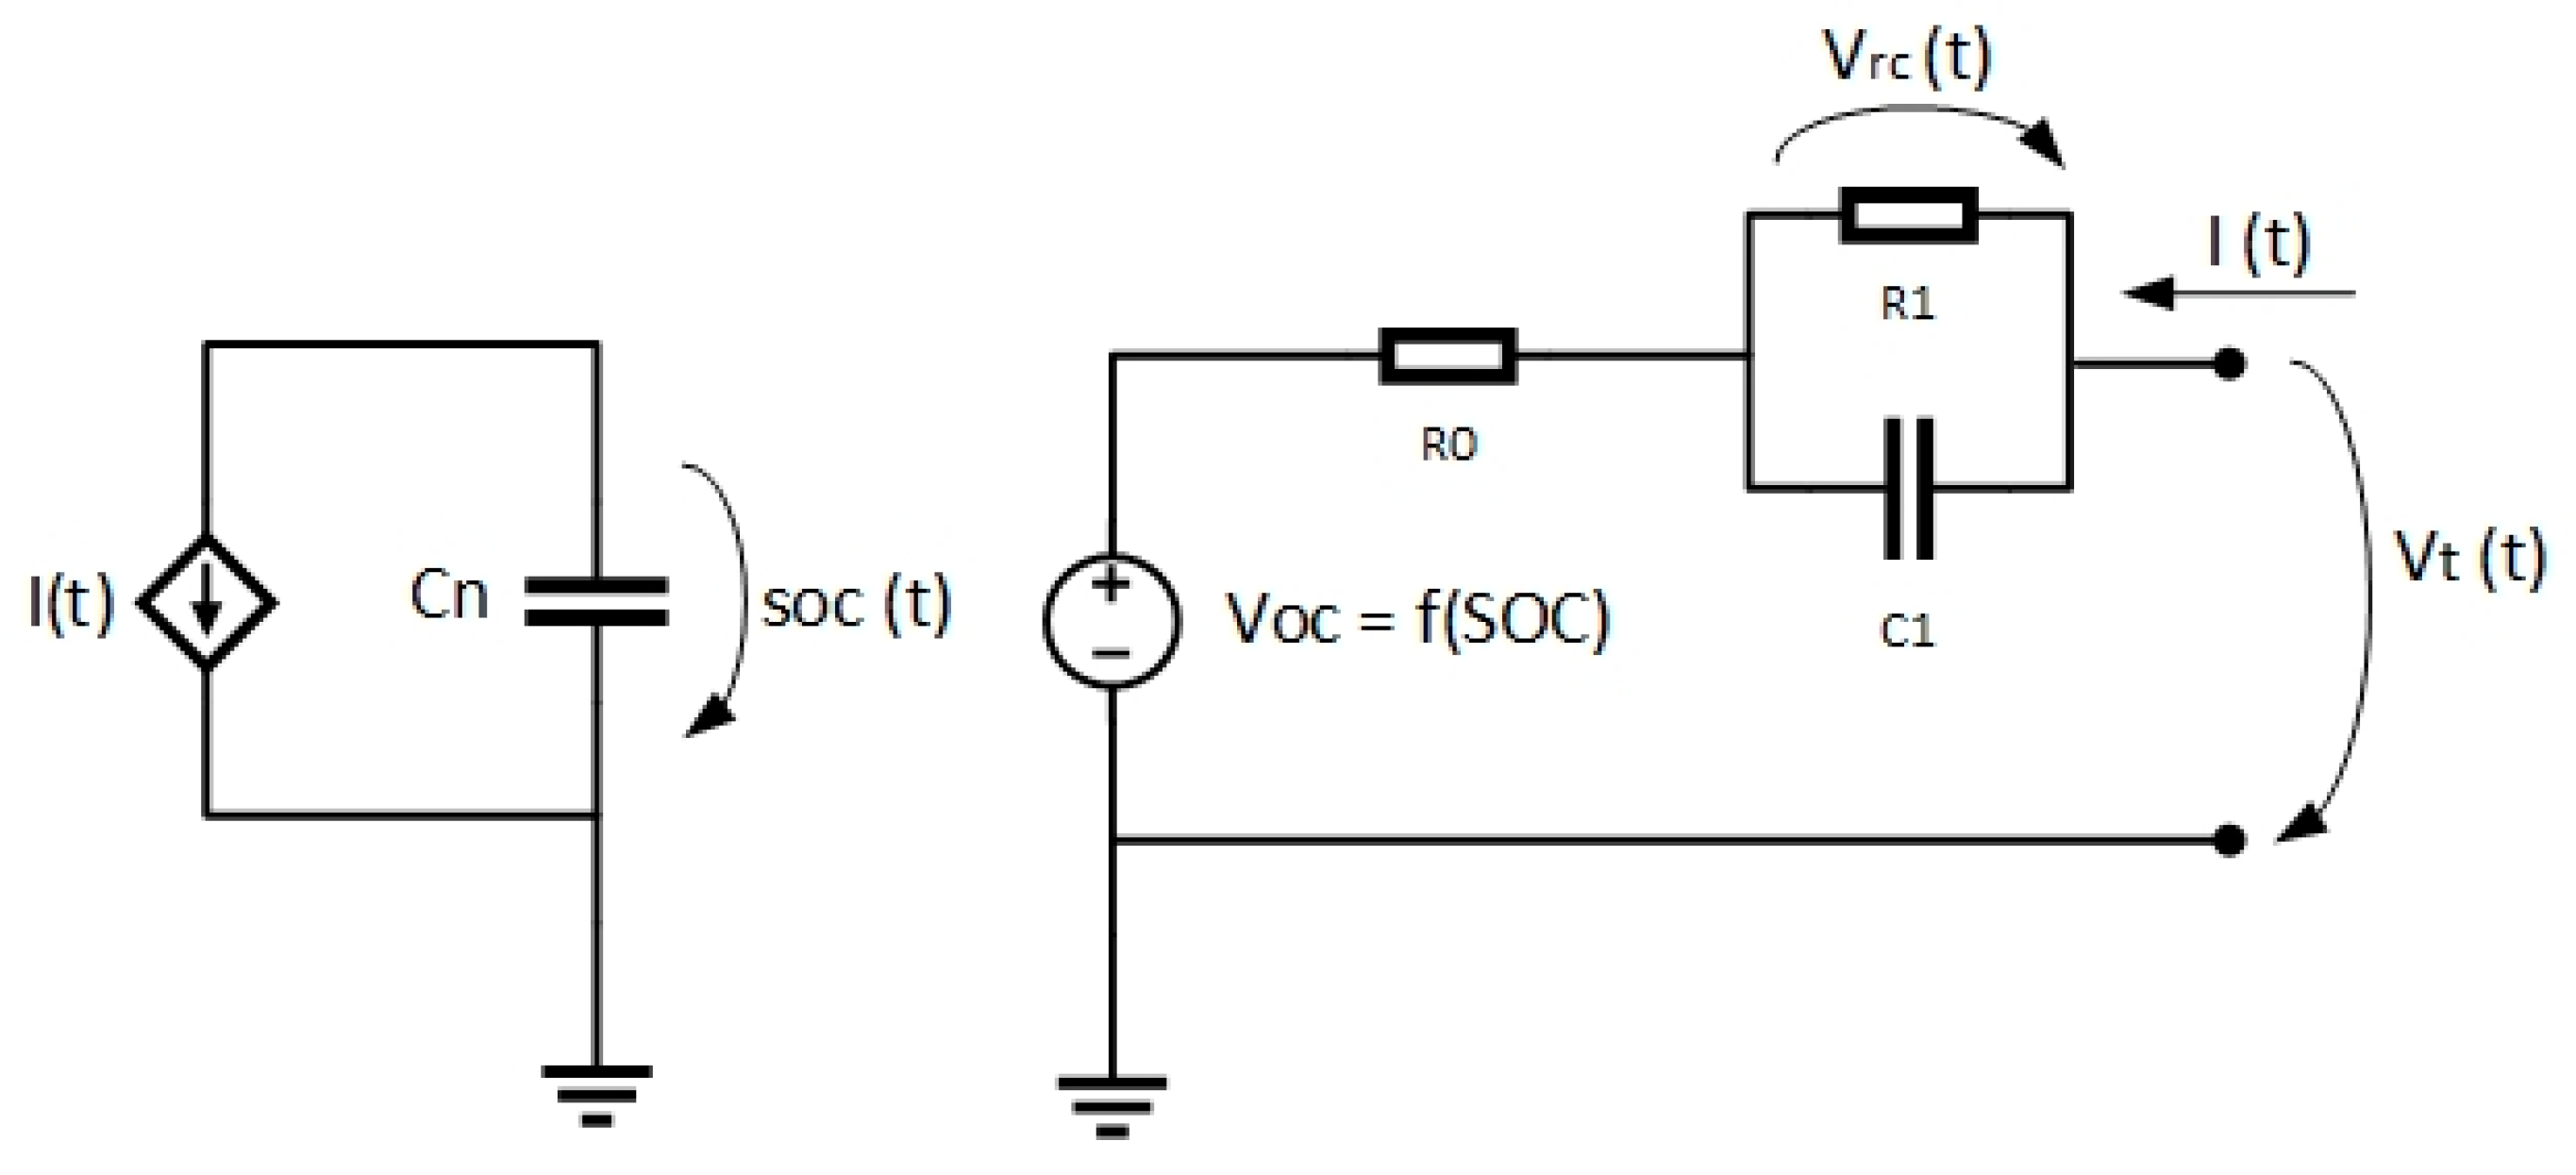
Based on the work made in [4], in this paper, we will use an ECM model with 1 RC branch considering the relationship between the OCV (Open Circuit Voltage) and the SOC. and also the hysteresis effect. The model is represented in Figure 1.
Considering Figure 1, the equations and states that represent this circuit are as follows [4]: ; . Where and are:
where represents the battery nominal capacity.
Regarding the model output, in this paper a new approach is presented. The model that commonly has only one output [4], now has two outputs. The first output remains the battery voltage and is presented by Equation (3).
where the are the nonlinear relationship between the OCV and the SOC. This relationship is described by the piecewise linear function that was detailed in [4] and represented by Equation (4), with different and values according to the :
Replacing Equation (4) in Equation (3) results in:
Now, the second output is the state of charge itself, presented by Equation (6).
Considering Equations (5) and (6), the state-space equations that represent the battery’s dynamics can be written as follows:
is the battery nominal capacity, which can be found in the datasheet. The parameters and depend on the SOC, as shown in [4]. And the and battery parameters should be identified.
2.2. Two-Stage Algorithm for System Identification
In this paper, all the experiments were made with the same battery cell type, presented in [4], which is a battery with 6 Ah of capacity.
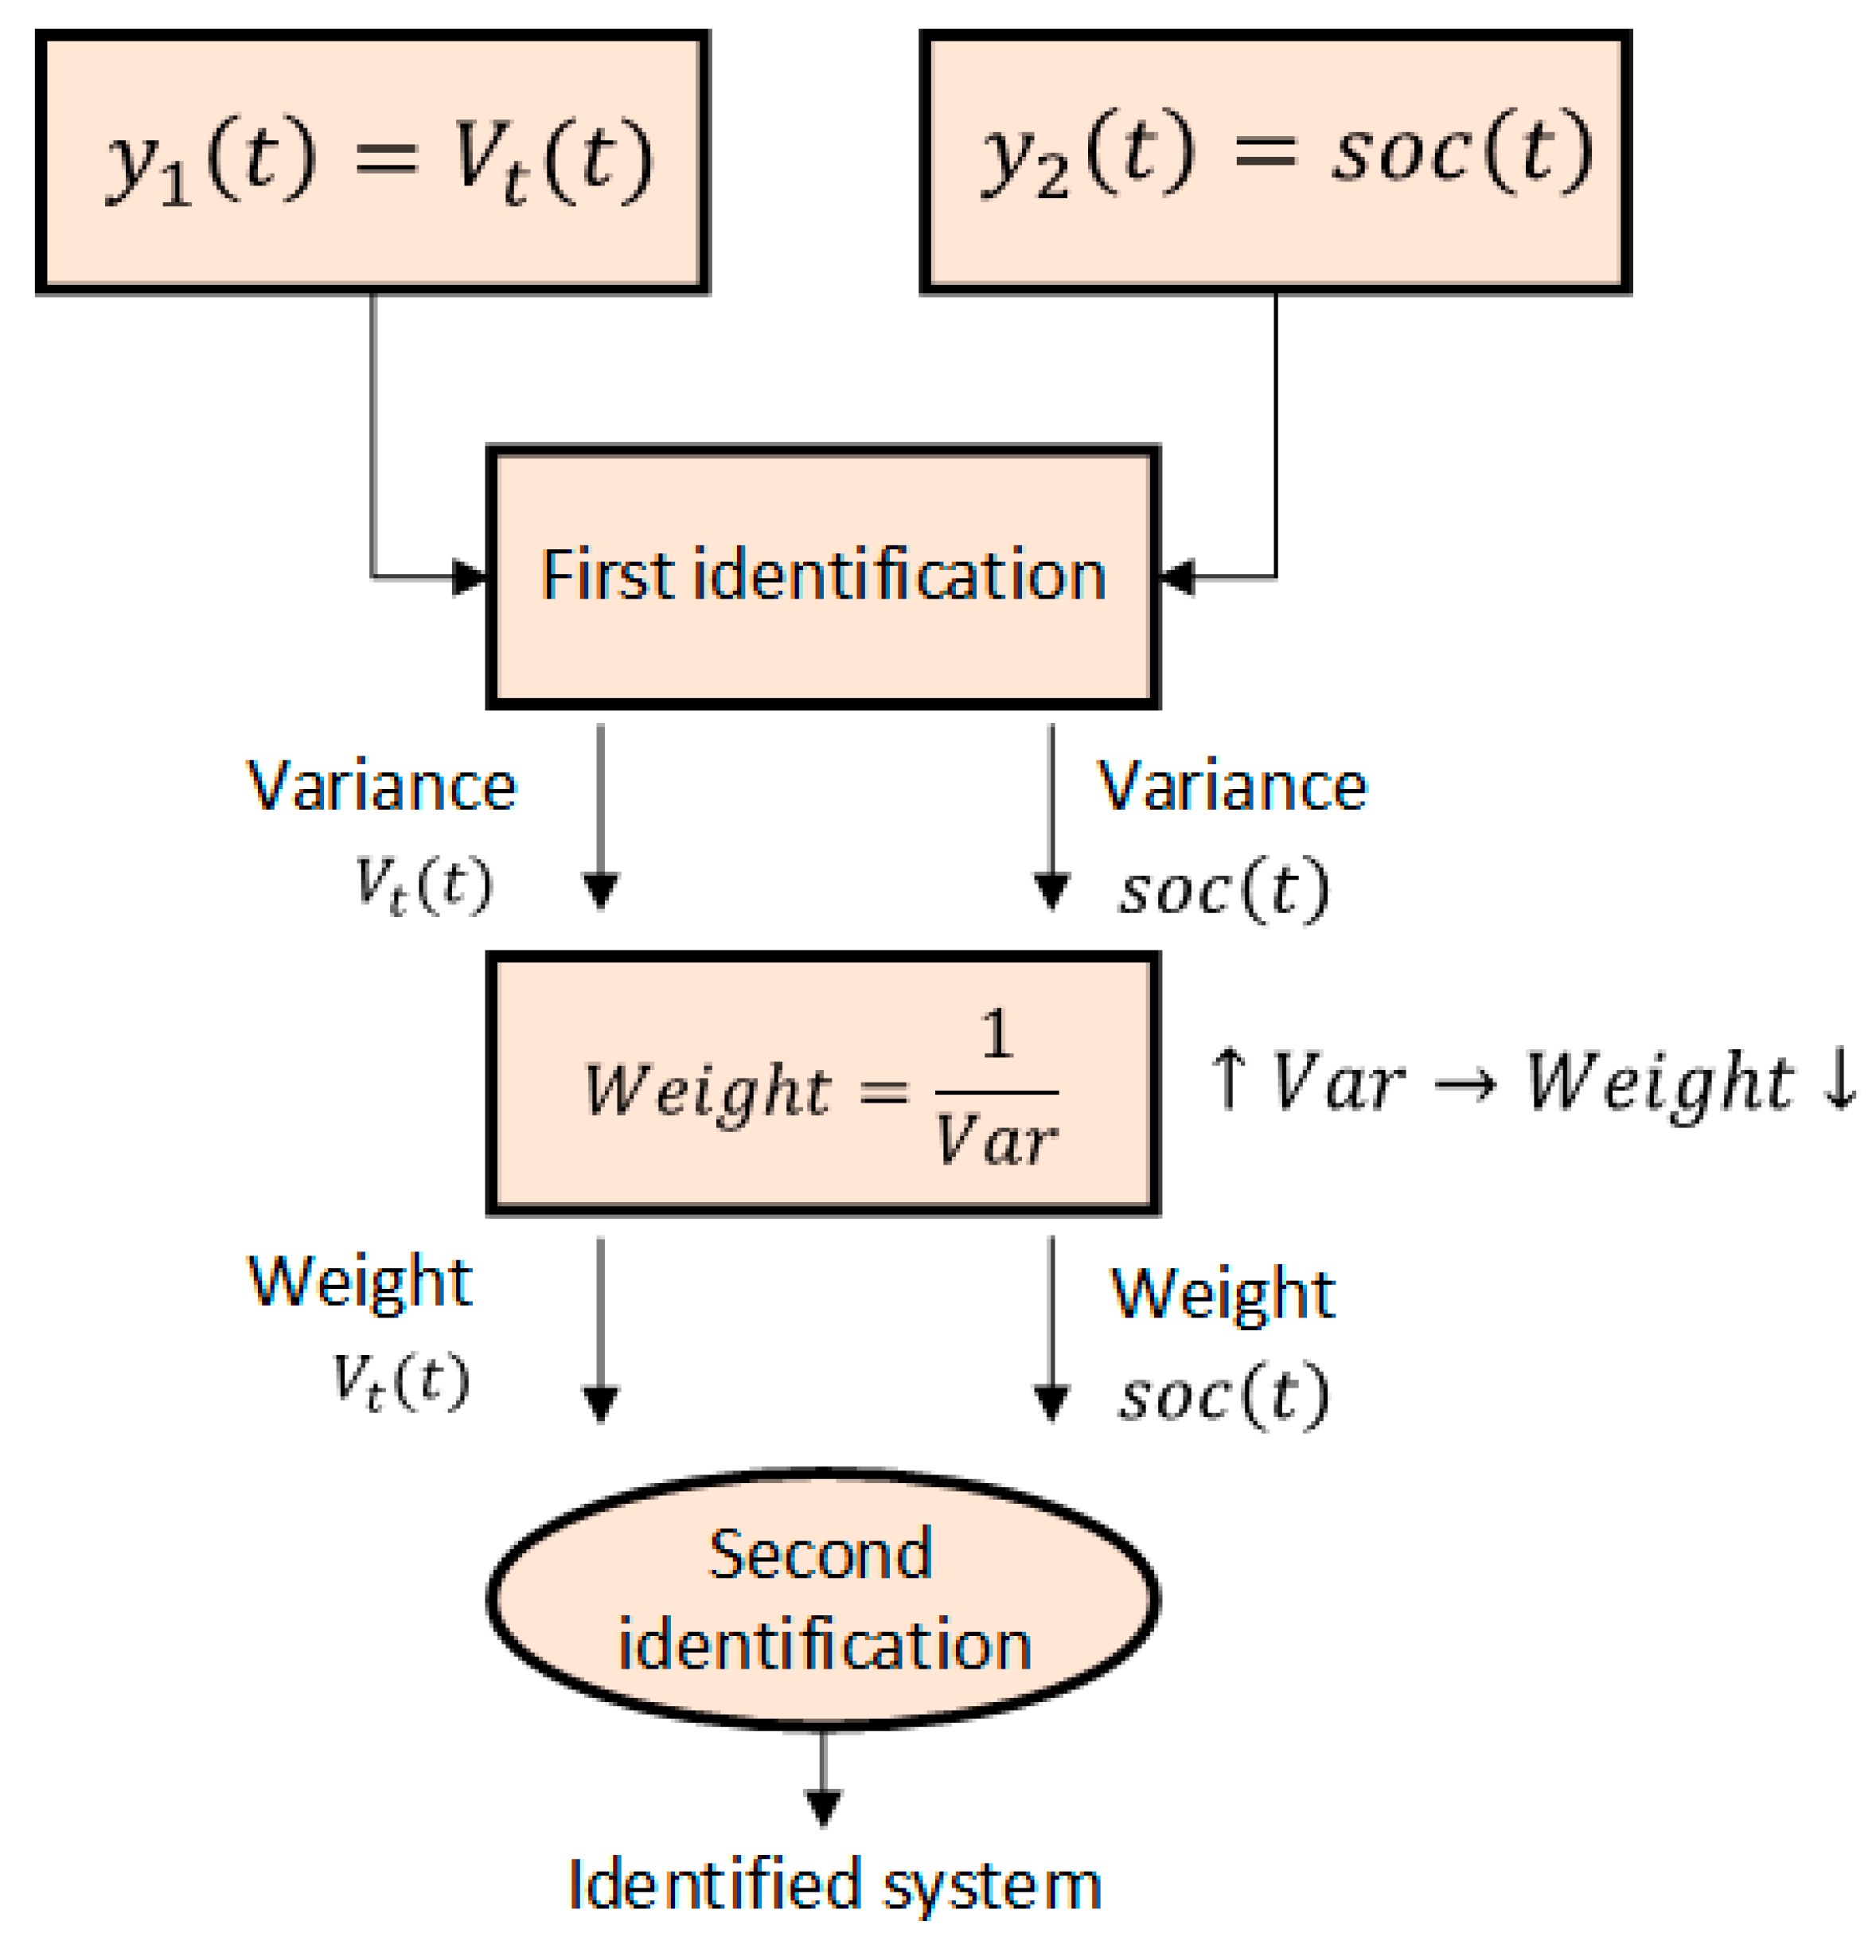
Using a model with two outputs, it is necessary to define which one of the two outputs should have greater weight when identifying the parameters; in other words, which output will have more information for the algorithm to calculate the parameters with the greatest possible accuracy. By default, models are identified considering that all outputs have the same weight. However, the strategy adopted in this work consists of carrying out a first system identification, considering the same weight for the two outputs, to calculate each output variance. Next, a second system identification is carried out, considering as weights the inverse of each output variance. This method is shown in Figure 2.
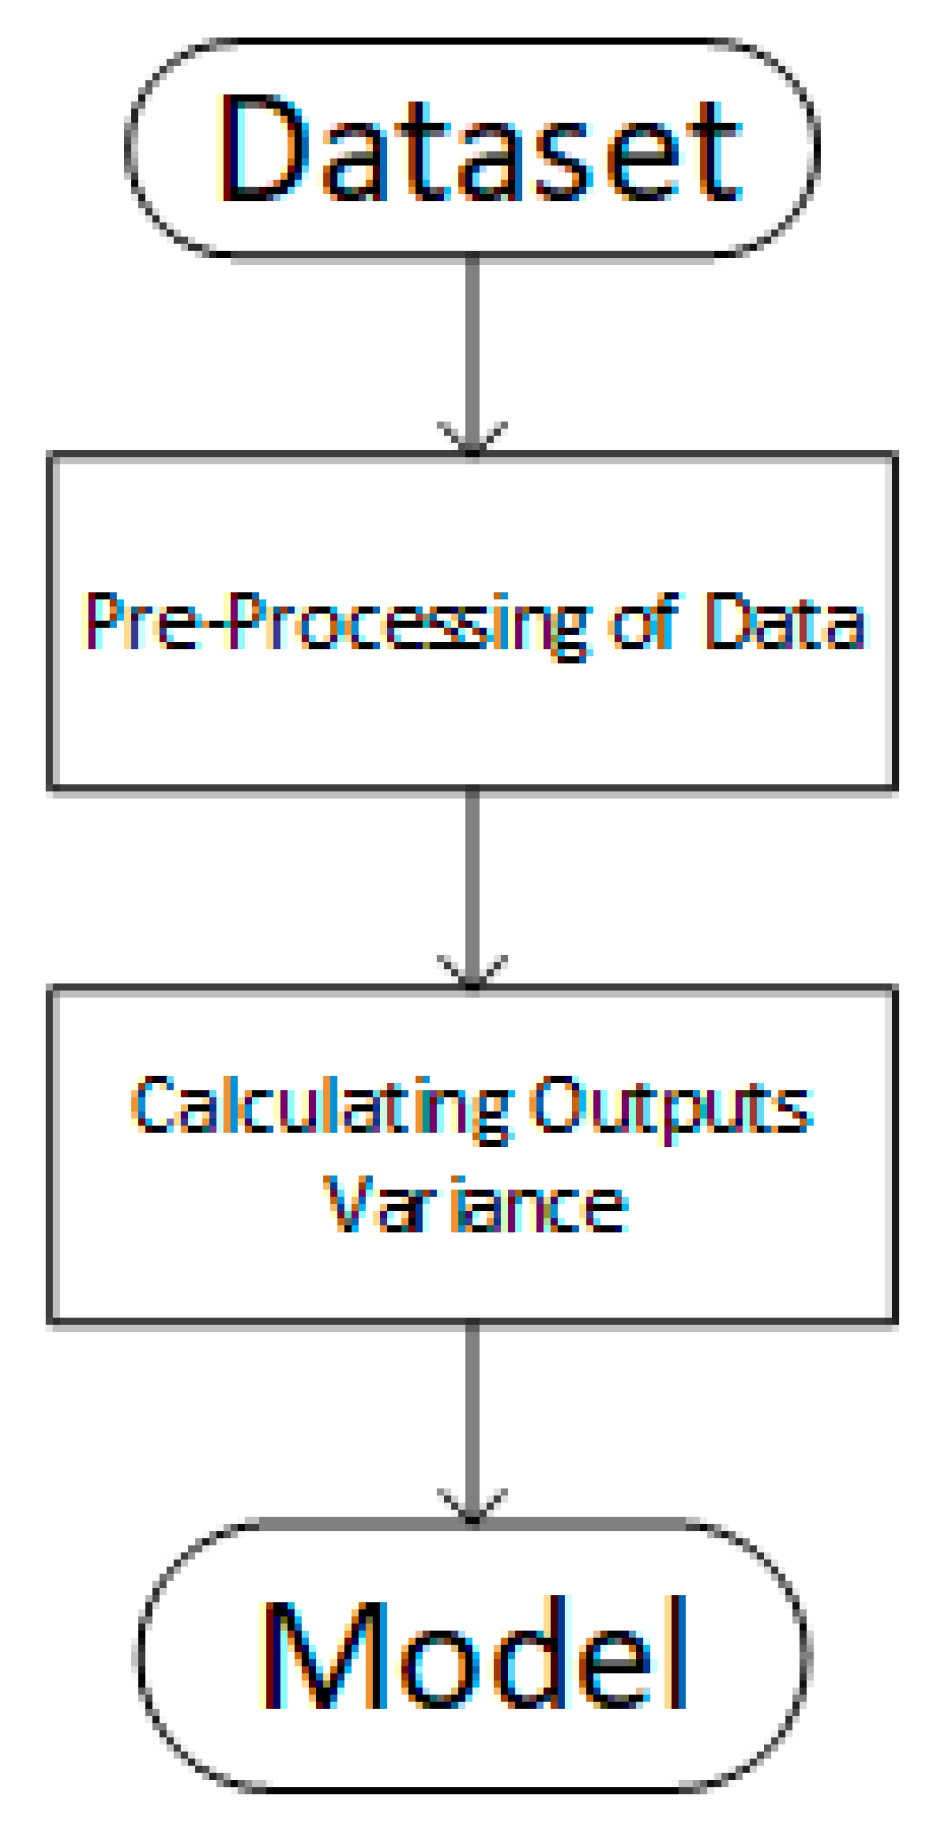
Basically, the main idea was to adjust the lowest weight to the output with the highest variance. In other words, the parameters will be identified considering a greater weight on the output in which the system has greater confidence (lower variance). Figure 3 presents a flowchart with the main steps of the algorithm implemented in MATLAB to identify the model parameters considering the output weight.
In this way, it is possible to obtain an accurate model, without bias, of low complexity and easy implementation. The model parameters, identified through this strategy, will be used in the battery state of charge estimation algorithm.
3. Experiment Design
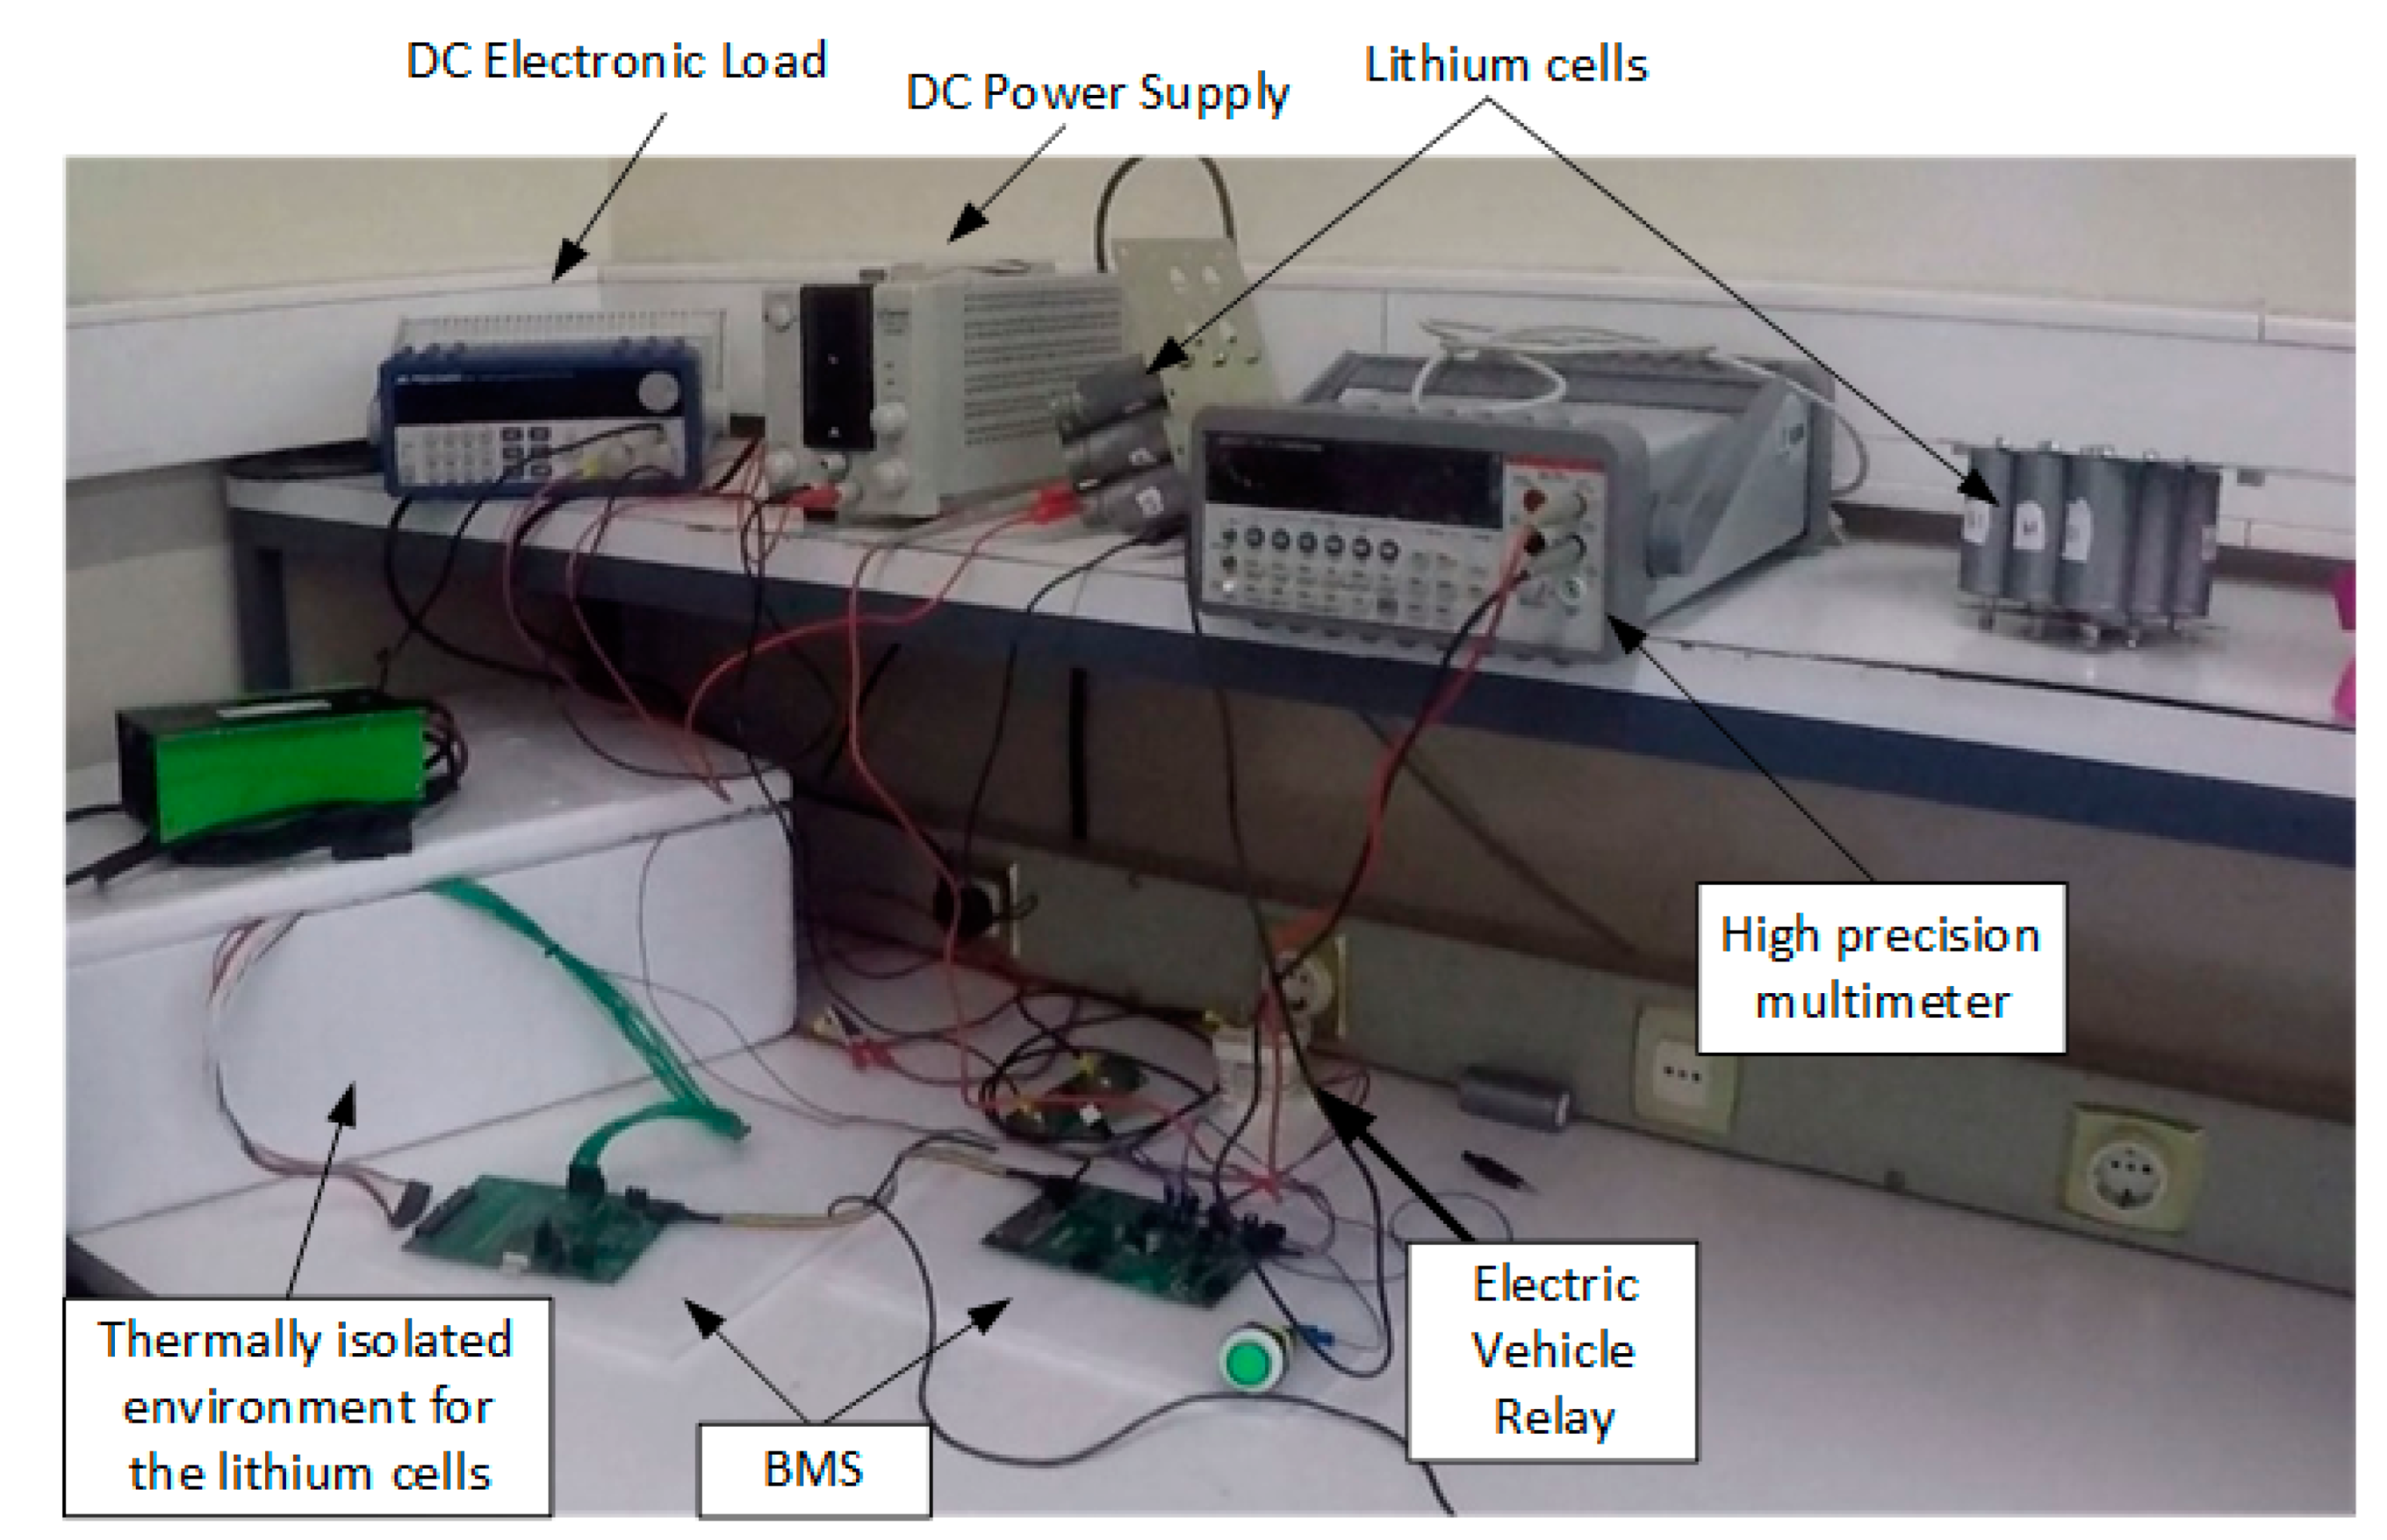
The experimental work was carried out on a test bench, with the following components: lithium cells within a thermally isolated environment, a BMS developed by the authors, an electric vehicle relay, high precision multimeter, DC power supply, and DC electronic load. A photograph of the test bench is shown in Figure 4.
The fit to validation data was performed on all experiments described and presented in [4]; these experiments were designed with a focus on electric forklift application. The results related to the battery voltage output () is shown in Table 1 where the best ones are shown in blue, and the worst ones are shown in orange.
The result related to the output that represents the state of charge, (), is shown in Table 2.
Analyzing Table 1, the best experiment related to the output battery voltage is the “30 s high 1 m low”. One important point to mention is about the worst results. According to Table 1, the OCV test presents the worst results within all fit-to-validation data. As mentioned in [4], this happens because the OCV test dynamic is hugely different from the other experiments. This emphasizes that the battery models that were estimated with the OCV test will not work properly on a battery applied to electric forklifts. However, the best experiment design should be defined considering other important information.
Analyzing Table 2, the best experiment related to the battery state of charge is the “OCV with 1 h of rest” experiment, while the worst ones are “18 s of battery rest” and “1 m high 30 s low”. However, all results presented in Table 2 are greater than 99%; that is, all experiments can estimate the state of charge with good accuracy. The OCV experiment best represents the battery state of charge; however, it is not able to accurately represent the battery voltage. An important point to stress is that the values in Table 2 are very similar, which indicates that the modeling established and data collected from the application can estimate very well the model proprieties. In other words, these results show that a good mix of the model structure and the data was achieved, allowing a correct description of the battery model, which is instrumental for SOC prediction and model parameters. To sum up, the results presented in Table 2 show that we obtain a good fit to data with a model with few parameters.
In this case, the experiment capable of describing the battery dynamics with better accuracy was the “30 s high 1 m low” experiment, which obtained excellent results, both in terms of battery voltage and state of charge. However, as presented in [4], the best experiment must also be evaluated in relation to the parameter’s standard deviation and the output variance. In this case, the parameter’s standard deviation and the output variance are shown in Table 3, where the best result is shown in blue and the worst in orange. The best of the best results, either in Table 1 and Table 2, are highlighted in green.
Analyzing Table 3, it is possible to notice that the parameters’ standard deviation is 1000 times smaller than those obtained in [4]. The battery voltage output variance is very similar compared to [4] in all experiments; however, the estimated parameters are 1000 times more accurate using the two outputs nonlinear grey box model.
In summary, considering the best results in Table 1, Table 2 and Table 3, it is possible to conclude that the best experiment to identify the batteries’ mathematical model parameters with the two outputs nonlinear grey box model is “30 s high 1 m low”. In other words, with the experiment “30 s high 1 m low” and with the two outputs nonlinear grey box model, it was possible to achieve a 1000 times better accuracy in the battery model parameters estimation applied on electric forklifts.
4. Two-Outputs Nonlinear Grey Box Model Estimated with the Best Experiment Design
In this section, the two-output nonlinear grey box models will be presented in detail. The following estimations will be carried out with the best experiment, defined in Section 3, with 40% of SOC. The initial parameters were calculated according [2] and the initial states were estimated using the nonlinear least squares method. The fit to estimation data was 69.61% related to the battery voltage () and 94.86% related to the state of charge (). The initial state results are:
It is important to mention that the initial state of charge estimated by the nonlinear least squares method was very close to the state of charge calculated using the coulomb counting algorithm. This new approach with two outputs aims to solve a problem presented in [4], where the nonlinear least squares optimization method used to estimate the initial states resulted in 29.17% of SOC, while the experiments were made with 40% of SOC, measured by the coulomb counting algorithm.
As described in Section 2.2, it is possible to define the weight given to each output when identifying the battery parameters. In this case, it is necessary to initially identify the model parameters with equal weights in the two outputs, calculate their variances, and then identify the model parameters again with the inverse of the variance in each output, as shown in Figure 2. Table 4 presents a model result comparison without the outputs’ weight and with the outputs’ weight.
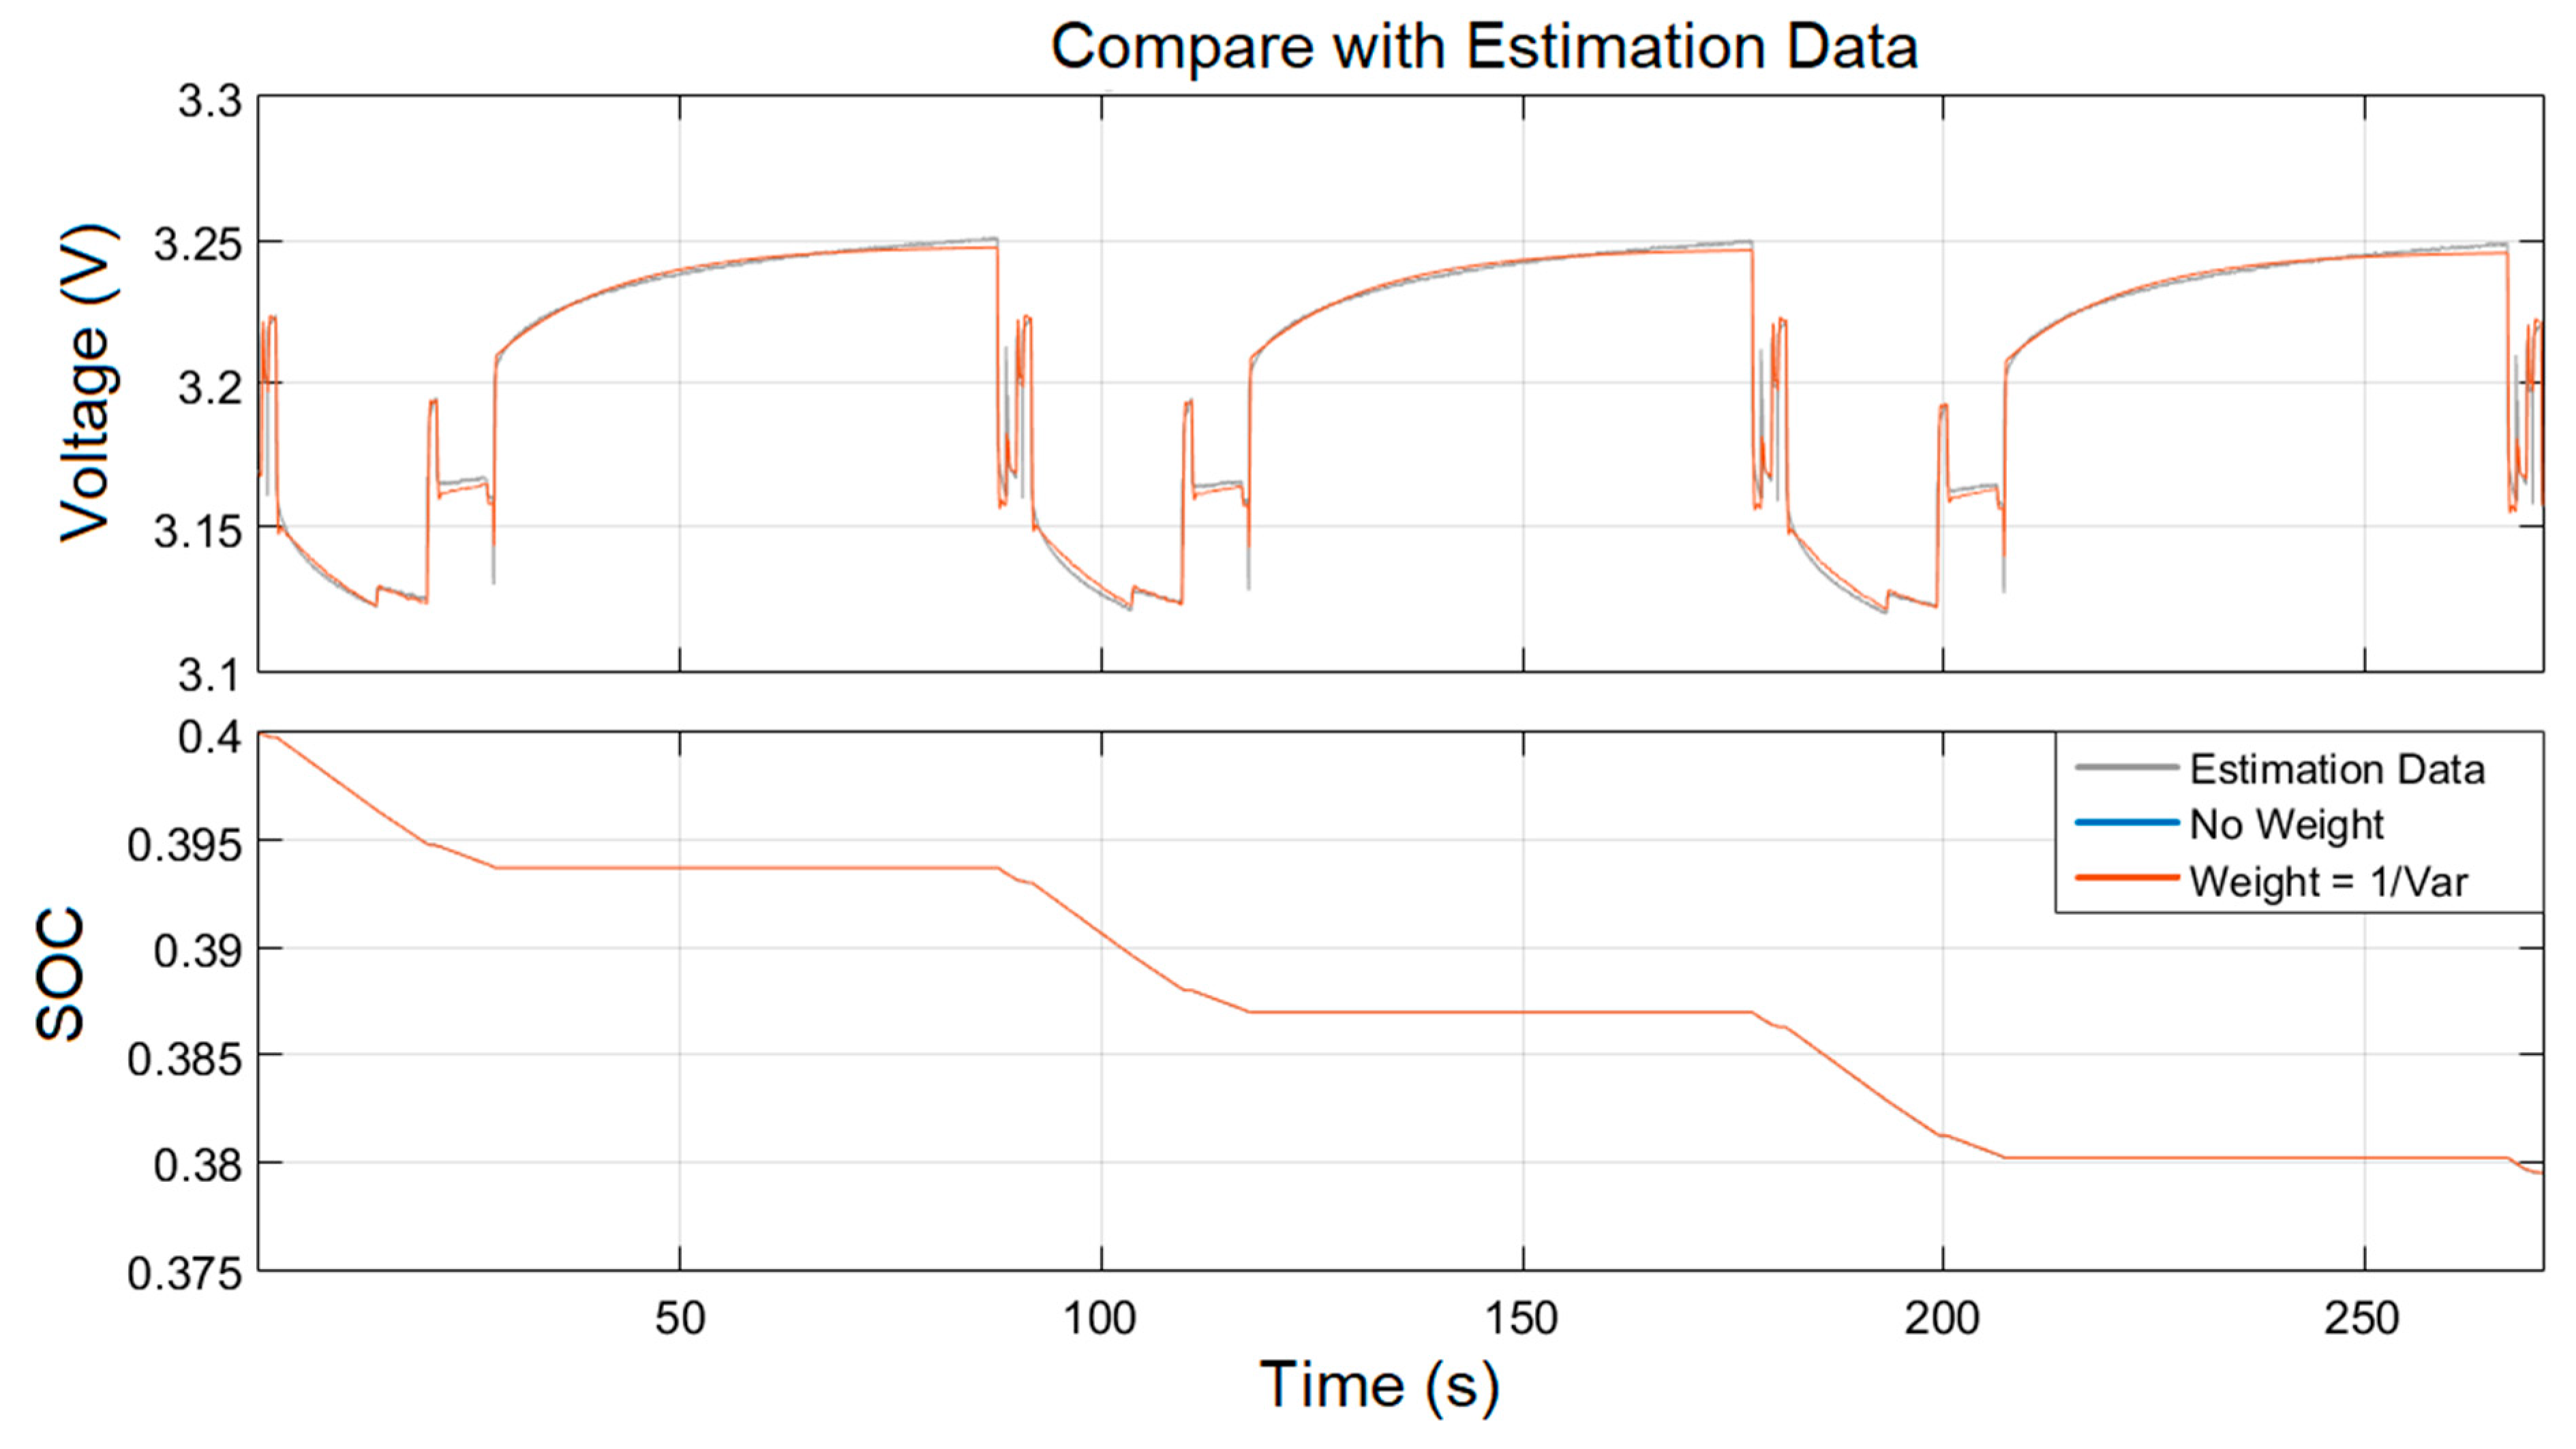
Analyzing Table 4, the adjustment with the estimation data obtained the same result, regardless of the fit to estimation without weight or with weight. Regarding the parameters’ standard deviation, only parameter did not obtain a decrease in its deviation when estimated with output weight. On the other hand, the output variance also obtained a better result in the second estimation, with output weight. In other words, in general, the estimation performed with output weight obtained better results, increasing the model accuracy. It is possible to perform a result visual inspection with the estimation data through Figure 5. It is important to mention that the SOC value in the parameter estimation algorithms is used on a scale of 0 to 1, that is, the SOC presented by the next figures will be represented by values from 0 to 1, where 0 means 0% and 1 means 100%.
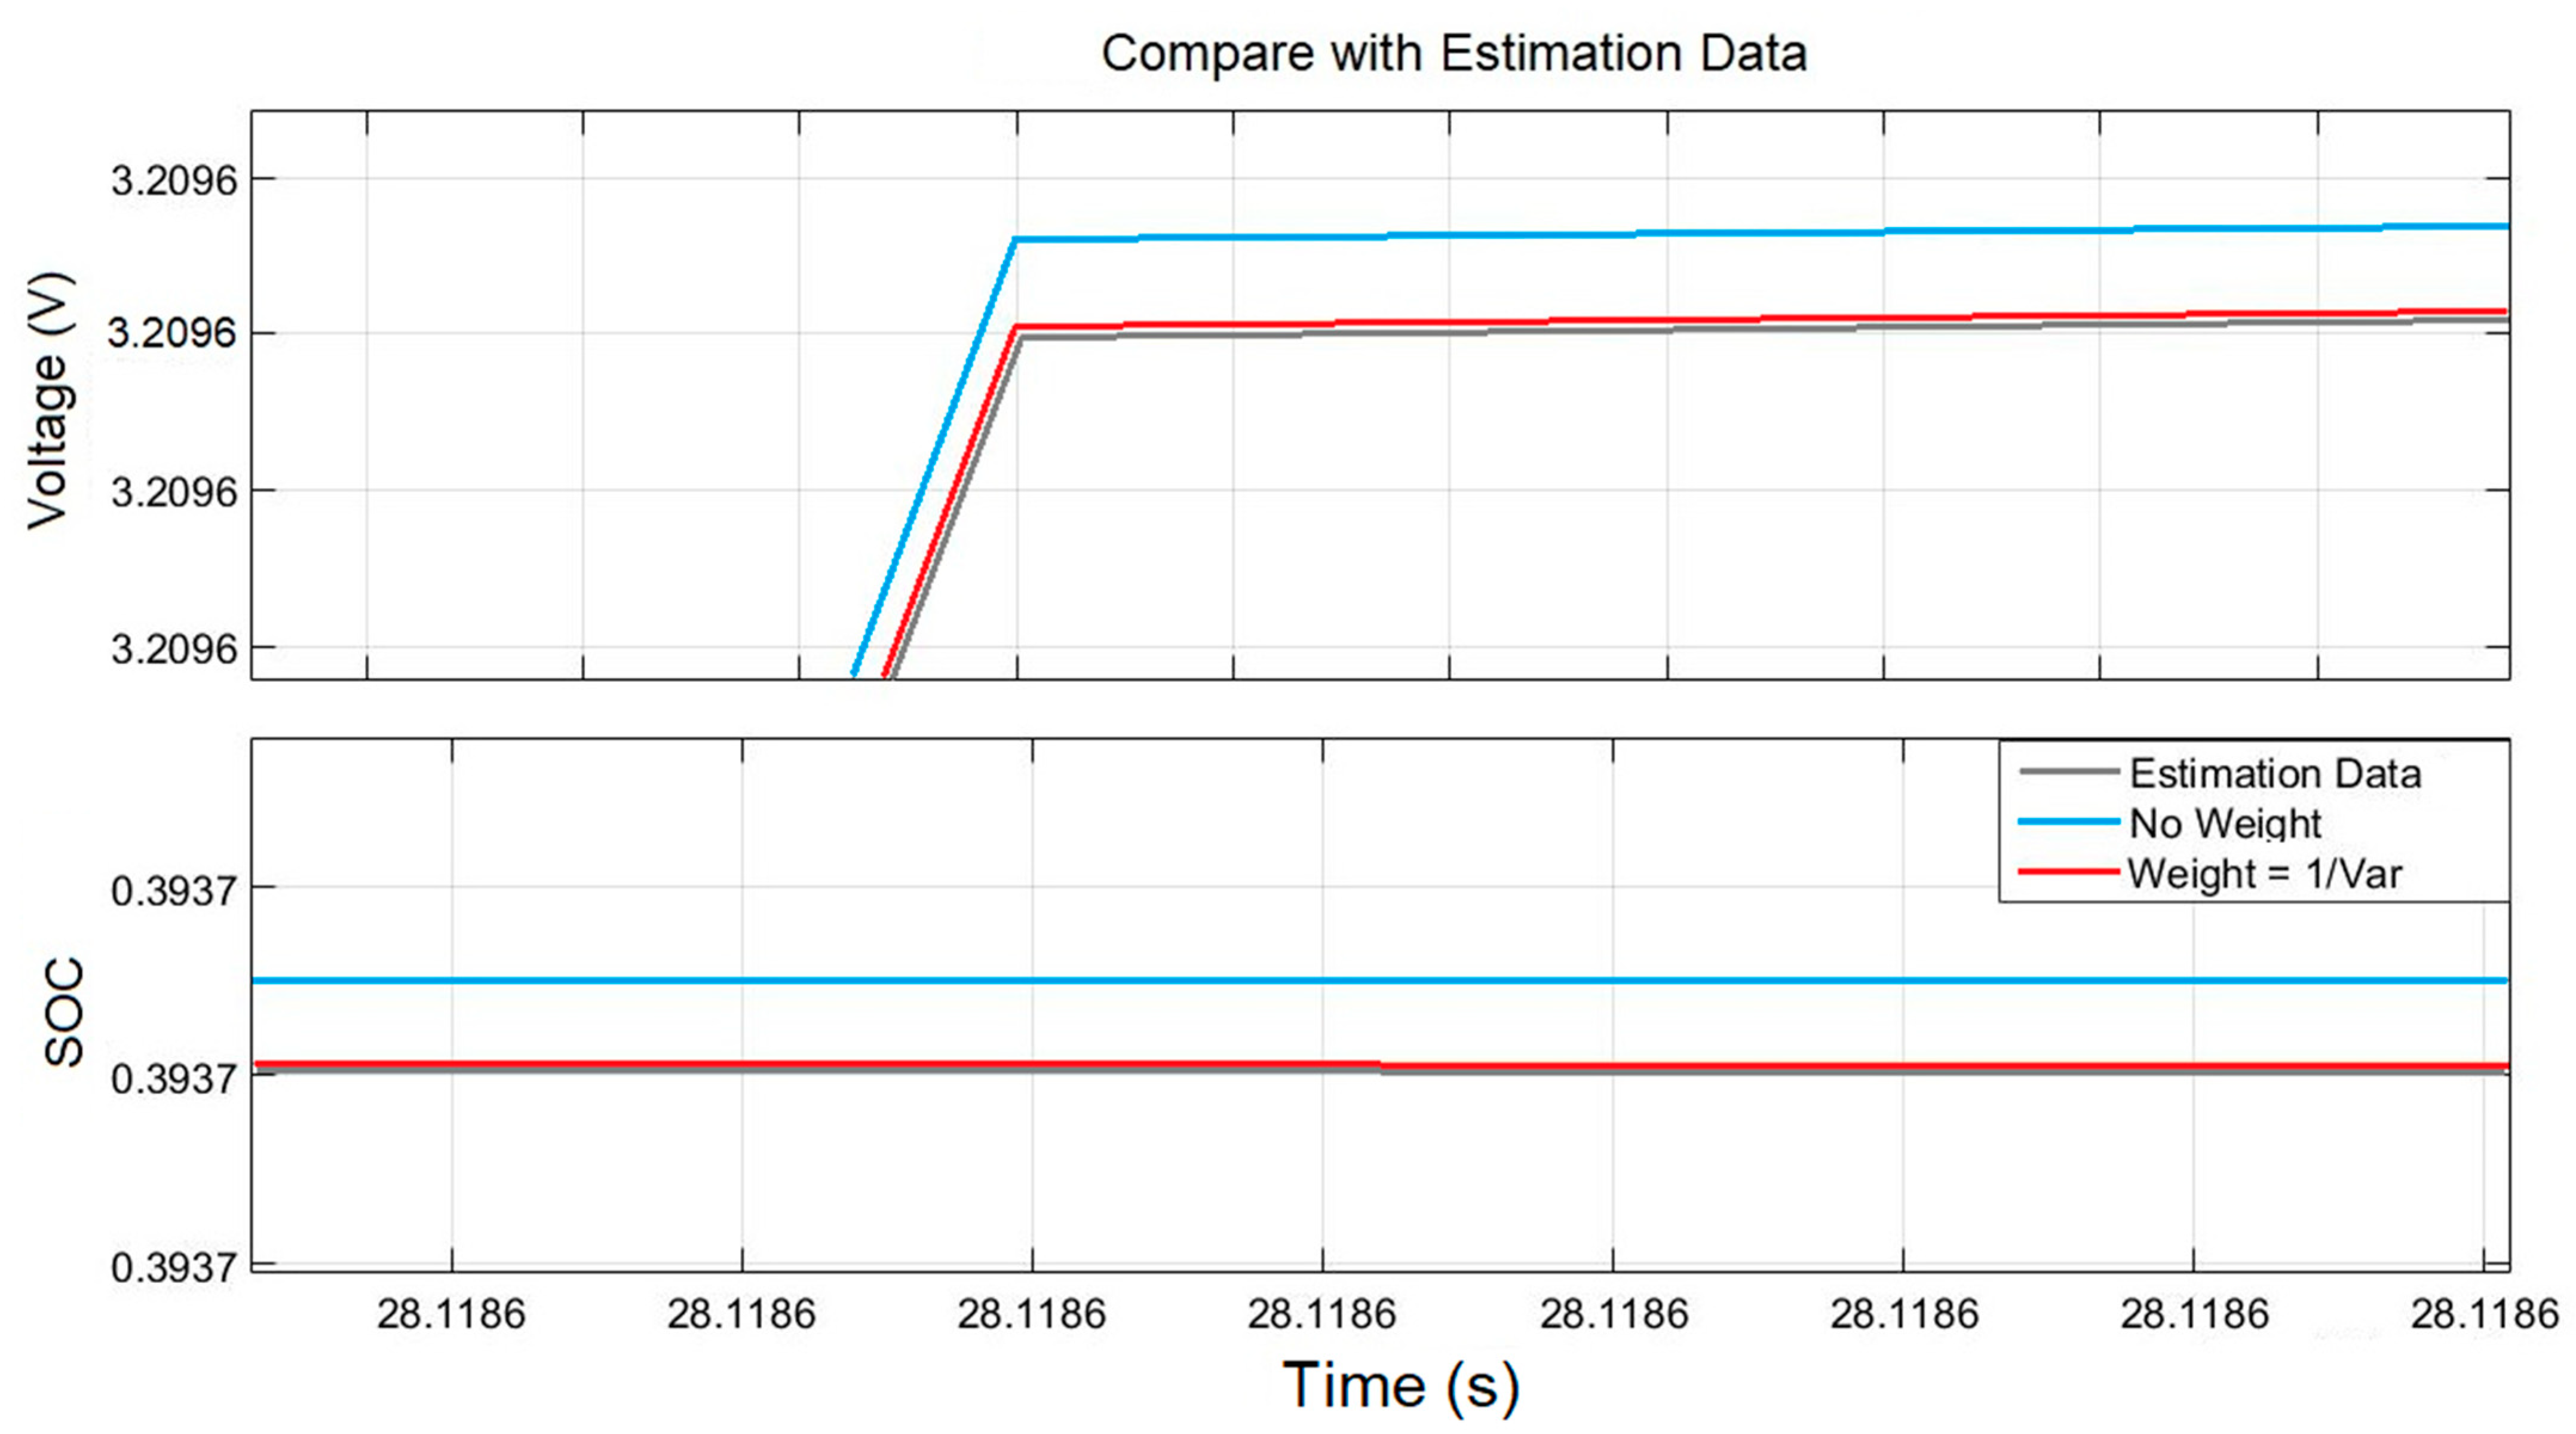
It is possible to observe that the model result estimated without weight and with weight have very similar values. To facilitate the comparison between the magnitudes, Figure 6 shows the signal part details, enlarged.
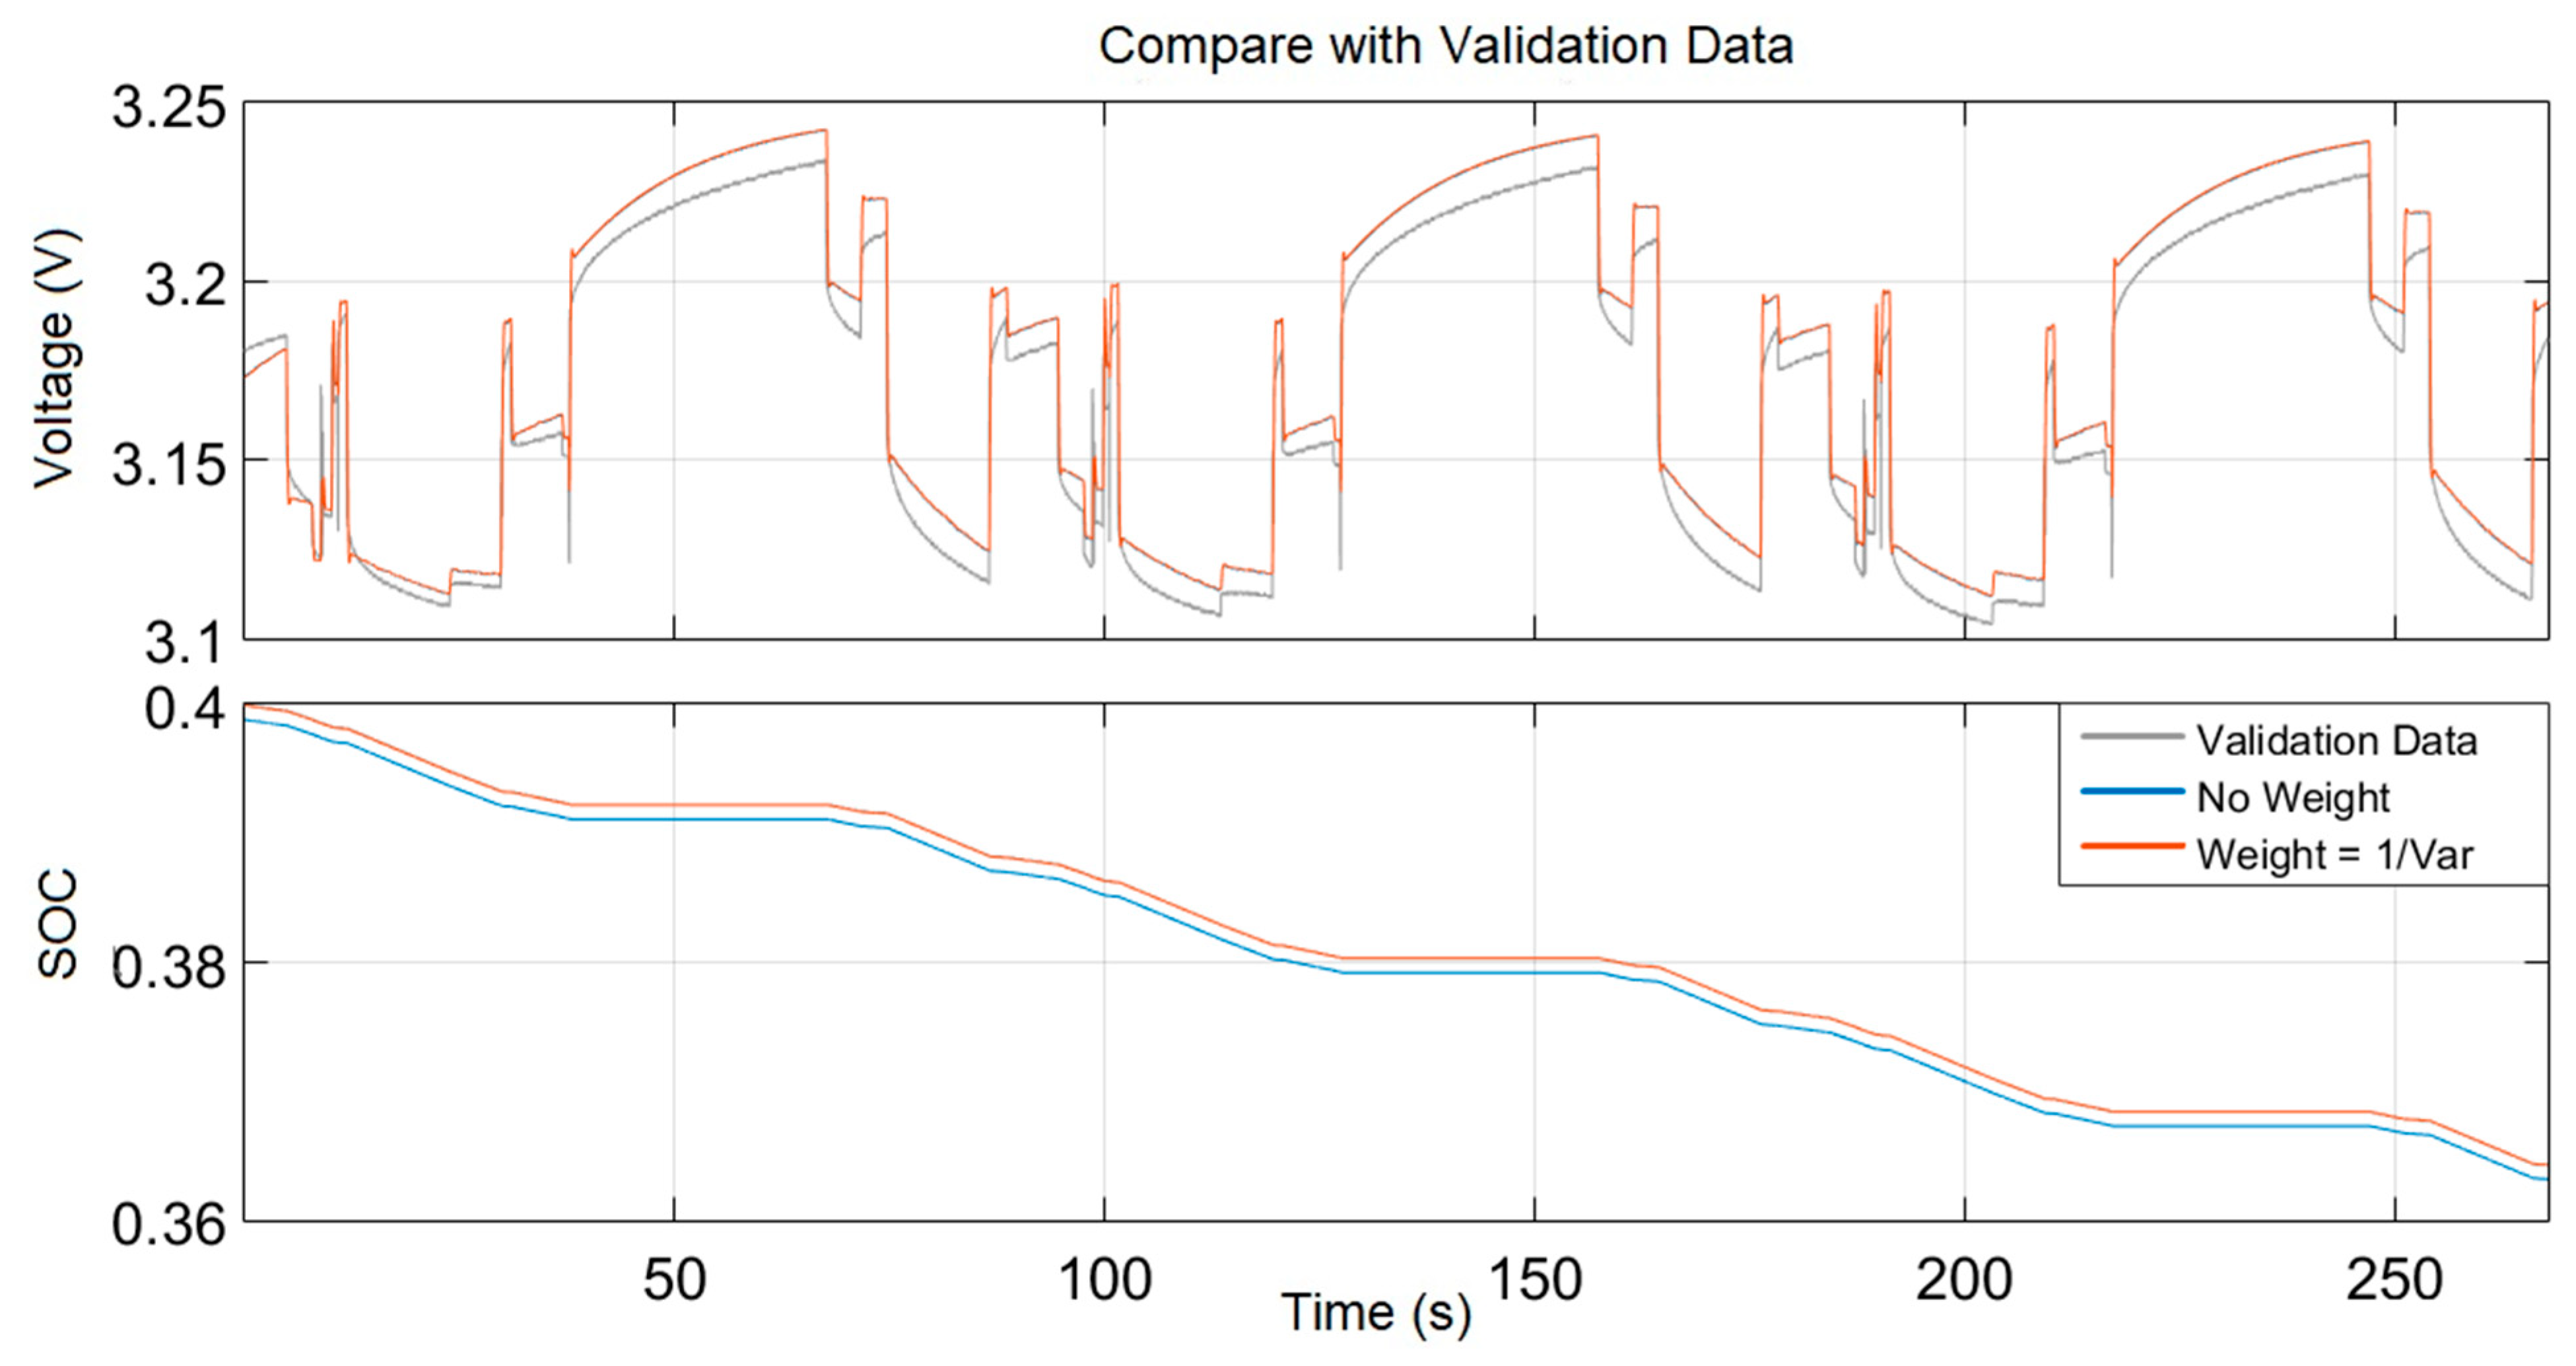
However, it is necessary to validate the model with different data used for estimation. In this case, the validation data chosen was the experiment “1 m high 30 s low”, because according to Table 1, this experiment presents the worst fit result for the model estimated with the experiment “30 s high 1 m low”, so we will validate the model in its worst case. Figure 7 presents the comparison with the validation data; the fit result related to the battery voltage was 78.9% (without weight) and 78.6% (with weight). The fit result related to the state of charge (the main objective of this work) was 89% (without weight) and 99.7% (with weight).
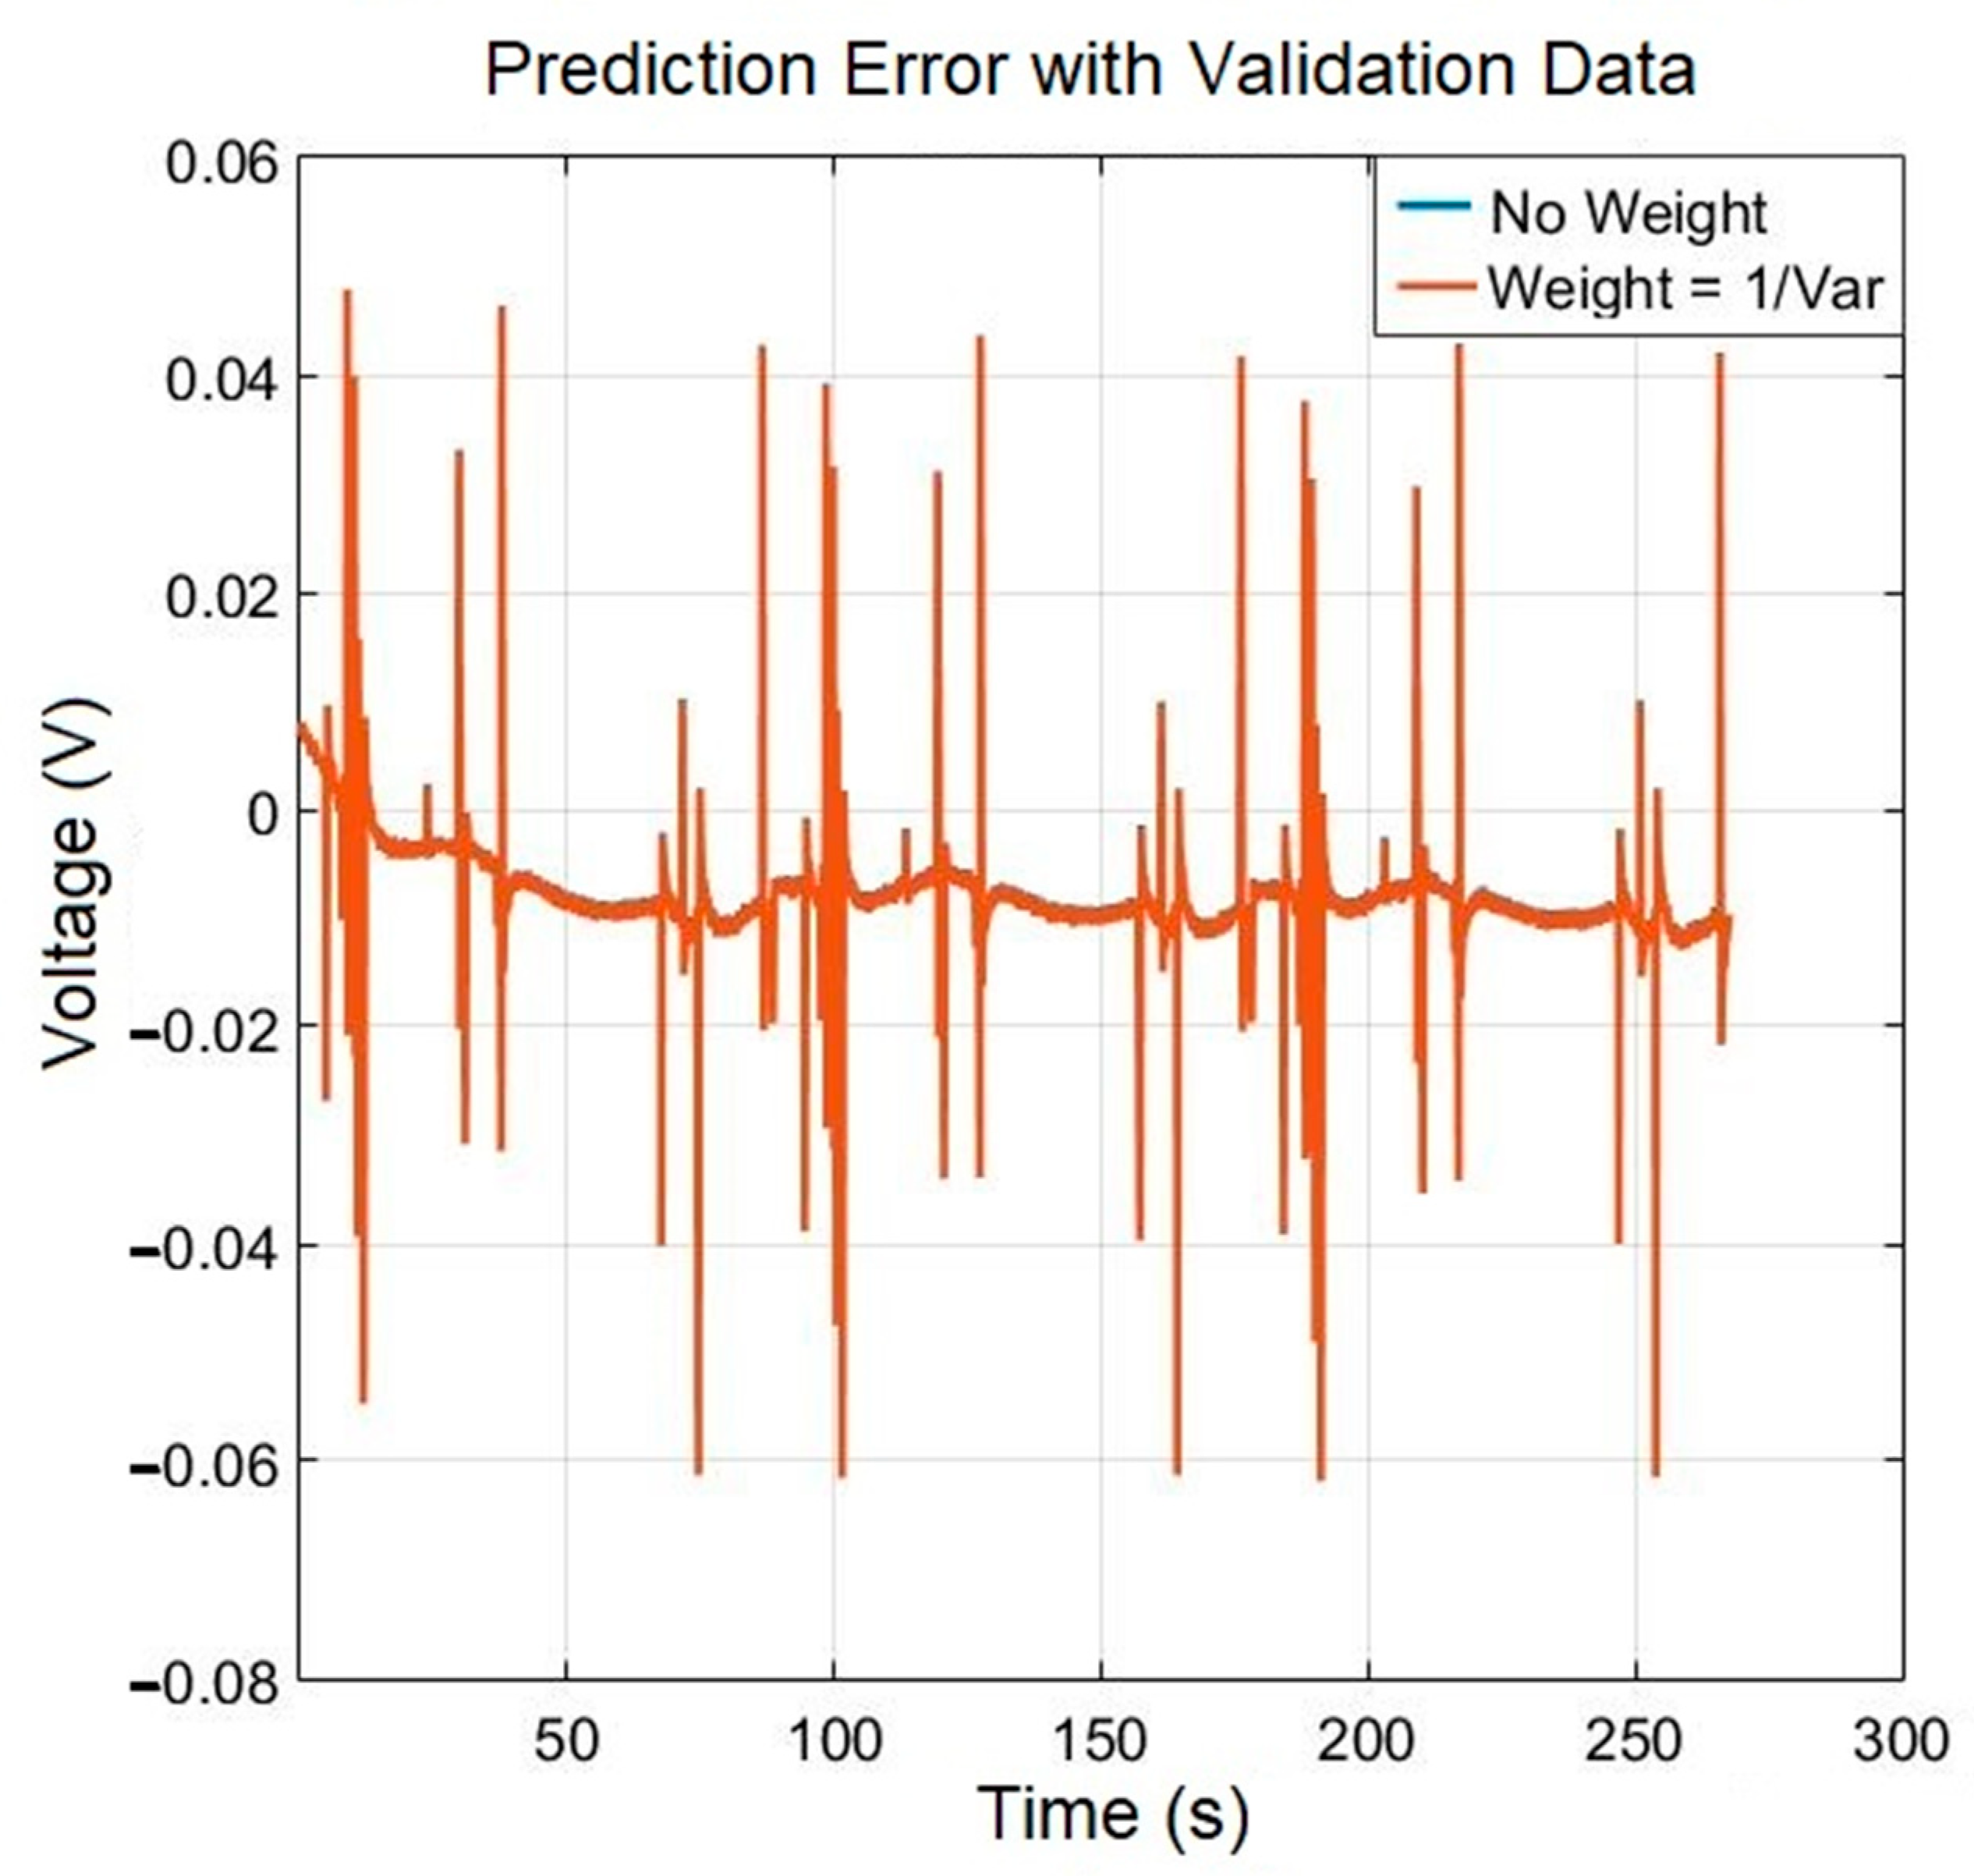
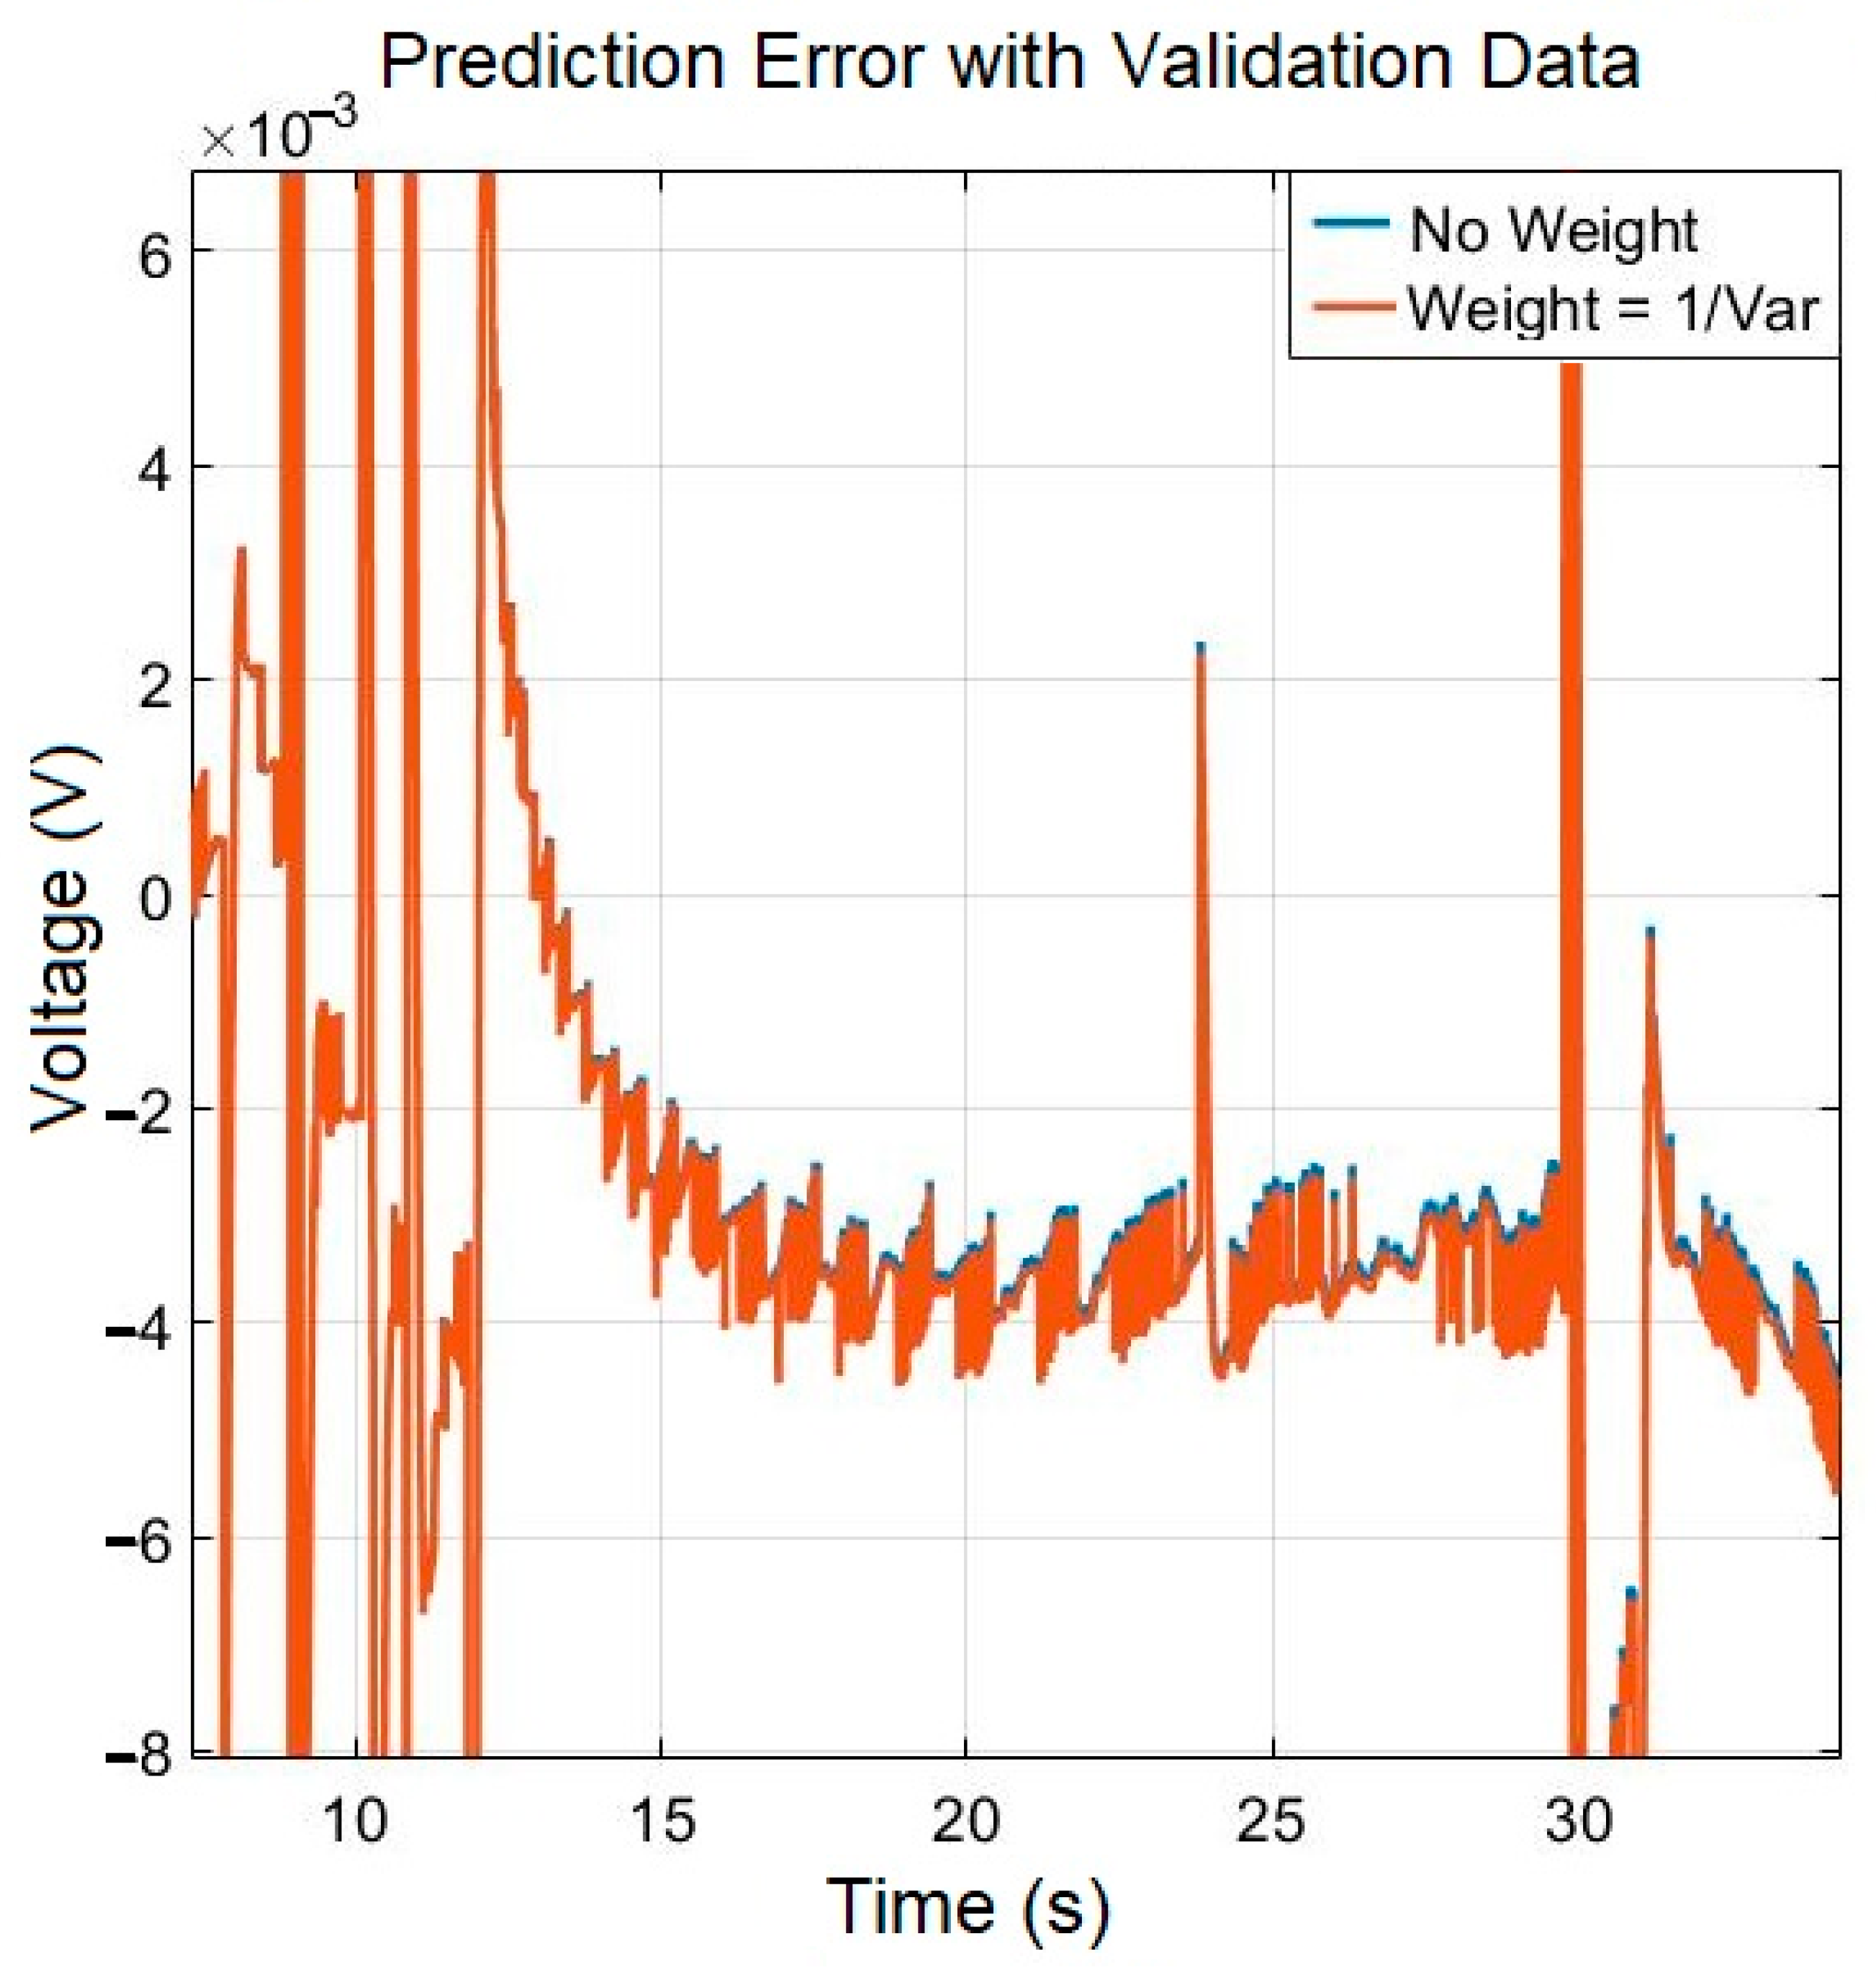
Analyzing Figure 7, it is possible to visualize the difference between the estimated model state of charge result without output weight and with output weight, with approximately 10% difference. Regarding the battery voltage, the difference between the estimated model result with weight and without weight is only 0.3%. The prediction error between the measured battery voltage and the estimated battery voltage is shown in Figure 8.
Analyzing Figure 8, it is possible to notice that the general error is 60 mV maximum, which confirms a good model accuracy, even with the worst data set as input for validation. It is possible to observe that the model-estimated prediction error without weight and with weight have very similar values. To facilitate the comparison of the magnitudes, Figure 9 shows the signal part details, enlarged, and Table 5 presents the mean and the RMS (root mean square) values in order to facilitate the comparison of the magnitudes with/without weights.
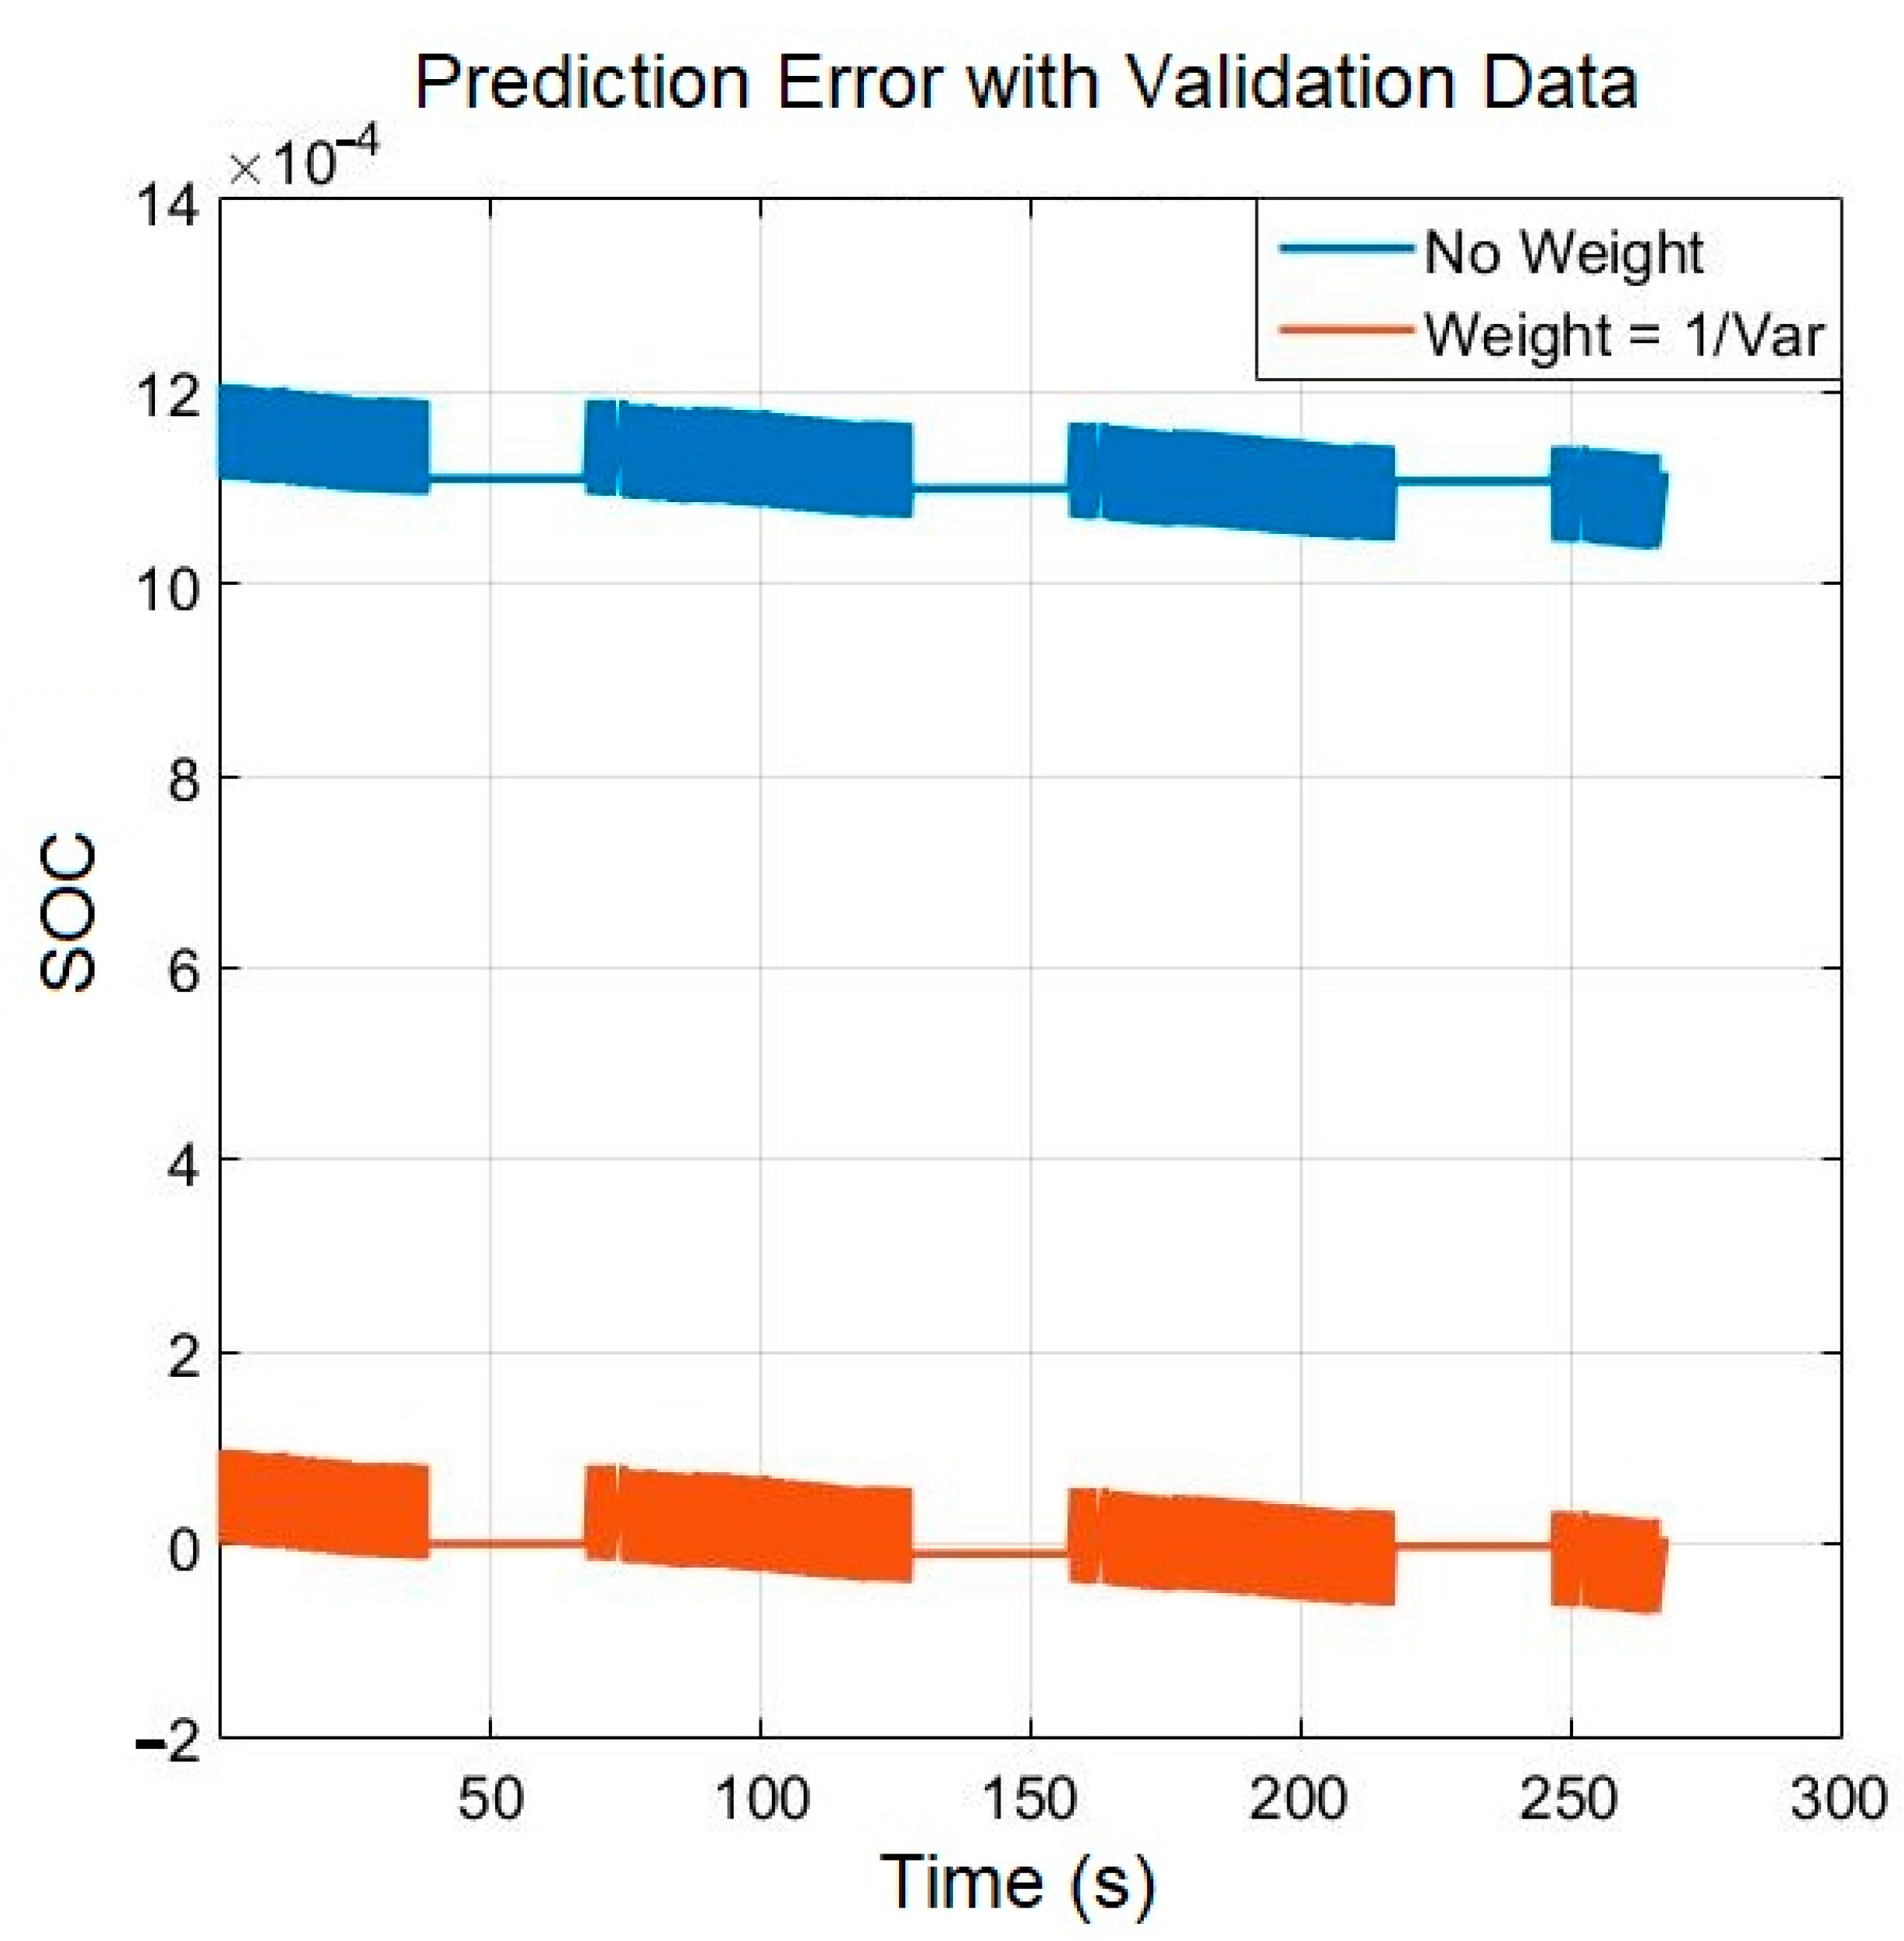
It is possible to notice that although there is an improvement, the difference between the results with weight and without weight regarding the battery voltage is not very significant. Nevertheless, when we analyze the prediction error regarding the state of charge we arrive at interesting results. The prediction error between the state of charge calculated by coulomb counting and the state of charge estimated by the model is shown in Figure 10 and Table 6 presents the mean and RMS values.
Analyzing Figure 10 and Table 6, it is possible to notice some differences between the error result with the model estimated without weight and with weight. The larger prediction error, in the case without weight, shows that the state of charge calculated by the model has some bias, or some influence on other parameters or phenomena. Although the differences are relatively small, the presence of a certain DC level in the estimation may induce larger errors given the SOC integrative nature. Therefore, the proposed adjustment in the output weight improves the SOC estimate, with a lower prediction error, strengthening the idea of defining specific weights between the two outputs of the model.
Thus, it can be stated that the nonlinear grey box model with two outputs, and with specific output weights, estimated with the best experiment, was properly validated.
It was possible to perform the parameter identification procedure at all SOC points, resulting in the parameters shown in Table 7.
In the worst case, the model reached 78.6% of accuracy related to the battery voltage and 99.7% related to the state of charge. Additionally, in the worst case, the model presents a 60 mV maximum error related to the battery voltage, as shown in Figure 8, and a maximum of 0.01% related to the state of charge, as shown in Figure 10.
5. Conclusions
In this paper, a new approach for a nonlinear grey box battery model was presented. The model presented here has two outputs, with the battery voltage as the first output and the state of charge as the second output. The second output was added to solve a previous problem regarding the initial state’s accurate estimation for the nonlinear grey box model in any experimental design. The best experiment design was defined by comparing the results of seven different experiments, each one designed based on the electric forklift scenario. The experiments have different input current amplitudes and periods, representing different types of electric forklift usage. The best experiment design was the experiment with 30 s of current pulses and 1 min of battery rest. With this experiment, it was possible to represent different levels of the battery dynamics, and the model estimated with this experiment was capable of fitting, with good accuracy, in different validation data sets.
For the identified model parameters to be of the greatest precision and non-biased, a strategy was developed for defining model output weights. In other words, the parameters were identified considering a greater weight in the output in which the system has greater confidence. The strategy of adding a second output to the model resulted in 1000 times better accuracy in the model parameter’s standard deviation and the strategy of different weights in the outputs resulted in a non-biased model.
As future work, it is intended to implement a battery SOC estimation (with the model approach developed in this paper) to be used on an actual electric forklift BMS.
Author Contributions
Conceptualization, R.E.A., E.L.P. and C.T.d.S.; methodology, C.T.d.S., R.E.A. and E.L.P.; software, B.M.d.A.D.; validation, R.E.A., E.L.P. and A.A.M.L.; formal analysis, E.L.P. and R.E.A.; investigation, C.T.d.S. and B.M.d.A.D.; resources, R.E.A., E.L.P. and A.A.M.L.; data curation, B.M.d.A.D.; writing—original draft preparation, C.T.d.S.; writing—review and editing, E.L.P. and R.E.A.; visualization, B.M.d.A.D.; supervision, R.E.A. and E.L.P.; project administration, A.A.M.L.; funding acquisition, A.A.M.L. All authors have read and agreed to the published version of the manuscript.
Funding
This study was financed in part by the “Coordenação de Aperfeiçoamento de Pessoal de Nível Superior—Brazil (CAPES)—Finance Code 001”. This paper was partially supported by the “Fundação de Desenvolvimento da Pesquisa (FUNDEP) Rota 2030/Linha V under grant 27192/27. The participation of Rui Esteves Araújo in this work was financed by National Funds through the Portuguese funding agency, FCT—Fundação para Ciência e a Tecnologia, within project UIDB/50014/2020.
Data Availability Statement
The data presented in this study are available on request from the first author.
Conflicts of Interest
The authors declare no conflict of interest.
Nomenclature
| Symbol: | |
| BMS | Battery Management System |
| y-intercept parameter | |
| parameter slope of the linear approximation | |
| Battery Equivalent Circuit Capacitor | |
| Battery nominal capacity | |
| ECM | Equivalent Circuit Models |
| NLGR | Nonlinear Grey Box model |
| OCV | Open Circuit Voltage |
| Battery Equivalent Circuit Resistors | |
| RC | Resistor/Capacitor circuit |
| SOC | State of Charge |
| Open circuit voltage | |
| Battery total voltage (V) | |
| A | State matrix |
| B | Input matrix |
| C | Output matrix |
| D | Feedforward matrix |
| I(t) | Applied current vector (A) |
| soc(t) | State of charge vector |
| u(t) | Input vector |
| Voltage drop in Resistor/Capacitor circuit | |
| Battery total voltage (V) | |
| State vectors | |
| State vector derivative | |
| Observed and model output vector |
References
- Kusiak, R.S. Lifetime Mathematical Modelling of Polymer Lithium-Ion Batteries Based on Hybrid Models Considering Variable Discharge Currents. Master’s Thesis, Regional Northwest University of Rio Grande do Sul State, Rio Grande do Sul, Brazil, 2016; 87p. [Google Scholar]
- Xin, M.; Lian, X.; Gao, X.; Xu, P.; Li, W.; Dong, F.; Zhang, A.; Xie, H.; Liu, Y. Enabling High-Capacity Li Metal Battery with PVDF Sandwiched Type Polymer Electrolyte. J. Colloid Interface Sci. 2023, 629, 980–988. [Google Scholar] [CrossRef] [PubMed]
- Wang, C.Y.; Liu, T.; Yang, X.G.; Ge, S.; Stanley, N.V.; Rountree, E.S.; Leng, Y.; McCarthy, B.D. Fast Charging of Energy-Dense Lithium-Ion Batteries. Nature 2022, 611, 485–490. [Google Scholar] [CrossRef] [PubMed]
- Da Silva, C.T.; Dias, B.M.d.A.; Araújo, R.E.; Pellini, E.L.; Laganá, A.A.M. Battery Model Identification Approach for Electric Forklift Application. Energies 2021, 14, 6221. [Google Scholar] [CrossRef]
- Abada, S.; Marlair, G.; Lecocq, A.; Petit, M.; Sauvant-Moynot, V.; Huet, F. Safety focused modeling of lithium-ion batteries: A review. J. Power Sources 2015, 306, 178–192. [Google Scholar] [CrossRef]
- Ljung, L. System Identification. Theory for the User, 2nd ed.; Prentice Hall: Hoboken, NJ, USA, 1999; ISBN 0-13-656695-2. [Google Scholar]
- Allafi, W.; Zhang, C.; Uddin, K.; Worwood, D.; Dinh, T.Q.; Ormeno, P.A.; Li, K.; Marco, J. A lumped thermal model of lithium-ion battery cells considering radiative heat transfer. Appl. Therm. Eng. 2018, 143, 472–481. [Google Scholar] [CrossRef] [Green Version]
- Navid, Q.; Hassan, A. An accurate and precise grey box model of a low-power lithium-ion battery and capacitor/supercapacitor for accurate estimation of state-of-charge. Batteries 2019, 5, 50. [Google Scholar] [CrossRef] [Green Version]
- Khalfi, J.; Boumaaz, N.; Soulmani, A.; Laadissi, E.M. Box-Jenkins black-box modeling of a lithium-ion battery cell based on automotive drive cycle data. World Electr. Veh. J. 2021, 12, 102. [Google Scholar] [CrossRef]
- Zheng, D.; Wang, H.; An, J.; Chen, J.; Pan, H.; Chen, L. Real-Time Estimation of Battery State of Charge with Metabolic Grey Model and LabVIEW Platform. IEEE Access 2018, 6, 13170–13180. [Google Scholar] [CrossRef]
- Peng, J.; Luo, J.; He, H.; Lu, B. An improved state of charge estimation method based on cubature Kalman filter for lithium-ion batteries. Appl. Energy 2019, 253, 113520. [Google Scholar] [CrossRef]
- Hu, X.; Zou, C.; Zhang, C.; Li, Y. Technological developments in batteries: A survey of principal roles, types, and management needs. IEEE Power Energy Mag. 2017, 15, 20–31. [Google Scholar] [CrossRef]
- Hu, X.; Li, S.; Peng, H. A Comparative study of equivalent circuit models for li-ion batteries. J. Power Sources 2012, 198, 359–367. [Google Scholar] [CrossRef]
- Feng, T.; Yang, L.; Zhao, X.; Zhang, H.; Qiang, J. Online identification of lithium-ion battery parameters based on an improved equivalent-circuit model and its implementation on battery state-of-power prediction. J. Power Sources 2015, 281, 192–203. [Google Scholar] [CrossRef]
- Sun, X.; Ji, J.; Ren, B.; Xie, C.; Yan, D. Adaptive forgetting factor recursive least square algorithm for online identification of equivalent circuit model parameters of a lithium-ion battery. Energies 2019, 12, 2242. [Google Scholar] [CrossRef] [Green Version]
- Meng, J.; Boukhnifer, M.; Diallo, D. Lithium-Ion battery monitoring and observability analysis with extended equivalent circuit model. In Proceedings of the 2020 28th Mediterranean Conference on Control and Automation (MED), Saint-Raphael, France, 15–18 September 2020. [Google Scholar] [CrossRef]
- Wang, J.; Jia, Y.; Yang, N.; Lu, Y.; Shi, M.; Ren, X.; Lu, D. Precise equivalent circuit model for Li-ion battery by experimental improvement and parameter optimization. J. Energy Storage 2022, 52, 104980. [Google Scholar] [CrossRef]
- Yang, Z.; Wang, X. An improved parameter identification method considering multi-timescale characteristics of lithium-ion batteries. J. Energy Storage 2023, 59, 106462. [Google Scholar] [CrossRef]
- Guo, R.; Shen, W. A review of equivalent circuit model based online state of power estimation for lithium-ion batteries in electric vehicles. Vehicles 2022, 4, 1–29. [Google Scholar] [CrossRef]
- Naseri, F.; Schaltz, E.; Stroe, D.-I.; Gismero, A.; Farjah, E. An enhanced equivalent circuit model with real time parameter identification for battery state of charge estimation. IEEE Trans. Ind. Electron. 2022, 69, 3743–3751. [Google Scholar] [CrossRef]
- Peng, X.; Yin, J.; Sun, L.; Ye, Z.; Wei, T. Parameter identification of lithium-ion battery equivalent circuit model based on limited memory recursive least squares algorithm with variable forgetting factor. J. Phys. Conf. Ser. 2022, 2246, 012090. [Google Scholar] [CrossRef]
- Santoro, P.A. An Impedance Spectrum Analysis Using the Poisson-Nersnt-Planck Model with Anomalous Diffusion. Doctoral Thesis, Maringá State University, Maringá, Brazil, 2014. Graduate Program in Physics. 86p. [Google Scholar]
- Saidani, F.; Hutter, F.X.; Scurtu, R.G.; Braunwarth, W.; Burghartz, J.N. Lithium-ion Battery Models: A Comparative Study and Model-Based Powerline Communication. Adv. Radio Sci. 2017, 15, 83–91. [Google Scholar] [CrossRef] [Green Version]
- Yang, Z.; Li, K.; Foley, A.; Zhang, C. A New Self-Learning TLBO Algorithm for RBF Neural Modelling of Batteries in Electric Vehicles. In Proceedings of the IEEE Congress on Evolutionary Computation (CEC), Beijing, China, 6–11 July 2014. [Google Scholar] [CrossRef]
Figure 1.
Equivalent circuit model for a lithium-ion battery pack.

Figure 2.
System identification strategy for battery modeling based on different output weights.

Figure 3.
Flowchart of implemented algorithm.

Figure 4.
Test bench with BMS.

Figure 5.
Comparison of the two outputs of the nonlinear grey box model estimation data with the best experiment.
Figure 5.
Comparison of the two outputs of the nonlinear grey box model estimation data with the best experiment.

Figure 6.
Comparison with the two-outputs nonlinear grey box model estimation data with the best experiment—amplified signal.
Figure 6.
Comparison with the two-outputs nonlinear grey box model estimation data with the best experiment—amplified signal.

Figure 7.
Comparison of the two-outputs nonlinear grey box model validation data with the best experiment.
Figure 7.
Comparison of the two-outputs nonlinear grey box model validation data with the best experiment.

Figure 8.
Prediction error regarding battery voltage.

Figure 9.
Prediction error regarding battery voltage—amplified signal.

Figure 10.
Prediction error regarding state of charge.


Table 1.
Comparison between all experiment’s designs, related to estimation and validation data, considering the output .
Table 1.
Comparison between all experiment’s designs, related to estimation and validation data, considering the output .
| Estimation Data in 40% of SOC | Fit to Validation Data in 40% of SOC | ||||||
|---|---|---|---|---|---|---|---|
| 30 s of Battery Rest | 18 s of Battery Rest | 5 s of Battery Rest | 1 m HIGH 30 s LOW | 30 s HIGH 30 s LOW | 30 s HIGH 1 m LOW | OCV with 1 h of Rest | |
| 30 s of battery rest | 93.03% | 88.07% | 76.45% | 58.27% | 73.45% | 84.00% | 37.32% |
| 18 s of battery rest | 87.10% | 91.99% | 79.39% | 65.05% | 78.18% | 83.12% | 35.52% |
| 5 s of battery rest | 69.26% | 79.89% | 87.60% | 74.02% | 82.06% | 72.92% | 30.84% |
| 1 m HIGH 30 s LOW | 61.84% | 64.40% | 62.91% | 90.57% | 82.83% | 75.30% | 38.09% |
| 30 s HIGH 30 s LOW | 70.24% | 73.56% | 75.56% | 82.63% | 89.56% | 84.10% | 40.40% |
| 30 s HIGH 1 m LOW | 82.36% | 83.04% | 79.91% | 78.60% | 86.12% | 90.47% | 44.89% |
| OCV with 1 h of rest | 39.43% | 31.14% | 31.13% | 52.64% | 57.28% | 46.77% | 72.97% |
Table 2.
Comparison between all experiment’s designs, related to estimation and validation data, considering the output .
Table 2.
Comparison between all experiment’s designs, related to estimation and validation data, considering the output .
| Estimation Data in 40% of SOC | Fit to Validation Data in 40% of SOC | ||||||
|---|---|---|---|---|---|---|---|
| 30 s of Battery Rest | 18 s of Battery Rest | 5 s of Battery Rest | 1 m HIGH 30 s LOW | 30 s HIGH 30 s LOW | 30 s HIGH 1 m LOW | OCV with 1 h of Rest | |
| 30 s of battery rest | 99.53% | 99.41% | 99.31% | 99.71% | 99.49% | 99.53% | 99.93% |
| 18 s of battery rest | 99.50% | 99.43% | 99.29% | 99.64% | 99.47% | 99.49% | 99.92% |
| 5 s of battery rest | 99.48% | 99.40% | 99.32% | 99.73% | 99.51% | 99.53% | 99.91% |
| 1 m HIGH 30 s LOW | 99.43% | 99.36% | 99.27% | 99.74% | 99.50% | 99.50% | 99.93% |
| 30 s HIGH 30 s LOW | 99.51% | 99.41% | 99.31% | 99.74% | 99.51% | 99.53% | 99.94% |
| 30 s HIGH 1 m LOW | 99.50% | 99.36% | 99.30% | 99.70% | 99.48% | 90.56% | 99.79% |
| OCV with 1 h of rest | 99.53% | 99.42% | 99.31% | 99.74% | 99.51% | 99.51% | 99.97% |
Table 3.
Estimated initial states, standard deviation, and output variance of all experiment designs.
Table 3.
Estimated initial states, standard deviation, and output variance of all experiment designs.
| Estimation Data in 40% of SOC | Standard Deviation | Output Variance | |||
|---|---|---|---|---|---|
| 30 s of battery rest | 7.63 | ||||
| 18 s of battery rest | 9.16 | ||||
| 5 s of battery rest | 18.59 | ||||
| 1 m HIGH 30 s LOW | 6.23 | ||||
| 30 s HIGH 30 s LOW | 9.82 | ||||
| 30 s HIGH 1 m LOW | 7.56 | ||||
| OCV with 1 h of rest | 18.31 | ||||
Table 4.
Comparison between the first estimation without weight and the second estimation with weight in the outputs.
Table 4.
Comparison between the first estimation without weight and the second estimation with weight in the outputs.
| First Estimation (Without Outputs’ Weight) | ||||||
|---|---|---|---|---|---|---|
| Fit to estimation | Standard deviation | Output variance | ||||
| (mΩ) | (mΩ) | (F) | (mV) | (%) | ||
| 90.47% | 99.56% | |||||
| Second Estimation (Weight = 1/Var) | ||||||
| Fit to estimation | Standard deviation | Output variance | ||||
| (mΩ) | (mΩ) | (F) | (mV) | (%) | ||
| 90.47% | 99.56% | |||||
Table 5.
Mean and RMS values of the prediction error (battery voltage).
| Prediction Error Regarding the Battery Voltage | |||
|---|---|---|---|
| Mean Value | RMS | ||
| Without Weight | With Weight | Without Weight | With Weight |
| −0.0078 | −0.0079 | 0.0093 | 0.0095 |
Table 6.
Mean and RMS values of the prediction error (state of charge).
| Prediction Error Regarding the State of Charge | |||
|---|---|---|---|
| Mean Value | RMS | ||
| Without Weight | With Weight | Without Weight | With Weight |
| 0.001115 | 0.000006 | 0.00111 | 0.00003 |
Table 7.
Battery parameters at all SOC points, estimated with the two-outputs nonlinear grey box model.
Table 7.
Battery parameters at all SOC points, estimated with the two-outputs nonlinear grey box model.
| SOC (%) | |||||
|---|---|---|---|---|---|
| 10 | 2.87 | 3.35 | 15.27 | 19.20 | 712.97 |
| 20 | 3.16 | 0.39 | 14.46 | 12.38 | 1102.95 |
| 30 | 3.18 | 0.32 | 14.23 | 10.91 | 1296.85 |
| 40 | 3.25 | 0.08 | 14.00 | 9.91 | 1443.59 |
| 50 | 3.28 | 0.01 | 13.84 | 9.16 | 1578.57 |
| 60 | 3.26 | 0.04 | 13.66 | 8.42 | 1645.65 |
| 70 | 3.15 | 0.23 | 13.59 | 8.36 | 1679.73 |
| 80 | 3.25 | 0.09 | 13.83 | 9.95 | 1628.80 |
| 90 | 3.31 | 0.01 | 13.99 | 9.60 | 1575.89 |
| 100 | 2.12 | 1.33 | 13.92 | 8.43 | 1512.54 |
Disclaimer/Publisher’s Note: The statements, opinions and data contained in all publications are solely those of the individual author(s) and contributor(s) and not of MDPI and/or the editor(s). MDPI and/or the editor(s) disclaim responsibility for any injury to people or property resulting from any ideas, methods, instructions or products referred to in the content. |
© 2023 by the authors. Licensee MDPI, Basel, Switzerland. This article is an open access article distributed under the terms and conditions of the Creative Commons Attribution (CC BY) license (https://creativecommons.org/licenses/by/4.0/).
Share and Cite
MDPI and ACS Style
da Silva, C.T.; Dias, B.M.d.A.; Araújo, R.E.; Pellini, E.L.; Laganá, A.A.M. Two-Outputs Nonlinear Grey Box Model for Lithium-Ion Batteries. Energies 2023, 16, 2218. https://doi.org/10.3390/en16052218
AMA Style
da Silva CT, Dias BMdA, Araújo RE, Pellini EL, Laganá AAM. Two-Outputs Nonlinear Grey Box Model for Lithium-Ion Batteries. Energies. 2023; 16(5):2218. https://doi.org/10.3390/en16052218
Chicago/Turabian Styleda Silva, Cynthia Thamires, Bruno Martin de Alcântara Dias, Rui Esteves Araújo, Eduardo Lorenzetti Pellini, and Armando Antônio Maria Laganá. 2023. "Two-Outputs Nonlinear Grey Box Model for Lithium-Ion Batteries" Energies 16, no. 5: 2218. https://doi.org/10.3390/en16052218
Note that from the first issue of 2016, this journal uses article numbers instead of page numbers. See further details here.