Article

Analysis of Energy Generation Efficiency and Reliability of a Cogeneration Unit Powered by Biogas

by
Józef Ciuła
1,
Sławomir Kowalski
1,
Agnieszka Generowicz
2,*,
Krzysztof Barbusiński
3,*,
Zbigniew Matuszak
4 and
Krzysztof Gaska
3
1
Faculty of Engineering Sciences, State University of Applied Sciences in Nowy Sącz, Zamenhofa 1A, 33-300 Nowy Sącz, Poland
2
Department of Environmental Technologies, Cracow University of Technology, Warszawska 24, 31-155 Cracow, Poland
3
Department of Water and Wastewater Engineering, Silesian University of Technology, Konarskiego 18, 44-100 Gliwice, Poland
4
Department of Mechanics, Maritime University of Szczecin, Willowa 71, 70-500 Szczecin, Poland
*
Authors to whom correspondence should be addressed.
Energies 2023, 16(5), 2180; https://doi.org/10.3390/en16052180
Submission received: 16 January 2023 / Revised: 17 February 2023 / Accepted: 22 February 2023 / Published: 24 February 2023
(This article belongs to the Special Issue Analysis of Cogeneration Systems and Electricity Consumption)

Abstract

:
Landfill gas recovery and utilisation is a solution which reduces the adverse environmental impact of the landfill. Combined heat and power (CHP) generation improves the energy balance of the facility and enables the optimal management of energy generated from a renewable source. This article aims to analyse the operation of the CHP unit in two aspects, that is, in terms of energy generation efficiency and operational availability. Energy ratios were calculated and the analysis was based on the Weibull distribution in order to assess the CHP unit’s operational reliability to minimise costs and maximise energy production. The results of the investigations and analyses demonstrated an increase of the gas yield by 29.5%, an increase of energy production by approx. 42%, and the reduction of downtime by 28.2% from 2018 to 2022. Studies related to the efficiency and reliability of operation of the cogeneration unit showed an increase in all the main parameters analysed, which resulted in greater energy and operational efficiency. The research which has been conducted is a significant scientific contribution to the optimisation of the “waste-to-energy” process for cogeneration units with the capacity of up to 0.5 MW.

1. Introduction

The process of municipal solid waste neutralisation at landfills is among the least recommended in the waste-handling hierarchy. This notwithstanding, the process is commonly used in many countries worldwide. When banning biodegradable waste storage at landfills, the European Union had in mind, among other factors, the adverse impact of landfills in terms of the atmospheric emissions of methane and carbon dioxide as primary greenhouse gases [1,2]. As a consequence of waste storage, waste waters come into being in the landfill bed. If these waste waters are not managed correctly, they may pose a hazard to human health if they penetrate into surface or groundwaters [3,4]. Landfill monitoring aims to check the quality of waters in the landfill area and, in particular, to protect individual and common water intakes [5,6]. In the waste bed, physical and chemical processes occur whose intensity depends on the morphology of waste being deposited including, in particular, the biodegradable fraction content [7]. As a consequence of these processes, the landfill as a civil structure becomes a bioreactor in which landfill gas (LFG) is generated, with methane and carbon dioxide being its main components [8,9]. This gas becomes a problem for landfill operators, in particular, in terms of an odour nuisance in the landfill area due to emissions into air. The solution most commonly used at landfills is the construction of a degassing plant to recover and neutralise this gas [10]. As LFG contains mainly methane (45–55%), it may be utilised for heat generation or in a combined process (combined heat and power or CHP) to generate electricity and heat [11,12]. LFG recovery and utilisation in a CHP system is the optimal solution, which reduces the environmental impact of the landfill as a facility [13]. This issue may be analysed in two aspects: in terms of energy, as the utilisation of a renewable fuel for energy generation and its use immediately at the landfill, and in terms of the environment, as a reduction of the emissions of a greenhouse gas, that being methane [14,15]. Municipal infrastructure facilities at a landfill, which are a waste neutralisation facility, as well as power engineering infrastructure, should be supervised to be ready to fulfil their function in the context of energy generation reliability. The extension and modernisation process must take place with the use of materials holding relevant certificates, and waste generated in the process should be managed in accordance with the waste disposal hierarchy pertaining to waste of a given type [16,17].
CHP systems at landfills should be subject to ongoing inspection and monitoring for the efficiency of energy generation and utilisation directly at the landfill. The lack of suitable supervision, operation records, and appropriate biogas combined heat and power plant personnel results in the plant’s inappropriate operation which, as a consequence, translates into the low efficiency of the conversion of landfill gas in a CHP and into small energy production [18,19]. The correct approach to the operation of such a system consists in the development of a correct procedure which governs the basic activities concerning the amount and quality of biogas recovered from the landfill, along with the monitoring of the basic energy ratios. The implementation of such a procedure will result in the reliable operation of the cogeneration system [20].
Research aimed at optimising the efficiency of energy production from renewable sources in CHP units is part of the environmental footprint and life cycle assessment (LCA) methodology in the context of climate change. The key element is to ensure the quality of the input data for the optimisation process, described by the authors of paper [21], who presented a pragmatic approach that can help identify areas such as energy processes and their efficiency.
The Weibull distribution is a recognised statistical model in machine reliability assessment. The Weibull distribution is the generalisation of the exponential distribution. The applicability of that distribution comprises phenomena where damage intensity is a variable with a monotonic pattern. That distribution is used to describe, for example, the fatigue life of materials and mechanical structures [22]. System data needed for the ratio analysis may be obtained from difference sources, namely laboratory tests or the record of events in the course of facility operation [23]. It is therefore important that the users of the biogas cogeneration system be equipped with simple “tools” for the assessment of the facility’s operation [24]. The Weibull distribution has been successfully used, for example, to assess the operational reliability of waste water treatment plants [25] and photovoltaic systems [16] as well as to determine pseudo-components and the kinetic analysis of the pyrolysis of the selected combustible solid wastes [26]. The authors of [27] applied the Weibull distribution model to the analysis of wind velocity and power density distribution. A similar issue was examined by the authors of [28]. They analysed the option to apply the Weibull distribution to determine the energy performance of wind. The authors of [29] used the parameters of the Weibull distribution to assess the wind power potential and calculated the prospective annual revenues for Gdańsk if the city had municipal wind turbines in its centre. In work [30], damage assessment was conducted and life expectancy of the end superheater tubes of power plant boilers was measured. The Weibull distribution model was used to obtain a trend in the changes in the cumulative risk of failure as well as to assess and predict the safety status of the entire system of pressure components of the power plant boilers [31].
In this article, reliability analysis according to the Weibull distribution is used to estimate the reliability of a cogeneration unit. Understanding the distribution of reliability indicators will allow the reader to develop an appropriate device management strategy to minimise maintenance costs and maximise energy production.
In the literature, mention is mainly made of research work on CHP units equipped with gas engines in large cogeneration units with the electrical power above electricity of 1 MW.
The results of research presented by the authors of the work [32] showed that for cogeneration systems based on biogas, the efficiency of electricity production ranges from 16% to 83%, and heat production ranges from 18% to 90%. These values result from the power range of cogeneration units and the type of biogas.
The research results showed that the use of CHP units for biogas installations is recommended mainly because of the use of renewable energy.
The technical and economic analysis of a cogeneration unit powered by agricultural biogas was described in work [33]. Its authors demonstrated the electrical efficiency of the cogeneration unit at the level of 22% and the thermal efficiency of 65%. The parameters of the CHP unit defined in this way indicate the priority in heat generation with low efficiency of electricity generation without taking the reliability aspects into account.
Most of the literature focuses on the energy efficiency of the energy generation process in large biogas-fired CHP plants with the capacity of more than 1 MW.
The novelty of research presented in this article is the focus on small CHP units up to 0.5 MW and the correlation of such research with reliability.
In the literature, there are no publications concerning small biogas-powered CHP installations based on gas engines. Therefore, the aim of this work is to fill this gap and demonstrate the synergy between energy efficiency and energy production reliability.

2. Object of Research

The object of research is the biogas combined heat and power plant (a CHP system) in a containerised design with the electric capacity of 440 kW and the thermal capacity of 520 kW, which has been operated at a municipal landfill since 2010. Waste after mechanical and biological treatment is deposited at the landfill. The landfill is part of the Waste Processing Company (WPC), which comprises the mechanical and biological waste processing system, RDF (refuse-derived fuel) preparation station and construction waste processing plant. The gas piston engine driving the generator is supplied with biogas obtained from the landfill degassing plant with the use of vertical degassing wells. Biogas sucked by a blower with the capacity of up to 280 m3 h−1 is then directed to the processing station, where biogas is conditioned and thus prepared for combustion in the gas engine. The containerised cogeneration unit with basic equipment is shown in Figure 1.
The engine is a v-shaped, four-stroke, turbocharged, 12-cylinder engine with a supercharged mixture cooler and is factory-adapted to run on biogas with a variable methane content from 35% to 65%.
The cogeneration unit is built in a container and consists of the following main components:
  • Biogas engine;
  • Synchronous power generator;
  • Heat recovery block (the engine and exhaust gases);
  • Backup cooling system with an external cooler;
  • Electricity, metering and export system;
  • Control and visualization system.
The technical parameters of the cogeneration unit are presented in Table 1.
Landfill biogas recovered from the waste bed is treated in a plant comprising a carbon filter and condensate settling tank. Before feeding into the gas engine, biogas is measured with the use of a flow meter.
In the period from plant construction in 2010, until 2017, the plant was only supervised by a third party on-line, and only planned inspections were conducted. Such a situation resulted in frequent breaks in the operation of the plant, which were caused by, for example, the following:
  • CHP shutdown due to a low methane level (measurements were not conducted and the output of the various gas wells was not optimised);
  • Operation interruption caused by the lack of power supply (temporary power failures and lightning strikes);
  • Oxygen meter failure (excessive biogas moisture content, no biogas drying plant);
  • Inadequate biogas yield (silting-up of gas wells and pipelines at the landfill);
  • Excessive reaction time (up to 48 h) of remote service staff to the causes of plant downtime;
  • Exceeding permissible air temperature in the container (a fan failure);
  • Exceeding permissible exhaust gas temperature (exhaust gas exchanger blockage);
  • Gas blower stopping as a result of the limit pressure being exceeded (flooding of wells and gas pipelines with water);
  • Lack of ongoing measurements of biogas quality, including the content of hydrogen sulphide, which is reduced in the active carbon of the landfill gas filter.
The average methane content of landfill gas between 2012 and 2017 was 47.4% (the calorific value of 16,548.7 kJ∙m−3), which was the result of the lack of monitoring the quality of gas extracted from the landfill and landfill gas optimisation on control valves in the suction and regulation station.
Table 2 shows the basic performance data recorded in the CHP control system for 2012–2017.
In view of the frequent downtime of the CHP plant, an electrician has been employed since 2016 on the degassing system and biogas utilisation plant at the landfill, who was seconded only to the plant, and a relevant procedure was implemented to optimise and ensure reliable operation of the cogeneration plant. The implemented internal procedure consists in the detailed monitoring of the degassing plant, along with optimising cogeneration plant operation. As part of the procedure, an operational database was created on the basis of the documentation in place, titled “Operation records for the degassing system and biogas utilisation at the landfill”.
The documentation includes, without limitation:
  • Landfill gas meter reading sheet;
  • Gross electricity production meter reading sheet;
  • Net active electricity meter reading sheet for electricity transmitted to the power grid;
  • Active electricity meter reading sheet for electricity consumed for the purposes of supplying landfill equipment;
  • Heat meter reading sheet for heat generated in the CHP plant;
  • Plant operation sheet (failures, downtime, and inspections);
  • Gas flare operation record;
  • Landfill gas composition measurement sheet (oxygen, carbon dioxide, methane, hydrogen sulphide).
The average methane content in landfill gas in 2018–2022 was 56.6% (the calorific value of 19,635.2 kJ∙m−3), which was the outcome of the introduction of corrective measures including full LFG monitoring in terms of quantity and quality. The operational database was maintained on the basis of records in the plant operation documentation by a staff member hired as a power engineer with a relevant licence for plant operation and supervision. All the measurements and readings on the plant were taken three times a day, and monthly schedules were subject to review by the managers. The basic performance data from 2018–2022 for the CHP plant is included in Table 3.
The data in Table 3, completed with the results of biogas quality measurements and with the calculated biogas calorific values, are the input data for the calculation of the basic energy ratios for the CHP plant.

3. Research Methodology

The input data for the analysis of energy generation efficiency in the CHP system is the operating data from 2012–2022. These are the results of meter readings, measurements, and calculations. As the assessment of energy efficiency of the combined heat and power generation process differs from single-purpose processes, the efficiency of the individual processes was assessed on the operation manuals for energy cogeneration systems. The difference in these systems lies in the fact that all the cogenerated products have a useful value, and their production and management are conducted to the expectations of energy consumers.
The results were statistically analysed with the use of Statistica v 13.3 by TIBCOI Software Inc. [35]. To analyse the impact of the amount of biogas recovered for conversion into electricity and heat in a CHP system, 3 W scatter plots were used to visualise the interdependence between the three variables representing the X, Y, and one Z (vertical) coordinates of each point in three-dimensional space.
In turn, to analyse the impact of plant running time on the amount of electricity and heat generated in the CHP system, categorised 3W surface plots were used for the three variables corresponding to the sets of X, Y, and Z coordinates, i.e., for data subsets defined by the selected categorisation method suitable for the surface and defined by the smoothing method.
The analysis of the efficiency of energy generation in the CHP unit was conducted with the use of calculations based on indicators characterising the efficiency of the fuel chemical energy conversion process in the cogeneration system. The variable values taken for the calculations according to Formulas (1)–(3) were the average figures for the periods under analysis.
Electricity generation efficiency:
η e l _ E C =   E e l E ˙ c h = E e l V ˙   ·   W d
Heat generation efficiency:
η t _ E C =   Q E ˙ c h = Q V ˙   ·   W d
Total efficiency:
η t o t a l =   E e l + Q E ˙ c h
where:
  • E ˙ c h —LFG chemical energy yield
  • E e l —amount of electricity produced
  • Q —amount of heat produced
  • V ˙ —annual LFG yield
  • W d —LFG calorific value
As a tool for analysing the conversion of the chemical energy contained in landfill gas [36], these energy ratios pertain to CHP generation processes.
The availability of the CHP unit for power generation ( A C H P ) was analyzed by calculating the unit‘s availability with the use of Formula (4), assuming the maximum annual working time of 8760 h.
A C H P = t m a x t D t m a x
where:
  • t m a x —maximum annual working time
  • t D —annual downtime
Reliability factors were analysed with the use of the Weibull distribution. As part of the reliability analysis, the following estimates were made:
  • Reliability function:
R t = e t β α
  • Damage intensity function:
λ t = β α t α β 1
  • Cumulative distribution functions of the running time until the first damage:
F t = 1 e t β α
where:
-
t—facility correct running time
-
α —shape parameter
-
β —scale parameter
By solving the system of three equations, the scale parameter β and shape parameter α may be determined.
α · i = 1 n 2 l n x i n 2 · l n β = i = 1 n 2 l n l n 1 1 h x i α · i = n 2 n l n x i n n 2 · l n β = i = n 2 n l n l n 1 1 h x i h x i = i 0.5 n
One of the objectives of research and analyses conducted was to assess the operational reliability of the cogeneration unit at the municipal landfill. Between January 2018 and December 2022, a database was maintained which concerned, among other data, the plant running, inspection, heavy repair, and failure time. These data are presented in Figure 2.

4. Research Results and Discussion

4.1. Analysis of Energy Generation Efficiency in the CHP System

To analyse the impact of the amount of biogas recovered for conversion into electricity and heat in a CHP system, 3W scatter plots were used to visualise the interdependence between the three variables representing the X, Y, and one Z (vertical) coordinates of each point in three-dimensional space. The operation of the cogeneration plant from 2012 to 2017 was distinguished by no direct plant supervision or the analysis of energy ratios, which resulted in the actual annual running time of 7489 h calculated as an average for the years from 2012 to 2017. As a consequence of this situation, the average LFG yield in that period was 910,533 m3·year−1, which enabled the generation of the following amounts of electricity and heat, respectively: 1219.39 kWh/year and 1615.94 kWh/year. Figure 3 shows the amount of electricity and heat generated in the CHP unit depending on the amount of recovered landfill gas.
The analysis of the data for 2018–2022 showed that the annual average amount of recovered biogas was 1,291,515 m3·year−1, a figure 29.5% higher than in the previous period under analysis. This LFG yield enabled the CHP unit to produce 2131.22 MWh of electricity and 2799.44 MWh of heat per year.

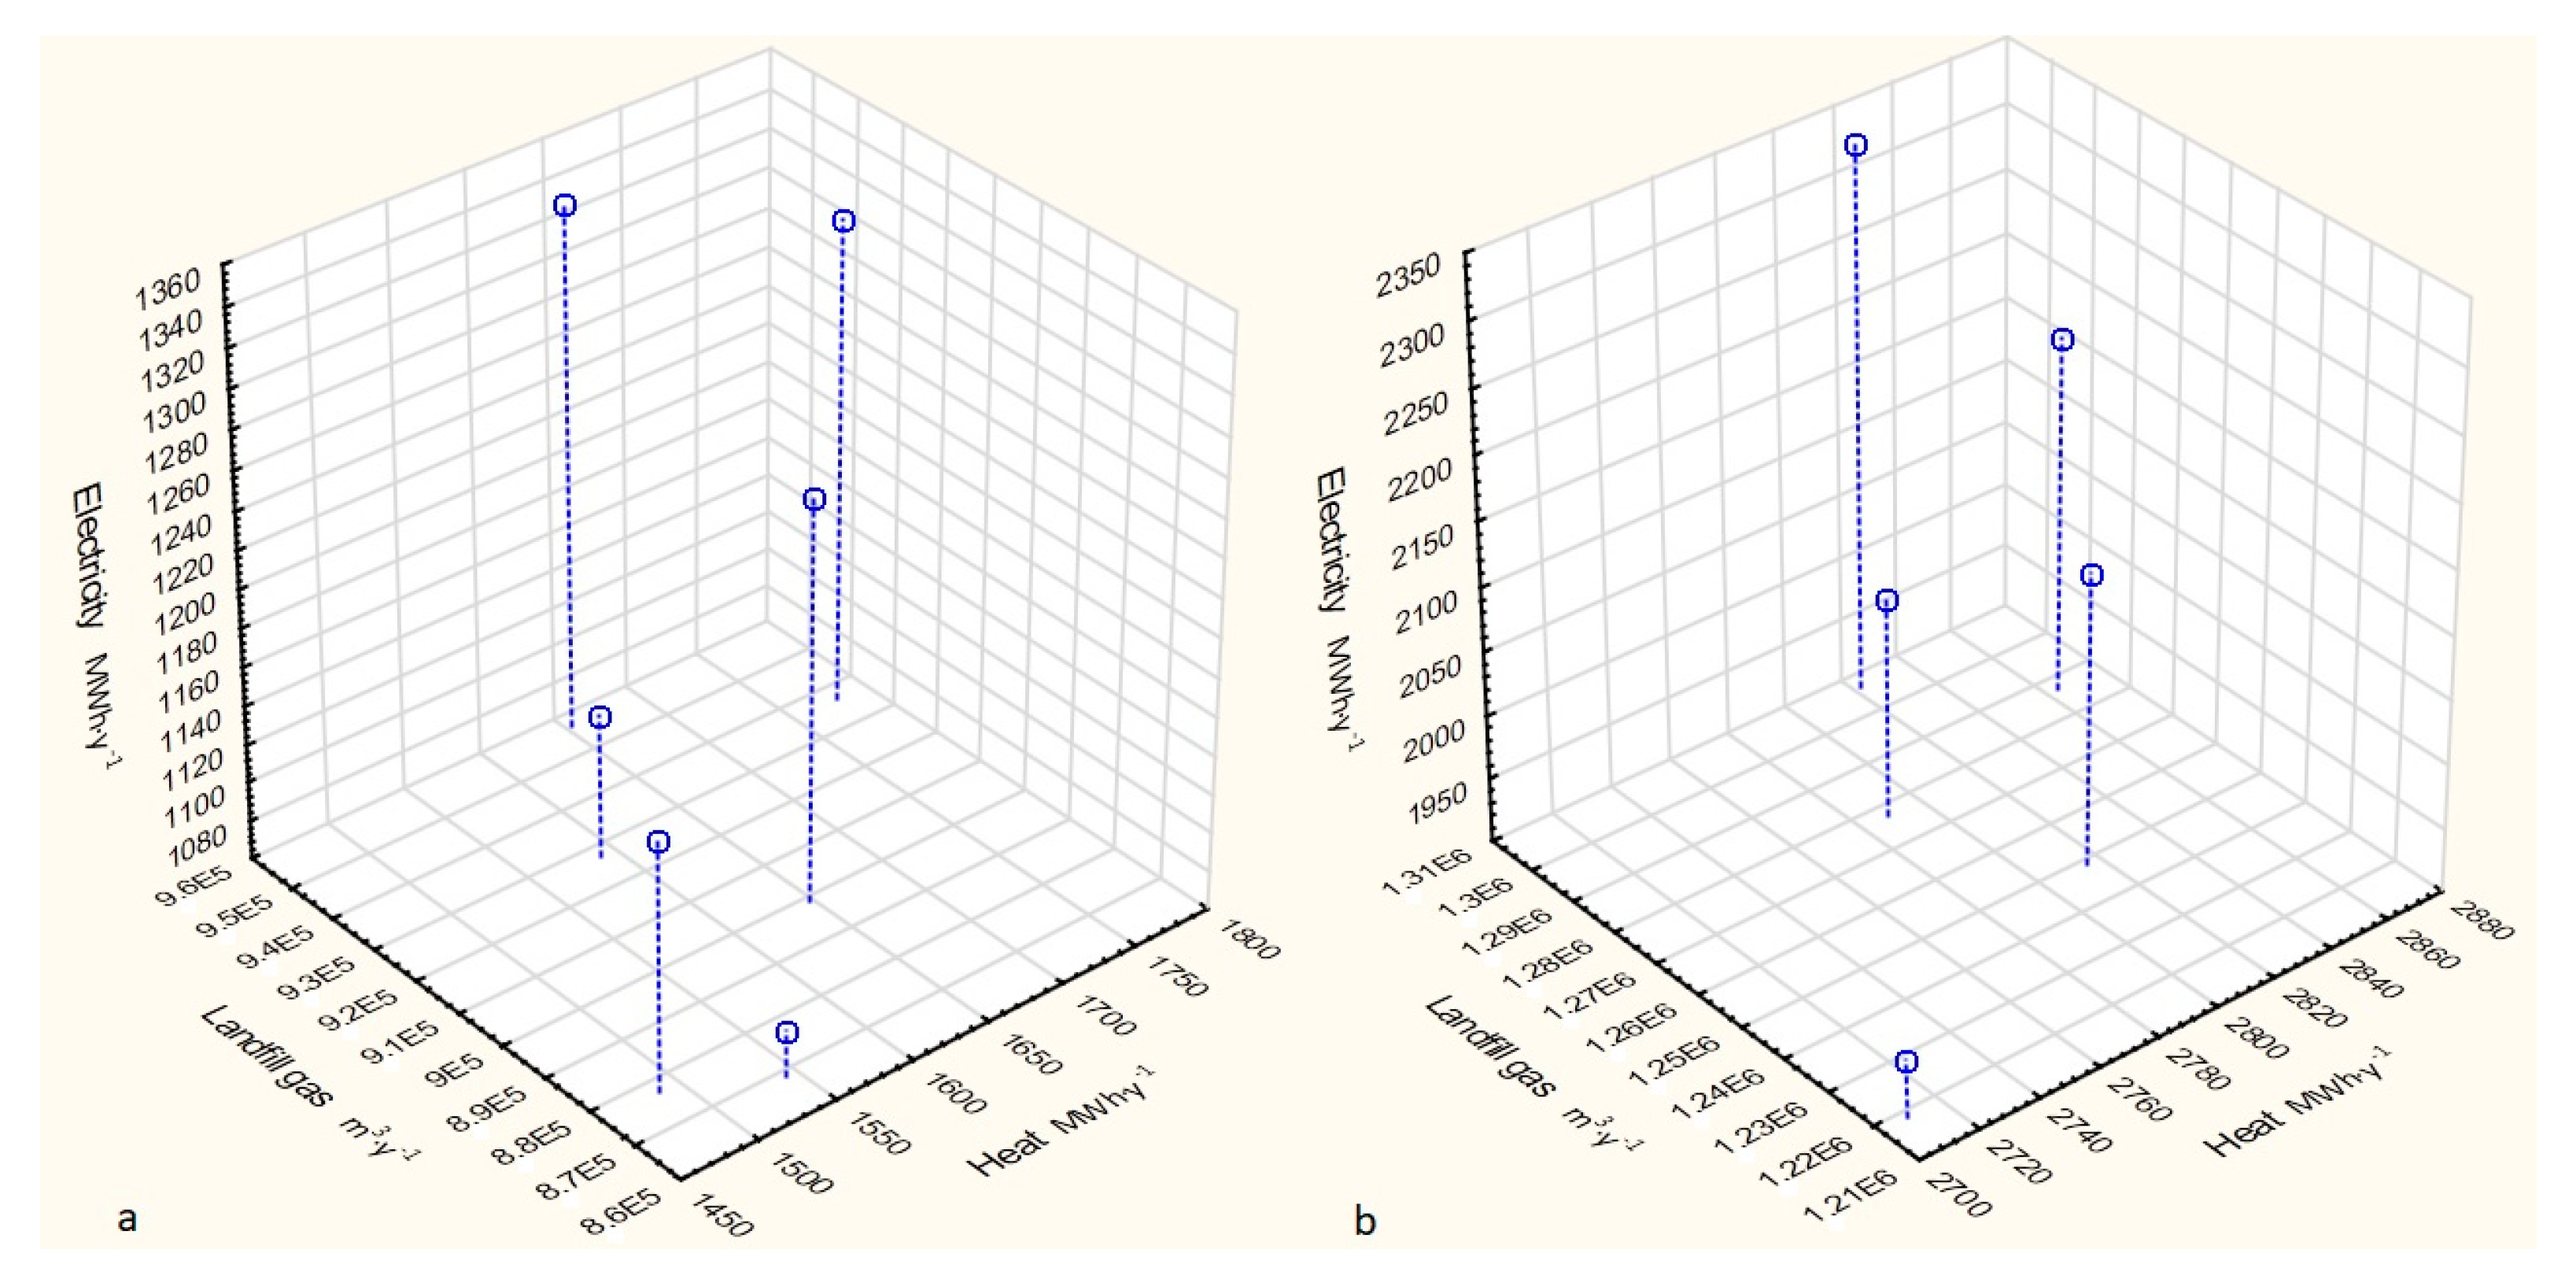
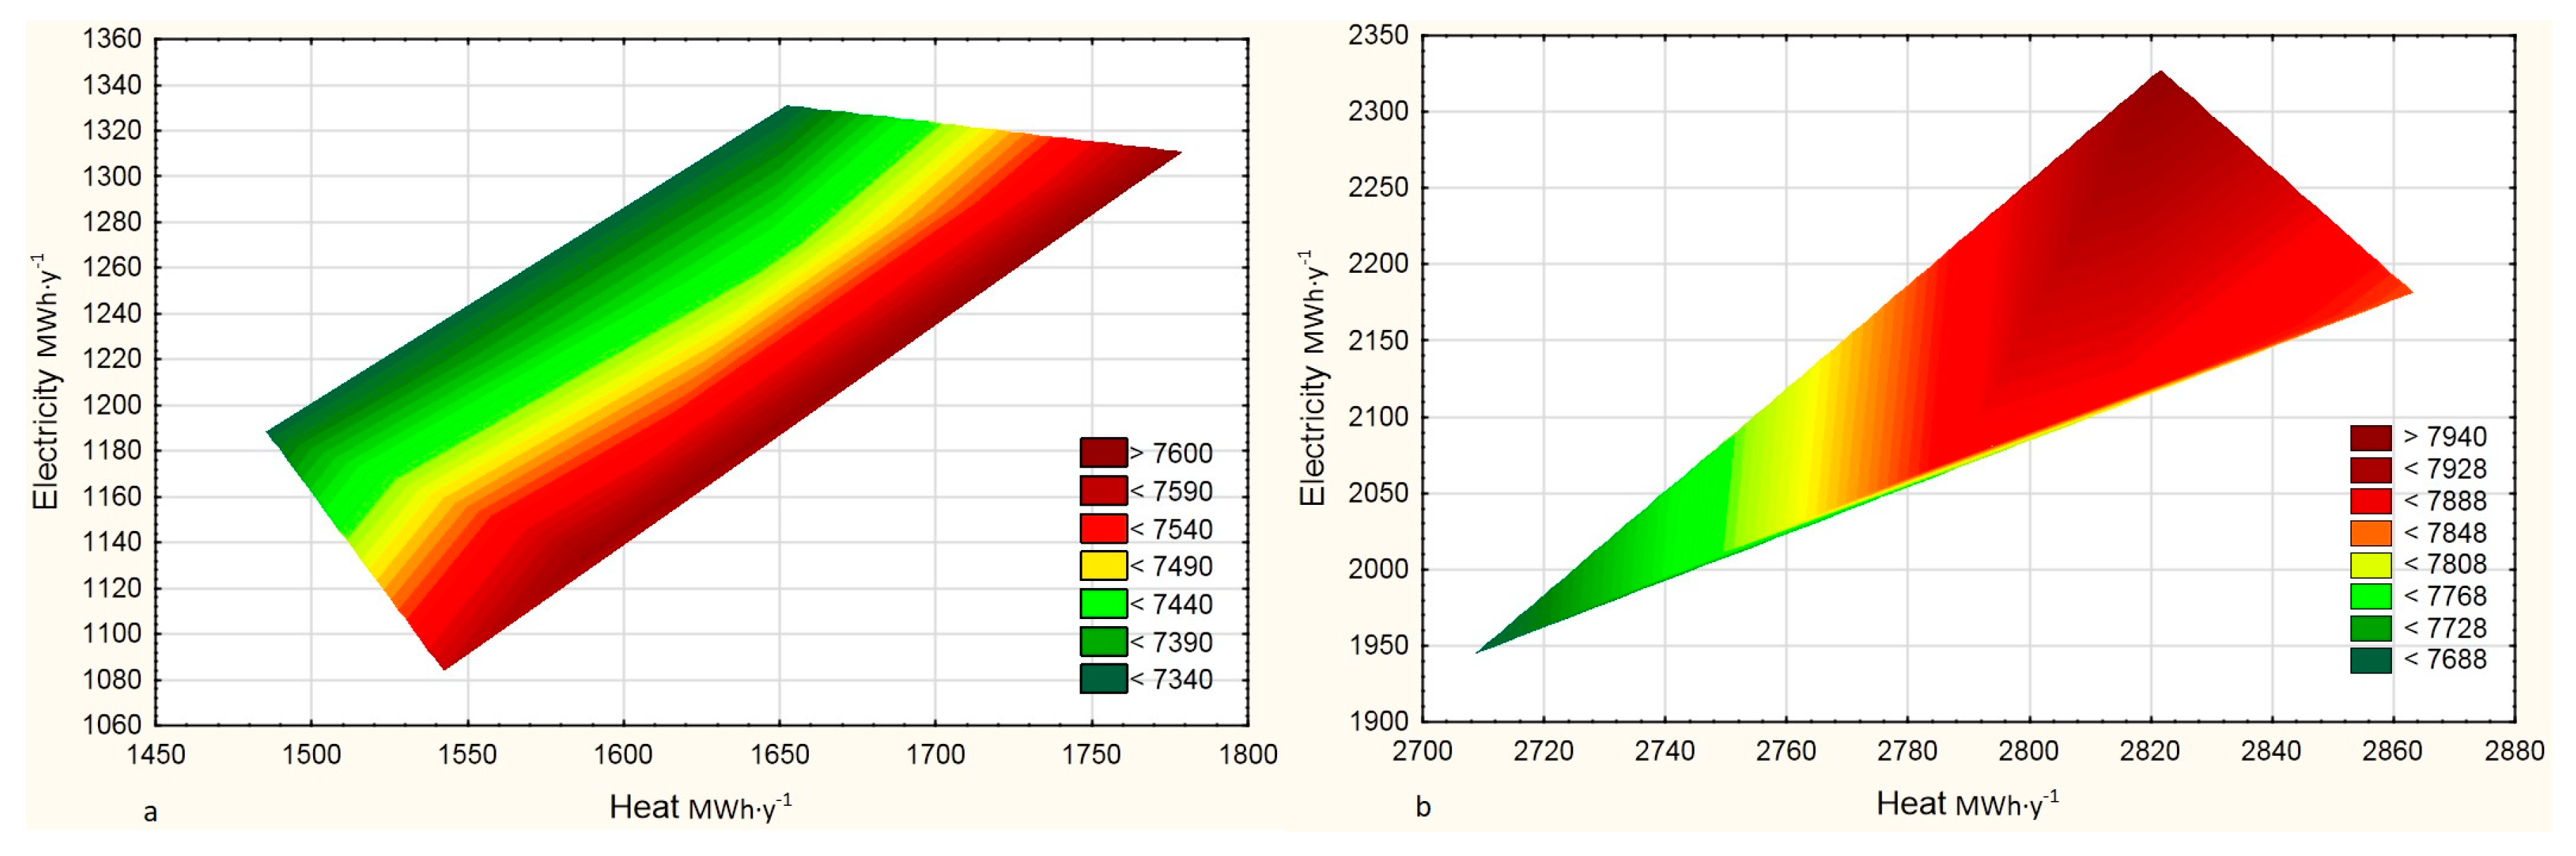
4.2. Analysis of the Impact of Plant Running Time on the Amount of Electricity and Heat Generated in the CHP System

The impact of plant running time on the amount of electricity and heat generated in terms of energy, as two basic indicators characterising the efficiency of the fuel chemical energy conversion process in the cogeneration system, were calculated with the use of Formulas (5)–(8) [37], i.e., the efficiency of electricity and heat generation. The calculated availability of the cogeneration unit, including energy generation efficiency, is presented in Table 4.
Calculated electricity generation efficiency after optimisation of CHP plant operation was higher by 6.66% and heat generation efficiency increased by 5.12%. These values indicate that the optimisation measures taken by the plant owner have a positive effect.
The volume of electricity production in the two periods under analysis is presented by means of categorised 3 W surface plots for the three variables corresponding to the sets of X, Y, and Z coordinates, i.e., for data subsets defined by the selected categorisation method suitable for the surface and defined by the smoothing method. Figure 4 comprises the comparison of the amount of electricity and heat generated in the two periods of CHP plant operation under analysis.
Figure 4 shows the amount of energy produced before and after optimisation depending on plant running time.
Higher energy parameters were achieved because of an increase in the generation unit’s running time by 4.6%, which resulted in the availability of the CHP unit at the level of 0.895. These parameters and the higher LFG calorific value made the cogeneration unit generate more energy in 2018–2022 than in 2012–2017.

4.3. Assessment of the Technical Condition and the Analysis of the CHP Reliability Factors

During the CHP plant operation period, i.e., between 2018 and 2022, repeated technical inspections were conducted. Worn-out parts were replaced and the necessary maintenance work required by the documentation was performed. For example, the flywheel, combustion temperature sensors, spark plugs, and ignition cables were replaced. Observations of the combustion chambers were also conducted. The sample results of the observations are shown in Figure 5.
The effect of a carbon deposit build-up is a drop in compression pressure in the specific cylinders. Table 5 presents the measured values of compression pressure.
The results of the measurements and observations demonstrated that the gas engine installed in the cogeneration unit did not operate at its rated load, which resulted in underburning of the mixture and in the formation of a carbon deposit in the engine components. The main source of the resulting contaminants in the engine are sulphur and silicon compounds (siloxanes) present in landfill gas, resulting in the formation of silica in the engine combustion chamber. When decomposing in the combustion process, silica causes damage to the engine cylinders and pistons [39,40].
Operating an engine when such contaminants are present most frequently leads to mechanical damage to the assembly of the crankshaft, pistons, and connecting rods as well as to the development of fretting wear in the components of an internal combustion engine [41,42]. Such a situation has a negative impact on the reliability of gas engine operation, which directly affects the efficiency of heat and electricity generation. Therefore, the key issue is to control the landfill gas treatment process and replace the gas filter in order not to exceed the permissible gas parameters allowed by the gas engine manufacturers [43,44].
In the period under analysis, the database was maintained, which included information on the type of damage following from plant operation. The irregularities and their numbers are compiled in Table 6.
This information was used for the preparation of CHP plant reliability factors. Table 7 shows the calculations needed for the determination of the reliability function R(t), damage intensity function λ(t), and the cumulative distribution functions of the running time until the first damage F(t). The CHP plant running time until inoperability was marked t.
With the use of information in Table 7 and Formula (4), the scale parameter β and shape parameter α were calculated. These values are as follows:
α = 2.006231 ;   β = 714504251.9
The shape parameter α has the value greater than one, and therefore the damage intensity function should be expected to grow.
If the value of the scale and shape parameters is known, the various reliability factors may be determined by means of Formulas (5)–(7). It is on that basis that the pattern of the reliability function R(t), damage intensity function λ(t), and the cumulative distribution functions of the running time until the first damage F(t) were determined, and their distributions are presented in Figure 6, Figure 7 and Figure 8.
It may be estimated on the basis of Figure 6 and Figure 7 that the CHP plant reaches 50% efficiency after approx. 21,500 h of operation. The plant reaches 90% efficiency after approx. 39,000 h of operation.
The calculations resulting in the diagrams shown above make it possible to estimate effectively the current increase in the risk for the CHP plant in the future and the timing of an intensive failure. On the basis of the risk situation and the consequences of the failure, it is possible to prioritise planned maintenance of the high-risk system to avoid unplanned downtime and thus effectively reduce operating costs by predicting the probability distribution and risk density of plant failure.
The comparison of the optimisation parameters is presented in Table 8.
Based on the analysis of parameters after optimisation of the CHP unit, their increase in relation to the values of the initial parameters can be observed. The key issue in this process is to increase the production availability of the unit as a result of the implemented technical and organizational processes, which directly translates into the energy efficiency of cogeneration.
Energy production is closely linked to the organic matter content in waste which, as a consequence, translates into the quantity and quality of biogas produced and into the availability of the energy generation unit. The efficiency of the energy generation process, which determines the efficiency of the conversion of biogas energy into electricity and heat [45], is directly linked to the question of biogas post-treatment quality and energy self-sufficiency of the waste water treatment plant.
Comparing the results of the research conducted in this work with the literature data, it should be noted that access to these data is limited due to the lack of research for CHP units in the power range up to 0.5 MW.
The few available test results of units operated in Greece showed the efficiency of electricity generation in the range of 30–35%. The total efficiency of these units was 70–75%. These data were not related to the period of technological availability [46].
Biogas-powered CHP installations up to 1 MW operated in Sweden showed electrical efficiency in the range of 20–50%, while their total energy generation efficiency was 70–80% [47].
Increasing the efficiency of the use of chemical energy in fuel (biogas) for the purposes of electricity and heat generation is recommended at the EU-level by the European Commission.
Biogas utilisation in a cogeneration unit (CHP) is regarded as an added value, reducing the costs of electricity production [48,49].
Due to the fact that the research conducted in this work aimed at increasing the energy efficiency and reliability of the CHP unit powered by landfill gas and is in line with the general trend of optimisation of manufacturing processes, this research can be transferred to other industries, not only those related to the municipal economy.
Research results in this area are presented by [50], with the author emphasising that the electrical efficiency of cogeneration units is a major factor in the commercial viability of electricity generation from biogas. Eight CHP units fuelled with biogas from sludge digestion were analysed. Research results demonstrated that the highest engine efficiency was achieved only in the case of units with a full service package including heavy repairs.

5. Conclusions

The analysis of operation of the landfill-gas-fuelled cogeneration unit in two periods, i.e., 2012–2017 and 2018–2022, showed considerable differences in the amount of LFG recovered and energy generated as well as in the availability of the CHP unit.
The period under analysis, i.e., 2012–2017 was distinguished by the lack of the plant operator’s integrated approach to the process of energy generation from LFG. The operational and organisational changes introduced in the second period of the unit’s operation, i.e., 2018–2022, showed the gas yield increase by 29.5%, the methane content increase by 16.25%, and the reduction in downtime hours by 28.24% compared to the first period. As a consequence of these parameters, energy generation efficiency increased, which resulted in an increase in electricity production by 42.78% and an increase in thermal energy production by 42.27%. The analysis of reliability factors with the use of the Weibull distribution demonstrated that CHP plant would reach 50% efficiency after approx. 21,500 h of operation, while a clear decrease in efficiency by 10% would be reached by the plant after 39,000 h of operation. In view of the indicators presented, further corrective measures need to be undertaken to prevent failures which result in no energy being generated. In the case of the operation of landfill-gas-fuelled cogeneration units, it is crucial to ensure the ongoing supervision of the plant in order to monitor LFG quality and the technical condition of equipment as well as to optimise the management of the energy generated.

Author Contributions

Conceptualization, J.C., S.K. and K.B.; methodology, J.C., S.K. and A.G.; software, S.K. and K.G.; validation, S.K., K.G. and Z.M.; formal analysis, K.B., A.G. and Z.M.; investigation, J.C., S.K. and Z.M.; resources, J.C. and Z.M.; data curation, J.C., S.K. and K.B. writing—original draft preparation, A.G. and K.G.; writing—review and editing, J.C. and S.K.; visualization, K.B., A.G. and Z.M.; supervision, K.B.; project administration, A.G., J.C. and S.K. All authors have read and agreed to the published version of the manuscript.

Funding

Publication was supported under the rector’s pro-quality grant. Silesian University of Technology, Poland, grant number: 08/040/RGJ22/0164.

Data Availability Statement

Not applicable.

Conflicts of Interest

The authors declare no conflict of interest.

References

  1. Gronba-Chyła, A.; Generowicz, A.; Kwaśnicki, P.; Cycoń, D.; Kwaśny, J.; Grąz, K.; Gaska, K.; Ciuła, J. Determining the Effectiveness of Street Cleaning with the Use of Decision Analysis and Research on the Reduction in Chloride in Waste. Energies 2022, 15, 3538. [Google Scholar] [CrossRef]
  2. Sobiecka, E.; Cedzynska, K.; Smolinska, B. Vitrification of medical waste as an alternative method of wastes stabilization. Fresenius Environ. Bull. 2010, 19, 3045–3048. [Google Scholar]
  3. Smol, M.; Włodarczyk-Makuła, M. Effectiveness in the Removal of Organic Compounds from Municipal Landfill Leachate in Integrated Membrane Systems: Coagulation–NF/RO. Polycycl. Aromat. Compd. 2017, 37, 456–474. [Google Scholar] [CrossRef]
  4. Koc-Jurczyk, J.; Jurczyk, Ł.; Zapałowska, A. Treatment of landfill leachate in intermittently aerated hybrid or conventional SBRs operating at different temperatures. Desalination Water Treat. 2021, 232, 264–279. [Google Scholar] [CrossRef]
  5. Ciuła, J. Analysis of the effectiveness of wastewater treatment in activated sludge technology with biomass recirculation. Archit. Civil Eng. Environ. 2022, 15, 123–134. [Google Scholar] [CrossRef]
  6. Wysowska, E.; Wiewiórska, I.; Kicińska, A. Minerals in tap water and bottled waters and their impact on human health. Desalination Water Treat. 2022, 259, 133–151. [Google Scholar] [CrossRef]
  7. Gewald, D.; Siokos, K.; Karellas, S.; Spliethoff, H. Waste heat recovery from a landfill gas-fired power plant. Renew. Sust. Energ. Rev. 2012, 16, 41779–41789. [Google Scholar] [CrossRef]
  8. den Boer, E.; den Boer, J.; Hakalehto, E. Volatile fatty acids production from separately collected municipal biowaste through mixed cultures fermentation. J. Water Process Eng. 2020, 38, 101582. [Google Scholar] [CrossRef]
  9. Tappen, S.J.; Aschmann, V.; Effenberger, M. Lifetime development and load response of the electrical efficiency of biogas-driven cogeneration units. Renew. Energy 2017, 114, 857–865. [Google Scholar] [CrossRef]
  10. Dalpaz, R.; Konrad, O.; Cândido da Silva, C.C.; Barzotto, H.P.; Hasan, C.; Guerini, F.M. Using biogas for energy cogeneration: An analysis of electric and thermal energy generation from agro-industrial waste. Sustain. Energy Technol. Assess. 2020, 40, 100774. [Google Scholar] [CrossRef]
  11. Dregulo, A.M.; Bobylev, N.G. Integrated Assessment of Groundwater Pollution from the Landfill of Sewage Sludge. J. Ecol. Eng. 2021, 22, 68–75. [Google Scholar] [CrossRef]
  12. Ciuła, J.; Generowicz, A.; Gaska, K.; Gronba-Chyła, A. Efficiency Analysis of the Generation of Energy in a Biogas CHP System and its Management in a Waste Landfill–Case Study. J. Ecol. Eng. 2022, 23, 143–156. [Google Scholar] [CrossRef]
  13. Novotny, V.; Spale, J.; Szucs, D.J.; Tsai, H.-J.; Kolovratnik, M. Direct integration of an organic Rankine cycle into an internal combustion engine cooling system for comprehensive and simplified waste heat recovery. Energy Rep. 2021, 7, 644–656. [Google Scholar] [CrossRef]
  14. Pandyaswargo, A.H.; Onoda, H.; Nagata, K. Energy recovery potential and life cycle impact assessment of municipal solid waste management technologies in Asian countries using ELP model. Int. J. Energy Environ. Eng. 2012, 3, 28. Available online: https://www.journal-ijeee.com/content/3/1/28 (accessed on 12 November 2022). [CrossRef] [Green Version]
  15. Kowalski, Z.; Kulczycka, J.; Verhé, R.; Desender, L.; De Clercq, G.; Makara, A.; Generowicz, N.; Harazin, P. Second-generation biofuel production from the organic fraction of municipal solid waste. Front. Energy Res. 2022, 10, 919415. [Google Scholar] [CrossRef]
  16. Williams, I.D.; Curran, T.; den Boer, E.; Perlt, A.; Lock, D.; Kent, A.; Wilding, P. Resource efficiency network in the construction of new buildings. Waste Resour. Manag. 2014, 167, 139–153. [Google Scholar] [CrossRef] [Green Version]
  17. Kouvo, P. High Efficiency Landfill Gas Fired Power Plant Process with ORC. J. Earth Sci. Eng. 2016, 6, 254–263. [Google Scholar] [CrossRef] [Green Version]
  18. Yechiel, A.; Shevah, Y. Optimization of energy generation using landfill biogas. J. Energy Storage 2016, 7, 93–98. [Google Scholar] [CrossRef]
  19. Lund, R. Energy System Benefits of Combined Electricity and Thermal Storage Integrated with District Heating. Int. J. Sustain. Energy Plan. Manag. 2021, 31, 23–38. [Google Scholar] [CrossRef]
  20. Sarah, J.; Simon, P.E.; Singleton, A.R.; Carter, J.F. Landfill Gas as Fuel for Combined Heat and Power. Cogen. Distrib. Gener. J. 2007, 22, 33–44. [Google Scholar] [CrossRef]
  21. Salemdeeb, R.; Saint, R.; Clark, W.; Lenaghan, M.; Pratt, K.; Millar, F. A pragmatic and industry-oriented framework for data quality assessment of environmental footprint tools. Resour. Environ. Sustain. 2021, 3, 100019. [Google Scholar] [CrossRef]
  22. Badura, H.; Michna, A.; Czerwiński, S. Assessment of technical condition mining machines based on the criterion of the Weibull distribution. Syst. Wspomagania Inżynierii Prod.–Górnictwo–Perspekt. Zagrożenia 2016, 1, 639–654. Available online: http://www.dydaktyka.polsl.pl/ROZ5/konfer/english/wyd/2016/1/R54.pdf (accessed on 9 October 2022).
  23. Ferreria, L.A.; Silva, J.L. Parameter estimation for Weibull distribution with right censored data using EM algorithm. Eksploat. Niezawodn.–Maint. Reliab. 2017, 19, 310–315. [Google Scholar] [CrossRef]
  24. Bugajski, P. Analysis of reliability of the treatment plant bioblok PS-50 using the method of Weibull. Infrastruct. Ecol. Rural. Areas 2014, II, 667–677. [Google Scholar] [CrossRef]
  25. Wąsik, E.; Bugajski, P.; Chmielowski, K. Weibull model as a tool for assessment of operation reliability in a sewage treatment plant in Niepołomice. Nauka Przyr. Technol. 2016, 10, 1–11. [Google Scholar] [CrossRef]
  26. Shin, J.-W.; Yoon, K.-H.; Chai, H.-S.; Kim, J.-C. Reliability-Centered Maintenance Scheduling of Photovoltaic Compo nents According to Failure Effects. Energies 2022, 15, 2529. [Google Scholar] [CrossRef]
  27. Tianju, C.; Wu, W.; Wu, J.; Cai, J.; Wu, J. Determination of the pseudocomponents and kinetic analysis of selected combustible solid wastes pyrolysis based on Weibull model. J. Therm. Anal. Calorim. 2016, 126, 1899–1909. [Google Scholar] [CrossRef]
  28. Teimourian, H.; Abubakar, M.; Yildiz, M.; Teimourian, A. A comparative study on wind energy assessment distribution models: A case study on Weibull distribution. Energies 2022, 15, 5684. [Google Scholar] [CrossRef]
  29. Bingöl, O.; Bulut, A. Estimation of Weibull distribution parameters for wind energy applications: A case study of Dinar region in Turkey. Uluslararası Teknol. Bilim. Derg. 2022, 14, 1–10. [Google Scholar] [CrossRef]
  30. Aydin, O.; Igliński, B.; Krukowski, K.; Siemiński, M. Analyzing wind energy potential using efficient global optimization: A case study for the City Gdańsk in Poland. Energies 2022, 15, 3159. [Google Scholar] [CrossRef]
  31. Liu, G.; Yang, X.; Yang, X.; Liang, K.; An, D.; Wu, D.; Ren, X. Typical Damage Prediction and Reliability Analysis of Superheater Tubes in Power Station Boilers Based on Multisource Data Analysis. Energies 2022, 15, 1005. [Google Scholar] [CrossRef]
  32. Hakawati, R.; Smyth, B.M.; McCullough, G.; De Rosa, F.; Rooney, D. What is the most energy efficient route for biogas utilization: Heat, electricity or transport? Appl. Energy 2017, 206, 1076–1087. [Google Scholar] [CrossRef] [Green Version]
  33. Hamzehkolaei, F.T.; Amjady, N. A techno-economic assessment for replacement of conventional fossil fuel based technologies in animal farms with biogas fueled CHP units. Renew. Energy 2018, 118, 602–614. [Google Scholar] [CrossRef]
  34. Available online: https://horus-energia.pl/gaz-biogaz/kogeneracja-poligeneracja/ (accessed on 1 October 2022).
  35. Statistica, version 13.3; TIBCOI Software Inc.: Palo Alto, CA, USA, 2017.
  36. Ziębik, A.; Gładysz, P. System effects of primary energy reduction connected with operation of the CHP plants. Arch. Thermodyn. 2017, 38, 61–79. [Google Scholar] [CrossRef] [Green Version]
  37. Gong, H.; Chen, Z.; Yu, H.; Wu, W.; Wang, W.; Pang, H.; Du, M.N. Methane recovery in a combined amine absorption and gas steam boiler as a self-provided system for biogas upgrading. Energy 2018, 157, 744–751. [Google Scholar] [CrossRef]
  38. Arnold, A. Reduction and Monitoring of Biogas Trace Compounds; VTT-Utgivare-Julkaisija–Publisher: Vuorimiehentie, Finland, 2009. [Google Scholar]
  39. Ajhar, M.; Travesset, M.; Yüce, S.; Melin, T. Siloxane removal from landfill and digester gas—A technology overview. Bioresour. Technol. 2010, 101, 2913–2923. [Google Scholar] [CrossRef]
  40. Rarosue, J.; Amaraibi, B.J.; Kuhn, J.N. Techno-economic and sustainability analysis of siloxane removal from landfill gas used for electricity generation. J. Environ. Manage. 2022, 314, 115070. [Google Scholar] [CrossRef]
  41. Kowalski, S. Influence of diamond-like carbon coatings on the wear of the press joint components. Wear 2021, 486–487, 204076. [Google Scholar] [CrossRef]
  42. Kowalski, S. Application of dimensional analysis in the fretting wear studies. J. Balk. Tribol. Assoc. 2016, 22, 3823–3835. [Google Scholar]
  43. Álvarez-Flórez, J.; Egusquiza, E. Analysis of damage caused by siloxanes in stationary reciprocating internal combustion engines operating with landfill gas. Eng, Fail. Anal. 2015, 50, 9–38. [Google Scholar] [CrossRef] [Green Version]
  44. Stanuch, I.; Biegańska, J. Siloxane in the biogas. Arch. Waste Manage. Environ. Prot. 2014, 16, 18. Available online: http://yadda.icm.edu.pl/baztech/element/bwmeta1.element.baztech-647f454f-7629-4bb7-af08-dc6e3c62fe54 (accessed on 20 October 2022).
  45. Themelis, N.J.; Ulloa, P.A. Methane generation in landfills. Renew. Energy 2007, 32, 1243–1257. [Google Scholar] [CrossRef]
  46. Papadimitriou, A.; Vassiliou, V.; Tataraki, K.; Giannini, E.; Maroulis, Z. Economic Assessment of Cogeneration Systems in Operation. Energies 2020, 13, 2206. [Google Scholar] [CrossRef]
  47. Salomón, M.; Savola, T.; Kirjavainen, M.; Martin, A.R.; Fogelholm, C.J. Distributed Combined Heat and Power Generation with Small-Scale Biomass Plants-State of the Art Review Second International Symposium on Distributed Generation: Power System and Market Aspects 2–4 October 2002, Stockholm, Sweden. Available online: https://www.researchgate.net/publication/261873202_Distributed_Combined_Heat_and_Power_Generation_with_Small-Scale_Biomass_Plants_-_State_of_the_Art_Review (accessed on 9 February 2023).
  48. Buck, M.; Graf, A.; Graichen, P. European Energy Transition 2030. The Big Picture. Berlin: Agora Verkehrswende. 2019. Available online: https://www.stiftung-mercator.de/de/publikationen/european-energy-transition-2030-the-big-picture/ (accessed on 9 February 2023).
  49. Kampman, B.; Leguijt, C.; Scholten, T.; Tallat-Kelpsaite, J.; Brückmann, R.; Maroulis, G.; Lesschen, J.P.; Meesters, K.; Sikirica, N.; Elbersen, B. Optimal use of biogas from waste streams. An assessment of the potential of biogas from digestion in the EU beyond 2020. European Commission. Available online: https://ec.europa.eu/energy/sites/ener/files/documents/ce_delft_3g84_biogas_beyond_2020_final_report.pdf. (accessed on 9 February 2023).
  50. Nikkhah, A.; Khojastehpour, M.; Abbaspour-Fard, M.H. Hybrid landfill gas emissions modeling and life cycle assessment for determining the appropriate period to install biogas system. J. Clean. Prod. 2018, 185, 772–780. [Google Scholar] [CrossRef]
Figure 1. General view of the cogeneration unit [34].
Energies 16 02180 g001
Figure 2. Cogeneration unit’s running, inspection, heavy repair, and failure time in the various years of operation.
Energies 16 02180 g002
Figure 3. Biogas volume for the generation of electricity and heat in the CHP plant: (a) before optimisation, 2010–2015; (b) after the introduction of plant operation management, 2018–2022.
Energies 16 02180 g003
Figure 4. Energy production depending on CHP running time: (a) before optimisation, 2012–2017; (b) after the introduction of plant operation management, 2018–2022.
Energies 16 02180 g004
Figure 5. Sample results of the videoscopic observations of combustion chambers: (a) siloxane layer on the inner surfaces of a cylinder piston and piston liner and (b) sulphur deposits in the gas engine [38].
Energies 16 02180 g005
Figure 6. The distribution of the reliability function R(t) of the CHP plant in time.
Energies 16 02180 g006
Figure 7. Distribution of the reliability function R(t) and the cumulative distribution functions of the running until the first damage F(t) of the CHP plant in time.
Energies 16 02180 g007
Figure 8. Distribution of the damage intensity function λ(t) of the CHP plant in time.
Energies 16 02180 g008
Table 1. Technical parameters of the cogeneration unit.
ParameterValue
Electrical capacity440 kW
Thermal capacity520 kW
Electrical efficiency37.6%
Thermal efficiency42.8%
Table 2. CHP plant performance data for 2012–2017.
YearPlant Running Time
[h·year−1]
Amount of Biogas Recovered
[m3·year−1]
Amount of Electricity Generated
[MWh·year−1]
Amount of Heat Generated
[MWh·year−1]
20127614926,7321135.251589.35
20137623936,3211310.851779.01
20147436898,4641266.831646.88
20157581868,4511083.831542.37
20167338956,2981331.171652.48
20177342876,9321188.421485.52
Average7489910,5331219.391615.94
Table 3. CHP plant performance data for 2018–2022.
YearPlant Running Time
[h·year−1]
Amount of Biogas Recovered
[m3·year−1]
Amount of Electricity Generated
[MWh·year−1]
Amount of Heat Generated
[MWh·year−1]
201878761,306,2982327.822788.38
201978521,276,7322073.412863.35
202078831,286,3212181.602815.28
202176871,248,4642128.632708.61
202279431,218,4511944.652821.60
Average78481,291,5152131.222799.44
Table 4. CHP plant performance data for 2012–2020.
YearsCHP Plant Running Time
[h]
Downtime
[h]
AvailabilityElectricity Generation EfficiencyHeat Generation EfficiencyTotal Efficiency
2012–2017748912710.8540.280.370.65
2018–202278489120.8950.310.400.71
Table 5. Compression pressure in cylinders [MPa].
Cylinder No.Measured ValueCorrect Value
11.651.90
21.651.90
31.751.90
41.651.90
51.701.90
61.601.90
71.801.90
81.601.90
91.751.90
101.851.90
111.801.90
121.601.90
Table 6. Type and cause of failures of the CHP plant.
No.ElementCause of Inoperability of the SystemNumber of Occurrences of Damage in the Period Under Analysis
1Cylinder headBridge microcrack
Water jacket crack
2
2TurbochargerOil leak2
3FlywheelTooth breaking 1
4StarterRack bearing damage1
5Exhaust manifoldContamination with oil4
6Cooling systemCooling liquid tube crack3
724 V battery chargerNo electric voltage1
8BatteryTotal discharge1
9Actuator on the gas path to the engineMechanical damage2
10Engine blockLeaks, gasket3
Table 7. CHP plant performance data for 2016–2020.
No.tln(t)h(t)1/[1−h(t)]ln{1/[1−h(t)]}ln{ln{1/[1−h(t)]}}Ʃln{ln{1/[1−h(t)]}}Ʃln(t)
116807.4265490720.0251.0256410260.025317808−3.676247258−15.1109978394.0869
256238.6346206080.0751.0810810810.077961541−2.551539632
310,8509.2919203590.1251.1428571430.133531393−2.013418678
414,3749.5731762980.1751.2121212120.192371893−1.64832484
515,1899.6283267610.2251.2903225810.25489225−1.366914374
617,4599.7676105540.2751.3793103450.321583624−1.134497663
719,3139.8685337230.3251.4814814810.393042588−0.933837306
820,1189.9093702160.3751.600.470003629−0.755014863
921,5869.9798002350.4251.7391304350.553385238−0.591700887
1022,18010.006946260.4751.9047619050.644357016−0.439502333
1123,54810.066796170.5252.1052631580.744440475−0.2951223833.846541555103.536
1224,18710.093570580.5752.3529411760.85566611−0.155875037
1326,50010.184900010.6252.6666666670.980829253−0.019356889
1429,37710.287967330.6753.0769230771.239300970.116831558
1532,50110.389026140.7253.6363636361.2909841810.255404859
1633,47410.41852430.7754.4444444441.4916548770.399886159
1734,25010.441441840.8255.7142857141.7429693050.555590156
1836,55510.506573250.8758.002.0794415420.732099368
1938,94510.569905670.92513.333333332.5902671650.951761023
2039,24110.57747740.97540.003.6888794541.305322741
Table 8. Comparison of optimisation parameters.
ParameterUnitParameter Value
Before OptimisationAfter Optimisation
Biogas streamm3/year910,5331,291,515
Electricity productionMWh/year1219.392131.22
Heat productionMWh/year1615.942799.44
CHP unit operating timeh/year74897848
Downtimeh/year1271912
Availability%8589
Efficiency of electricity generation-0.280.31
Heat generation efficiency-0.370.40
Total efficiency-0.670.70
Disclaimer/Publisher’s Note: The statements, opinions and data contained in all publications are solely those of the individual author(s) and contributor(s) and not of MDPI and/or the editor(s). MDPI and/or the editor(s) disclaim responsibility for any injury to people or property resulting from any ideas, methods, instructions or products referred to in the content.

