Article

High-Cell-Density Yeast Oil Production with Diluted Substrates Imitating Microalgae Hydrolysate Using a Membrane Bioreactor

1
Chair of Biochemical Engineering, School of Engineering and Design, Technical University of Munich, 85748 Garching, Germany
2
Werner Siemens-Chair of Synthetic Biotechnology, School of Natural Sciences, Technical University of Munich, 85748 Garching, Germany
3
TUM Pilot Plant for Industrial Biotechnology, Technical University of Munich, 85748 Garching, Germany
*
Author to whom correspondence should be addressed.
Energies 2023, 16(4), 1757; https://doi.org/10.3390/en16041757
Submission received: 19 January 2023 / Revised: 3 February 2023 / Accepted: 8 February 2023 / Published: 10 February 2023
(This article belongs to the Special Issue Biopower Technologies)

Abstract

:
Microbial oil production from industrial waste streams and biogenic resources, such as biomass hydrolysates, is emerging as a sustainable alternative to use of fossil and vegetable oils. However, the carbon sources of these substrates are typically diluted, leading to low product concentrations and, therefore, high fermentation and downstream processing costs. In this study, high-cell-density yeast oil production with a defined medium, which imitated the sugar composition of a diluted substrate, a typical microalgal biomass hydrolysate, is carried out on a 50 L scale using a membrane bioreactor (MBR) consisting of a microfiltration unit suited for industrial application. The process was run on a semi-continuous mode to reduce operational costs. Oleaginous yeast Cutaneotrichosporon oleaginosus was used as a biocatalyst and lipid production was induced by phosphate deficiency in the medium with a C/P ratio of 3515 g g−1. In this way, high cellular lipid contents of up to 76.5% (w/w) of dry cell mass, an average lipid yield of 32% (w/w), and a lipid space–time yield (STY) of up to 8.88 g L−1 d−1 were achieved with final high cell densities of up to 116 g L−1 dry biomass. Furthermore, use of a defined medium and elemental analysis of the yeast cells and yeast oil enabled drawing an accurate carbon mass balance of the production system. Carbon conversion efficiencies—fraction of total carbon supplied in the form of sugars converted into lipids at the end of the process—of up to 61.5% were achieved from diluted substrates using the MBR with total cell retention. Considering these results, it is concluded that utilization of an MBR on a semi-continuous mode would be very reasonable for yeast oil production, enabling high productivities with diluted sugar substrates.

1. Introduction

With the supply of fossil oils being limited and the current climate crisis, a rapid energy transition and transition to renewable, sustainable resources as raw materials is needed in the industry [1,2]. Microbial oils can be an alternative to petroleum and vegetable oils, which are linked to deforestation, such as palm oil and cacao oil. Techno-economic analysis of the process shows the potential of microbial oils especially for production of oleochemicals and other high-added-value products, but possibly also for biodiesel production in the future as fossil oils become scarcer and prices rise [3,4,5]. The advantages of switching to microbial oils depend on the carbon source used for oil production as well as productivity. The main candidates producing single-cell oils (SCO) are oleaginous microalgae and yeast, both being intensively researched in recent years. Oleaginous microorganisms can accumulate lipids of at least 20% of their dry weight [6], and some oleaginous yeast strains are known to achieve a cellular lipid content of up to almost 90% [7].
Industrial waste streams and biogenic resources, such as biomass residues from the forestry and agriculture sectors, are low-cost carbon sources that could be used for microbial oil production [8,9,10,11,12,13,14,15,16,17]. Microalgae are also an interesting source of biomass hydrolysate since they grow faster, with higher biomass yield, fixating CO2 into their biomass with efficiencies of up to 90% [18]. Using microalgae hydrolysate as a cultivation medium would make CO2 the main carbon source for yeast oil production and thus enable establishing a carbon neutral production process. Even though microalgae can also accumulate SCO and grow on wastewater streams, they have much lower lipid productivities than the most oleaginous yeasts. Therefore, at present, application of microalgae remains limited to mainly wastewater treatment [19,20], aquaculture supplying foodstuffs [21,22], and production of specific polyunsaturated fatty acids (PUFAs), such as docosahexaenoic acid, eicosapentaenoic acid, or arachidonic acid, for use as nutraceuticals [23]. Thus, utilization of microalgae biomass as a carbon source, rather than a SCO producer, could be a better option for a microbial oil factory considering the advantages regarding process productivity. Generally, microalgae biomass grown under nutrient-replete conditions has around 25% (w/w) carbohydrates and 50% (w/w) proteins [18], both of which could be converted into valuable carbon sources that can be utilized by oleaginous yeasts. This would, for instance, correspond to around 50 g L−1 sugar concentration in a microalgal biomass hydrolysate produced using a concentrated biomass with 250 g dry cell weight per liter [24].
The waste streams or biomass hydrolysates considered as a carbon source for yeast cultivation do, however, as elucidated for microalgal biomass hydrolysate, typically have a much lower concentration of the carbon source [10,11,14,15,16] in comparison to synthetic media used in industrial processes. Use of a diluted substrate as a cultivation medium means low product concentration in the end, which results in higher costs in downstream processing. Utilization of a membrane bioreactor (MBR) is very appropriate to be able to carry out high-cell-density yeast cultivation with a diluted medium at low sugar concentrations, imitating microalgae hydrolysate. In this way, the residence time of the yeast cells in the bioreactor is decoupled from that of the medium, enabling feeding of large amounts of substrate solution without diluting the yeast suspension inside the bioreactor. In this study, an MBR (stirred-tank bioreactor with cross-flow microfiltration in a bypass) was employed with total cell retention to prevent any loss of valuable lipid-producing and lipid-accumulating yeast cells.
Oleaginous yeast strain Cutaneotrichosporon oleaginosus, formerly known as Candida curvata D, Apiotrichum curvatum, Cryptococcus curvatus, Trichosporon cutaneum, and Trichosporon oleaginosus, respectively [17], has been noted to be capable of utilizing a very wide spectrum of substrates as carbon sources [25,26,27,28] and displays high tolerance against growth inhibitors [29,30,31,32]. Additionally, the ability of this strain to co-utilize various substrates and to grow in variable and harsh conditions found in wastewater streams speaks to the great potential of C. oleaginosus in valorization of wastes and residues. Hence, C. oleaginosus was used as a biocatalyst for oil production in this study considering the variety of carbon sources present in many industrial waste streams and biomass hydrolysates that are likely to be utilized for microbial oil production. Nevertheless, a synthetic medium imitating a microalgal biomass hydrolysate was used in the experiments instead of the hydrolysate itself since the composition of the synthetic medium is completely defined, which enables exact mass balance of the process.
Lipid accumulation by oleaginous yeast cells is induced by deficiency of a nutrient required for growth, such as nitrogen, phosphorus, or sulfur, accompanied by simultaneous excess of carbon sources in the medium. Phosphate elimination using precipitating agents is an uncomplicated and cheap option to create nutrient-depleted conditions applicable on an industrially relevant scale [33]. Accordingly, in this study, the preferred method for induction of lipid production by oleaginous yeast was limiting the phosphor source. Moreover, a semi-continuous MBR mode of operation was applied to reduce the operation time of the microfiltration unit throughout the process so that energy consumption associated with medium filtration is significantly reduced compared to a fully continuous operation.
Application of phosphor limitation to induce lipid accumulation with C. oleaginosus in an MBR with a hollow fiber ultrafiltration module has already been shown previously on a liter scale [24]. In this study, high-cell-density yeast oil production with a defined medium imitating diluted sugar composition of a microalgal hydrolysate is carried out on a 50 L scale with an MBR consisting of a microfiltration unit suited for industrial application and with a semi-continuous mode of operation.

2. Materials and Methods

2.1. Yeast Strain and Cultivation Medium

The oleaginous yeast strain, Cutaneotrichosporon oleaginosus (ATCC 20509), was purchased from the German Collection of Microorganisms and Cell Cultures (DSMZ) (Braunschweig, Germany) as a dried culture, where it is registered under DSM number 11815.
Long-term strain maintenance was completed using cryo-stocks of the yeast cells in 25% (v/v) glycerin containing medium stored at −80 °C. The preculture medium used to suspend the cryo-stocks was yeast extract peptone dextrose (YPD) medium (20 g L−1 peptone, 10 g L−1 yeast extract, 20 g L−1 glucose). The preculture used for experiments on the 50 L scale was incubated in concentrated YPD medium (60 g L−1 peptone, 30 g L−1 yeast extract, 60 g L−1 glucose) in 8 × 2 L shaking flasks with 400 mL filling volume each at 30 °C and 150 rpm for 3 d. The medium used for batch and semi-continuous cultivations in the membrane bioreactor was a modified version of the defined medium published by Hassan et al. [34]. The changes to the medium aimed to imitate sugar content and composition of a microalgae hydrolysate and create a phosphor-depleted medium with a C/P mass ratio of 3515 g g−1 to induce lipid production by oleaginous yeast [18,24]. The medium contained per one liter of water: 40.0 g glucose; 10.0 g mannose; 12.0 g (NH4)2SO4; 0.025 g KH2PO4; 1.0 g MgSO4·7 H2O; 1 mL antifoam (Antifoam 204, Sigma-Aldrich, Taufkirchen, Germany); 10 mL solution of trace elements; 2.5 mL solution of vitamins; 1 mL solution of kanamycin A; 1 mL solution of tetracycline. One liter of the trace element solution contained: 3.6 g CaCl2·2 H2O; 0.75 g ZnSO4·7 H2O; 0.13 g CuSO4·5 H2O; 0.13 g COCl2·6 H2O; 0.50 g MnSO4·H2O; 0.61 g (NH4)6Mo7O24·4 H2O. One liter of the vitamin solution contained: 50.00 g myo-inositol; 2.000 g nicotinic acid; 2.712 g calcium pantothenate; 2.240 g thiamine hydrochloride; 3.012 g pyridoxine hydrochloride; 0.050 g biotin. The kanamycin and tetracycline solutions contained 100 g L−1 kanamycin sulfate in deionized water and 100 g L−1 tetracycline hydrochloride in 50% (v/v) ethanol in water mixture. The vitamin and antibiotic solutions were filter-sterilized (0.22 µm filter) and added into the medium prior to inoculation. All other medium components were sterilized at 121 °C for 20 min.

2.2. Membrane Bioreactor with Total Cell Retention

A membrane bioreactor (MBR) with total cell retention was used for high-cell-density yeast cultivation with the diluted substrate imitating microalgae hydrolysate. The MBR was composed of two main units: a stirred-tank bioreactor with a 50 L working volume (LP75L, Bioengineering, Wald, Switzerland) and a cross-flow microfiltration unit (Clearflow MF X 01, Heinrich Frings, Rheinbach, Germany) connected to it as an external bypass, as shown in Figure 1. The state variables were controlled via BioSCADALab (Bioengineering, Wald, Switzerland) software using local IFM controllers and a peristaltic pump station provided by the manufacturer (Bioengineering, Wald, Switzerland). Additionally, a control cascade was used to keep the dissolved oxygen level over 40% air saturation at all times by regulating the agitation and aeration rate. 1 M sulfuric acid, 25% (v/v) ammonia, and 10% (v/v) antifoam (Antifoam 204, Sigma-Aldrich, Taufkirchen, Germany) solutions were connected to the pump station for automated software control of the pH and foam. The cross-flow microfiltration unit had a central control cabinet with a programmable logic controller (PLC, Siemens, Munich, Germany) and a touch panel. The microfilter used was a 1.2 m long ceramic module (Crystar 41-61-3.0 FT250, Compagnie de Saint-Gobain, Courbevoie, France) with capillaries (61 × 3.2 mm inside diameter), 0.25 μm pore size, and a filtration area of 0.8 m2. A sterile vessel with 200 L capacity (Rütten Engineering Ltd., Tagelswangen, Switzerland) equipped with a magnetic stirrer, a sterile filter, a manometer, a thermometer, and a cooling jacket was used as the feed tank. The feed medium was supplied to the bioreactor by a peristaltic pump with manually adjustable pump speed at the pump station. The data and state variables applied for operation of the MBR are summarized in Table 1.

2.3. Semi-Continuous Operation of the MBR

Cultivation was started in batch mode by inoculation of the reactor. After complete depletion of the sugars in the medium marked by a steep increase in the dissolved oxygen level, the MBR operation was switched to semi-continuous mode. In the semi-continuous mode of operation, the feed is supplied into the MBR continuously with a constant rate, whereas filtering out of the used up medium from the reactor is completed only for 8 h during the day. This method entails a constant change in liquid volume inside the reactor in a preset range; however, it also reduces the time of microfiltration per process time so that energy consumption associated with medium filtration is reduced by two thirds compared to a fully continuous operation.
In the experiments presented in this paper, the feed was started with and kept constant at a rate of 1.1 g sugars L−1 h−1 at the end of the batch phase based on the initial liquid volume in the MBR. With a sugar concentration of 50 g L−1 in the feed medium and an initial volume of 50 L, this feeding rate equals a volumetric flow rate of 1.1 L h−1. In addition, the permeate flow rate through the filter was adjusted to 3.3 L h−1 so that the liquid volume inside the MBR was reduced from 61.6 L at the beginning of each day to 44 L at the end of the day within 8 h. Since there was no filtration but only the feed flow into the reactor at night, the liquid volume inside the MBR increased from 44 L to 61.6 L overnight within 16 h. In this manner, the liquid volume inside the MBR was kept in the desired range and the initial volume of 50 L was achieved in the MBR once a day midway into the filtration phase. The dilution rate achieved with these settings was D = 0.528 d−1, which corresponds to 0.022 h−1 on a daily average.
Before and after each experiment, the MBR was heat-sterilized (at 121 °C for 20 min). After sterilization, at the end of an experiment, the MBR was cleaned using a standard machine cleaner dissolved in water, stirring at 70 °C for 40 min and then rinsed with tap water. No formation of persistent biofilm was observed on the filter material and no further cleaning of the MBR was required.

2.4. Optical Density and Cell Dry Weight

Cell density was determined by optical density measurement at 600 nm (OD600) against culture medium in triplicates using a UV–vis spectrophotometer (Genesys 10S UV–VIS, Thermo Fisher Scientific Inc., Waltham, MA, USA). Buffered saline (PBS) (8 g L−1 NaCl, 0.2 g L−1 KCl, 1.44 g L−1 Na2HPO4, 0.24 g L−1 KH2PO4) was used for dilution of the samples into the linear correlation range of the photometer phosphate. Whenever dilution of a sample was necessary, the blank was also diluted with the same dilution factor. In addition, cell dry weight (CDW) of each sample was measured in triplicate gravimetrically by centrifugation (at 20,817 rcf for 5 min) of the samples in pre-dried and pre-weighed tubes and drying the pellet for at least 48 h at 70 °C before weighing a second time. The CDW concentration was then calculated by dividing the dried weight by the volume of the sample initially centrifuged.

2.5. Total Lipid Analysis

The total lipid concentration of the yeast suspension was determined using the sulfo-phospho-vanillin (SPV) assay [35]. For preparation of the phospho-vanillin reagent, 0.3 g of vanillin was dissolved in 50 mL of 10% (v/v) ethanol in water mixture and mixed with 200 mL of phosphoric acid. 50 µL of each sample was incubated in 1 mL sulfuric acid (98% (v/v)) for 10 min at 90 °C in glass vials and cooled at −4 °C for 5 min. Then, 2.5 mL phosphor-vanillin reagent was added into each vial and the mixture was incubated in a thermomixer at 37 °C and 900 rpm for 15 min (Thermomixer basic, CellMedia, Elsteraue, Germany). After incubation, the absorption at 530 nm wavelength against air was measured with a UV–vis spectrophotometer (Genesys 10S UV–VIS, Thermo Fisher Scientific Inc., Waltham, MA, USA). Blank values were measured separately and subtracted from the measured absorption values manually. Each sample was measured in triplicate and the sugar-containing samples were washed with phosphate buffered saline (PBS) (8 g L−1 NaCl, 0.2 g L−1 KCl, 1.44 g L−1 Na2HPO4, 0.24 g L−1 KH2PO4) to avoid additional color formation, which would interfere with absorption at 530 nm. An external standard of rapeseed oil was used to create a correlation line between absorption and total lipid concentration.

2.6. Fatty Acid Composition

A gas chromatograph with a flame ionization detector (GC–FID) was used to determine the fatty acid composition of the yeast oil but also to verify the results of the total lipid concentrations measured using the SPV assay. The samples were prepared by freezing at −80 °C and subsequent lyophilization at −50 °C and 0.12 mbar for at least 48 h (Lyophilizer ALPHA 1–2 LDplus, Martin Christ Gefriertrocknungsanlagen GmbH, Osterode am Harz, Germany). For preparation of the fatty acid methyl esters (FAME), a direct transesterification procedure by Griffiths et al. [36] was applied with slight modifications as described previously [24]: 9–12 mg of lyophilized biomass per sample was used; a 2 mg mL−1 solution of C12-TAG (Glyceryl tridodecanoate, Sigma-Aldrich, Taufkirchen, Germany) in toluene was used as internal standard instead of C17-TAG in toluene; as acid catalyst, HCl in methanol solution (5% (v/v) concentrated HCl in methanol) was used; use of methyl nonadecanoate (C19-ME) as a secondary internal standard was omitted. After phase separation, the upper layer with the FAME containing hexane–toluene mixture was analyzed via GC–FID (GC-2010 Plus, Shimadzu Deutschland GmbH, Duisburg, Germany) with a fused silica separation column (FAMEWAX, Restek GmbH, Bad Homburg, Germany) using helium as carrier gas (as described previously by Thurn et al. [37]). The column temperature was started at 120 °C, increased to 220 °C with 7 °C min−1, and finally held at 220 °C for 20 min. The injector and FID temperatures were 220 °C and 250 °C, respectively. Peaks were identified by retention time based on an external standard (Marine Oil Test Mix, Restek GmbH, Bad Homburg, Germany). Fatty acid composition was determined by division of the corresponding FAME peak area by the sum of all peaks excluding the internal standard. The individual fatty acid contents of the biomass were calculated by correlating the peak area of the fatty acid to that of the standard with known concentration and normalizing the value to the dry sample weighed initially.

2.7. Substrate Anaylsis

The concentrations of glucose, mannose, and ammonia were determined photometrically using enzymatic assays (D-Glucose and ammonia assay kits, R-Biopharm AG, Darmstadt, Germany; D-Mannose/D-Fructose/D-Glucose assay kit, Megazyme, Wicklow, Ireland), whereas the phosphate concentration was measured using a colorimetric test kit (Phosphate colorimetric kit, Sigma-Aldrich, Munich, Germany).

2.8. Elemental Analysis

Analysis of the carbon, hydrogen, nitrogen, and sulfur (CHNS) contents was carried out using a CHNS elemental analyzer (Euro EA CHNS Elemental Analyzer, HEKAtech GmbH, Wegberg, Germany). In the analyzer, each sample is combusted using pure oxygen at 1800 °C and the resulting gas mixture containing CO2, H2O, N2, and SO2 is fed into a gas chromatography column for separation using helium as carrier gas. Subsequently, the separated gases are measured by a thermal conductivity detector. The C, H, N, and S contents are then calculated as the mass of the element measured per mass of the initially weighed sample. For the analysis, the cell samples were freeze-dried and the oil sample was handled in liquid form. Each sample was measured in triplicate.
The phosphor content was determined using a colorimetric method. The samples were initially mineralized in round bottom flasks at 400 °C using concentrated sulfuric acid and fuming nitric acid. Then, the nitrous gases were boiled away. An aliquot part of ammonium vanadate and ammonium molybdate was added to the mixture and the resulting phosphomolybdic acid was measured against standards photometrically at 650 nm (Cary 100 UV–Vis Spectrophotometer, Agilent, Waldbronn, Germany). Each sample was measured in duplicate.

2.9. Carbon Balance and Conversion Efficiency

The carbon initially present in the medium in the form of sugars and vitamins is used by the yeast cells for cell growth, lipid production, and for energy gain by respiration generating CO2. The overall carbon balance was calculated based on this premise using the measured elemental composition of the cells and the yeast oil. The carbon balance can be formulated as:
M C , in = M S · x C , S + M Vit · x C , Vit = M X · x C , X + M Lipid · x C , Lipid + R
where MC,in is the total carbon mass fed into the system, MS is the total sugar mass fed, MVit is the total vitamin mass fed, MX is the lipid-free CDW produced, MLipid is the lipid mass generated, xC,S is the overall carbon fraction of the sugars, xC,Vit is the carbon fraction of the vitamins, xC,X is the carbon fraction of the lipid-free CDW, xC,Lipid is the carbon fraction of the lipids, and R is the remaining carbon mass, which is presumed to be oxidized by respiration and thus can be expressed as follows:
R = M CO 2 · x C , CO 2
where MCO2 is the mass of carbon dioxide generated and xC,CO2 is the fraction of carbon in CO2.
Carbon conversion efficiency (ηC) is defined as the fraction of total carbon supplied into the system in the form of sugars, which is converted into lipids at the end of the process:
η C = M Lipid · x C , Lipid M C , in

3. Results and Discussion

3.1. High-Cell-Density Yeast Oil Production in the MBR

A membrane bioreactor with total cell retention and a working volume of 40–67 L (7.25 L of it bypass) was utilized for high-cell-density yeast cultivation on a substrate imitating a microalgal hydrolysate with low sugar concentration (40 g L−1 glucose and 10 g L−1 mannose). Oleaginous yeast C. oleaginosus was cultivated under phosphate-depleted conditions with a C/P ratio of 3515 g g−1 to induce lipid production. The experiment was carried out a total of three times to demonstrate the reproducibility of the results, which are shown in Figure 2. Batch phase duration varied between the experiments due to lag-time between complete depletion of sugars in the medium and the start of the fresh medium feed. This resulted in stagnation of cell growth of around 1.5 days after inoculation in Experiments 1 and 2. In Experiment 3, the cell density at the time of inoculation was adjusted so that this delay could be prevented. Furthermore, Experiment 1 had to be terminated sooner than intended due to technical problems. During the process, the maximum permeate flow rate achievable by the microfiltration unit decreased over time as a function of increasing biomass concentration. Therefore, Experiments 2 and 3 were stopped as soon as the required permeate flow rate could not be ensured anymore.
The batch phase took 28–46 h, and, during this time, the sugars were utilized simultaneously by the yeast, meaning there was no preference of one sugar over the other, as expected based on a prior experiment (See Figure S1). After complete consumption of sugars in the batch medium, the semi-continuous mode of operation was applied as described in Section 4. Small fluctuations in the actual values of flow rates from the set points during the semi-continuous operation led to changes in liquid volume inside the MBR between 40 and 67 L, with slight deviations from the planned range of 44–63 L. In all the experiments, the initial phosphate and total sugar concentrations in the medium were 100 mg L−1 and 50 g L−1, respectively. The initial lipid content of the cells was between 20 and 30% (w/w) in all the experiments (Figure 2d), which suggests that a nutrient limitation had already taken place in the preculture. However, the cellular lipid quota sank quickly after transfer into nutrient-replete fresh medium by inoculation of the MBR. After the start of the semi-continuous operation, the CDW kept increasing at a constant rate of approximately 0.48 kg per day until the end of the process (Figure 2a). It is remarkable that the lipid concentration also kept rising constantly, although at a rather lower rate of 0.44 kg per day (Figure 2c). Accordingly, on average, the lipid-free CDW only marginally increased by 40 g per day (Figure 2b). Assuming that these rates remain constant, it follows that, with infinite process time, the cellular lipid content would converge to approximately 91.7% (w/w). The lipid space–time yield (STY) thereby achieved corresponds to around 8.88 g L−1 d−1, which is comparable to the values reported with C. oleaginosus so far (2.64–14.16 g L−1 d−1) [24,38,39]. The STY achieved in this study was limited mainly by the conservative choice of feed flow rate. The feed flow was kept relatively low since it was very important to ensure that no valuable carbon source exits the MBR unused by keeping the sugar concentrations below the detection limit of 0.004 g L−1 glucose and 0.014 g L−1 mannose at all times.
In this way, up to 117 g L−1 CDW in 50 L reaction volume was achieved, and, on average, around 5.83 kg of CDW was formed 9 days after the start of the semi-continuous operation (Figure 2a). Around 4.46 kg lipids (81.7 g L−1 lipids in 54.5 L) were present in the yeast suspension at the end of the process (Figure 2c), which corresponds to a cellular lipid content of 76.5% (w/w), although, in all the experiments, 70% (w/w) lipid quota was already achieved after 4–5 days into the process (Figure 2d). The CDW and lipid measurements as concentration values in g L−1 are provided in Figure S2. The results of all the experiments were significantly similar to each other, which demonstrates very high reproducibility of the results. Zhang et al. [38] and Shaigani et al. [11] reported achieving 35% and 28% lipid content of dry biomass of C. oleaginosus using phosphate-depleted medium with N-acetyl glucosamine as the carbon source after 4 days process time. In a more comparable study by Zhou et al. [40], in which a phosphate-depleted hydrolysate from water hyacinth was used as the carbon source, 60% lipid content of C. oleaginosus CDW was documented. In the study by Meo et al. [24], which is the most analogous study to this one due to use of a very similar phosphate-depleted medium and an MBR concept on a liter scale, around 70% (w/w) cellular lipid content was recorded after 3–4 days. The lipid quota achieved in this study after 4 days is much higher than or at least identical to all the data cited above for this yeast. Moreover, to the best of our knowledge, 76.5% (w/w) lipid content reported in this study is the highest reported so far with C. oleaginosus using P limitation. The lipid yield YL/S (g lipid produced per g sugar consumed) calculated at the end of the process was 0.32 g g−1, which is also higher than the range (0.20–0.26 g g−1) stated in comparable studies using P limitation with C. oleaginosus [24,38,40].

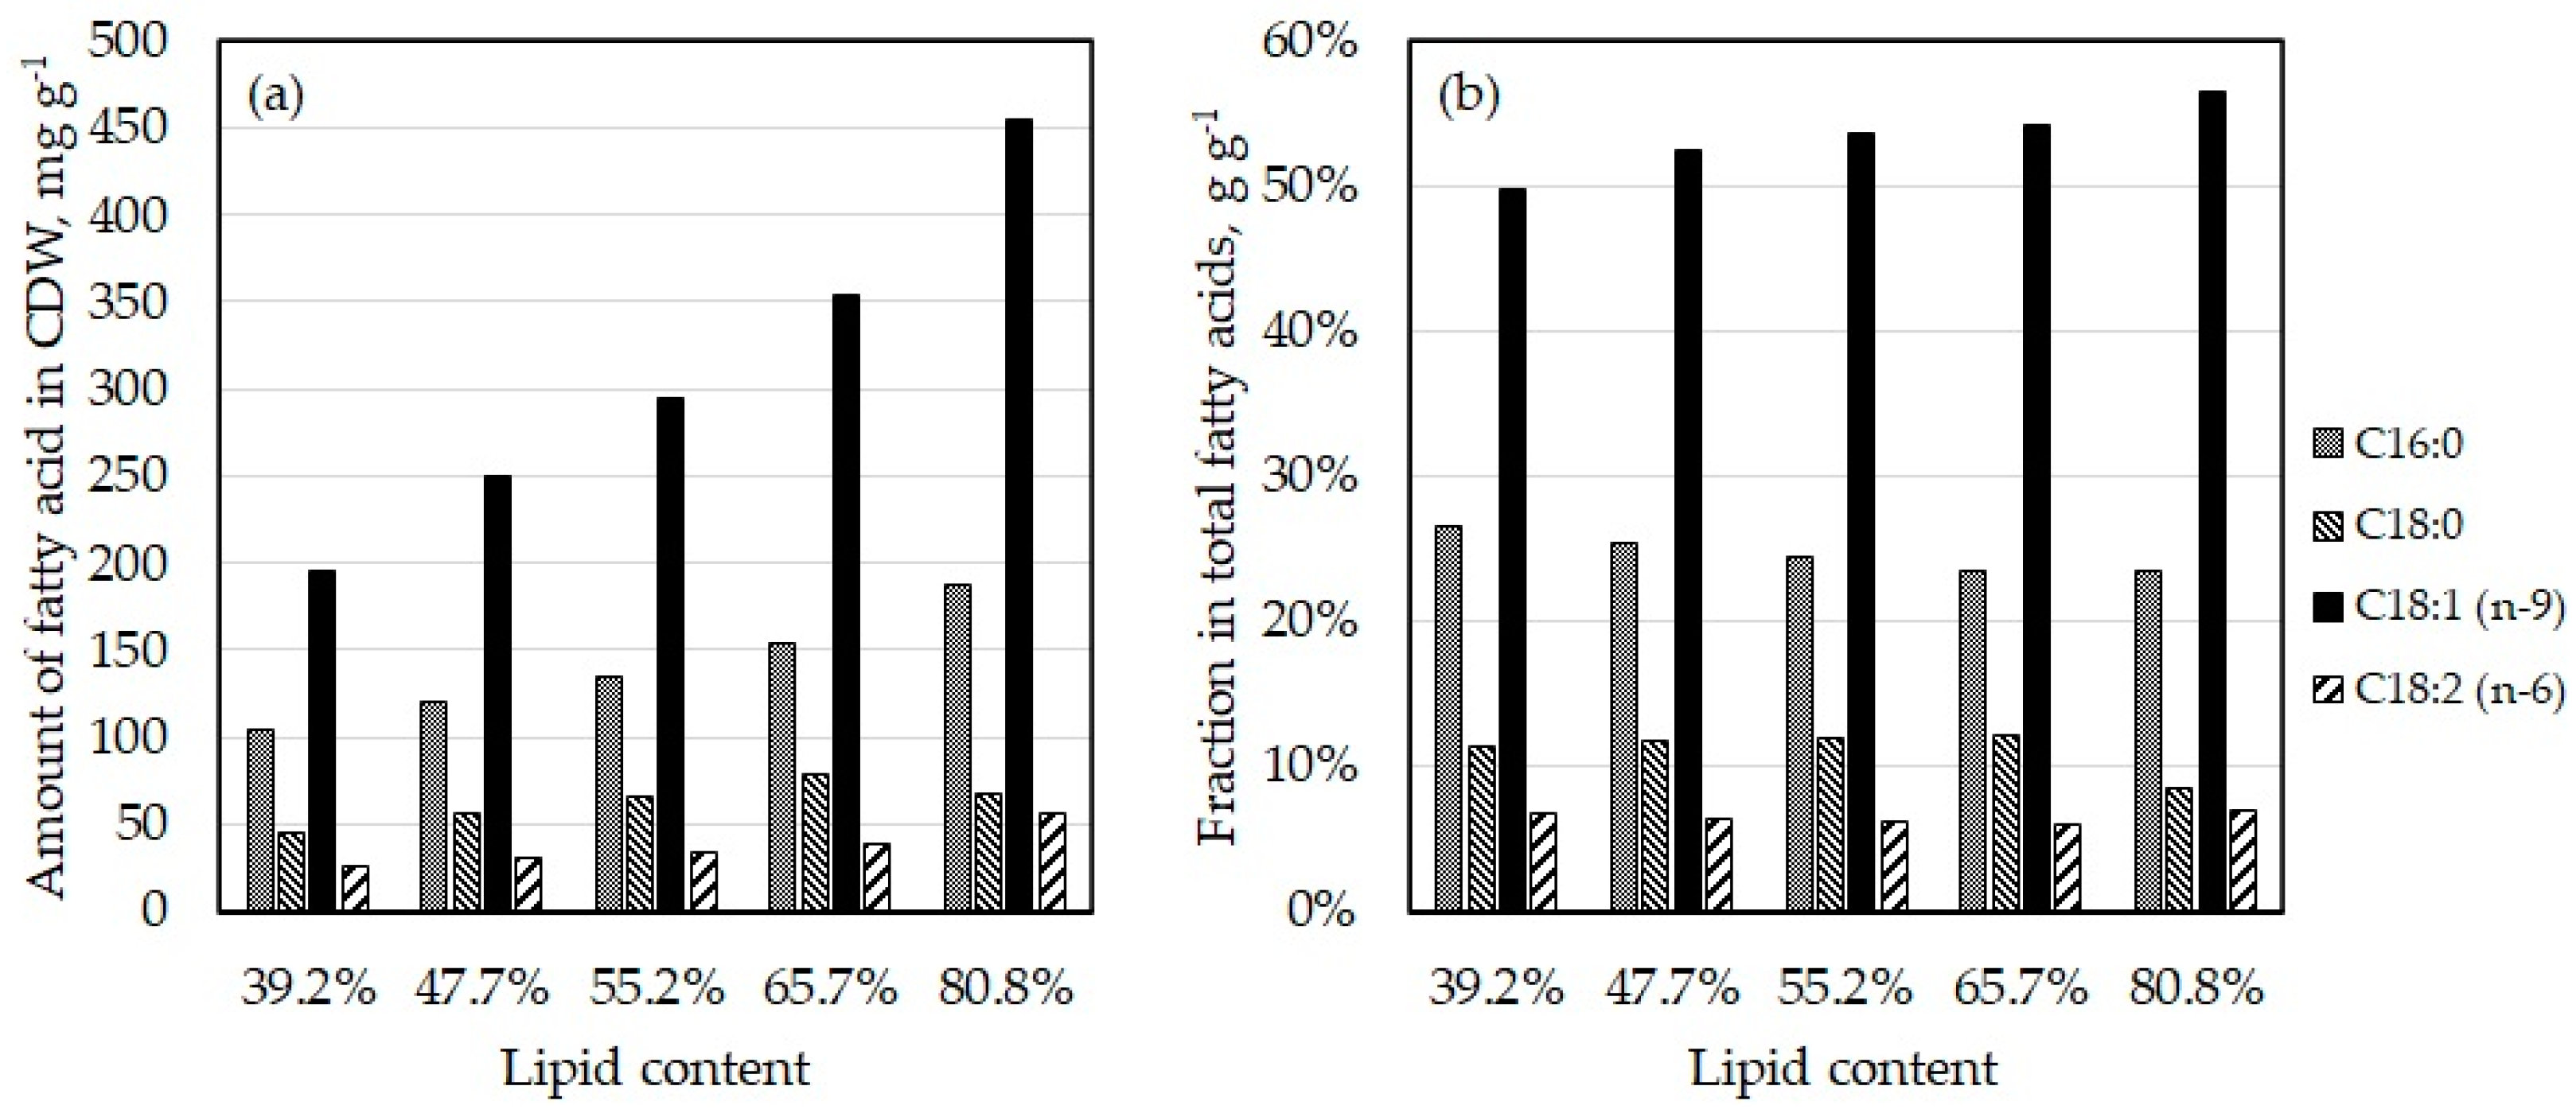
3.2. Fatty Acid Composition

The fatty acid composition of the C. oleaginosus cells after lipid production under P-depleted conditions is shown in Table 2. Among all of them, two fatty acids stand out as the main constituents of this yeast oil, namely oleic acid and palmitic acid, with 52–57% and 23%, respectively. These are followed by stearic acid and linoleic acid but with much smaller fractions of around 10% and 6%. For comparison, data from two similar studies and compositions of some plant oils are presented as well. Even though this yeast oil consists of mostly oleic acid, its overall fatty acid profile resembles that of palm oil rather than olive oil. It is reported in the literature that the exact fatty acid composition of C. oleaginosus oil might vary depending on the carbon and nitrogen sources present in the substrate; however, the differences are relatively small [11,27,41].
As shown in Figure 3, the fatty acid composition of C. oleaginosus changes only marginally over the process time with increasing lipid quota of yeast cells. The most noticeable changes are the increase in the oleic acid fraction by 6.6% and the decrease in the palmitic acid fraction by 3.21%.

3.3. Elemental Composition

The elemental composition of the C. oleaginosus cells before and after lipid production under P-depleted conditions, as well as that of the yeast oil produced in this manner, are listed in Table 3. The mass fractions of the elements in the dry cell biomass are very similar to the values reported for various oleaginous yeasts considering the given cellular lipid content [43]. The elemental composition of the C. oleaginosus biomass with low lipid quota and the lipid-free biomass are very much in conformity with the mass fractions of the elements reported for oleaginous yeast Rhodosporidium toruloides (C 43.87%, H 6.74%, O 42.64%, and N 6.75% for lipid content of 1% (w/w)) by Zhou et al. [44].
According to the elemental analysis data presented in Table 3, the elemental formula of the C. oleaginosus cells with 14.8% (w/w) lipid content (calculated using the CDW and lipid concentration measured as described in Section 2.4 and 2.5) corresponds to CH1.76O0.47N0.16 and that of the yeast oil to CH1.97O0.11. These values are consistent with the values stated for yeast biomass and yeast oil in the literature [24,45]. The elemental formula of the lipid-free CDW of C. oleaginosus was calculated as CH1.70O0.58N0.21.

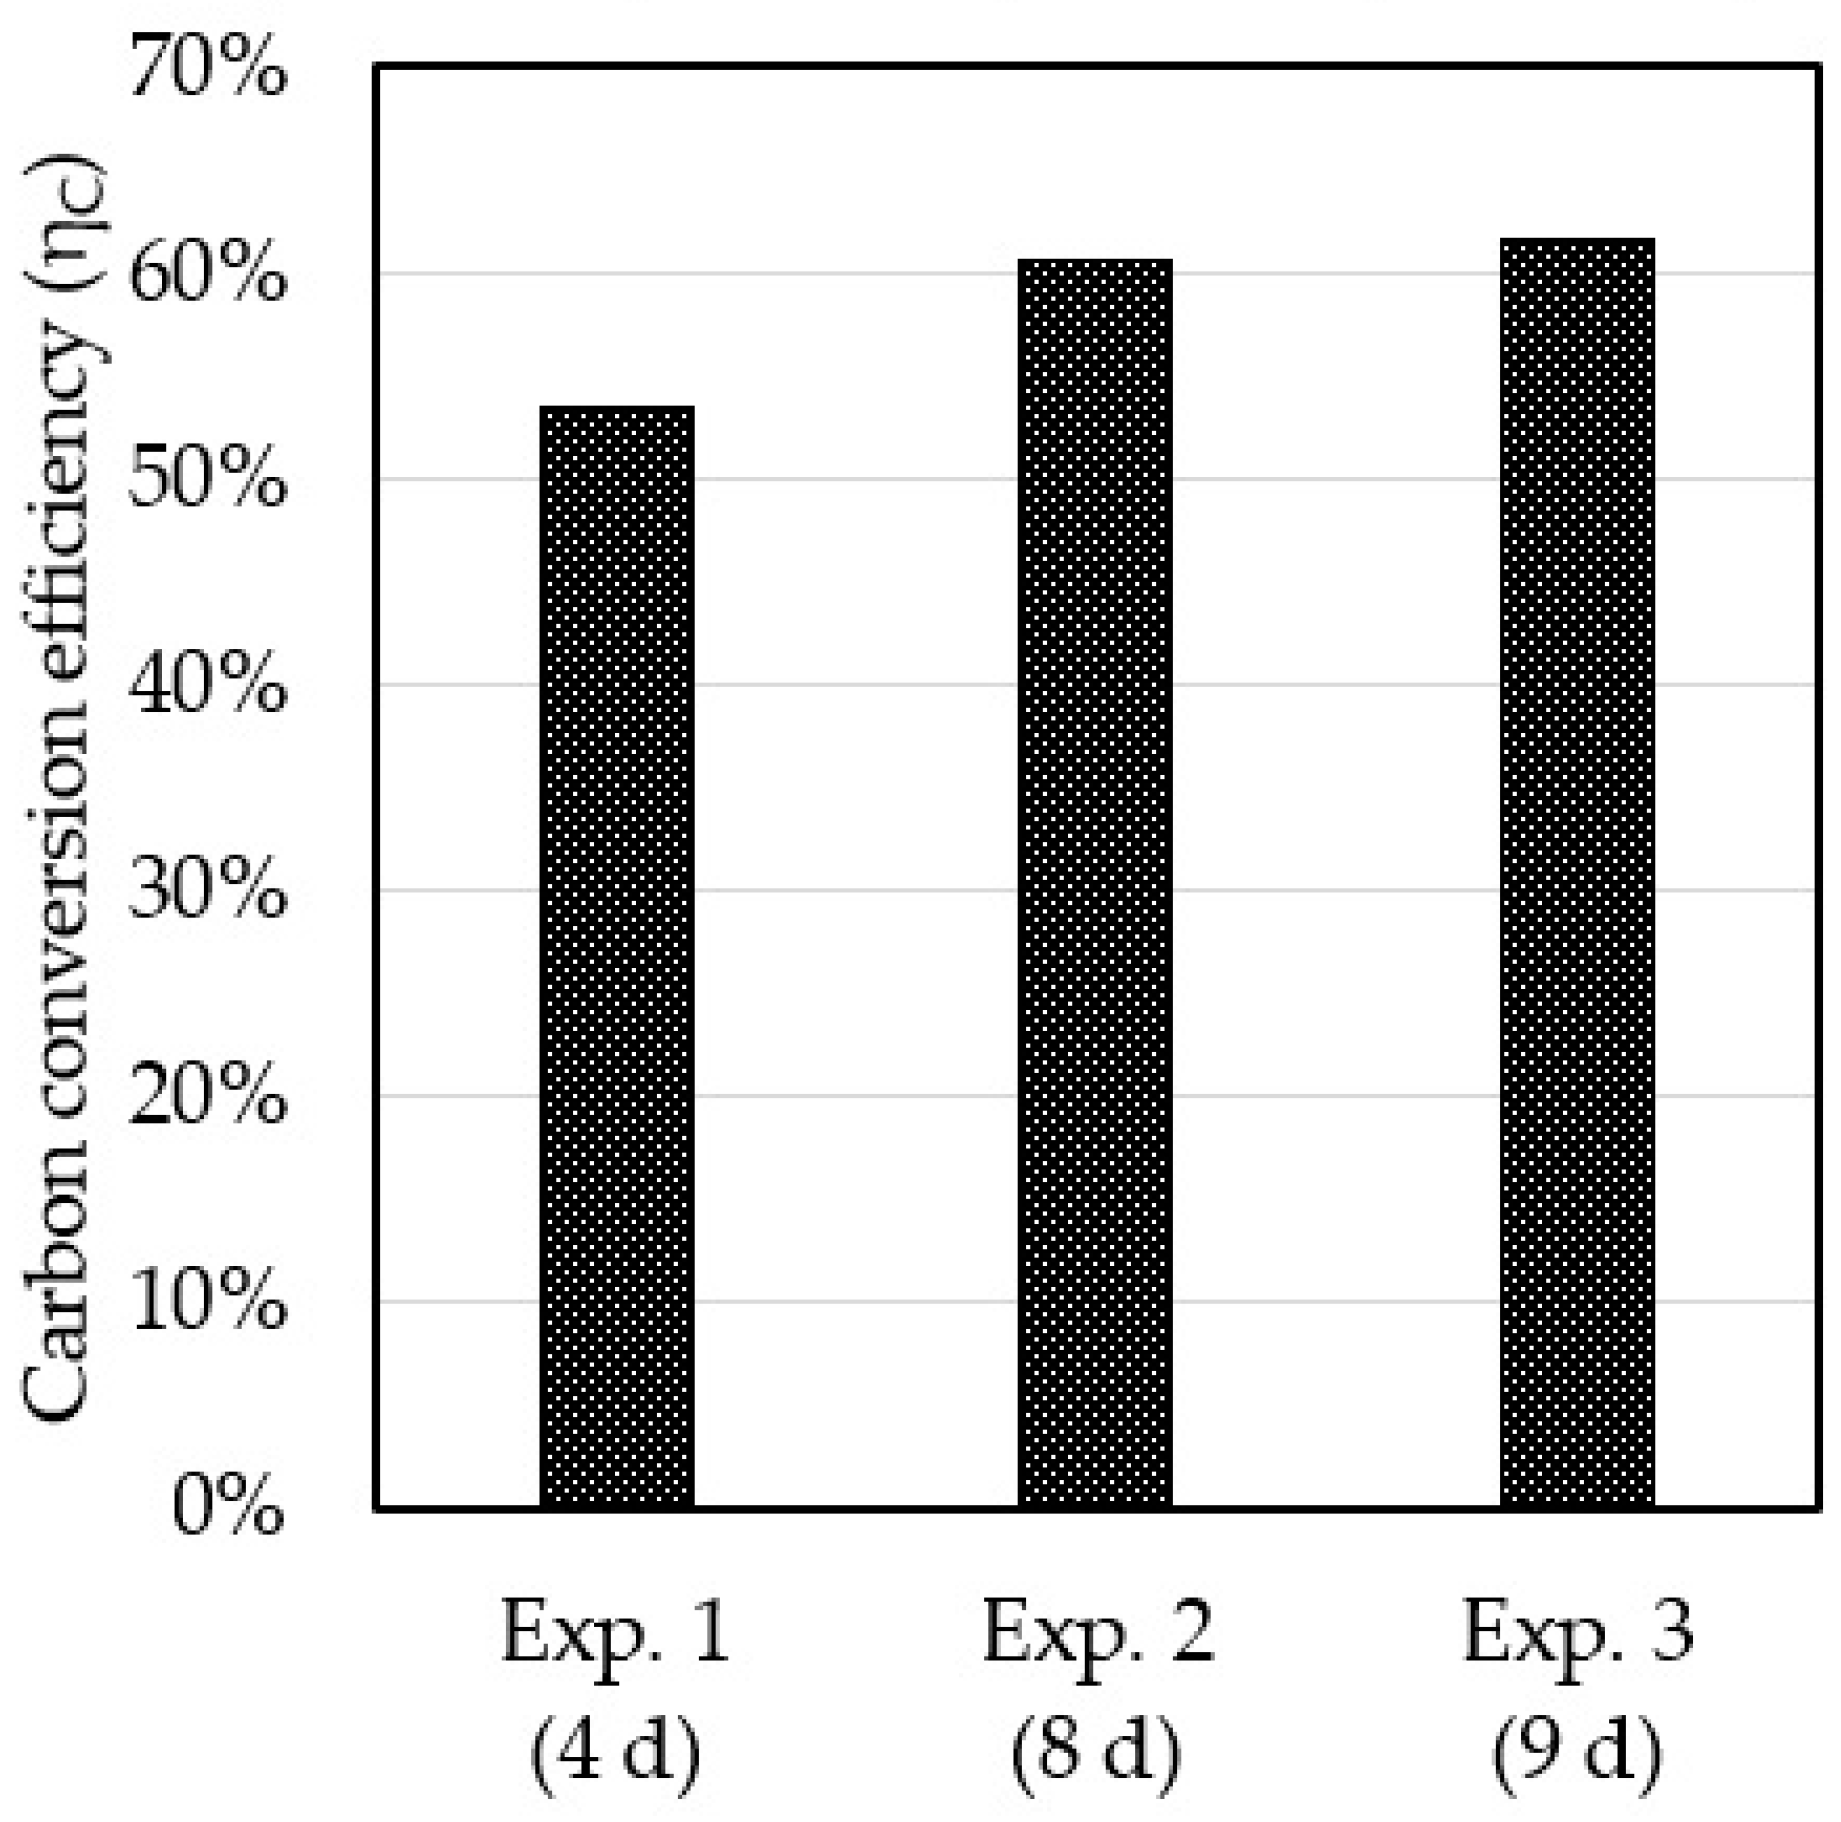
3.4. Carbon Balance and Conversion Efficiency

The carbon fed to the yeast in the form of sugars is used for cell growth, lipid production, and energy gain by respiration generating CO2. The overall carbon balance was calculated as described in Section 2.9 using the elemental composition of the lipid-free dry biomass and yeast oil. For all experiments, the calculated fraction of the total carbon consumed by the yeast, which was converted into lipid-free CDW, lipids, or CO2 at the end of the specified process time, is provided in Table 4. On average, 58.3% (±3.6%) of the carbon was successfully converted into lipids, whereas the remaining 30.3% (±2.5%) was assumed to be completely oxidized and released as CO2 in the exhaust gas. In Figure 4, the carbon conversion efficiency (ηC) achieved in all experiments is displayed schematically. Considering that the short process duration in Experiment 1 was the apparent cause of the rather lower carbon conversion efficiency, an average of Experiments 2 and 3 is more meaningful to note, which equals 60.8% (±0.5%).
In a biorefinery using biomass as raw material, conversion of valuable carbon sources into microbial oils with the highest efficiency possible would be one of the most important objectives. Therefore, it is quite remarkable that we could demonstrate in this study that a high-cell-density yeast oil production process with a dilute substrate would reliably achieve carbon conversion efficiency exceeding 50% (up to 61.3%). It should be considered that carbon conversion efficiency could decrease somewhat depending on the chosen method of yeast oil extraction. In the literature, lipid recovery yields of over 90% from oleaginous yeasts are reported when a cell disruption method, such as acid treatment or high-pressure homogenization, is followed by wet solvent extraction of yeast oil [46,47].

4. Conclusions

Using a membrane bioreactor with total cell retention enabled high-cell-density yeast oil production with a dilute substrate imitating a microalgae hydrolysate. Although this has been investigated before on a liter scale with a cross-flow ultrafiltration module [24], in this study, it has been demonstrated on a 50 L scale with an MBR consisting of a steam-sterilizable cross-flow microfiltration unit suitable for industrial use and with a semi-continuous mode of operation to reduce operational costs (8 h filtration within 24 h). Very high cellular lipid contents of up to 76.5% (w/w), an average lipid yield of 0.32 g g−1, and a lipid STY of up to 0.37 g L−1 h−1 were achieved with oleaginous yeast C. oleaginosus. Additionally, elemental analysis of the yeast cells and the produced yeast oil enabled accurate mass balance calculations, and, thus, it could be confirmed that carbon conversion efficiencies of up to 61.5% can be reached using this method.
After demonstration of the MBR system, operating mode, and process parameters used in this study as suitable for high-cell-density yeast oil production with dilute substrates, the next logical step would be to apply this method for oil production using real microalgae biomass hydrolysate as a substrate. For one such experiment (requiring 340 L of microalgae biomass hydrolysate with a sugar concentration of 50 g L−1), 85 kg of dry microalgae biomass with a carbohydrate content of 26% (w/w) [18] would be needed, assuming a saccharification efficiency of 90% for the microalgae biomass hydrolysis [16,48,49]. In that case, (1) choice of microalgae strain, (2) the cultivation conditions, (3) the process steps for hydrolysis to be applied, and (4) the downstream processing steps used are of utmost importance for the overall efficiency, productivity, and profitability of the microbial oil production process and should, therefore, be carefully selected specifically for this purpose.

Supplementary Materials

The following supporting information can be downloaded at: https://www.mdpi.com/article/10.3390/en16041757/s1, Figure S1: A batch process with C. oleaginosus in a stirred-tank bioreactor on 3 L scale to check for possible substrate preferences; Figure S2: Experimental results from Figure 2 with CDW and lipid amounts presented as concentration.

Author Contributions

Conceptualization, A.K., T.B. and D.W.-B.; methodology, validation, formal analysis, and investigation, A.K., K.B., T.P. and L.S.-R.; writing—original draft preparation, A.K.; writing—review and editing, T.B. and D.W.-B.; visualization, A.K.; supervision, D.W.-B.; project administration, T.B. and D.W.-B.; funding acquisition, T.B. and D.W.-B. All authors have read and agreed to the published version of the manuscript.

Funding

This research was funded by the German Federal Ministry of Education and Research (BMBF, Berlin, Germany) under grant number 03SF0577A.

Data Availability Statement

Data presented in this manuscript are available upon request from the corresponding author.

Acknowledgments

The authors gratefully acknowledge support by Jeremy von Poschinger and Emil Korzin at the TUM Pilot Plant for Industrial Biotechnology, Garching, Germany. We also thank Ulrike Ammari at the Analytical Department of the TUM Catalysis Research Center (CRC) for performing the elemental analysis. The support of Ayse Koruyucu by the TUM Graduate School (Technical University of Munich, Germany) is acknowledged as well.

Conflicts of Interest

The authors declare no conflict of interest. The funders had no role in the design of the study; in the collection, analyses, or interpretation of data; in the writing of the manuscript; or in the decision to publish the results.

References

  1. Green Deal: EU Agrees Law to Fight Global Deforestation and Forest Degradation Driven by EU Production and Consumption. Available online: https://ec.europa.eu/commission/presscorner/detail/en/ip_22_7444 (accessed on 30 January 2023).
  2. The Paris Agreement. Available online: https://unfccc.int/process-and-meetings/the-paris-agreement/the-paris-agreement (accessed on 30 January 2023).
  3. Koutinas, A.A.; Chatzifragkou, A.; Kopsahelis, N.; Papanikolaou, S.; Kookos, I.K. Design and techno-economic evaluation of microbial oil production as a renewable resource for biodiesel and oleochemical production. Fuel 2014, 116, 566–577. [Google Scholar] [CrossRef]
  4. Ratledge, C. Single cell oils—Have they a biotechnological future? Trends Biotechnol. 1993, 11, 278–284. [Google Scholar] [CrossRef] [PubMed]
  5. Masri, M.A.; Garbe, D.; Mehlmer, N.; Brück, T. A sustainable, high-performance process for the economic production of waste-free microbial oils that can replace plant-based equivalents. Energy Environ. Sci. 2019, 12, 2717–2732. [Google Scholar] [CrossRef]
  6. Thorpe, R.F.; Ratledge, C. Fatty Acid Distribution in Triglycerides of Yeasts Grown on Glucose or n-Alkanes. J. Gen. Microbiol. 1972, 72, 151–163. [Google Scholar] [CrossRef]
  7. Abeln, F.; Chuck, C.J. The history, state of the art and future prospects for oleaginous yeast research. Microb. Cell Fact. 2021, 20, 221. [Google Scholar] [CrossRef] [PubMed]
  8. Angerbauer, C.; Siebenhofer, M.; Mittelbach, M.; Guebitz, G.M. Conversion of sewage sludge into lipids by Lipomyces starkeyi for biodiesel production. Bioresour. Technol. 2008, 99, 3051–3056. [Google Scholar] [CrossRef]
  9. Xue, F.; Miao, J.; Zhang, X.; Luo, H.; Tan, T. Studies on lipid production by Rhodotorula glutinis fermentation using monosodium glutamate wastewater as culture medium. Bioresour. Technol. 2008, 99, 5923–5927. [Google Scholar] [CrossRef]
  10. Yousuf, A.; Sannino, F.; Addorisio, V.; Pirozzi, D. Microbial Conversion of Olive Oil Mill Wastewaters into Lipids Suitable for Biodiesel Production. J. Agric. Food Chem. 2010, 58, 8630–8635. [Google Scholar] [CrossRef]
  11. Shaigani, P.; Awad, D.; Redai, V.; Fuchs, M.; Haack, M.; Mehlmer, N.; Brueck, T. Oleaginous yeasts-substrate preference and lipid productivity: A view on the performance of microbial lipid producers. Microb. Cell Fact. 2021, 20, 220. [Google Scholar] [CrossRef]
  12. Grubišić, M.; Perečinec, M.G.; Peremin, I.; Mihajlovski, K.; Beluhan, S.; Šantek, B.; Šantek, M.I. Optimization of Pretreatment Conditions and Enzymatic Hydrolysis of Corn Cobs for Production of Microbial Lipids by Trichosporon oleaginosus. Energies 2022, 15, 3208. [Google Scholar] [CrossRef]
  13. Grubišić, M.; Mihajlovski, K.; Gruičić, A.M.; Beluhan, S.; Šantek, B.; Šantek, M.I. Strategies for Improvement of Lipid Production by Yeast Trichosporon oleaginosus from Lignocellulosic Biomass. J. Fungi 2021, 7, 934. [Google Scholar] [CrossRef] [PubMed]
  14. Moon, N.J.; Hammond, E.G.; Glatz, B.A. Conversion of Cheese Whey and Whey Permeate to Oil and Single-Cell Protein. J. Dairy Sci. 1978, 61, 1537–1547. [Google Scholar] [CrossRef]
  15. Masri, M.A.; Younes, S.; Haack, M.; Qoura, F.; Mehlmer, N.; Brück, T. A Seagrass-Based Biorefinery for Generation of Single-Cell Oils for Biofuel and Oleochemical Production. Energy Technol. 2018, 6, 1026–1038. [Google Scholar] [CrossRef]
  16. Younes, S.; Bracharz, F.; Awad, D.; Qoura, F.; Mehlmer, N.; Brueck, T. Microbial lipid production by oleaginous yeasts grown on Scenedesmus obtusiusculus microalgae biomass hydrolysate. Bioprocess Biosyst. Eng. 2020, 43, 1629–1638. [Google Scholar] [CrossRef] [PubMed]
  17. Di Fidio, N.; Minonne, F.; Antonetti, C.; Galletti, A.M.R. Cutaneotrichosporon oleaginosus: A Versatile Whole-Cell Biocatalyst for the Production of Single-Cell Oil from Agro-Industrial Wastes. Catalysts 2021, 11, 1291. [Google Scholar] [CrossRef]
  18. Schädler, T.; Cerbon, D.C.; de Oliveira, L.; Garbe, D.; Brück, T.; Weuster-Botz, D. Production of lipids with Microchloropsis salina in open thin-layer cascade photobioreactors. Bioresour. Technol. 2019, 289, 121682. [Google Scholar] [CrossRef]
  19. Brenner, A.; Abeliovich, A. Water Purification: Algae in Wastewater Oxidation Ponds. In Handbook of Microalgal Culture; John Wiley & Sons: Hoboken, NJ, USA, 2013; pp. 595–601. [Google Scholar]
  20. Kaplan, D. Absorption and Adsorption of Heavy Metals by Microalgae. In Handbook of Microalgal Culture; John Wiley & Sons: Hoboken, NJ, USA, 2013; pp. 602–611. [Google Scholar]
  21. Becker, E.W. Microalgae for Aquaculture: Nutritional Aspects. In Handbook of Microalgal Culture; John Wiley & Sons: Hoboken, NJ, USA, 2013; pp. 671–691. [Google Scholar]
  22. Muller-Feuga, A. Microalgae for Aquaculture: The Current Global Situation and Future Trends. In Handbook of Microalgal Culture; John Wiley & Sons: Hoboken, NJ, USA, 2013; pp. 613–627. [Google Scholar]
  23. Ratledge, C. Single Cell Oils for the 21st Century. In Single Cell Oils: Microbial and Algal Oils; AOCS Publishing: New York, NY, USA, 2005; pp. 1–20. [Google Scholar]
  24. Meo, A.; Priebe, X.L.; Weuster-Botz, D. Lipid production with Trichosporon oleaginosus in a membrane bioreactor using microalgae hydrolysate. J. Biotechnol. 2017, 241, 1–10. [Google Scholar] [CrossRef]
  25. Kourist, R.; Bracharz, F.; Lorenzen, J.; Kracht, O.N.; Chovatia, M.; Daum, C.; Deshpande, S.; Lipzen, A.; Nolan, M.; Ohm, R.A.; et al. Genomics and Transcriptomics Analyses of the Oil-Accumulating Basidiomycete Yeast Trichosporon oleaginosus: Insights into Substrate Utilization and Alternative Evolutionary Trajectories of Fungal Mating Systems. mBio 2015, 6, e00918-15. [Google Scholar] [CrossRef]
  26. Yaguchi, A.; Rives, D.; Blenner, M. New kids on the block: Emerging oleaginous yeast of biotechnological importance. AIMS Microbiol. 2017, 3, 227–247. [Google Scholar] [CrossRef]
  27. Karayannis, D.; Papanikolaou, S.; Vatistas, C.; Paris, C.; Chevalot, I. Yeast Lipid Produced through Glycerol Conversions and Its Use for Enzymatic Synthesis of Amino Acid-Based Biosurfactants. Int. J. Mol. Sci. 2023, 24, 714. [Google Scholar] [CrossRef]
  28. Ykema, A.; Verbree, E.C.; Kater, M.M.; Smit, H. Optimization of lipid production in the oleaginous yeast Apiotrichum curvatum in wheypermeate. Appl. Microbiol. Biotechnol. 1988, 29, 211–218. [Google Scholar] [CrossRef]
  29. Yaguchi, A.; Robinson, A.; Mihealsick, E.; Blenner, M. Metabolism of aromatics by Trichosporon oleaginosus while remaining oleaginous. Microb. Cell Fact. 2017, 16, 206. [Google Scholar] [CrossRef] [PubMed]
  30. Bracharz, F.; Beukhout, T.; Mehlmer, N.; Brück, T. Opportunities and challenges in the development of Cutaneotrichosporon oleaginosus ATCC 20509 as a new cell factory for custom tailored microbial oils. Microb. Cell Fact. 2017, 16, 178. [Google Scholar] [CrossRef] [PubMed]
  31. Yu, X.; Zeng, J.; Zheng, Y.; Chen, S. Effect of lignocellulose degradation products on microbial biomass and lipid production by the oleaginous yeast Cryptococcus curvatus. Process Biochem. 2014, 49, 457–465. [Google Scholar] [CrossRef]
  32. Yu, X.; Zheng, Y.; Dorgan, K.M.; Chen, S. Oil production by oleaginous yeasts using the hydrolysate from pretreatment of wheat straw with dilute sulfuric acid. Bioresour. Technol. 2011, 102, 6134–6140. [Google Scholar] [CrossRef]
  33. Sabelfeld, M.; Geißen, S.-U. Processes for the Elimination and Recovery of Phosphorus from Municipal Wastewater. Chem. Ing. Tech. 2011, 83, 782–795. [Google Scholar] [CrossRef]
  34. Hassan, M.; Blanc, P.J.; Granger, L.-M.; Pareilleux, A.; Goma, G. Influence of nitrogen and iron limitations on lipid production by Cryptococcus curvatus grown in batch and fed-batch culture. Process Biochem. 1996, 31, 355–361. [Google Scholar] [CrossRef]
  35. Mishra, S.K.; Suh, W.I.; Farooq, W.; Moon, M.; Shrivastav, A.; Park, M.S.; Yang, J.-W. Rapid quantification of microalgal lipids in aqueous medium by a simple colorimetric method. Bioresour. Technol. 2014, 155, 330–333. [Google Scholar] [CrossRef]
  36. Griffiths, M.J.; van Hille, R.P.; Harrison, S.T.L. Selection of Direct Transesterification as the Preferred Method for Assay of Fatty Acid Content of Microalgae. Lipids 2010, 45, 1053–1060. [Google Scholar] [CrossRef]
  37. Thurn, A.L.; Stock, A.; Gerwald, S.; Weuster-Botz, D. Simultaneous photoautotrophic production of DHA and EPA by Tisochrysis lutea and Microchloropsis salina in co-culture. Bioresour. Bioprocess. 2022, 9, 130. [Google Scholar] [CrossRef]
  38. Zhang, G.; French, W.T.; Hernandez, R.; Hall, J.; Sparks, D.; Holmes, W. Microbial lipid production as biodiesel feedstock from N-acetylglucosamine by oleaginous microorganisms. J. Chem. Technol. Biotechnol. 2011, 86, 642–650. [Google Scholar] [CrossRef]
  39. Meesters, P.A.E.P.; Huijberts, G.N.M.; Eggink, G. High-cell-density cultivation of the lipid accumulating yeast Cryptococcus curvatus using glycerol as a carbon source. Appl. Microbiol. Biotechnol. 1996, 45, 575–579. [Google Scholar] [CrossRef]
  40. Zhou, W.; Tang, M.; Zou, T.; Peng, N.; Zhao, M.; Gong, Z. Phosphate removal combined with acetate supplementation enhances lipid production from water hyacinth by Cutaneotrichosporon oleaginosum. Biotechnol. Biofuels 2019, 12, 148. [Google Scholar] [CrossRef] [PubMed]
  41. Awad, D.; Bohnen, F.; Mehlmer, N.; Brück, T. Multi-Factorial-Guided Media Optimization for Enhanced Biomass and Lipid Formation by the Oleaginous Yeast Cutaneotrichosporon oleaginosus. Front. Bioeng. Biotechnol. 2019, 7, 1219–1227. [Google Scholar] [CrossRef] [PubMed]
  42. Belitz, H.-D.; Grosch, W.; Schieberle, P. Lehrbuch der Lebensmittelchemie, 6th ed.; Springer: Berlin/Heidelberg, Germany, 2008; pp. 659–690. [Google Scholar]
  43. Minkevich, I.G.; Dedyukhina, E.G.; Chistyakova, T.I. The effect of lipid content on the elemental composition and energy capacity of yeast biomass. Appl. Microbiol. Biotechnol. 2010, 88, 799–806. [Google Scholar] [CrossRef] [PubMed]
  44. Zhou, W.; Li, Y.; Zhang, Y.; Zhao, Z.K. Energy efficiency evaluation of lipid production by oleaginous yeast Rhodosporidium toruloides. J. Therm. Anal. Calorim. 2012, 108, 119–126. [Google Scholar] [CrossRef]
  45. von Stockar, U.; Liu, J.S. Does microbial life always feed on negative entropy? Thermodynamic analysis of microbial growth. Biochim. Biophys. Acta Bioenerg. 1999, 1412, 191–211. [Google Scholar] [CrossRef]
  46. Kruger, J.S.; Cleveland, N.S.; Yeap, R.Y.; Dong, T.; Ramirez, K.J.; Nagle, N.J.; Lowell, A.C.; Beckham, G.T.; McMillan, J.D.; Biddy, M.J. Recovery of Fuel-Precursor Lipids from Oleaginous Yeast. ACS Sustain. Chem. Eng. 2018, 6, 2921–2931. [Google Scholar] [CrossRef]
  47. Khot, M.; Raut, G.; Ghosh, D.; Alarcón-Vivero, M.; Contreras, D.; Ravikumar, A. Lipid recovery from oleaginous yeasts: Perspectives and challenges for industrial applications. Fuel 2020, 259, 116292. [Google Scholar] [CrossRef]
  48. Scholz, M.J.; Weiss, T.L.; Jinkerson, R.E.; Jing, J.; Roth, R.; Goodenough, U.; Posewitz, M.C.; Gerken, H.G. Ultrastructure and Composition of the Nannochloropsis gaditana Cell Wall. Eukaryot. Cell 2014, 13, 1450–1464. [Google Scholar] [CrossRef] [Green Version]
  49. Demuez, M.; Mahdy, A.; Tomás-Pejó, E.; González-Fernández, C.; Ballesteros, M. Enzymatic cell disruption of microalgae biomass in biorefinery processes. Biotechnol. Bioeng. 2015, 112, 1955–1966. [Google Scholar] [CrossRef] [PubMed]
Figure 1. (a) Schematic illustration of the MBR system consisting of the stirred-tank bioreactor with a working volume of 50 L, a cross-flow microfiltration unit connected to it as an external bypass with a volume of 7.25 L, a 200 L feed tank, a permeate container, and peristaltic pumps for inlet and outlet streams; (b) a photograph of the steam-sterilizable MBR; (c) a photograph of the steam-sterilizable feed tank.
Energies 16 01757 g001
Figure 2. Three individual semi-continuous processes for yeast oil production with C. oleaginosus in a membrane bioreactor on 50 L scale with total cell retention. A defined medium was used with a low sugar concentration of 50 g L−1 (mixture of 80% glucose and 20% mannose) and a C/P ratio of 3515 g g−1. The black line shows the end of the batch phase and switch to semi-continuous mode of operation. The results of Experiment 1 are marked in orange (Energies 16 01757 i001), those of Experiment 2 in white (Energies 16 01757 i002), and those of Experiment 3 in black (Energies 16 01757 i003
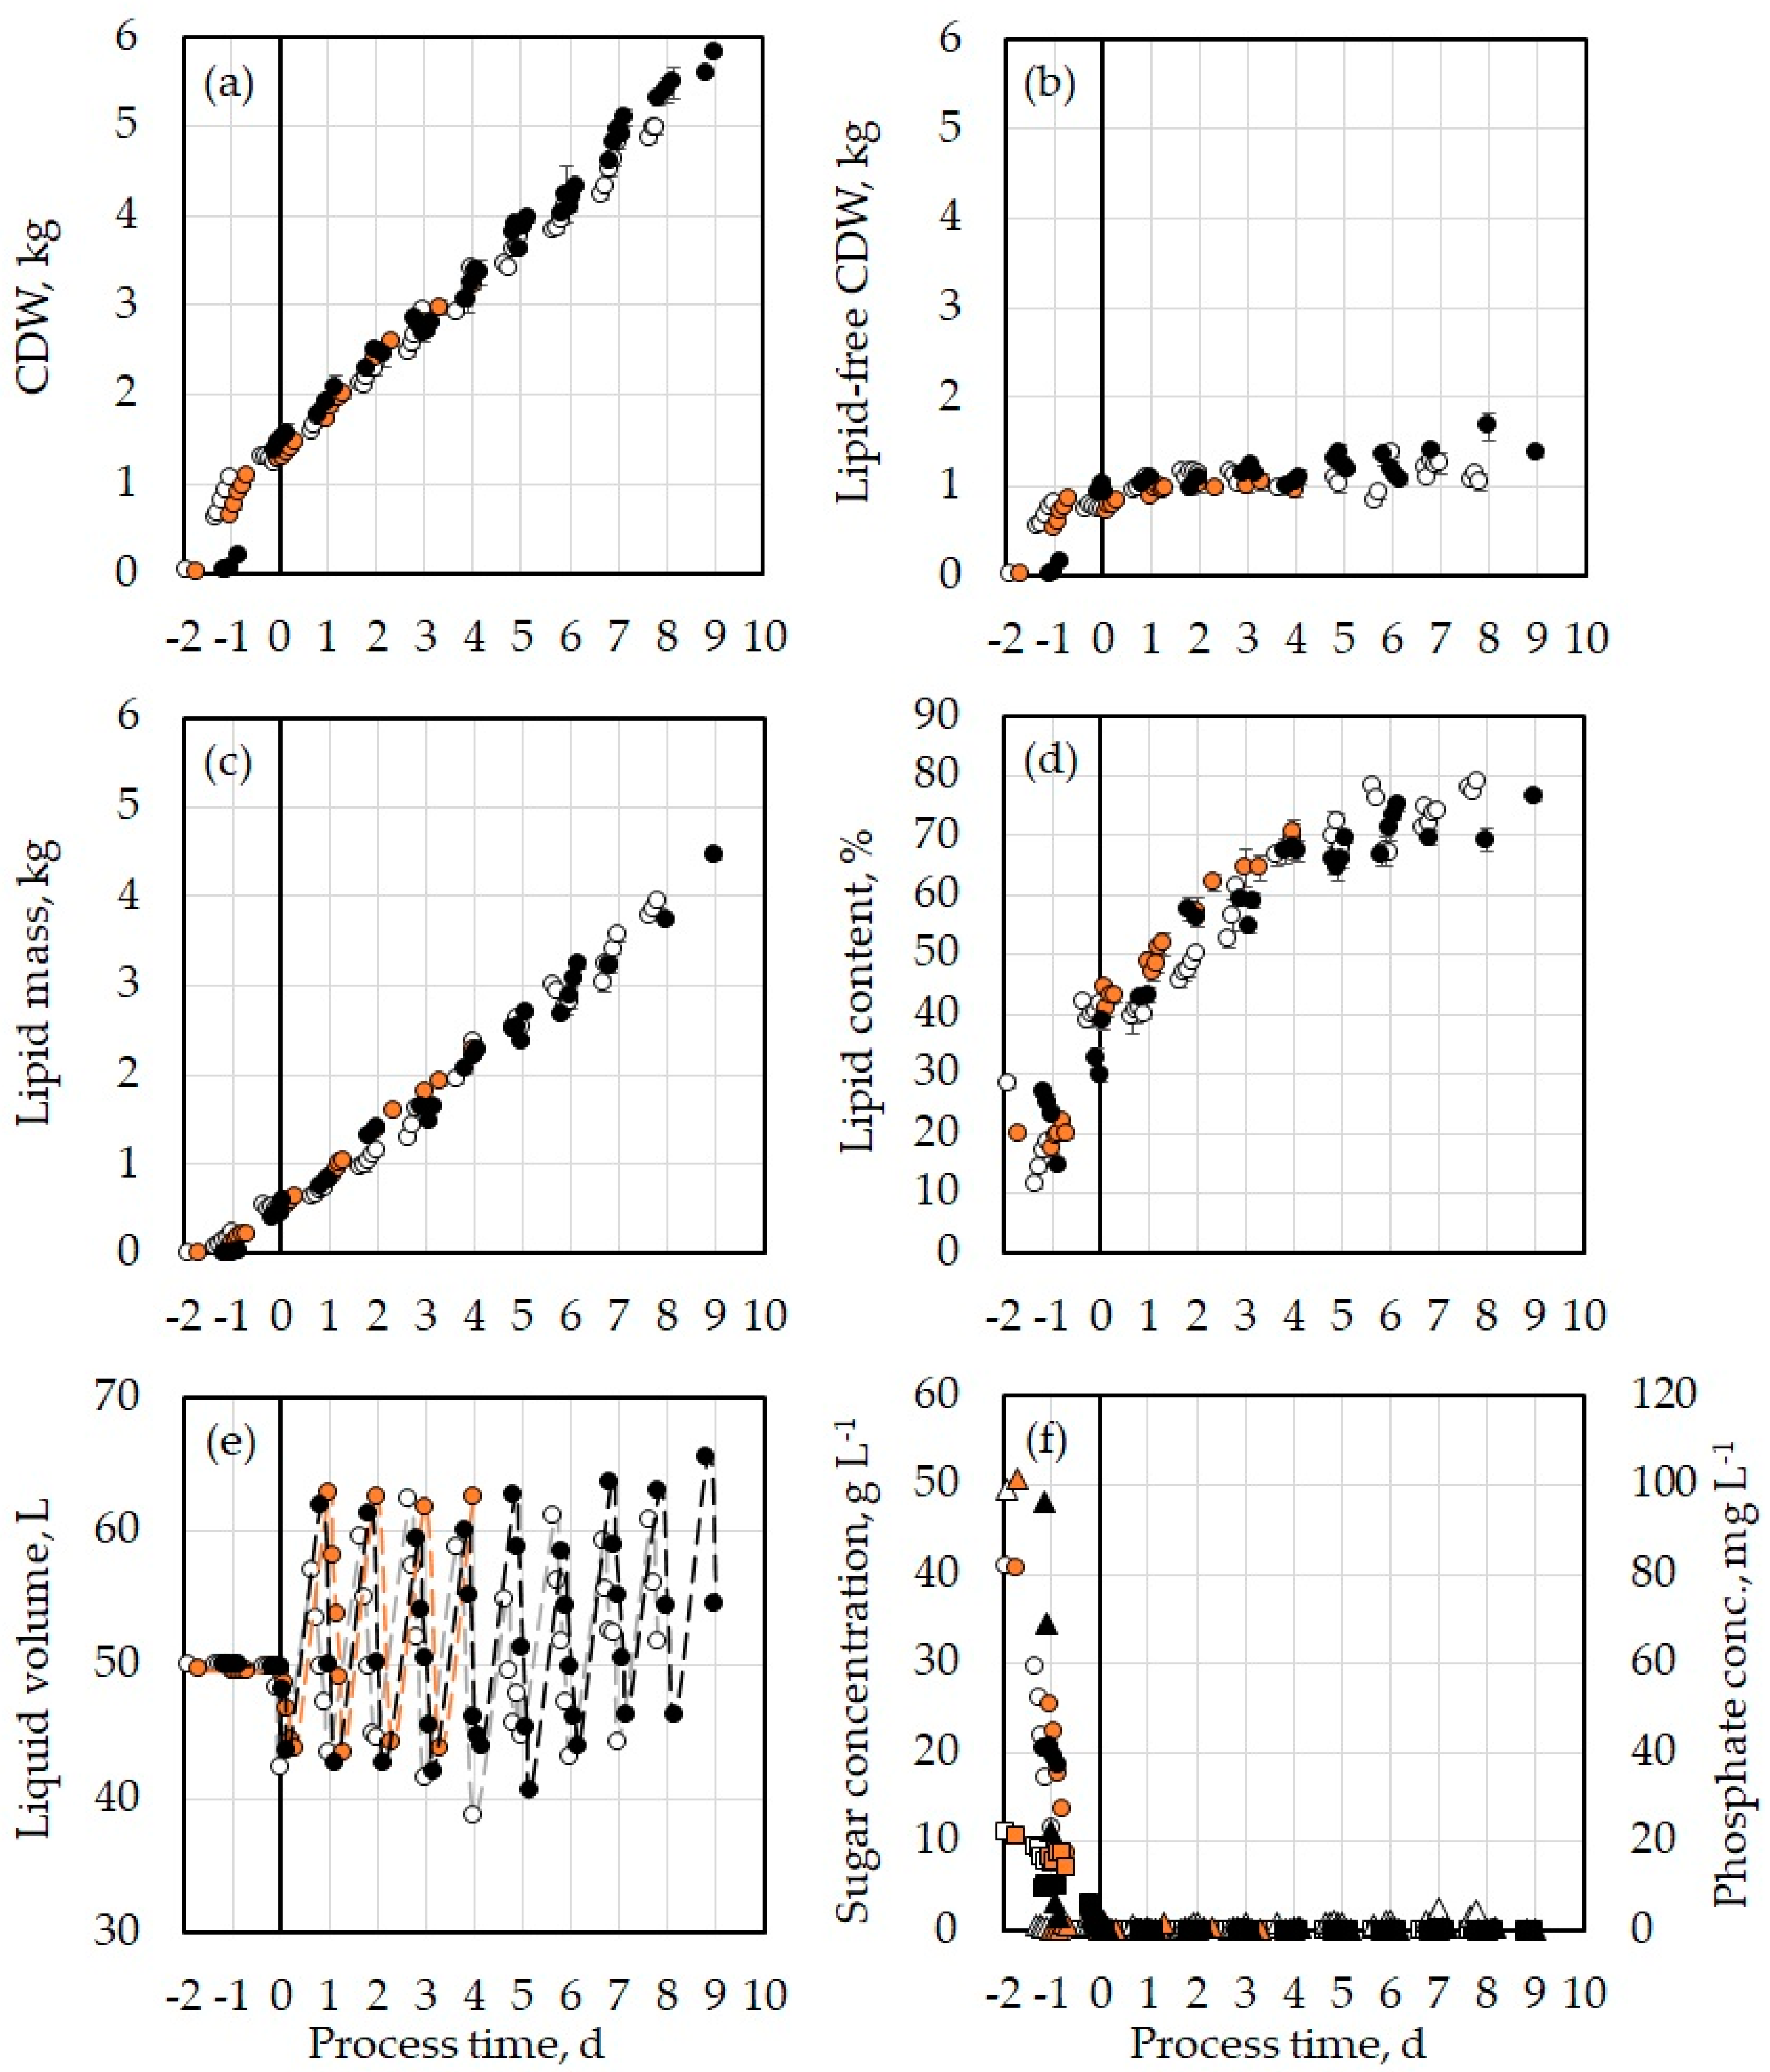
). The error bars show the standard deviation of the triplicate measurements. Presented are: (a) cell dry weight; (b) lipid-free cell dry weight; (c) lipid mass; (d) lipid content of the yeast cells; (e) liquid volume inside the MBR; (f) concentrations of glucose (●) and mannose (■) on the primary vertical axis and phosphate (▲) concentration on the secondary vertical axis with the corresponding marker color of each experiment.
Energies 16 01757 g002
Figure 3. Change in (a) the amount of certain fatty acids in the CDW and (b) the fraction of these in the total fatty acid content of C. oleaginosus cells with respect to the cellular lipid quota.
Energies 16 01757 g003
Figure 4. Overall carbon conversion efficiency (ηC) achieved with C. oleaginosus at the end of each experiment carried out using the MBR with semi-continuous mode of operation and a diluted substrate as cultivation medium (50 g L−1 sugars).
Energies 16 01757 g004
Table 1. Process data and state variables applied for operation of the MBR.
Process ParameterValue
Reactor typeStirred-tank bioreactor
Agitator type2 × Rushton turbines
Working volume including bypass 40–67 L
Bypass volume7.25 L
Temperature30 °C
pH6.5
Aeration rate50–100 NL min−1
Agitation350–800 rpm
Cross-flow filter typeMicrofilter with capillaries
Cross-flow filter materialCeramic (>99% SIC)
Cross-flow filter pore size0.25 μm
Volumetric flow rate in bypass150 L h−1
Mean residence time in bypass2.9 min
Table 2. Fatty acid composition of yeast oil produced with C. oleaginous using phosphor-depleted medium in this study presented together with data from other comparable studies in the literature and fatty acid profiles of similar plant oils, namely olive oil and palm oil.
Fraction in Total Fatty Acids, % (w/w)
Fatty AcidTrivial NameExp. 1Exp. 2Meo et al. [24]Zhang et al. [38]Olive oil [42]Palm oil [42]
C14:0Myristic acid0.60.60.71.901
C16:0Palmitic acid23.123.525.932.011.543.8
C16:1Palmitoleic acid0.50.7-1.31.50.5
C18:0Stearic acid11.88.415.410.22.55
C18:1 (n-9)Oleic acid52.856.453.644.975.539
C18:2 (n-6)Linoleic acid5.87.13.65.07.510
C18:3 (n-3)α-Linolenic acid0.50.40.90.91.00.2
C20:0Arachidic acid0.40.3--0.50.5
C22:0Behenic acid0.20.2---
C24:0Lignoceric acid3.11.4---
C22:6 (n-3)DHA0.60.6---
C24:1 (n-9)Nervonic acid0.30.0---
Others0.20.3---
Table 3. Elemental composition of the C. oleaginosus cells with 14.8% (w/w) lipid quota of the CDW and the yeast oil produced. The composition of the lipid-free yeast dry mass was calculated by general mass balancing based on the other two measurements (dry cells and yeast oil) and the measured lipid content of the yeast cells.
Mass Fraction of the Element, %
CHNSOP
Dry yeast cells (14.8% (w/w) lipids)50.427.449.390.2331.620.91
Yeast oil76.2112.630.030.0011.050.06
Lipid-free yeast dry mass (calculated)45.946.5411.010.2635.191.06
Table 4. Fraction of total carbon consumed by the yeast, which was converted into lipid-free CDW, lipids, or CO2 at the end of high-cell-density oil production in the MBR after the specified process time.
Fraction of Total Carbon Consumed Converted into, %
Lipid-Free CDWLipidsCO2
Exp. 1 (4 d)13.453.333.3
Exp. 2 (8 d)9.660.330.1
Exp. 3 (9 d)11.461.327.3
Disclaimer/Publisher’s Note: The statements, opinions and data contained in all publications are solely those of the individual author(s) and contributor(s) and not of MDPI and/or the editor(s). MDPI and/or the editor(s) disclaim responsibility for any injury to people or property resulting from any ideas, methods, instructions or products referred to in the content.

