
Utilizing Locally Available Bioresources for Powering Remote Indigenous Communities: A Framework and Case Study


1
Energy and Resources Institute, Charles Darwin University, Darwin 0810, Australia
2
Research Institute for the Environment and Livelihoods, Charles Darwin University, Darwin 0810, Australia
*
Author to whom correspondence should be addressed.
Energies 2023, 16(2), 666; https://doi.org/10.3390/en16020666
Submission received: 28 November 2022
/
Revised: 30 December 2022
/
Accepted: 30 December 2022
/
Published: 5 January 2023
(This article belongs to the Special Issue Biomass Resources and Bio-Energy Potential)
Abstract
:We establish a framework to examine the feasibility of using local vegetation for bioenergy power systems in small-scale applications and remote settings. The framework has broad application, and we present a specific case here to demonstrate the process. Our case study is the Tiwi Islands in northern Australia, where a large Acacia mangium plantation is a potential source of biofuel feedstock. Two types of technology were considered: 1. Bio-oil from pyrolysis in diesel generators and 2. Direct combustion coupled with a steam turbine. The biomass was characterized and found to have adequate properties for an energy crop, with a lower heating value of about 18 MJ/kg and entire tree ash content of 2%. Measurements from trees that were damaged from wildfires had similar results, showing potential value recovery for a plantation after unplanned fire. In comparison to a petroleum diesel-based generator, the bio-oil system was 12% more expensive. The direct combustion system was found to be the most economical of those explored here, costing as low as 61% of the bio-oil system. Additional social and environmental benefits were identified, including local employment opportunities, improved energy security and reduced greenhouse gas emissions. Our findings of high techno-economic potential of bioenergy systems, especially through direct combustion, are widely applicable to on-demand renewable energy supply in remote communities.
1. Introduction
The supply of energy to remote communities is a global challenge, with about 20% of the world’s population lacking access to a major electricity grid network [1]. These are usually rural populations in developing countries where the major grid networks do not extend to [2]. The solution to providing electricity in cases where grid connections are not possible is the installation of micro-grids or standalone systems. Common technologies used to provide energy where grid connections are not possible include conventional diesel and gasoline generators as well as renewable energy sources such as biogas, photovoltaics (PV), wind, and hydro power [3]. The conventional sources have historically dominated, but now that reliability of renewable technologies has been established, the expenses continue to fall, and there is a desire to move away from fossil fuels, renewable systems are becoming increasingly competitive. Converting current microgrid power systems from conventional to renewable energy can also provide the blueprint for further dispersion of renewable power systems to locations that are currently without electricity.
In Australia, state and territory governments are responsible for supplying electricity to many of the remote communities, where the populations are often mainly Indigenous. Diesel and gas generators have been the dominant technology to meet the community demand [4]. Though there is growing introduction of PV and batteries into the remote power systems for daytime operations, diesel is still required for 24-h operations as the cost of battery storage is too high [5]. Due to the nature of the landscape and seasonal weather events, the logistics of diesel fuel delivery leads to substantially increased costs and can cause shortages and unreliability in the local network [6,7,8,9]. Local communities often experience power outages that can cause significant social disruption, including to health services. Many remote communities in northern and central Australia experience extreme weather such as very high temperatures during summer and/or cold during winter [10]. This is becoming more extreme due to climate change, increasing health risk due to a disrupted electricity supply [4,11,12]. By developing a microgrid that runs on locally produced feedstock, disruptions to the supply chain would be greatly reduced, leading to improved energy security in these regional communities. Since this essential service is typically provided at an economic loss at present, given the great expense of delivery to small populations in remote areas, our focus is on finding the option that is cost-effective and provides the best overall benefits to the community.
Here, we examine the techno-economic potential for replacing imported petroleum-based diesel fuel with local bioenergy for a more secure electricity supply that could also reduce greenhouse gas emissions, deliver financial savings, and provide regional employment opportunities. The technology used to meet the electricity demand in remote Australia needs to be reliable and robust to ensure communities are not left without power. Equipment parts and specialized services can be difficult to obtain, especially on short notice. Therefore, we have chosen to investigate two options: 1. pyrolysis oil (bio-oil) without upgrading for diesel generators, and 2. direct combustion of woody biomass. There has been little research on using bio-oil directly in internal combustion engines (ICE) in recent years, but it has been shown that with slight modifications, bio-oil is a usable fuel [13,14,15,16]. Since pyrolysis can be performed at small scales and in remote locations [17,18], we decided to revisit the use of bio-oil directly in diesel ICEs for electricity generation to determine if research on this process should be renewed for remote applications. This would allow the most straightforward application to the current diesel generator systems in place. Recent research is focused on upgrading bio-oils into higher quality fuels [19,20,21,22], but this adds complexity to the overall system and has yet to be proven on the small-scale, limiting their current appeal for remote applications. Therefore, more complicated systems were not explored in this study.
The second option we investigate is the direct combustion of biomass. Combustion in a boiler to create steam that runs a turbine is one of the oldest and simplest ways to generate electricity from a biomass source, and the technology has reached maturity [23,24]. While more modern methods have higher efficiencies, the total capital costs of a combustion system are much lower [13,25] and the systems have proven to be robust, an important characteristic for remote applications.
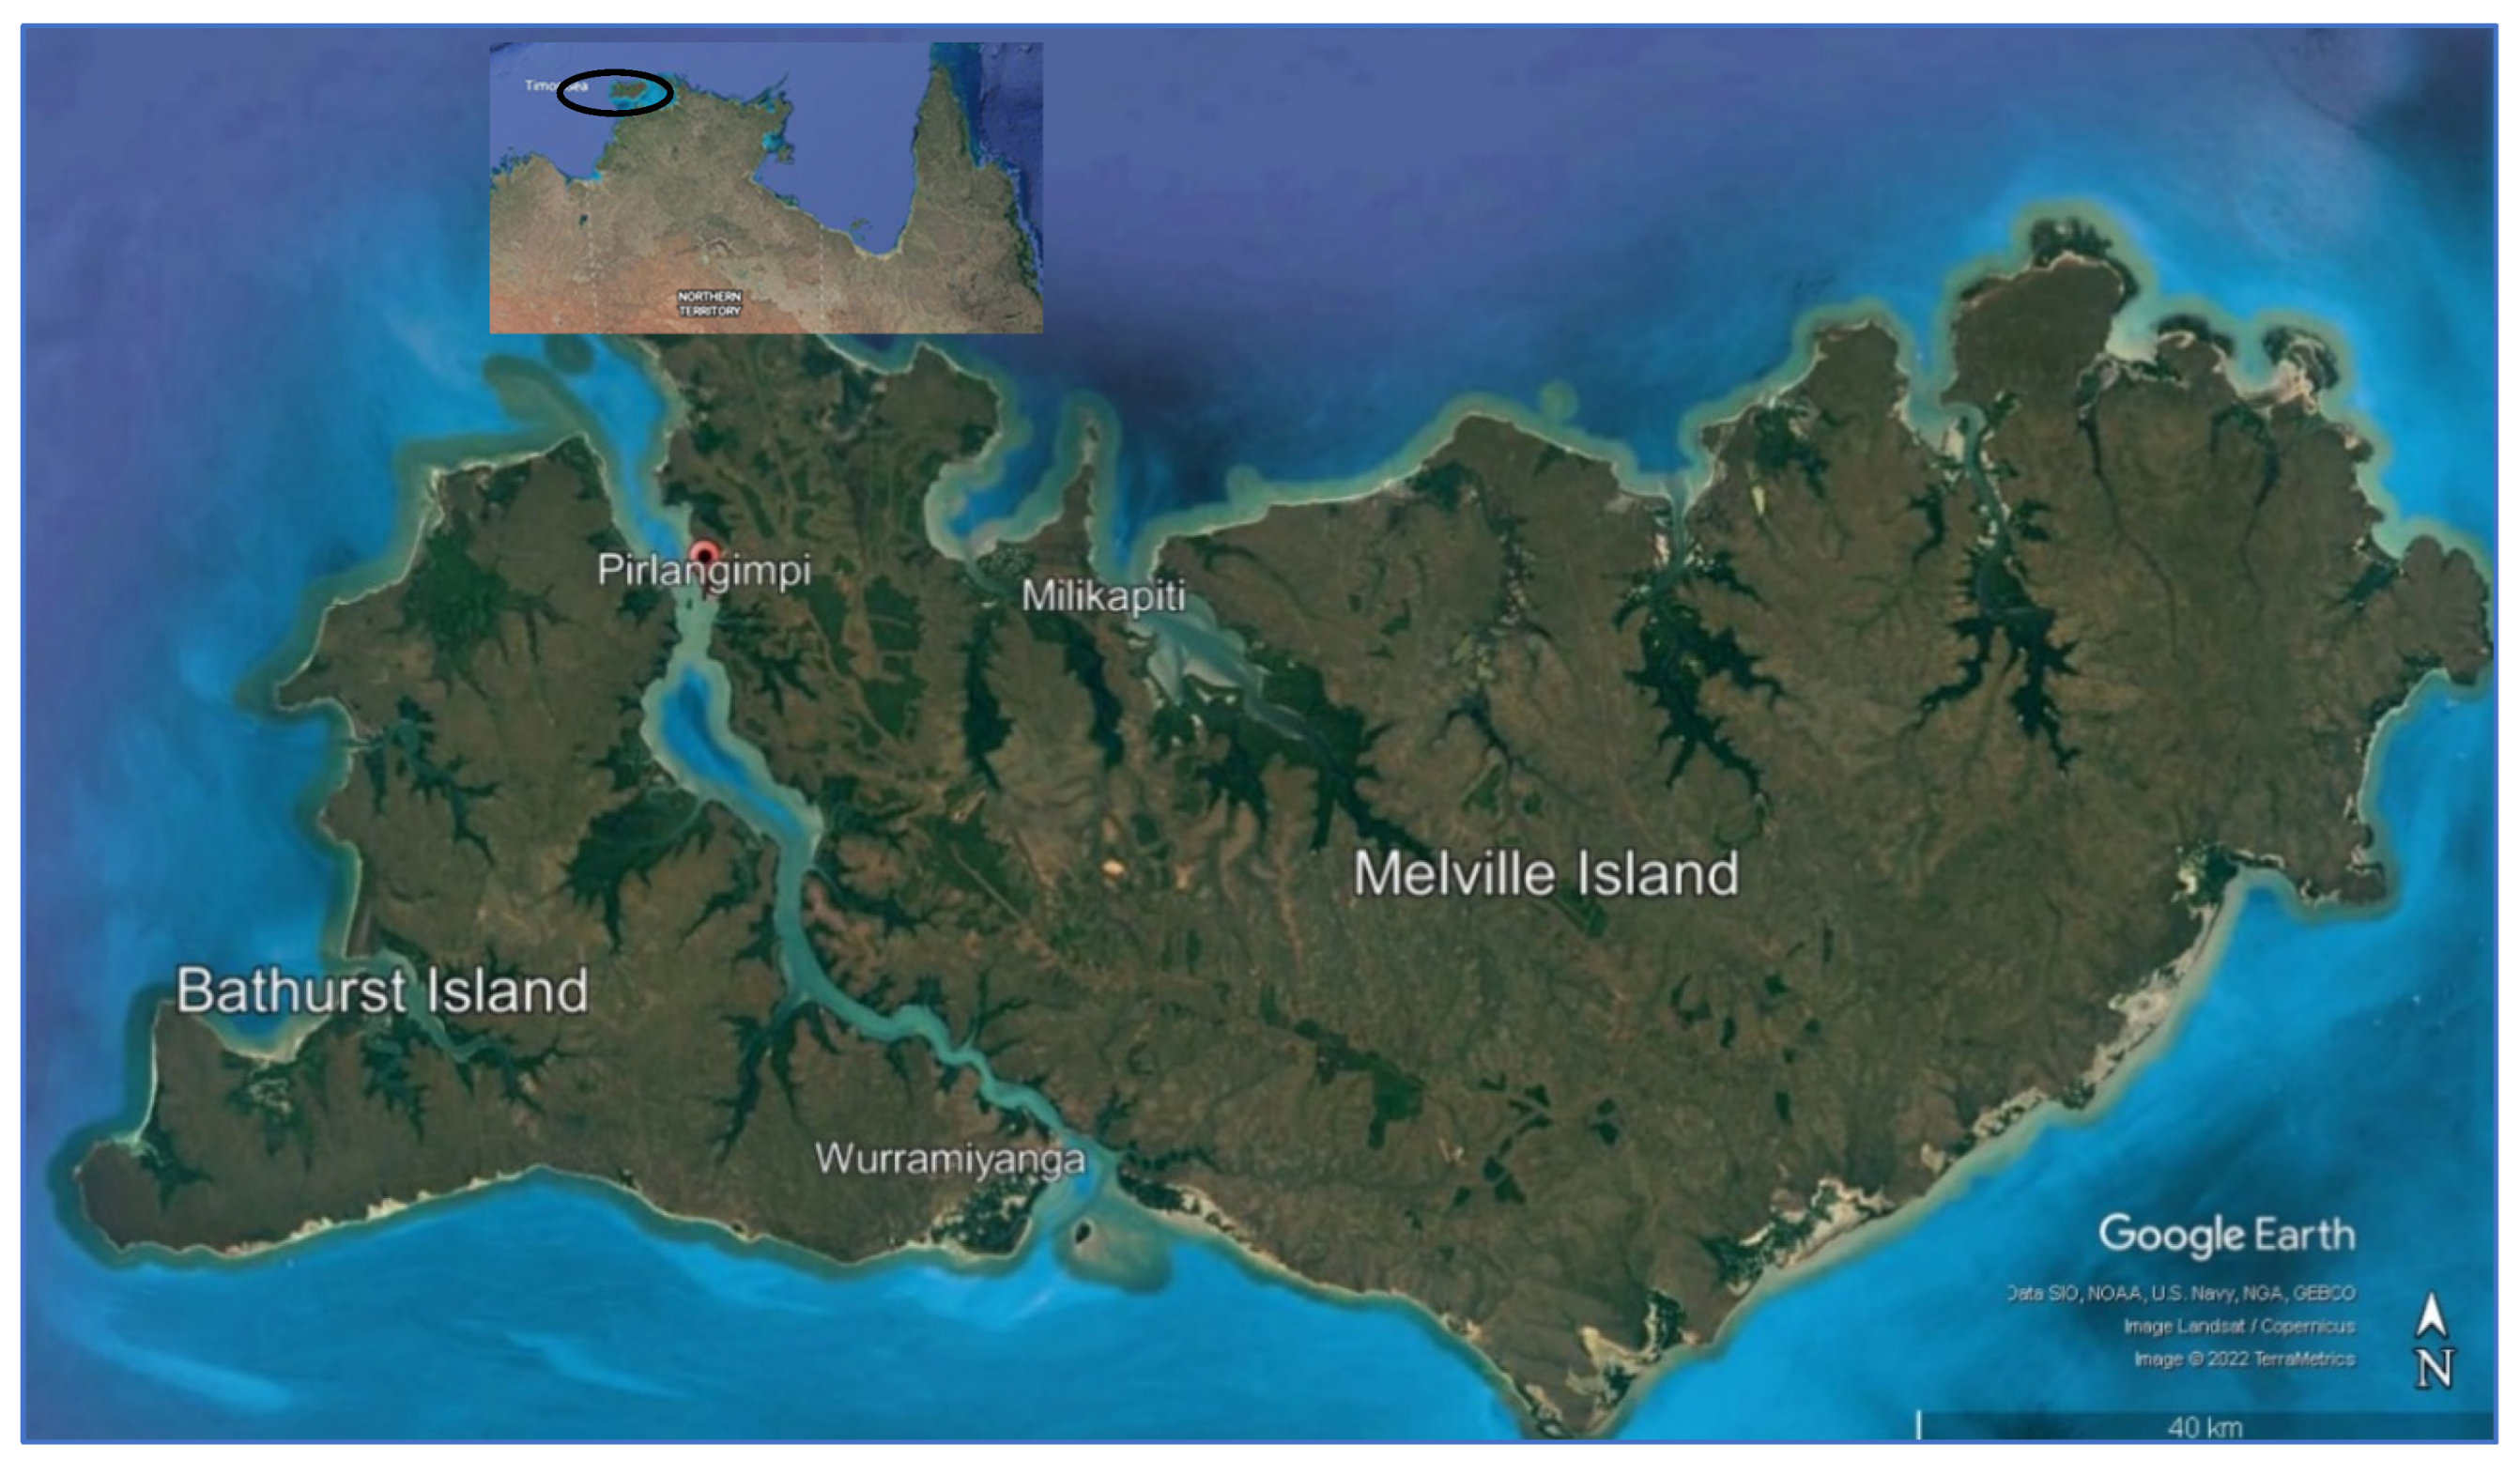
Our case study site is the Tiwi Islands, located 80 km north of Darwin in northern Australia. The map in Figure 1 shows the two inhabited Tiwi Islands, the closely approximated Melville and Bathurst Islands that have a combined area of 8320 km2 supporting a mostly Indigenous population of approximately 2500 people [26]. All Tiwi communities use diesel generators, either in full or in part, for electricity supply through microgrids. There are plans by the local power company to install an interconnection between the largest communities of Wurrumiyanga (Bathurst Island), Pirlangimpi (Melville Island), and Milikapiti (Melville Island) to run on a single grid network [27].
On Melville Island, there is a 30,000-ha community-owned forestry plantation that grows mainly Acacia mangium as an export industry [28]. The wood is chipped on site and shipped overseas from its port near Pirlangimpi, where it is used to make paper. In this study, we investigate the feasibility of using the woodchips and waste products from the local acacia plantation as a fuel for electricity generation to meet the demands of the Tiwi people. Researchers from around the world have already demonstrated the characteristics of A. mangium show promise as a bioenergy feedstock [29,30,31,32].
Our overall objective is to investigate through a techno-economic analysis whether electricity generated from locally grown vegetation is an economical alternative to current petroleum diesel-based systems and to determine the land requirement to fulfill the energy needs. We first assess the suitability of the A. mangium grown on the Tiwi plantation as a feedstock for bioenergy. We then determine if the relatively newer technology of producing bio-oil through pyrolysis is a better option than the more well-established direct combustion coupled steam turbine system at small-scales for remote communities. Lastly, we look at what other socio-economic and environmental benefits can be realized through developing renewable energy systems in remote communities.
2. Materials and Methods
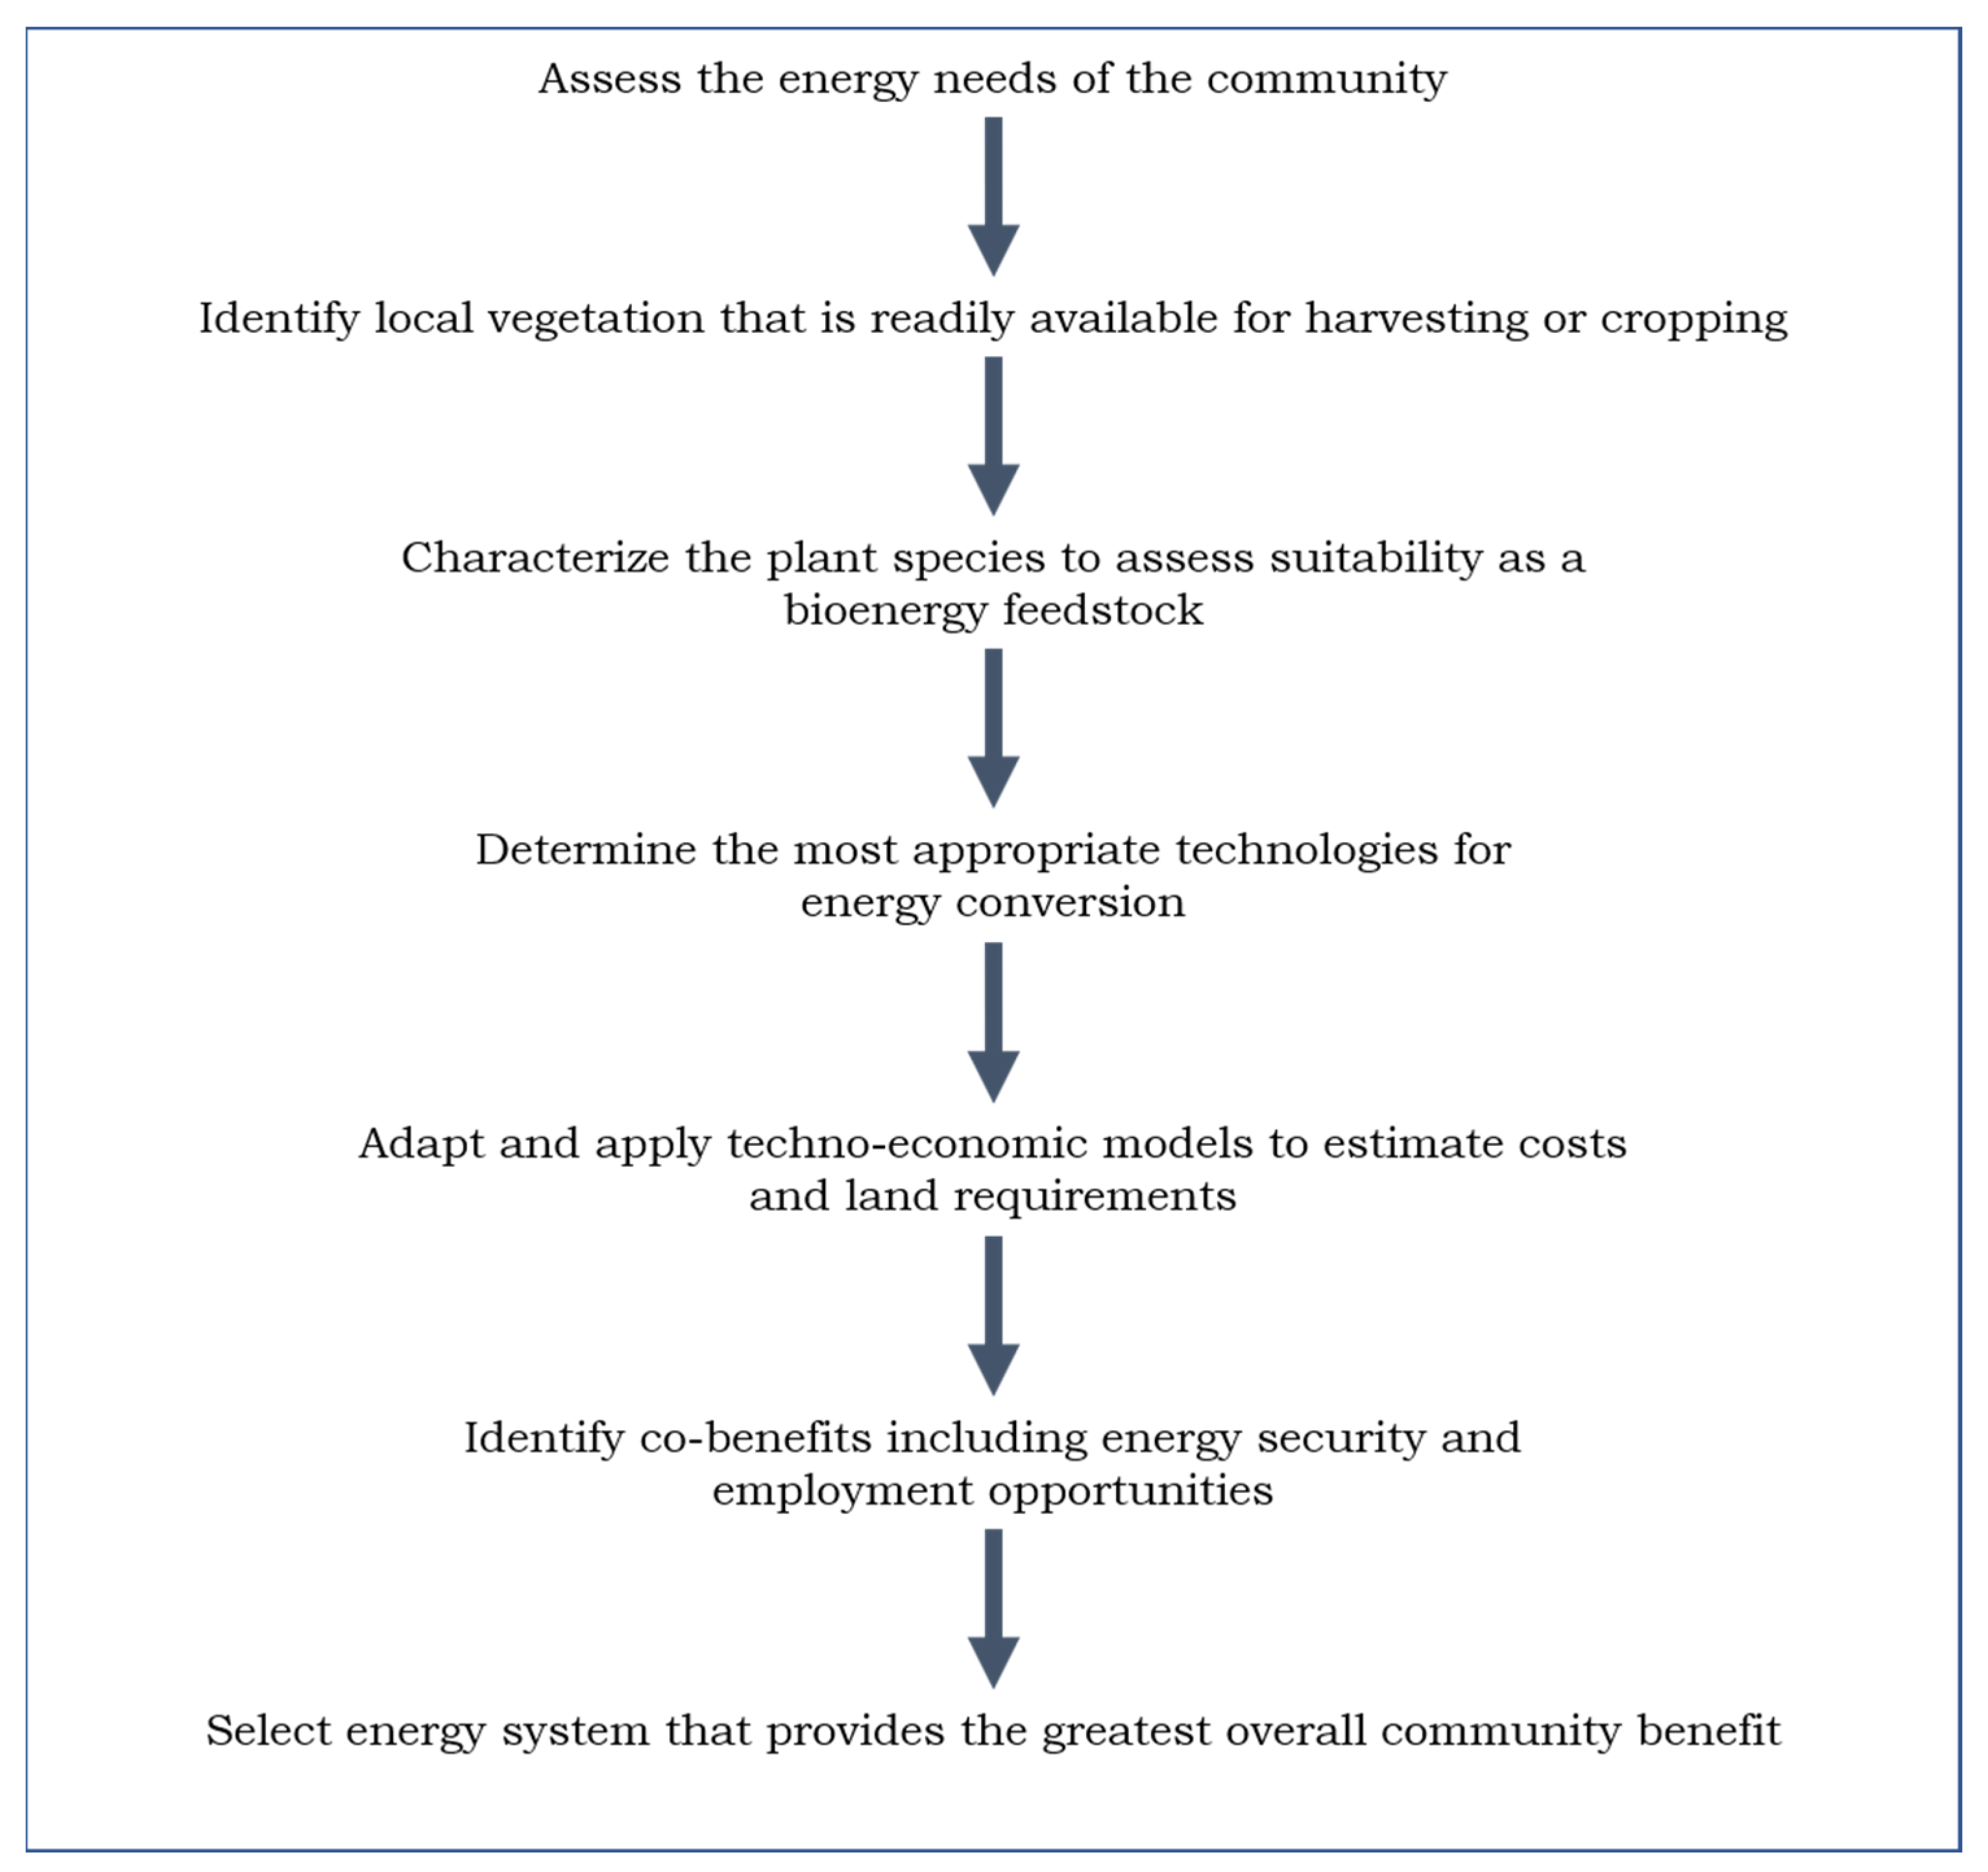
In order to determine feasibility and advantages of supplying electricity through the use of biomass for remote communities, we established the framework outlined in Figure 2. The strategy is broad enough to relate to any remote community, but the details in this work are specific to the Tiwi Island case study.
The communities on the Tiwi Islands receive their electricity from diesel generators. Aside from the community of Wurrumiyanga, the electricity demand of the Tiwi Islands is not publicly known. However, the combined population of the three largest communities is around 2300 people [33,34,35], which is similar in size to that of the community of Maningrida [36] located about 300 km away on the NT mainland and has an electricity demand of 8738 MWh/yr [37]. For our study, we assumed the electrical interconnection between the Tiwi communities was completed at government expense, so a single central power plant could supply electricity to the three communities with an energy demand similar to that of Maningrida.
The electricity demand in remote communities in the Northern Territory varies much less than a standard grid network [38]. In the absence of actual usage data, for simplicity, we modelled a constant 1 MWe net-output power system to give an estimate of the installation and running costs of all power systems that we considered, generating a net 8760 MWH/yr. While there is expected to be increased air conditioning load during the wet season, our overall results would not be substantially impacted as only a slightly larger system would be needed to manage peak demand. A 1 MWe solar photovoltaic (PV) system without a battery energy storage system, which is located at Wurrumiyanga [37], was not included in the analysis presented in this paper. This would not impact the capital investment estimates as the system would still need to account for 100% of the maximum power demand given the intermittency of solar PV. This also allows the modelling presented here to have a broader application, as PV output is highly dependent on location and would need customized analysis for a hybrid system for different sites.
Using previously published models, we simulated a theoretical diesel generator power system that supplies electricity to the three largest communities on the Tiwi Islands on a single grid network as the base case, since this is the technology currently in place. We then replaced the conventional system with alternatives that run mainly on biomass, but also with supplementary diesel. All systems were designed with redundancy to ensure an uninterrupted electricity supply.
Since there is a large Acacia mangium plantation already on Melville Island, the choice of biomass was obvious. It has also been identified as having desirable bioenergy properties [29,30,31,32]. The first step was to characterize the vegetative material and evaluate its potential to be used as a feedstock for bioenergy electricity systems. The properties of the samples were used as inputs into techno-economic models of two possible bioenergy electricity systems: 1. raw bio-oil produced via pyrolysis used in modified diesel generators, and 2. direct combustion of material paired with a steam turbine generator. From the models, we determined the capital and operational costs associated from the point where the diesel and biomass were received at the facility through to electrical connection to the grid network. The amount of biomass needed was calculated based on the electricity requirements and efficiencies of the electricity generation systems, and from there the amount of land needed for cropping was estimated.
We assumed a cost of 175 AUD/odt of biomass based on 2019 export prices of wood chips [39]. However, these prices could be expected to be considerably lower as the chips are not required to be of export quality; indeed, unwanted plant parts could be used for energy purposes to reduce costs. The proximity of the plant and guaranteed constant supply for the power plant could further reduce biomass costs through contract negotiations. The diesel price was based on the 10-year average of the terminal gate price of the closest city of Darwin, 1.31 AUD/L [40]. An additional 23% was added to account for the excess costs of transporting the fuel to the islands based on the price difference between fuel station prices in Darwin and on the island, leading to a cost of 1.61 AUD/L (44.0 AUD/GJ).
Additional financial incentives for switching to renewable energy are carbon credits. The current Australian carbon credit scheme issues credits through the Clean Energy Regulator for new technologies that reduce carbon emissions by generating Australian Carbon Credit Units (ACCUs) [41]. Each unit is equal to one tonne of carbon dioxide equivalent that is stored or avoided altogether. The credits are sold on the open market. The National Greenhouse and Energy Reporting legislation used to determine credits, places emissions from non-transportation combustion of diesel oil at 3 t CO2-e/kL and bioenergy sources at nil emissions. Emissions savings were estimated based on the difference in emissions from a petroleum diesel electricity plant, such as is used currently, and the amount that the mostly renewable systems modelled here would produce. The cost savings in ACCUs were calculated at a conservative price of 25 AUD/unit over the seven years for which they are allowed [42].
2.1. Biomass Characteristics
The biomass source for these calculations was Acacia mangium from the plantation located on Melville Island. We characterized the wood chips, fines (debris that fell off the chips during loading), residue (parts that were stripped before chipping excluding bark) and regrowth (trunk less than two years old including bark). The regrowth samples were the only freshly cut ones, but the age of the other samples was not known. The regrowth was chosen to estimate the lower limit of energy expectations as it presented the lowest measured calorific content. Additionally, we investigated the trunks of two trees that were exposed to wildfires and therefore damaged, so no longer available for sale.
The moisture content (MC) was measured by drying to constant mass in an oven at 105 °C. The HHV was measured using an oxygen bomb calorimeter (C5000, IKA, Kuala Lumpur, Malaysia), ash content (AC) using a tube furnace (EHA, Carbolite-Gero, Hope Valley, UK) and organic elemental composition (CHNS/O) using an elemental analyzer (FlashSmart, Thermo Fisher Scientific, Milan, Italy). All tests were run in triplicate and average values were obtained, except for AC that was run in duplicate according to ISO 18122:2015 procedures and MC, in which the entire sample was used at once. The lower heating value (LHV) was calculated from the measured HHV and hydrogen weight percentage according to Equation (1) [43]:
Using the results from these tests, two separate biomass-based electricity technologies were considered in the following sections: bio-oil used in diesel generators and direct combustion.
2.2. Bio-Oil as a Diesel Substitute
Pyrolysis liquid derived from biomass, bio-oil, has shown to be a suitable substitute for diesel in slow and medium diesel engines with slight modifications and extra cleaning steps [13,14,15]. In addition to bio-oil, there are biochar and gas products from the pyrolysis process, which have chemical energy that is released when combusted.
In this section, we present the technical and economic features of the process from biomass to electricity generation through the pyrolysis process, which occurs in five distinct steps: pre-treatment, pyrolysis, bio-oil storage, electricity generation, and electricity distribution. We mostly followed the costings of Bridgwater et al. [13] for their 1 MWe system, which were based on well-developed and utilized technologies, except for the pyrolysis process itself, which was subsequently updated [45], and we used the new estimates.
In the following sections, the technical details and the associated capital and operational costs were given for each step in the biomass to electricity process based on the work of Bridgwater et al. [13,45] and adapted for our application. In our circumstances, labor costs were calculated with an average salary of AUD 75,000 in four shifts. Maintenance and overhead costs were assumed to be 2.5% and 2.0% of capital costs, respectively. Annualized capital costs (ACC) were calculated using total capital cost (TCC) and the capital recovery factor (CRF) according to Equation (2)
where i is the real discount rate, i′ is the nominal discount rate, f is the inflation rate, and n is the number of years. We used a nominal discount rate of 8% and inflation rate of 2% over the course of the twenty-year lifespan of the facility. The levelized cost of energy (LCOE) was determined by the ACC, operational expenses (OPEX), fuel costs, and the total amount of electrical energy, Ee, produced in a year according to Equation (3)
All costs were calculated in euros for the year in which these works were based and updated with inflation based on the Harmonised Index of Consumer Prices (HICP) to values for the year 2021 [46]. The costs were then converted to AUD using the exchange rate reported by the Australian Tax Office (1 €: 1.575 AUD) [47].
2.2.1. Pre-Treatment
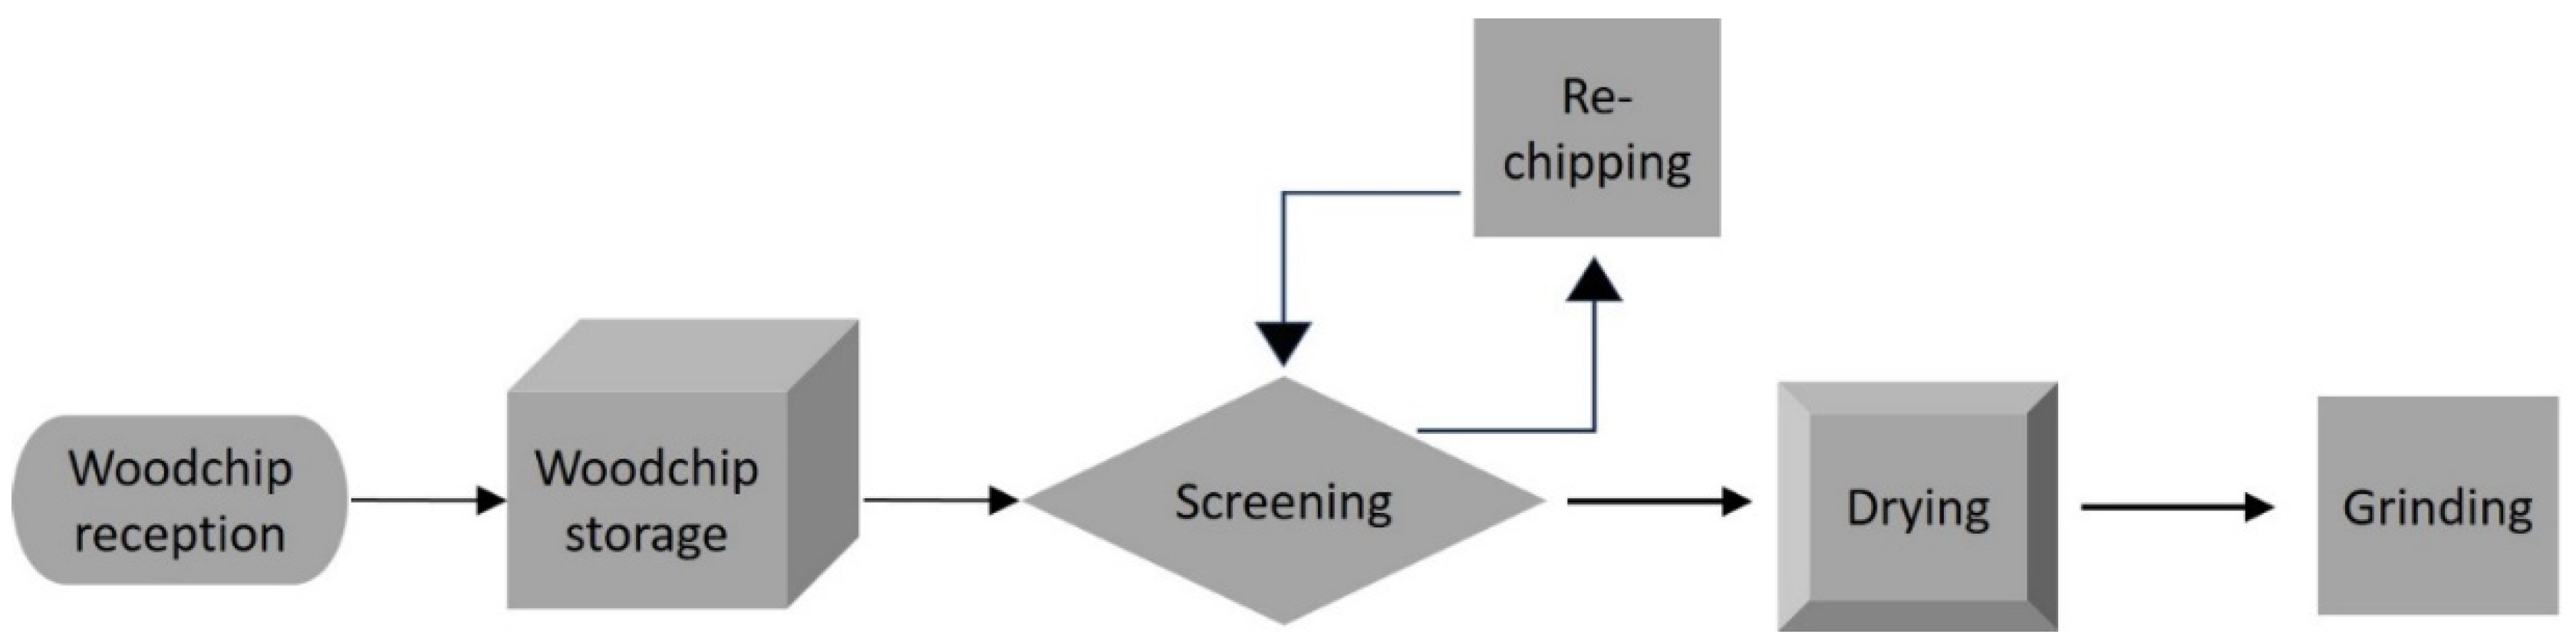
Pre-treatment includes the reception of the chipped biomass and everything needed to prepare it for the pyrolysis process; the steps are shown in Figure 3. The biomass was assumed to have an MC of around 50%. After reception, the biomass is stored while it awaits processing that involves screening and re-chipping, if needed, to reach the appropriate size. Afterwards, it is dried to MC of 7% and then ground to sizes of less than 2 mm. The heat required for drying is produced through burning of the gas and biochar produced as by-products of the pyrolysis process.
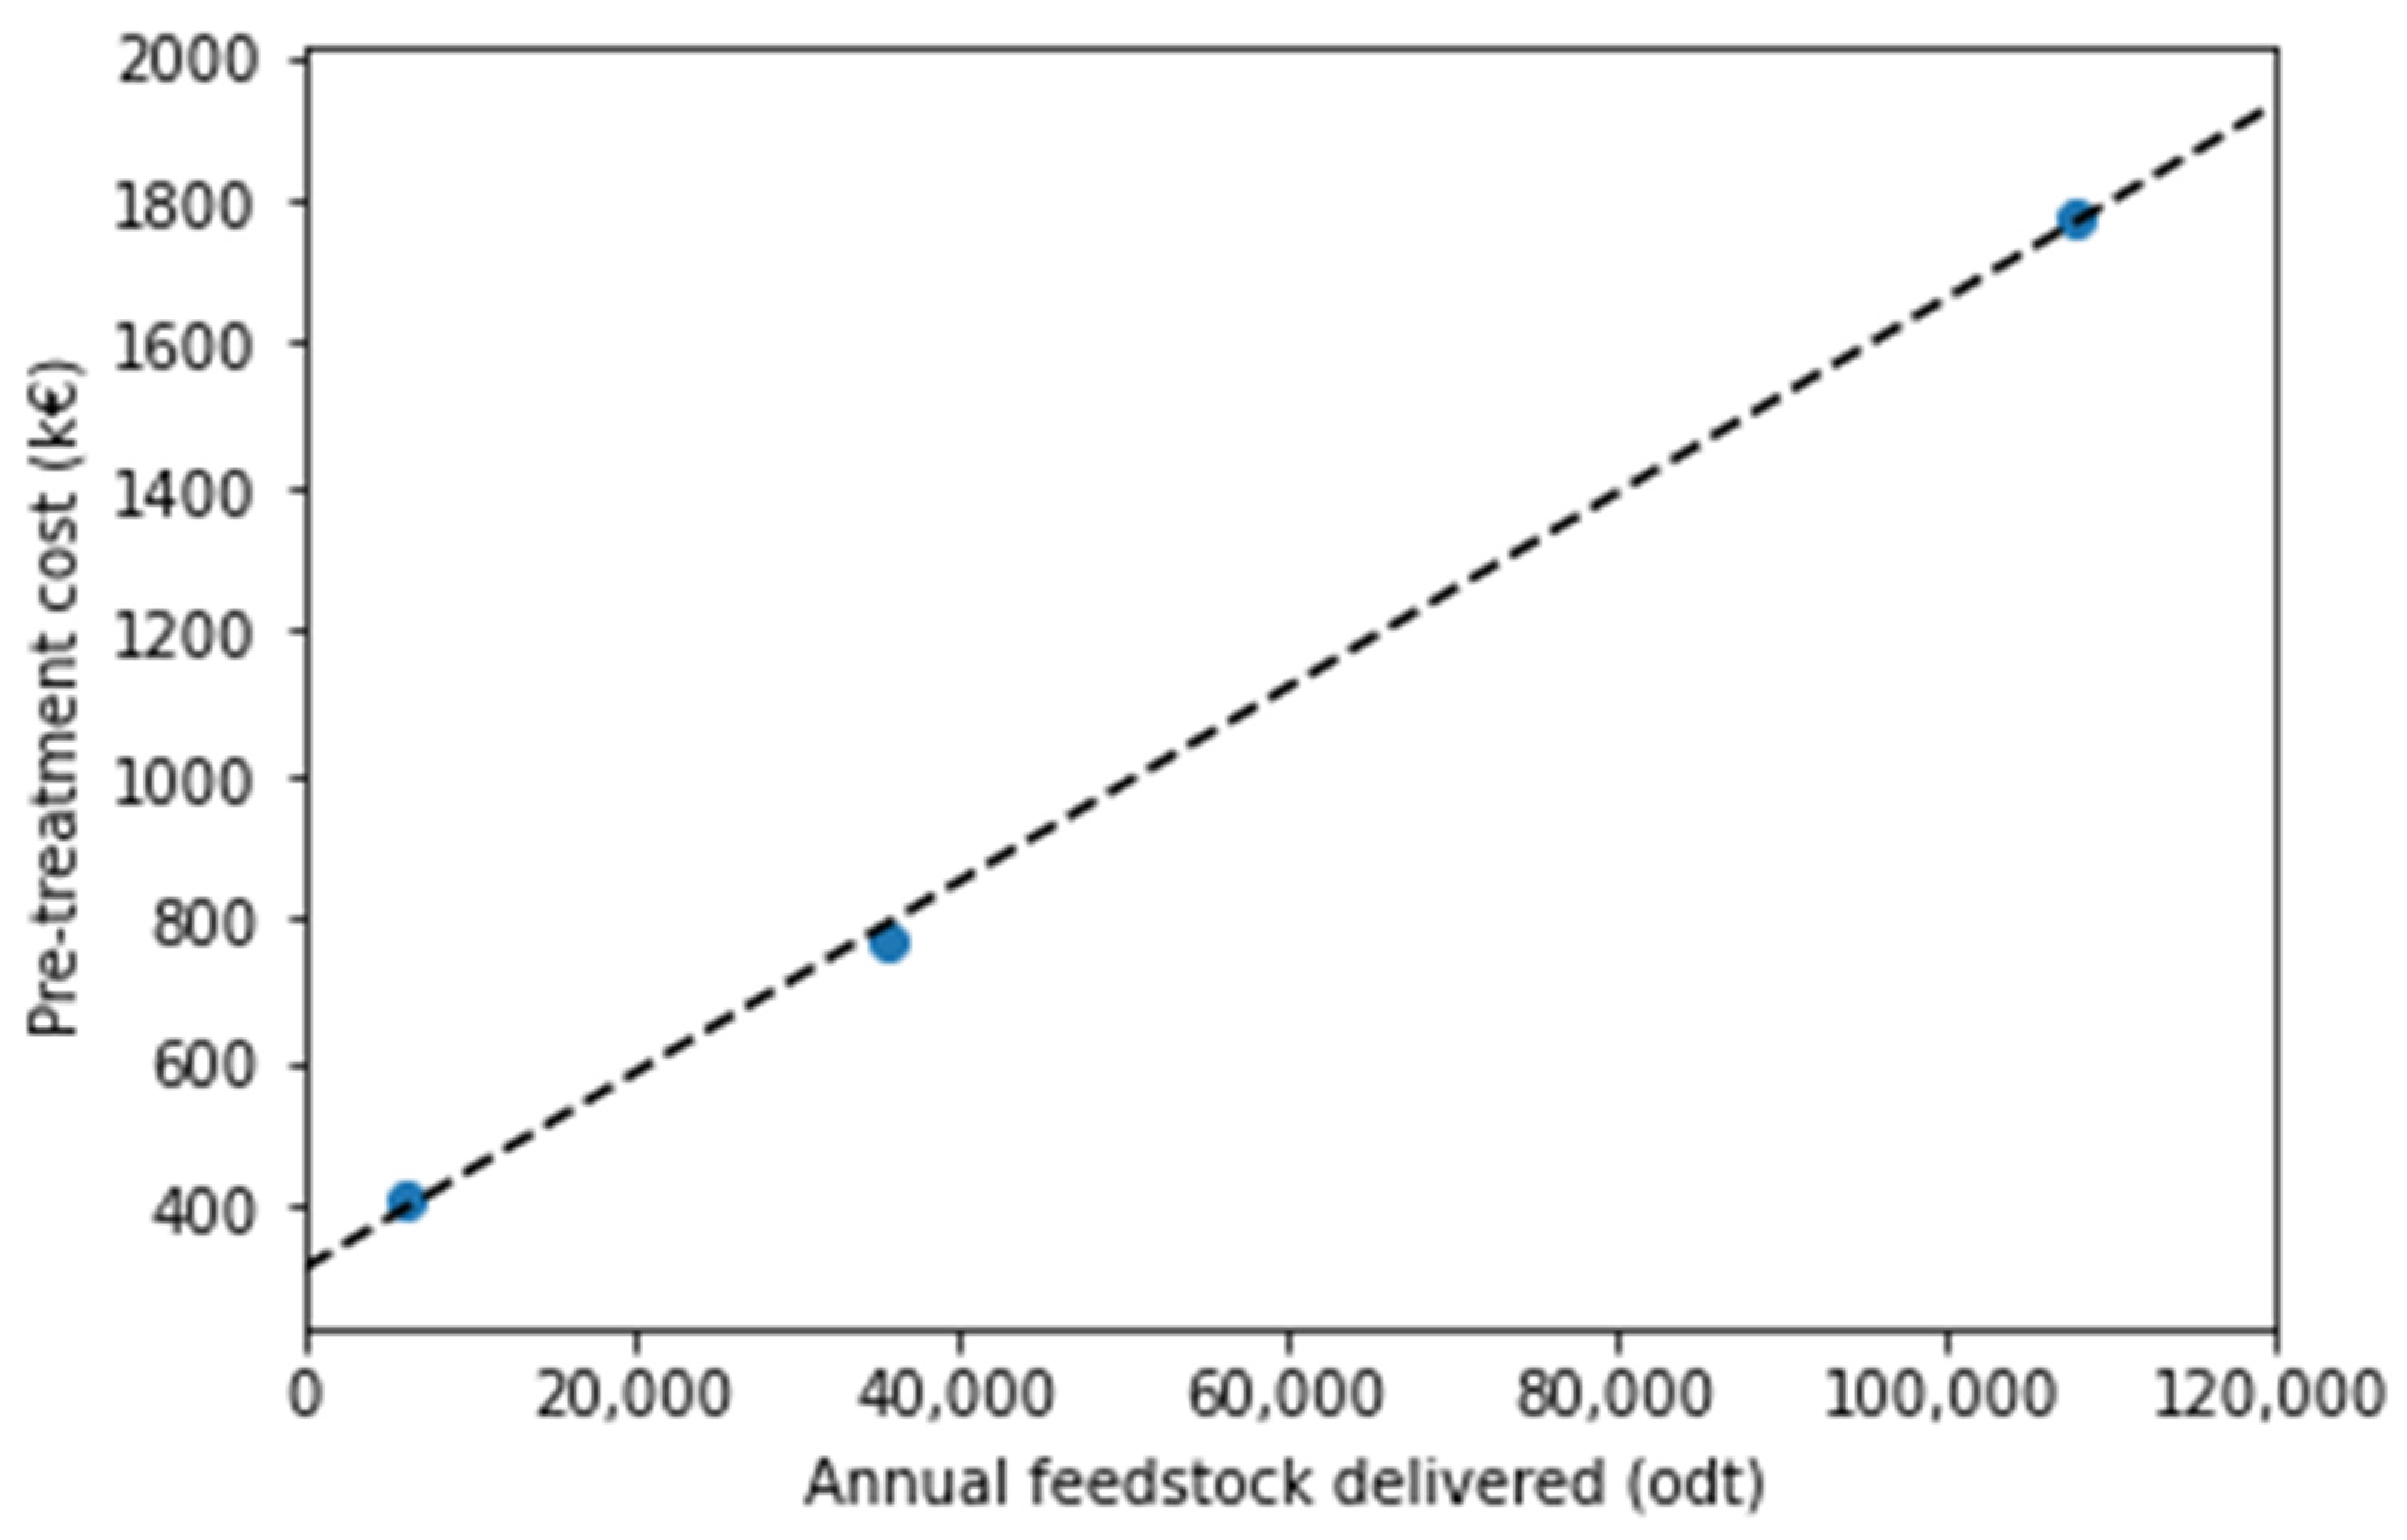
Since the LHV of our feedstock differed from that of Bridgwater et al. [13], our quantity of biomass was adjusted to match the total energy of 121 TJ in the original model. A change to the amount of biomass would also affect the costs of the pre-treatment process. The precise details of the capital and operational costs of the pre-treatment process were not given, but the overall costs were given for three different sizes of mass processing flows. A linear fit of this data was performed with an R2 value of 0.999 according to Equation (4) [Appendix A].
where M is the amount of dried biomass processed in oven-dry tonnes (odt) per year by the facility. Based on our LHV measurements of the A. mangium, we used Equation (4) to calculate the pre-treatment costs to compensate for the difference in the amount biomass needed for a Tiwi power plant. We made further adjustments to the labor costs to compensate for the higher Australian wages.
2.2.2. Fast Pyrolysis
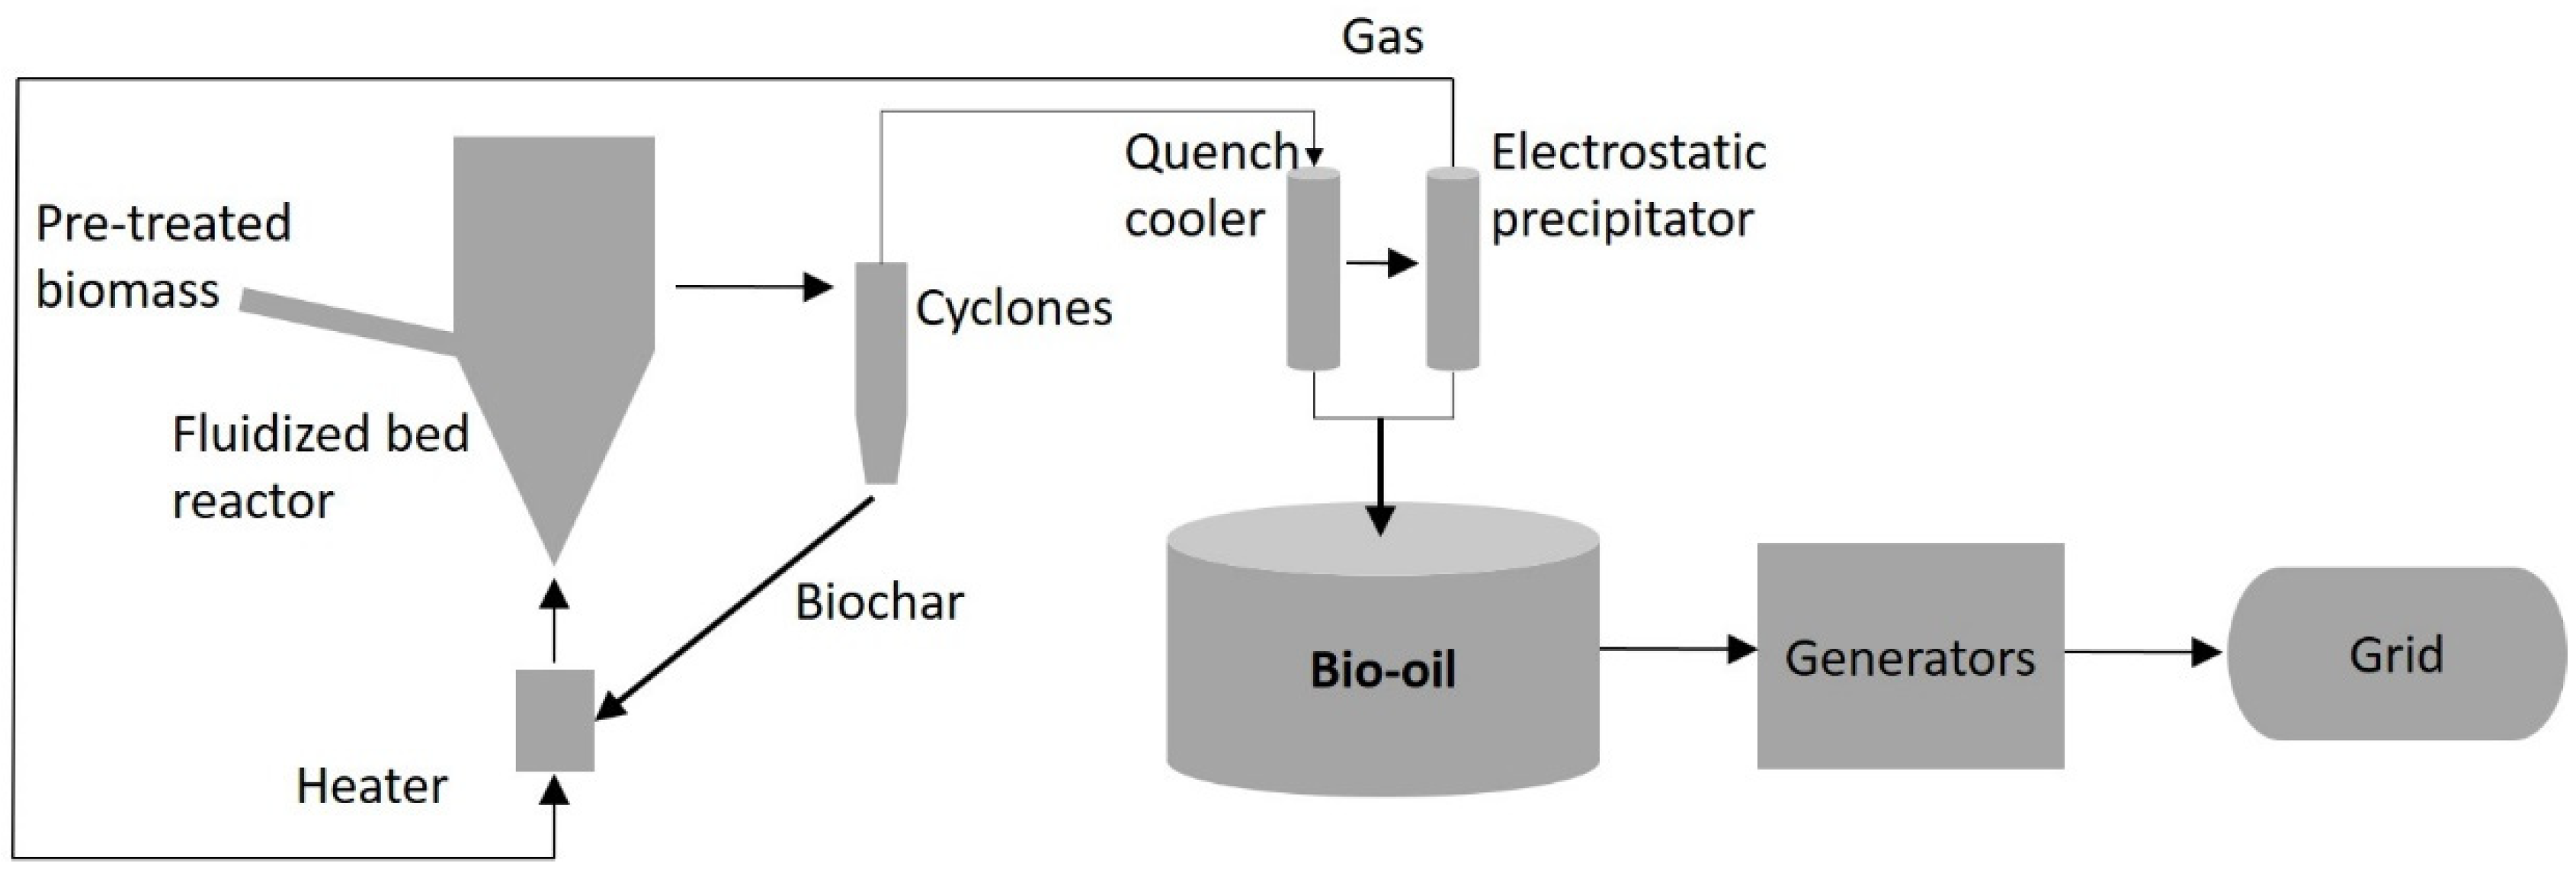
After pre-treatment, the steps for converting the biomass into bio-oil [45], and into electricity to be distributed in the microgrid [13], are shown in Figure 4. The analysis was based on fast pyrolysis in a fluid bed reactor, which maximizes bio-oil yield [48]. In fast pyrolysis, the pre-treated biomass is quickly heated to a temperature around 500 °C in an oxygen-deprived atmosphere with a residence time on the order of seconds. Liquid (bio-oil), gaseous, and solid products are separated. We used a conversion efficiency of raw, dry biomass to bio-oil of 70% by weight [20]. The resultant LHV of the bio-oil is 15.7 GJ/t [13]. After the liquid is collected, it is transferred to storage tanks. The pyrolysis gas and biochar are ignited to provide the heat necessary to continue the pyrolysis process while bio-oil was collected, so no external power supply is needed.
2.2.3. Bio-Oil Storage
The bio-oil is placed into storage tanks following the fast pyrolysis process. Extra storage was included to allow for unexpected shutdowns of the pyrolysis furnace to guarantee a constant fuel supply for the generators.
2.2.4. Diesel Generators Powered by Bio-Oil
Slow- and medium-speed diesel generators can run on the type of bio-oil produced through the methods above with slight modifications [13,15]. Flushing with methanol is required due to fouling of the fuel injection system, but this is a viable option with minimal alterations to the engine and with slightly more maintenance; such costs have been included as a 10% increase over standard petroleum diesel generators in the calculations. Additional maintenance costs are 0.02 AUD/kWh, similar to petroleum diesel generators.
Diesel engines cannot easily be run solely on bio-oil due to a lack of ignition, so 7.5% of the total fuel energy comes from typical petroleum diesel mixed with the bio-oil. As bio-oil has a much lower calorific content than petroleum diesel, on a volume basis petroleum diesel would make up 4.1% of the fuel. The engine efficiency is 39.5% and 0.2 MWe of the generated power is for plant operations [13].
To ensure an uninterrupted power supply, our system was designed with n + 1 redundancy in the number of engines. This would also allow for the additional maintenance needed for using bio-oil as a fuel source. In place of the single 1.2 MWe output generator, we modelled 3 × 0.6 MWe engines with the understanding that two engines would always be running, leaving one for maintenance requirements or backup supply. The net electricity output would therefore be given by Equation (5)
2.2.5. Grid Connection
The last step involves obtaining the electricity from the generators to the grid network. Since we assumed the interconnection between Wurramiyanga, Pirlangimpi, and Milikapiti was constructed as planned by the Power and Water Corporation at their expense [27], only a single connection is needed. Costs are included to cover controls and protection equipment, as well as transformers and switchgear.
2.3. Direct Combustion
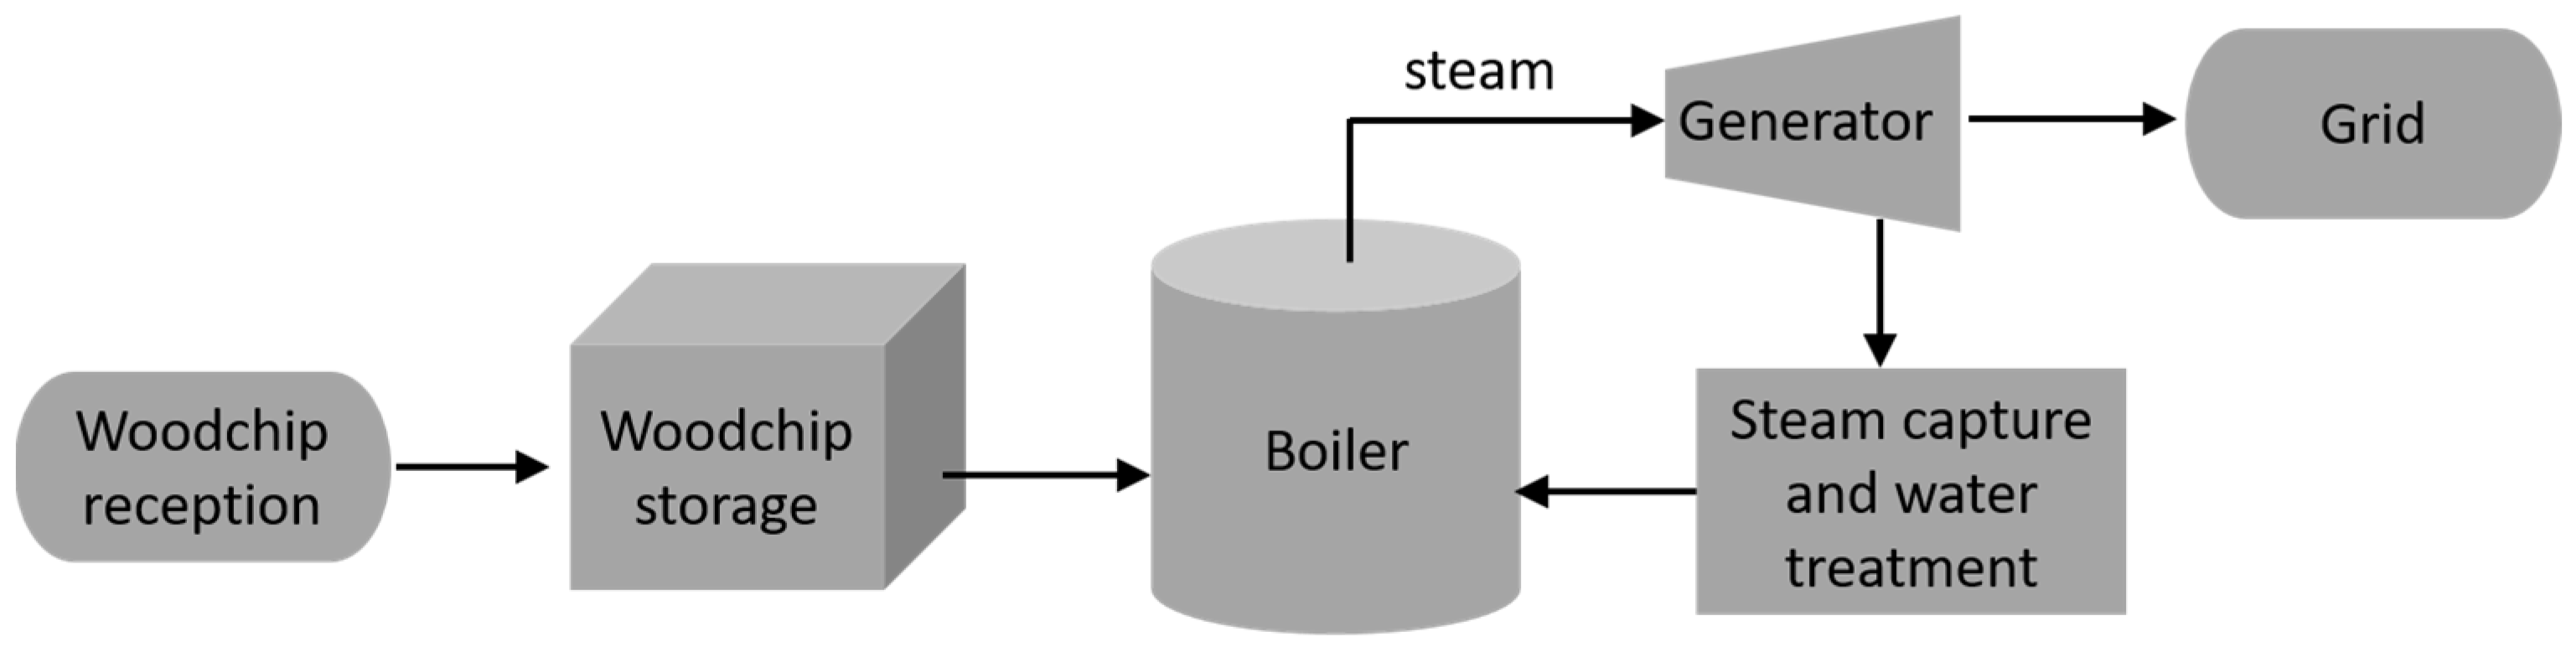
The system we looked at for generating electricity from direct combustion of the biomass was through a steam turbine generation unit. As shown in Figure 5, the woodchips are received and placed into storage while awaiting combustion. The heat from combustion creates steam in the boiler, which in turn drives a turbine to generate electricity. The electricity is exported to the grid. Ash from the woodchips is collected and disposed of, while gaseous NOx and SOx produced from the combustion process are scrubbed to reduce emissions.
As one of the more popular technologies in power generation due to its low NOx emissions, we chose a fluidized bed boiler for woodchip combustion and steam generation. To calculate the costs of such a system, we followed a similar process as above and utilized the model developed of such a system by Caputo et al. [49]. In this model, the capital works and operational expenses were itemized and summed to yield the total cost of the plant. For details on this model, we refer you to the original work. We mainly followed their methods, and the key input values are outlined below.
We used a net energy efficiency from biomass chemical energy to electrical energy of 23% in our calculations. The combustion system operates for 8000 h/year and is shut down so that maintenance can be performed, and 10% of the gross electricity output is used internally. We added a single 1.2 MWe diesel generator to provide electricity to the communities when the direct combustion system was not available in the case of maintenance or unplanned outages.
Inflation was adjusted using HICP [46] and then converted to Australian dollars using the exchange rate from the Australian Tax Office for the end of the year 2021 [47]. Yearly capital expenses were calculated with a nominal discount rate of 8% and an inflation rate of 2% over the course of the twenty-year lifespan of the facility using Equation (2).
2.3.1. Capital Costs
We calculated the cost of each component of the system based on the itemized list of Caputo et al. [49] for a 1 MWe net-capacity power plant. Included were direct plant costs, such as equipment, civil works, electrical works, and instrumentation, and indirect plant costs, such as engineering and start-up. The sum of the component costs was used to give the total cost of the plant.
As a comparison to the theoretical model described above, we also included calculations based on the work of Morató et al. [25]. They collated the total capital costs of a multitude of real-world direct combustion power plants. The plants were separated based on combustion technology: fluidized bed and grate-fired, with grate-fired found to be more economical at smaller scales. However, the grate-fired systems had larger capital cost variance than the fluidized-bed, so we included both technologies. They performed power regression analysis of the total capital cost versus plant capacity, which we used to calculate the total capital costs for both technologies. As the currency used in that paper was USD in the year 2017, we used the inflation given by the US Bureau of Labor Statistics to adjust for inflation to the year 2021 [50] and converted to AUD using the ATO figures [47]. The diesel generator was costed according to Bridgwater et al. [13].
2.3.2. Operational Costs
Labor costs were based on an operational bioenergy combustion plant. The closest capacity real-world example we could find employment numbers for was located in Italy, with a nominal 3.6 MWe capacity, which employs 10 people [51]. With consideration that a minimum number of employees would be needed to run the various steps of the plant, e.g., biomass receiving, storage, combustion, and ash disposal, we used the same employment number for our 1 MWe plant. To calculate the labor costs, we used the average salary of AUD 75,000 for each of the 10 employees. We note that more specialized labor may be needed for the direct combustion plant than for the diesel generator plant due to the complexities of the steam engine cycle, such as the water treatment.
Other than labor costs, the operational costs of the direct combustion process were calculated following the method of Caputo et al. [49]. Removal of ash from the premises requires transporting it out. The amount of ash was estimated from the results of our characterization tests, but the cost of transportation is 98 AUD/t, and the estimated ash disposal fee of 100 AUD/t was used. Since the disposal site would be on Indigenous land, the actual cost would need to be negotiated but this value is close to the general commercial garbage disposal fees in the Darwin landfill [52].
Maintenance was calculated as 1.5% of capital costs. Insurance and general costs were calculated as 1.0% of capital costs. The total operation cost of the direct combustion system was the sum of all the categories above. We added the operational expenses associated with the diesel generator to the total. The operational costs for the diesel generator were the same as those described above in Section 2.2. The expenses related to modifications for burning of bio-oil were not needed and are reflected in lower operational expenses.
2.4. Calorific Content Sensitivity Analysis
Since there is always some variation in the calorific content of biomass, a sensitivity analysis was carried out for different values of LHV. This is also beneficial to understanding how the cost would change if a different feedstock were used. The LCOE was used as a comparison for the different values of LHV.
For the case of the bio-oil, we assumed that the bio-oil LHV was unchanged but that the mass of feedstock needed to produce the bio-oil varied by the same percentage of the feedstock, i.e., if the raw biomass had an LHV of 16 MJ/kg instead of 18 MJ/kg, 12.5% more raw biomass would be needed to produce the same amount bio-oil.
In the case of direct combustion, the conversion efficiency was unchanged, so raw biomass needed to be changed proportionally to the give the same total output energy of the initial 18 MJ/kg feedstock. For the sensitivity analysis, the costs of the three different combustion models were averaged.
2.5. Land Area Requirement
Another important aspect for using local plantations to supply the needed biomass to the electricity systems is the land area requirement. Since we chose our feedstock to be regrowth that is harvested every two years, to prevent the plants from reaching maturity and seeding stage, we determined how much land is needed to provide the necessary amount of biomass.
Acacia mangium is prolific in regrowth. The measured biomass growth rates for two A. mangium plantations in neighboring Indonesia were measured by Heriansayah et al. [53]. After the initial two years of growth, the plantation in West Java produced 10 odt/ha while the one in South Sumatra produced 34 odt/ha. The mass of the roots accounted for 13% of the total mass, which we did not plan for harvesting to allow reshooting, so we reduced yield by this amount, leading to a biennial production rate of 8.7–29.6 odt/ha.
Once the total amount of woodchips needed was determined by the results of the biomass characterization tests and technical models below, we used the two-year growth rate to determine the land area required for yearly energy production. The total area needed would be twice this amount, with a rotation between two plots annually.
3. Results
3.1. Biomass Characteristics
The results from biomass characterization are shown in Table 1. The conservative LHV value of 18.0 GJ/odt was used in the power system models below. The AC of the entire tree was calculated to be 2%, similar to the value used by Caputo et al. [49]. The MC of the regrowth trunk was close to our chosen value for modelling of 50%. The trunks that were exposed to wildfires had the lowest MC of all samples, likely due to being dried out by the fires. Most of the samples showed promise as bioenergy feedstocks, having high LHV and low AC. The AC of leaves by themselves may be too high, but if mixed with other biomass, the overall percentage would be brought down to acceptable limits and their energy content exploited. There would likely be some changes in composition of the raw materials as plant parts would be available in different proportions throughout the year, leading to varying qualities of the bio-oil produced. This may cause problems with the engines and would need to be addressed before entering the production stage.
3.2. Bio-Oil as a Diesel Substitute
The A. mangium LHV of 18.0 GJ/odt was 7% lower than was used by Bridgwater et al. [13], therefore we increased the feed content and feed rate to compensate in the costings. To provide a constant 1 MWe to the islands, 8010 odt of A. mangium was needed per annum to make the necessary 5607 t (88,030 GJ) of bio-oil. In addition, 7138 GJ of petroleum diesel was necessary as a pilot fuel for the gensets. The combined capital and operational costs of pre-treatment were found from Equation (4) and the additional wage expense for Australia led to the total pre-treatment cost of AUD 1.1 M annually.
The capital costs of the power station that runs solely on petroleum diesel are compared to one with all the equipment needed to produce and operate on bio-oil in Table 2. The systems use the same diesel generators and grid connection, but the bioenergy system required about four times higher capital investment for the pyrolysis process to produce the needed bio-oil.
The operational costs of the diesel-only system, together with the costs from after pre-treatment to the electricity generation of the bioenergy plant, are displayed in Table 3. Including pre-treatment (calculated using Equation (4)), the total annual costs of the bio-oil system led to a total of AUD 5.7 M with 16 full-time employees. The operational costs of the petroleum diesel system were considerably higher due to the cost of the fuel, though overall costs were lower. Running the generators solely on petroleum diesel amounted to AUD 5.1 M per annum.
Additional savings from carbon credits could be available for the bioenergy system, making the cost more attractive. The difference in petroleum diesel fuel between the two systems amounts to 2.4 ML (7.3 kt CO2-e). This brings additional savings of AUD 1.3 M, distributed evenly over the first seven years, in ACCUs to the pyrolysis plant. Aside from the costs, environmental, energy security, and employment issues need to be considered and are addressed in the Discussion.
3.3. Direct Combustion
Based on the LHV of 18.0 GJ/odt of the biomass and the overall efficiency of the combustion to electricity process, 7652 odt of A. mangium were needed. The capital costs comparing the theoretical model of Caputo et al. [49] using fluidized-bed combustion technology with that of regression analysis of Morató et al. [25] on fluidized bed and grate-fired type combustion systems are shown in Table 4. The average costs of real-world systems with both types of combustors were lower than the theoretical, with grate-fired being less than half the cost of the fluidized bed.
The operational costs for all three systems were calculated following the method from Caputo et al. [49] and itemized in Table 5. The total annual costs of the three different models ranged from AUD 3.5–4.8 M. Compared to the petroleum diesel plant, carbon emissions would be 7.9 kt CO2-e less and produce ACCUs that equate to a total of AUD 1.4 M spread equally over the first seven years of operation. While the cost-savings of the direct combustion systems over petroleum are important, there are additional environmental and socio-economic issues that should be considered, as addressed in the Discussion.
3.4. Land Area Requirement
Both bio-oil in diesel generators and direct combustion with steam turbine systems needed about 8 kt of dry biomass to meet the energy requirement of the communities. To grow this much A. mangium, two plots that would be harvested biennially with a combined land size of 540–1840 ha would meet these needs. This represents 6% or less of the total Tiwi plantation size.
3.5. Calorific Content Sensitivity Analysis
The LCOE of each technology was calculated using Equation (3). The LCOE for diesel was 0.582 AUD/kWh, and a sensitivity analysis was carried out for the bioenergy plants based on the LHV value as seen in Table 6. A decrease in LHV by 2 GJ/odt had a bigger impact on the costs of both systems than an increase in LHV by the same amount.
4. Discussion
The results from our calculations showed that the cost of using biomass-derived pyrolysis oil to generate electricity on the 1 MWe scale was about 12% more than employing conventional petroleum diesel, with an annual difference of AUD 0.6 M. Since both systems rely on diesel generators to create electricity, the major difference in capital costs between the systems was from the fast pyrolysis segment, which added approximately AUD 12 M to the total.
The diesel fuel itself accounted for nearly 90% of the operational costs for the petroleum diesel system, while the cost of biomass feedstock accounted for less than half the operational costs for the bio-oil system. Shifts in the prices of these two commodities would lead to large differences in operational costs, but especially for the diesel system. A long-term contract between the power generation operator and the plantation could be mutually beneficial, giving the generator a lower and stable price while providing the plantation with an assured market for its product.
As biofuels are considered to be carbon neutral since the carbon dioxide they release when burned are captured by new growth through photosynthesis [54], there would be a reduction in carbon emissions of around 7 kt CO2-e. The impact of ACCUs on the system amounted to about 1% of the total costs over its lifetime, slightly narrowing the cost difference. If the European Union and Australia decide to pursue linking their carbon credit systems, which was considered before in 2014 [55], they would be much more valuable. Considering the EU carbon price has been above AUD 25 since 2018 and climbing subsequently [56], if the ACCUs were worth AUD 125 (~80 €), savings of more than AUD 6 M over the life of the systems studied could be available, roughly a 5% reduction in costs. However, even this extreme price of carbon credits (by Australian standards) was not enough to overcome the cost difference and further cost-saving measures were needed.
Another avenue for making bio-oil more attractive is by accessing low-interest loans through government schemes to reduce carbon emissions and improve infrastructure, such as the Clean Energy Finance Council (CEFC) or Northern Australia Infrastructure Facility (NAIF), can reduce risks, making way to replace conventional power systems with renewables [57]. Obtaining grants through government agencies, such as the Australian Renewable Energy Agency (ARENA) could further tilt the economics case toward the renewable system.
Under the right conditions, the bio-oil and petroleum diesel systems could have similar costs, but there are other advantages to the biomass-sourced fuel that should be considered. There are relatively few employment opportunities in remote communities [58], so by choosing the pyrolysis technology, jobs would be created for running the plant as well as the additional labor needed for forestry services to supply the biomass. Using a local energy source would also reduce the need to import petroleum diesel internationally with its own shipping emissions, and lead to increased energy security. Costs of using bio-oil could also be further reduced by modifying the already present diesel generators. Overall efficiency could be increased in central and southern Australia, where heating is required in winter, through a combined heat and power facility.
The viability of the pyrolysis process improves greatly by economies of scale [13,45]. At the scale we modelled, there was not a clear economic choice between using pyrolysis or petroleum diesel when high values of ACCUs and funding sources were taken into account. At smaller scales, bio-oil would likely not be a viable option, especially when the extra complexity the pyrolysis process brings is considered. Since the Tiwi community is one of the largest remote communities in Australia, there would be few opportunities to deploy a pyrolysis-based system beyond there. The exception would be if multiple communities were in close enough proximity to each other that a plant could produce pyrolysis oil and deliver it over short distances to nearby communities, thereby taking advantage of economies of scale. The Tiwi Islands have an established port facility and so it would be worth a further investigation to determine if upgrading the pyrolysis oil to drop-in fuels such as renewable diesel or aviation fuel would be a feasible export industry.
While the pyrolysis system was shown it could be competitive under the right circumstances with the petroleum diesel systems currently in place, direct combustion was found to be the most economical option. Between the two renewable energy systems, the operational costs were considerably higher for the bio-oil plant, and the extra capital costs associated with the fast pyrolysis process were never recuperated. Considering that the direct combustion system would bring the same socio-economic and environmental benefits as the pyrolysis-based system, and because the technology is more mature and cheaper, we believe it to be the most judicious choice for an electricity system of the three options presented.
Down to a capacity of at least 0.5 MWe, direct combustion still has the advantage over petroleum diesel with annual costs of AUD 2.3 M and AUD 2.5 M, respectively. However, it is expected that as the quantity of biomass needed for direct combustion decreases, the cost per unit mass procured locally would increase, leading to a shift in the economic calculations. Further work is needed to determine at what minimum scale combustion coupled with forestry is still the more economic choice. At even lower scales, petroleum diesel becomes the least costly choice, e.g., at 0.1 MWe the cost for combustion is AUD 1.1 M and AUD 0.5 M for petroleum diesel.
There was a difference in capital costs between the theoretical fluidized bed combustion system and the regression of actual plants. This could be due to what was considered to be included in capital costs by individual plant operators. The reported value of actual combustion plants had varying total capital costs, and the authors acknowledged that there was some uncertainty surrounding which elements were included on the total capital costs of the reported systems [25]. If certain costs that were deemed to be capital in the input data but were not by plant operators when reporting the values, it could lead to this discrepancy. The grate-fired combustor did not show a large enough advantage over the fluidized bed to conclusively determine it as the preferred technology. The choice between them will likely come to down to the specific circumstances of each plant and decided at the design stage.
Care should be taken when looking at the costs involved with the combustion systems, since neither of the previous works used to arrive at our calculations considered systems below 5 MWe. Further studies are needed to determine if direct combustion at smaller scales would still be the economical choice over diesel generators. The actual electricity demand would not be constant as we have calculated, and some amount of variation would be expected. If the real demand were known, the backup diesel generators in the system could run at a minimum load with enough spinning reserve to manage the power fluctuations, and the operational costs could be adjusted accordingly. Alternatively, excess steam could be generated that bypasses the generator when not needed for negative control power [59]. An economic analysis is also needed to determine the feasibility of cropping the feedstock in remote locations solely for bioenergy production. If the cropping is found to be economical, there is a strong case for a widespread introduction of these systems to remote communities.
The calorific content of the feedstock would not be expected to always have the same value as growth conditions can vary. A sensitivity analysis was carried out with LHVs that vary between 16–20 GJ/odt. The results showed that feedstock with LHV lower than 18 GJ/odt raised the cost by a larger amount than was reduced by using a higher LHV material. However, changes in the LHV were not enough to change the economical choice of technology; bio-oil was still the most expensive and direct combustion was the most economical at all LHV values.
There are many varieties of plant species that can be used as feedstock for bioenergy, but the genus of Acacia has many attributes that make it a good candidate, particularly for Australia. There are around 1000 species across the nation, and at least one species had been identified in every region of the country [60,61]. Other acacia species have shown potential to be used as a bioenergy feedstock since they have good energy properties and are fast-growing even in poor soil conditions [29,30,31,44,62,63,64,65]. Our preliminary analyses of 18 samples differing in species, climate zones, and landscapes across the Northern Territory found similar calorific content with higher heating values (HHV) in the range of 17–22 GJ/odt. The nitrogen-fixing plant genus is also hardy enough to grow in poor soil conditions, allowing application of the described model below for a multitude of locations.
All calculations were based on the LHV of A. mangium regrowth that was less than two years old. The reason this is important is that this species was introduced to the Tiwi Islands and grown there for forestry purposes. It has since spread throughout the island uncontrolled, disrupting the natural environment as it has in other locations where the vegetation was introduced [66,67]. By limiting the age of the trees and harvesting them before they seed, they would not be able to propagate and the ability to harvest what has already been established would remain. This process could be implemented in other locations around the world where the plants have become invasive as a cost-effective means of controlling their spread and eradicating them [68].
Mature trees, on the other hand, have a lower bark-to-trunk mass ratio [63], and had a higher LHV based on our measurements, and therefore would be a more economical option. In Australia, more value could be found through the alternative approach to instead grow Acacia species that are native to the area, such as Acacia auriculiformis for the Tiwi Islands, let them reach maturity, and have a higher LHV and lower AC. In other regions, appropriate plants would need to be identified.
Another important finding from this work is that the basic properties of trees that were exposed to wildfires did not vary considerably from undamaged trees. In fact, the lower MC of the damaged trees makes them more suitable for a feedstock since less energy would be needed to dry them and the energy content remained the same as unburnt trees. From a forestry perspective, this adds value to the plantation that otherwise would have been lost. From a broader perspective, due to climate change from greenhouse gas emissions, the severity and frequency of wildfires is increasing, leading to higher mortality of trees, at least in temperate regions [69,70]. If burnt vegetation whose thermochemical energy remained were harvested for energy purposes, and if the energy generated offsets conventional fuels, it would lower carbon emissions and help to reduce the incidence of the fires [23].
5. Conclusions
In this work, we investigated replacing the petroleum diesel-based electricity systems used in remote communities across Australia with biomass-based systems. In the specific case study of the Tiwi Islands using biomass from an acacia plantation, we found that producing bio-oil via fast pyrolysis to be used in the diesel generators was more expensive than the current petroleum diesel generation. Even extremely high values for carbon credits were not enough on their own to shift the economics to make the bio-oil system cheaper than diesel, so government financial aid would be needed. In addition to costs, employment opportunities, reduced greenhouse gas emissions, and increased energy security should be considered for converting technologies. Further opportunities should be investigated for upgrading the bio-oil to drop-in fuels that could be exported to mainland Australia or Southeast Asia. Of the three technologies investigated, direct combustion should be considered the best choice, generating the social and economic benefits of the pyrolysis plant, at a cost lower than the current petroleum diesel source. In Australia, local species of acacia would make a good starting point for investigations into potential plant varieties for a bioenergy feedstock to be used in remote power generation. In a broader sense, this framework outlines the steps needed to determine the best overall bioenergy facilities needed for remote power generation that provides constant electricity supply leading to lower emissions, local job opportunities, and improved energy security.
Author Contributions
Conceptualization, J.B.T., K.K.S., A.N.A. and S.N.T.; methodology, J.B.T., K.K.S. and S.N.T.; formal analysis, J.B.T.; investigation, J.B.T., writing—original draft preparation, J.B.T.; writing—review and editing, K.K.S., A.N.A. and S.N.T. All authors have read and agreed to the published version of the manuscript.
Funding
This research received no external funding.
Data Availability Statement
No new data were created or analyzed in this study. Data sharing is not applicable to this article.
Acknowledgments
We would like to thank Murray Knyvett from the Tiwi Land Council, the Tiwi Plantation Corporation, and Hanna Lillicrap from Plantation and Management Partners for providing us with the plant samples and other insights.
Conflicts of Interest
The authors declare no conflict of interest.
Appendix A
The cost of the annual pre-treatment costs for the pyrolysis process was interpolated from the data given by Bridgwater et al. [Bridgwater 2002]. The cost of pre-treatment was found to have a linear relationship between the feed delivered and cost as seen in Figure A1. The line of best fit provided Equation (4) above with an R2 value of 0.999. The fit was done using the linregress function from the Python module scipy.stats.
Figure A1.
Plot of annual pre-treatment costs versus feedstock delivered for biomass pyrolysis preparation. The values were taken from Bridgwater et al. [13].
Figure A1.
Plot of annual pre-treatment costs versus feedstock delivered for biomass pyrolysis preparation. The values were taken from Bridgwater et al. [13].

References
- Zomers, A. Remote Access: Context, Challenges, and Obstacles in Rural Electrification. IEEE Power Energy Mag. 2014, 12, 26–34. [Google Scholar] [CrossRef]
- Mainali, B.; Silveira, S. Alternative Pathways for Providing Access to Electricity in Developing Countries. Renew. Energy 2013, 57, 299–310. [Google Scholar] [CrossRef]
- Khodayar, M.E. Rural Electrification and Expansion Planning of Off-Grid Microgrids. Electr. J. 2017, 30, 68–74. [Google Scholar] [CrossRef]
- Longden, T. The Impact of Temperature on Mortality across Different Climate Zones. Clim. Chang. 2019, 157, 221–242. [Google Scholar] [CrossRef]
- Power and Water Corporation, Northern Territory. SETuP Knowledge—Daly River Lessons Learned; NT, Australia 2019. Available online: https://www.powerwater.com.au/__data/assets/pdf_file/0018/32328/SETuP-Knowledge-Sharing-Daly-River-Nauiyu-Lessons-Learned-and-Performance-Report-September-2019-FINAL.pdf (accessed on 7 December 2021).
- Sangha, K.K.; He, J.; Edwards, A.C.; Russell-Smith, J. Measuring Environmental Losses from Natural Disasters: A Case Study of Costing Bushfires in the Northern Territory. Aust. J. Emerg. Manag. 2019, 34, 32–40. [Google Scholar]
- Power and Water Corporation. Indigenous Essential Services Annual Report 2016–2017; Centre for Appropriate Technology: Darwin, Australia, 2017.
- Centre for Appropriate Technology. The Northern Territory Homelands and Outstations Asses and Access Review; Centre for Appropriate Technology: Alice Springs, Australia, 2016. [Google Scholar]
- Australian Bureau of Statistics. Housing and Infrastructure in Aboriginal and Torres Strait Islander Communities; Australian Bureau of Statistics: Belconnen, ACT, Australia, 2017.
- Kovats, R.S.; Hajat, S. Heat Stress and Public Health: A Critical Review. Annu. Rev. Public Health 2008, 29, 41–55. [Google Scholar] [CrossRef]
- Longden, T.; Quilty, S.; Riley, B.; White, L.V.; Klerck, M.; Davis, V.N.; Frank Jupurrurla, N. Energy Insecurity during Temperature Extremes in Remote Australia. Nat. Energy 2022, 7, 43–54. [Google Scholar] [CrossRef]
- Patz, J.A.; Campbell-Lendrum, D.; Holloway, T.; Foley, J.A. Impact of Regional Climate Change on Human Health. Nature 2005, 438, 310–317. [Google Scholar] [CrossRef]
- Bridgwater, A.V.; Toft, A.J.; Brammer, J.G. A Techno-Economic Comparison of Power Production by Biomass Fast Pyrolysis with Gasification and Combustion. Renew. Sustain. Energy Rev. 2002, 6, 181–246. [Google Scholar] [CrossRef]
- Hossain, A.K.; Davies, P.A. Pyrolysis Liquids and Gases as Alternative Fuels in Internal Combustion Engines—A Review. Renew. Sustain. Energy Rev. 2013, 21, 165–189. [Google Scholar] [CrossRef]
- Ringer, M.; Putsche, V.; Scahill, J. Large-Scale Pyrolysis Oil Production: A Technology Assessment and Economic Analysis; National Renewable Energy Laboratory (NREL): Golden, CO, USA, 2006; Report number NREL/TP-510-37779. [Google Scholar]
- Oasmaa, A.; van de Beld, B.; Saari, P.; Elliott, D.C.; Solantausta, Y. Norms, Standards, and Legislation for Fast Pyrolysis Bio-Oils from Lignocellulosic Biomass. Energy Fuels 2015, 29, 2471–2484. [Google Scholar] [CrossRef]
- Brown, D.; Rowe, A.; Wild, P. A Techno-Economic Analysis of Using Mobile Distributed Pyrolysis Facilities to Deliver a Forest Residue Resource. Bioresour. Technol. 2013, 150, 367–376. [Google Scholar] [CrossRef]
- Zafar, S. Biomass Pyrolysis. AltEnergyMag, 2 February 2009. Available online: https://www.altenergymag.com/article/2009/02/biomass-pyrolysis/502/ (accessed on 29 December 2022).
- Gollakota, A.R.K.; Reddy, M.; Subramanyam, M.D.; Kishore, N. A Review on the Upgradation Techniques of Pyrolysis Oil. Renew. Sustain. Energy Rev. 2016, 58, 1543–1568. [Google Scholar] [CrossRef]
- Kumar, R.; Strezov, V.; Weldekidan, H.; He, J.; Singh, S.; Kan, T.; Dastjerdi, B. Lignocellulose Biomass Pyrolysis for Bio-Oil Production: A Review of Biomass Pre-Treatment Methods for Production of Drop-in Fuels. Renew. Sustain. Energy Rev. 2020, 123, 109763. [Google Scholar] [CrossRef]
- Rodrigues Santos Alves, V. Advances in the Pyrolysis Process and the Generation of Bioenergy. In Recent Perspectives in Pyrolysis Research; Bartoli, M., Giorcelli, M., Eds.; IntechOpen: London, UK, 2022; ISBN 978-1-83969-914-6. [Google Scholar]
- Wright, M.M.; Daugaard, D.E.; Satrio, J.A.; Brown, R.C. Techno-Economic Analysis of Biomass Fast Pyrolysis to Transportation Fuels. Fuel 2010, 89, S2–S10. [Google Scholar] [CrossRef] [Green Version]
- González, A.; Riba, J.-R.; Puig, R.; Navarro, P. Review of Micro- and Small-Scale Technologies to Produce Electricity and Heat from Mediterranean Forests׳ Wood Chips. Renew. Sustain. Energy Rev. 2015, 43, 143–155. [Google Scholar] [CrossRef]
- Obernberger, I. Decentralized Biomass Combustion: State of the Art and Future Development 11 Paper to the Keynote Lecture of the Session “Processes for Decentralized Heat and Power Production Based on Cumbustion’’ at the 9th European Bioenergy Conference, June 1996, Copenhagen, Denmark. Biomass Bioenergy 1998, 14, 33–56. [Google Scholar] [CrossRef]
- Morató, T.; Vaezi, M.; Kumar, A. Techno-Economic Assessment of Biomass Combustion Technologies to Generate Electricity in South America: A Case Study for Bolivia. Renew. Sustain. Energy Rev. 2020, 134, 110154. [Google Scholar] [CrossRef]
- 2016 Tiwi Islands, Census All Persons QuickStats | Australian Bureau of Statistics. Available online: https://www.abs.gov.au/census/find-census-data/quickstats/2016/702031060 (accessed on 23 August 2022).
- Solar Rolling out in Northern Territory Off-Grid Communities—Australian Renewable Energy Agency (ARENA). Available online: https://arena.gov.au/news/solar-rolling-out-in-northern-territory-off-grid-communities/ (accessed on 23 August 2022).
- Tiwi Forestry, Melville Island, Northern Territory. Available online: https://www.tiwiplantations.com.au/ (accessed on 14 September 2022).
- Ahmed, A.; Abu Bakar, M.S.; Azad, A.K.; Sukri, R.S.; Mahlia, T.M.I. Potential Thermochemical Conversion of Bioenergy from Acacia Species in Brunei Darussalam: A Review. Renew. Sustain. Energy Rev. 2018, 82, 3060–3076. [Google Scholar] [CrossRef]
- Amirta, R.; Anwar, T.; Sudrajat; Yuliansyah; Suwinarti, W. Trial Production of Fuel Pellet from Acacia Mangium Bark Waste Biomass. IOP Conf. Ser. Earth Environ. Sci. 2018, 144, 012040. [Google Scholar] [CrossRef]
- Crespo, Y.A.; Naranjo, R.A.; Quitana, Y.G.; Sanchez, C.G.; Sanchez, E.M.S. Optimisation and Characterisation of Bio-Oil Produced by Acacia Mangium Willd Wood Pyrolysis. Wood Sci. Technol. 2017, 51, 1155–1171. [Google Scholar] [CrossRef]
- Marsoem, S.N.; Irawati, D. Basic Properties of Acacia Mangium and Acacia Auriculiformis as a Heating Fuel. AIP Conf. Proc. 2016, 1755, 130007. [Google Scholar] [CrossRef] [Green Version]
- 2016 Wurrumiyanga, Census All Persons QuickStats | Australian Bureau of Statistics. Available online: https://www.abs.gov.au/census/find-census-data/quickstats/2016/SSC70295 (accessed on 23 August 2022).
- 2016 Pirlangimpi, Census All Persons QuickStats | Australian Bureau of Statistics. Available online: https://www.abs.gov.au/census/find-census-data/quickstats/2016/SSC70226 (accessed on 23 August 2022).
- 2016 Milikapiti, Census All Persons QuickStats | Australian Bureau of Statistics. Available online: https://www.abs.gov.au/census/find-census-data/quickstats/2016/SSC70185 (accessed on 23 August 2022).
- 2016 Maningrida, Census All Persons QuickStats | Australian Bureau of Statistics. Available online: https://www.abs.gov.au/census/find-census-data/quickstats/2016/UCL715003 (accessed on 23 August 2022).
- Power and Water Corporation, Northern Territory, Solar Energy Transformation Program Performance Report #1 for 1 July 2018 to 30 June 2019, NT, Australia 2020. Available online: https://arena.gov.au/assets/2020/10/setup-performance-report-1.pdf (accessed on 7 December 2021).
- Power and Water Corporation, Northern Territory. The Solar Energy Transformation Program (SETuP)—Lessons and Opportunities for High Renewables Mini-Grids. In Proceedings of the ARENA Insights Forum, 25 June 2019. Available online: https://www.powerwater.com.au/__data/assets/pdf_file/0019/32329/SETuP-Presentation-to-ARENA-Insights-forum-June-2019.pdf (accessed on 7 December 2021).
- Whittle, L.; Lock, P.; Hug, B. Economic Potential for New Plantation Establishment in Australia: Outlook to 2050: Research Report 19.4; Australian Bureau of Agriculture, Fisheries and Forestry: Sydney, NSW, Australia, 2019. [Google Scholar] [CrossRef]
- Australian Institute of Petroleum Historical ULP and Diesel TGP Data | Australian Institute of Petroleum. Available online: http://www.aip.com.au/historical-ulp-and-diesel-tgp-data (accessed on 23 August 2022).
- Carbon Credits (Carbon Farming Initiative) Act, Australia 2011.
- ACCUs.Com.Au. Available online: https://www.accus.com.au/ (accessed on 13 September 2022).
- Oasmaa, A.; Leppamaki, E.; Koponen, P.; Levander, J.; Tapola, E. Physical Characterisation of Biomass-Based Pyrolysis Liquids Application of Standard Fuel Oil Analyses; Technical Research Centre of Finland (VTT): Espoo, Finland, 1997; ISBN 951–38–5051–X. [Google Scholar]
- Tchichelle, S.V.; Mareschal, L.; Koutika, L.-S.; Epron, D. Biomass Production, Nitrogen Accumulation and Symbiotic Nitrogen Fixation in a Mixed-Species Plantation of Eucalypt and Acacia on a Nutrient-Poor Tropical Soil. For. Ecol. Manag. 2017, 403, 103–111. [Google Scholar] [CrossRef]
- Bridgwater, A.V. Review of Fast Pyrolysis of Biomass and Product Upgrading. Biomass Bioenergy 2012, 38, 68–94. [Google Scholar] [CrossRef]
- Database—Harmonised Indices of Consumer Prices (HICP)—Eurostat. Available online: https://ec.europa.eu/eurostat/web/hicp/data/database (accessed on 23 August 2022).
- Australian Tax Office Calendar Year Ending. 31 December 2021. Available online: https://www.ato.gov.au/Tax-professionals/TP/Calendar-year-ending-31-December-2021/ (accessed on 23 August 2022).
- Pawar, A.; Panwar, N.L.; Salvi, B.L. Comprehensive Review on Pyrolytic Oil Production, Upgrading and Its Utilization. J. Mater. Cycles Waste Manag. 2020, 22, 1712–1722. [Google Scholar] [CrossRef]
- Caputo, A.C.; Palumbo, M.; Pelagagge, P.M.; Scacchia, F. Economics of Biomass Energy Utilization in Combustion and Gasification Plants: Effects of Logistic Variables. Biomass Bioenergy 2005, 28, 35–51. [Google Scholar] [CrossRef]
- CPI Home: U.S. Bureau of Labor Statistics. Available online: https://www.bls.gov/cpi/ (accessed on 23 August 2022).
- Riva, G. Analisi delle Iniziative per la produzione di Energia Elettrica da Biomasse Agro—Industriali in Italia (Analysis of Initiatives for the Production of Electricity from Agro-Industrial Biomass in Italy); April 2003. Available online: https://www.cti2000.it/utils/downloadfile.php?table=pubblicazioni&id=34855 (accessed on 20 June 2022).
- Shoal Bay Weigh Bridge Fees. Available online: https://www.darwin.nt.gov.au/sites/default/files/publications/attachments/city-of-darwin-weighbridge-Fees-Charges.pdf (accessed on 23 August 2022).
- Heriansyah, I.; Miyakuni, K.; Kato, T.; Kiyono, Y.; Kanazawa, Y. Growth characteristics and biomass accumulations of acacia mangium under different management practices in indonesia. J. Trop. For. Sci. 2007, 19, 226–235. [Google Scholar]
- Hanaki, K.; Portugal-Pereira, J. The Effect of Biofuel Production on Greenhouse Gas Emission Reductions. In Biofuels and Sustainability; Takeuchi, K., Shiroyama, H., Saito, O., Matsuura, M., Eds.; Science for Sustainable Societies; Springer: Tokyo, Japan, 2018; pp. 53–71. ISBN 978-4-431-54894-2. [Google Scholar]
- International Carbon Market. Available online: https://ec.europa.eu/clima/eu-action/eu-emissions-trading-system-eu-ets/international-carbon-market_en (accessed on 23 August 2022).
- EU Carbon Permits—2022 Data—2005-2021 Historical—2023 Forecast–Price–Quote. Available online: https://tradingeconomics.com/commodity/carbon (accessed on 23 August 2022).
- Trombley, J.; Thennadil, S. Wider Benefits and Industry Blueprint for the Integration of Solar Power into LNG Plants; National Energy Resources Australia (NERA): Perth, Australia, 2021; Available online: https://12259-console.memberconnex.com/Attachment?Action=Download&Attachment_id=372 (accessed on 29 December 2022).
- Sangha, K.K.; Duvert, A.; Archer, R.; Russell-Smith, J. Unrealised Economic Opportunities in Remote Indigenous Communities: Case Studies from Northern Australia. Soc. Sci. Humanit. Open 2020, 2, 100093. [Google Scholar] [CrossRef]
- Thrän, D.; Dotzauer, M.; Lenz, V.; Liebetrau, J.; Ortwein, A. Flexible Bioenergy Supply for Balancing Fluctuating Renewables in the Heat and Power Sector—A Review of Technologies and Concepts. Energ. Sustain. Soc. 2015, 5, 35. [Google Scholar] [CrossRef] [Green Version]
- Australia. Division of National Mapping, Australian Surveying and Land Information Group. Atlas of Australian Resources; Division of National Mapping: Canberra, ACT, Australia, 1980; ISBN 0642514585.
- World Wide Wattle. Available online: http://worldwidewattle.com/ (accessed on 25 August 2022).
- Ahmed, A.; Hidayat, S.; Abu Bakar, M.S.; Azad, A.K.; Sukri, R.S.; Phusunti, N. Thermochemical Characterisation of Acacia Auriculiformis Tree Parts via Proximate, Ultimate, TGA, DTG, Calorific Value and FTIR Spectroscopy Analyses to Evaluate Their Potential as a Biofuel Resource. Biofuels 2021, 12, 9–20. [Google Scholar] [CrossRef]
- Albaugh, T.J.; Rubilar, R.A.; Maier, C.A.; Acuña, E.A.; Cook, R.L. Biomass and Nutrient Mass of Acacia Dealbata and Eucalyptus Globulus Bioenergy Plantations. Biomass Bioenergy 2017, 97, 162–171. [Google Scholar] [CrossRef]
- Laclau, J.-P.; Bouillet, J.-P.; Gonçalves, J.L.M.; Silva, E.V.; Jourdan, C.; Cunha, M.C.S.; Moreira, M.R.; Saint-André, L.; Maquère, V.; Nouvellon, Y.; et al. Mixed-Species Plantations of Acacia Mangium and Eucalyptus Grandis in Brazil. For. Ecol. Manag. 2008, 255, 3905–3917. [Google Scholar] [CrossRef]
- le Maire, G.; Nouvellon, Y.; Christina, M.; Ponzoni, F.J.; Gonçalves, J.L.M.; Bouillet, J.-P.; Laclau, J.-P. Tree and Stand Light Use Efficiencies over a Full Rotation of Single- and Mixed-Species Eucalyptus Grandis and Acacia Mangium Plantations. For. Ecol. Manag. 2013, 288, 31–42. [Google Scholar] [CrossRef]
- Reza, M.S.; Ahmed, A.; Caesarendra, W.; Abu Bakar, M.S.; Shams, S.; Saidur, R.; Aslfattahi, N.; Azad, A.K. Acacia Holosericea: An Invasive Species for Bio-Char, Bio-Oil, and Biogas Production. Bioengineering 2019, 6, 33. [Google Scholar] [CrossRef] [Green Version]
- Koutika, L.-S.; Richardson, D.M. Acacia Mangium Willd: Benefits and Threats Associated with Its Increasing Use around the World. For. Ecosyst. 2019, 6, 2. [Google Scholar] [CrossRef] [Green Version]
- Vera, I.; Goosen, N.; Batidzirai, B.; Hoefnagels, R.; van der Hilst, F. Bioenergy Potential from Invasive Alien Plants: Environmental and Socio-Economic Impacts in Eastern Cape, South Africa. Biomass Bioenergy 2022, 158, 106340. [Google Scholar] [CrossRef]
- Etchells, H.; O’Donnell, A.J.; Lachlan McCaw, W.; Grierson, P.F. Fire Severity Impacts on Tree Mortality and Post-Fire Recruitment in Tall Eucalypt Forests of Southwest Australia. For. Ecol. Manag. 2020, 459, 117850. [Google Scholar] [CrossRef]
- Stephens, S.L.; Agee, J.K.; Fulé, P.Z.; North, M.P.; Romme, W.H.; Swetnam, T.W.; Turner, M.G. Managing Forests and Fire in Changing Climates. Science 2013, 342, 41–42. [Google Scholar] [CrossRef]
Figure 1.
Map of the Tiwi Islands with an inset map of Northern Australia.

Figure 2.
Framework used to determine the feasibility of using bioenergy to supply electricity to the Tiwi Islands, the requirements of such a system, and the benefits.
Figure 2.
Framework used to determine the feasibility of using bioenergy to supply electricity to the Tiwi Islands, the requirements of such a system, and the benefits.

Figure 3.
Pre-treatment process before pyrolysis of the biomass.

Figure 4.
The process for converting pre-treated biomass into bio-oil, then injected into diesel generators and electricity exported to the microgrid network.
Figure 4.
The process for converting pre-treated biomass into bio-oil, then injected into diesel generators and electricity exported to the microgrid network.

Figure 5.
The process for directly burning dried woodchips in a combustor to generate steam in a boiler. The steam is sent through a turbine and electricity is generated that is sent to the grid.
Figure 5.
The process for directly burning dried woodchips in a combustor to generate steam in a boiler. The steam is sent through a turbine and electricity is generated that is sent to the grid.


Table 1.
Characteristics of Acacia mangium samples from the plantations on Melville Island. All values given are in reference to oven-dried weight. (All uncertainties in MC were 0.1% and in AC were less than or equal to 0.1%. The HHV measurements all had standard deviations less than or equal to 0.3 GJ/odt, except for the fines which was 1.0 GJ/odt. The standard deviations in all elemental measurements are less than or equal for C of 0.5%, for H of 0.1%, except for leaves which was 1.3%, for N of 0.1%, for S of 0.03%, and for O of 1.0%).
| Sample | MC (%) | AC (%) | HHV (GJ/odt) | LHV (GJ/odt) | C (%) | H (%) | N (%) | S (%) | O (%) |
|---|---|---|---|---|---|---|---|---|---|
| Chips | 38.95 | 0.35 | 20.11 | 18.44 | 49.88 | 5.89 | 0.00 | 0.00 | 38.99 |
| Fines | 32.34 | 0.42 | 19.91 | 17.90 | 50.20 | 7.10 | 0.27 | 0.04 | 39.22 |
| Sticks | 10.20 | 1.76 | 20.95 | 19.25 | 51.75 | 6.02 | 0.87 | 0.02 | 34.84 |
| Leaves | 3.58 | 20.69 | 18.88 | 52.68 | 6.39 | 2.35 | 0.00 | 30.61 | |
| Shredded wood | 1.98 | 20.03 | 18.36 | 49.78 | 5.88 | 0.23 | 0.00 | 37.07 | |
| Bark | - | 5.58 * | - | - | - | - | - | - | - |
| Regrowth trunk | 47.62 | 0.60 | 19.70 | 18.00 | 48.92 | 5.99 | 0.03 | 0.01 | 39.40 |
| Trunk (2018 wildfire) | 20.14 | 0.87 | 20.77 | 19.11 | 51.04 | 5.89 | 0.00 | 0.00 | 36.42 |
| Trunk (2020 wildfire) | 24.74 | 0.92 | 20.25 | 18.66 | 51.69 | 5.62 | 0.00 | 0.00 | 38.46 |
* value for AC of bark taken from Amirta et al. [30].
Table 2.
Capital costs associated with running a diesel generator electricity plant with petroleum diesel and biomass converted to bio-oil fuel sources (exclusive of pre-treatment costs). All values are given in AUD millions. The annual capital costs were calculated using Equation (2).
Table 2.
Capital costs associated with running a diesel generator electricity plant with petroleum diesel and biomass converted to bio-oil fuel sources (exclusive of pre-treatment costs). All values are given in AUD millions. The annual capital costs were calculated using Equation (2).
| Process | Petroleum Diesel (AUD Millions) | Bio-Oil (AUD Millions) |
|---|---|---|
| Fast pyrolysis | - | 11.9 |
| Bio-oil storage | - | 0.2 |
| Diesel generators | 3.4 | 3.4 |
| Grid connection | 0.7 | 0.7 |
| Total capital costs | 4.1 | 16.2 (excluding pre-treatment) |
| Annual Capital costs | 0.4 | 1.4 (excluding pre-treatment) |
Table 3.
Operational costs associated with running a diesel generator electricity plant with petroleum diesel and biomass converted to bio-oil as its fuel source (exclusive of pre-treatment costs). The final row is the total overall costs of the plant including, pre-treatment, capital, and operational costs. All values given in AUD millions.
| Category | Petroleum Diesel (AUD Millions) | Bio-Oil (AUD Millions) |
|---|---|---|
| Labor | 0.19 | 0.56 |
| Maintenance | 0.27 | 0.58 |
| Insurance and overheads | 0.07 | 0.33 |
| Biomass (@175 AUD/odt) | - | 1.40 |
| Petroleum diesel (@44.0 AUD/GJ) | 4.19 | 0.32 |
| Total operational costs | 4.7 | 3.2 (excluding pre-treatment) |
| Total annual costs | 5.1 | 5.7 (including pre-treatment) |
Table 4.
Capital costs associated with running an electricity plant with directly combusted biomass. All costs are in AUD millions. The annual capital costs were calculated using Equation (2). (The calculations based on the work of Morató et al. only include the overall capital costs of direct combustion plant, hence why there are no line items).
| Caputo (Fluidized Bed) | Morató (Fluidized Bed) | Morató (Grate-Fired) | |
|---|---|---|---|
| Power generation | 5.54 | - | - |
| Biomass storage and handling | 0.43 | - | - |
| Fumes treatment | 1.00 | - | - |
| Piping | 0.65 | - | - |
| Electrical | 1.52 | - | - |
| Civil works | 3.30 | - | - |
| Direct installation | 2.10 | - | - |
| Auxiliary services | 1.05 | - | - |
| Instrumentation and controls | 0.70 | - | - |
| Site preparation | 0.70 | - | - |
| Engineering | 0.84 | - | - |
| Start-up | 0.70 | - | - |
| Diesel generator (1 MWe) | 2.47 | 2.47 | 2.47 |
| Total capital costs | 21.0 | 14.9 | 9.4 |
| Annual capital costs | 1.8 | 1.3 | 0.8 |
Table 5.
Operational costs associated with running an electricity plant with directly combusted biomass. All costs are in AUD millions.
Table 5.
Operational costs associated with running an electricity plant with directly combusted biomass. All costs are in AUD millions.
| Caputo (Fluidized Bed) | Morató (Fluidized Bed) | Morató (Grate-Fired) | |
|---|---|---|---|
| Labor | 0.75 | 0.75 | 0.75 |
| Maintenance | 0.31 | 0.18 | 0.14 |
| Insurance and overheads | 0.21 | 0.12 | 0.09 |
| Ash transport | 0.01 | 0.01 | 0.01 |
| Ash disposal | 0.01 | 0.01 | 0.01 |
| Biomass (@175 AUD/odt) | 1.3 | 1.3 | 1.3 |
| Petroleum diesel (@44.0 AUD/GJ) | 0.36 | 0.36 | 0.36 |
| Total operational costs | 3.0 | 2.7 | 2.7 |
| Total annual costs | 4.8 | 3.8 | 3.5 |
Table 6.
Sensitivity analysis of the LCOE due to the calorific content of the raw biomass feedstock. For comparison, the LCOE of the modelled diesel system was AUD 0.582/kWh.
Table 6.
Sensitivity analysis of the LCOE due to the calorific content of the raw biomass feedstock. For comparison, the LCOE of the modelled diesel system was AUD 0.582/kWh.
| Feedstock LHV | Bio-Oil (AUD/kWh) (% Change) | Direct Combustion (AUD/kWh) (% Change) |
|---|---|---|
| 16 GJ/odt | 0.686 (+5.4%) | 0.477 (+4.3%) |
| 18 GJ/odt | 0.651 (-) | 0.457 (-) |
| 20 GJ/odt | 0.643 (−1.2%) | 0.442 (−3.3%) |
Disclaimer/Publisher’s Note: The statements, opinions and data contained in all publications are solely those of the individual author(s) and contributor(s) and not of MDPI and/or the editor(s). MDPI and/or the editor(s) disclaim responsibility for any injury to people or property resulting from any ideas, methods, instructions or products referred to in the content. |
© 2023 by the authors. Licensee MDPI, Basel, Switzerland. This article is an open access article distributed under the terms and conditions of the Creative Commons Attribution (CC BY) license (https://creativecommons.org/licenses/by/4.0/).
Share and Cite
MDPI and ACS Style
Trombley, J.B.; Sangha, K.K.; Andersen, A.N.; Thennadil, S.N. Utilizing Locally Available Bioresources for Powering Remote Indigenous Communities: A Framework and Case Study. Energies 2023, 16, 666. https://doi.org/10.3390/en16020666
AMA Style
Trombley JB, Sangha KK, Andersen AN, Thennadil SN. Utilizing Locally Available Bioresources for Powering Remote Indigenous Communities: A Framework and Case Study. Energies. 2023; 16(2):666. https://doi.org/10.3390/en16020666
Chicago/Turabian StyleTrombley, Jeremy B., Kamaljit K. Sangha, Alan N. Andersen, and Suresh N. Thennadil. 2023. "Utilizing Locally Available Bioresources for Powering Remote Indigenous Communities: A Framework and Case Study" Energies 16, no. 2: 666. https://doi.org/10.3390/en16020666
Note that from the first issue of 2016, this journal uses article numbers instead of page numbers. See further details here.