Article

Thermal Energy and Luminosity Characterization of an Advanced Ignition System Using a Non-Intrusive Methodology in an Optically Accessible Calorimeter

1
Engineering Department, University of Perugia, Via Goffredo Duranti, 93, 06125 Perugia, Italy
2
DISMI—Department of Sciences and Methods for Engineering, University of Modena and Reggio Emilia, Via Giovanni Amendola, 2, 42122 Reggio Emilia, Italy
3
Federal-Mogul Powertrain Italy, a Tenneco Group Company, Stabilimento Ignition—Carpi, Via Della Scienza 6/8, 41012 Carpi, Italy
*
Author to whom correspondence should be addressed.
Energies 2023, 16(1), 520; https://doi.org/10.3390/en16010520
Submission received: 17 October 2022 / Revised: 19 December 2022 / Accepted: 20 December 2022 / Published: 3 January 2023
(This article belongs to the Special Issue Internal Combustion Engine: Research and Application)

Abstract

:
To restrain the environmental impact of modern SI engines, igniters must guarantee stable combustions with low cycle-to-cycle variability in extreme operating conditions (high EGR, ultra-lean), via high energy release in the combustion chamber. The direct measurement of this energy is not trivial and requires a controlled environment. Luminosity detection is a non-intrusive diagnostic technique to indirectly measure the thermal energy released by the discharge on optically accessible apparatus. This work compares energy and luminosity produced by a plasma igniter in a constant volume vessel at realistic working conditions (ignition at 8 bar and air as a medium). A calibration factor can be defined to describe the thermal energy behavior as a function of the discharge luminosity and to give an assessment of such approach for its use in optically accessible engine. This study shows that thermal energy and luminosity are influenced by the gas type and related by a linear relationship for both air and nitrogen. The presence of oxygen resulted in discharges with reduced energy delivery to the medium and a lower discharge luminosity compared to nitrogen. This work outcome could improve the use of a non-intrusive methodology, based on luminosity detection, to characterize the igniter performance, exploitable for 3D-CFD.

1. Introduction

The role of internal combustion engines (ICE) has been predominant for ground transportation in recent decades. In the foreseeable future, ICE will still hold a key role in transportation, industry and power generation, justifying the manufacturers endeavor to design more efficient and cleaner engines [1,2]. The path toward a more sustainable transport sector determined the enforcement of ever-stringent pollutant emissions and greenhouse gas regulations in order to limit the impact of fossil fuels on a local and global scale. Such targets require Spark-Ignition (SI) engines to adopt combustion strategies involving increased boost level, water injection [3,4], lean burn and/or high exhaust gas recirculation (EGR) diluted mixture [5,6]. In these challenging operating conditions, the reduced mixture reactivity demands high ignition energies to be delivered by the igniter to guarantee an effective combustion initiation [7,8,9]. Hence, the determination of the amount of energy deposited into the medium is of pivotal importance to characterize the ignition system capability of providing a robust and stable ignition process [10,11]. In fact, the thermal energy released by the discharge accentuates the chemical kinetics of the fuel oxidation chain reactions by increasing the local gas temperature, thus mightily influencing flame kernel formation [12,13].
Generally speaking, the igniter thermal energy characterization requires the adoption of dedicated controlled environments, such as the constant volume vessel [14,15,16]. In this context, the discharge produces a pressure rise inside the chamber, which can be considered proportional to the released energy, in the approximation of adiabaticity, and measured by employing extremely sensible pressure sensors [14]. This approach cannot be exploited in real engine applications because of the inherent dynamic pressure variation occurring during the compression stroke. Therefore, the small pressure oscillation caused by the discharge event could not be appropriately quantified. Moreover, the approximation of adiabaticity is hardly acceptable and the imperfect combustion chamber sealing, resulting in the leakage of a portion of the compressed charge, renders the determination of the working gas volume quite challenging.
Ricci et al. [17], in their previous work, studied the correlation among the luminous emission and the thermal energy deposited into nitrogen by a plasma-assisted igniter (PAI), in an optically accessible pressure-based calorimeter. A linear correlation between the two main outputs of the discharge has been found. The main purpose was to furnish an innovative optical method to estimate the thermal energy released by the igniter through the estimation of the discharge luminosity.
In ICE research field, luminosity detection is a well-known approach to providing quantitative information about combustion inception and flame kernel formation where the indicated analysis encounters its limit [18,19,20]. Optical access engines are widely adopted to study the flame propagation, the combustion stability, the heat release rate and as diagnostic tool for the combustion process and pollutant emissions [21,22,23]. Predominantly, these analyses are performed exploiting high-speed cameras, whose output frames permit not only luminosity emission to be assessed but also 2D-spatial information to be maintained [24,25]. Another technique to collect discharge or flame luminosity consists of placing an optical sensor—a photodetector—inside the combustion chamber, to provide luminous emission magnitude of certain area but losing the spatial information [26,27].
Within this context, the work herein wants to mirror the methodology in [17] in order to demonstrate if a direct relationship between luminosity and the amount of deposited thermal energy could be extended from a quasi-inert atmosphere (nitrogen) to a real oxidant one (air), and how the latter could affect the igniter discharge. As a test medium, synthetic air has been employed with the aim of investigating near-like engine oxidant at engine relevant pressure. A PAI was chosen to carry out the experimental campaign, and specifically, a barrier discharge igniter (BDI) prototype has been tested in an optical access calorimeter by simultaneously acquiring the pressure variation inside the chamber and the event luminosity due to the discharge.
Differently from traditional igniters, PAIs are innovative ignition systems based on the generation of non-equilibrium plasma, in the form of streamers (ionization waves), and characterized by the absence of a breakdown phase as well as a relatively larger ignition volume [28,29]. On one hand, the physical features of the discharge promote ignition not only through thermal effect but also by chemical kinetic effect, i.e., the production of active radicals and excited species [30]. On the other hand, a wider discharge volume renders such igniters well-suited to collect luminosity data and then to correlate those with thermal energy measurements. Several concepts have been studied to date: nanosecond pulse discharge [15], microwave assisted [31], radio-frequency corona ignition [32,33,34] and barrier discharge ignition [35,36].
Among those, the BDI proved its capability of promoting flame kernel formation and enhance combustion stability, which are attributes of major interest for combustion in lean, ultra-lean or highly EGR diluted mixture conditions [37,38].
The selection of a BDI relates to its discharge modulation capability, in terms of peak electrode voltage and time duration, and its dielectric layer (barrier). The first permits several luminosity and thermal energy levels to be investigated, while the second prevents streamer-to-arc transition [38]. In addition to that, the igniter choice was driven from the fact that numerical results suggested how the radical production effect is less predominant than the thermal deposition one [39].
Thermal effect is the dominant component for a traditional igniter such as a spark plug, since they are associated with the production of thermal or equilibrium plasma (because the plasma is in thermal equilibrium with the free electrons and therefore it has their high temperature). The latter is not capable of producing a substantial ionization (i.e., radicals production), that proved to be a pivotal factor in enhancing flame kernel formation in hard-to-ignite mixtures when non-equilibrium plasma igniters were adopted. However, the thermal effect is still produced by the PAIs and still plays a role in the overall ignition process. On the other hand, in the absence of spectral analysis, the impact of each ignition mechanism is not distinguishable and cannot be quantified separately: the overall igniter ability to start the fuel mixture combustion allows to determine the main ignition mechanism only, since it heavily affects the flame onset speed (fast speed for the low temperature non-equilibrium plasma related effects, slow speed for the thermal effect). Additionally, the overall luminosity is a sum of contributions, due both to the thermal effect and to the electronic transitions, distinctive of the PAI physics, in the (not only) visible light spectrum.
The luminosity and the ability to ignite a fuel mixture are then functions of these effects (thermal effect as well as ionization effect) and therefore can be related each other. Even if this relationship is precisely unknown, is fixed once the particular igniter kind is chosen, allowing for the luminosity calibration.
Consequently, the present work has two major intents: the first one is to fully analyze the luminosity–thermal energy correlation in the presence of air, an in-cylinder engine mixture component (fresh air, fuel vapor, exhaust residual) present in optical and metal engines, and assess the impact of oxygen on the discharge behavior, since it is by far the most active species in the combustion chamber; the second is to evaluate if luminosity can be exploited as a non-intrusive diagnostic parameter, in applications like optical access engine, to quantify the thermal energy released into the mixture. Moreover, since the oxygen presence affects dramatically the discharge morphology, in terms of shape and branching, the present paper shows a novel and quantitative approach to characterize the physical development of the streamers on the igniter surface to highlight and evaluate the oxygen contribution. Finally, a comparison with pure N2 [17] is also proposed, not only in terms of luminous emission, but also considering the main discharge features.

2. Materials and Methods
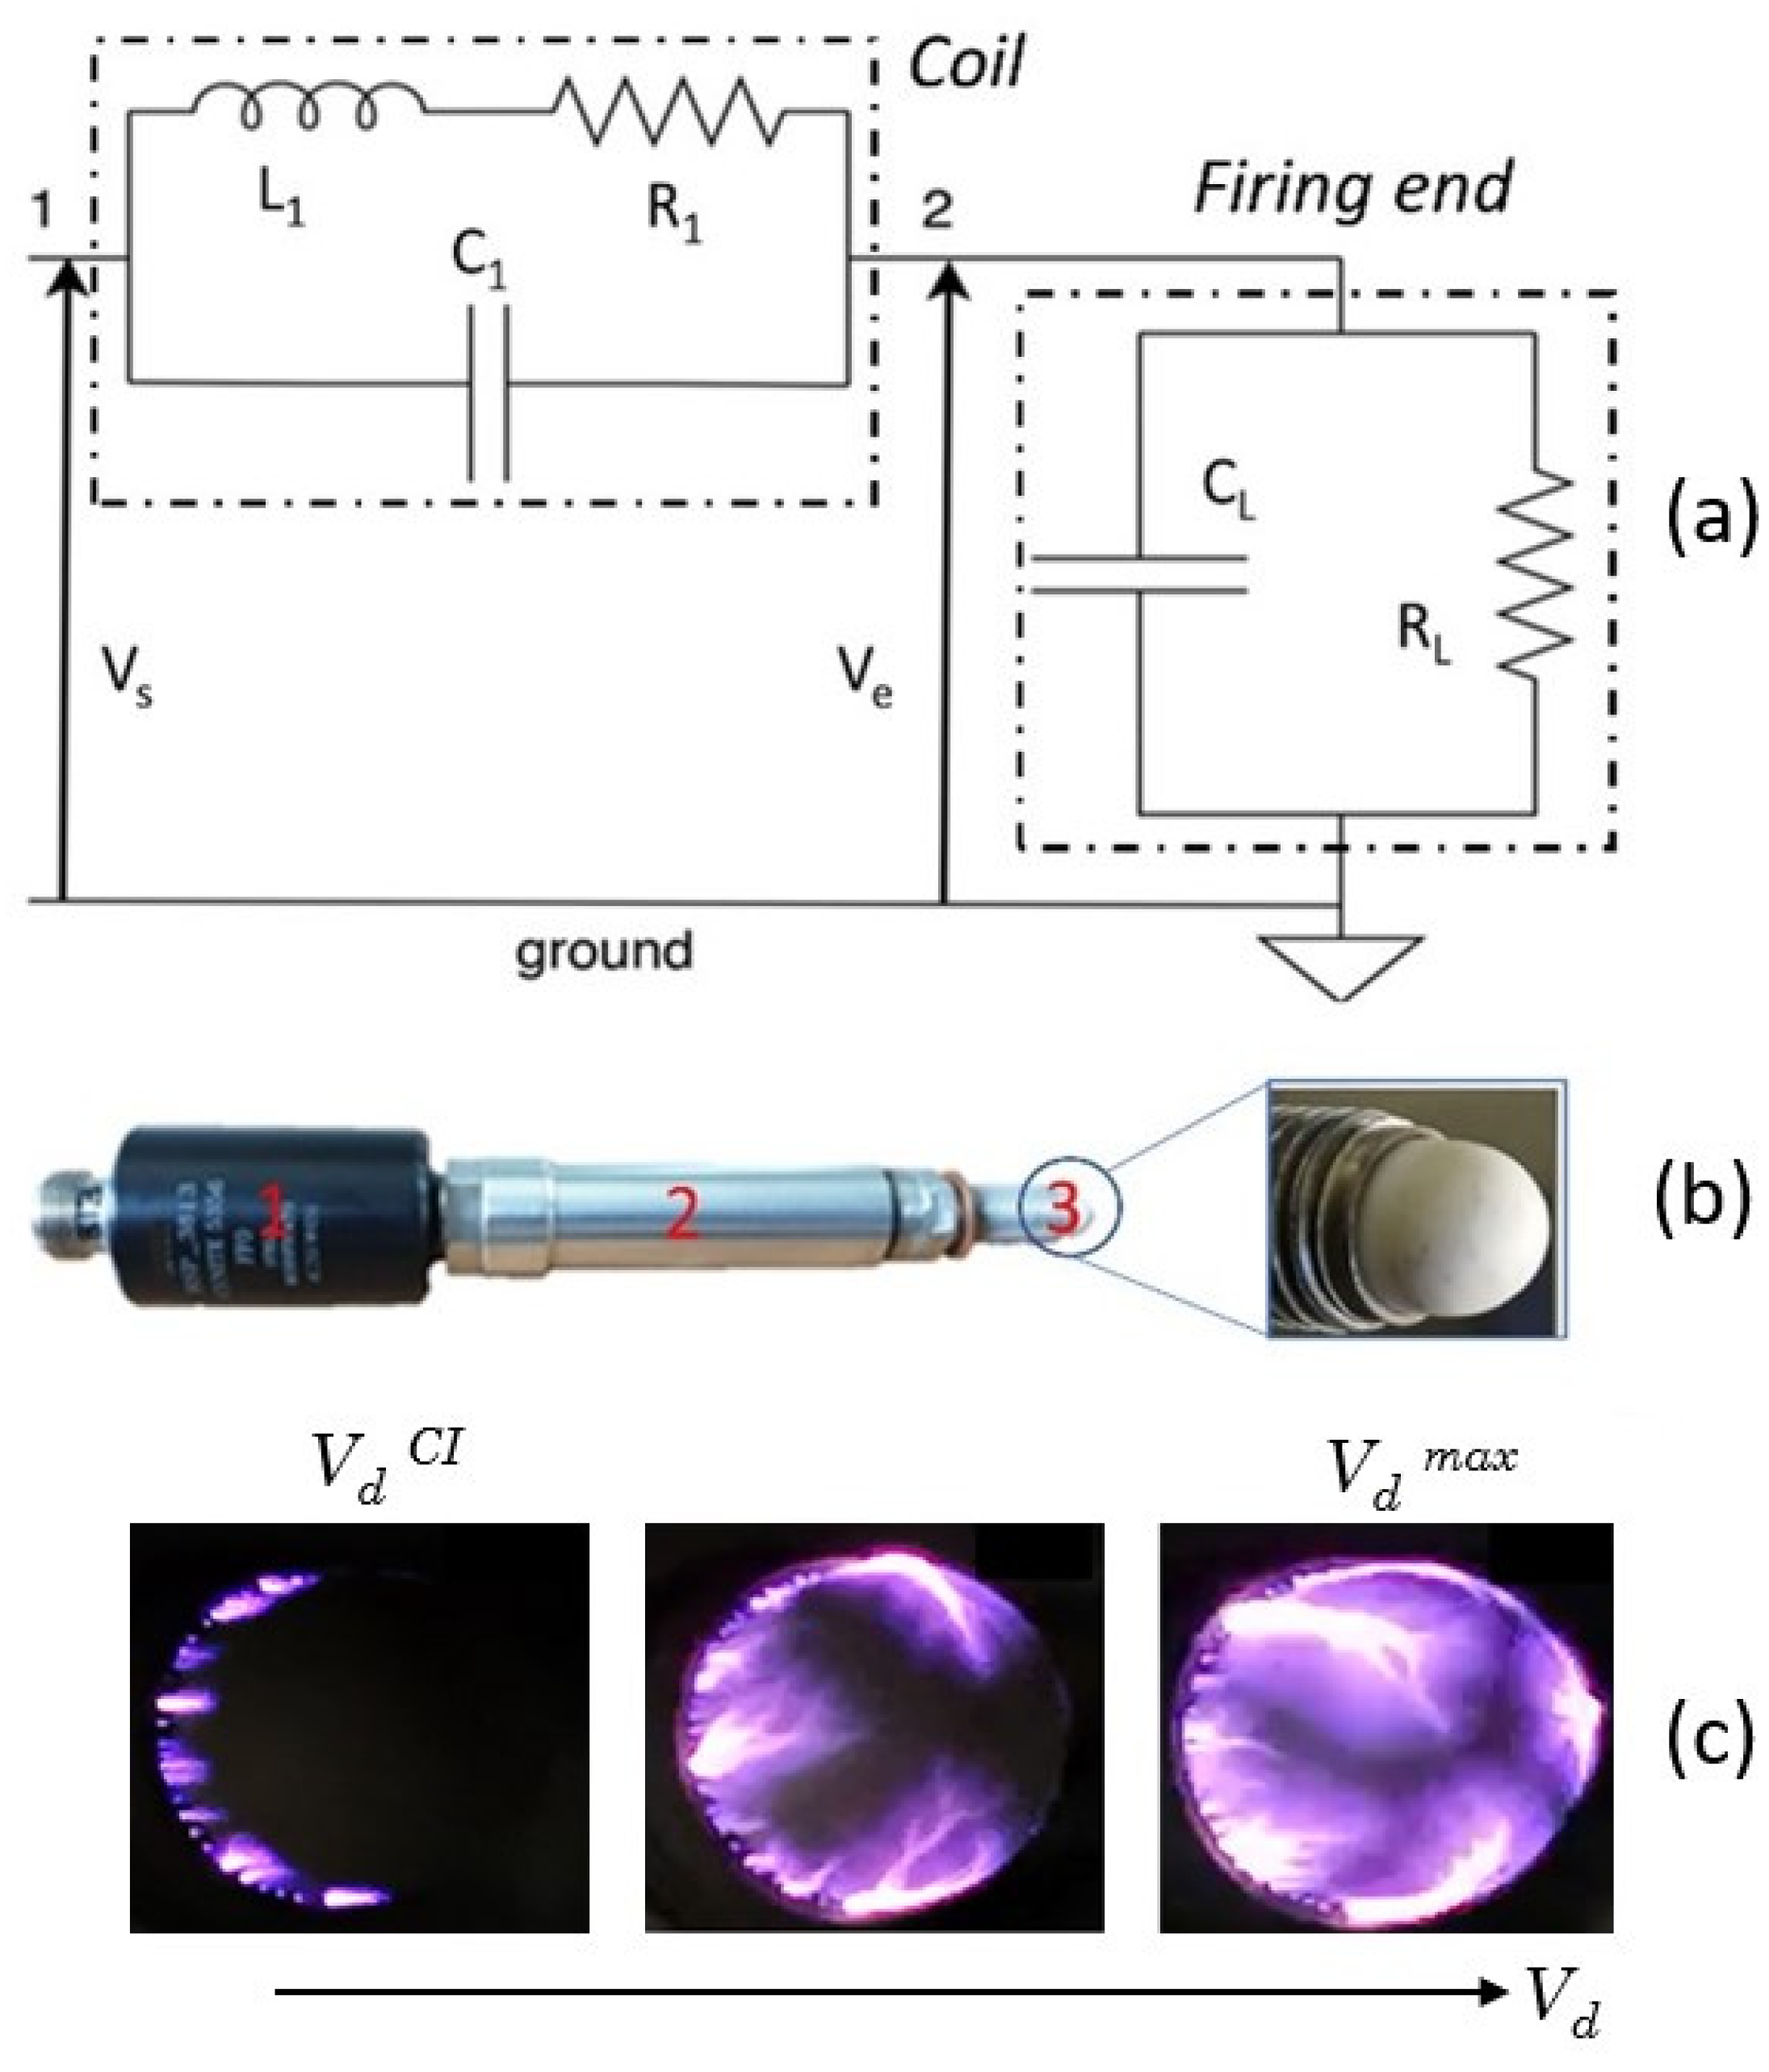
2.1. Igniter

The dielectric barrier discharge, studied in this work (Figure 1b), is produced by the so-called barrier discharge igniter. The device belongs to the advanced corona ignition system (acis) family [37] and it was provided by Federal Mogul Powertrain—a Tenneco group company.
A dedicated electronic system (ACIS Box) powers the igniter assembly with an input radiofrequency of about 1.04 MHz, corresponding to the resonance frequency of the equivalent RLC circuit [38] of Figure 1b.
The main control parameters are the driving voltage Vd and the activation time ton [37], which are directly correlated with peak electrode voltage (Ve) and discharge duration [16], respectively. Once Vd is set, the electronic system magnifies the voltage up to a proportional value (supplied voltage, Vs) and provides it to the coil. This latter amplifies the voltage to the firing end up to Ve in order to produce the discharge.
According to the equivalent model (Figure 1a), the electrode voltage Ve is proportional to the driving voltage Vd. Since measuring Ve is not allowed without causing the dielectric breakdown [35,36], the driving voltage Vd is used as reference.
For an established gas mixture, density and pressure, the discharge arises in a precise voltage range, from corona inception voltage (VdCI) to the maximum value allowed by the manufacturer (VdMAX). Above the VdCI, the applied electric field surpasses a critical threshold, promoting the discharge onset. Then, streamers (ionization waves) start propagating annularly from the zero-potential BDI thread on top of its dielectric globe (Figure 1c). The hemispheric alumina insulation covers the BDI inner electrode and hinders streamer-to-arc transition phenomenon near breakdown voltage values [36,40] in order to ensure the dielectric barrier discharge [41,42].

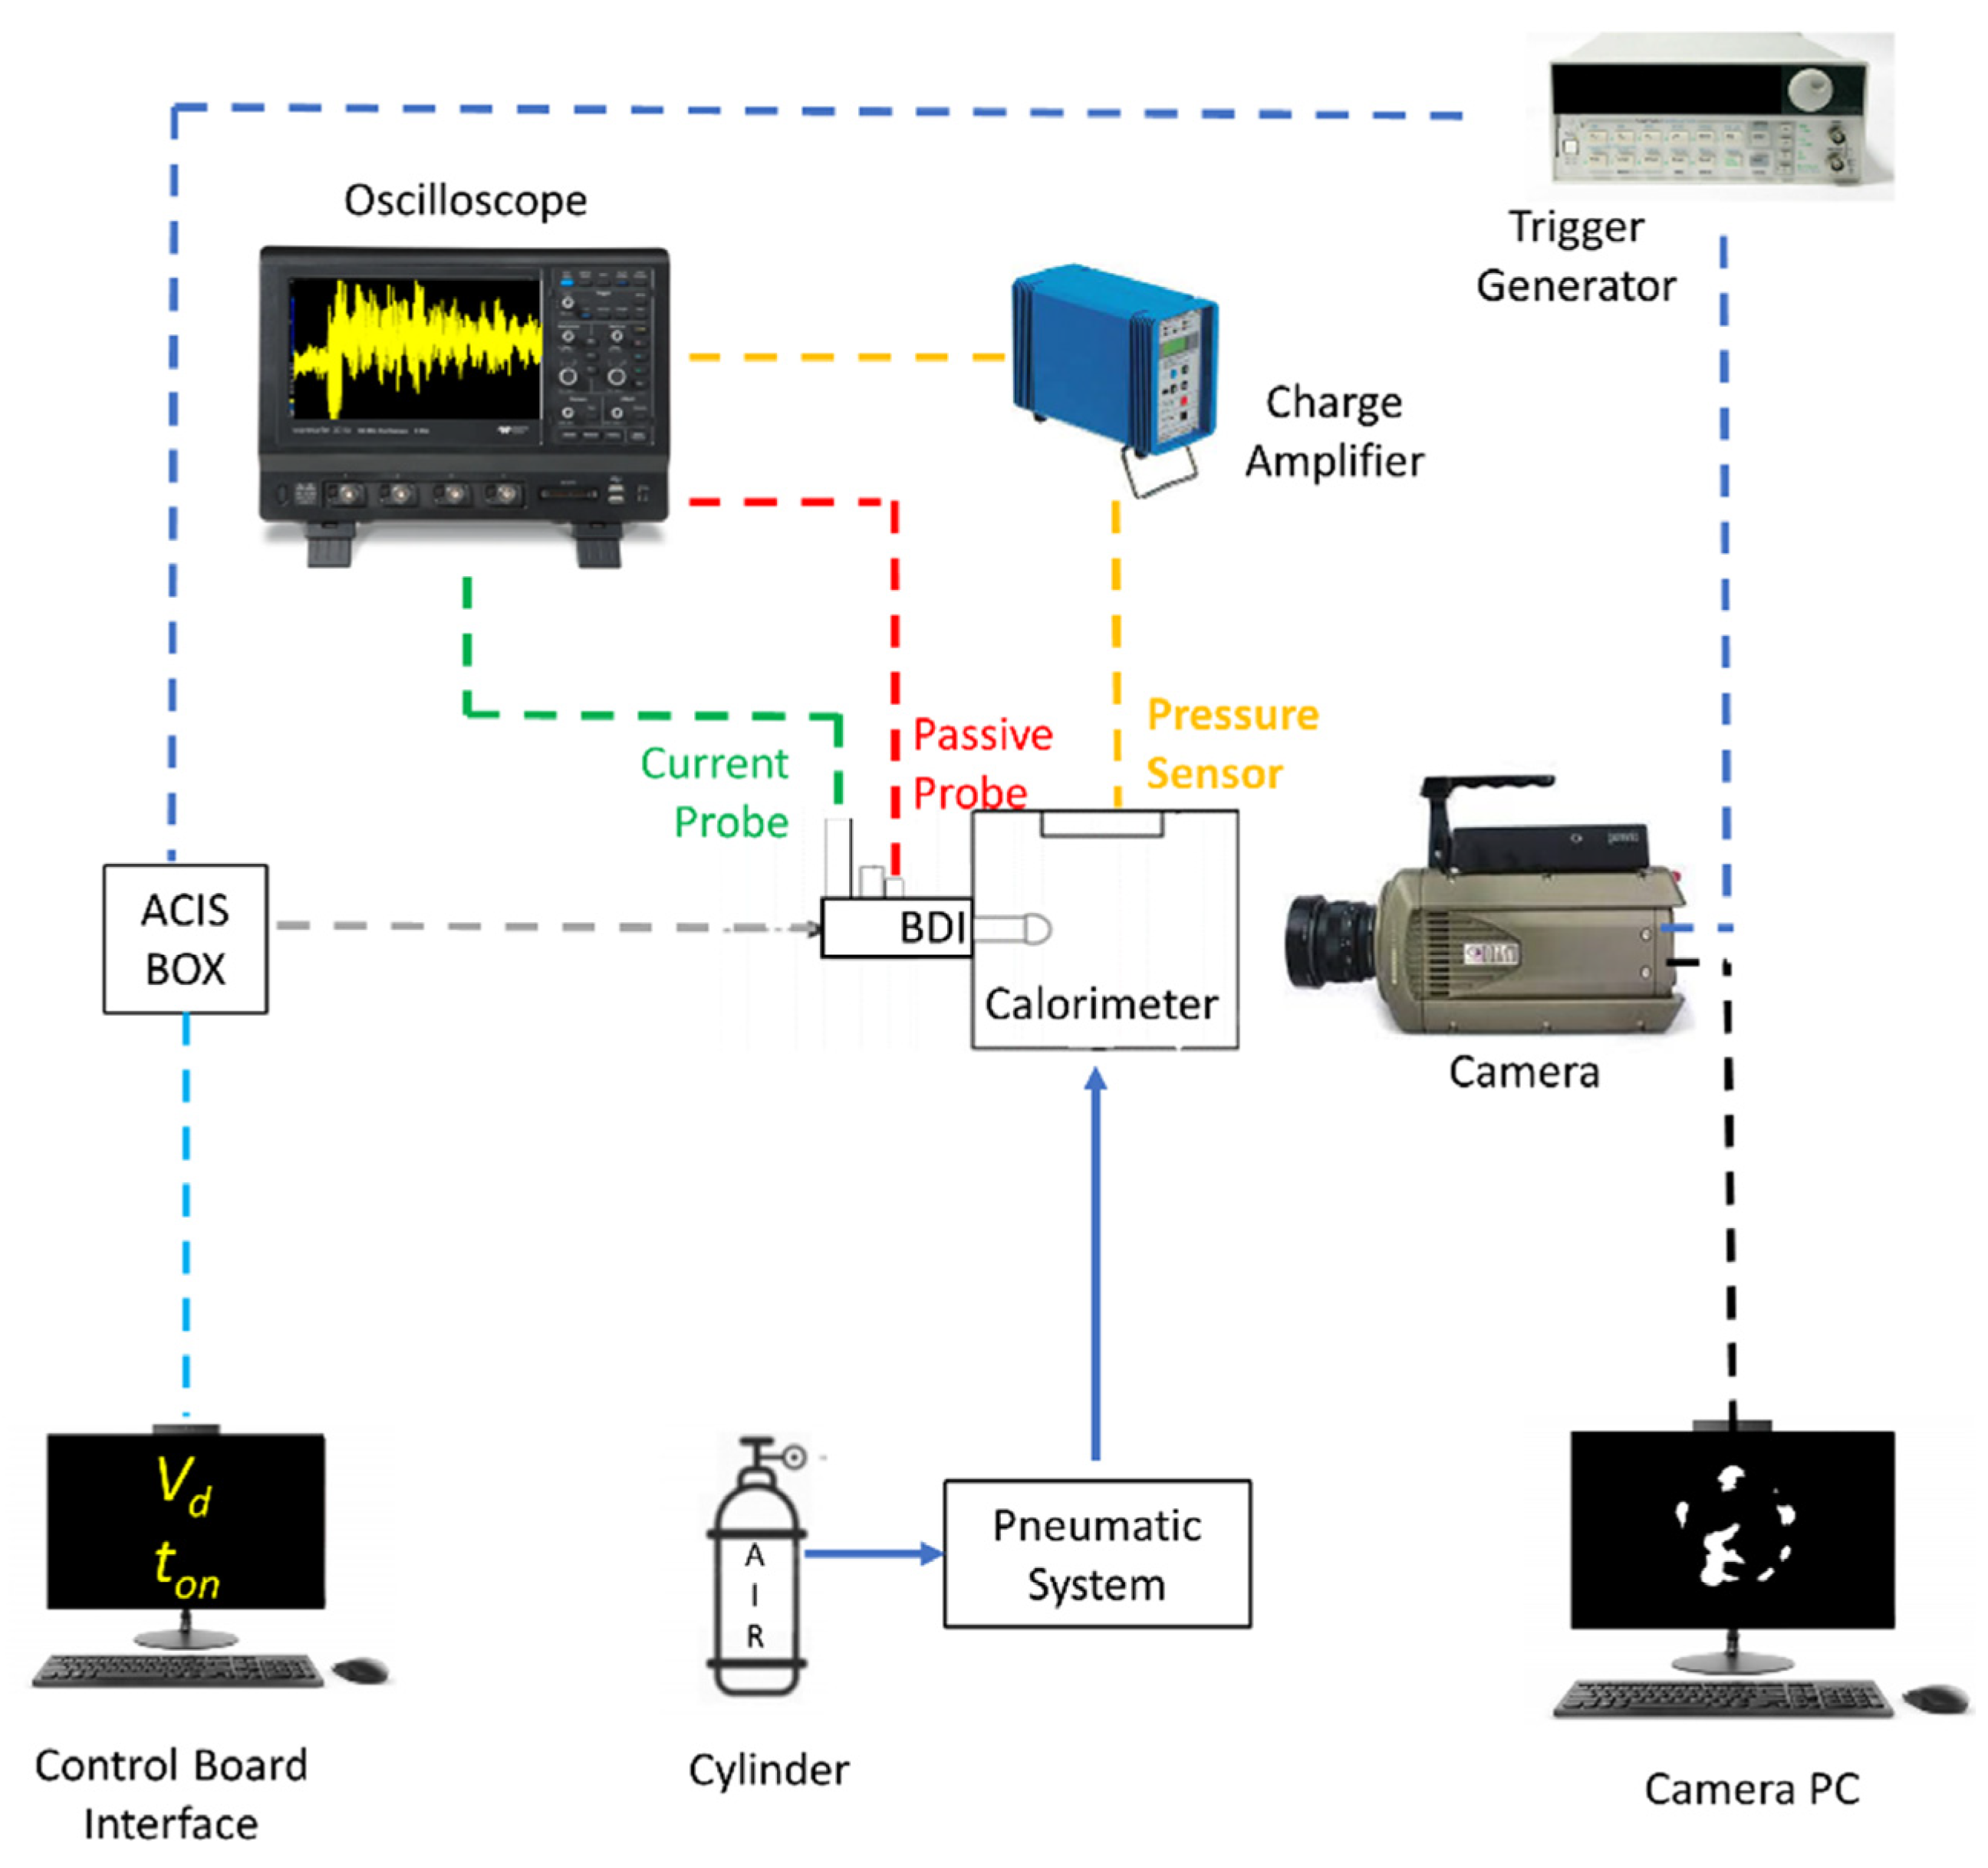
2.1.1. Experimental Setup

Tests were performed making use of an experimental set-up where a constant volume optical calorimeter was installed (Figure 2). The latter featured a volume of ν c h = 65.2 cm3 and it was made of plexiglass to ensure low thermal conductivity (0.187 W·m−1·K−1). The vessel was filled with synthetic air at room temperature (293 ± 1 °K), pressure regulation and flow exchange were managed by a pneumatic system equipped with a precision pressure reducer Festo LRP and one-way flow valves. It must be noted that a gas replacement after each discharge event (i.e., similarly to what occurs inside an internal combustion engine) was not feasible due to the time required for an effective medium replacement. Each discharge event was triggered by a TTL signal produced by an arbitrary wave generator (HP 33120A), at 10 Hz. With such frequency, the pressure level before a subsequent discharge is steady, so that each discharge is not affected by the previous one. Moreover, 10 Hz is coherent with the discharge frequency of the BDI at 1000–2000 rpm in a 4-stroke engine, a typical speed range in which the optical engine of our research group operated [23]. The signal coming from an arbitrary wave generator was also utilized to trigger the acquisition of a Phantom V710 high-speed camera, placed in front of the calorimeter, which records the igniter discharge natural luminosity. The voltage and the current at the igniter primary circuit were gathered by a Teledyne LeCroy PP020 passive probe measure and Teledyne LeCroy CP030 current probe (accuracy ±1.5% full scale), respectively. The pressure fluctuations due to the discharge event were recorded by a Kistler Type 7261 piezoelectric pressure transducer with 2200 pC·bar−1 of sensitivity and ≈10−5 bar of resolution). The latter signal was amplified and converted by a Kistler Type 5011 charge amplifier into a proportional voltage signal. All the aforementioned signals were acquired by a fast oscilloscope Lecroy Wavesurfer 3000 with a sampling frequency of 10 MHz, about ten times larger than the BDI working frequency. For each test point, 25 consecutive events were recorded and stored. This experimental apparatus allowed us to generate BDI discharges and to match the subsequent pressure rise with the streamers evolution images.
In this work, synthetic air Linde 5.0 with a composition of 80% N2 and 20% O2 in volume was used [43]. In the visible range, the discharge emission was mainly included in the 390–435 nm range for N2 [37,38] and to the 525–845 nm range for oxygen species [44].
The high-speed camera (Table 1) was equipped with a 6-diopter close-up lens placed downstream of a 50 mm f/1.4 lens. Each frame comprised 256 × 256 pixels and sampled at the maximum framerate allowed at the chosen image resolution (herein 79,000 fps, around one every 12.66 ms). The minimum allowed distance between camera and igniter was used in order to improve the spatial resolution by reducing the minimum focal distance (54 μm/pixel of spatial resolution was obtained).
The experimental optical apparatus (imaging apparatus [45] and plexiglass calorimeter) is sensitive in all the above-mentioned ranges. Moreover, no special filters were used in this test campaign.

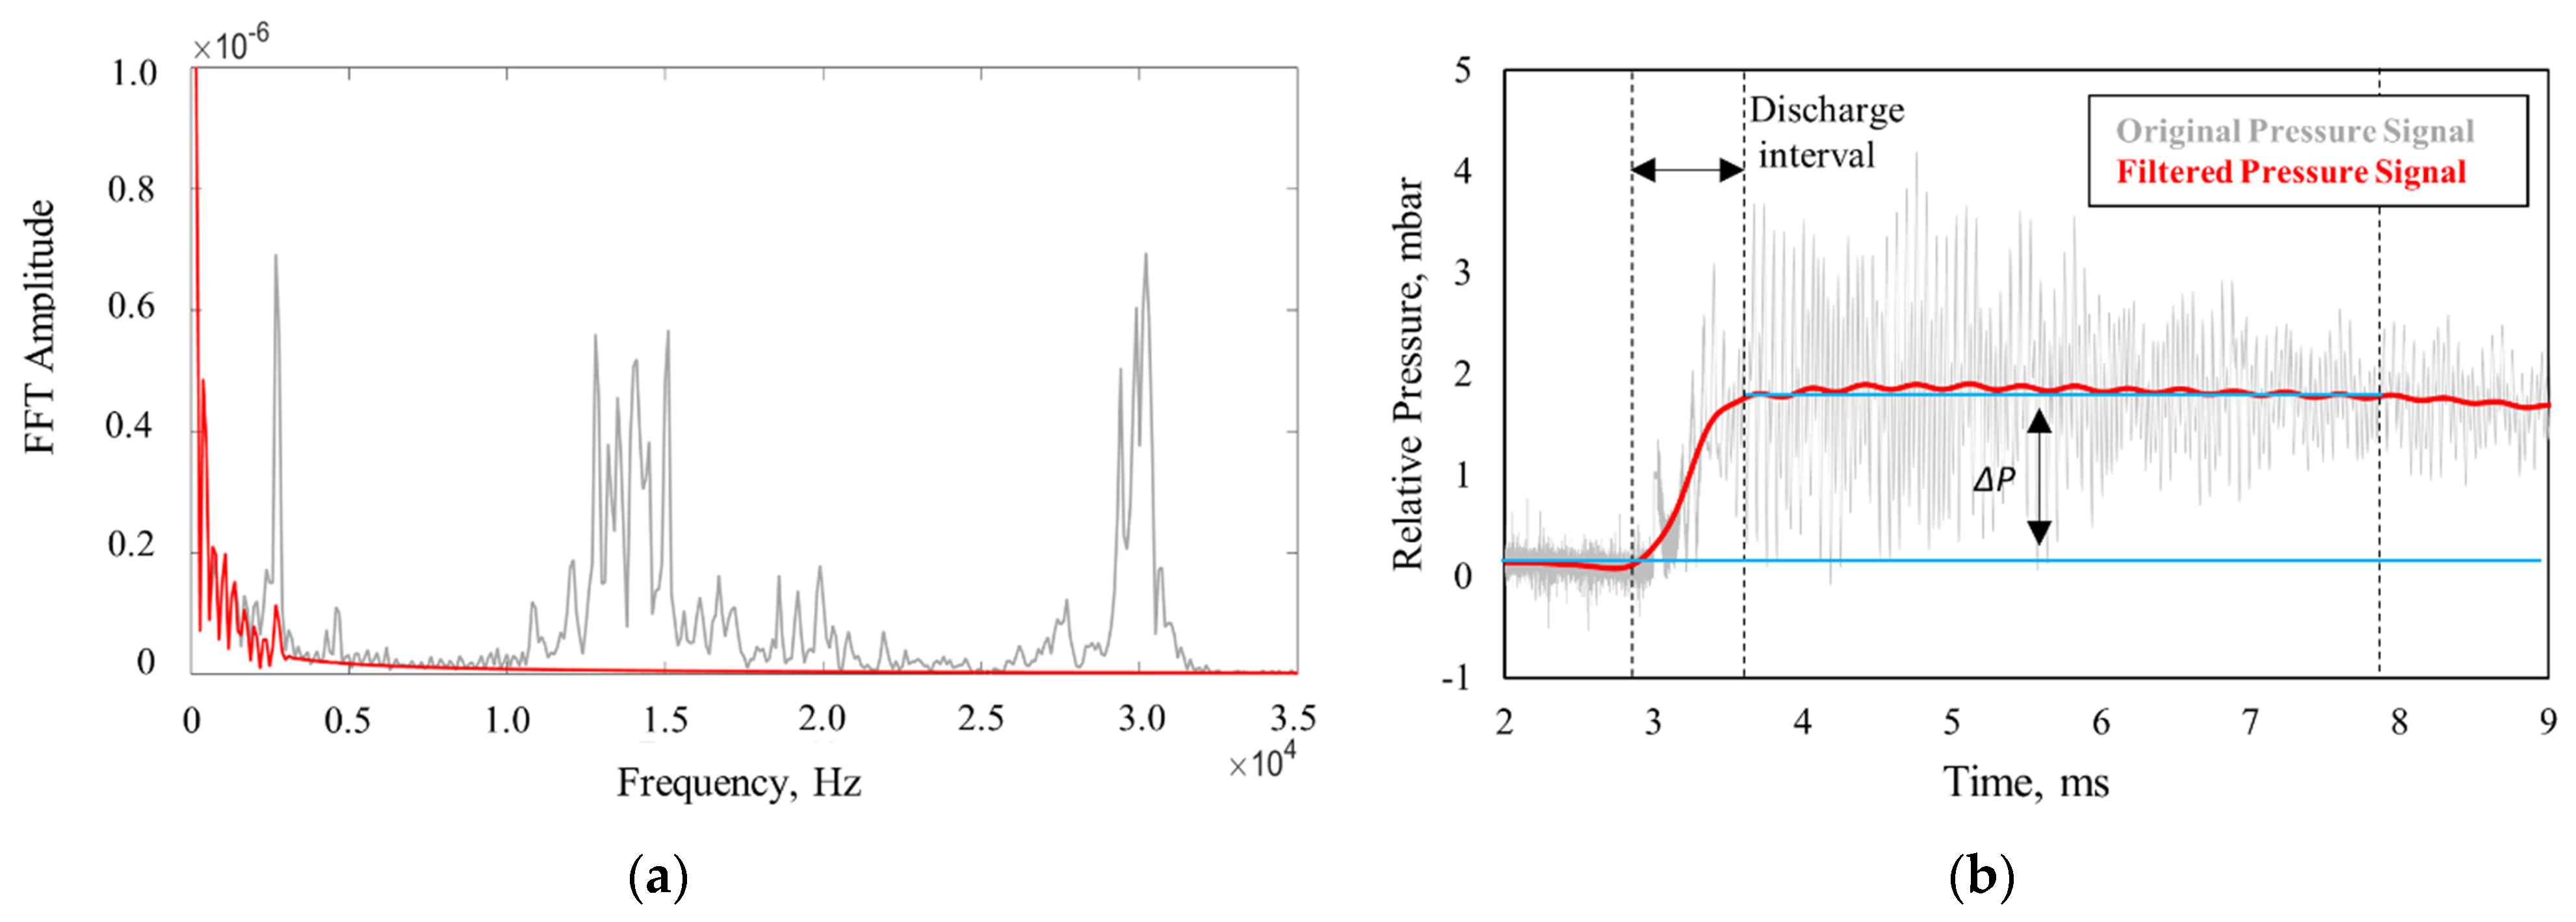
2.1.2. Released Thermal Energy Measurement

Once the pressure signal (Figure 3a) was acquired, the deposited thermal energy (Er) was computed starting from the internal pressure variation (ΔP = P m a x ¯ P m i n ¯ ) due to the discharge event, whose estimation is performed by in-house post-processing algorithms in MATLAB environment.
To correctly determine it, the recorded pressure signal (Figure 3a, grey line) was filtered by a 2 kHz low-pass filter [10] (Figure 3b, red line).
The determination of the cut-off frequency was performed by considering the FFT of the pressure signal with the aim of removing noise contribution [10]. A value of 2 kHz was found to be adequate for this purpose (Figure 3b). After the low-pass filtering, the algorithm identifies the steady values before ( P m i n ¯ ) and after ( P m a x ¯ ) the discharge, to compute ΔP. The steady value determination would be much more unstable if performed on a raw signal, especially for low energy discharges (low voltage and/or low duration), where the signal-to-noise ratio is low.
Assuming the hypothesis of adiabaticity of the chamber (effective for some milliseconds), the first law of thermodynamics can be used to compute the deposited thermal energy (1):
E r = 1 γ 1 ν c h Δ P
where ν c h is the chamber volume and γ is the specific heat ratio of the gas. To compute the average value E r ¯ and the standard deviation, 25 measurements were carried out for each tested point.

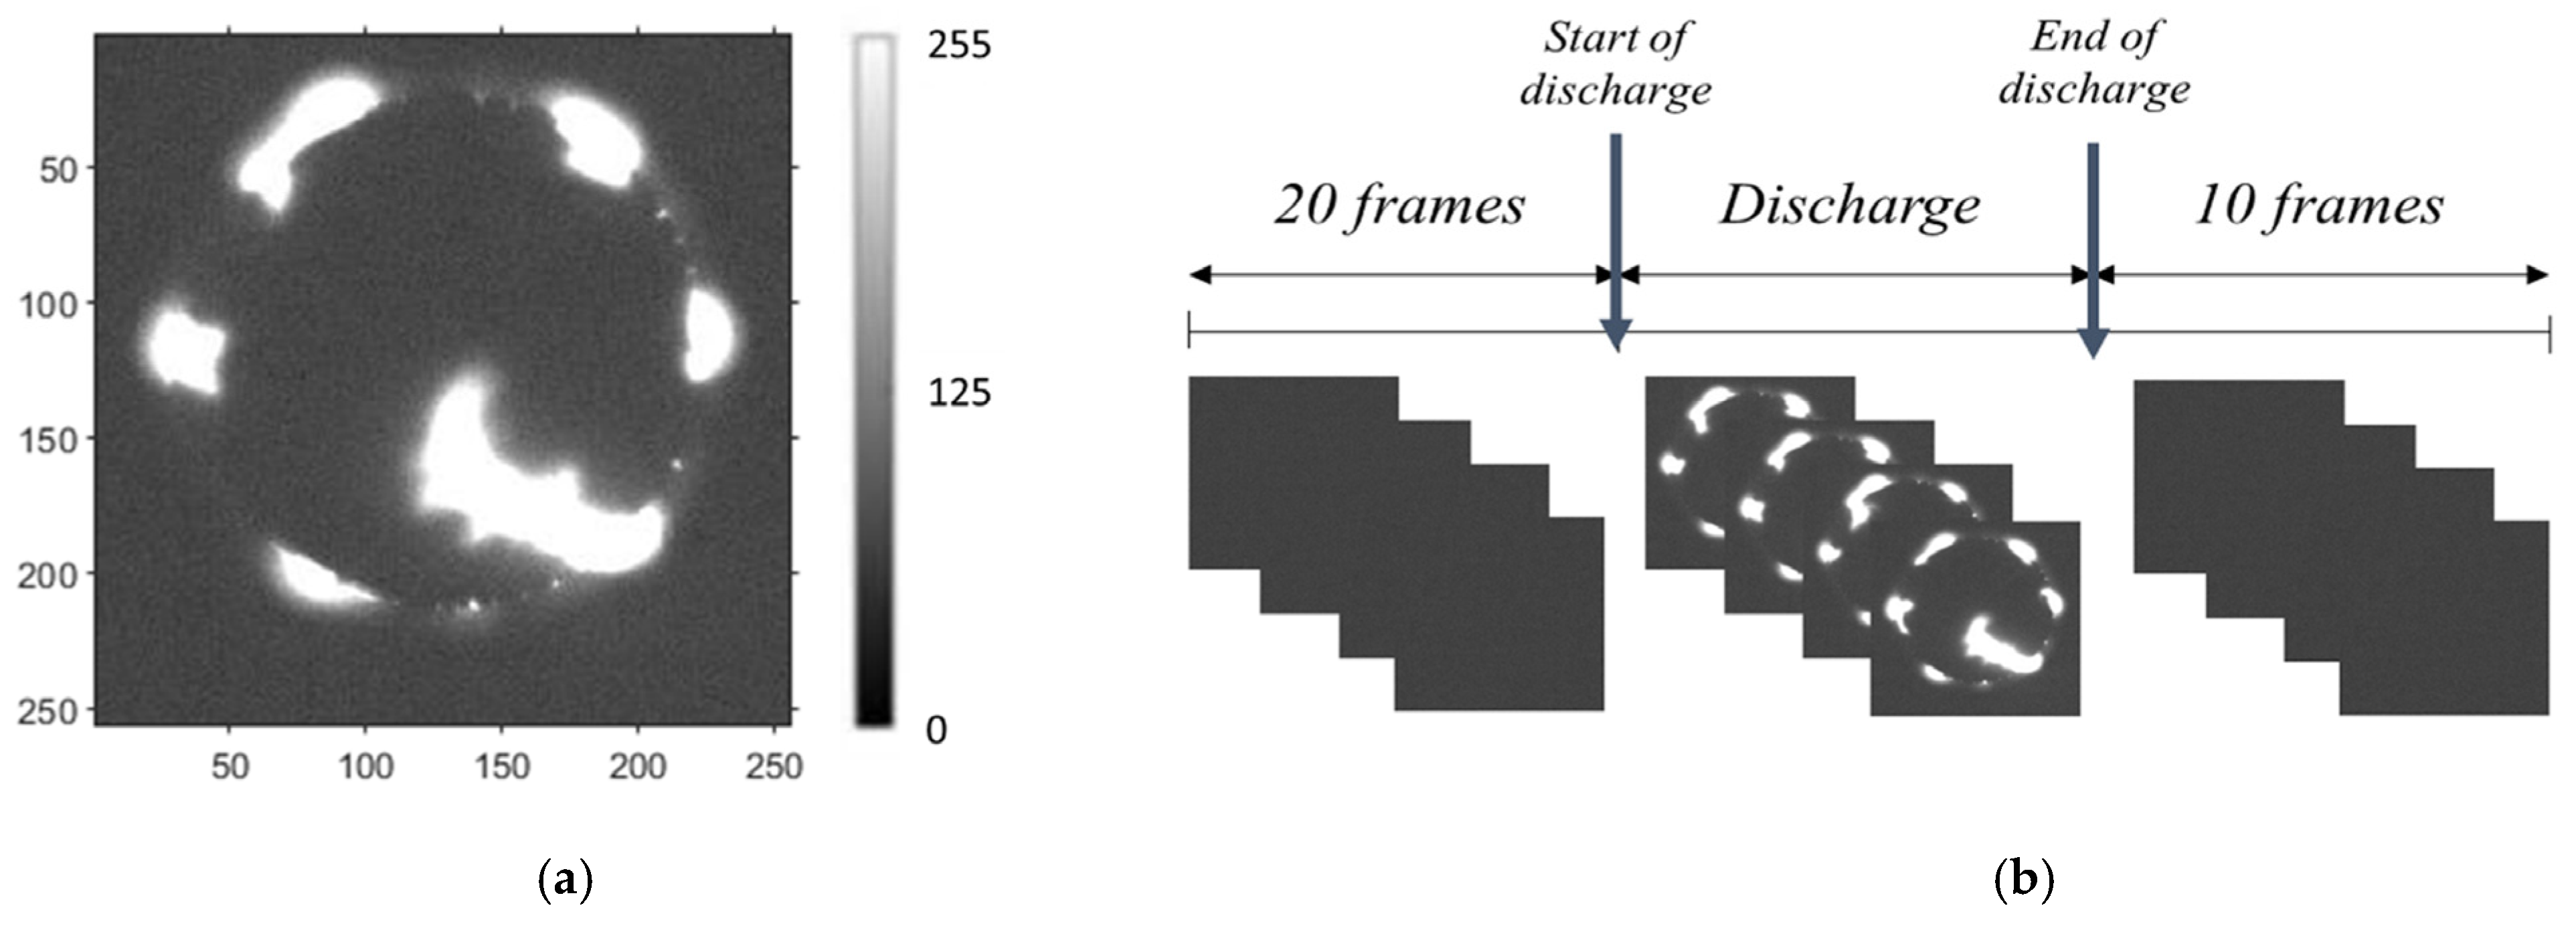
2.1.3. Luminosity Analysis

Depending on the discharge activation time of the device, the recorded events were composed by a certain number of frames (S), each of which comprised 256 × 256 pixels at 8 bits. In a similar manner to the thermal energy, the estimation of the discharge luminosity is performed by in-house MATLAB scripts. The luminosity level of each pixel was assumed proportional to the grey level intensity acquired by the camera [46] (Figure 4a).
Since pixel saturation could influence the energy–luminosity correlation, such circumstance must be limited to properly interrelate the amount of thermal energy released from the discharge to its brightness. Because of this, an adequate selection of the camera diaphragm position was found to obtain a trade-off between restricting the number of saturating pixels (in case of high energy–brightness discharge), by reducing the luminosity absorption, and avoiding the loss of resolution for the low energy–brightness discharge events. Before image processing, the user circumscribes the discharge event by selecting, on the file acquired by the camera PC, the frames to be post-processed. In fact, the 20 frames before the start of discharge were needed to characterize the background, while 10 frames were required after the end of the discharge to make sure that the discharge was effectively over (Figure 4b).
All the steps of the employed procedure for the luminosity estimation are described below:
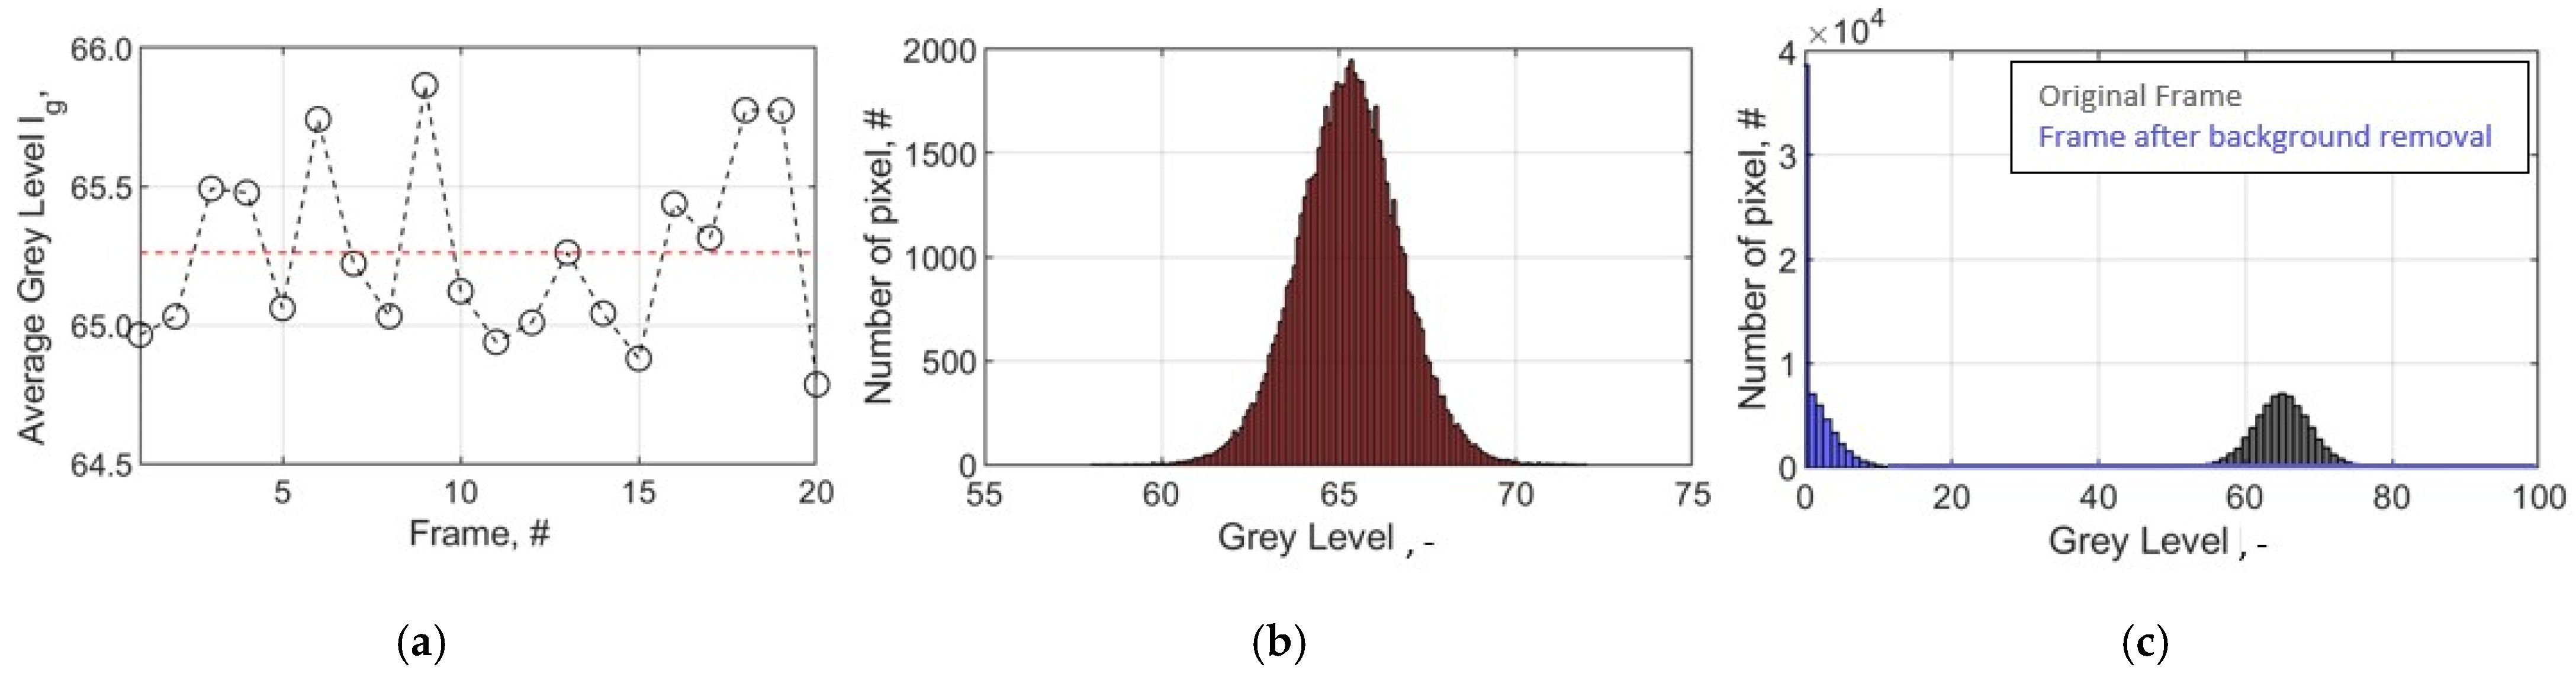
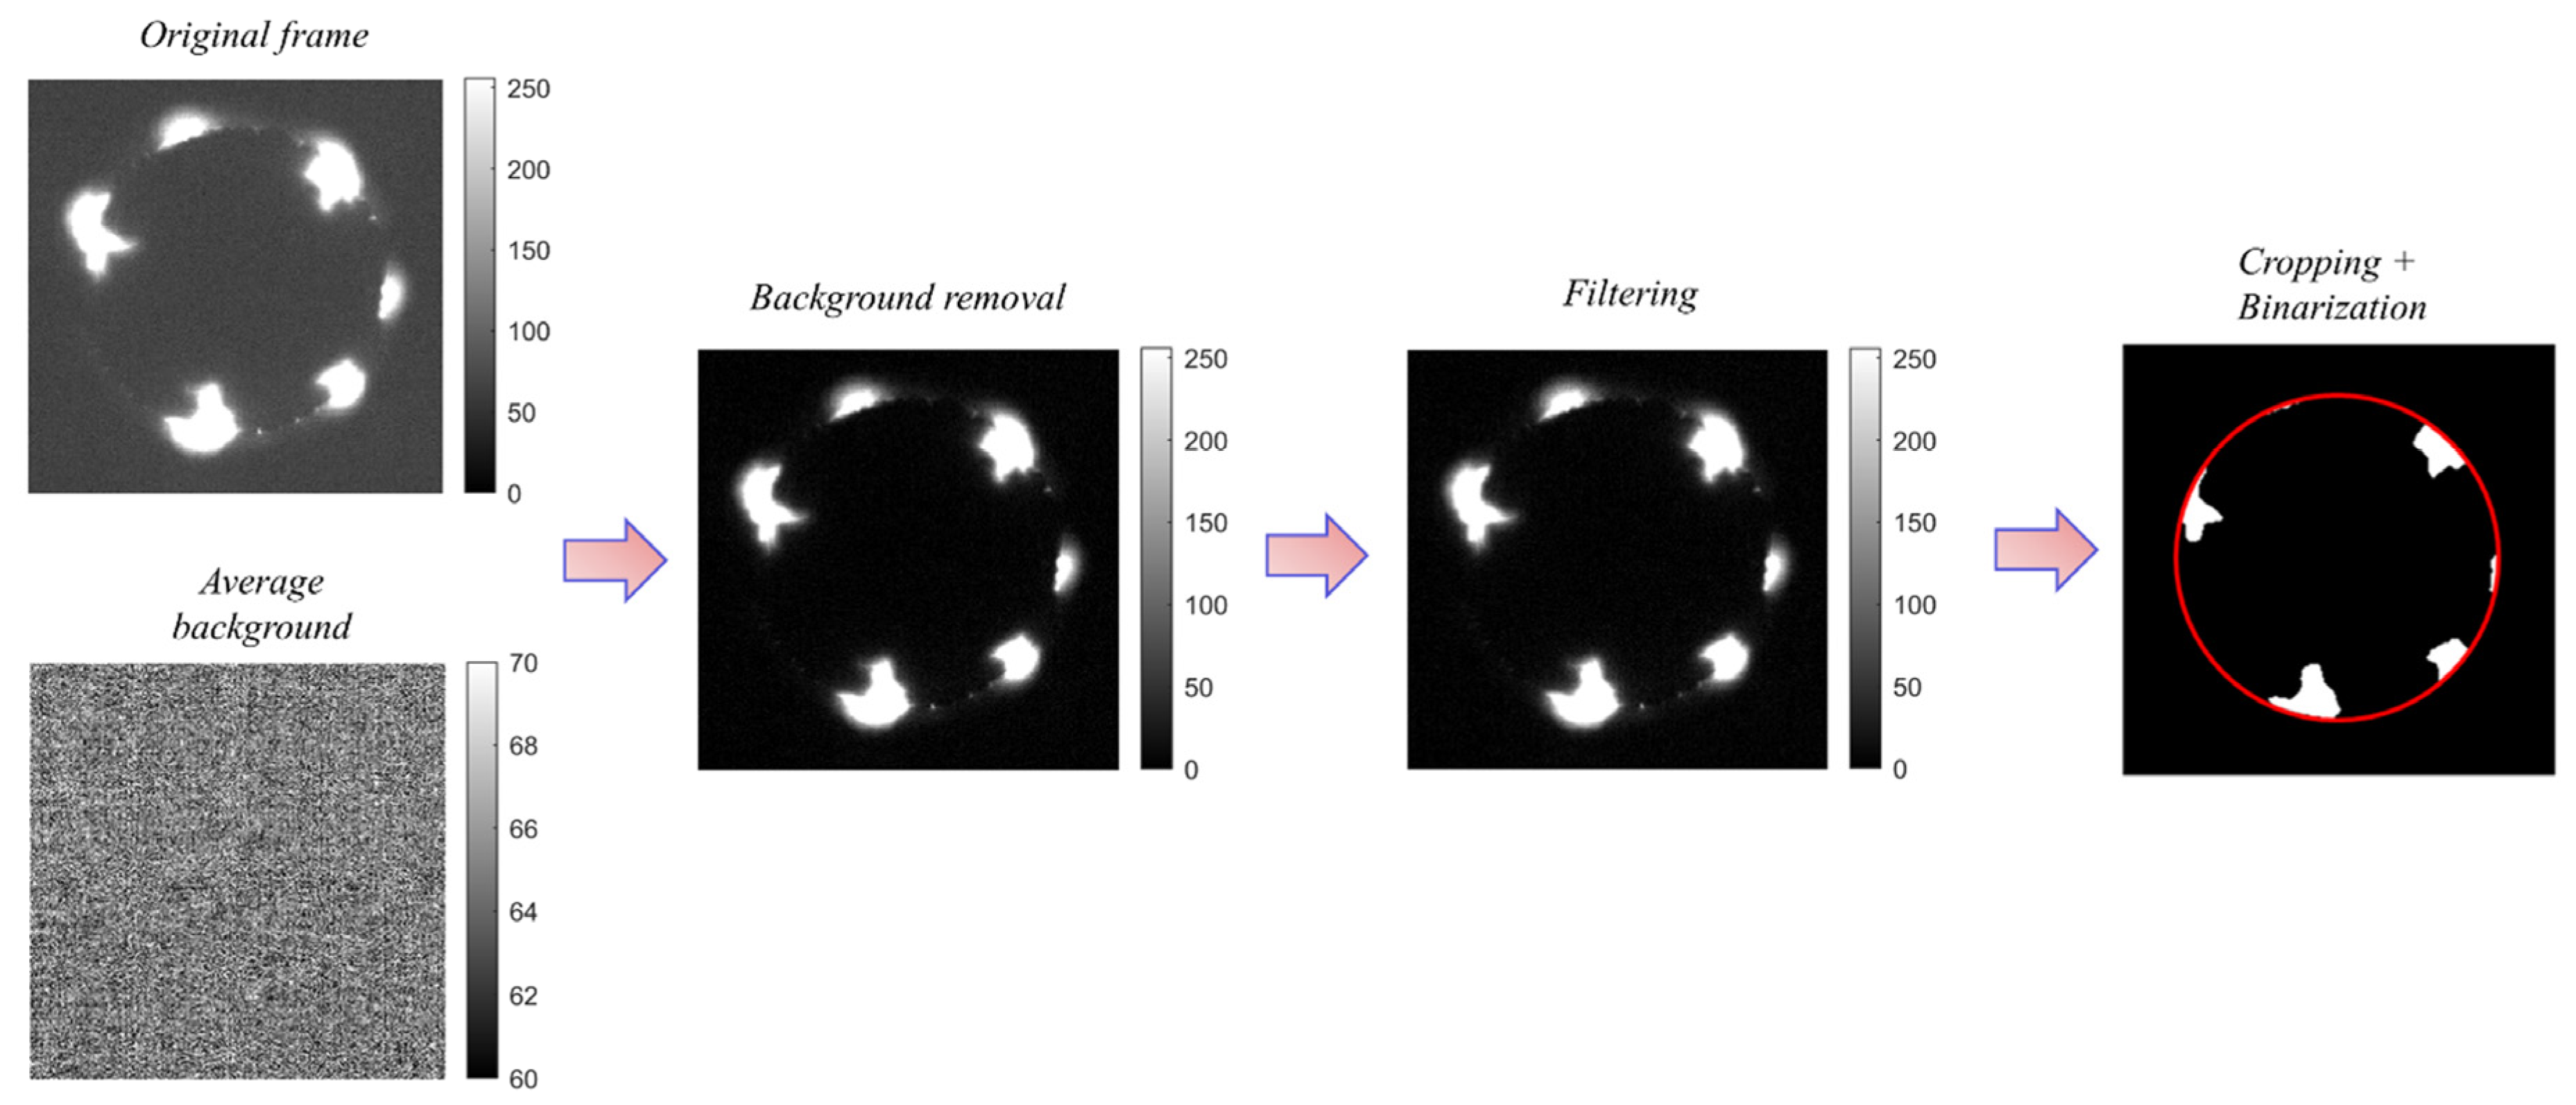
  • Background noise characterization and removing. The average grey level value of each pixel in the 20 initial frames with no discharge was computed (Figure 5a). A map of the average noise in the 256 × 256 pixel matrix can be obtained by computing the mean raw image of these 20 frames. The gray levels distribution of such image was found to be predominantly in the range 60–70 (Figure 5b). Once determined, noise was removed, for each frame of the specific series, by subtracting, pixel-by-pixel, the average background map (Figure 5c).
  • Filtering: A 2D Gaussian filter with a filter order σ = 1 was applied to reduce the residual noise. A sensitivity campaign was preliminarily realized on the filter type (median, gaussian or no filter at all) and filter order to determine the best setting. Gaussian filter with σ value equal to 1 belongs to a typical range that ensures effective Gaussian filtering [47] and, for this work, it was found to be a good compromise between noise cancellation and boundary conservation. This step allows artifacts and occasional spare pixels to be excluded, which could wrongly influence the final results.
  • Thresholding: For all the recorded series, preliminary tests were carried out to estimate the fixed threshold (specifically found to be 10 out of 255) to determine the differences between background and the luminosity emission related to the corona streamer. Such threshold was chosen, taking into consideration the image grey level distribution (Figure 5c), in order to account for the effect of light diffusion, in regions around the streamers’ body, on the computed discharge luminosity level. The value of 10 was selected as a suitable threshold to obtain a compromise in terms of luminosity over- or under-estimation.
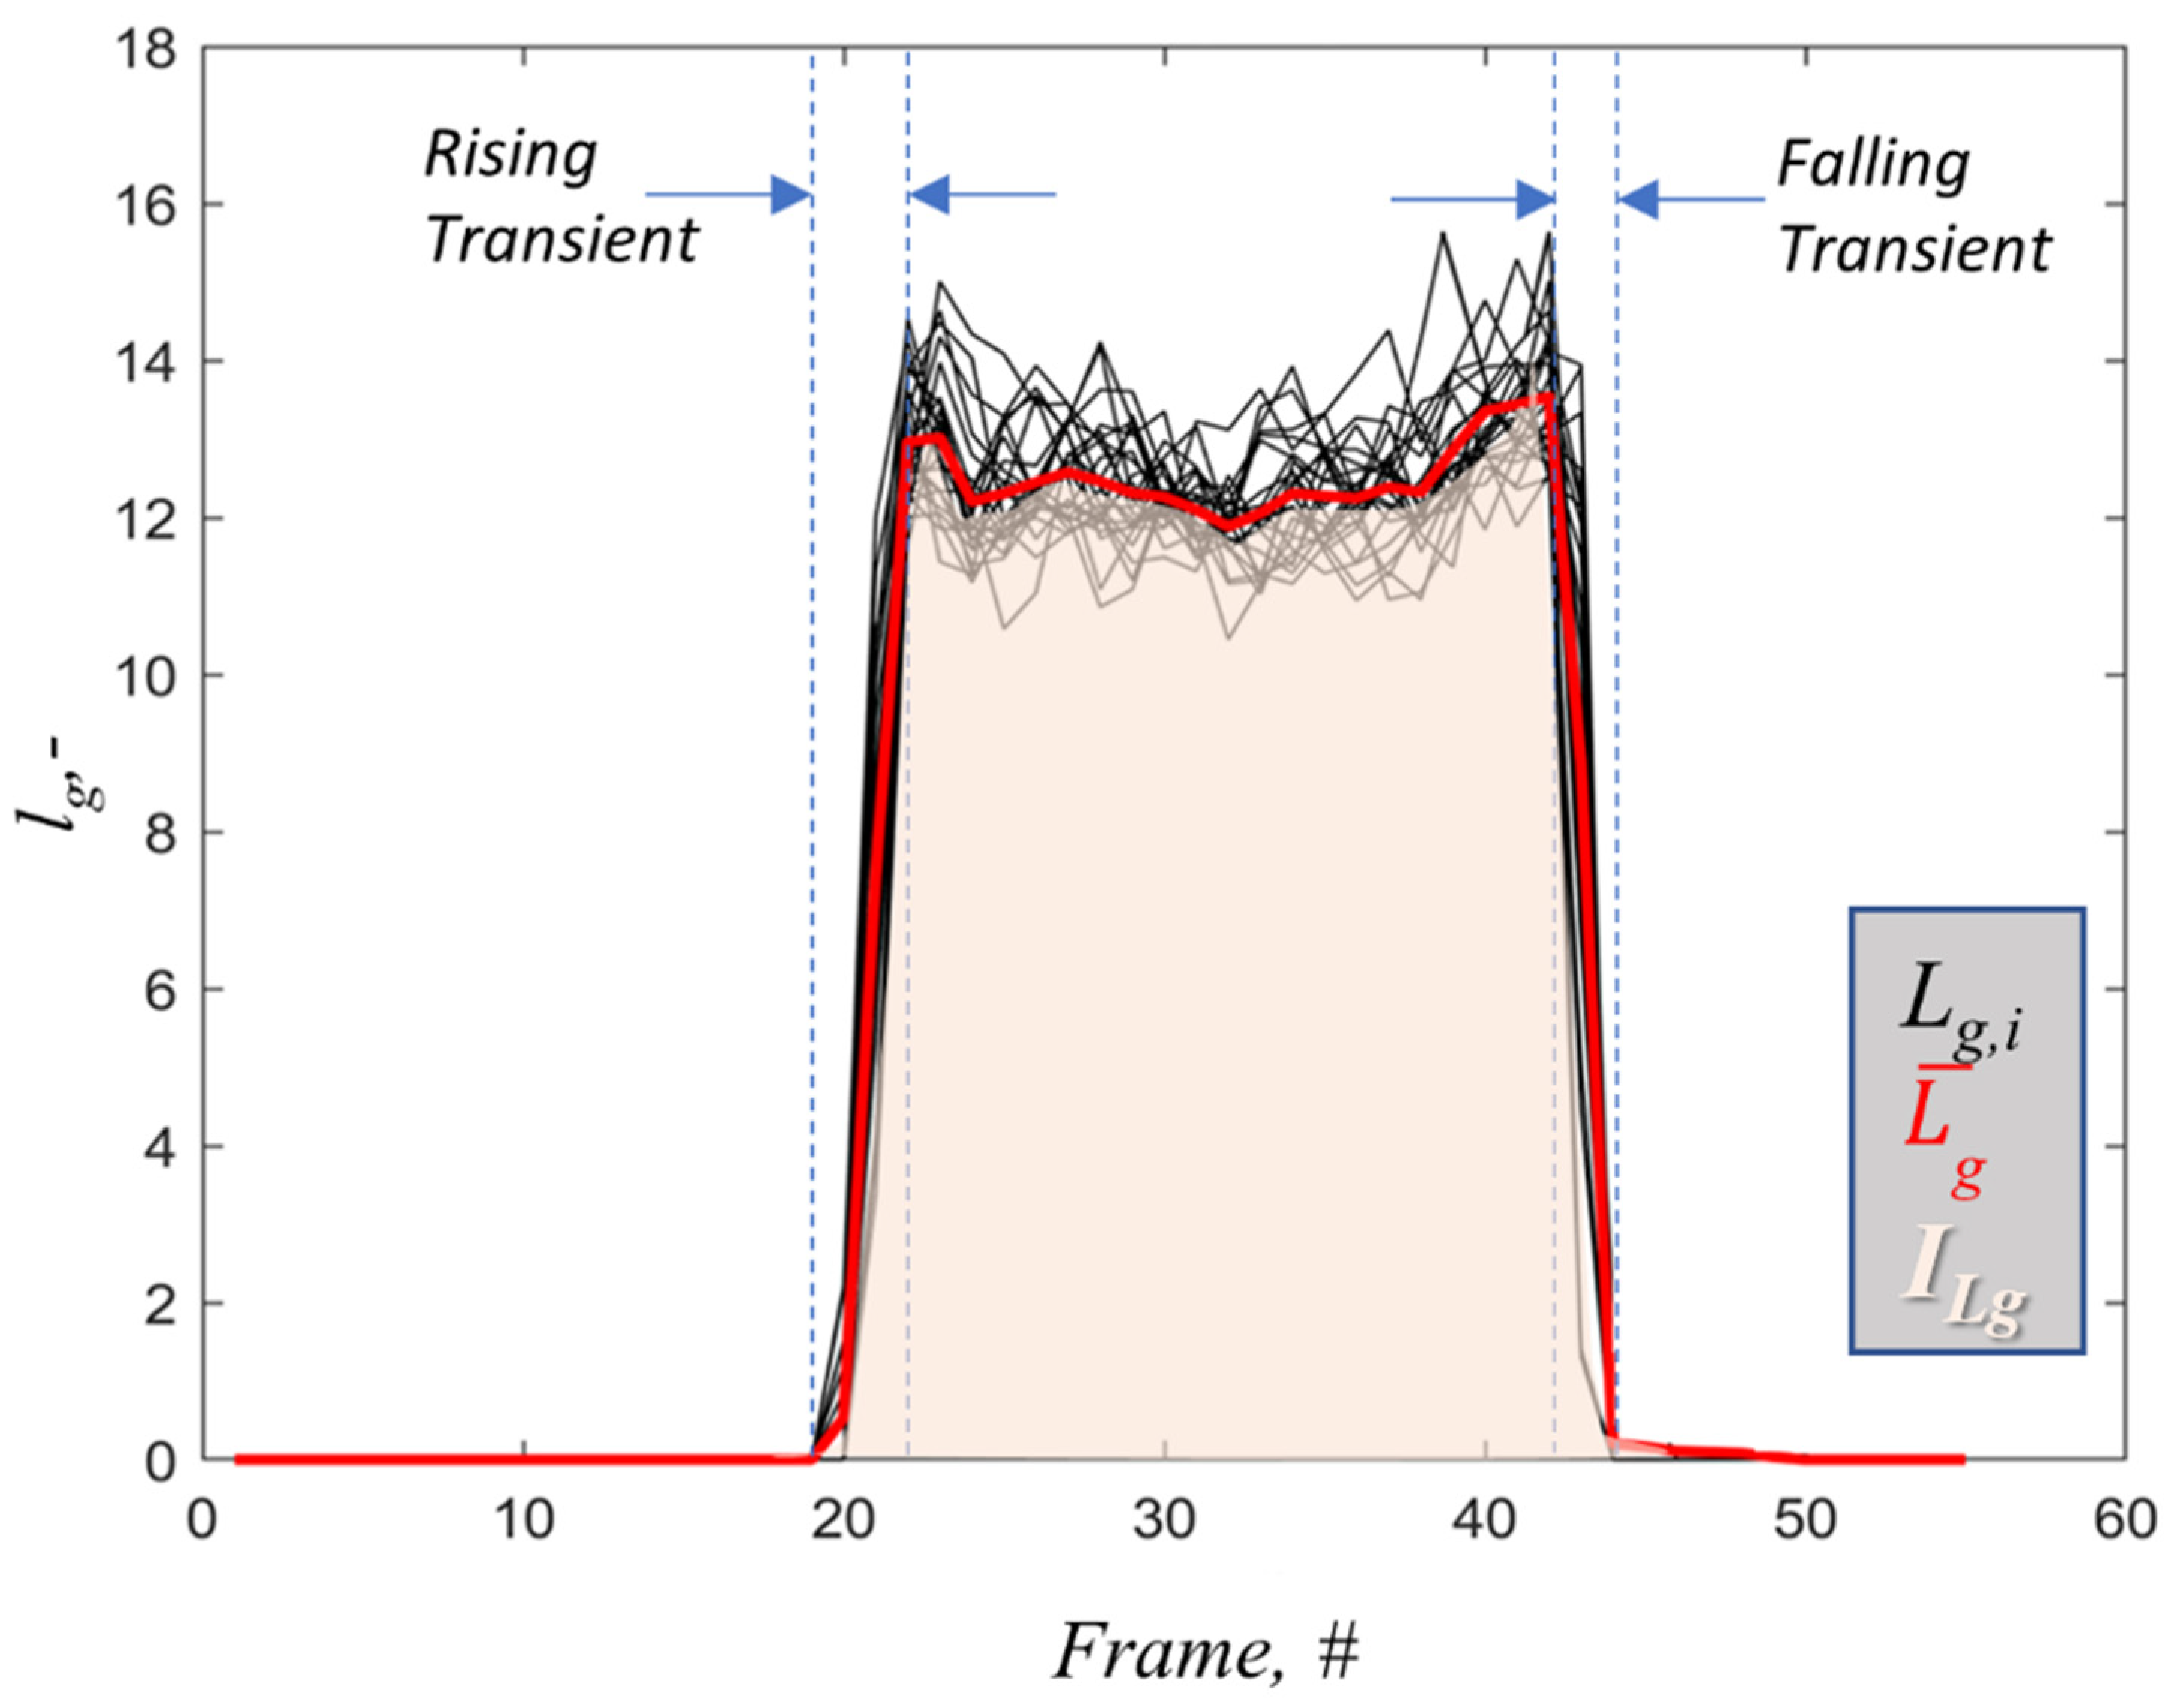
  • Average grey level lg estimation. Only for the frames in which the discharge is present, the scalar parameter “Average grey level” lg (2) is a measure of the luminous emission of the streamers in a period corresponding to the sensor exposure time, so it basically represents the average brightness of the frame.
    l g = j = 1 N l j N
    where N is the number of pixels (256 × 256) and lj the luminosity of the jth pixel.
Moreover, in order to estimate the surface of the streamers propagating on the BDI cupola, each frame was cropped around the igniter annular base. The aim was to not consider, as active streamer surface, the luminosity emission outside the cupola perimeter. A binarization processes is needed to estimate the streamer surface. The binarized area was computed by counting the white pixels for each black-and-white frame. This procedure allowed us to characterize the streamers branching around the BDI firing end with the purpose to investigate, from a different point of view, the discharge behavior when using a different medium. Figure 6 reports the procedure to obtain, at specific operating point, the average grey level lg of each frame (see up to Filtering step) and the surface streamers (Cropping + Binarization step).
The sequence of all consecutive lg values (black lines, Figure 7), characterizing a specific event, allow a trend to be obtained—Lg (3).
L g = ( l g 1 , l g 2 , , l g S )
The average trend L g ¯ (4) was then obtained by averaging, frame-by-frame, the lg values of the 25 consecutive discharges, which represents the average luminosity trend for a specific test point (red line, Figure 7).
L g ¯ = ( l ¯ g 1 , l ¯ g 2 , , l ¯ g S )
During the activation time of the igniter, the luminous emission depends not only on the steady state value but also on the transients (indicated by blue dashed lines in Figure 7), because of the discharge management carried out by the electronics. In order to account for the rising and falling luminosity transient and to characterize the average luminosity behavior of the discharge, the integral luminosity ILg is defined. Such a parameter represents the frame-by-frame sum of L g ¯ levels ( l ¯ g 1 , l ¯ g 2 , , l ¯ g S ) within frame interval where the discharge is present (red transparency area, Figure 7). As a matter of fact, ILg is directly proportional to the area under the L g ¯ curve, and it is used to compared different tested points.

3. Test Campaign

The experimental campaign was conducted in synthetic air (80% N2–20% O2 by volume) at an internal pressure chamber of 8 bar absolute and at room temperature. The 8 bar pressure value was selected because it could be representative of charge conditions, within the combustion chamber of optical access and metal engines, when the discharge event occurred [38,39].
Furthermore, such value refers to a widely investigated pressure range which can be found in several calorimeter studies [14,15,16]. The test campaign was built by varying each operating parameter (Vd, ton), one at a time. The discharge duration plays an important role in ignition strategy, since it could act as a reducer for the high cycle-to-cycle variability, characteristic of the ultra-lean blends or high EGR levels [28,39]. The driving voltage Vd is instead responsible for the corona development, which depends on the working conditions, namely, medium and internal pch [16,46]. In the first part of the test campaign, a sweep of Vd maintaining a fixed ton was performed: the BDI activation time was set to 300 μs, while the driving voltage was varied from the inception voltage to the maximum allowed by the manufacturer (60 V), with 1 V steps. Concerning the activation time, a value of 300 μs resulted to be an effective choice to guarantee mixture ignition in the internal combustion engine [20,28]. Figure 8 depicts the typical pressure signals arising from discharge events and the corresponding BDI globe images at VdCI, intermediate Vd and VdMAX.
In the second part of the test campaign, a sweep of ton from 50 μs to 1500 μs was conducted. The minimum value was chosen as representative of a very small discharge duration, as found with other kinds of ACIS igniters [33]. The maximum value selection prevents coil overheating with a fair safety margin. A time-step extension of 50 μs was adopted from minimum ton up to 300 μs to magnify what happens when a short-lasting discharge is extended, while a larger step of 300 μs was applied for the remaining tests. Three diverse driving voltages were chosen (35 V, 45 V, 55 V) to properly operate the BDI in a voltage range where an effective discharge was produced.
The test campaign performed in this work is summarized in Table 2.

4. Results and Discussions

The purpose of this experimental investigation was to examine, in a qualitative and quantitative manner, the behavior of a BDI igniter in air, as the control parameters vary. The luminosity and the energy release measurements, as well as the discharge morphology analysis, are herein proposed in order to highlight the effect of oxygen on the igniter performance. Once the igniter was characterized in air with varying operating conditions, the results were compared with those obtained using nitrogen as a reference medium in a previous work of our research group [17]. In fact, differently from the weak interaction properties of nitrogen [15], the presence of oxygen and the corresponding excited species, produced after discharge onset, could have a substantial influence not only on the global discharge behavior but also on the igniter electrode performance and durability [16].

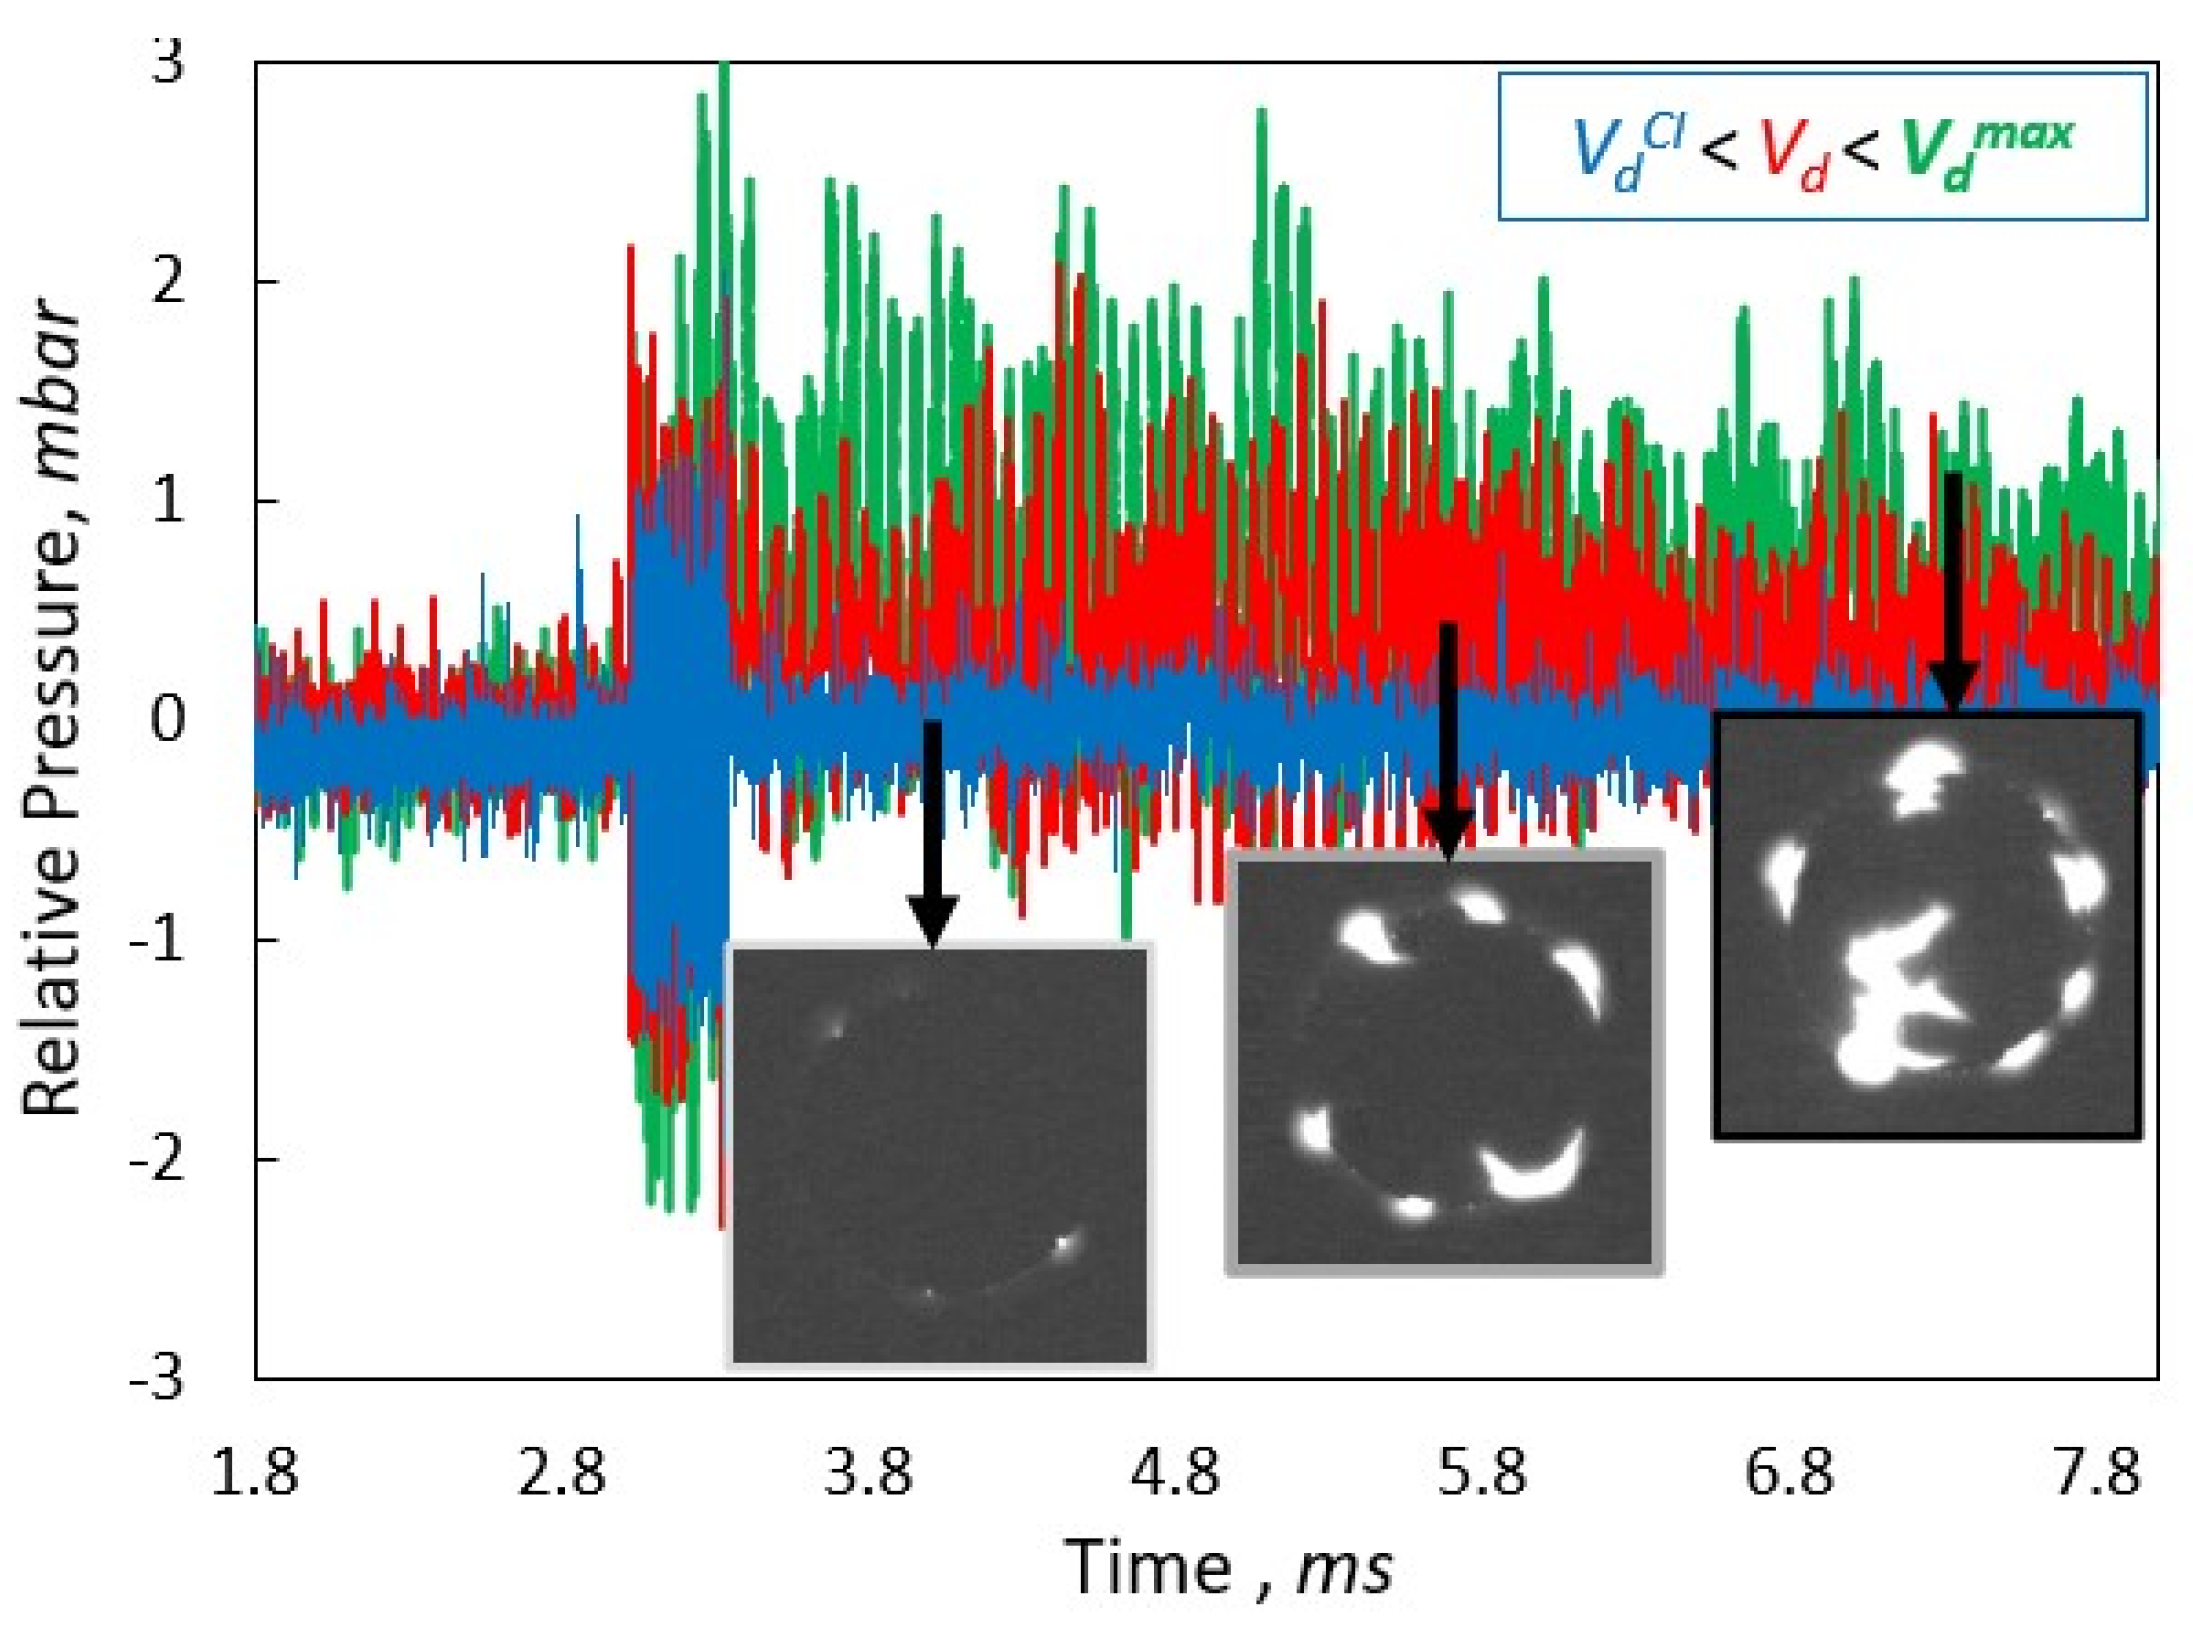
4.1. Driving Voltage Sweep
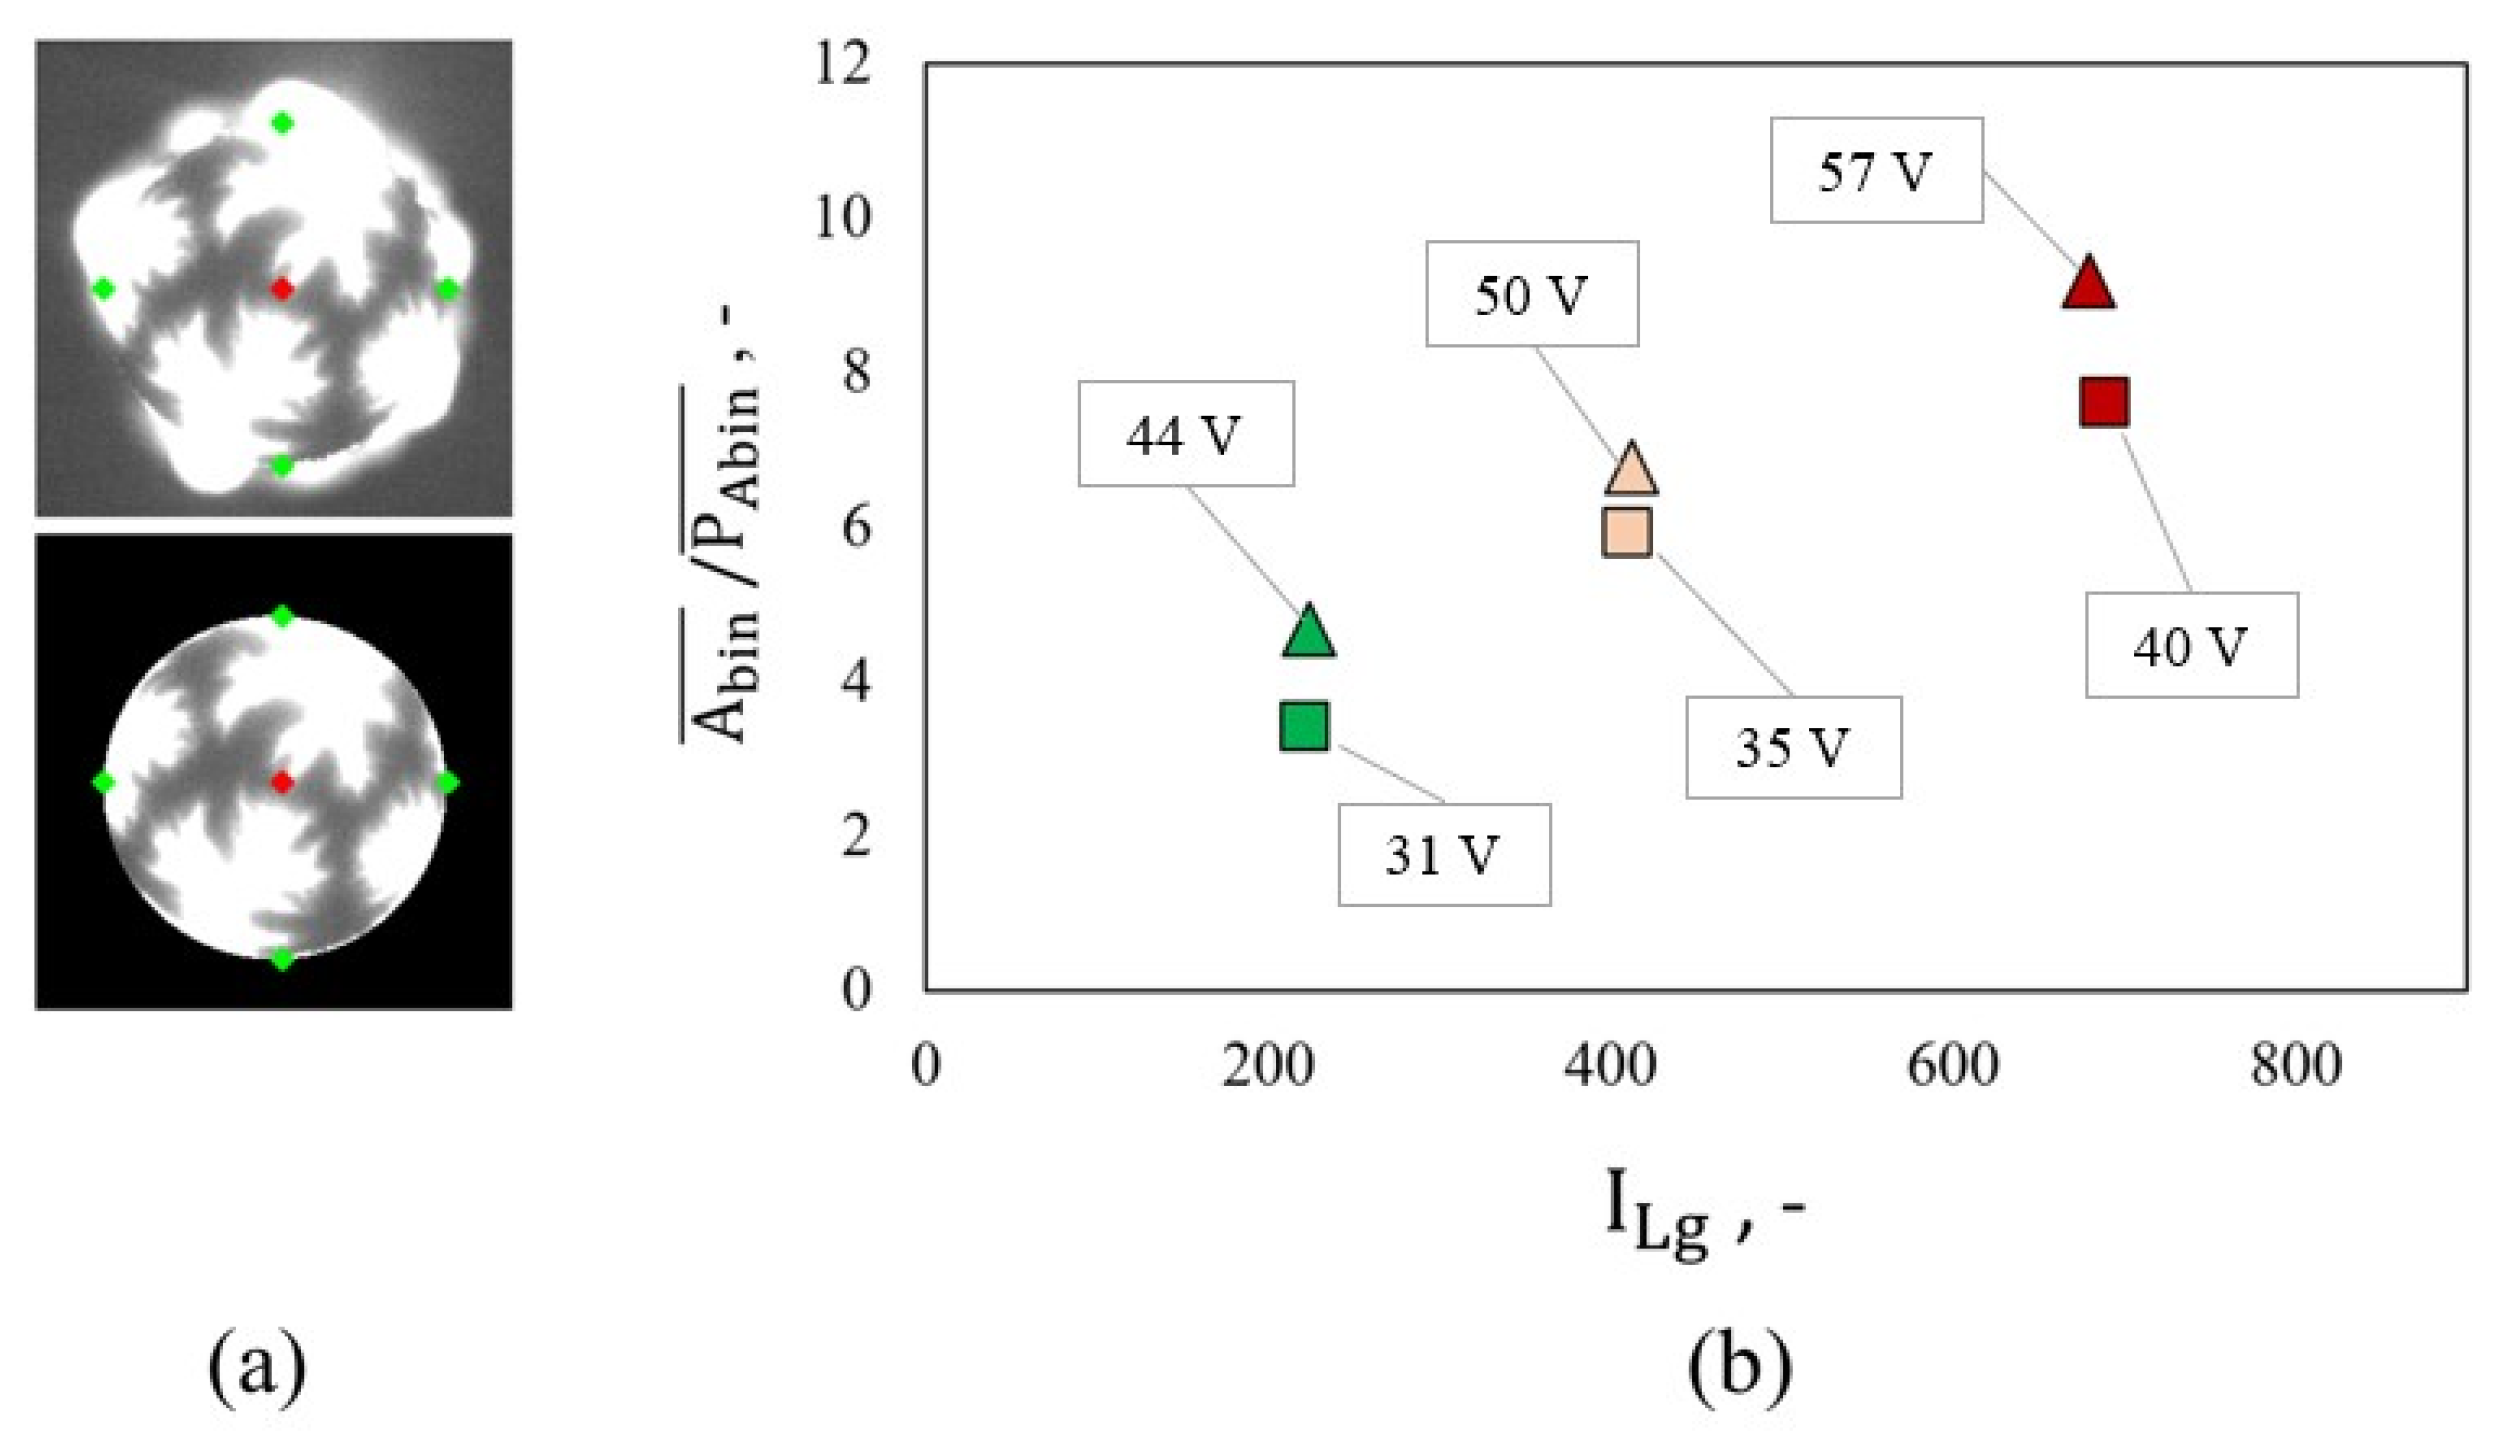
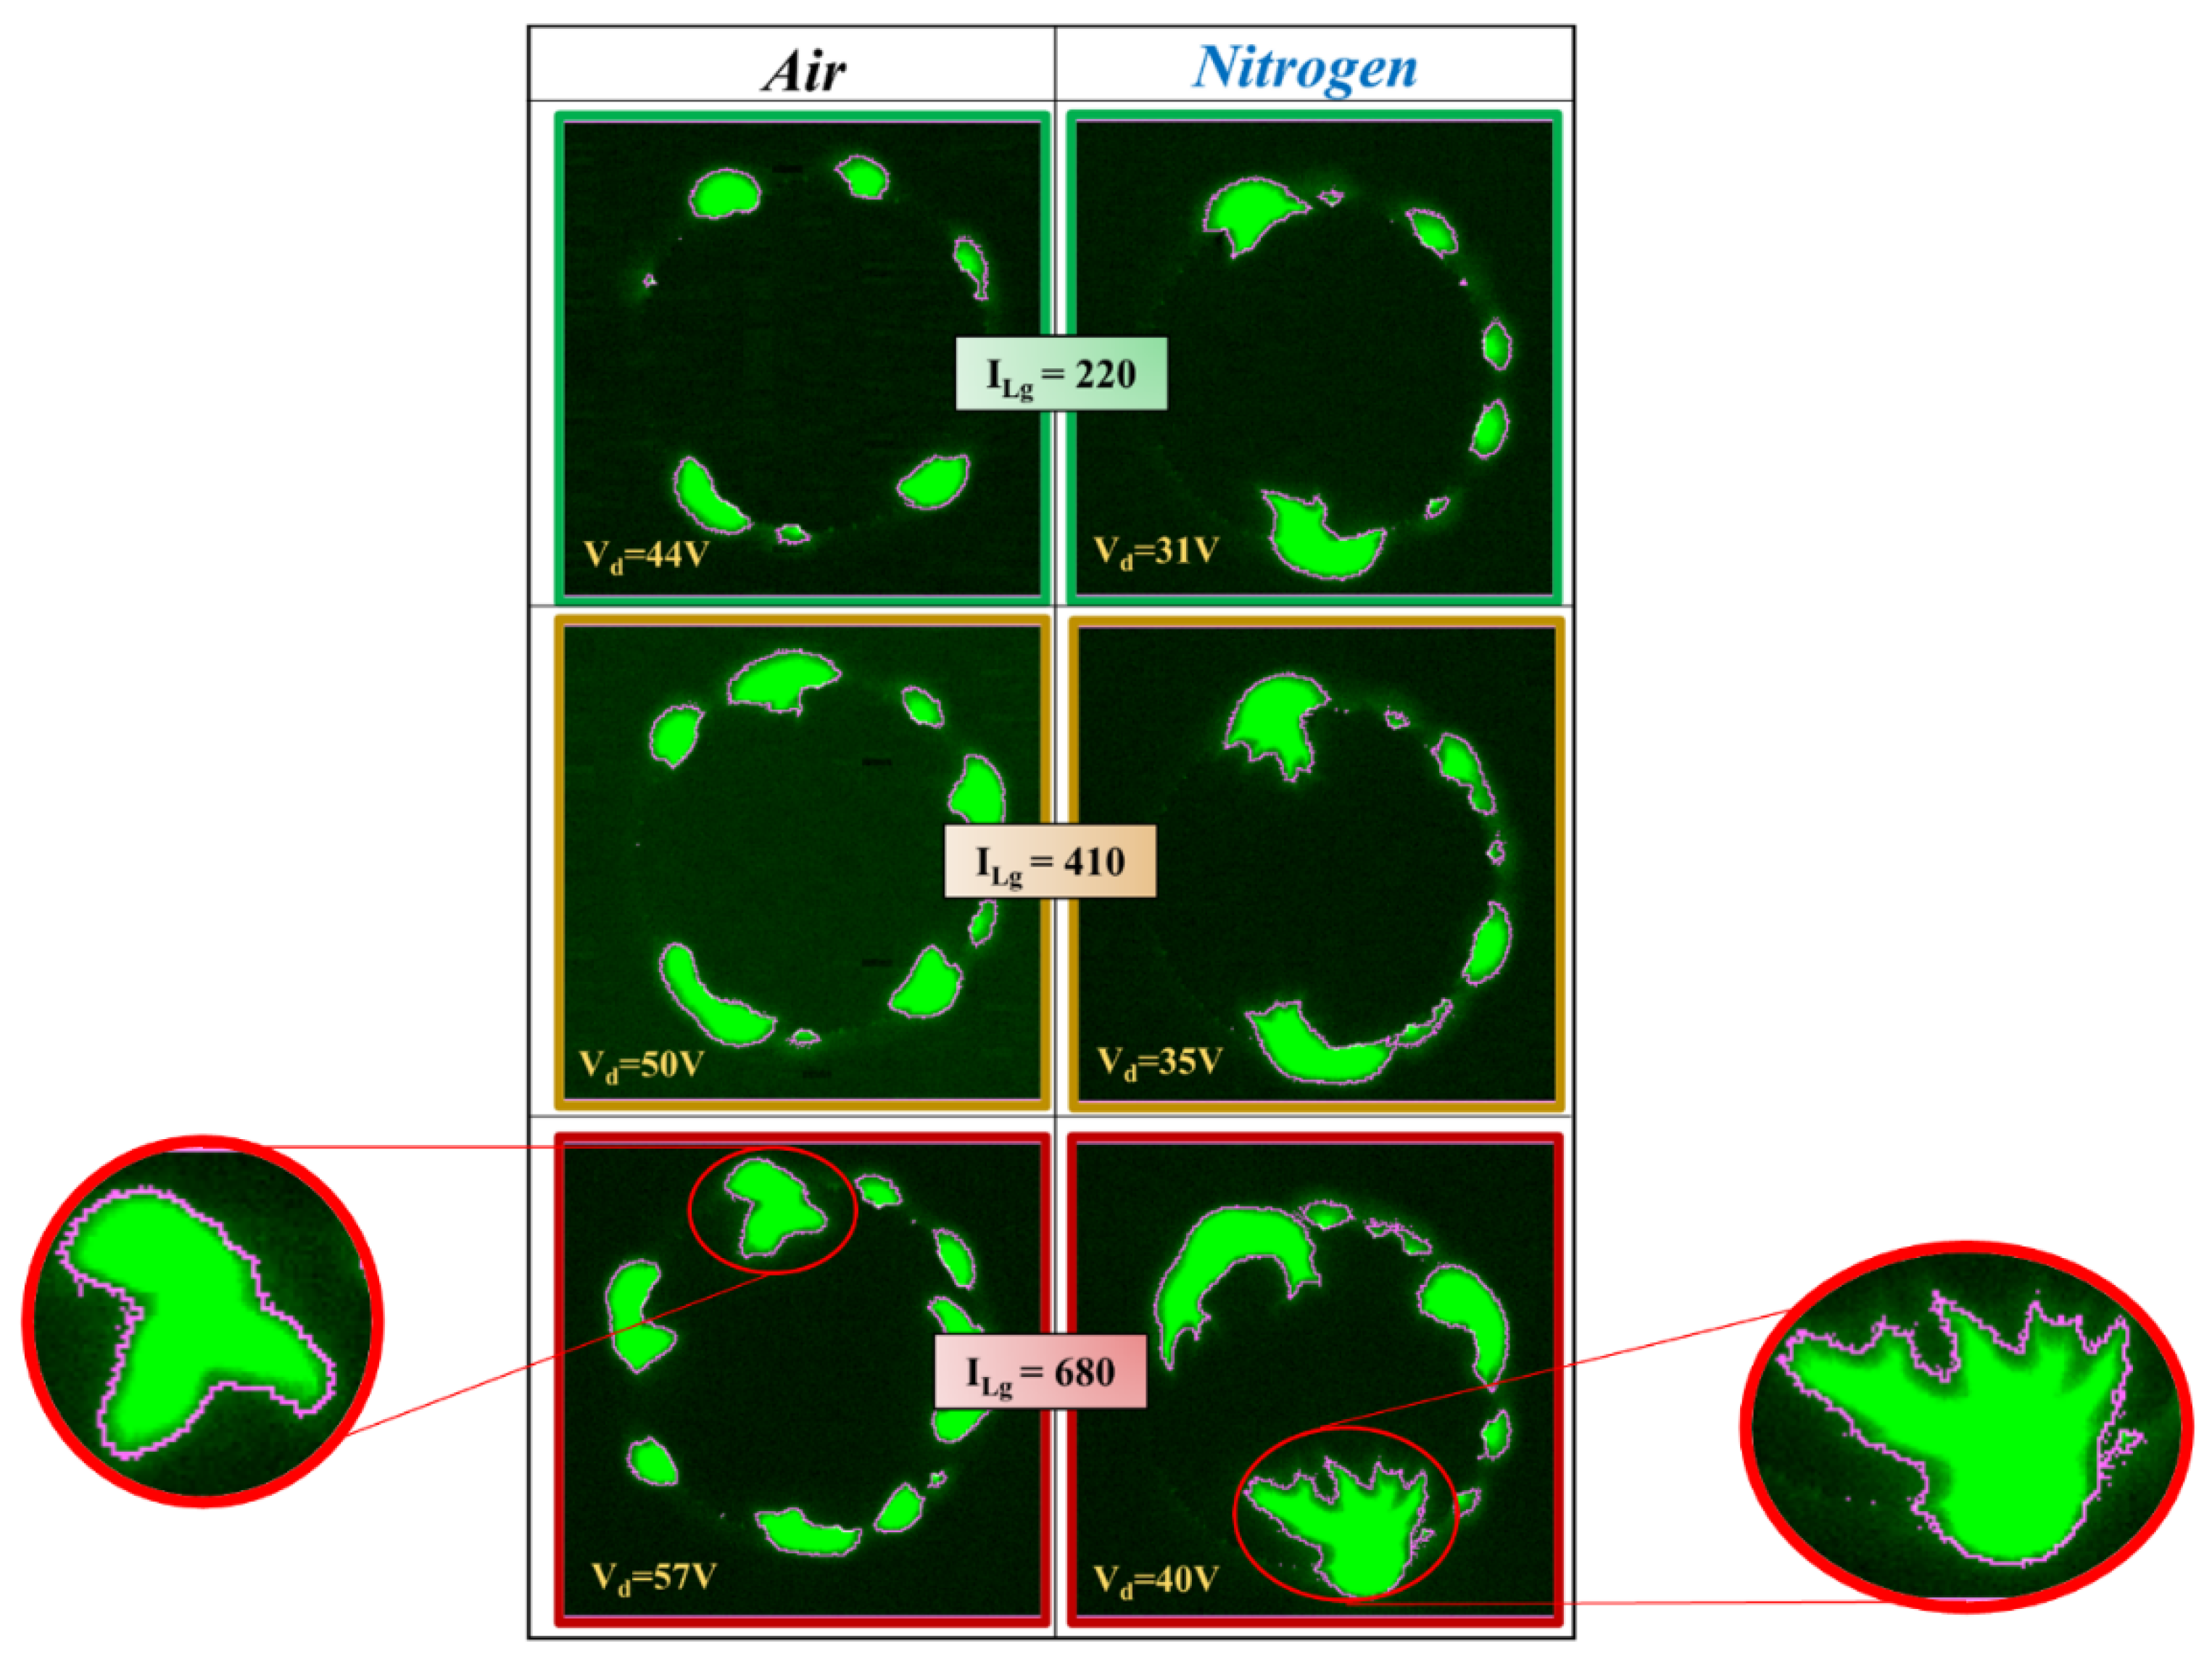
The driving voltage Vd is directly responsible for the entity of the streamer production and, consequently, for the thermal energy released into the surrounding medium as well as of the luminosity produced by the discharge: Figure 9 reports quantitative trends of energy released E r ¯ (a) and integral luminosity ILg (b) for both air (black markers) and nitrogen (blue markers); whereas Figure 10 shows images of streamers propagating over the BDI cupola in presence of air (left column) and nitrogen (right column). The corresponding applied Vd and the resulting E r ¯ and ILg are also therein reported, all of them increasing from the top to the bottom of the figure. Each row reports a pair of images with approximately the same amount of released thermal energy.
Using the BDI maximum driving voltage (established by the manufacturer, Vd = 60 V), an opening step was to identify the inception voltage VCI in air at 8 bar absolute pressure, in order to determine the igniter operating range [40]. All the events are considered capable of inducing a pressure variation inside the chamber if the uncertainty intervals of p c h m a x ¯ and p c h m i n ¯ do not overlap. Starting from this consideration, the corona inception voltage was identified as 32 V. It is worth mentioning that the high-speed camera records a non-zero luminous response even at lower voltages—up to 30 V (ILg = 10). This occurrence was similarly reported with nitrogen (VdCI = 27 V), suggesting again that either the camera is more sensitive than the piezoelectric pressure sensor or different energy transfer patterns are present near inception conditions. In addition to that, such evidence confirms that a non-zero thermal energy release occurs up to 24 V (ILg = 12) for nitrogen. However, air required a higher VdCI (Figure 10a) for streamers generations with respect to the one found in N2 (Figure 10b). This behavior could be a result of the quenching effect of molecular oxygen on other excited species and of the ability of oxygen to easily capture the first emitted electrons, thus hindering corona inception at a low driving voltage [48].
Regardless of the medium, in the whole analyzed range, the released energy and the luminosity raise as Vd increases. Moving toward increasing Vd values, a linear relationship (Figure 9) among the analyzed quantities, ILg (a), E r ¯ (b), and Vd can be recognized (see the linear data fits), with the exclusion of the low voltage points (filled markers). For the latter Vd values, i.e. close to zero E r ¯ , the luminosity diverges from the linear trend because of the strong reduction in streamers number (average behavior). Close to VdCI, the energy released and the luminosity produced by the small streamers proportionally decrease as Vd decreases, but, under a certain threshold, the single streamers vanish. Such a threshold, variable for each streamer, depends on the electrode surface local roughness that modulates the reduced electric field intensity, responsible, in turn, for the streamer generation and propagation [49,50]. For that reason, the linear regressions (red dotted lines) in Figure 9 exclude those operating points presenting E r ¯ below 1 mJ, because of the inherent stochasticity of the phenomena.
Considering this, Vd, energy data show that in nitrogen (Figure 10e) the thermal energy released to the medium is higher than the case of synthetic air (Figure 10f). Moving toward higher Vd, the differences in released thermal energy Δ E r ¯ between the two gases become more pronounced. For instance, at Vd = 34 V (first common not-filled point in Figure 9) a difference Δ E r ¯ of 4.3 mJ (nearly 40% with respect to air) is present, whereas at Vd = 60 V (extreme operating point tested) an increment of Δ E r ¯ at about 50% was found, thus leading to a difference Δ E r ¯   = 6.5 mJ. The lower energy recorded in air could be justified by the fact that the presence of oxygen generates different energy transfer pathways to the medium matter, thus hampering the thermal energy deposition. As a matter of fact, the pulse input energy breakdown changes when oxygen is dispersed into the medium, i.e., energy is less dissipated as heat (thermalization process) but employed in production of plasma chemical species and stored within atoms of O and ozone [51].
Similarly, at the same Vd, the luminous emission in nitrogen (Figure 10f) is stronger than in air (Figure 10c), and the higher the Vd the larger the ILg difference between the measurements (Figure 9a). The angular coefficient m of the linear regressions certifies this aspect by showing values equal to 54.97 V 1 in N2 and about half less in air (mair = 28.06 V 1 ). The difference in ILg among the two gases is even more pronounced than the ones found for E r ¯ , for which mN2 = 0.58 m J   V 1 and mair = 0.49 mJ   V 1 . This evidence is coherent with the results found by Ono et al. [52], in which images of streamers, propagating in mixtures with rising O2 concentration, required a progressive increase in the luminous intensity amplification factor. Streamer’s brightness levels could be related to the quenching effect of the excited species previously produced, which fall to a lower excitation or ground level emitting photons [53]. As a consequence, this aspect could determine the presence or the absence of atomic or molecular lines in the emitted spectrum in the visible region of our camera [54,55]. This reasoning could possibly justify not only the different luminosity level at the same driving voltage, but also synthetic air/N2 cases characterized by same energy levels but different values of luminosity (for instance, see Figure 10c,d). From the results of Figure 9, a direct correlation between E r ¯ and ILg can be inferred. Indeed, a linear relationship among thermal energy and discharge luminosity can be estimated for synthetic air (Figure 11a). As expected from Figure 9, the linearity is lost for low values of ILg (a) and of E r ¯ , due to the different instruments’ sensitivity and energy transfer modes. By excluding those points, the released thermal energy could be expressed as follows (Equation (5)):
E r ¯ = m D × I L g + q D
where m D equals to 0.011 mJ for N2 and to 0.018 mJ for air (Figure 11b). Therefore, by determining the proper calibration factors, discharge luminosity measurement could be a viable means to compute the released thermal energy into the mixture. It is worth noticing that the lack of linearity in the low energy–luminosity region (points excluded from the fits) leads to an overall positive value of the intercept q. In fact, this evidence is counter-intuitive, since the intercepts should be negative because of the above-cited greater diagnostic sensitivity given by the luminosity emission with respect to the energy measurement.

4.2. Branching

In Figure 10e,f, streamers are fully propagated over the BDI hemisphere, thus giving the chance to discuss air and nitrogen test outcomes from a different perspective. More specifically, these images suggest a peculiar dissimilarity in terms of streamers structure. In fact, the discharge events in air seem to be characterized by a less-prominent branching than those in nitrogen, i.e., the streamers’ contour is smoother. To quantitatively test the branching, the ratio between the streamers area and the corresponding perimeter is evaluated at a different voltage level, which will be referred to as aspect ratio. The latter is defined considering the ratio between the number of white pixels contained in the discharge area and those pixels belonging to the streamers’ perimeter, i.e., this parameter is nondimensional. Figure 12a reports the cropping and binarization procedure adopted for the calculation, whose details were introduced in the Materials and Methods section. It is important to note that the circular image crop is necessary to correctly estimate the active discharge area which can otherwise be overestimated, due to light diffusion, at the base of the igniter cupola. Figure 12b depicts the ratio between the discharge binarized area and its corresponding perimeter as a function of the integral luminosity ILg for three discharge events with equivalent luminosity (different colors). Each marker is representative of the average behavior of the discharge, i.e., for the corresponding tested point, the mean binarized area and perimeter are computed as the mean of the single frame, then along the single discharge event and then between the 25 recorded events, ending with the scalar numbers reported in Figure 12b.
As seen in Figure 12b, increasing values of ILg result in greater aspect ratios for either air (triangular markers) and nitrogen (square markers). Moreover, at different values of integral luminosity, there exists a relative difference among the two media, in terms of binarized-area-to-perimeter ratio, thus evidencing again the oxygen effect on the streamers number and propagation length [56,57]. Specifically, for each of the three cases, the higher aspect ratio found in air highlights the presence of a larger perimeter of the streamers in nitrogen. In other words, streamers tend to branch more in pure N2 than in the case with 20% O2. This analysis supports the previously inferred discharge feature which can be qualitatively visualized in Figure 13, for the three mentioned luminosity levels (associated with the markers).
Generally, streamers branching is an unpredictable phenomenon that leads to a deeply stochastic discharge morphology. The streamers’ structure, both in time and in space, is connected to the fluctuations in the electron density in the barely ionized region in front of the streamer head [56,57]. The above-mentioned behavior could be connected to the fact that streamers propagation is affected by the photo-ionization process, which, in turn, is strongly influenced by the presence of oxygen species [58]. Upon being a low-electron attacher (N2 is non-attaching), molecular oxygen substantially modifies the photoionization range of the medium, resulting in noticeable changes in the propagation features of streamers [59]. Reducing the oxygen concentration causes the nonlocal photoionization decrease, and therefore local instabilities and more branching. According to Li et al. [60], the streamers produced by high-purity N2 showed the branching much earlier in time and a longer distance in space, at the same operating pressure than in air. The oxygen concentration smooths the electron number density and causes the development of an inception cloud—a quasi-spherical ionization structure close to the electrode tip [61]—that avoids the streamers branching as long as they break up [60]. Research in the literature on streamers morphology revealed coincidental observations, pointing out the effects on streamer structure of the addition of oxygen to pure nitrogen [62,63,64].

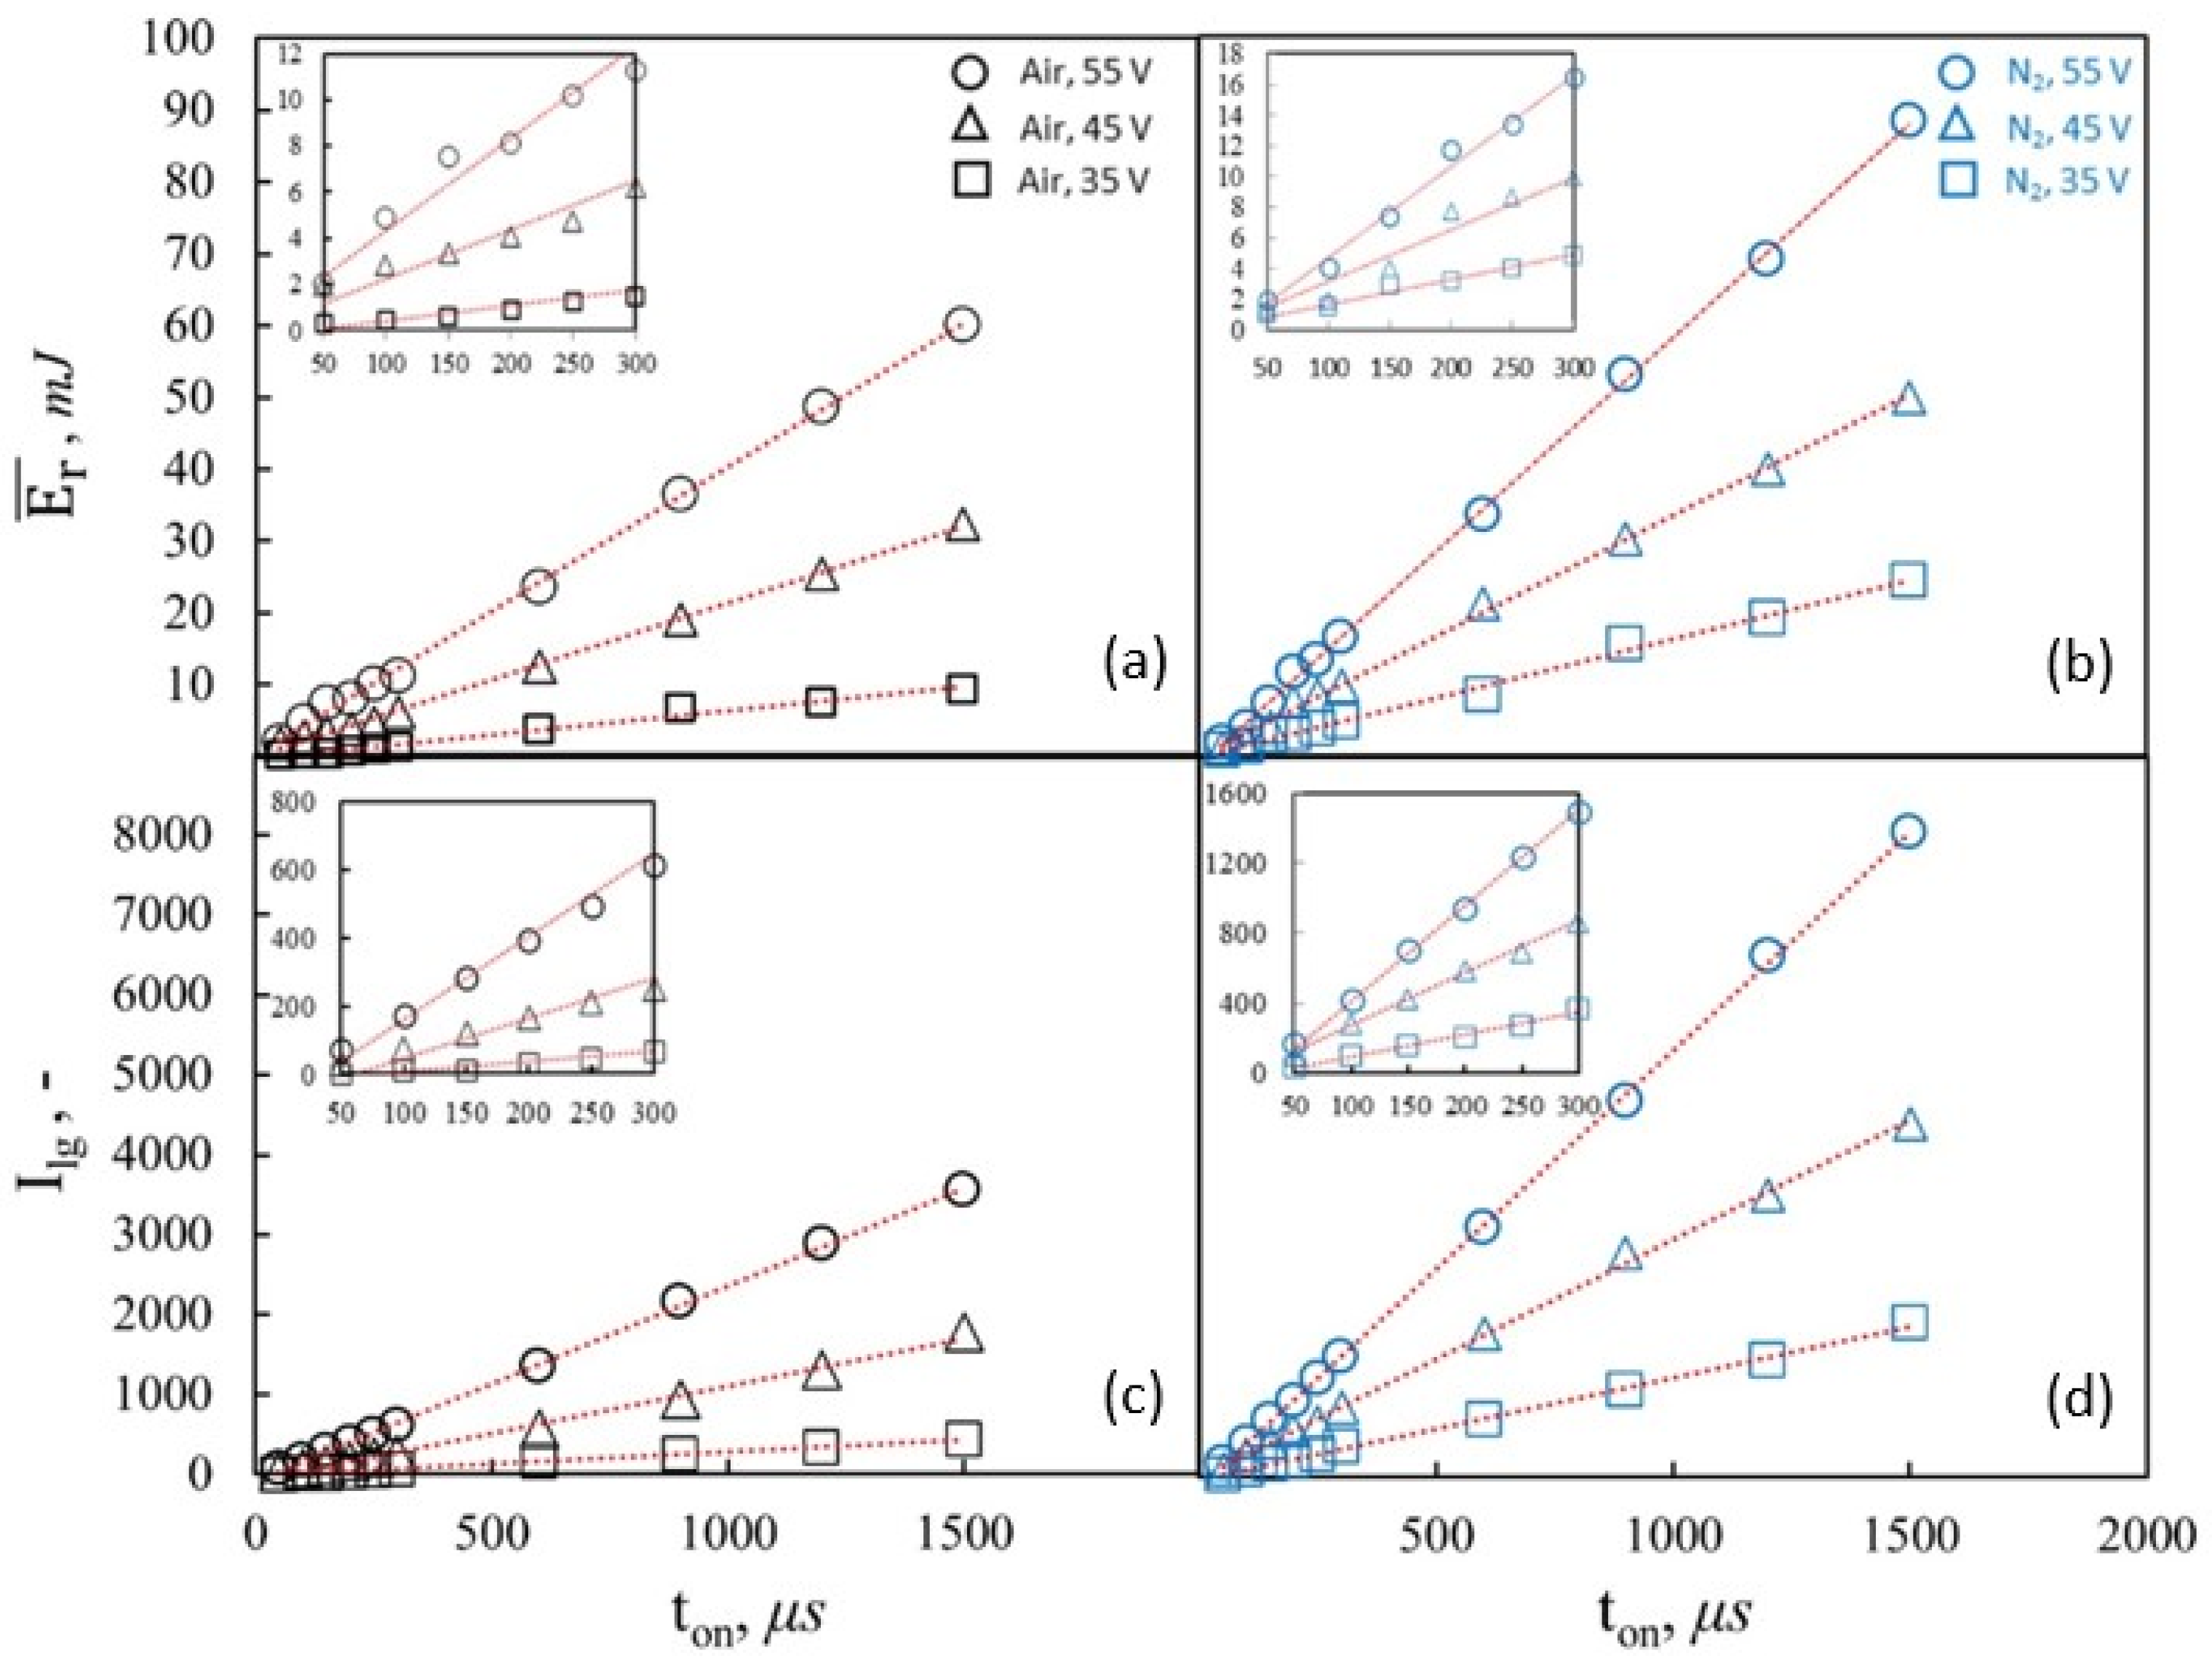
4.3. Activation Time Sweep

Activation time is the key control parameter affecting the total amount of thermal energy released by the discharge within the medium. In other words, discharge duration is directly correlated to the capability of the igniter to trigger combustion [33]. In an opposite manner to conventional igniters, which are limited by the quantity of energy stored in the coil, the BDI can be continuously powered by the supply system; therefore, the released energy increases over time. Similarly, the cumulative value of luminosity, ILg, is expected to rise as the discharge proceeds, being proportional to the discharge duration.
In Figure 14a,c, thermal energy and luminosity measurements performed in air are plotted against the activation time for three different Vd. The same data representation is mirrored for the results found with nitrogen (Figure 14b,d). Regardless of the medium investigated, it can be readily observed that a linear trend for either E r ¯ or ILg against ton is present, at all the driving voltages analyzed. The energy release trend highlights the capability of the power supply system to seamlessly support the igniter energy request throughout the operating range analyzed, whereas the second result confirms that ILg is proportional to the discharge duration. As seen in [17], below 300 µs the sampling step was intensified to 50 µs in order to analyze the above-discussed trends for low activation time. The purpose is to discern if the overall released energy and luminosity are affected by the rising transient time from streamers inception to full stable propagation. Hence, Figure 14 contains subplots displaying the E r ¯ or ILg values up to the first 300 µs. Focusing on the latter permits us to confirm that a linear relationship also exists for short-lasting discharges. Except for a few cases (i.e., see in Figure 14c the point at ton = 150 µs and Vd = 55 V), the experimental points of both E r ¯ and ILg lie on the corresponding linear regression fits, which shows a coefficient of determination of the regression line R2 higher than 0.998, in any case. For both gases, at same ton, it is confirmed that a higher Vd leads to an increased amount of released energy. At same Vd and ton, air features a lower level of E r ¯ in relation to the nitrogen case, as discussed in the previous section. It is worth highlighting that, as the igniter activation time increases, the broadening between iso–voltage curves becomes gradually substantial among nitrogen and air, which is a direct consequence of the linearity found against Vd and ton.
The above-discussed trends also suggest that the energy release mechanism and the photon emission process do not change their qualitative characteristic against time either in the presence of oxygen or not (constant rate of thermal energy and luminous intensity). This supports again, even in the case of synthetic air, the quest for a direct relationship between deposited energy and emitted luminosity. Figure 15 reports plots of released thermal energy against the integral luminosity value for the previous three analyzed voltage. Graphs on the left-hand side depict the whole data range of Er and ILg, whereas those on the right-hand side offer a corresponding close-up view to better appreciate the relation among the two discussed quantities, especially for synthetic air. As it can be seen, all the tested points could be approximated on two linear fitting lines (one for each tested gas), attesting to the existence of an energy–luminosity correlation.
For sake of completeness, the following considerations, concerning the results of Figure 15, are reported below:
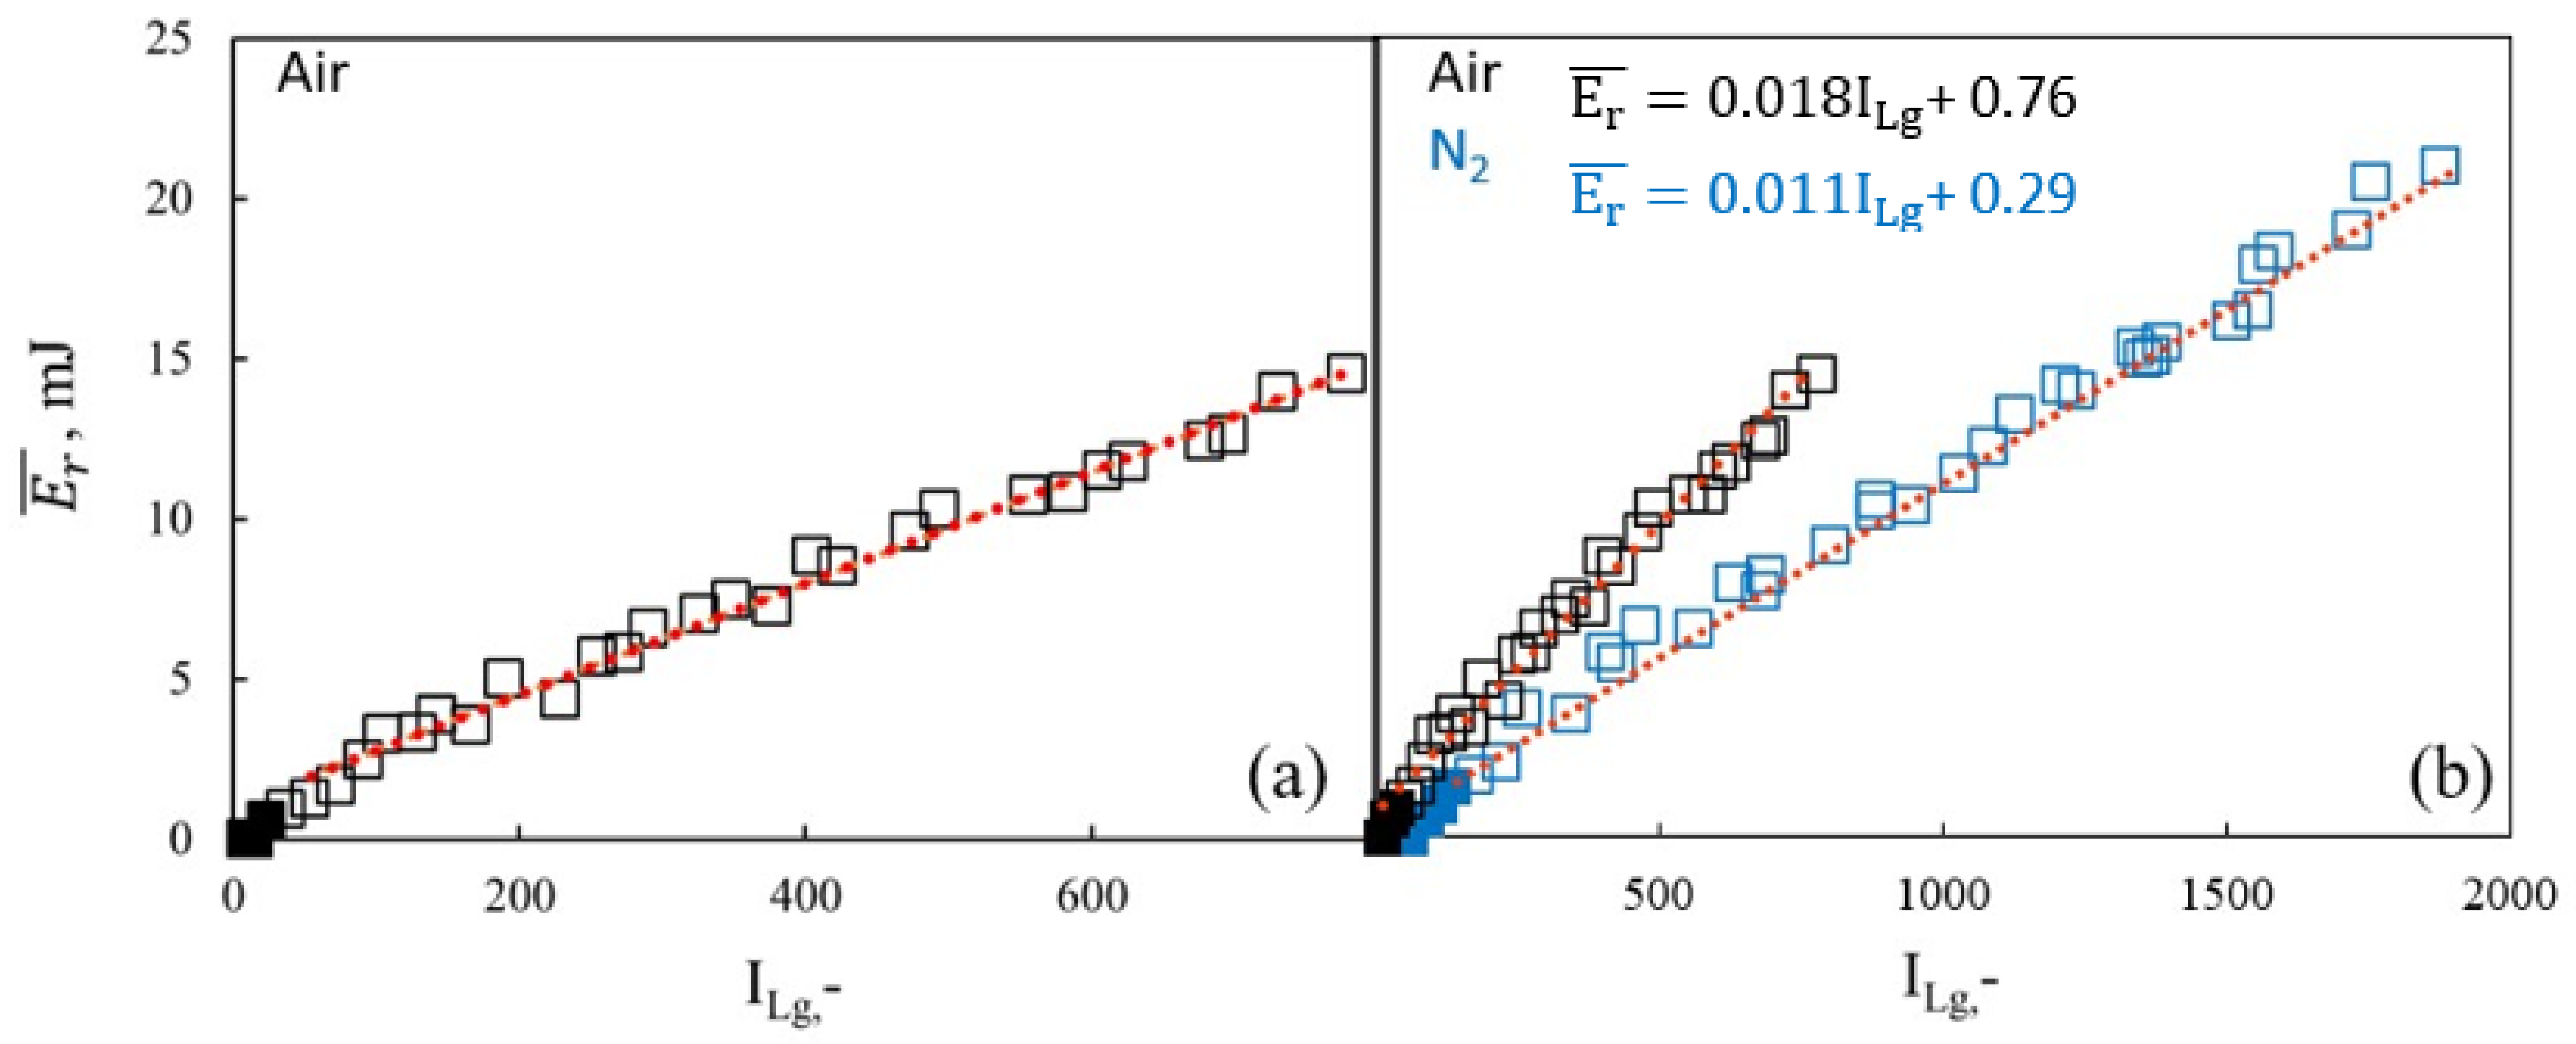
For both gases, a reduction in the angular coefficient m is found as Vd increases. This decrease results to be higher for the air case (see Table 3).
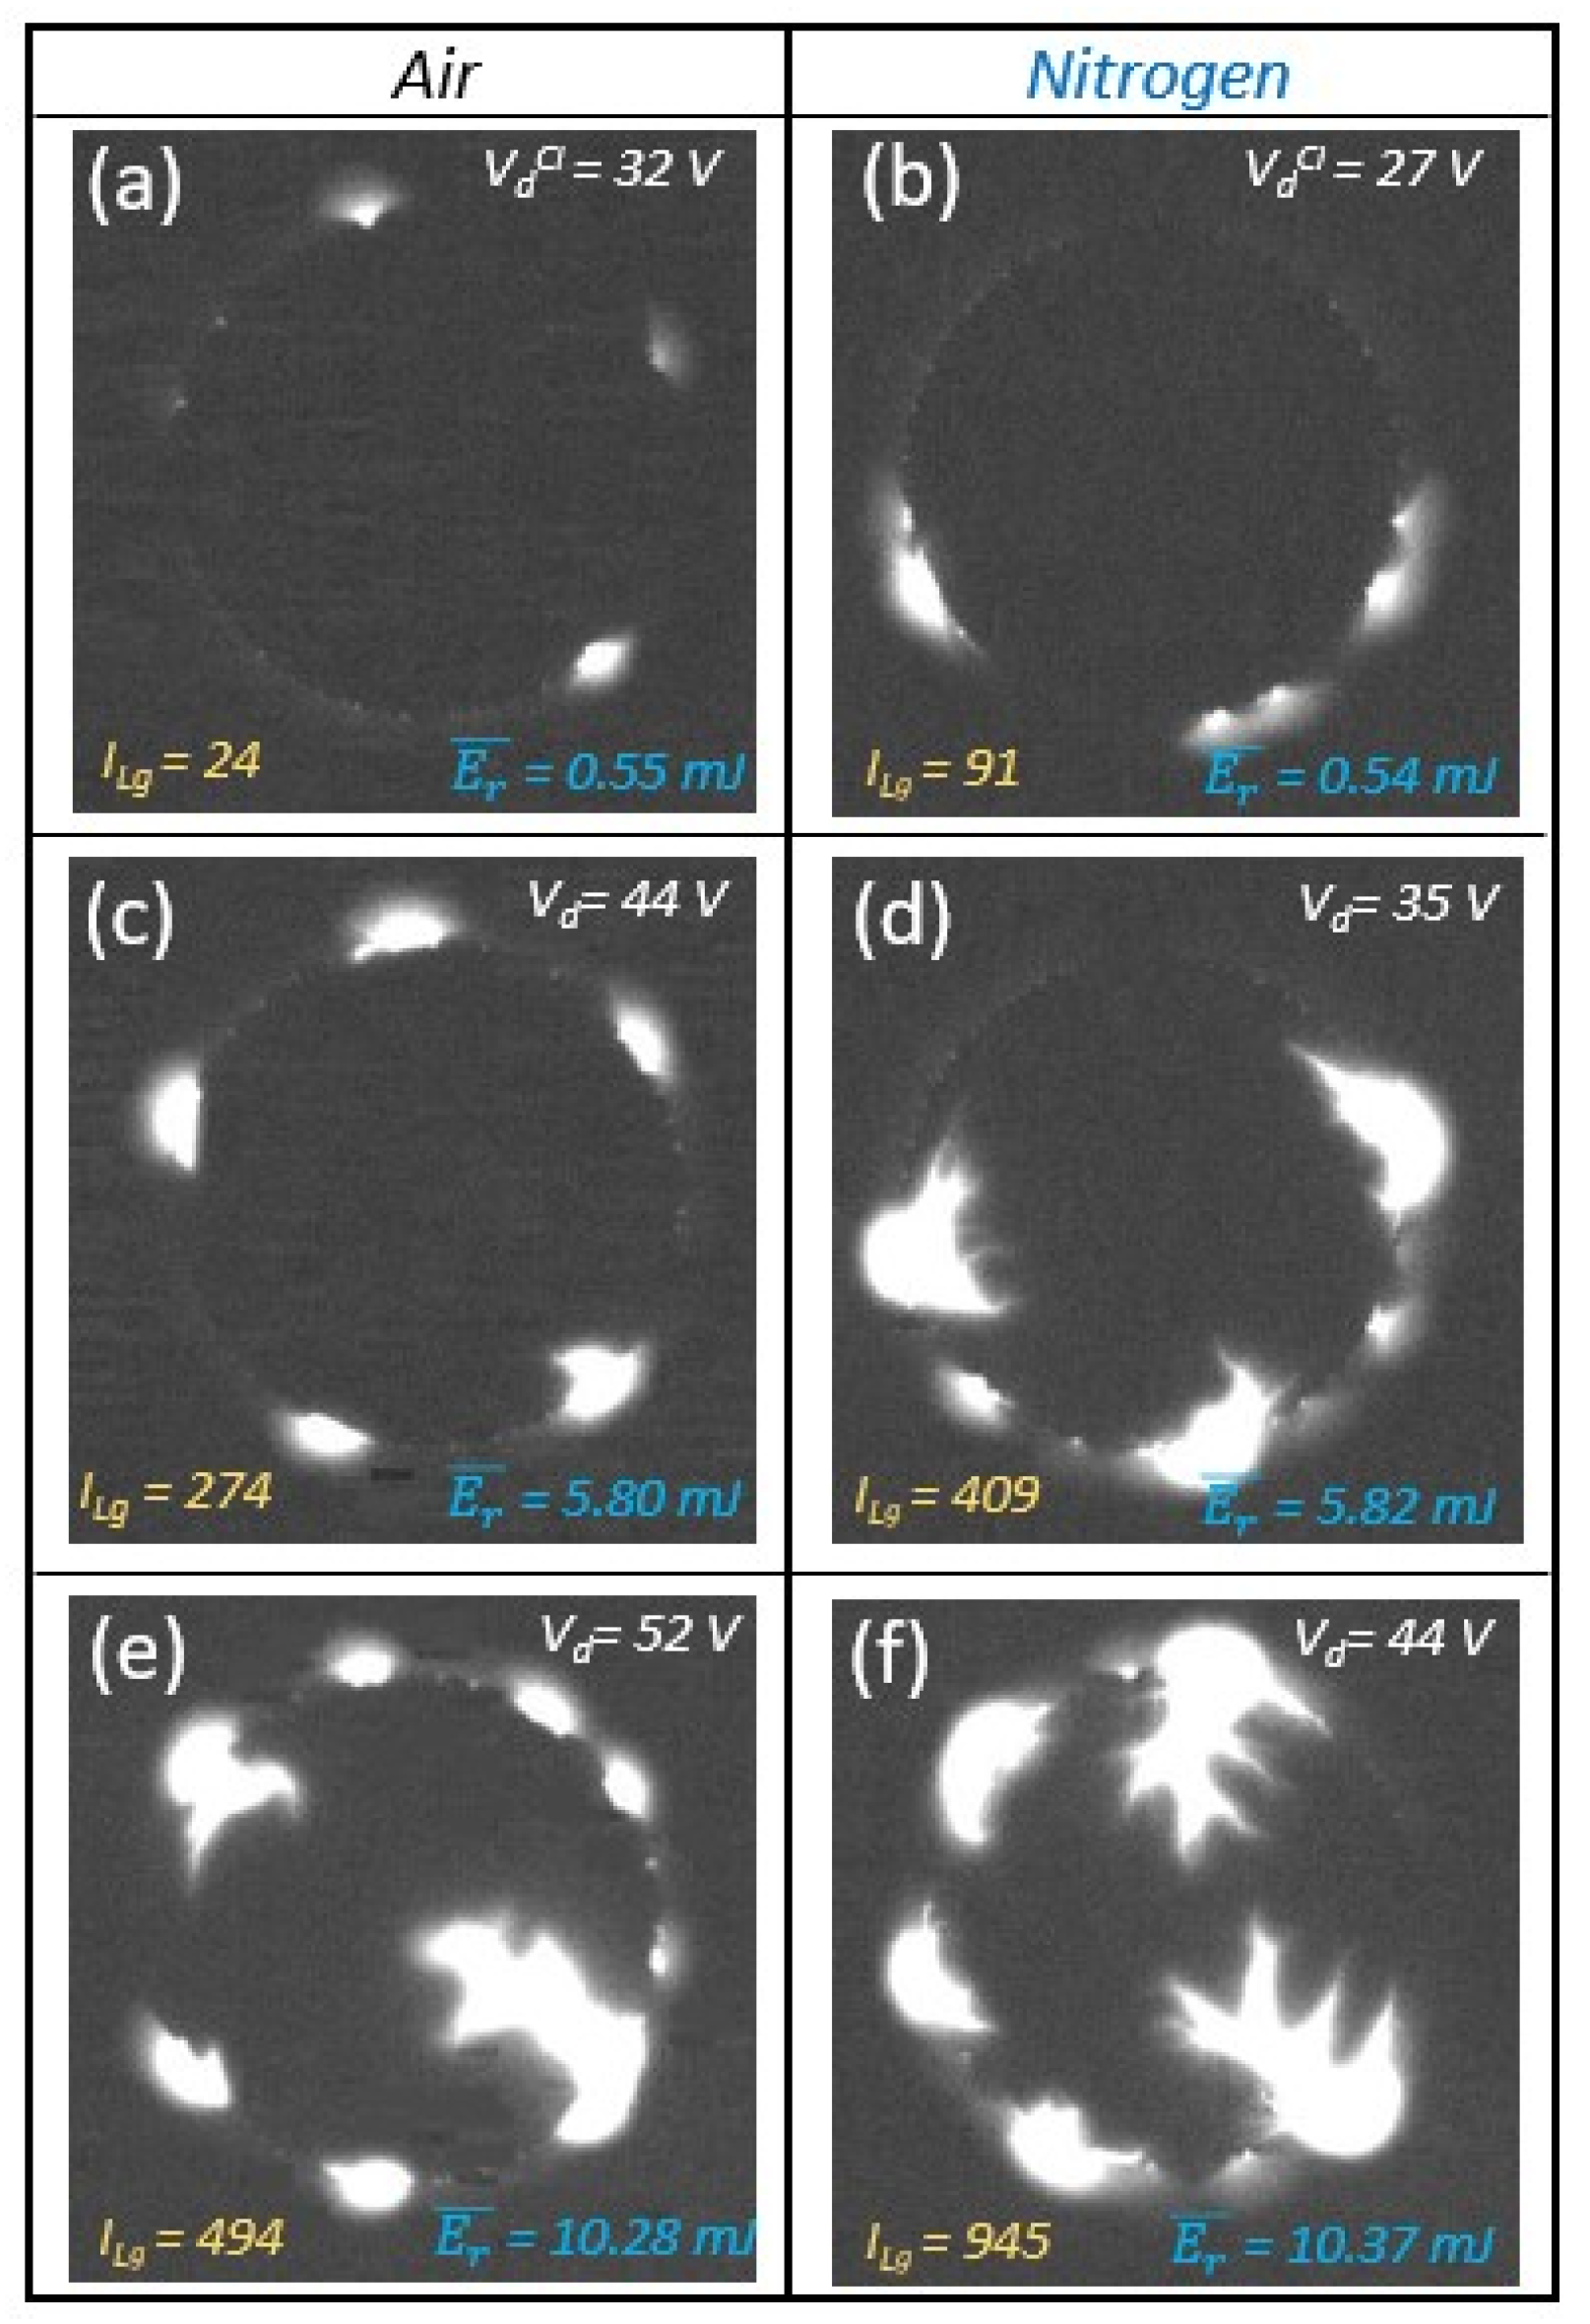
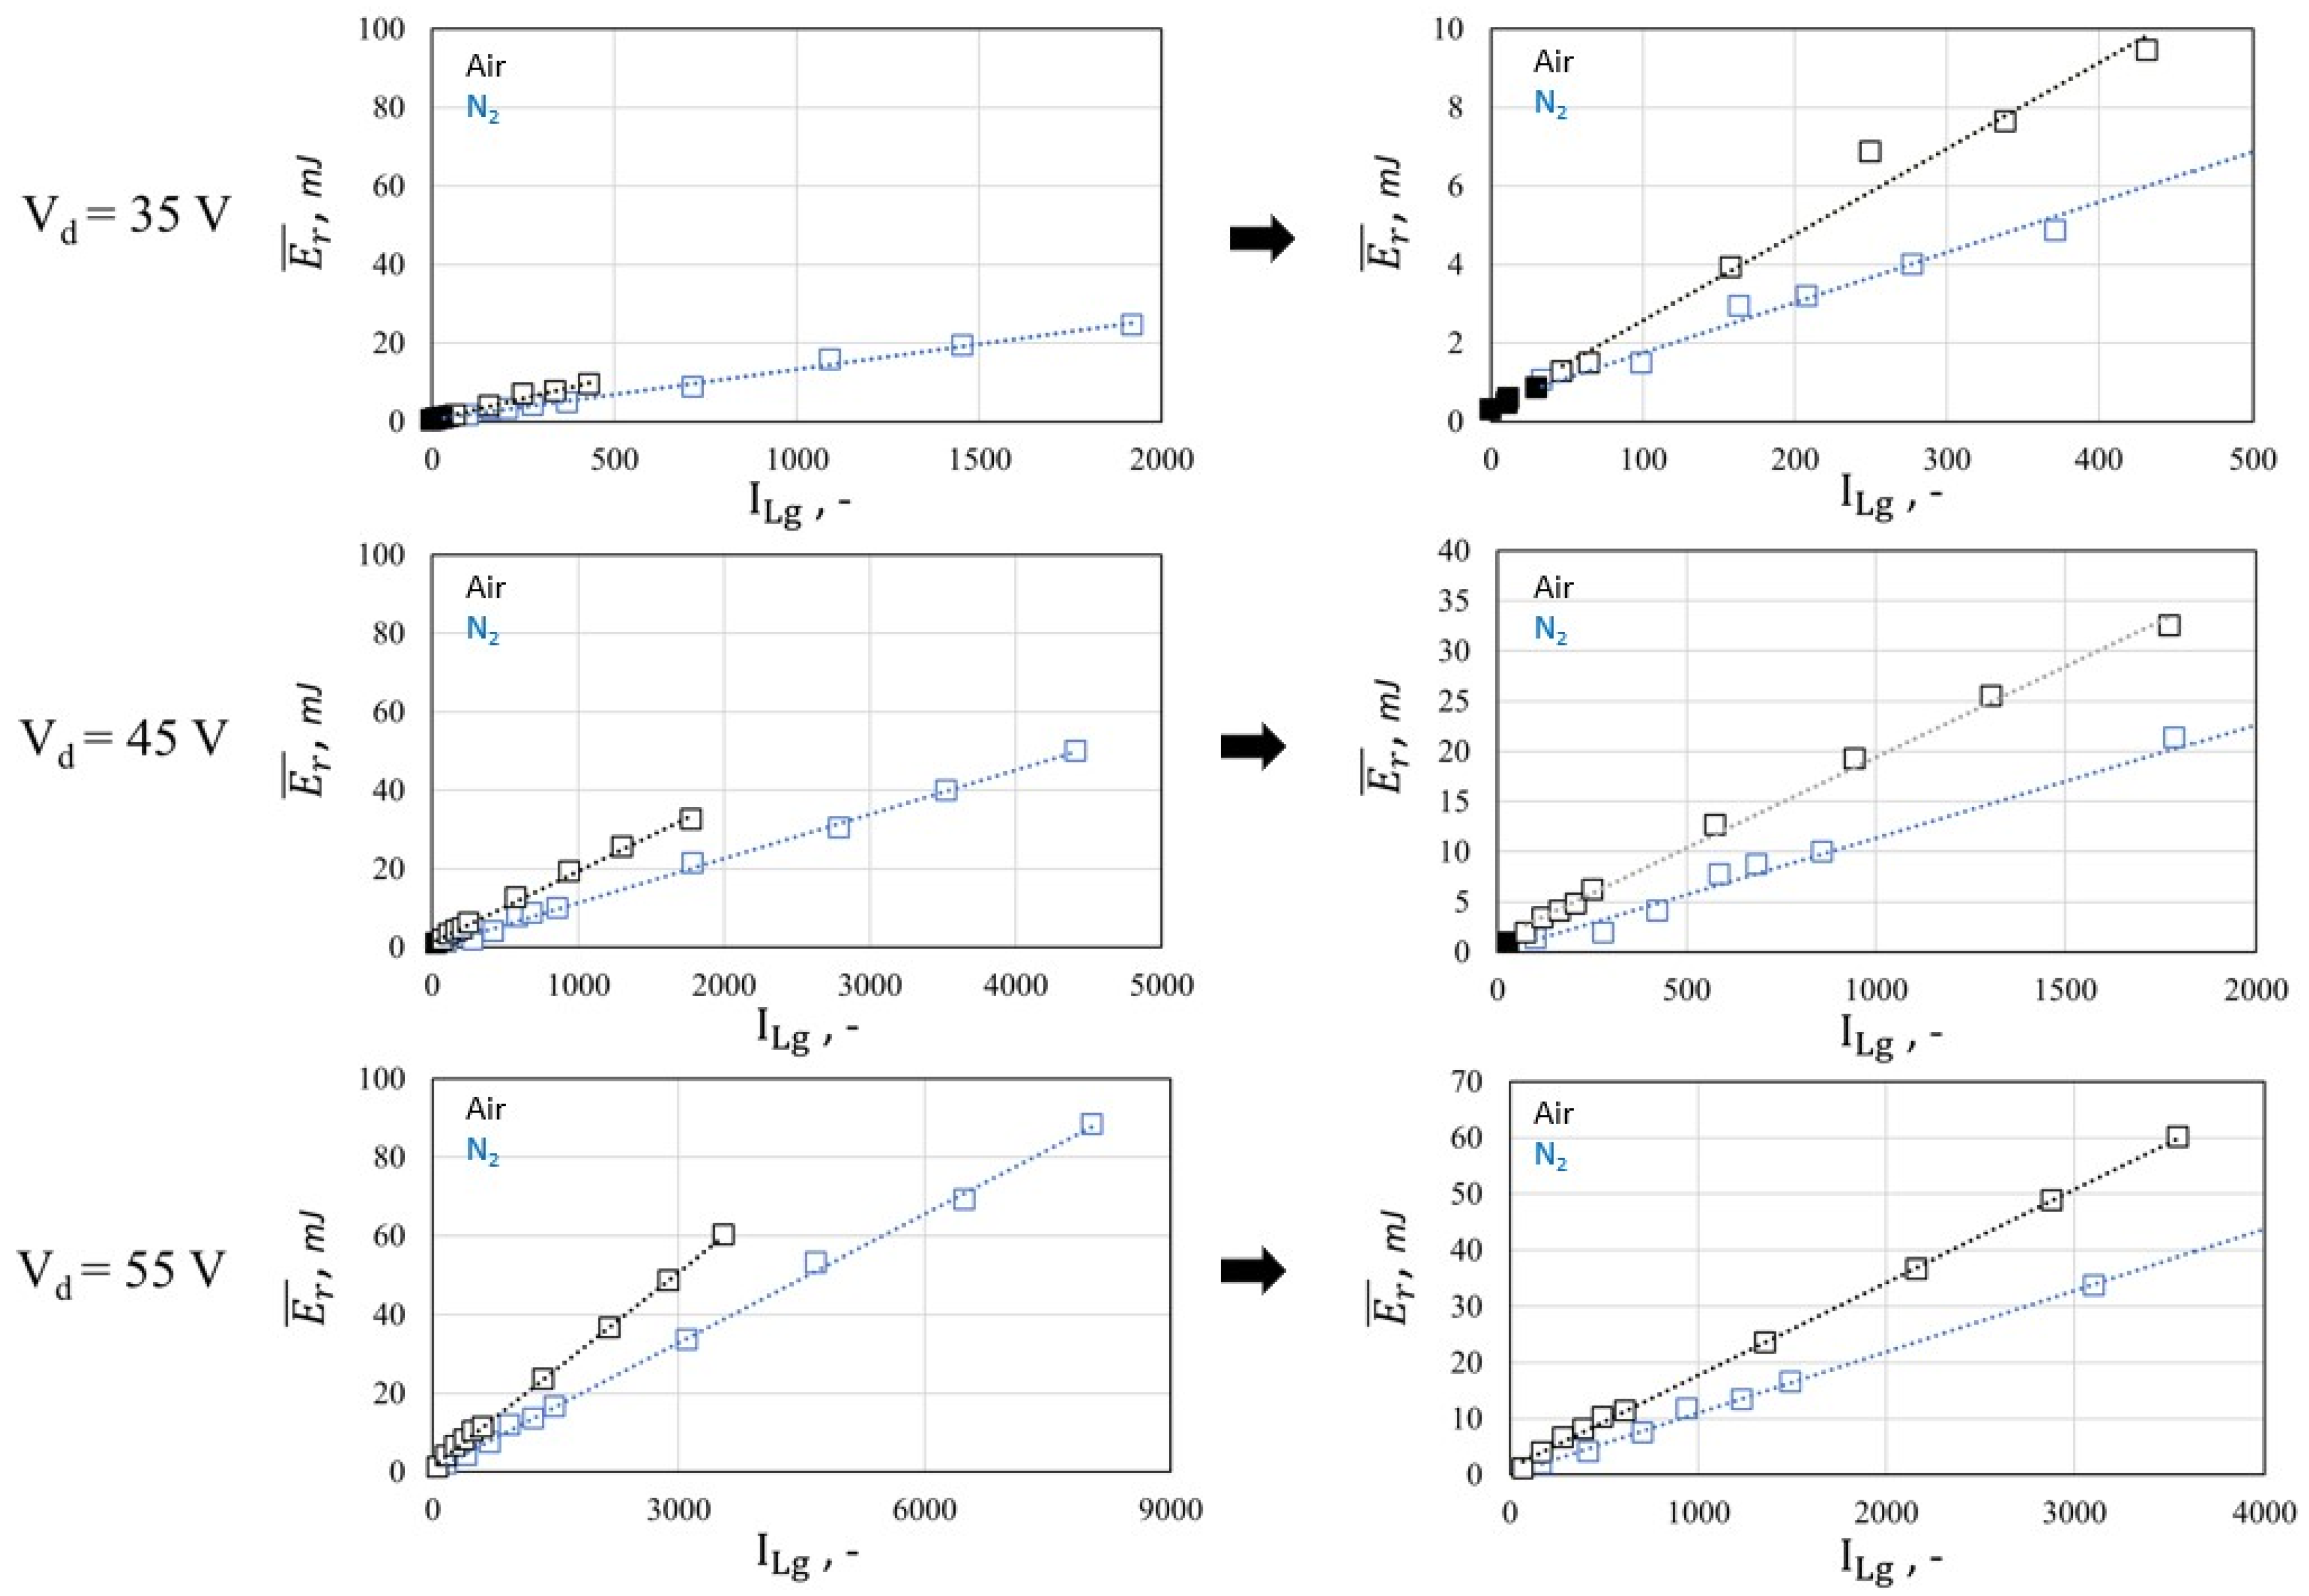
At each Vd, nitrogen showed lower m values than air, since, for the same ILg, a lower amount of thermal energy has been recorded. Vice versa, for the same E r ¯ , brighter streamers are present in nitrogen with respect to those analyzed in synthetic air.
Positive values of the intercept q, either in air or in nitrogen, are due to the lack of linearity in the low energy–luminosity region (points excluded as already mentioned for fit calculation).
Based on the above considerations, the different slopes found in air and nitrogen emphasize that it is possible to determine calibration factors among thermal energy and luminosity. Their correct determination and their dependence on the tested media are of paramount importance if a similar approach is to be replicated on an optically accessible engine. To conclude, it must be pointed out that, as mentioned in the previous section, streamers luminosity emission is strongly influenced by the chemical species produced during the discharge events. As a consequence, a spectroscopical and chemiluminescent analysis could be suitable to gain further insights into the discharge physics, so as to profoundly quantify the luminosity–thermal energy correlation.
Actually, the developed method of image post-processing is also quite strict in the parameter value selection, because it consists of the implementation and adaptation of different algorithms imported from other fields of the image analysis. Furthermore, changing the adopted parameters also has an impact on the theory behind these methods, so the statistical meaning of the results can lose its validity.
Currently, our group is involved in the development of a new kind of CNN-based (convolutional neural network, a class of artificial neural network) algorithm to remove algorithm dependence from the particular parameters chosen, so as to improve the universality of the method and to widely reduce the use complexity and the user arbitrariness. The recognition of the flame evolution is carried out by PA, regardless of any user’s decision, which could make the proposed method potentially suitable for any type of application requiring a high degree of objectivity. The new algorithm, applied to simplified but realistic images, shows promising results [65,66].

5. Conclusions

The present study analyzed the discharge characteristics of a barrier discharge igniter by simultaneously recording pressure data and natural luminosity images employing an optically accessible calorimeter. Test are performed in synthetic air at 8 bar absolute, room temperature and by executing a parametric investigation of the main setting parameters of the igniter, namely, driving voltage and activation time. The data gathered are compared with the results obtained with nitrogen as a test medium in a previous work of the same group. The relevant outcomes of the study are:
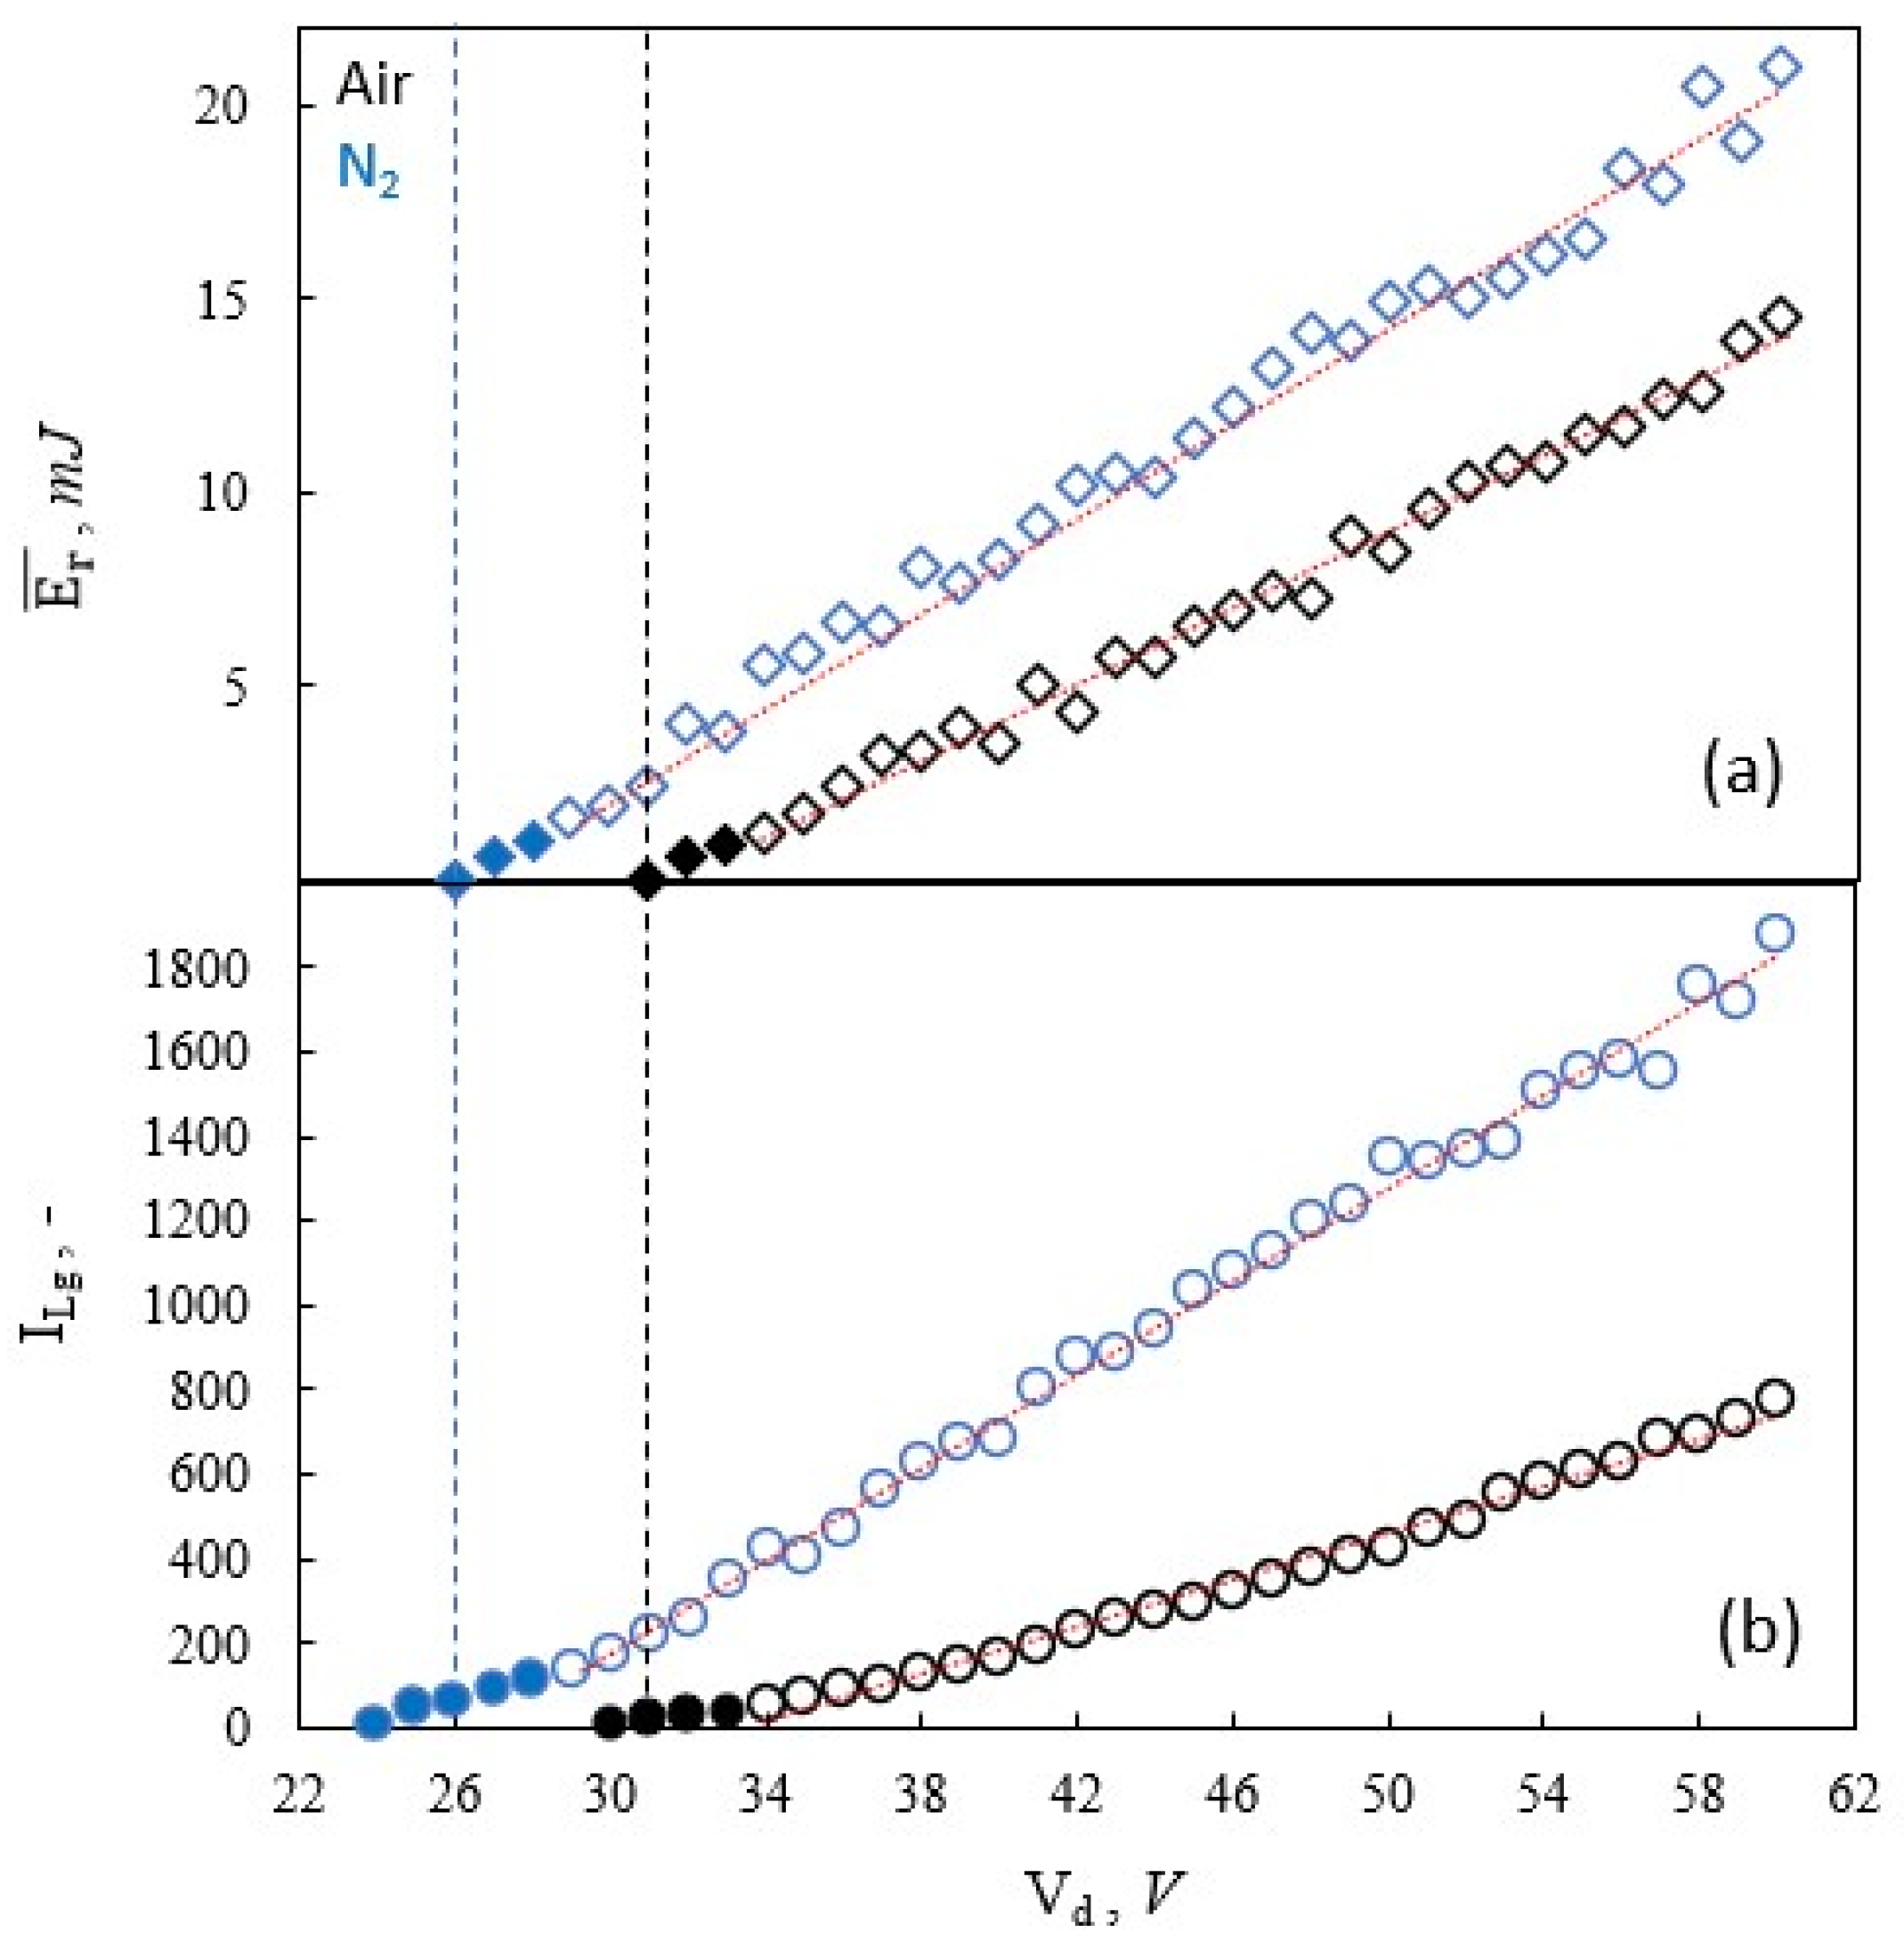
  • For a fixed activation time in synthetic air test, thermal energy and discharge luminosity show a linear relationship with the driving voltage in a similar manner to nitrogen. At the lowest voltages (close-to-inception conditions), non-linear behavior among the previous quantities is commonly present in both media.
  • Considering the same driving voltage, in synthetic air, a simultaneous reduction in released thermal energy and luminosity is detected with respect to pure nitrogen.
  • In common with N2, in synthetic air a direct linear correlation between deposited thermal energy and luminosity can be found. It must be noted that different calibration factors between the two media are identified.
  • The presence of oxygen modifies the structure of the streamers, resulting in a thicker and less branched morphology in the case of synthetic air with respect to N2.
In this experimental investigation, air was chosen since it approaches the in-cylinder mixture composition (fresh air, fuel vapor, exhaust residual) present in optical and metal engines. In principle, it could be feasible to exploit the outcome of such non-intrusive diagnostic technique to characterize the igniter’s energetic behavior in an optical access engine. Future works are aimed at proving and supporting the above assumption, by evaluating the influence of different media (mixture of air and carbon dioxide for EGR simulation) and igniters on the energy–luminosity correlation.

Author Contributions

Conceptualization, R.M.; methodology, R.M. and F.R.; software, F.R.; validation, R.M. and F.R.; formal analysis, L.P.; investigation, L.P., R.M. and F.R.; data curation, R.M. and F.R.; writing—original draft preparation R.M. and F.R.; writing—review and editing, G.D., C.N.G., and S.P.; visualization, S.P.; supervision, G.D., C.N.G.; project administration, C.N.G.; All authors have read and agreed to the published version of the manuscript.

Funding

This research was funded by Ministero dell’Università e della Ricerca grant number 2017X8RLFE

Data Availability Statement

Data are not available due to privacy.

Acknowledgments

This work has been developed under the support of the project PRIN-2017X8RLFE_002.

Conflicts of Interest

The authors declare no conflict of interest.

Nomenclature

ACISAdvanced Corona Ignition System
BDIBarrier Discharge Igniter
EGRExhaust Gas Recirculation
ErEnergy released to the medium
PAIPlasma Assisted Igniter
P m a x ¯   Chamber pressure after a streamer event
P m i n ¯   Chamber pressure before a streamer event
SISpark Ignition
tonDuration of corona discharge
VdDriving voltage
VdCIDriving voltage at corona inception
VdMAXMaximum driving voltage
VeElectrode voltage
VsSupply voltage
ljGrey level of the jth pixel
lgFrame average grey level
LgAverage grey level trend of a single discharge event
L g ¯   Average grey level trend of the 25 discharge events
ILgIntegral luminosity
ν c h Bomb chamber inner volume
γHeat specific ratio
ΔPPressure gradient due to a streamer event

References

  1. Leach, F.; Kalghatgi, G.; Stone, R.; Miles, P. The scope for improving the efficiency and environmental impact of internal combustion engines. Transp. Eng. 2020, 1, 100005. [Google Scholar] [CrossRef]
  2. Nakata, K.; Nogawa, S.; Takahashi, D.; Yoshihara, Y.; Kumagai, A.; Suzuki, T. Engine Technologies for Achieving 45% Thermal Efficiency of S.I. Engine. SAE Int. J. Engines 2015, 9, 179–192. [Google Scholar] [CrossRef]
  3. Battistoni, M.; Grimaldi, C.N.; Cruccolini, V.; Discepoli, G.; De Cesare, M. Assessment of Port Water Injection Strategies to Control Knock in a GDI Engine through Multi-Cycle CFD Simulations; SAE Technical Paper; SAE International: Warrendale, PA, USA, 2017. [Google Scholar] [CrossRef]
  4. da Rocha, D.D.; Radicchi, F.D.C.; Lopes, G.S.; Brunocilla, M.F.; Gomes, P.C.D.F.; Santos, N.D.S.A.; Malaquias, A.C.T.; Filho, F.A.R.; Baêta, J.G.C. Study of the water injection control parameters on combustion performance of a spark-ignition engine. Energy 2021, 217, 119346. [Google Scholar] [CrossRef]
  5. Zembi, J.; Mariani, F.; Battistoni, M. Large Eddy Simulation of Ignition and Combustion Stability in a Lean SI Optical Access Engine; SAE Technical Paper; SAE International: Warrendale, PA, USA, 2019. [Google Scholar] [CrossRef]
  6. Tornatore, C.; Bozza, F.; De Bellis, V.; Teodosio, L.; Valentino, G.; Marchitto, L. Experimental and numerical study on the influence of cooled EGR on knock tendency, performance and emissions of a downsized spark-ignition engine. Energy 2019, 172, 968–976. [Google Scholar] [CrossRef]
  7. Jiang, L.J.; Shy, S.; Nguyen, M.T.; S.Y., S.; Yu, D.W. Spark ignition probability and minimum ignition energy transition of the lean iso-octane/air mixture in premixed turbulent combustion. Combust. Flame 2018, 187, 87–95. [Google Scholar] [CrossRef]
  8. Wei, H.; Zhang, R.; Chen, L.; Pan, J.; Wang, X. Effects of high ignition energy on lean combustion characteristics of natural gas using an optical engine with a high compression ratio. Energy 2021, 223, 120053. [Google Scholar] [CrossRef]
  9. Chen, L.; Wei, H.; Zhang, R.; Pan, J.; Zhou, L.; Feng, D. Effects of spark plug type and ignition energy on combustion performance in an optical SI engine fueled with methane. Appl. Therm. Eng. 2018, 148, 188–195. [Google Scholar] [CrossRef]
  10. Discepoli, G.; Cruccolini, V.; Dal Re, M.; Zembi, J.; Battistoni, M.; Mariani, F.; Grimaldi, C. Experimental assessment of spark and corona igniters energy release. Energy Procedia 2018, 148, 1262–1269. [Google Scholar] [CrossRef]
  11. Kim, K.; Tambasco, C.; Hall, M.; Matthews, R. Experimental and Modeling Study of Spark Plug Electrode Heat Transfer and Thermal Energy Deposition. SAE Tech. Pap. 2021. [Google Scholar] [CrossRef]
  12. Salvi, B.; Subramanian, K. Experimental investigation and phenomenological model development of flame kernel growth rate in a gasoline fuelled spark ignition engine. Appl. Energy 2015, 139, 93–103. [Google Scholar] [CrossRef]
  13. Yin, X.; Sun, N.; Sun, T.; Shen, H.; Mehra, R.K.; Liu, J.; Wang, Y.; Yang, B.; Zeng, K. Experimental investigation the effects of spark discharge characteristics on the heavy-duty spark ignition natural gas engine at low load condition. Energy 2022, 239, 122244. [Google Scholar] [CrossRef]
  14. Abidin, Z.; Chadwell, C.J. Parametric Study and Secondary Circuit Model Calibration Using Spark Calorimeter Testing; SAE Technical Paper; SAE International: Detroit, MI, USA, 2015. [Google Scholar]
  15. Wolk, B.M.; Ekoto, I. Calorimetry and Imaging of Plasma Produced by a Pulsed Nanosecond Discharge Igniter in EGR Gases at Engine-Relevant Densities. SAE Int. J. Engines 2017, 10, 970–983. [Google Scholar] [CrossRef]
  16. Discepoli, G.; Cruccolini, V.; Ricci, F.; Di Giuseppe, A.; Papi, S.; Grimaldi, C. Experimental characterisation of the thermal energy released by a Radio-Frequency Corona Igniter in nitrogen and air. Appl. Energy 2020, 263, 114617. [Google Scholar] [CrossRef] [Green Version]
  17. Ricci, F.; Cruccolini, V.; Discepoli, G.; Petrucci, L.; Grimaldi, C.; Papi, S. Luminosity and Thermal Energy Measurement and Comparison of a Dielectric Barrier Discharge in an Optical Pressure-Based Calorimeter at Engine Relevant Conditions; SAE Technical Paper; SAE International: Southfield, MI, USA, 2021. [Google Scholar] [CrossRef]
  18. Costa, M.; Marchitto, L.; Merola, S.; Sorge, U. Study of mixture formation and early flame development in a research GDI (gasoline direct injection) engine through numerical simulation and UV-digital imaging. Energy 2014, 77, 88–96. [Google Scholar] [CrossRef]
  19. Merola, S.S.; Marchitto, L.; Tornatore, C.; Valentino, G.; Irimescu, A. UV-visible Optical Characterization of the Early Combustion Stage in a DISI Engine Fuelled with Butanol-Gasoline Blend. SAE Int. J. Engines 2013, 6, 1953–1969. [Google Scholar] [CrossRef]
  20. Cruccolini, V.; Grimaldi, C.N.; Discepoli, G.; Ricci, F.; Petrucci, L.; Papi, S. An Optical Method to Characterize Streamer Variability and Streamer-to-Flame Transition for Radio-Frequency Corona Discharges. Appl. Sci. 2020, 10, 2275. [Google Scholar] [CrossRef] [Green Version]
  21. Karvountzis-Kontakiotis, A.; Vafamehr, H.; Cairns, A.; Peckham, M. Study on pollutants formation under knocking combustion conditions using an optical single cylinder SI research engine. Energy 2018, 158, 899–910. [Google Scholar] [CrossRef]
  22. Irimescu, A.; Marchitto, L.; Merola, S.S.; Tornatore, C.; Valentino, G. Evaluation of different methods for combined thermodynamic and optical analysis of combustion in spark ignition engines. Energy Convers. Manag. 2014, 87, 914–927. [Google Scholar] [CrossRef]
  23. Cruccolini, V.; Discepoli, G.; Cimarello, A.; Battistoni, M.; Mariani, F.; Grimaldi, C.N.; Dal Re, M. Lean combustion analysis using a corona discharge igniter in an optical engine fueled with methane and a hydrogen-methane blend. Fuel 2020, 259, 116290. [Google Scholar] [CrossRef]
  24. Shawal, S.; Goschutz, M.; Schild, M.; Kaiser, S.; Neurohr, M.; Pfeil, J.; Koch, T. High-Speed Imaging of Early Flame Growth in Spark-Ignited Engines Using Different Imaging Systems via Endoscopic and Full Optical Access. SAE Int. J. Engines 2016, 9, 704–718. [Google Scholar] [CrossRef]
  25. Cheng, Q.; Ahmad, Z.; Kaario, O.; Larmi, M. Simultaneous Visualization of Natural Luminosity and Chemiluminescence of Dual Fuel Combustion in an Optically Accessible Engine; SAE Technical Paper; SAE International: Warrendale, PA, USA, 2020. [Google Scholar] [CrossRef]
  26. Jeon, J. Spatiotemporal flame propagations, combustion and solid particle emissions from lean and stoichiometric gasoline direct injection engine operation. Energy 2020, 210, 118652. [Google Scholar] [CrossRef]
  27. Mazacioglu, A.; Gross, M.; Kern, J.; Sick, V. Infrared Borescopic Evaluation of High-Energy and Long-Duration Ignition Systems for Lean/Dilute Combustion in Heavy-Duty Natural-Gas Engines; SAE Technical Paper; SAE International: Warrendale, PA, USA, 2018. [Google Scholar] [CrossRef] [Green Version]
  28. Starikovskaia, S.M. Plasma assisted ignition and combustion. J. Phys. D Appl. Phys. 2006, 39, R265–R299. [Google Scholar] [CrossRef]
  29. Starikovskiy, A.; Aleksandrov, N. Plasma-assisted ignition and combustion. Prog. Energy Combust. Sci. 2013, 39, 61–110. [Google Scholar] [CrossRef] [Green Version]
  30. Ju, Y.; Sun, W. Plasma assisted combustion: Dynamics and chemistry. Prog. Energy Combust. Sci. 2015, 48, 21–83. [Google Scholar] [CrossRef]
  31. Padala, S.; Nagaraja, S.; Ikeda, Y.; Le, M.K. Extension of Dilution Limit in Propane-Air Mixtures Using Microwave Discharge Igniter; SAE Technical Paper; SAE International: Warrendale, PA, USA, 2017. [Google Scholar] [CrossRef]
  32. Marko, F.; König, G.; Schöffler, T.; Bohne, S.; Dinkelacker, F. Comparative Optical and Thermodynamic Investigations of High Frequency Corona- and Spark-Ignition on a CV Natural Gas Research Engine Operated with Charge Dilution by Exhaust Gas Recirculation. In Ignition Systems for Gasoline Engines; International Conference on Ignition Systems for Gasoline Engines; Springer International Publishing: Cham, Switzerland, 2017; pp. 293–314. [Google Scholar] [CrossRef]
  33. Cimarello, A.; Cruccolini, V.; Discepoli, G.; Battistoni, M.; Mariani, F.; Grimaldi, C.; Re, M.D. Combustion Behavior of an RF Corona Ignition System with Different Control Strategies; SAE Technical Paper; SAE International: Warrendale, PA, USA, 2018. [Google Scholar] [CrossRef]
  34. Cruccolini, V.; Scarcelli, R.; Battistoni, M.; Grimaldi, C.N.; Re, M.A.D.; Breden, D.; Raja, L.L. Multidimensional modeling of non-equilibrium plasma generated by a radio-frequency corona discharge. Plasma Sources Sci. Technol. 2020, 29, 115013. [Google Scholar] [CrossRef]
  35. Shiraishi, T. A Study of Low Temperature Plasma-Assisted Gasoline HCCI Combustion. SAE Int. J. Engines 2019, 12, 31–44. [Google Scholar] [CrossRef]
  36. Shiraishi, T.; Urushihara, T. Fundamental Analysis of Combustion Initiation Characteristics of Low Temperature Plasma Ignition for Internal Combustion Gasoline Engine; SAE Technical Paper; SAE International: Warrendale, PA, USA, 2011. [Google Scholar] [CrossRef]
  37. Ricci, F.; Petrucci, L.; Cruccolini, V.; Discepoli, G.; Grimaldi, C.N.; Papi, S. Investigation of the Lean Stable Limit of a Barrier Discharge Igniter and of a Streamer-Type Corona Igniter at Different Engine Loads in a Single-Cylinder Research Engine. Proceedings 2020, 58, 11. [Google Scholar] [CrossRef]
  38. Cruccolini, V.; Discepoli, G.; Ricci, F.; Petrucci, L.; Grimaldi, C.; Papi, S.; Re, M.D. Comparative Analysis between a Barrier Discharge Igniter and a Streamer-Type Radio-Frequency Corona Igniter in an Optically Accessible Engine in Lean Operating Conditions; SAE Technical Paper; SAE International: Warrendale, PA, USA, 2020. [Google Scholar] [CrossRef]
  39. Zembi, J.; Ricci, F.; Grimaldi, C.; Battistoni, M. Numerical Simulation of the Early Flame Development Produced by a Barrier Discharge Igniter in an Optical Access Engine; SAE Technical Paper; SAE International: Warrendale, PA, USA, 2021. [Google Scholar] [CrossRef]
  40. Toyota, H.; Zama, S.; Akamine, Y.; Matsuoka, S.; Hidaka, K. Gaseous electrical discharge characteristics in air and nitrogen at cryogenic temperature. IEEE Trans. Dielectr. Electr. Insul. 2002, 9, 891–898. [Google Scholar] [CrossRef]
  41. Eliasson, B.; Kogelschatz, U. Modeling and applications of silent discharge plasmas. IEEE Trans. Plasma Sci. 1991, 19, 309–323. [Google Scholar] [CrossRef]
  42. Brandenburg, R. Corrigendum: Dielectric barrier discharges: Progress on plasma sources and on the understanding of regimes and single filaments (Plasma Sources Science and Technology (2017) 26 (053001)). Plasma Sources Sci. Technol. 2018, 27, 079501. [Google Scholar] [CrossRef]
  43. Gas, L. Available online: https://www.linde-gas.com/en/products_and_supply/gases_atmospheric/air.html (accessed on 1 February 2022).
  44. Hoder, T.; Bonaventura, Z.; Bourdon, A.; Šimek, M. Sub-nanosecond delays of light emitted by streamer in atmospheric pressure air: Analysis of N2(C3Πu) and N2+(B2Σu+) emissions and fundamental streamer structure. J. Appl. Phys. 2015, 117, 073302. [Google Scholar] [CrossRef] [Green Version]
  45. Rezaei, F.; Abbasi-Firouzjah, M.; Shokri, B. Investigation of antibacterial and wettability behaviours of plasma-modified PMMA films for application in ophthalmology. J. Phys. D Appl. Phys. 2014, 47, 085401. [Google Scholar] [CrossRef]
  46. Vision Research Inc. Phantom High Speed. 2019. Available online: https://w3.pppl.gov/~szweben/Cmod%20guide/v710.pdf/ (accessed on 1 February 2022).
  47. Cruccolini, V.; Discepoli, G.; Ricci, F.; Grimaldi, C.N.; Di Giuseppe, A. Optical and Energetic Investigation of an Advanced Corona Ignition System in a Pressure-Based Calorimeter. E3S Web Conf. 2020, 197, 06019. [Google Scholar] [CrossRef]
  48. Semmlow, J. Two-Dimensional Signals—Basic Image Analysis. In Circuits, Signals and Systems for Bioengineers; Academic Press: Cambridge, MA, USA, 2018; pp. 419–526. [Google Scholar] [CrossRef]
  49. Aleksandrov, N.L.; Bazelyan, E.M.; A Novitskii, G. The effect of small O2addition on the properties of a long positive streamer in Ar. J. Phys. D Appl. Phys. 2001, 34, 1374–1378. [Google Scholar] [CrossRef]
  50. Chvyreva, A.; Pancheshnyi, S.; Christen, T.; Pemen, A.J.M. Raether–Meek criterion for prediction of electrodeless discharge inception on a dielectric surface in different gases. J. Phys. D Appl. Phys. 2018, 51, 115202. [Google Scholar] [CrossRef]
  51. Meyer, H.K.H.; Marskar, R.; Gjemdal, H.; Mauseth, F. Corrigendum: Streamer propagation along a profiled dielectric surface (2020 Plasma Sources Sci. Technol. 29 115015). Plasma Sources Sci. Technol. 2021, 30, 069501. [Google Scholar] [CrossRef]
  52. Uddi, M.; Jiang, N.; Mintusov, E.; Adamovich, I.; Lempert, W.R. Atomic oxygen measurements in air and air/fuel nanosecond pulse discharges by two photon laser induced fluorescence. Proc. Combust. Inst. 2009, 32, 929–936. [Google Scholar] [CrossRef]
  53. Ono, R.; Oda, T. Formation and structure of primary and secondary streamers in positive pulsed corona discharge—Effect of oxygen concentration and applied voltage. J. Phys. D Appl. Phys. 2003, 36, 1952–1958. [Google Scholar] [CrossRef]
  54. Nijdam, S.; Teunissen, J.; Ebert, U. The physics of streamer discharge phenomena. Plasma Sources Sci. Technol. 2020, 29, 103001. [Google Scholar] [CrossRef]
  55. Nijdam, S. Experimental investigations on the physics of streamers. Ph.D. Thesis, Technische Universiteit Eindhoven, Eindhoven, The Netherlands, 2011. [Google Scholar]
  56. Bagheri, B.; Teunissen, J. The effect of the stochasticity of photoionization on 3D streamer simulations. Plasma Sources Sci. Technol. 2019, 28, 045013. [Google Scholar] [CrossRef] [Green Version]
  57. Luque, A.; Ebert, U. Electron density fluctuations accelerate the branching of positive streamer discharges in air. Phys. Rev. E 2011, 84, 046411. [Google Scholar] [CrossRef] [PubMed] [Green Version]
  58. A Kulikovsky, A. The role of photoionization in positive streamer dynamics. J. Phys. D Appl. Phys. 2000, 33, 1514–1524. [Google Scholar] [CrossRef]
  59. Pancheshnyi, S.V.; Starikovskaia, S.M.; Starikovskii, A.Y. Role of photoionization processes in propagation of cathode-directed streamer. J. Phys. D Appl. Phys. 2001, 34, 105–115. [Google Scholar] [CrossRef]
  60. Li, Y.; Dijcks, S.; Sun, G.; Wen, J.; Xu, Y.-Y.; Zhang, G.-J.; Ebert, U.; Nijdam, S. Characterizing streamer branching in N2–O2 mixtures by 2D peak-finding. Plasma Sources Sci. Technol. 2020, 29, 03LT02. [Google Scholar] [CrossRef]
  61. Chen, S.; Heijmans, L.C.J.; Zeng, R.; Nijdam, S.; Ebert, U. Nanosecond repetitively pulsed discharges in N2–O2 mixtures: Inception cloud and streamer emergence. J. Phys. D Appl. Phys. 2015, 48, 175201. [Google Scholar] [CrossRef] [Green Version]
  62. Yi, W.J.; Williams, P.F. Experimental study of streamers in pure N2 and N2/O2 mixtures and a ≈13 cm gap. J. Phys. D Appl. Phys. 2002, 35, 205–218. [Google Scholar] [CrossRef] [Green Version]
  63. Briels, T.M.P.; Van Veldhuizen, E.M.; Ebert, U. Positive streamers in air and nitrogen of varying density: Experiments on similarity laws. J. Phys. D Appl. Phys. 2008, 41, 234008. [Google Scholar] [CrossRef] [Green Version]
  64. Chen, S.; Wang, F.; Sun, Q.; Zeng, R. Branching characteristics of positive streamers in nitrogen-oxygen gas mixtures. IEEE Trans. Dielectr. Electr. Insul. 2018, 25, 1128–1134. [Google Scholar] [CrossRef]
  65. Petrucci, L.; Ricci, F.; Mariani, F.; Discepoli, G. A Development of a New Image Analysis Technique for Detecting the Flame Front Evolution in Spark Ignition Engine under Lean Condition. Vehicles 2022, 4, 10. [Google Scholar] [CrossRef]
  66. Petrucci, L.; Ricci, F.; Martinelli, R.; Mariani, F. Detecting the Flame Front Evolution in Spark-Ignition Engine under Lean Condition Using the Mask R-CNN Approach. Vehicles 2022, 4, 53. [Google Scholar] [CrossRef]
Figure 1. (a) 1: inductor, 2: connection, 3: firing end of the igniter and corresponding detail of the firing end. (b) BDI lumped-parameter circuit. The coil is represented by an inductive component L1, a resistance R1 which takes into account skin and proximity effects losses and ohmic losses, and a parasitic capacitance C1 between the turns. The firing end mostly represents the capacitance CL of the igniter assembly. A resistance RL, in parallel, is introduced to account for the ohmic losses of air and bulk insulation. (c) Streamers development around the BDI cupola as driving voltage increases from the inception up to the maximum allowed voltage.
Energies 16 00520 g001
Figure 2. Experimental setup.
Energies 16 00520 g002
Figure 3. (a) FTT amplitude of the recorded pressure signal (grey signal) due to the igniter discharge and corresponding filtered signal (red line). (b) Corresponding pressure signals over the time.
Energies 16 00520 g003
Figure 4. (a) Representation in MATLAB environment, in grey scale (0–255), of a frame acquired by the camera. (b) Frame selection process performed to identify the beginning and termination of the discharge event.
Energies 16 00520 g004
Figure 5. (a) Average grey level for each of the first 20 frame (black markers) and corresponding mean value of them (red dashed line). (b) Grey level distribution of the average noise frame. (c) Example of an original frame before (grey bars) and after (blue bars) the noise removing.
Energies 16 00520 g005
Figure 6. Workflow to obtain, at specific operating point, the average grey level and the binarized area for estimating the streamer surface around the igniter cupola.
Energies 16 00520 g006
Figure 7. Trends of Lg (black lines) composed by the sequence of all the grey level values lg of each discharge and the corresponding mean trend L g ¯ (red line) of all the discharges. Note that the y-axis physical quantity is the average grey level lg in Equation (2). The parameter ILg is indicated by the red transparency area below the L g ¯ curve.
Energies 16 00520 g007
Figure 8. Chamber relative pressure signal over time at three different driving voltages, in a range from VdCI to VdMAX.
Energies 16 00520 g008
Figure 9. ILg (a) and E r ¯ (b) versus the driving voltage in air (black markers) and nitrogen (blue markers) at all the voltage level investigated. Dashed black and blue vertical lines depict the voltage threshold over which a measurable release of thermal energy occurs. The dashed red lines represent a linear fit of ILg for both analyzed media.
Energies 16 00520 g009
Figure 10. Natural luminosity images of streamers evolution in air (a,c,e) and nitrogen (b,d,f) at different driving voltages.
Energies 16 00520 g010
Figure 11. Correlation between E r ¯ and ILg for all tested Vd in air (a) and comparison with nitrogen results (b). The dashed red lines represent a linear fit between E r ¯ and ILg for both analyzed media.
Energies 16 00520 g011
Figure 12. (a) Igniter discharge image cropping for streamers binarized area and perimeter estimation; (b) Discharge aspect ratio as a function of the integral luminosity in pure N2 (square markers) and synthetic air (triangular markers). Same color markers (green, orange, red) represent discharge events with equivalent luminosity among the two media.
Energies 16 00520 g012
Figure 13. False colored iso-luminosity discharge images for air (left column) and nitrogen (right column).
Energies 16 00520 g013
Figure 14. Thermal energy released (a,b) and luminous emission (c,d) plotted against the ton at three Vd level in air (black markers) and nitrogen (blue markers). Each graph contains a boxplot focused on the interval from 50 μs to 300 μs.
Energies 16 00520 g014
Figure 15. Correlation between E r ¯ and ILg in N2 (blue markers) and synthetic air (black markers) plotted against each activation time at the three voltage levels investigated. Left-hand side graphs report energy and luminosity data concerning the whole analyzed range and their linear fits (black and blue dashed lines). Plots on the right-hand side represent a magnification around the origin of the trend seen on the left-hand side.
Energies 16 00520 g015
Table 1. High-speed camera settings.
FeatureUnitValue
Image Resolutionpixel256 × 256
Spatial Resolutionμm/pixel54
Bit Depthbit8
Exposure Timeμs12.16
Sampling Ratefps79,000
Number of consecutive events recorded-25
Table 2. Test campaign.
Medium typeAir (80%O2–20%N2)
Medium pressure [bar]8
Test performedVd sweepton sweep
Driving voltage [V]VdCIVdMAX354555
Activation time [μs]30050, 100, 150, 200, 250, 300, 600, 900, 1200, 1500
Table 3. Angular coefficients and intercept values corresponding to the linear fits of E r ¯ versus ILg in air and nitrogen.
Driving Voltage Vd [V]Angular Coefficient m [mJ]Intercept q [mJ]
AirNitrogenAirNitrogen
35 V0.0220.0130.400.46
45 V0.0180.0111.120.09
55 V0.0170.0101.190.18
Disclaimer/Publisher’s Note: The statements, opinions and data contained in all publications are solely those of the individual author(s) and contributor(s) and not of MDPI and/or the editor(s). MDPI and/or the editor(s) disclaim responsibility for any injury to people or property resulting from any ideas, methods, instructions or products referred to in the content.

