
How Do Methane, Carbon Dioxide or Fatty Acids Affect Waxy Crude Oils?


1
CERENA, Instituto Superior Técnico, Universidade de Lisboa, 1049-001 Lisboa, Portugal
2
Department of Civil Engineering and Architecture, University of Beira Interior, 6201-001 Covilhã, Portugal
*
Author to whom correspondence should be addressed.
Energies 2023, 16(1), 406; https://doi.org/10.3390/en16010406
Submission received: 18 November 2022
/
Revised: 21 December 2022
/
Accepted: 25 December 2022
/
Published: 29 December 2022
(This article belongs to the Section H1: Petroleum Engineering)
Abstract
:In the oil and gas industry, wax formation and deposition are common problems, particularly during production and transportation. To better understand the expected behaviour of a given waxy crude oil and consequently select the best solution to prevent wax deposition, it is vital to conduct laboratory tests or numerical simulations to model its performance. For a Brazilian oil field, the phase behaviour of 17 crude oils was modelled using Multiflash software. To tune the model, laboratory tests were used, including true boiling point curves and viscosity tests. This study followed two stages: the first allowed characterization of the wax appearance temperature (WAT) and determination of the expected precipitation curves for these crude samples, and the second stage was evaluation of the impact on wax precipitation after the addition of methane (CH4), carbon dioxide (CO2) or fatty acid (CH3(CH2)nCOOH). Results showed that WAT varied between 47.5 °C and 51.6 °C for these crude oil samples at atmospheric pressure, considering the differential scanning calorimetry (DSC) method. Furthermore, the percentage of wax mass formed varied between 13.3% and 18.3%. By adding the aforementioned chemicals as an inhibitor, it is possible to observe a reduction in the paraffin precipitation tendency. Inhibition was compared in terms of effectiveness between the chemicals studied, and it was concluded that adding myristic acid (C14:0), oleic acid (C18:1), palmitic acid (C16:0), or lauric acid (C12:0) was the most effective in reducing the WAT value. In fact, when adding 25% mole fraction, CH4 and CO2 can reduce the WAT value by up to 4%, but the results are strongly dependent on the fluid pressure. Myristic acid was the most effective in reducing the WAT value by up to 5%, and the results were less pressure dependent.
1. Introduction
1.1. Framework and Motivation
Wax deposition is a frequent problem in the oil and gas industry [1,2,3]. Waxes naturally occurring in crude oils are mainly composed of normal paraffin, also known as alkanes. Isomers and cycloparaffins can also be present [4,5]. Due to changes in temperature and pressure, when crude oil flows out of the reservoir, the paraffin dissolved in fluid at reservoir conditions may crystallize as a waxy solid phase. Paraffin precipitation occurs when the fluid temperature drops, and the solvent loses its ability to bind a solution [6].
These waxes build up on oilfield infrastructure, reducing operating efficiency throughout the infrastructure’s productive life. Any surface where crude oil flows, such as a sucker rod, tubing, pump, production facilities, flowlines or pipelines, may become covered with paraffinic crystals that precipitate out of the bulk [7,8,9].
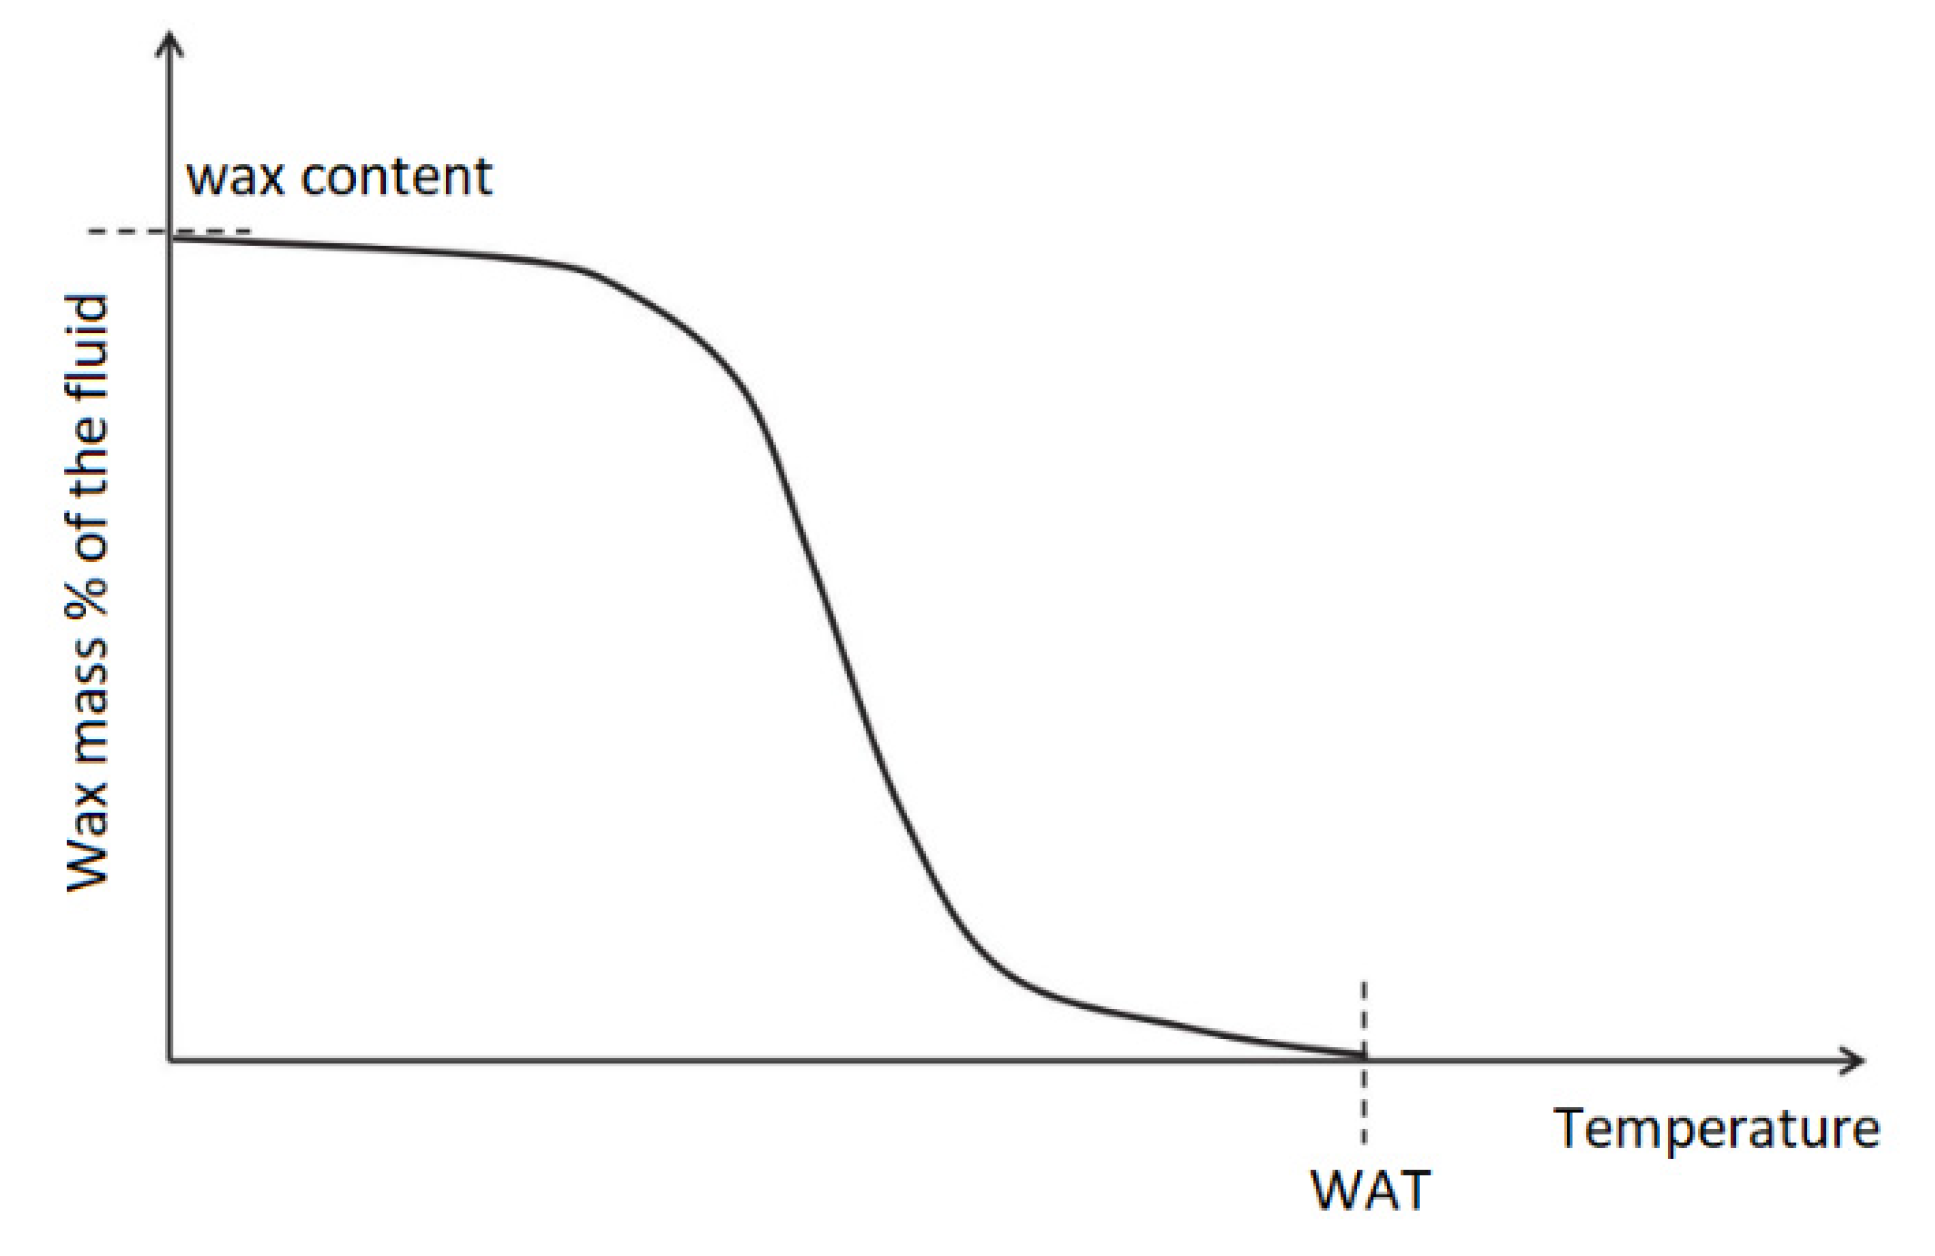
When waxes precipitate out of the crude oil bulk, the various solid fractions do not combine to form a solid solution. Instead, they separately solidify to create what is known as a multi-solid phase. The amount of wax that precipitates is a function of the fluid temperature. Therefore, the wax precipitation curve characterizes the wax content available in crude oil. The highest temperature in a wax precipitation curve corresponds to the wax appearance temperature, at which the wax component crystalises due to crude oil cooling. The precipitation curve often exhibits an asymptotic tendency at low temperatures, corresponding to the wax content. Standards like UOP46–64 or UOP46–85 can be used to measure the total wax content of an oil. Figure 1 represents a typical wax precipitation curve, where the WAT and wax content are identified.
Waxes are saturated hydrocarbons that can precipitate out of the bulk if the temperature is below a specific value, termed wax temperature appearance (WAT), and frequently described as the cloud point. WAT is one of the most significant indicators for determining the wax precipitation potential of crude oil, and it defines the temperature at which cooling results in the appearance of cloudiness [10]. When the temperature reaches this level, wax molecules start to precipitate and emerge in the fluid. Wax is not expected to precipitate if the operating temperature exceeds the cloud point.
Even though WAT measurements have become more accurate recently, measuring them correctly is still challenging. The experimental values can vary when using different methods [11], which means that the cloud point measurements utilized in the industry are often insufficient to characterize the precipitation onset. Since they depend on visual inspection of the wax crystals, the cloud point measuring procedures (ASTM D2500-88 or IP 219/82) are only appropriate for translucid crude oils [12]. Viscometry, differential scanning calorimetry (DSC), cross polar microscopy (CPM), light transmittance (LT), cold finger (CF), Fourier transform (FT-IR), and filter plugging (FP) are used to determine WAT for black oils [10]. Depending on the detectability criteria, different WAT values can be determined according to the experimental technique used. Viscometry, DSC, and CPM are frequently employed methods to quantify the WAT [13,14].
Wax content in crude oils can reach 32.5% globally [5]. If the crude oil’s wax concentration is low to moderate, which means that the wax content ranges between 0% and 10%, the wax-related problems are sporadic, and they are solved as needed [15] using the mitigation methods described by Sousa et al. [16]. If the wax content exceeds 10%, it causes severe flow issues due to wax deposition and demands ongoing treatment to ensure continuing production [15]. The wax content range that can cause flow assurance problems is not universally accepted, though. For instance, Huang et al. claim that crude oils with a WAT greater than the subseafloor temperature, typically approximately 4 °C, and a wax content of 2% (which is relatively low) can cause wax deposition issues [17]. Nevertheless, this problem can also occur in onshore fields [18], with a high economic impact [19].
Wax deposition can be prevented or remediated using a variety of approaches, such as mechanical removal, adding wax inhibitors, heating (hot flooding treatments), thermal isolation, wax-repellent surfaces, biological treatments, pipe-in-pipe, and cold flow [16,20]. In their maintenance program routine, companies have planned interventions to deal with paraffinic crude oils [21].
Predicting the wax appearance temperature and precipitation curve is crucial to properly understand the problem and propose the best solution to avoid paraffin deposition [22,23,24].
This research enabled comprehension of the phase behaviour of 17 crude oils, providing a broad overview of their physical characteristics. The pseudo-compounds were determined by Multiflash software, tuned with laboratory experiments, such as true boiling point curves and viscosity tests. These waxy crude oils were evaluated according to their precipitation curves and the wax appearance temperatures. After carrying out a global characterization of these crudes, wax inhibitors were added to determine which was more efficient. The main innovation of this work is to understand how methane (CH4), carbon dioxide (CO2) or fatty acids (CH3(CH2)nCOOH) affect the wax precipitation.
1.2. The Impact of Adding Methane, Carbon Dioxide and Fatty Acids to Waxy Crude Oils
This subsection summarises the results obtained in the literature review related to the use of methane (CH4), carbon dioxide (CO2) or fatty acids (CH3(CH2)nCOOH) as flow improvers or as chemicals that inhibit wax deposition.
1.2.1. Methane (CH4)
When reservoirs are depleted, solid precipitation from crude oils poses a severe concern for the oil industry. Wax particles found in crude oil, which have a high molecular weight, can precipitate. Injecting gas into the reservoir will increase the reservoir pressure, displace oil, or even vaporize the intermediate fractions of oil, enhancing the oil recovery. Once reservoir oil contacts the injected gas, it can increase the heavy fractions, precipitating the waxes [25]. However, this observation is not consensual. In fact, Vieira et al. evaluated how different gases affected the precipitation of wax crystals for different pressures (1.01, 50, 100, 150 and 200 bar) [26]. The composition of these four gases is presented in Table 1.
The results showed that methane pressurization causes a WAT decrease, whereas nitrogen pressurization raises the WAT value [26]. However, Gas 4 showed the greatest reduction in WAT, indicating that propane and butane have the greatest ability to dissolve waxes [26].
Derakhshan and Shariati predicted the wax precipitation temperature in petroleum reservoirs upon methane injection [25]. The equilibrium compositions of the oil samples and the methane were calculated using material balance and flash calculations [25]. A modified multi-solid-wax model was employed to investigate the impact of crude oil compositions on the wax appearance temperature. The Peng-Robinson equation of state described the liquid and vapour phases. WAT significantly changed due to the alteration of fluid composition changes caused by methane injection [25].
Stock tank oil is frequently used in studies on wax precipitation. However, precipitation may differ significantly in the tubing or flowline because of pressure and composition. For instance, the solubility of light hydrocarbons in the oil may cause the wax appearance temperature to drop due to the composition effect [27]. According to Pan et al., from atmospheric pressure to a saturation pressure of 100 bar, WAT may drop by as much as 15 K [27].
Even though the current investigation focuses on dead oil samples, it is essential to consider how methane injection may also affect wax deposition in a gas reservoir. There are situations in which, in the initial conditions of the reservoir, the fluid is at high pressure and temperature in the form of gas. As the fluid is produced, the pressure decreases, and condensation begins to occur, which means that a part of the gas liquefies. As production continues, the pressure will continue to decrease until the liquefied gas changes to gas, called retrograde condensation. Retrograde condensation may occasionally produce heavy organic deposition for methane-rich fluids, even for fluids with minimal heavy component amounts [28]. As a result, wax appearance temperature may rise due to gas depressurization [28,29]. To generalize measurements made on stock tank oils to live oils, one must understand the effects of pressure and gas dissolution on phase behaviour [28]. To investigate this phenomenon, Pauly et al. suggested that wax appearance temperature be determined under high pressure for different fluid types, spanning from condensates to heavy crude oils [28]. They employed synthetic waxes with an odd number of carbon atoms in their study to investigate the effect of methane dissolution. Many prior studies used mixtures composed of methane and paraffin with an even number of carbon atoms (n-hexadecane [30], n-eicosane [31,32], tetracosane [33] and triacontane [34]). However, Pauly et al. concluded that the phase diagram obtained with the system composed of methane and heptadecane was similar to those obtained with an even number of carbon atoms [28].
1.2.2. Carbon Dioxide (CO2)
Wax deposition inhibition methods and treatments can be held in various procedures, one of which is adding chemicals [16]. There are several ways that carbon dioxide and oil constituents might interact [35]. In particular, it is well known that injection of carbon dioxide causes precipitation of asphaltene. Enhanced oil recovery by carbon dioxide flooding is more successful for recovery in non-asphaltenic oil than in asphaltenic oil [36].
Hosseinipour et al. investigated the impact of CO2 on wax precipitation [37]. In that study, the wax formation likelihood of crude oils from Sudanese and Malaysian oil was examined when injecting CO2. Differential scanning calorimetry (DSC) was used to determine the WAT values. The findings indicated that CO2 injection lowered the crude oil’s WAT, and the magnitude of its impact depends on the pressure of CO2 gas injection [37]. Such a conclusion supports the notion that CO2 might prevent wax deposition. Furthermore, this solution has a double benefit since it allows carbon storage, decreasing the amount of CO2 released into the atmosphere [38].
The impact of carbon dioxide on heavy crude oil has been researched by Hu et al. [39]. Their study demonstrated that crude oil saturated with CO2 significantly reduces its viscosity at a specific temperature and pressure.
1.2.3. Fatty Acids
One of the most common techniques used in the oil and gas industry to prevent wax deposition is the addition of chemical inhibitors [16,40]. In the 1980s, the first generation of wax inhibitors was polymer-based, followed in the 1990s by biosurfactants. Since most wax inhibitors have several drawbacks, including their high cost and potentially damaging environmental effects, green wax-inhibiting agents have recently been used to prevent wax deposition. This section will describe how fatty acids (CH3(CH2)nCOOH) have been used in the oil and gas industry. These organic compounds are environmentally friendly and can easily be found in biomass. However, it is important to emphasize that these fatty acids, used as flow improvers, must be obtained from non-edible vegetables or waste residues. In this way, it is guaranteed that its production will not compete with the food industry. In fact, wax inhibitors made from plants or agricultural products are currently receiving more interest from researchers worldwide. Fatty acids behave as an active component in inhibiting wax deposition [41,42]. The significant advantage of using fatty acids rather than other chemicals is that it is easier to remediate the contaminated groundwater [41].
Natural plant-based inhibitors used to reduce wax deposition were systematized by Alpandi et al. [41]. Natural plant seed oils are being used as a source of fatty acids, and several pieces of research on the effectiveness of oleic acid have been performed [41]. In comparison to synthetic polymer-based, oleic acid-based wax inhibitors exhibit excellent performance and have the advantage of not harming the marine habitat [41]. Studies on oleic acid-based wax inhibitors have shown that they have exceptional flow-improving capabilities, especially at high concentrations, as well as the ability to reduce the crude oil viscosity and lower the pour point of crude oil [43,44], which means the temperature below which the fluid loses its capacity to flow. Furthermore, results showed that the behaviour of oleic acid-based wax inhibitors depends on the crude oil composition [41,43].
Patel et al. investigated the influence of oleic acid-based polymeric flow improvers for Langhnaj crude oil in North Gujarat, India [44]. Castor seeds and sunflower oil were also investigated as an inhibitor of wax deposition in Indian crude oil, and the results showed a reduction in wax deposition [45].
Castor, jatropha, and rubber seed oils were utilized as flow improvers, proving that they could lower the pour point of Nigerian waxy crude oils, preventing wax deposition [46,47,48]. Castor seed oil, tested in Akinyemi’s research, was composed of 89.3% ricinoleic acid (), 4.73% oleic acid (), and 2.96% linoleic acid (), by weight [46]. Jatropha seed oil had 0% ricinoleic, 43.11% oleic, and 39.12% linoleic acids [46]. Rubber seed oil had 0% ricinoleic, 18.30% oleic acid, 38.20% linoleic acid, and 24.10% linolenic acid () [46]. Akinyemi et al. concluded that higher paraffin inhibition efficiency due to the addition of these seed oils was 77.7% for castor seed oil, 73.5% for jatropha seed oil, and 69.9% for rubber seed oil [46]. Notably, these acids are unsaturated fatty acids with double bonds and polar group endings, which are crucial in preventing the formation of paraffin wax [47].
In a related investigation, Akinyemi et al. found that by employing a mixture of 60% jatropha seed oil with 40% castor seed oil by volume, it would be possible to achieve a wax inhibition efficiency up to 79.1%, enhancing the flow of Nigerian waxy crude oil [47]. These wax inhibitors are non-toxic to the environment, and non-edible, which makes them attractive to be used as flow improvers [46,47] and wax preventers.
Because there are so many palm oil plants in Asia, using palm oil is considerably more affordable and practical to prevent wax deposition in that region. Ragunathan et al. investigated the effectiveness of less expensive organic wax inhibitors in Malaysian waxy crude oil [49]. Studies on palm kernel oil and crude palm oil have been conducted to determine how they affected rheology and wax deposition [49,50]. The type and quantity of each fatty acid differs depending on the origin of the natural organic oil [51]. While crude palm oil is composed of 45.8% palmitic acid (), 44.1% oleic acid (), 12.5% linoleic acid (), 5.4% stearic acid (), and 1.5% of myristic acid (); the crude palm kernel oil composition is essentially 48.2% lauric acid (), 16.5% myristic acid (), 15.3% oleic acid (), and 8.4% palmitic acid ( [52]. According to studies by Ragunathan et al., the average paraffin inhibition efficiency is higher for crude palm oil than crude palm kernel oil, mainly due to the presence of natural oleic acid. Due to their capacity to create a barrier, both palm oil additives can impede wax deposition and prevent the structure of wax crystals from interconnecting [49]. They examined whether natural plant-based additive concentrations resulted in the highest average paraffin inhibition efficiency, which was 81.67% when palm oil was added at a concentration of 1% [49].
Another example of how vegetable oils can effectively be used as flow improvers was given by Zhang et al., who used rapeseed oil, soybean oil and castor oil to produce hydroxylmethyl triamide, and performed tests on crude oils from Yanchang Oilfield [53].
To determine the impact of Mt Oversea Mckyle Arab crude oil, Ragunathan et al. studied the rheological behaviour of crude oil in the presence of palm oil. They concluded that it is the best inhibitor to use [52].
The identified examples show that fatty acids can act as flow improvers. However, extensive analyses of different fatty acids have yet to be performed to understand their potential to reduce the wax precipitation tendency in waxy crude oils.
2. Methodology
An integrated pressure volume temperature (PVT) model was utilized to analyse the crude oil and its physical characteristics. This model enables simulation of the phase behaviour of crude oils and complex mixtures.
For computing oil–wax equilibria, several engineering models can be employed [11,54,55,56,57,58,59]. Coutinho’s model was used [58,59] to predict the wax appearance temperature. Huang et al. claim that Coutinho’s model is the most thermodynamically accurate approach for modelling wax deposition [17]. It considers the nonideality of the liquid phase since it applies the Flory free volume theory and UNIQUAC functional-group activity coefficients (UNIFAC) method. Coutinho’s model needs input parameters on the constituent paraffin components of the fluid. The n-paraffin distribution significantly affects the model predictions. Wax is represented as a solid solution in Coutinho’s model. The Wilson and universal quasi-chemical theory variants of the model exist. The Wilson model, which approximates the wax as a single solid solution, is the method that is typically chosen in Multiflash [60]. Wilson’s method is recommended for general technical applications since it is straightforward to implement and provides reasonable estimations either for the wax appearance temperature or the wax content for different temperatures.
To estimate the composition of the wax phase, Multiflash uses the known thermal properties of n-paraffins, such as their normal melting temperature and enthalpy of melting. The model needs these pseudo compounds to be clearly defined in the fluid model to estimate the wax appearance temperature and the wax content. Therefore, since n-paraffin concentration measures were not available, it was necessary to estimate the n-paraffin distribution. In Multiflash, the Redlich–Kwong–Soave (RKS) equation of state is defined as default.
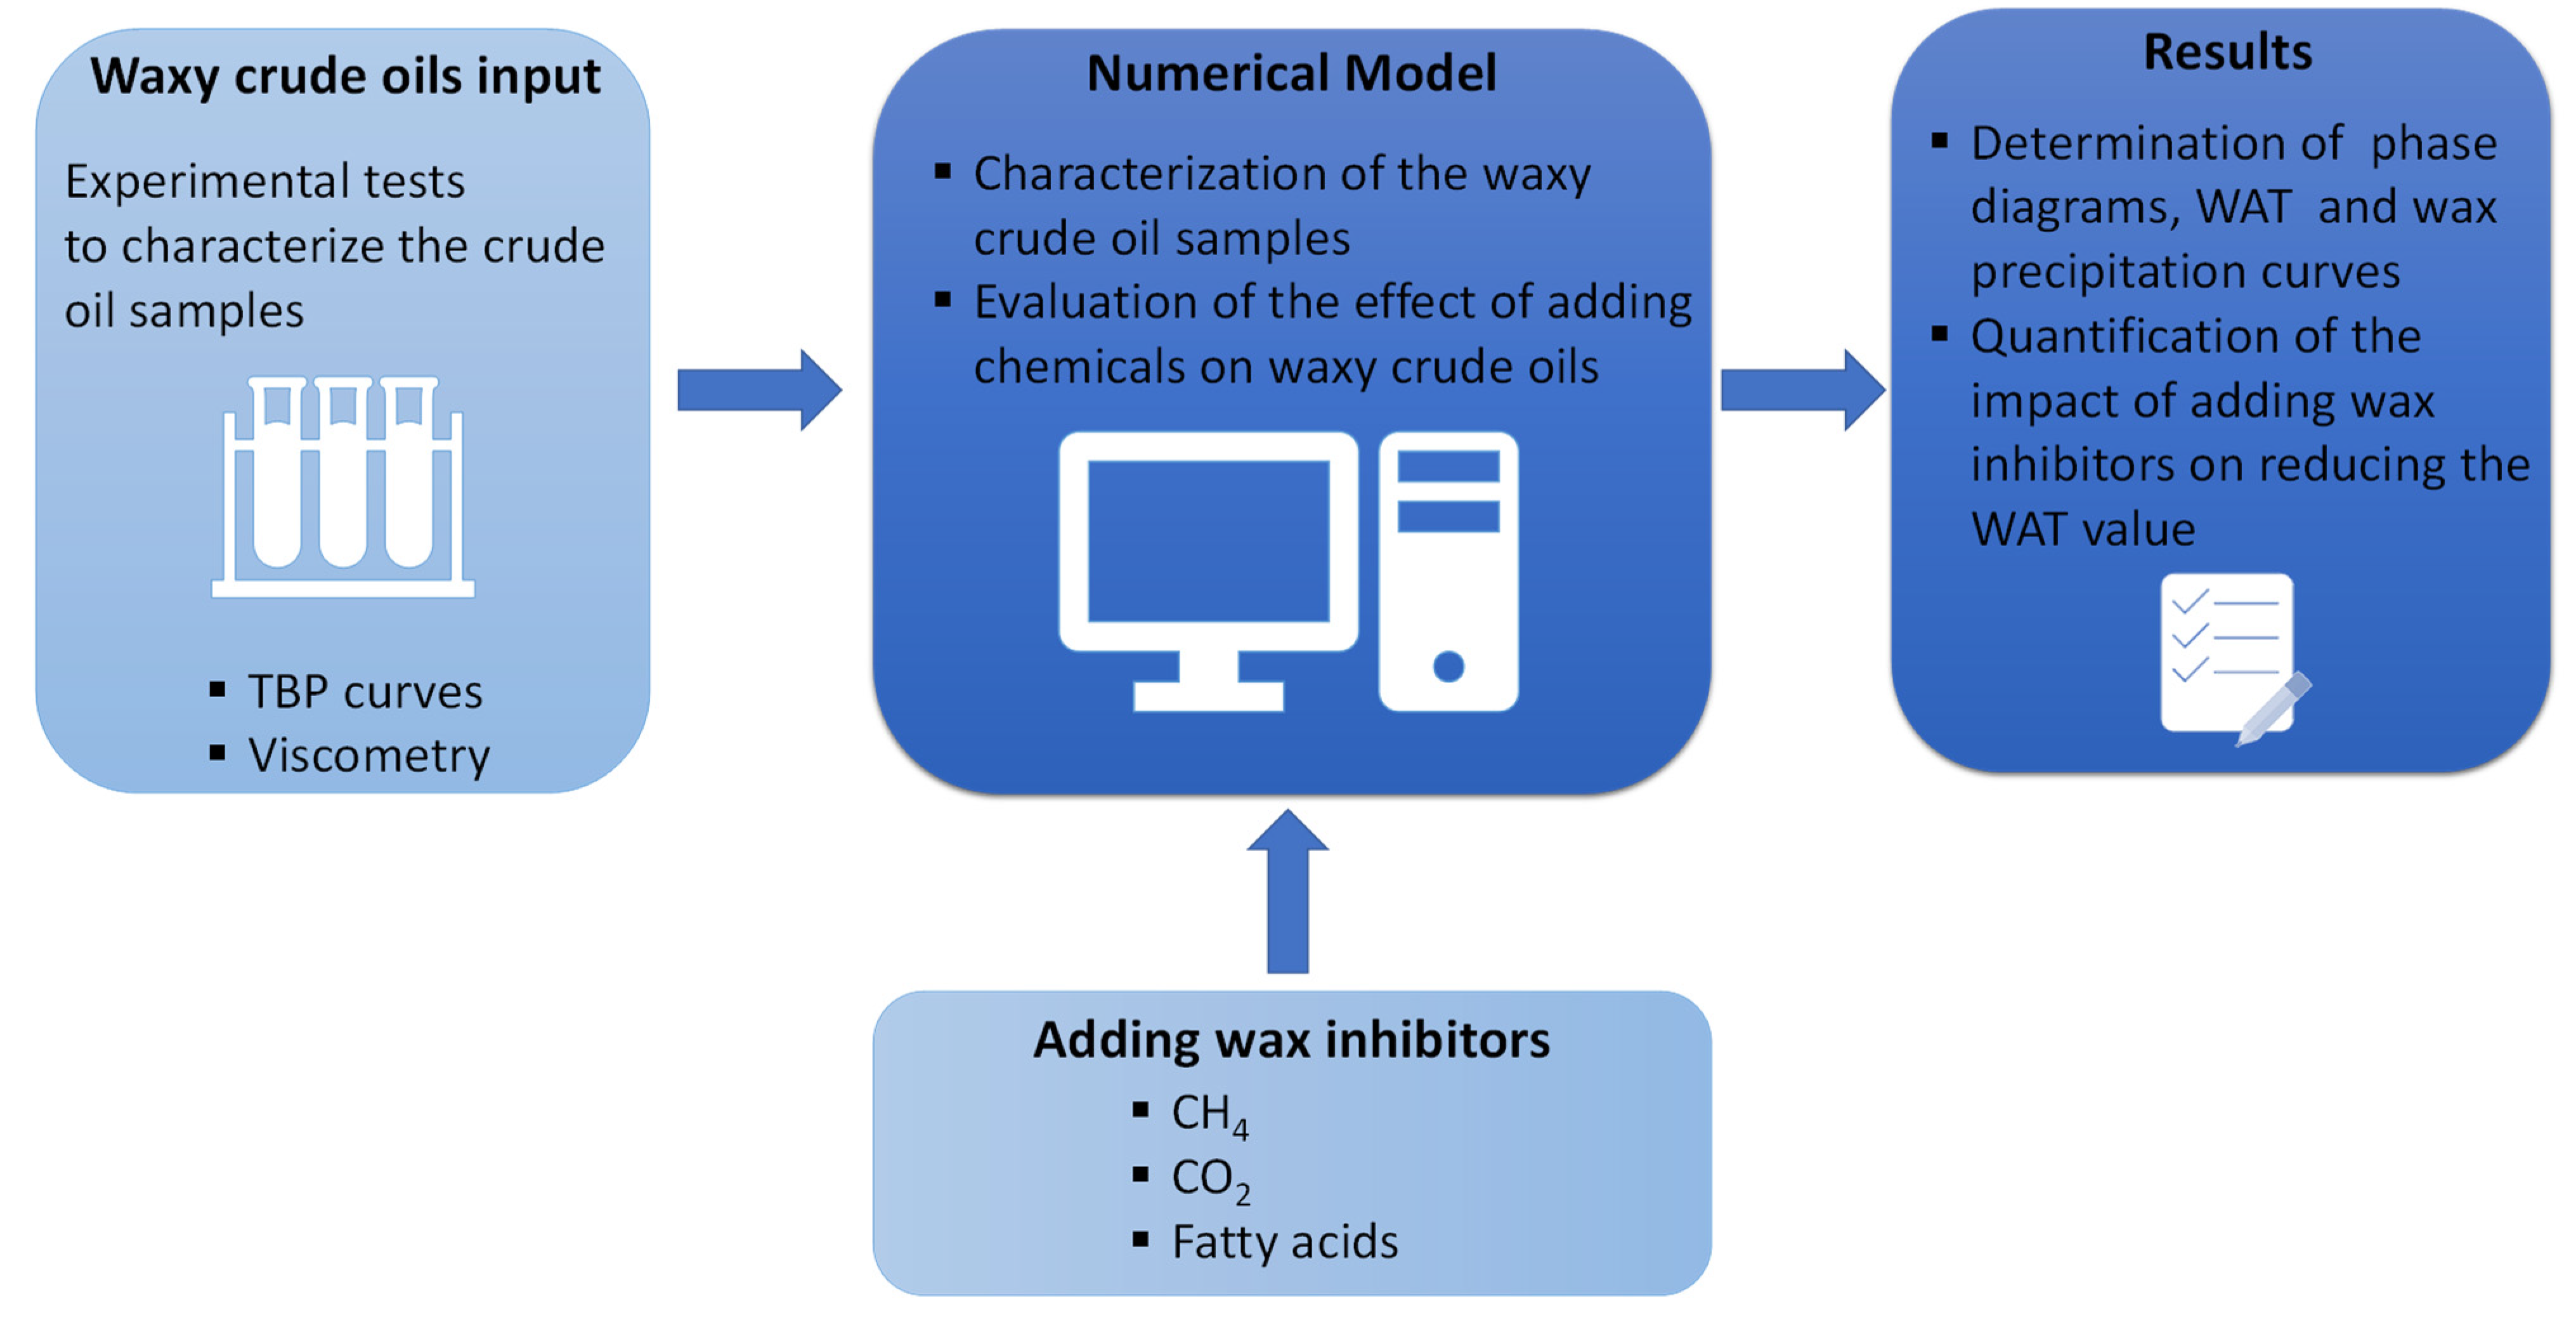
Figure 2 depicts the methodology used to characterize seventeen waxy crude oil samples and assess the impact on wax appearance temperature for each and when adding chemicals that are hypothesized to be wax inhibitors or flow improvers.
Crude oils are complex mixtures of several components whose exact composition is challenging to obtain. In this case, using Multiflash, experimental results were used as input data to mimic the fluid behaviour in the numerical model. Particularly, true boiling point (TBP) curves and viscometry data were included. These experimental data were provided by the oil company for seventeen crude oil samples which belong to the same oil field.
TBP curves show the percentage weight or volume for a specific boiling temperature. Their information allows the software to indirectly estimate the composition of crude oil. Getting the components’ mass spectra requires the partial separation of the crude oil’s basic chemical components for different temperature thresholds. This method consists of a distillation operation for several temperature stages. To obtain the TBP and density curves, crude oil was fractionated in an automatic distillation unit at atmospheric pressure until reaching 328 °C in steam. The procedure is based on the ASTM D 2892 method. The residue at 328 °C was then distilled in the same unit at a pressure of 2 mm Hg, until it reached 400 °C in steam. This residue was distilled in a Pot Still automatic distillation unit, following the ASTM D 5236 standard, at a pressure of 1.0 mm Hg, until reaching 450 °C in steam. The residue at 450 °C was distilled in the same unit at a pressure of 0.5 mm Hg, until reaching 487 °C in steam. Finally, the residue is distilled in the same unit at a pressure of 0.2 mm Hg, until it reaches 574 °C in steam.
The Multiflash model employs analytical protocols to define the pseudo component using that information. After determining the pseudo components of the crude oil samples, the viscosity data were included to tune the numerical model in Multiflash.
To obtain the crude oil viscosity as a function of the temperature, a viscometer with a cryostat is needed to control the sample temperature. To guarantee the fluid homogeneity and fluidity, it is necessary to preheat the sample. The crude oil can be preheated in a water bath using a heating plate. This thermal conditioning ensures that the sample is entirely in a liquid phase, guaranteeing that the wax that may have precipitated is liquefied. After performing this initial procedure, a crude oil sample is added to the viscometer compartment. The rotational viscometer allows the reading of dynamic viscosity in centipoise. It measures the viscosity through the torsional effort required to turn a spindle immersed in the sample for a constant rotational speed. The spindle turning speed is chosen to guarantee that the torsional resistance is according to the parameters defined in the ASTM D4402 standard [61], between 10% and 98%. If the torsional resistance value is above 98%, it is necessary to decrease the rotation speed. On the contrary, if the value is less than 10%, it is necessary to increase the rotation speed. Before measuring each viscosity value, it is required to guarantee a stabilized temperature in the viscometer compartment.
After inputting these parameters in the model, several results were obtained for the seventeen crude oils, including the PVT behaviour, the phase diagram, the wax precipitation curve, and the wax appearance temperature. Furthermore, the effect of pressure on the wax precipitation was investigated. The simulation conditions were defined, varying the pressure between 1 atm and 200 atm, for each crude oil sample.
The last step was to examine how the addition of specific chemicals, such as methane (CH4), carbon dioxide (CO2) and fatty acids (-COOH), can affect the way these crude oils behave. The first two, CH4 and CO2, were chosen because they are greenhouse gases that, if utilized, would have a double effect on the system, beyond the hypothesis raised about their potential impact on preventing wax precipitation since they are lighter components. On the one hand, they could increase the reservoir pressure, contributing to enhancing oil recovery if they were injected; on the other hand, since they are greenhouse gases, which means that they are atmospheric gases that both absorb and emit heat, it would be positive to capture and inject them in the geological layers, preventing their environmental impact on the atmosphere. Fatty acids were studied since they act as flow improvers, and there are not enough scientific studies that evaluate how they would impact wax precipitation.
An evaluation and comparison of the effect of the wax appearance temperature was performed before and after injecting those chemicals. To better understand the impact on all the samples, a dimensionless analysis was performed using Equation (1)
If this parameter is less than 1, the WAT value has decreased after adding a certain wax inhibitor.
3. Case Study—Characterization of Waxy Crude Oils
Data made available on this section depicts the waxy crude oils taken as case studies. Information has been attained with profuse laboratory testing. Hence, the following full results are also deemed to ensure reproducibility.
3.1. Density, TBP and Viscosity
The crude oil samples were collected from onshore wells in the Brazilian basin. Table 2 summarises the American Petroleum Institute gravity (°API) of the crude oil samples.
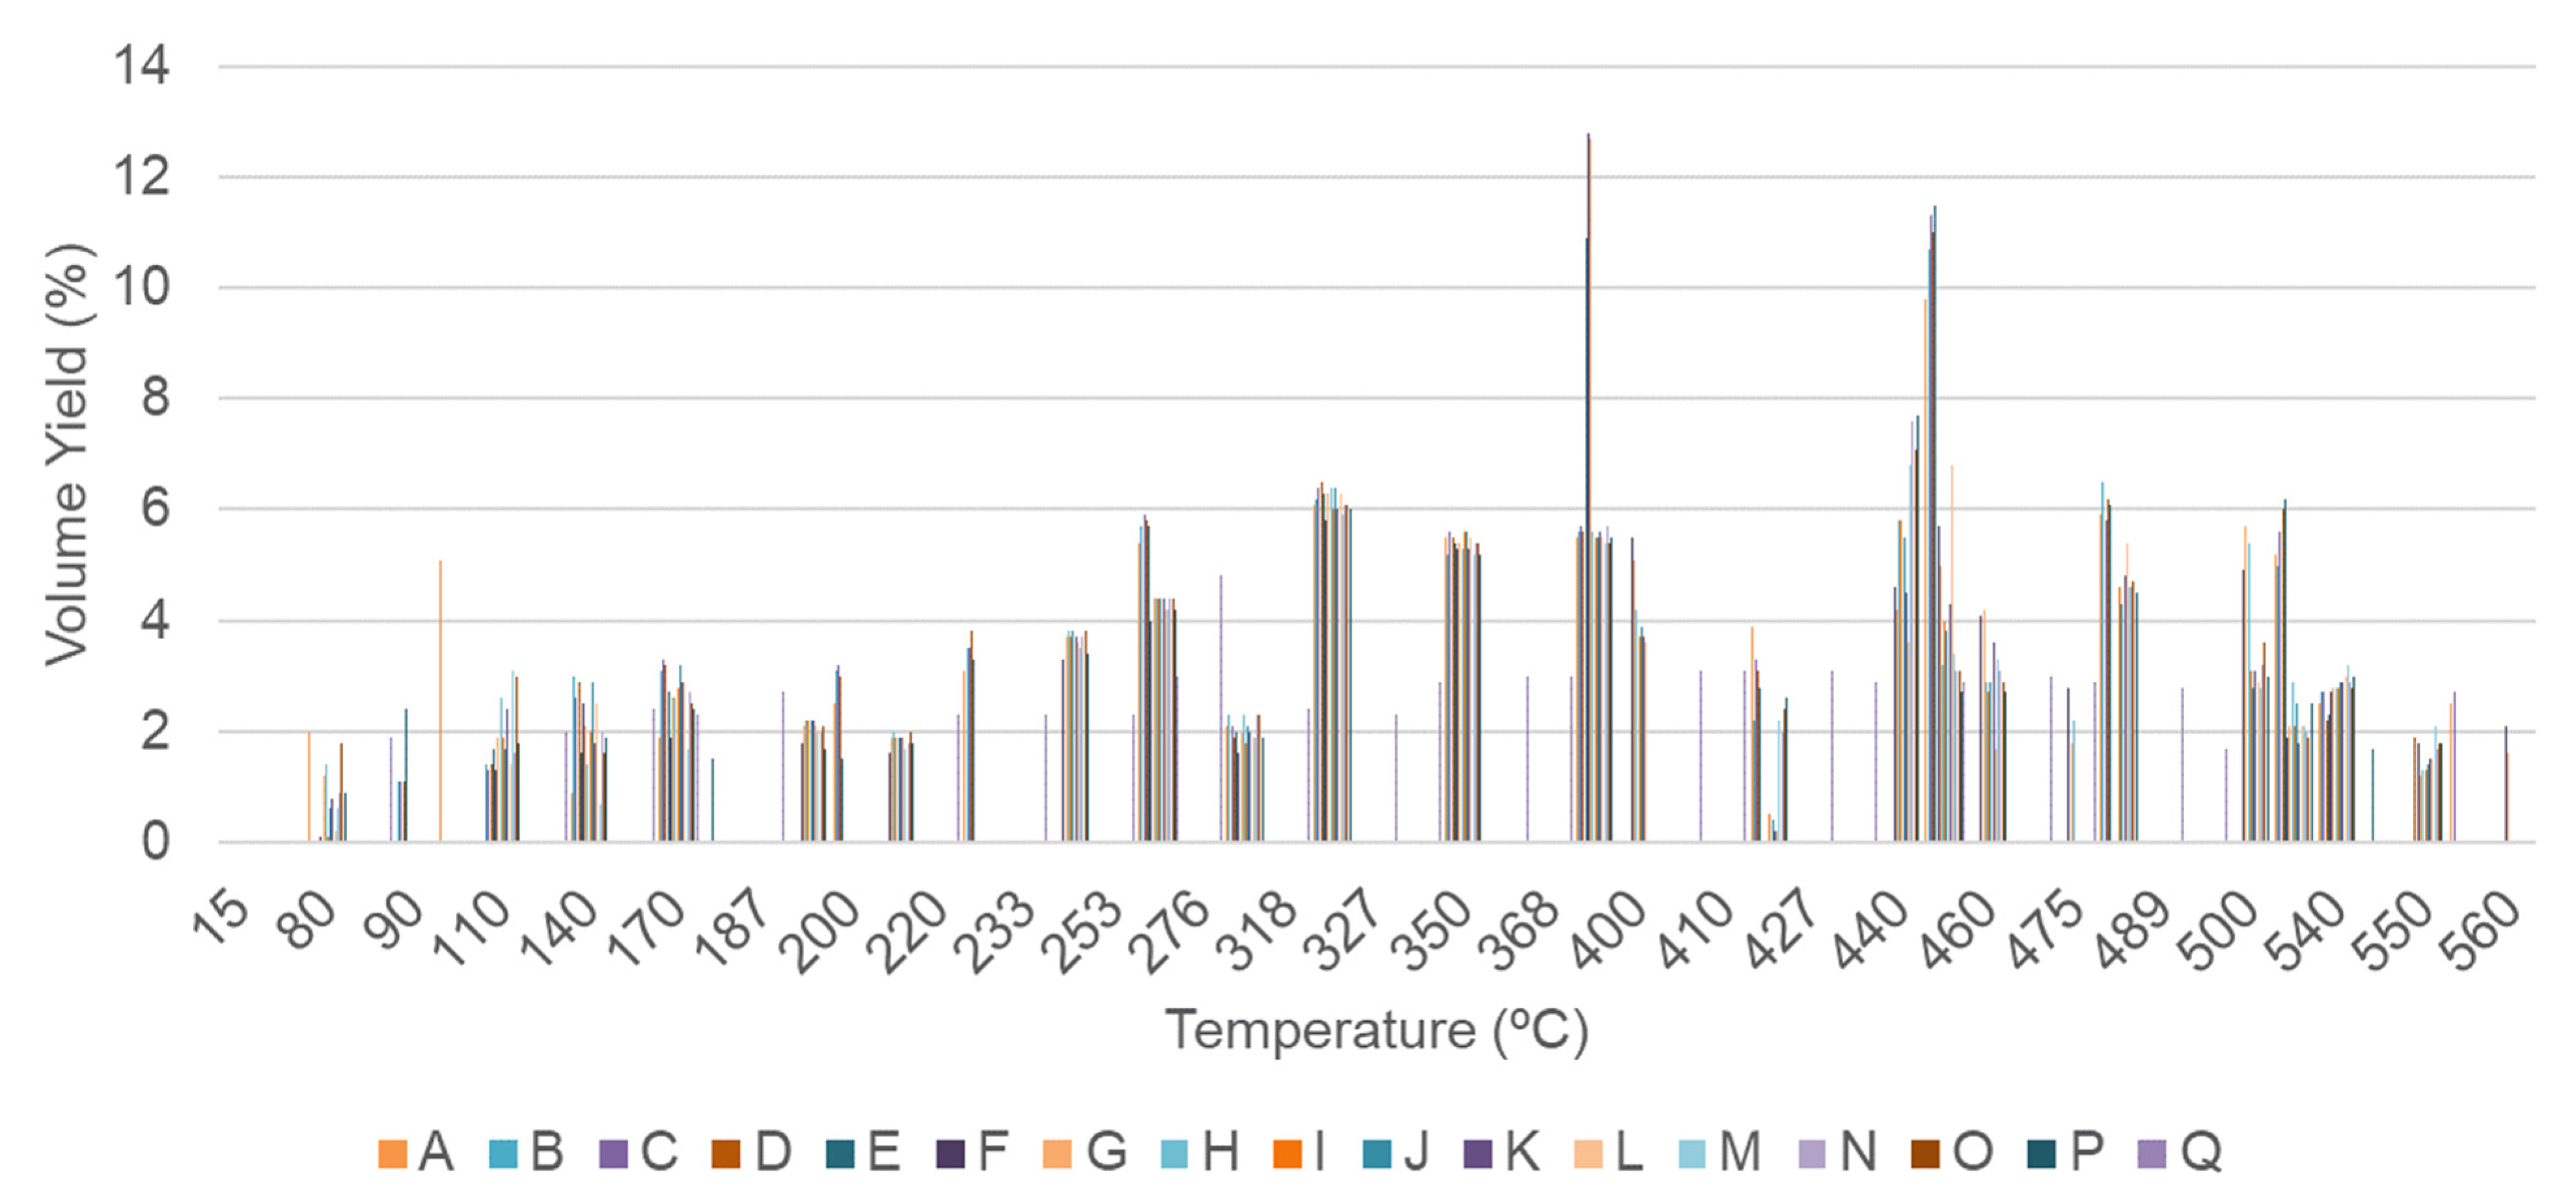
The distillation curves were obtained using the TBP method, according to the methodology described previously. Figure 3 represents the volume yield as a function of the true boiling point (TBP) for the 17 samples (A to Q).
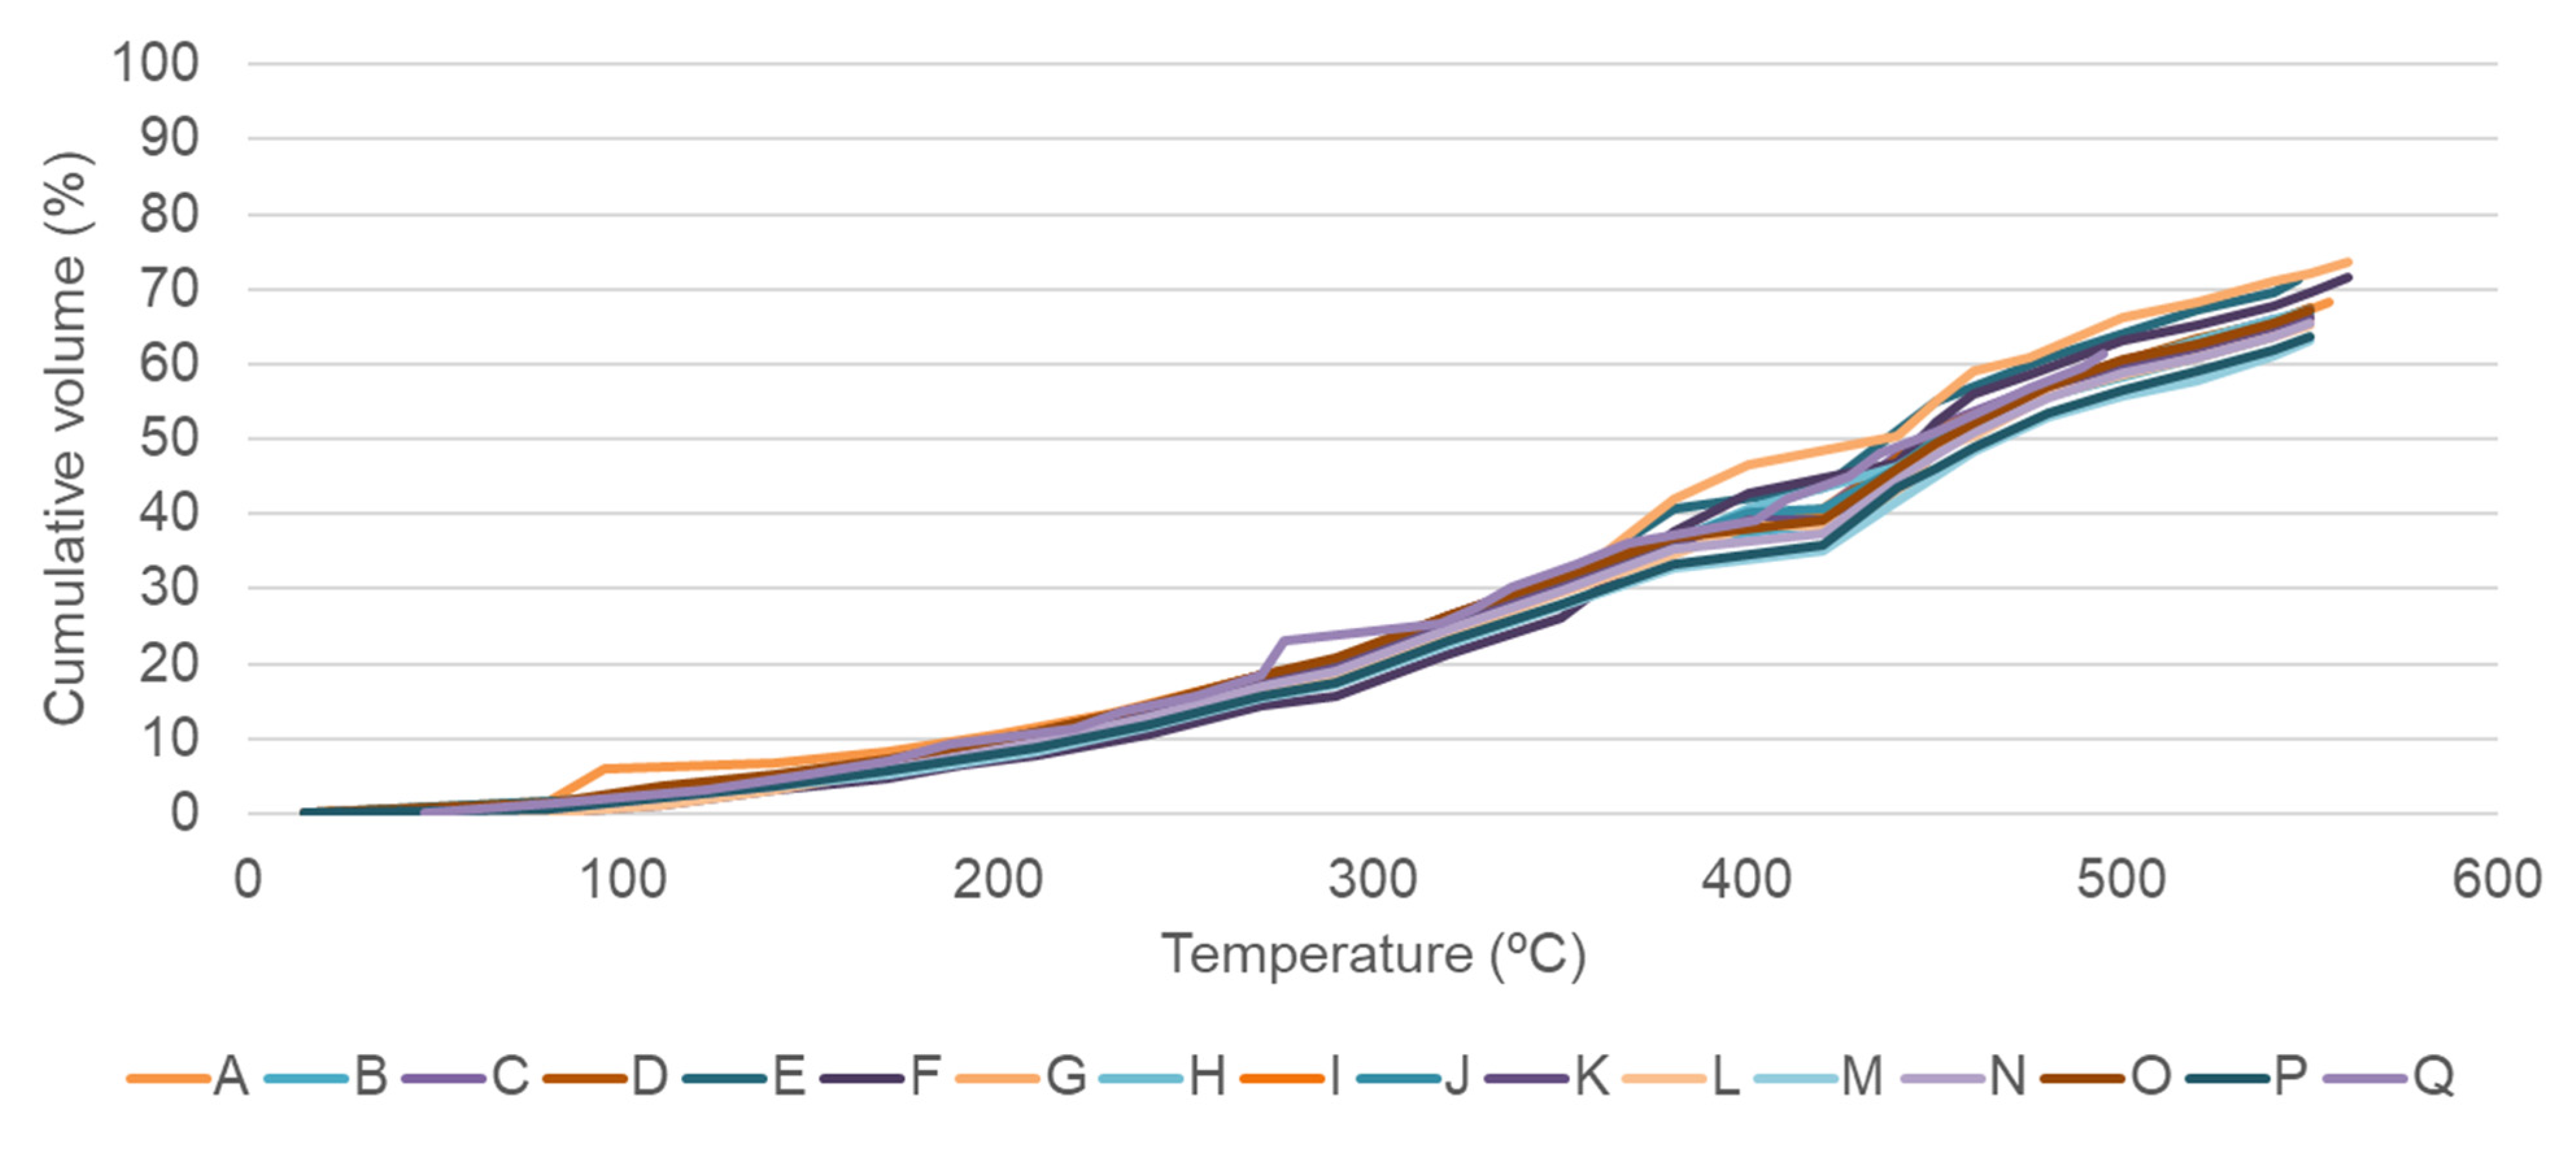
As it is possible to see, the fluid volume percentage follows similar distribution for all the samples. Figure 4 represents the TBP curves obtained by plotting the cumulative volume distillation fraction with increasing temperature.
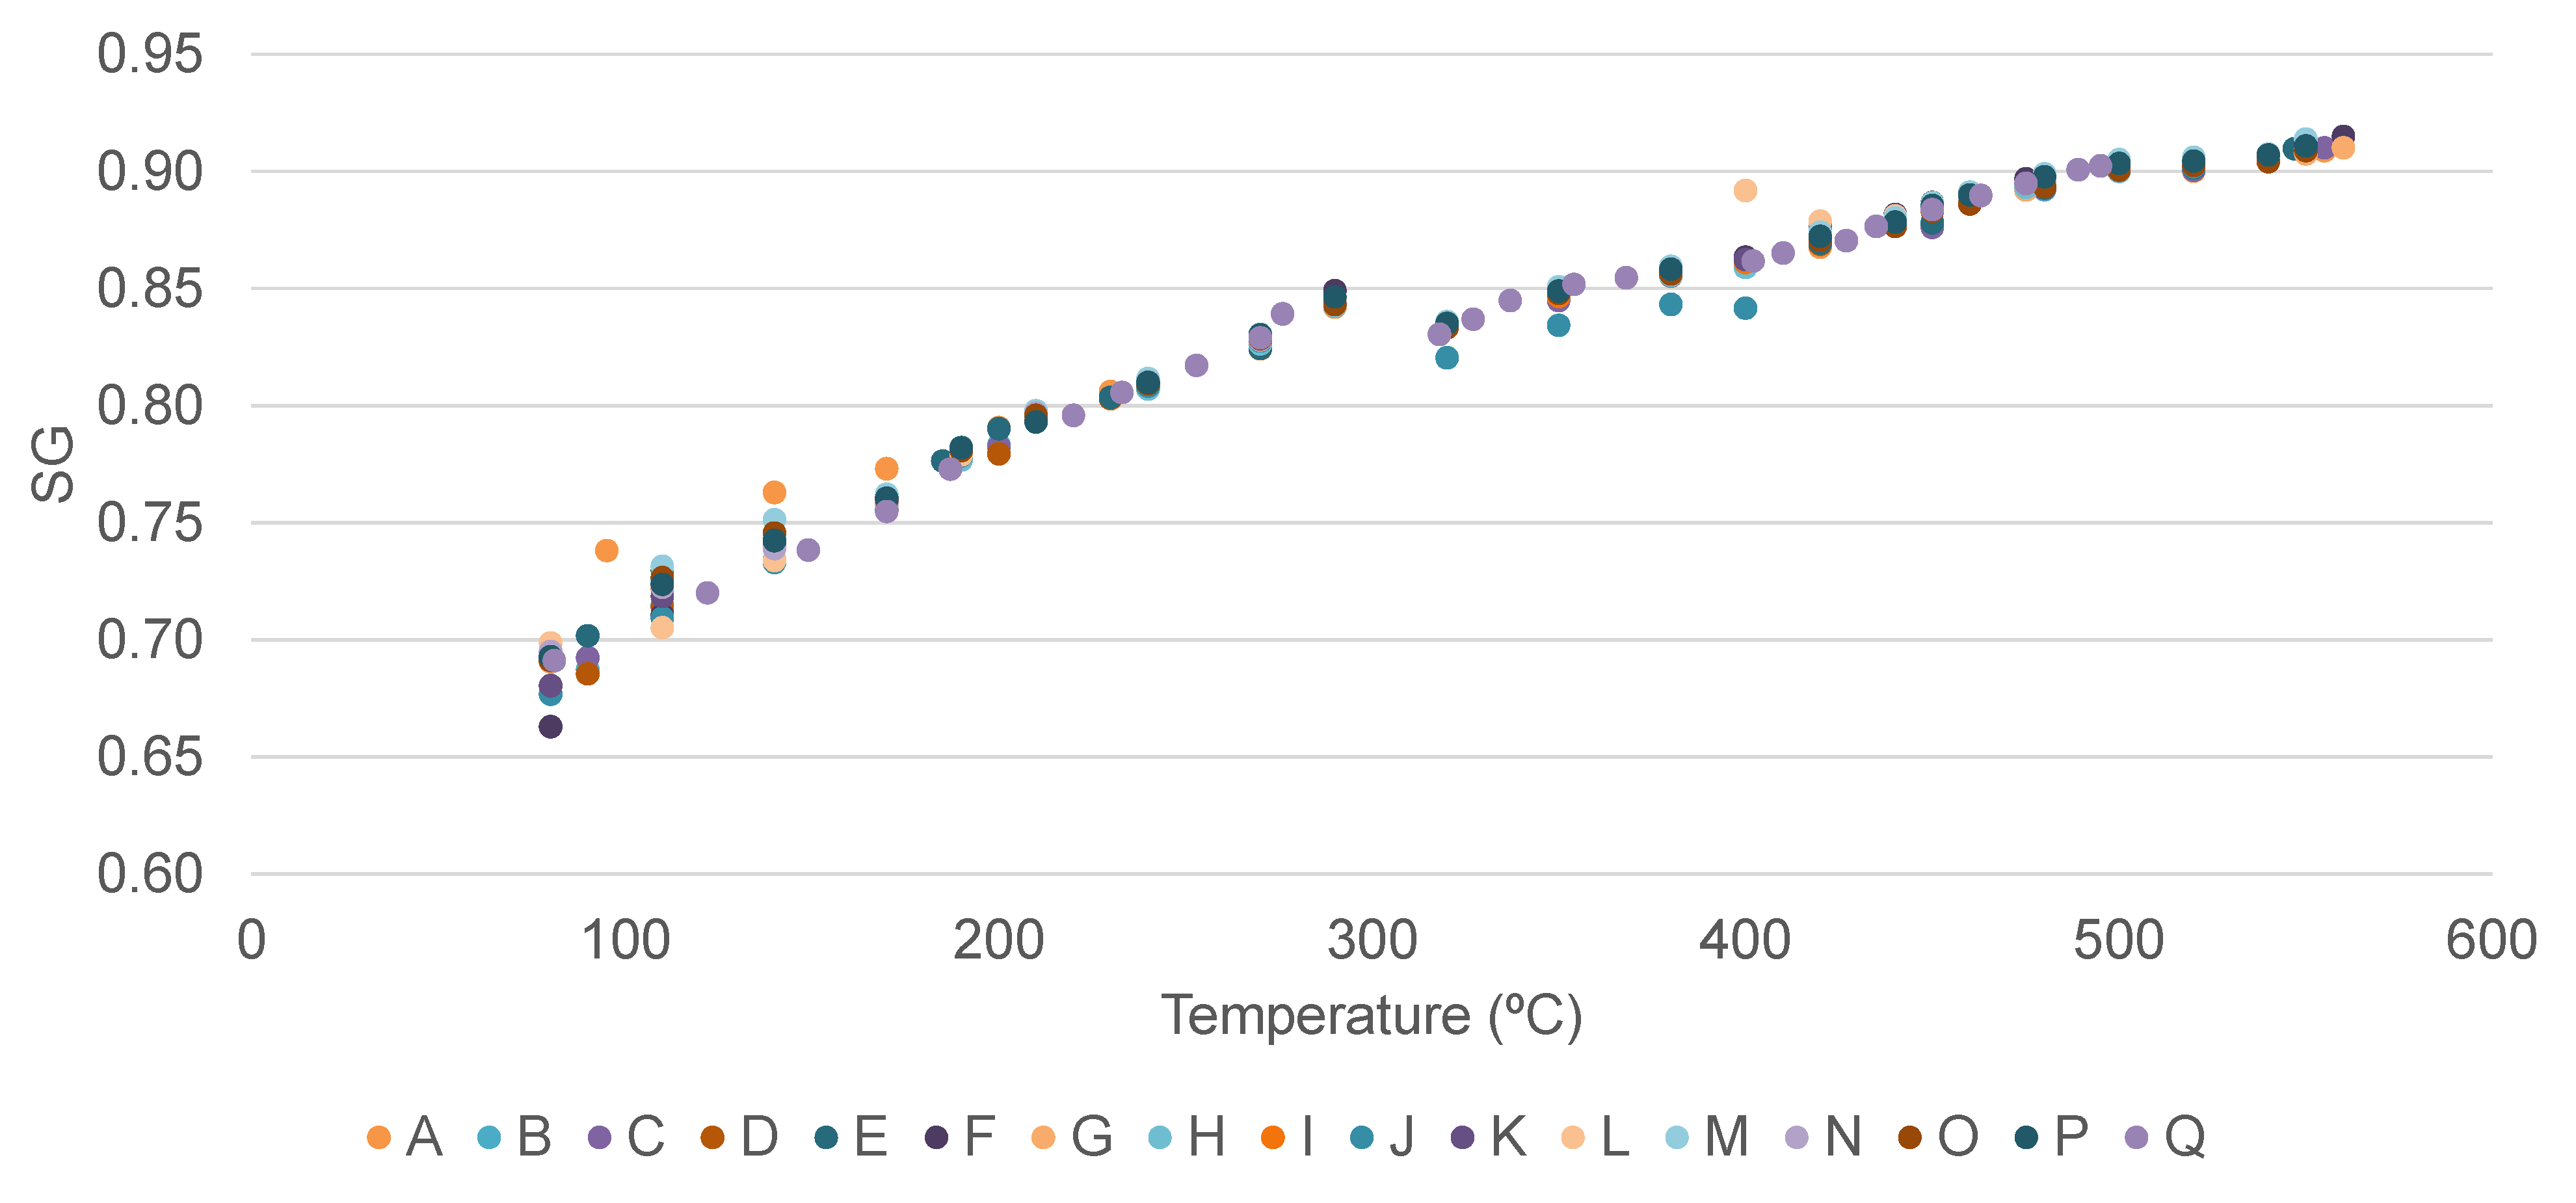
Figure 5 represents the specific gravity for each fraction as a temperature function.
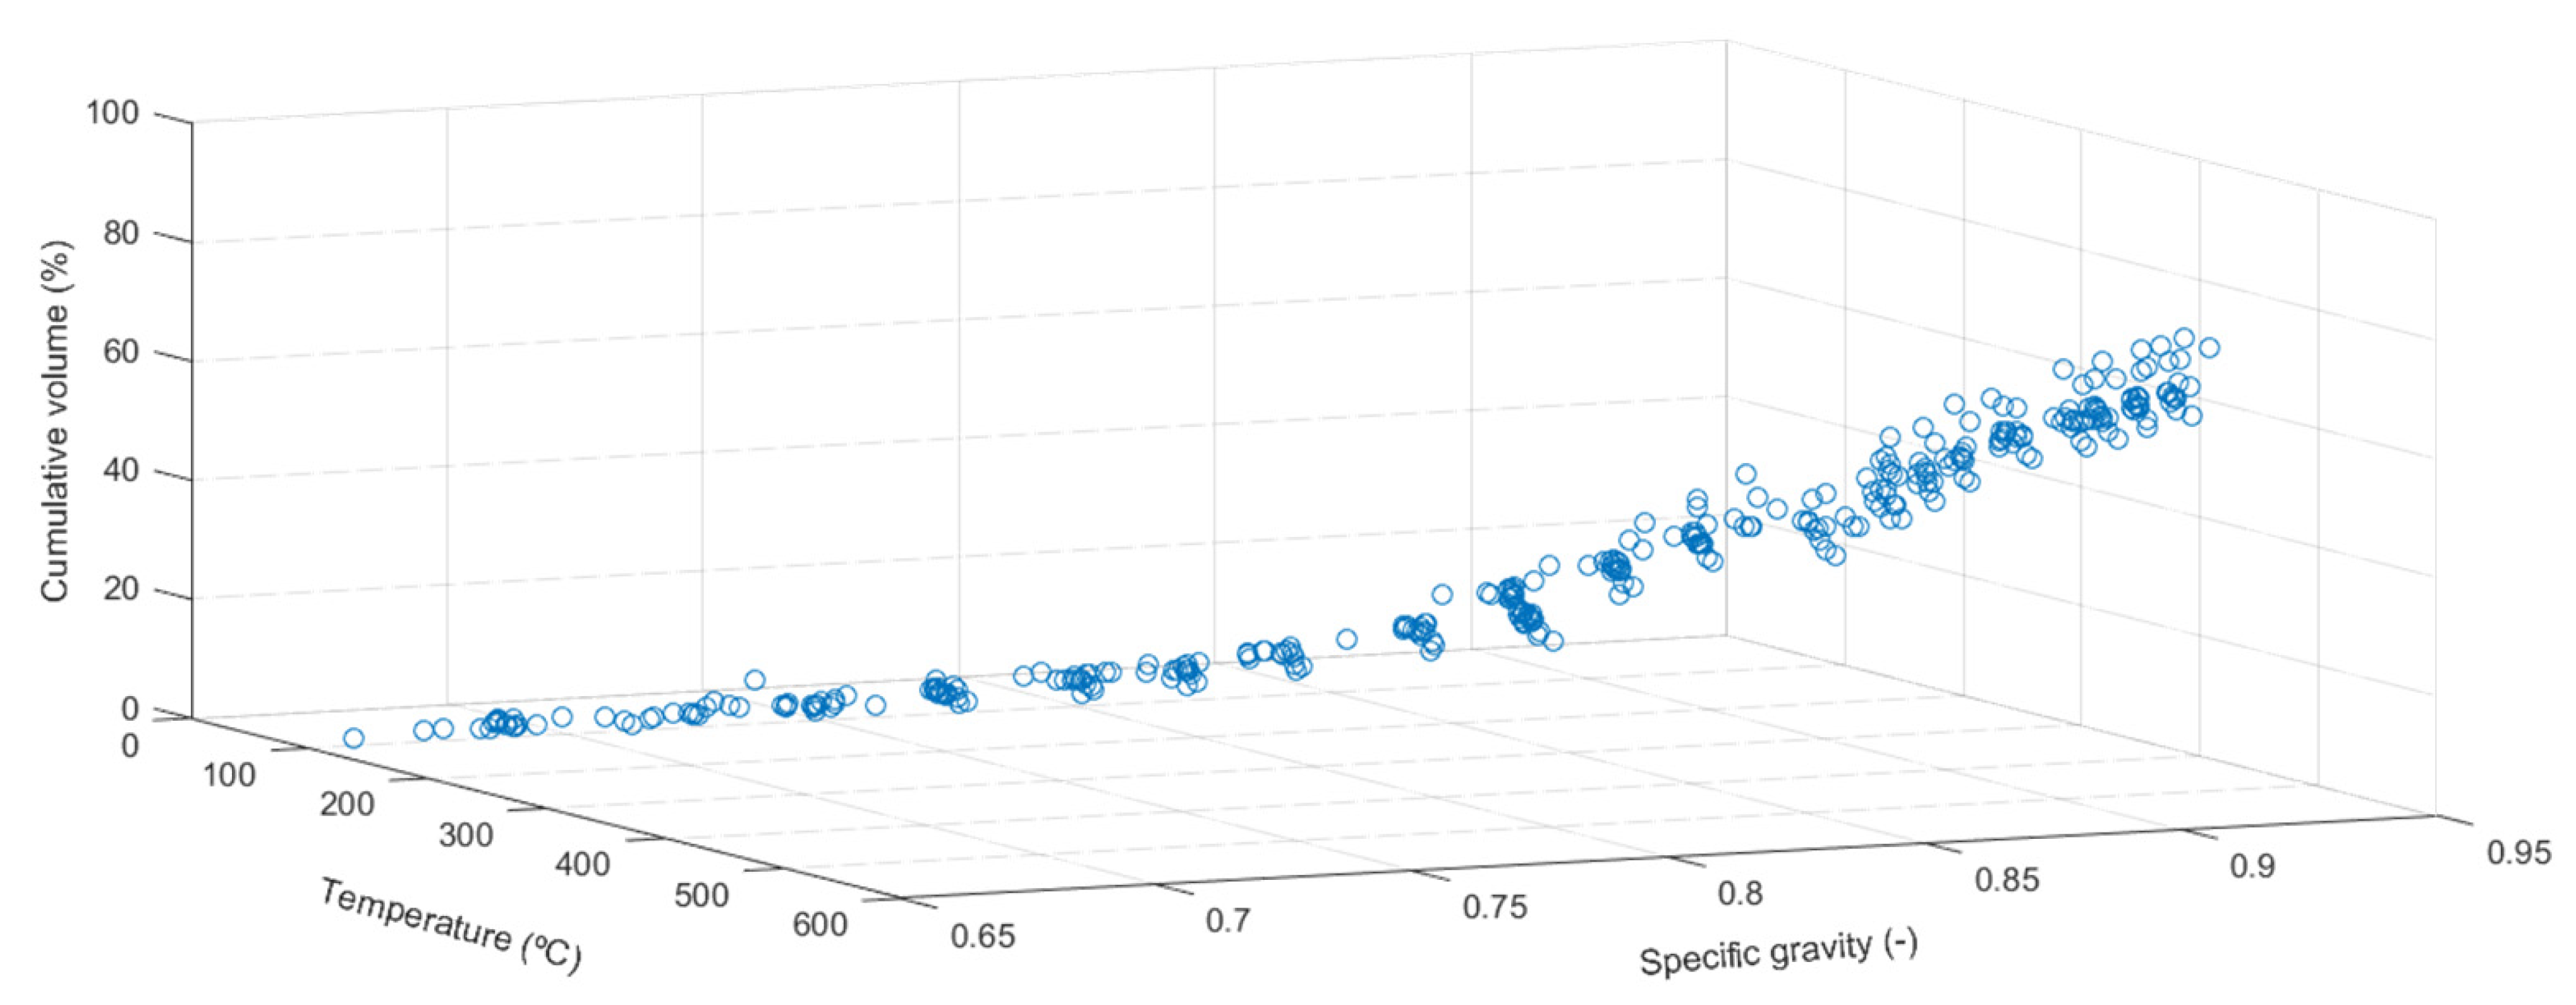
Figure 6 represents each fraction’s cumulative volume and specific gravity as a function of the TBP.
For these waxy crude oil samples, it is possible to obtain Equation (2), which defines the cumulative volume as a function of the TBP with an R-squared value of 0.9801.
Equation (3) defines the specific gravity values, of each fraction, as a function of the TBP, with an R-squared value of 0.9805.
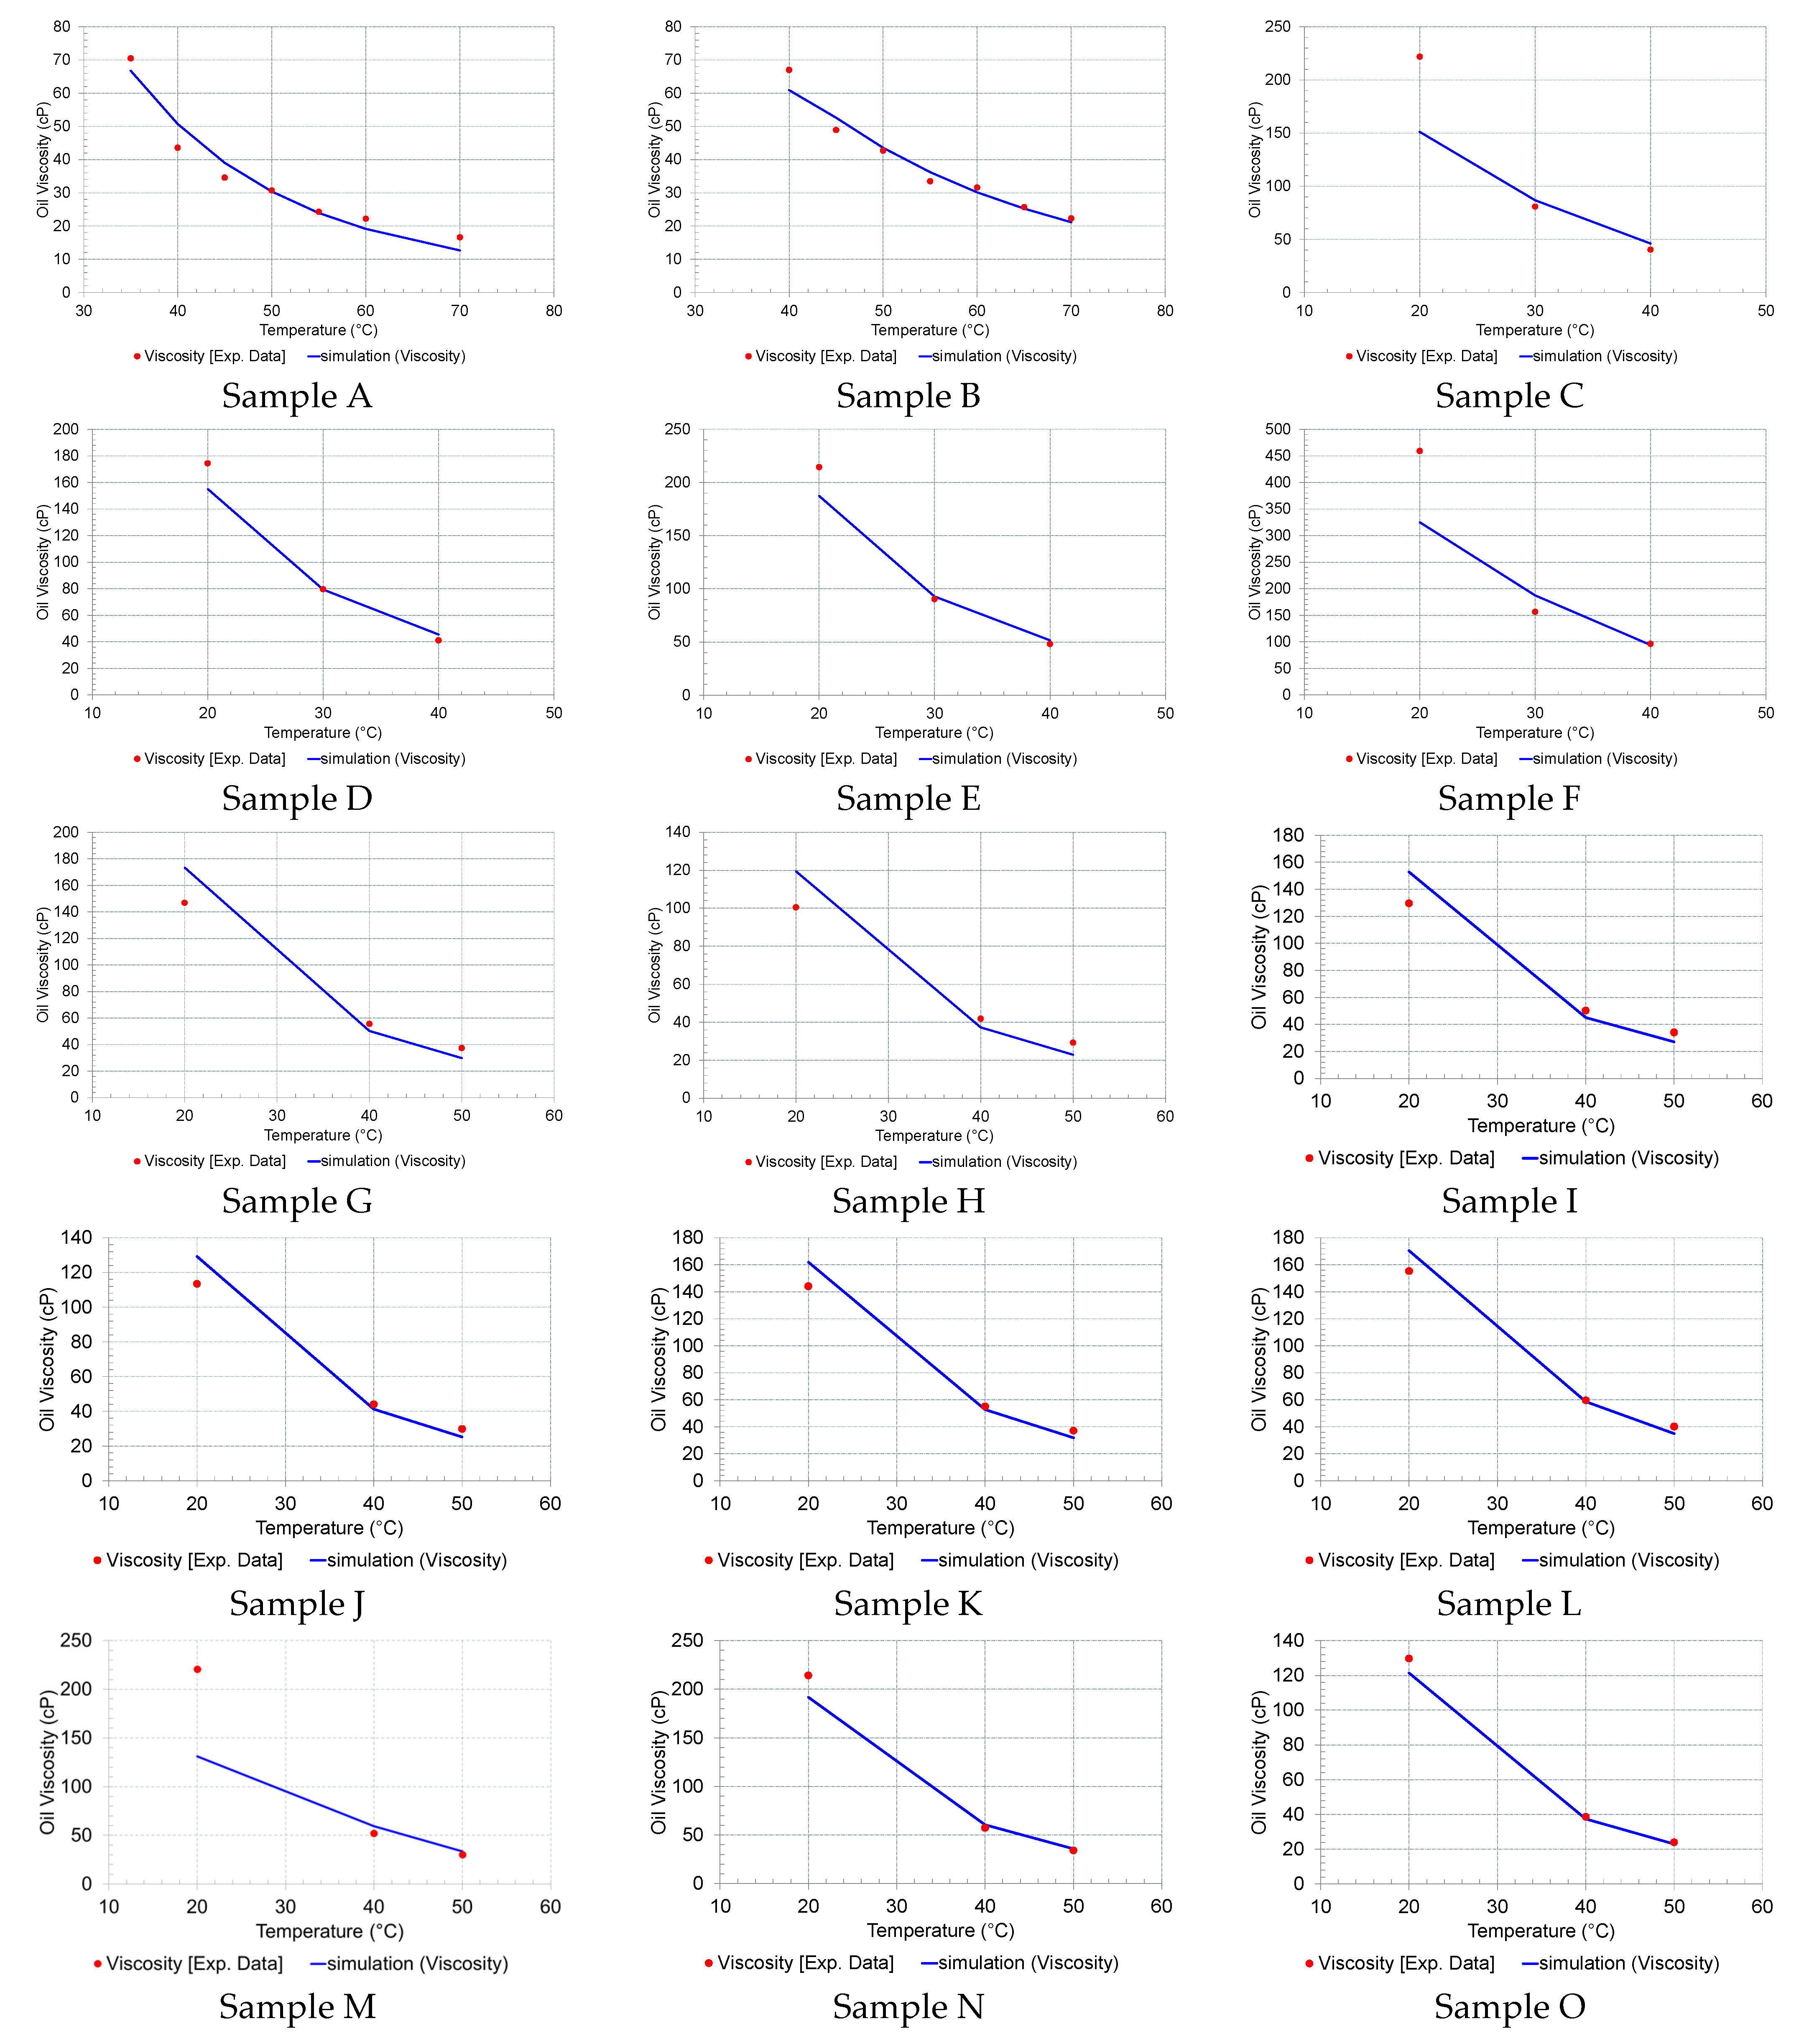
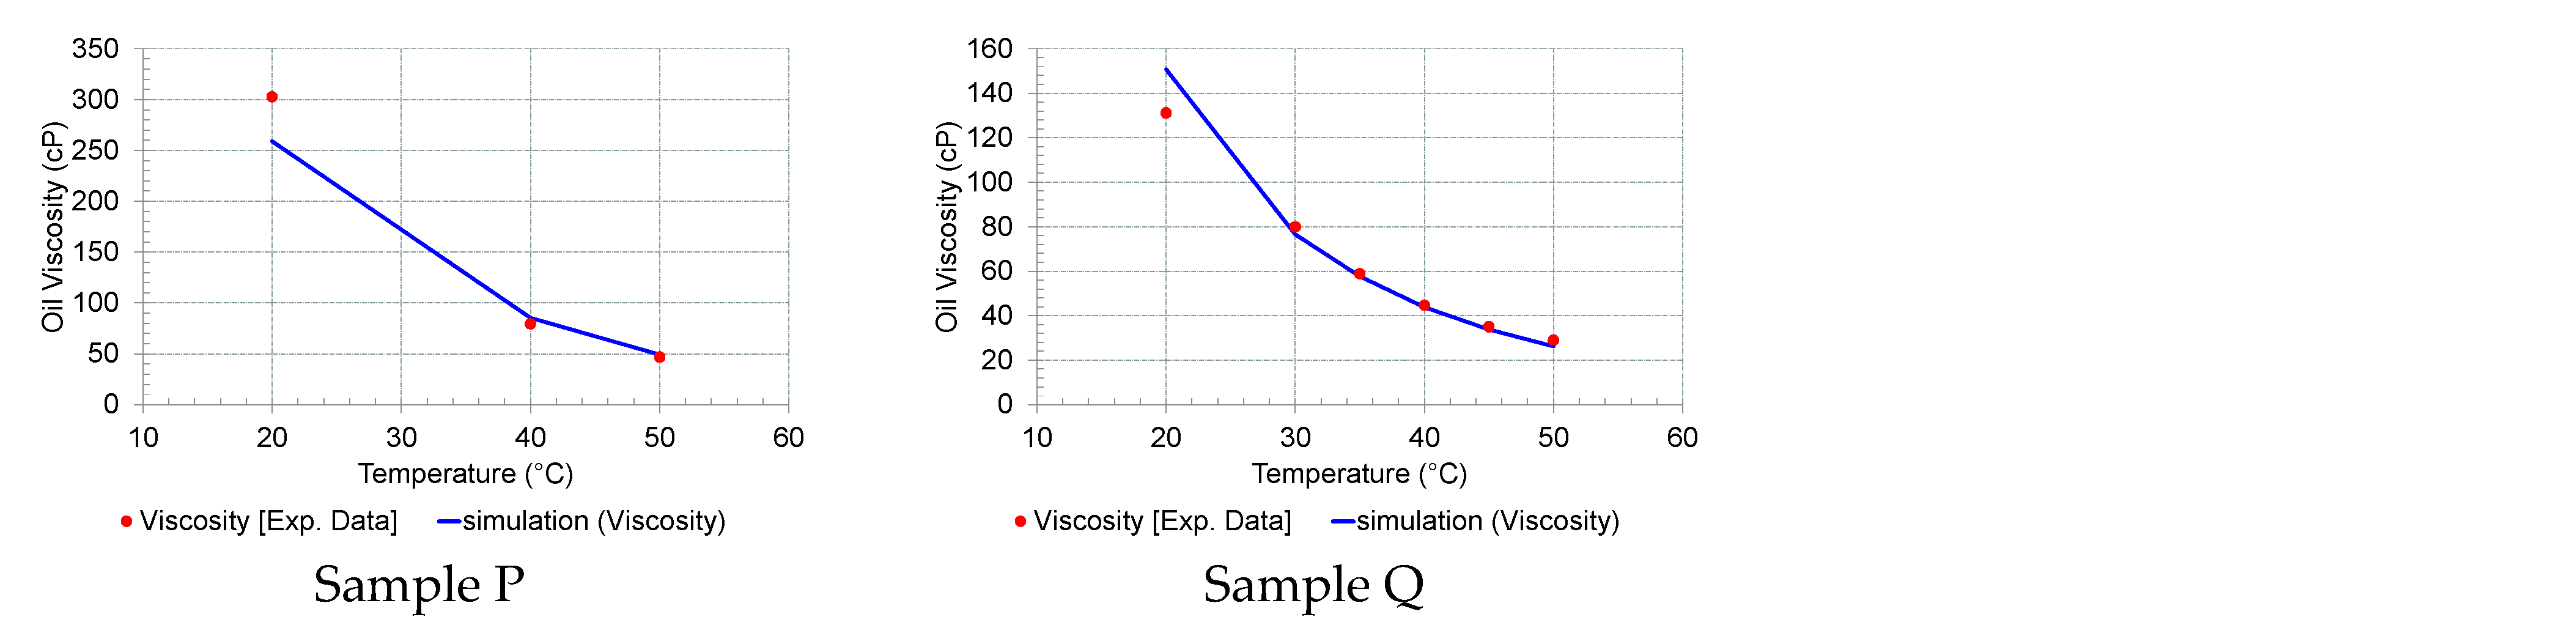
After adding the TBP data to the Multiflash model, the fluid characterization was performed, and the pseudo components were defined. Viscometry tests were then used to calibrate the Multiflash model by automatically fitting the calculated viscosity curve to the experimental measurements. Since it is regarded as the most flexible approach for predicting viscosity and generally performs better than the other methods available in Multiflash [62], the SuperTRAPP method was used to determine the calculated viscosity. Figure 7 graphically represents the results of this tunning procedure.
By analysing the previous graphics, it is possible to verify that adjusting the simulated viscosity to the experimental data is more challenging for lower temperatures. In other words, crude oil rheological behaviour is difficult to tune at low temperatures.
By the graphical analysis, it is not possible to determine the WAT values through the logarithmic plot since few viscosity measures were provided as a function of temperature. Thus, it is necessary to simulate it to estimate the WAT value associated with each crude sample.
3.2. PVT Analysis
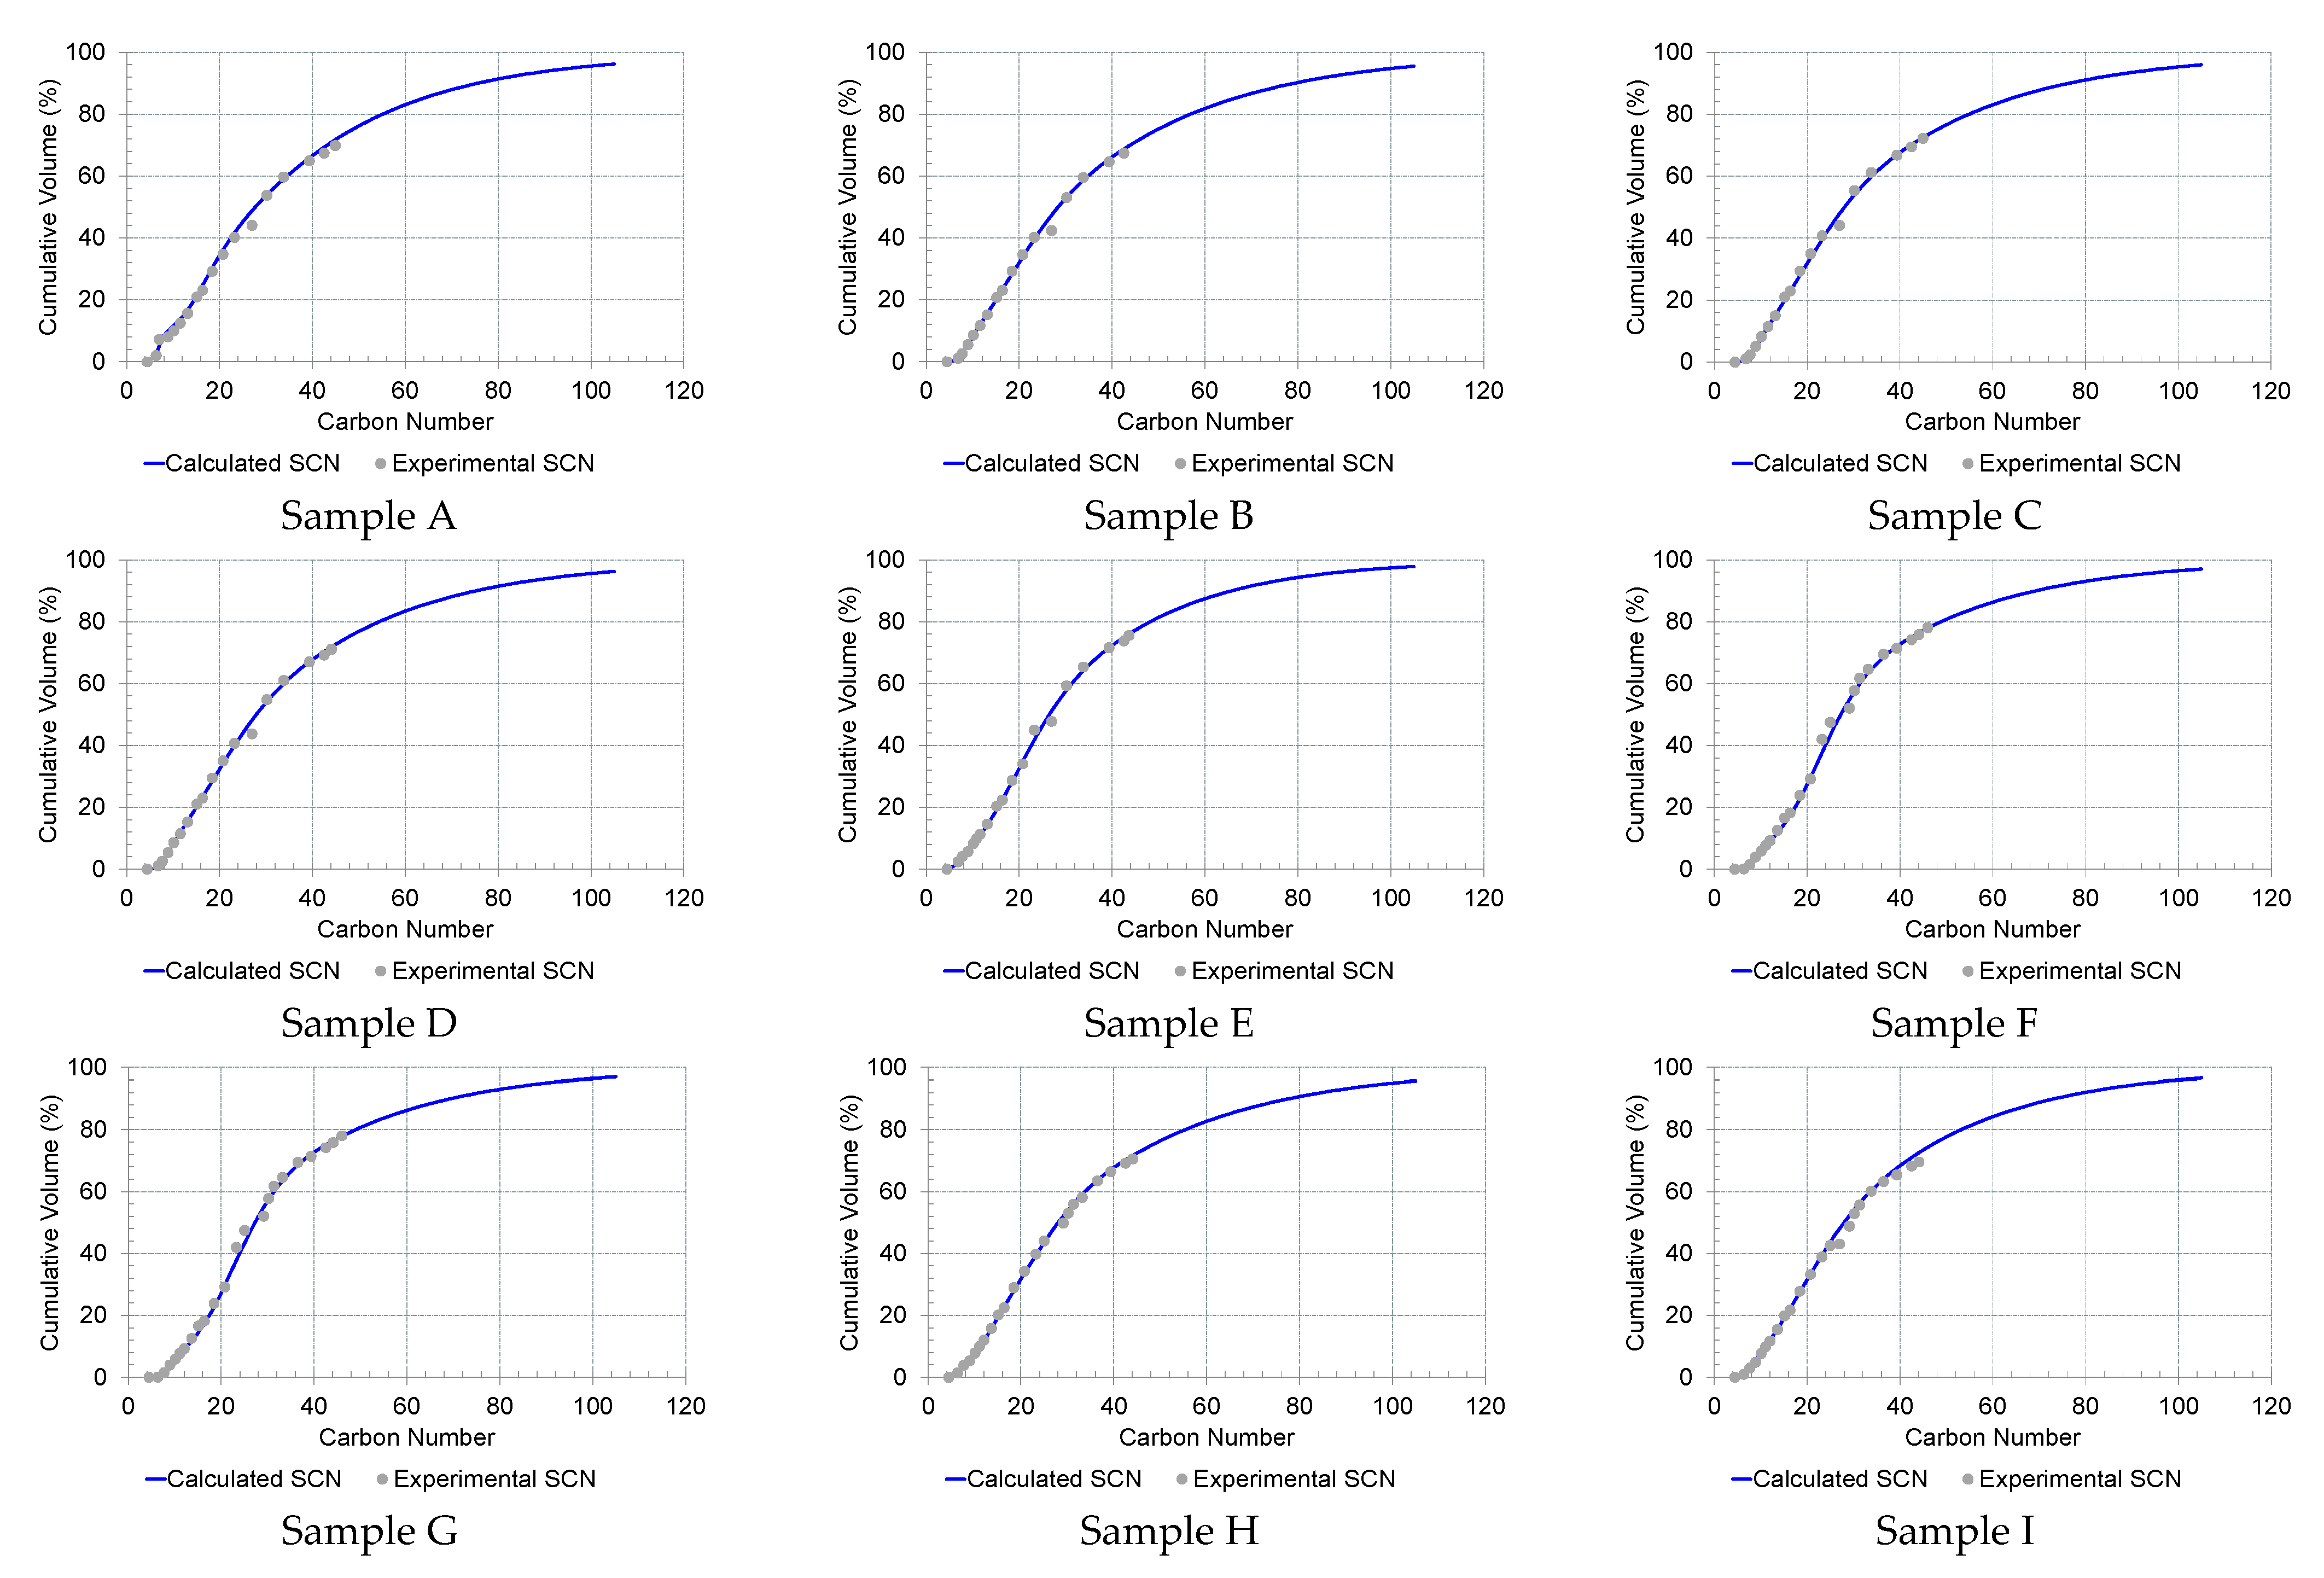
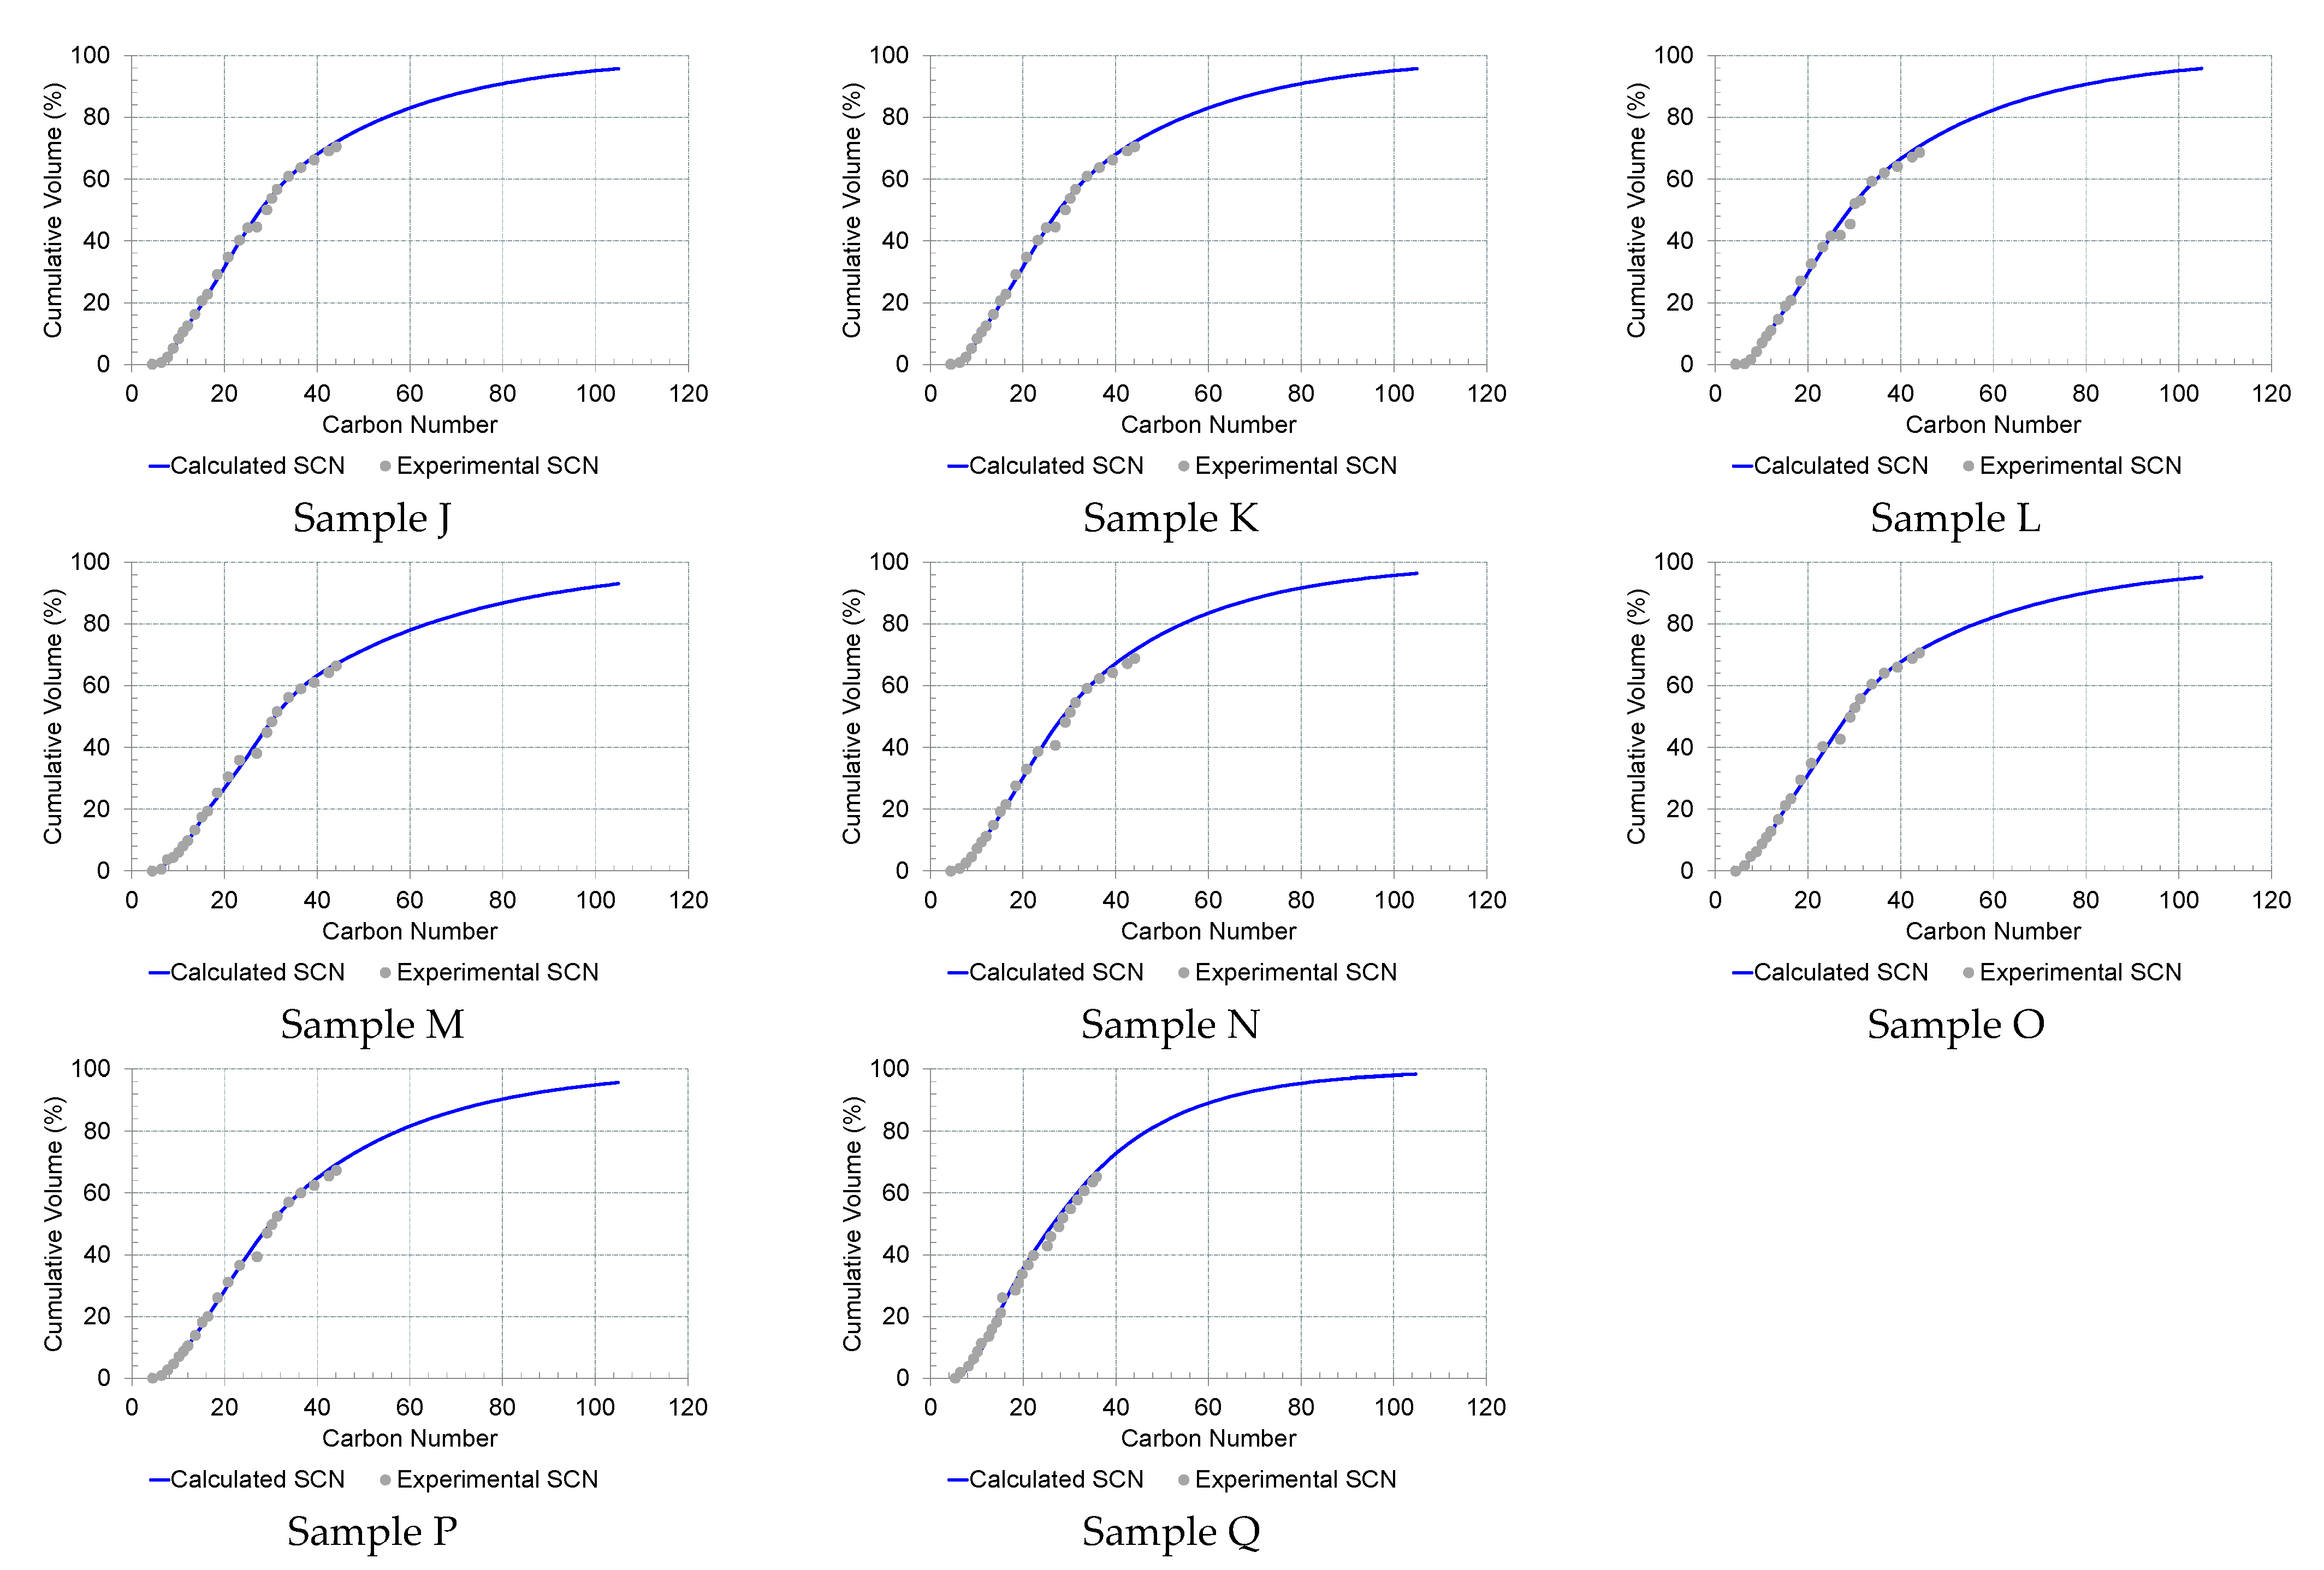
Determination of the pseudo components that form the crude was carried out by Multiflash. Figure 8 shows the adjustment of the input values and the values calculated by the software, illustrating the cumulative percentual volume as a function of the single carbon number (SCN).
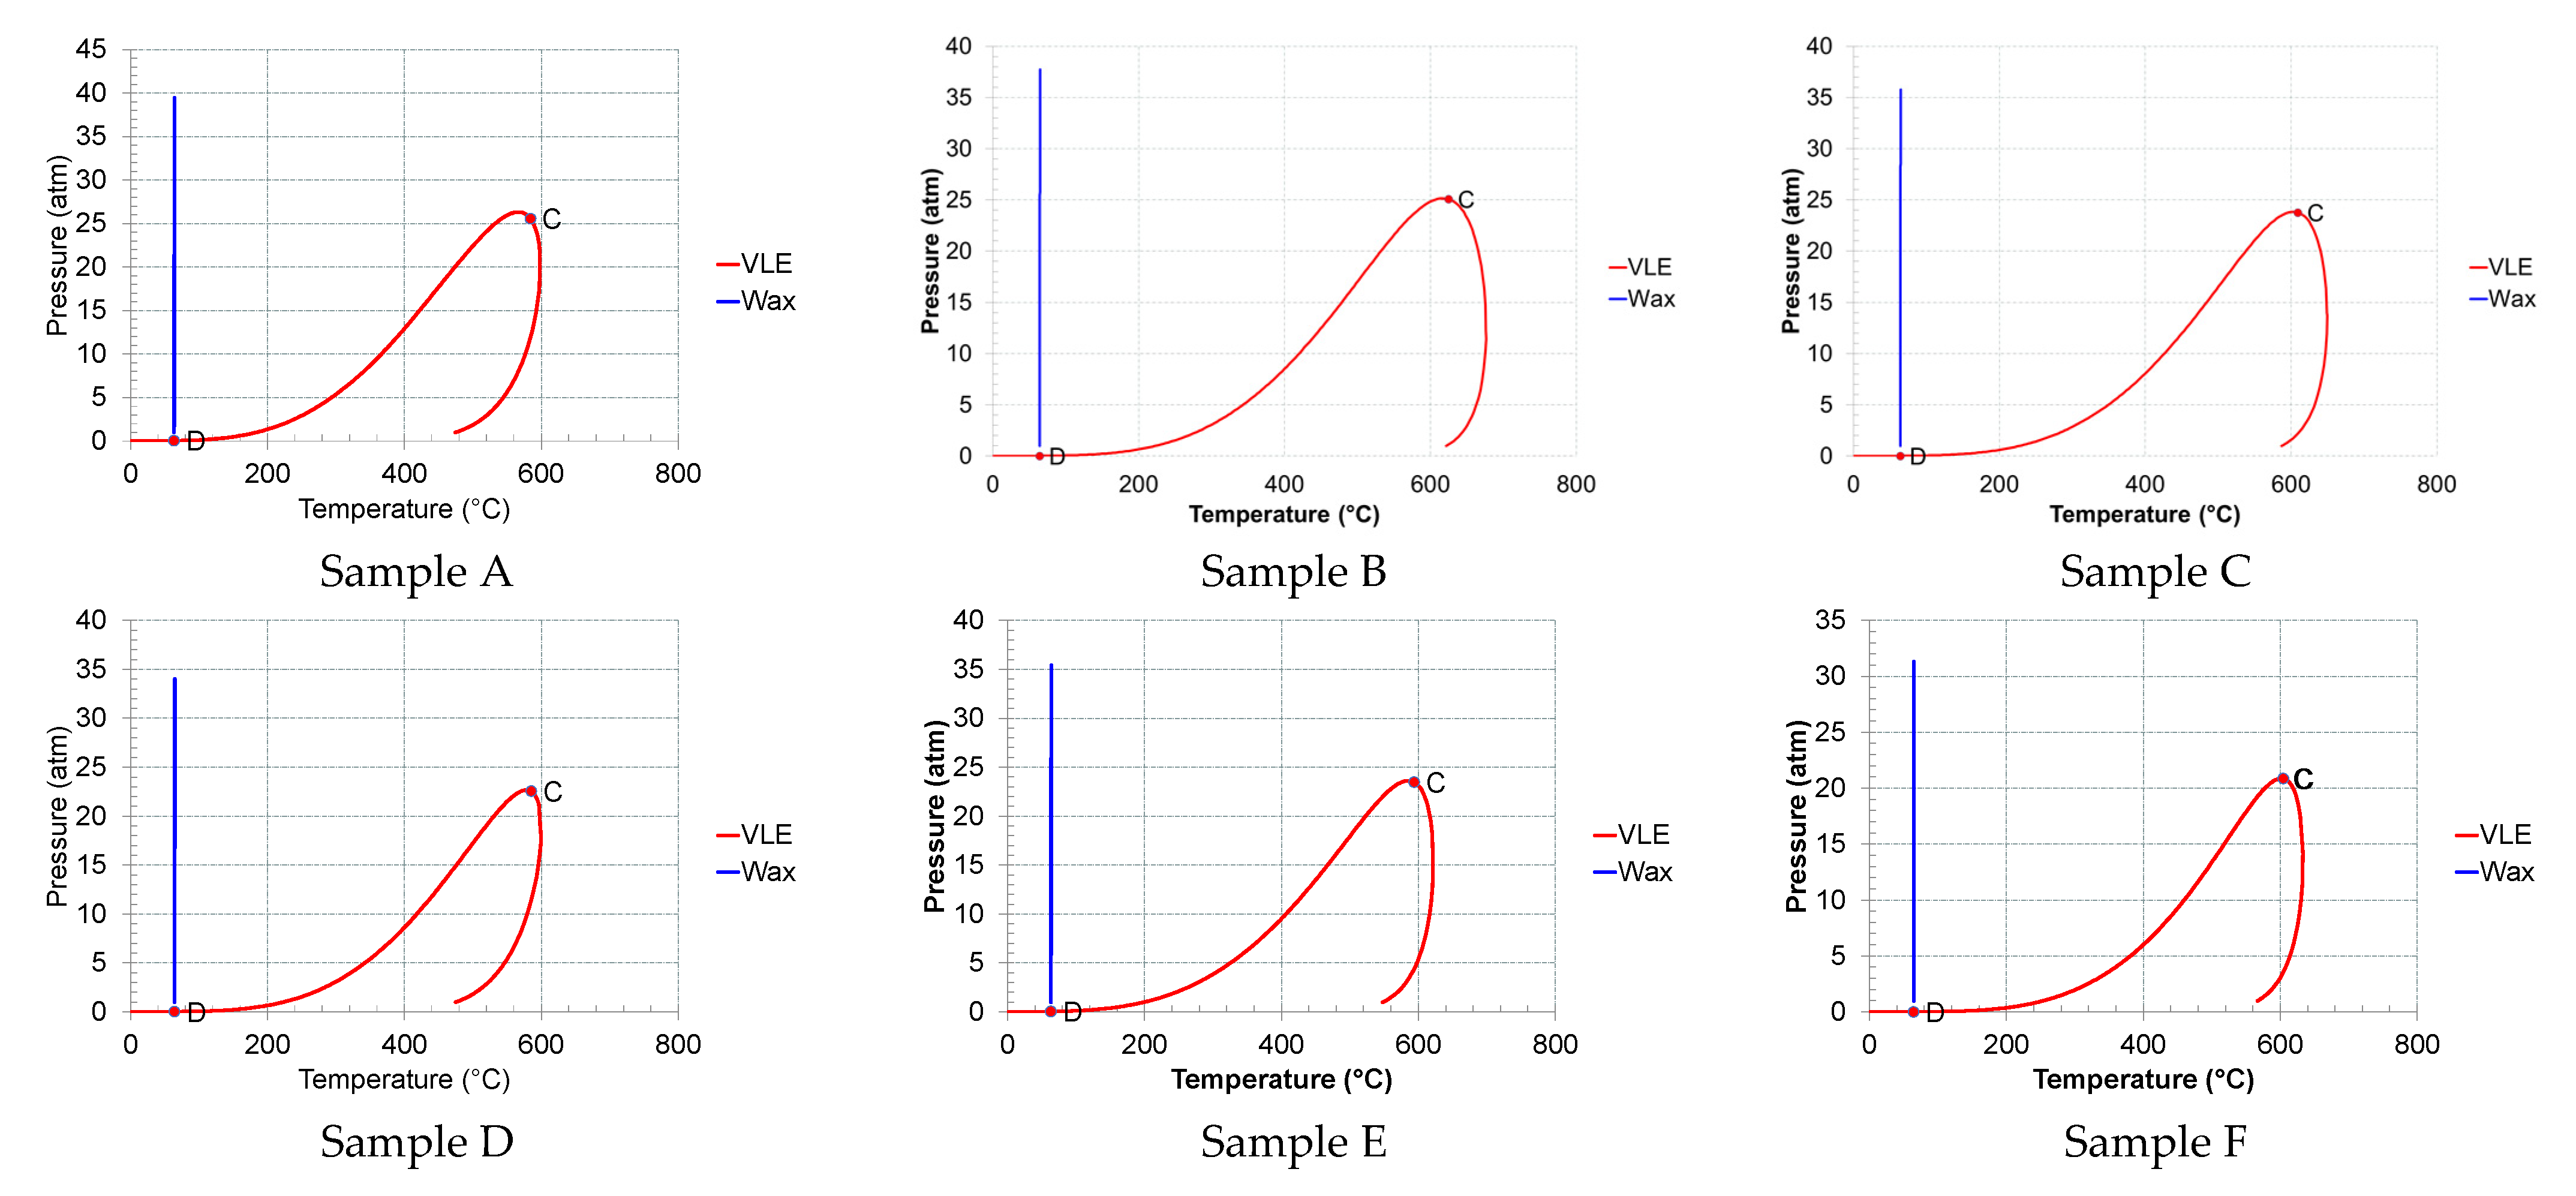
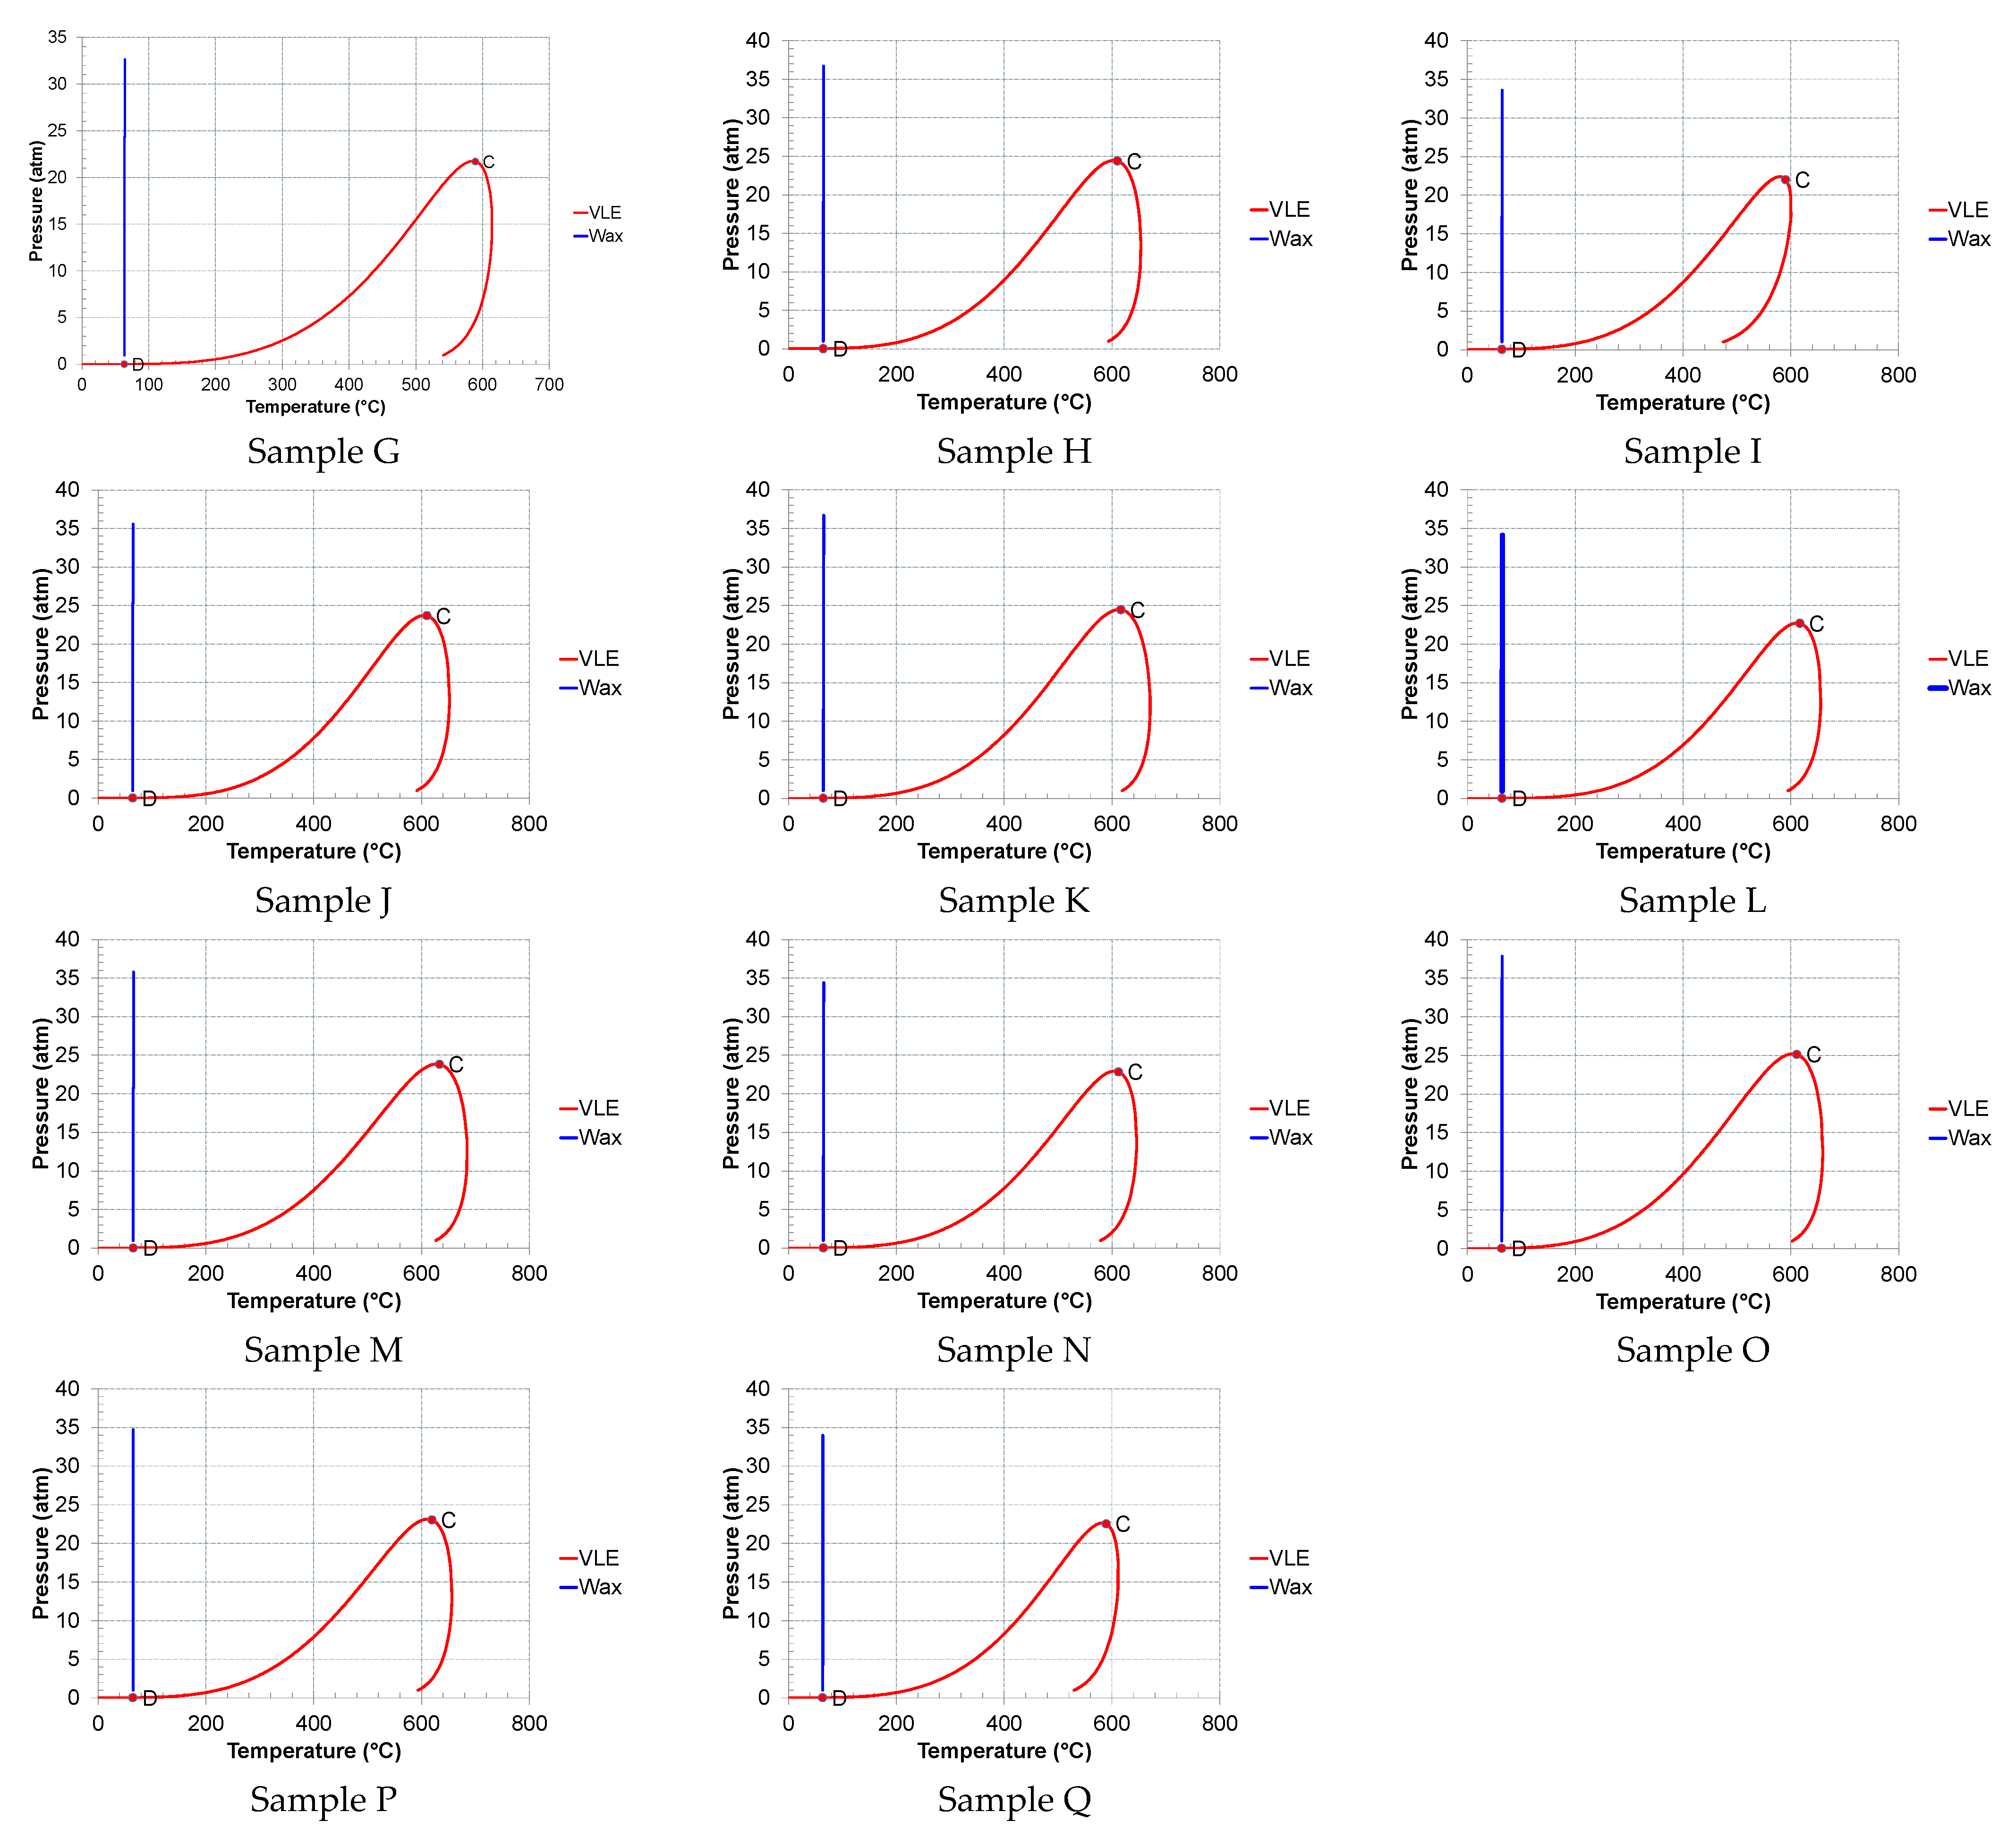
Knowing the wax thermodynamics is essential to identify the possibility of wax formation for particular operating conditions and to understand how severe the deposition can eventually be. Figure 9 shows the phase envelope for the seventeen samples obtained in Multiflash, using the Redlich–Kwong–Soave thermodynamic model.
When selecting the wax phase in Multiflash, the phase envelope button can be used to plot the wax boundary (blue line). In Figure 9, the wax boundary’s intersection with the bubble point line is indicated by the letter D.
This phase diagram enables the visual representation of how crude oil changes due to variations in temperature and pressure. The blue line indicates the temperature value below which the wax precipitates. The wax appearance temperature seems to be almost independent of the fluid pressure. However, as will be presented in more detail in Section 3.3, pressure influences the amount of precipitated wax. The higher the pressure, the higher the amount of precipitated wax.
3.3. Wax Characterization
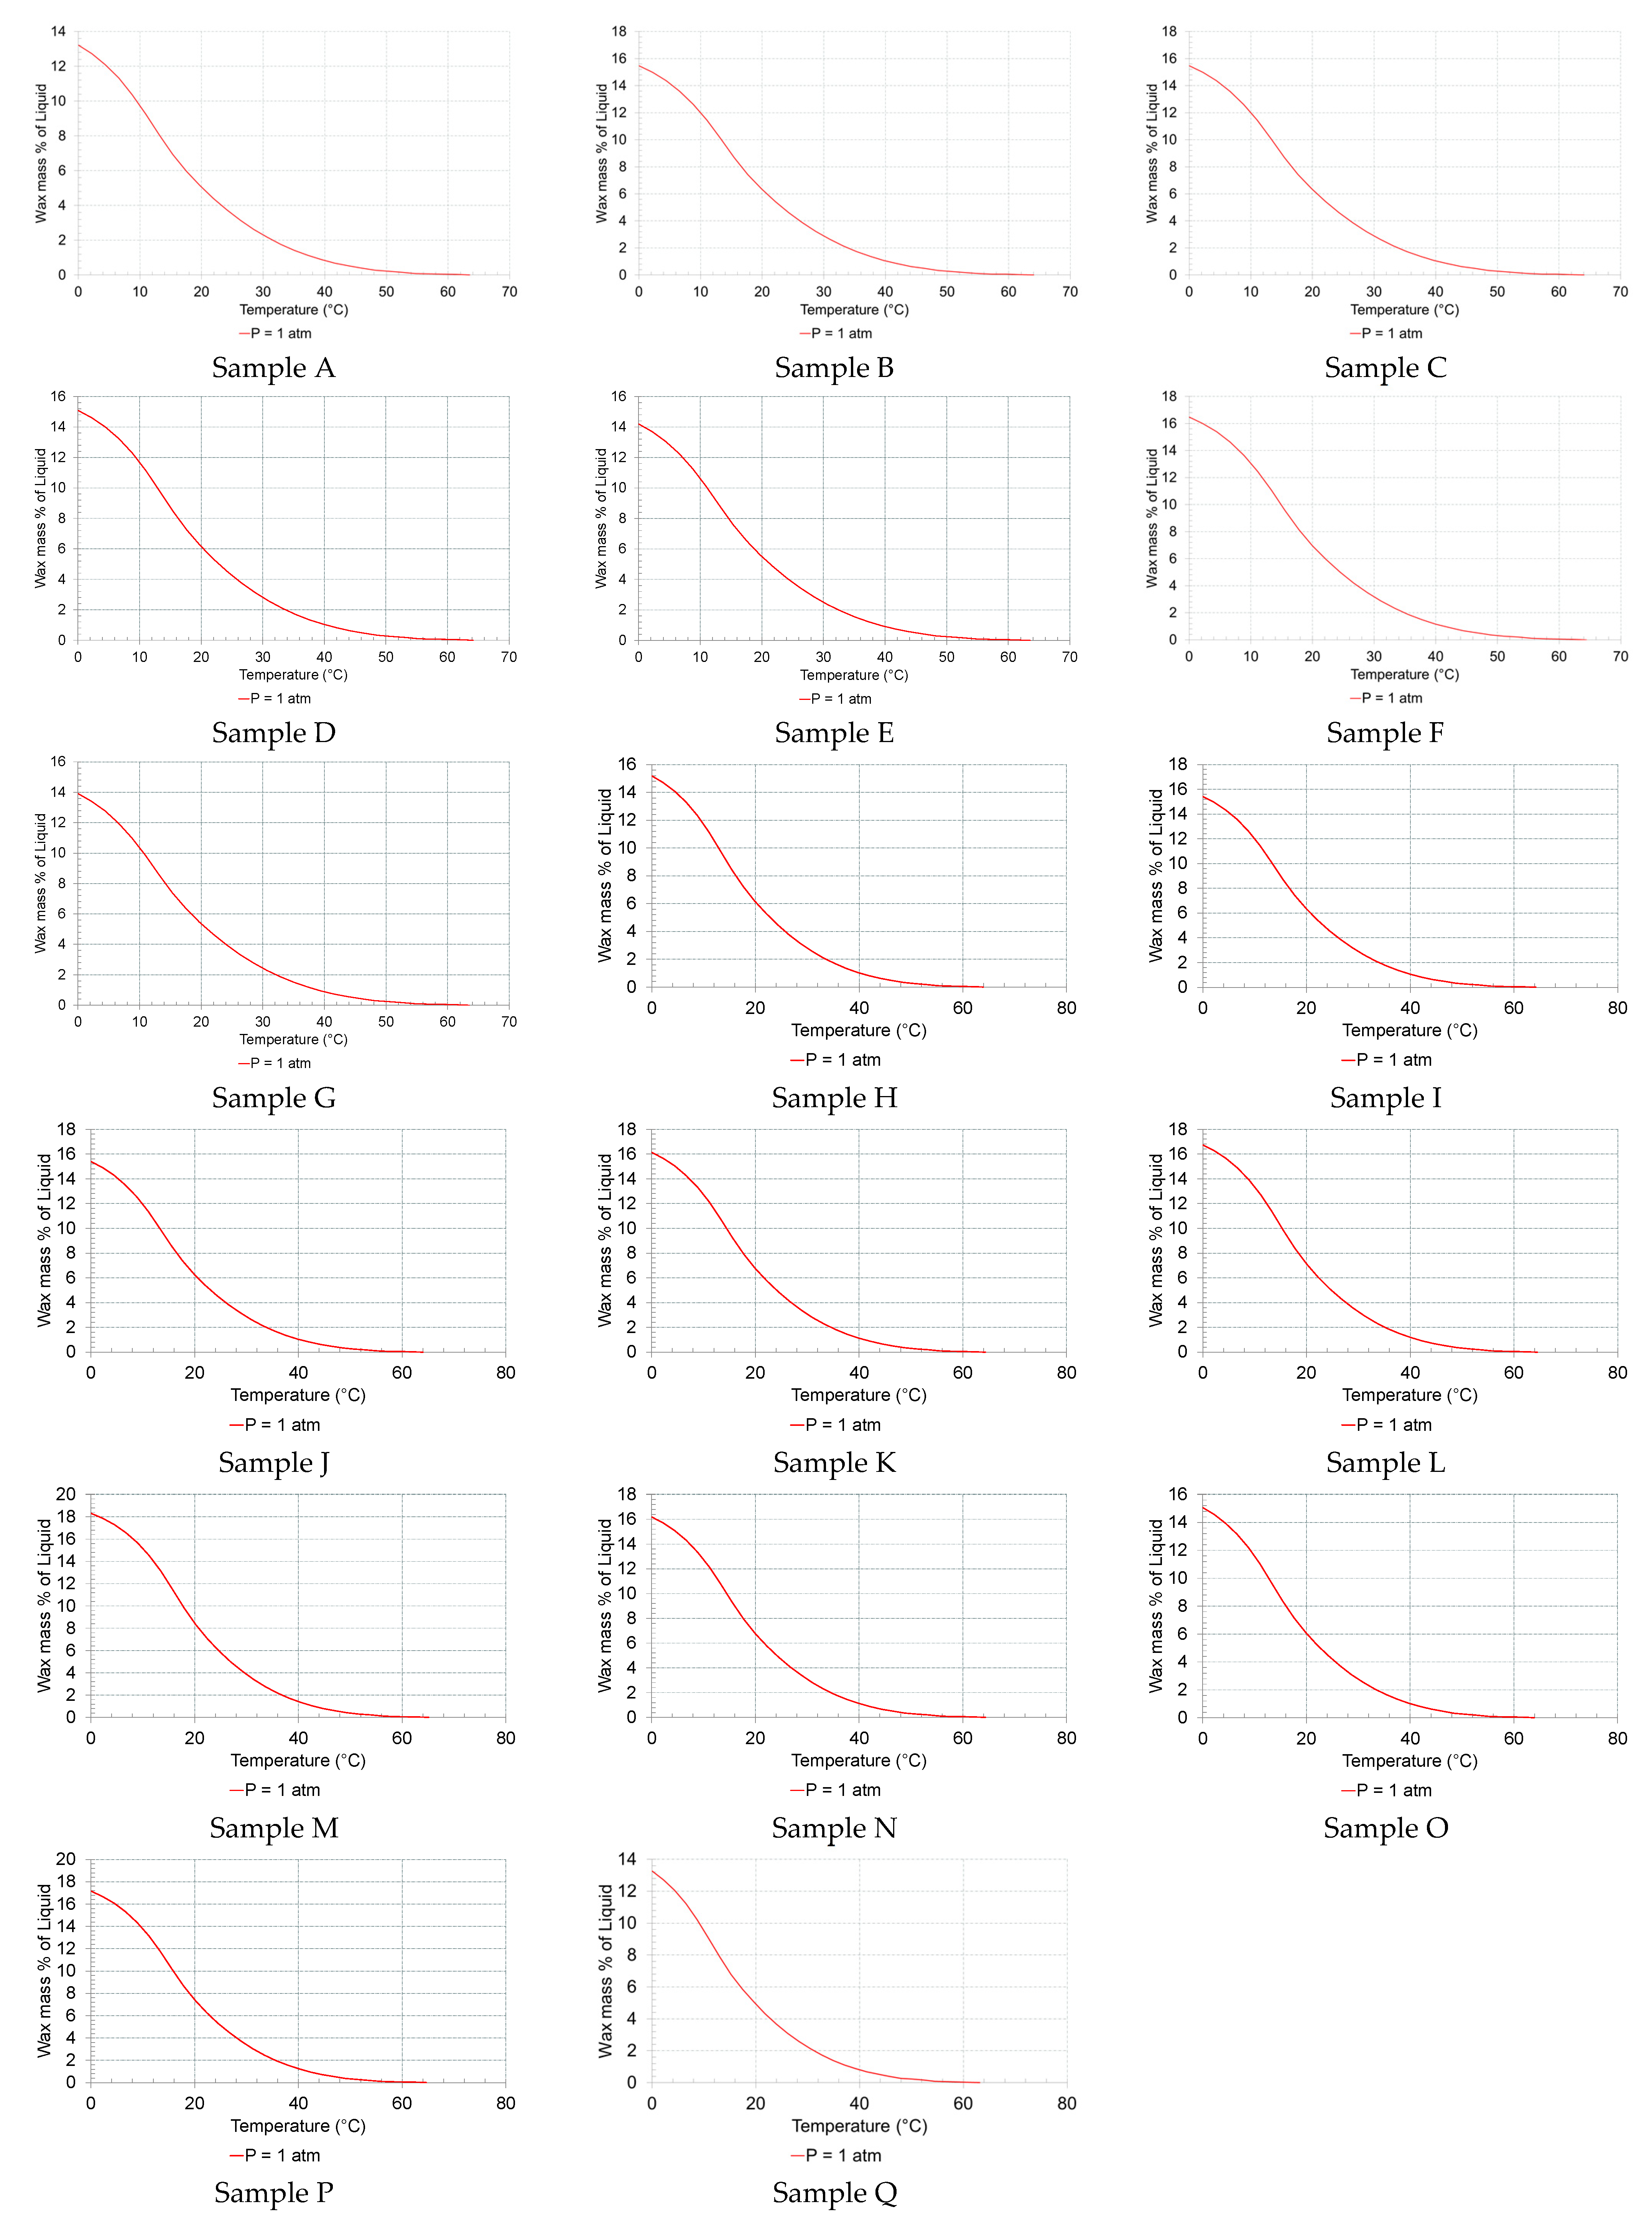
By selecting the wax precipitation curve button in Multiflash, a graph showing the wax mass percentage of liquid as a function of temperature will be generated at a specifically selected pressure. Starting at zero degrees Celsius, the final temperature is the computed WAT for zero percent wax. Figure 10 shows the wax precipitation curve.
While the above wax precipitation curves behave similarly, the amount of wax precipitated varies from sample to sample. For instance, the amount of precipitated wax for 0 °C varies, and the WAT is also different.
The values of WAT were also calculated at pressures of 1, 100 and 200 atm, and the results are presented in Table 3. Identifying a measurable WAT, which means a non-zero quantity of wax, depends on the experimental techniques used to determine it. Two different models were presented in these cases since they are already pre-set in Multiflash: cross polar microscopy (CPM) and differential scanning calorimetry (DSC).
The results show that for the evaluated samples the WAT varies linearly with the pressure, with a positive slope. The gradient ranges between 1.77 and 1.83 °C/100 bar for these waxy crude oils. Although the results obtained through those calculations contradict the trends obtained experimentally by Oyekunle et al. [12] in which the WAT decreases as the pressure increases, they corroborate the positive trend that Brown et al. [55] obtained. The latter suggested that it is realistic to estimate an increase in the cloud point due to pressure on any dead oil cloud point of 2 °C/100 bar [55]. From the calculations herein, it is possible to conclude that these results are compatible with the ones obtained by Brown et al. [55]. Wax is less soluble in crude oil as pressure is applied to it [63], so it is expected that WAT will be higher when the pressure is higher
When analysing the flow conditions from the reservoir to the surface through the well, it is possible to conclude that the pressure will affect wax precipitation. Nevertheless, it is expected that the temperature decrease of the fluid will have a higher impact on wax precipitation than the pressure.
When evaluating these results, it is possible to conclude that this oil field is expected to present a severe wax precipitation problem since the calculated WAT values are very high, ranging between 47.5 °C and 51.6 °C, for atmospheric conditions and considering the DSC results.
4. Results and Discussion—Impact of Using Chemicals to Prevent Wax Precipitation
To evaluate the impact of using specific chemicals to prevent wax precipitation, adding the physical properties of these components in the Multiflash program is necessary. When adding CH4, CO2 or fatty acids to these crude oil samples, adding the first two is straightforward because they already have their physical parameters set in the Multiflash database. However, the latter does not. Consequently, for each fatty acid, it was necessary to add standard properties, such as the molecular weight, specific gravity, (°C), (atm), w, (m3/kmol), (°C), (°C), (J/mol). These properties were collected from the research published by Sousa et al. [51] and complemented with the information available in the Aspen software database.
After running the Multiflash models with the addition of those chemicals, WAT values were collected for 1 atm, 100 atm and 200 atm.
A dimensionless parameter that is given by the quotient between the WAT after adding the desired chemical and the WAT without it () was used to compare the impact of adding each chemical. If this parameter is lower than 1, it means that the added chemical has a positive impact on decreasing the WAT value.
After calculating this dimensionless parameter (), 17 graphics were built for each inhibitor. Since 12 inhibitors were evaluated (methane, carbon dioxide, caprylic acid, capric acid, lauric acid, myristic acid, palmitic acid, stearic acid, arachidic acid, behenic acid, palmitoleic acid and oleic acid), a total of 204 graphs were obtained (17 crude oil samples x 12 inhibitors). Given that the variation of the dimensionless parameter () as a function of the molar fraction depicts a similar trendline for each inhibitor, the average values of were calculated for the 17 crude oil samples, and one graph was presented per inhibitor that aggregates the overall findings about its efficiency in reducing the WAT values.
4.1. Methane (CH4)
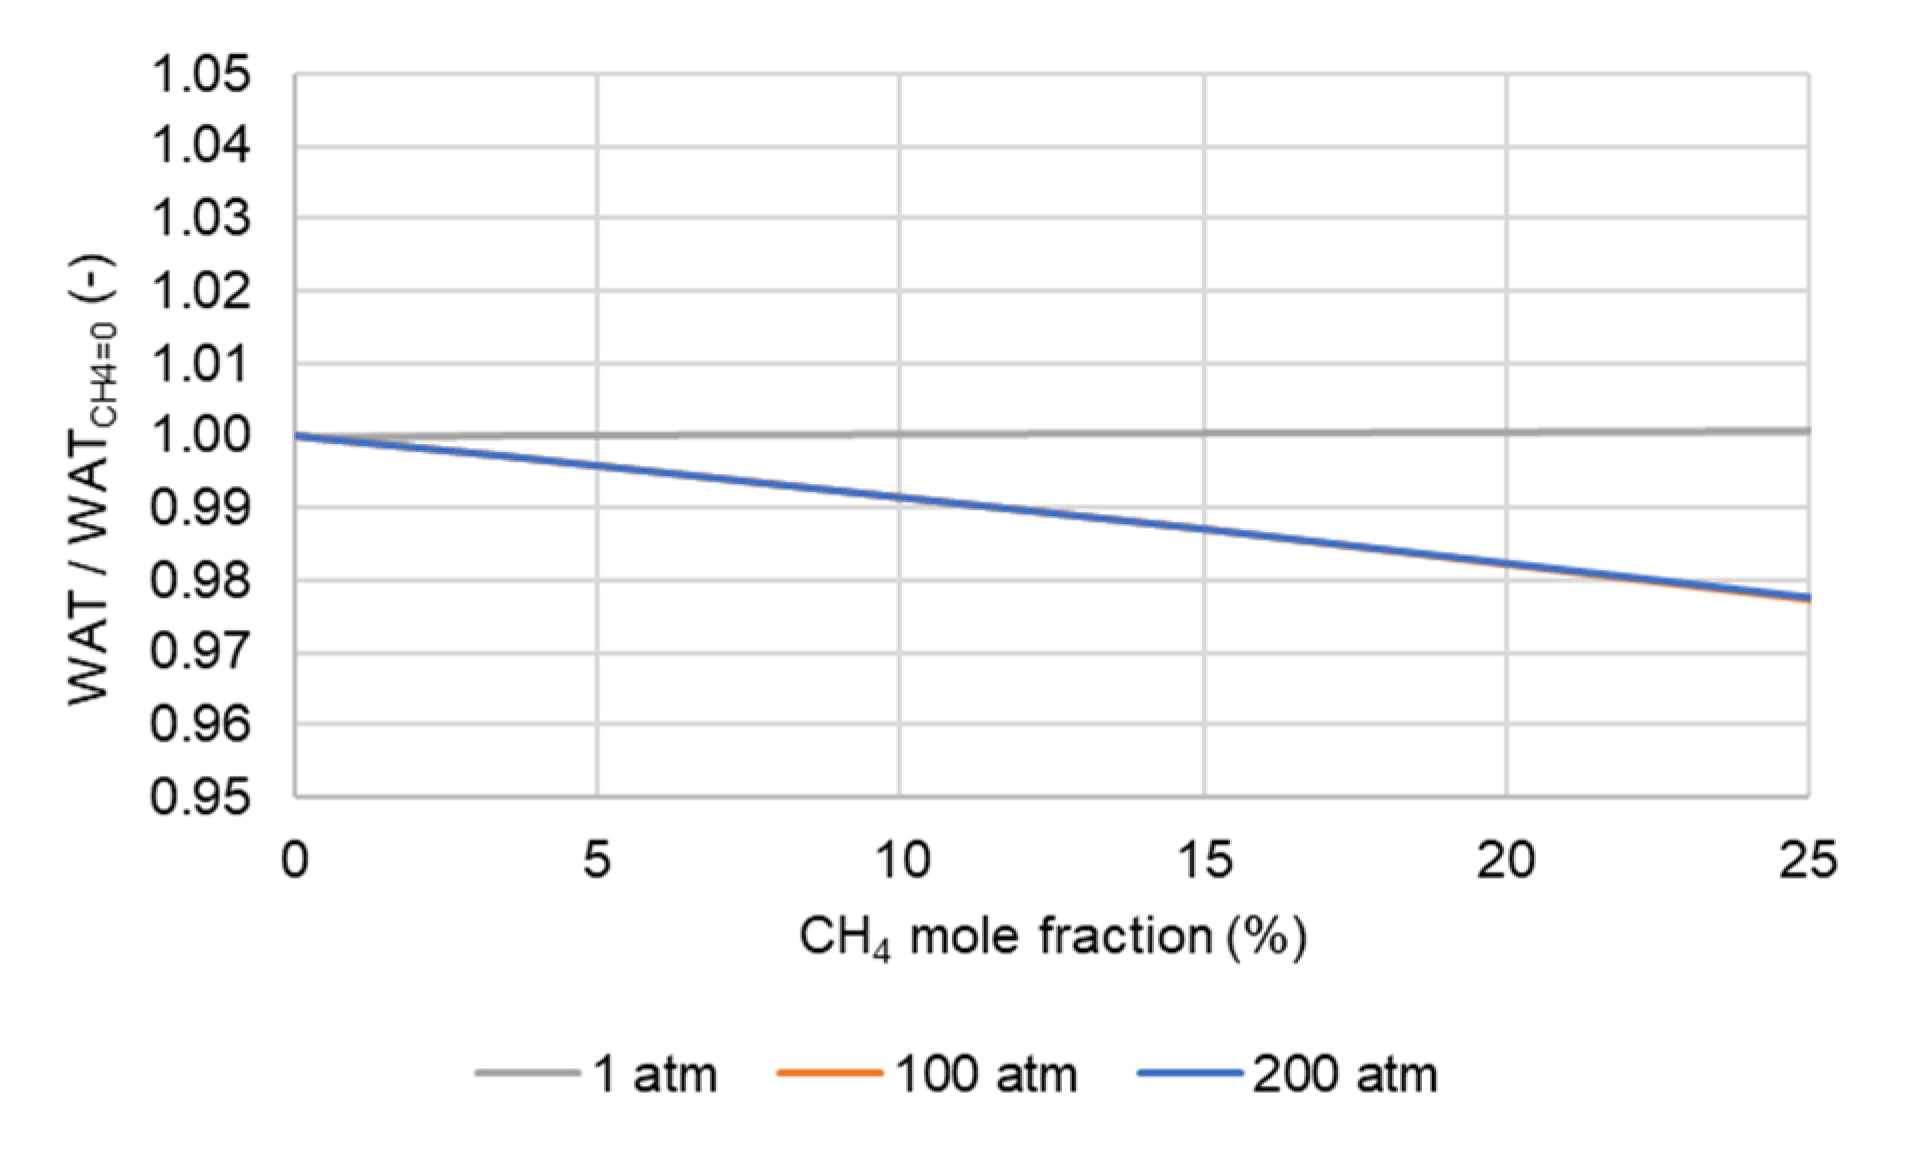
Due to the modification of the fluid composition caused by the addition of methane, WAT decreases, and this alteration is mainly observed for higher pressure values. Figure 11 represents the average as a function of the added CH4 molar fraction.
Injecting CH4 gas at atmospheric pressure will negligibly affect wax precipitation. The results obtained for 100 atm and 200 atm are almost overlapped for the mole fraction range presented in Figure 11. Those results confirm the outcomes of Vieira et al., showing that injecting methane causes a WAT decrease [26].
4.2. Carbon Dioxide (CO2)
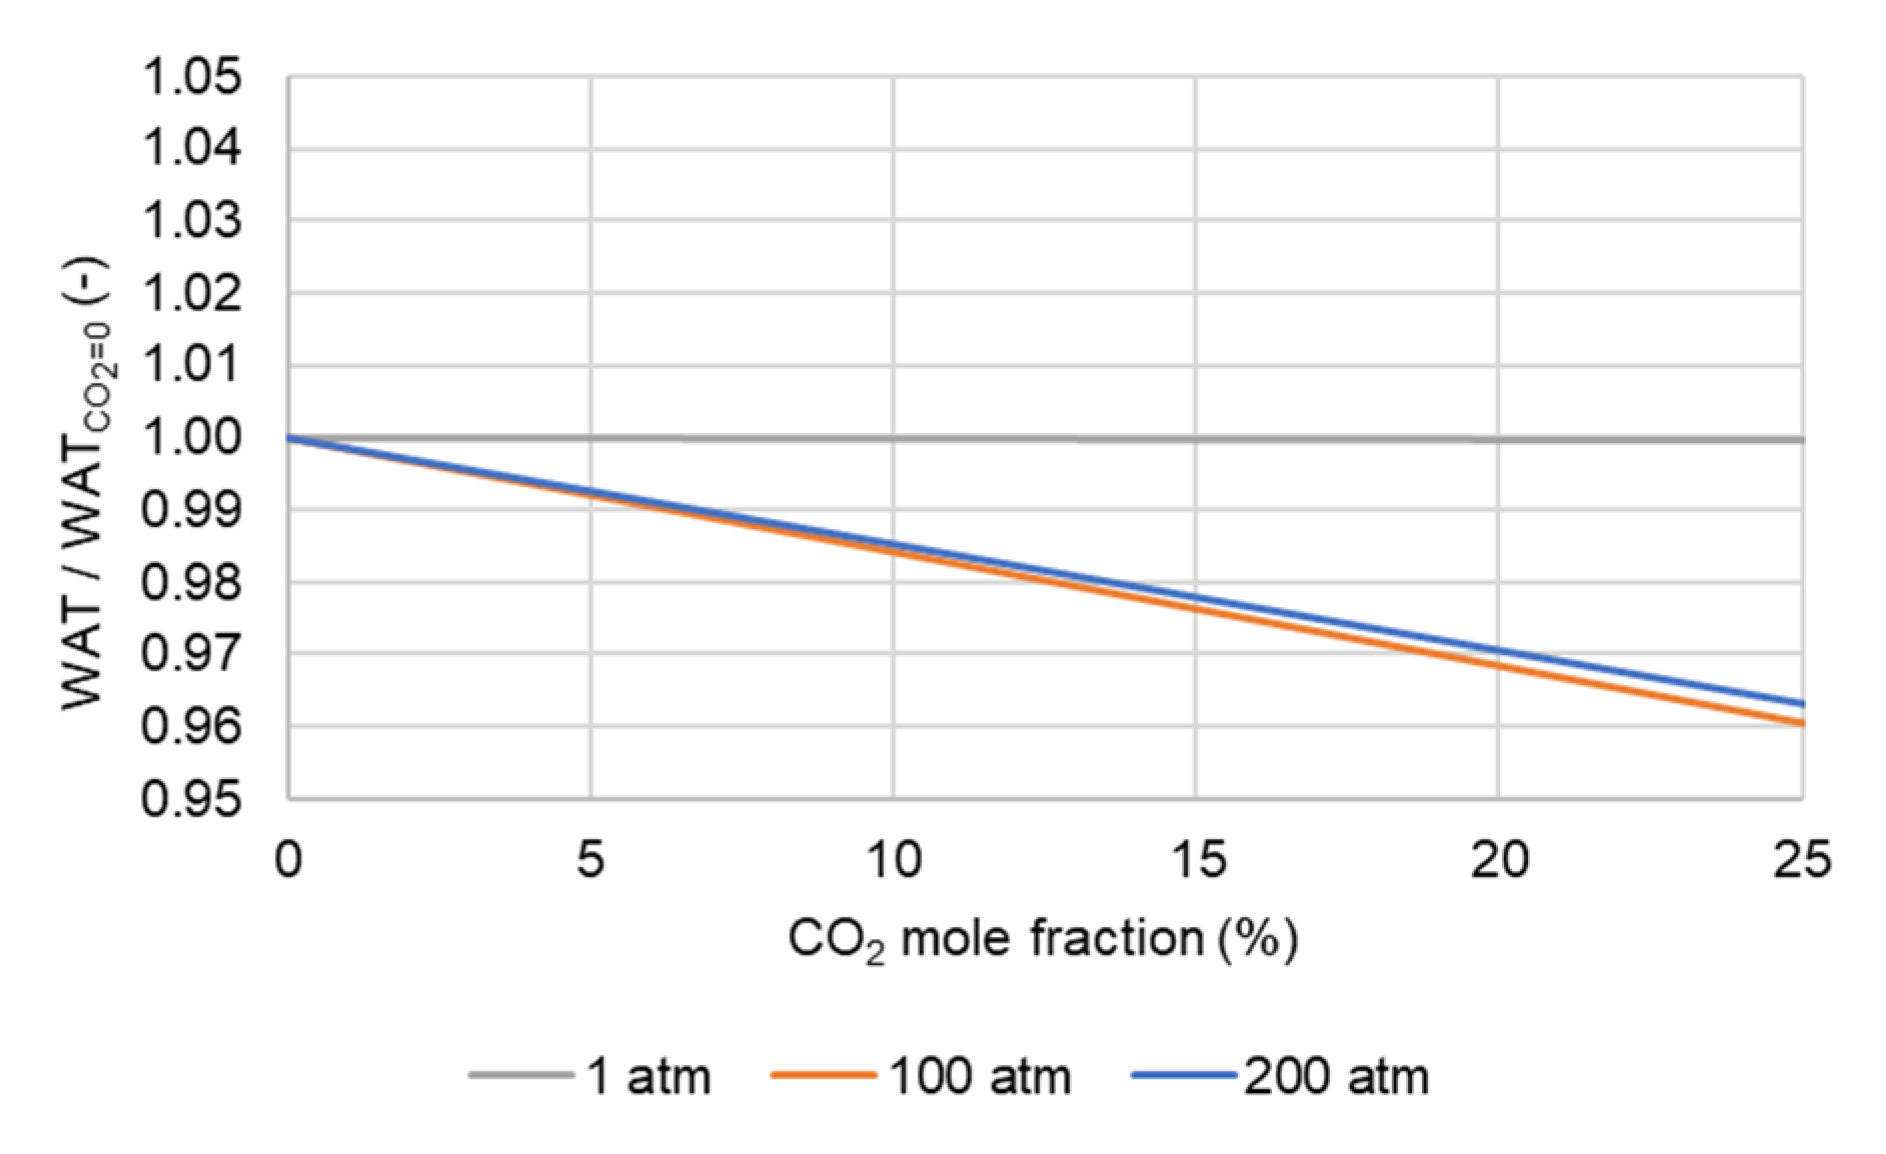
Figure 12 represents the average as a function of the added CO2 molar fraction.
Herein, the conclusion is similar to the previously obtained when injecting gas at atmospheric pressure. The effect on wax precipitation is negligible.
For higher pressures, the results corroborate the findings of Hosseinipour et al. [37], when they investigated the impact of CO2 on wax precipitation. The value of WAT tends to decrease after, and the reduction depends on the pressure.
4.3. Fatty Acids
In this study, fatty acids taken into account are those that are naturally present in higher proportions in the plant components and biomass residues that Sousa et al. [51] examined.
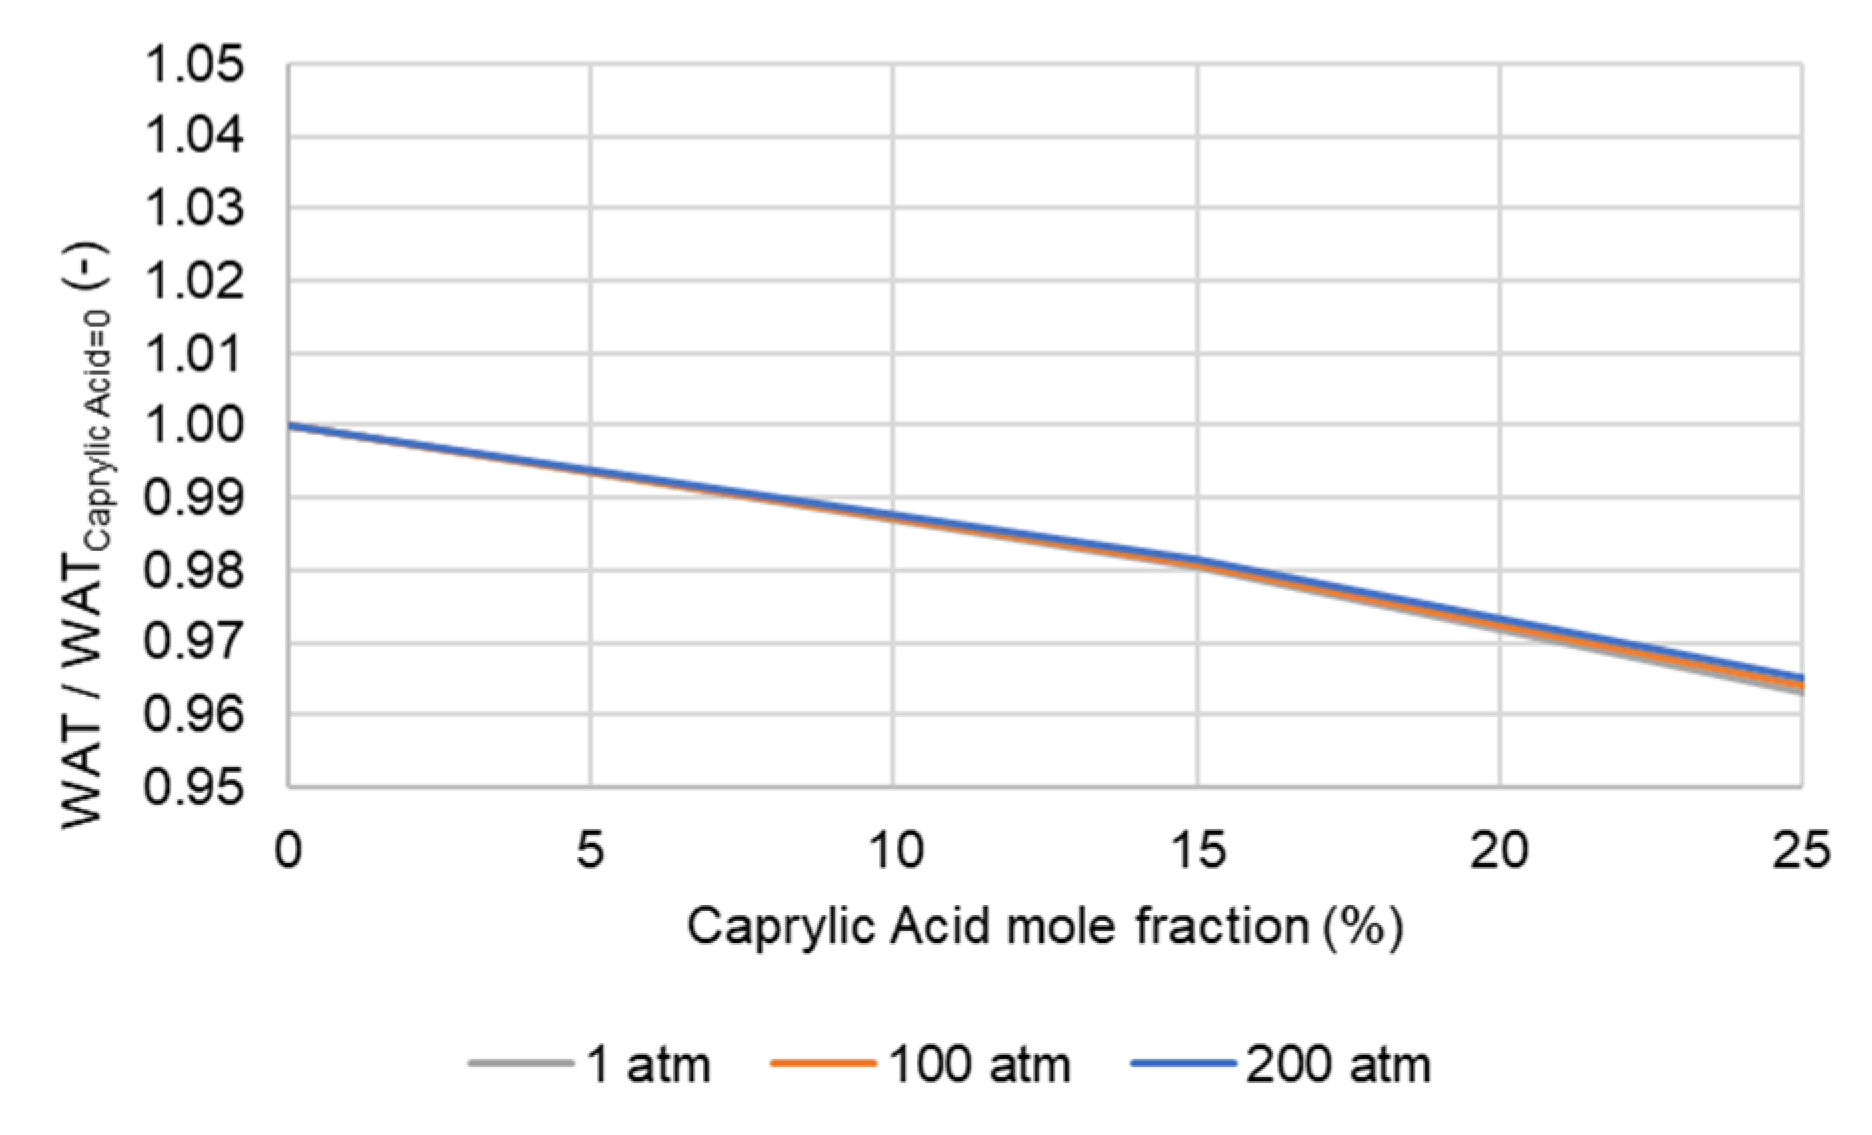
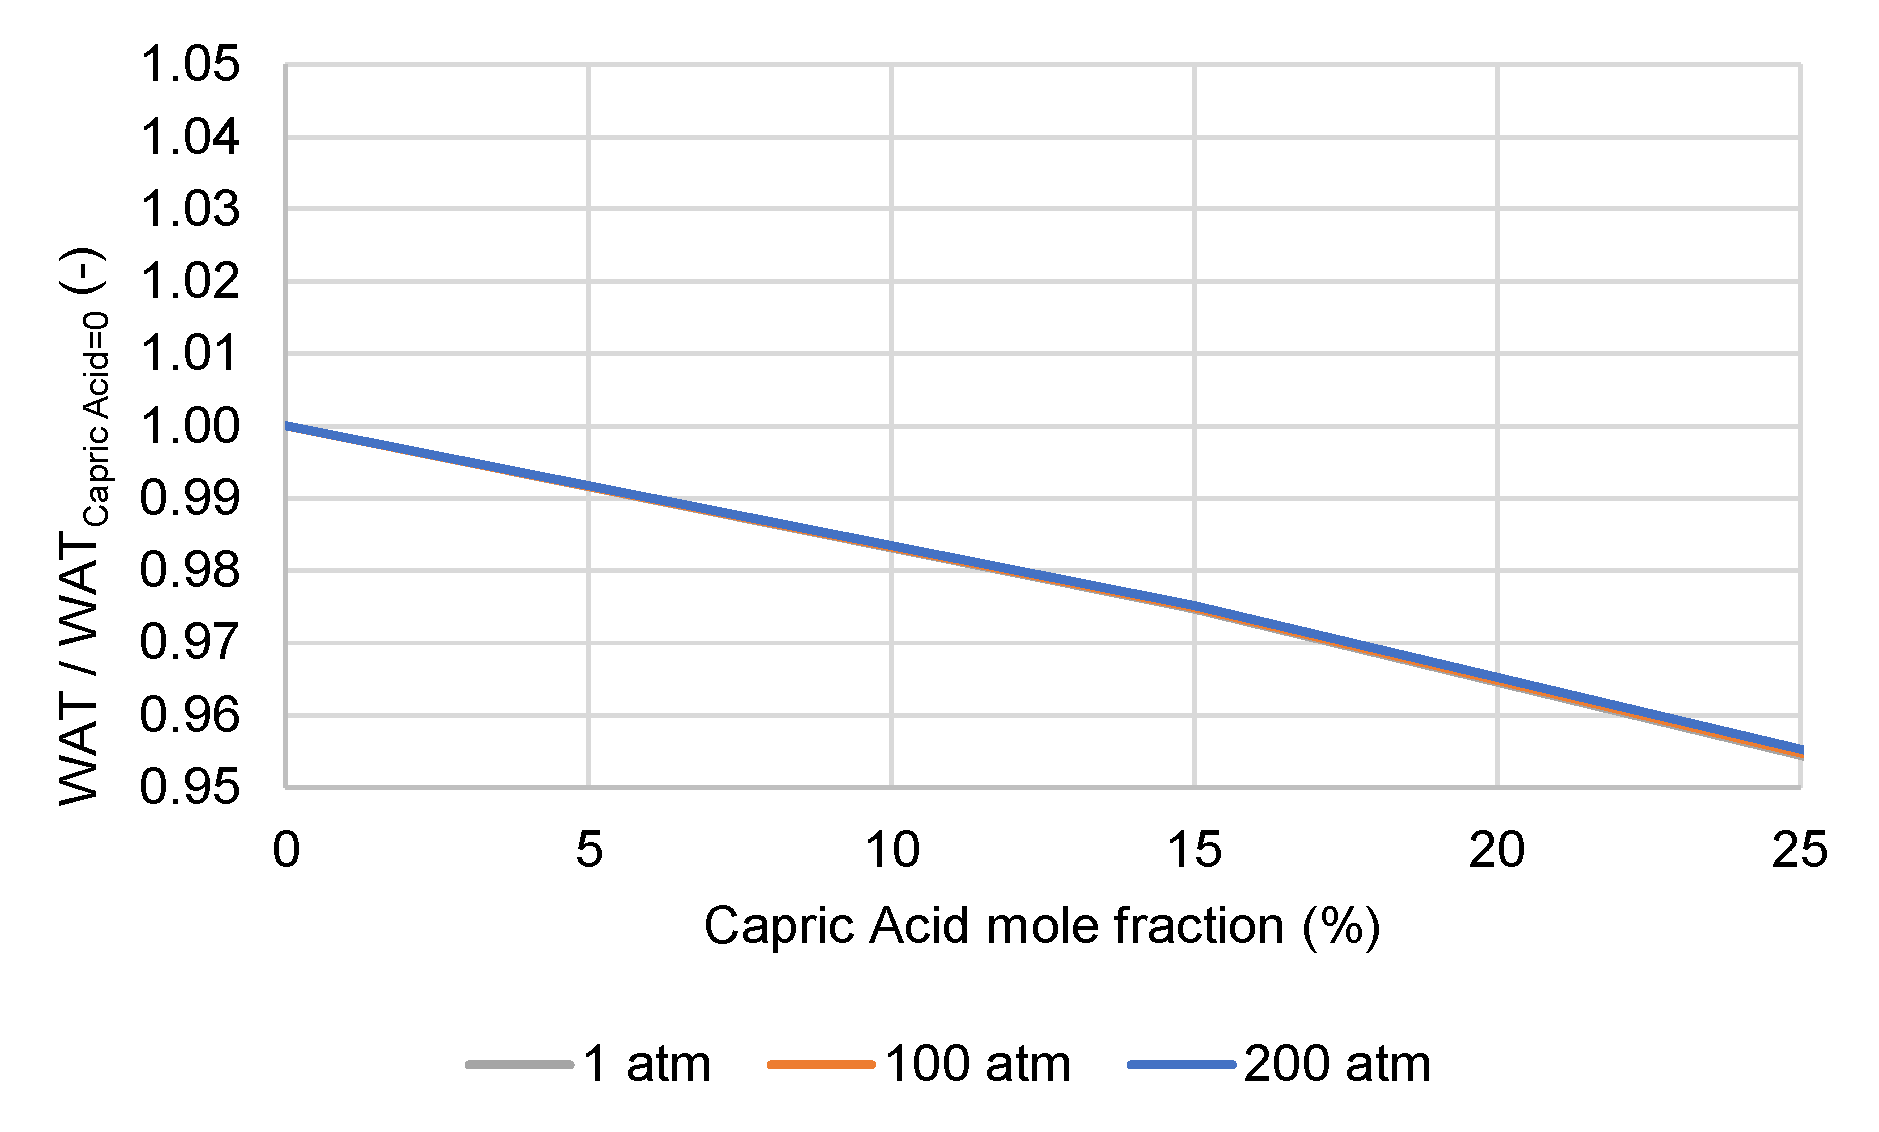
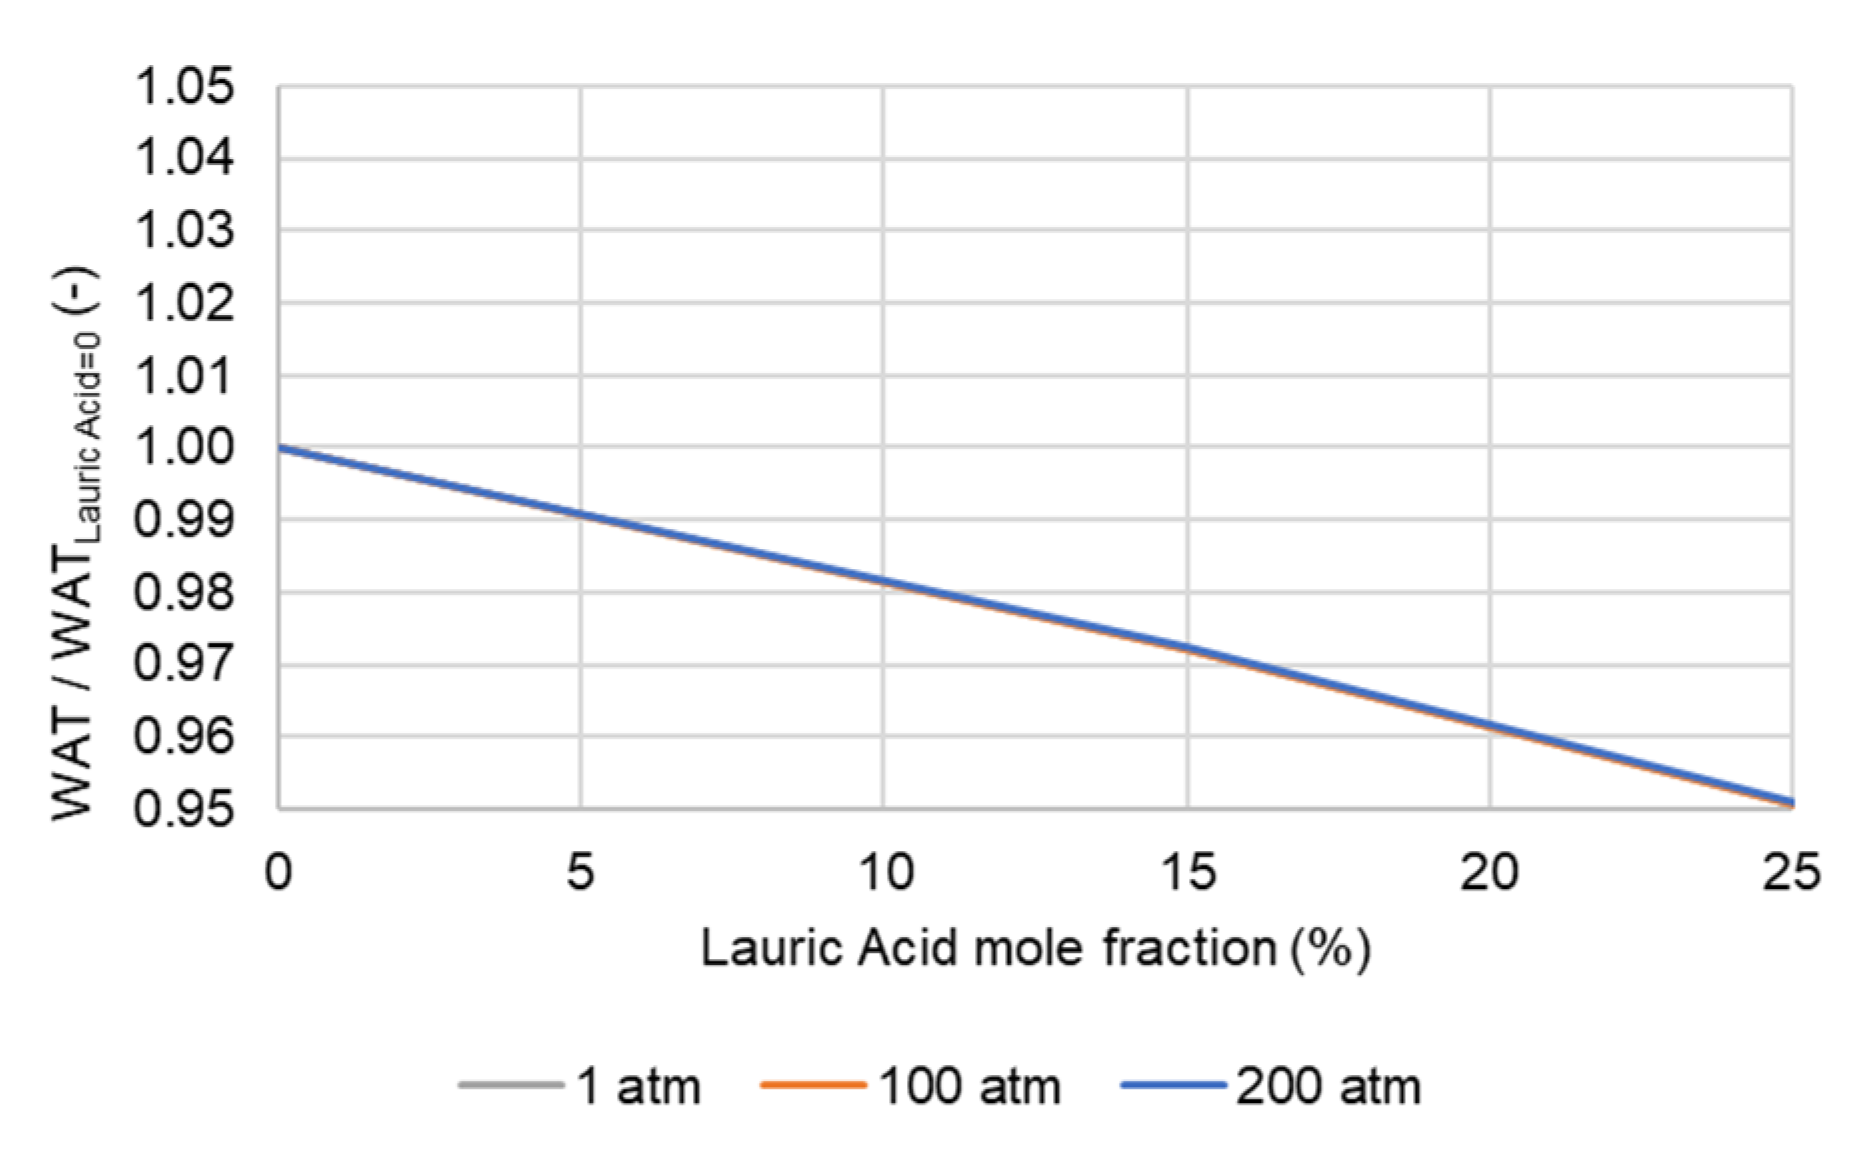
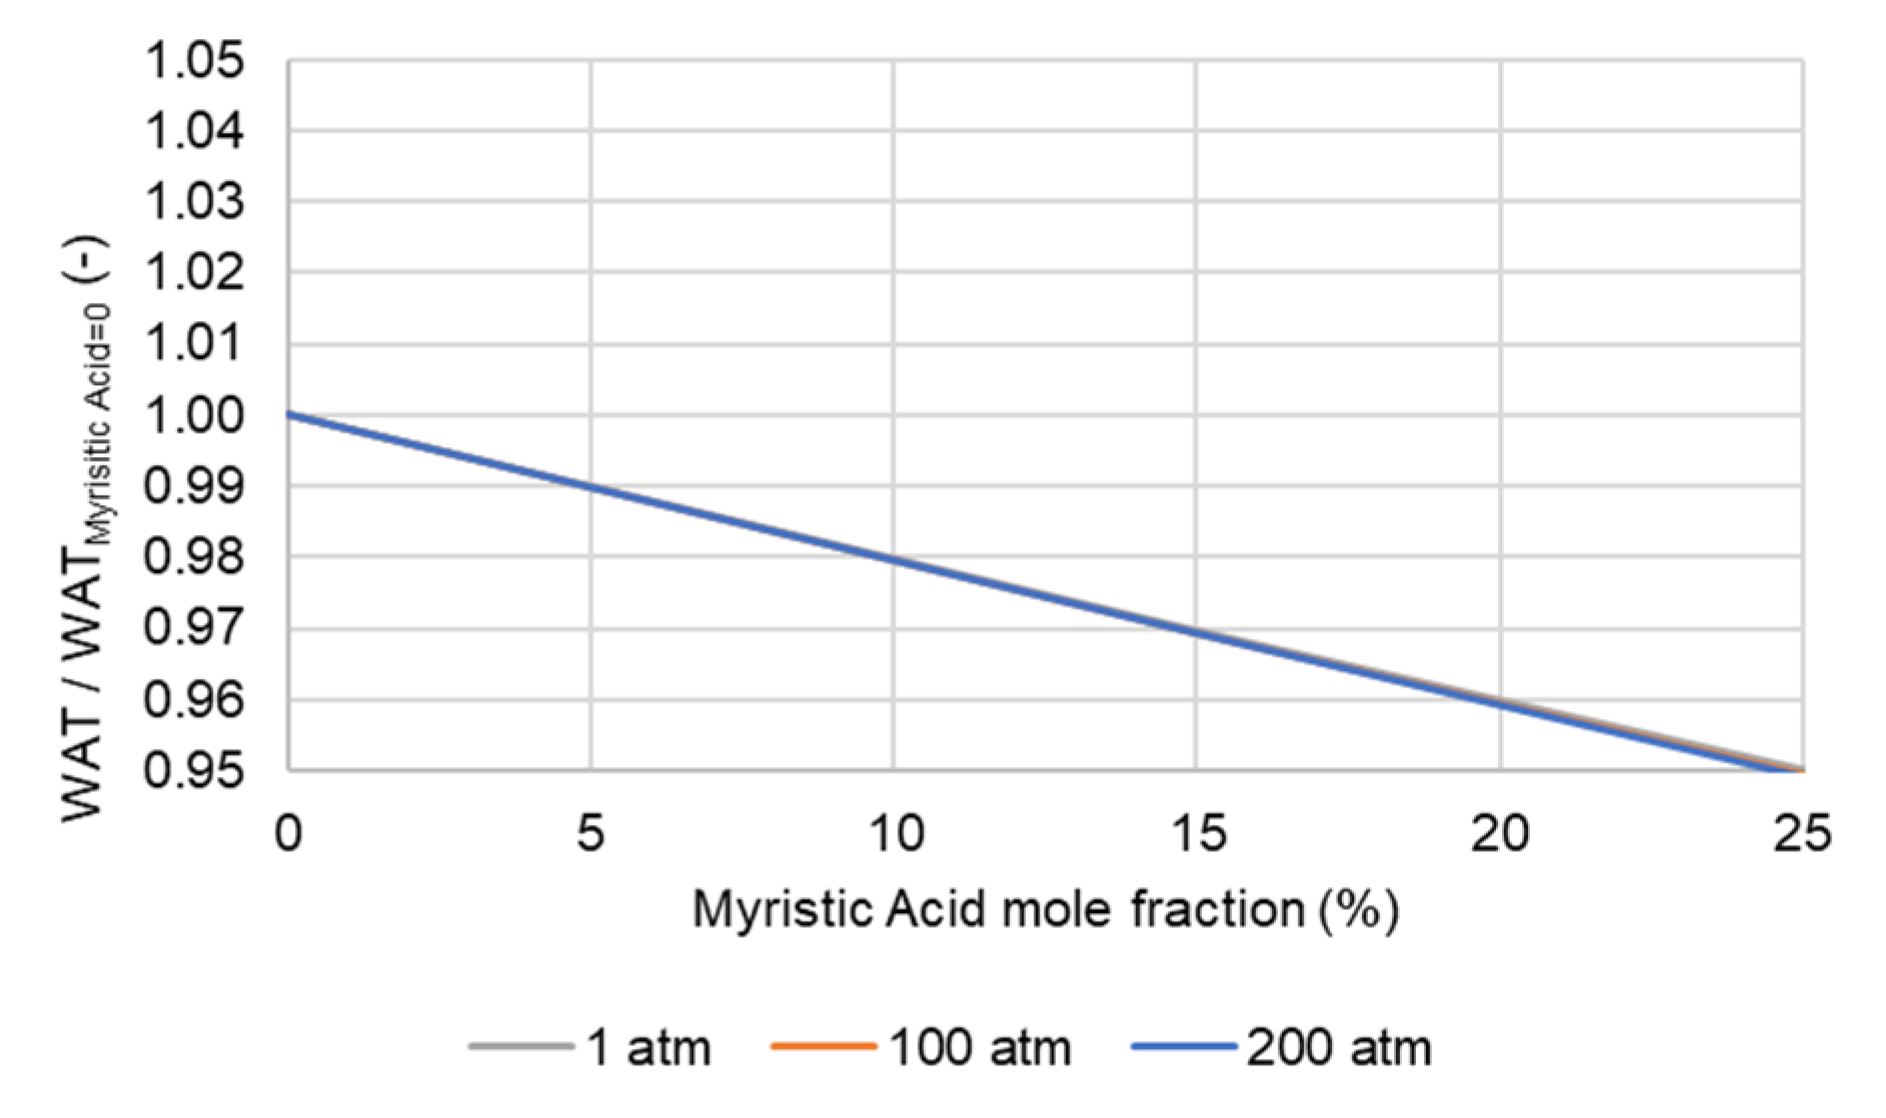
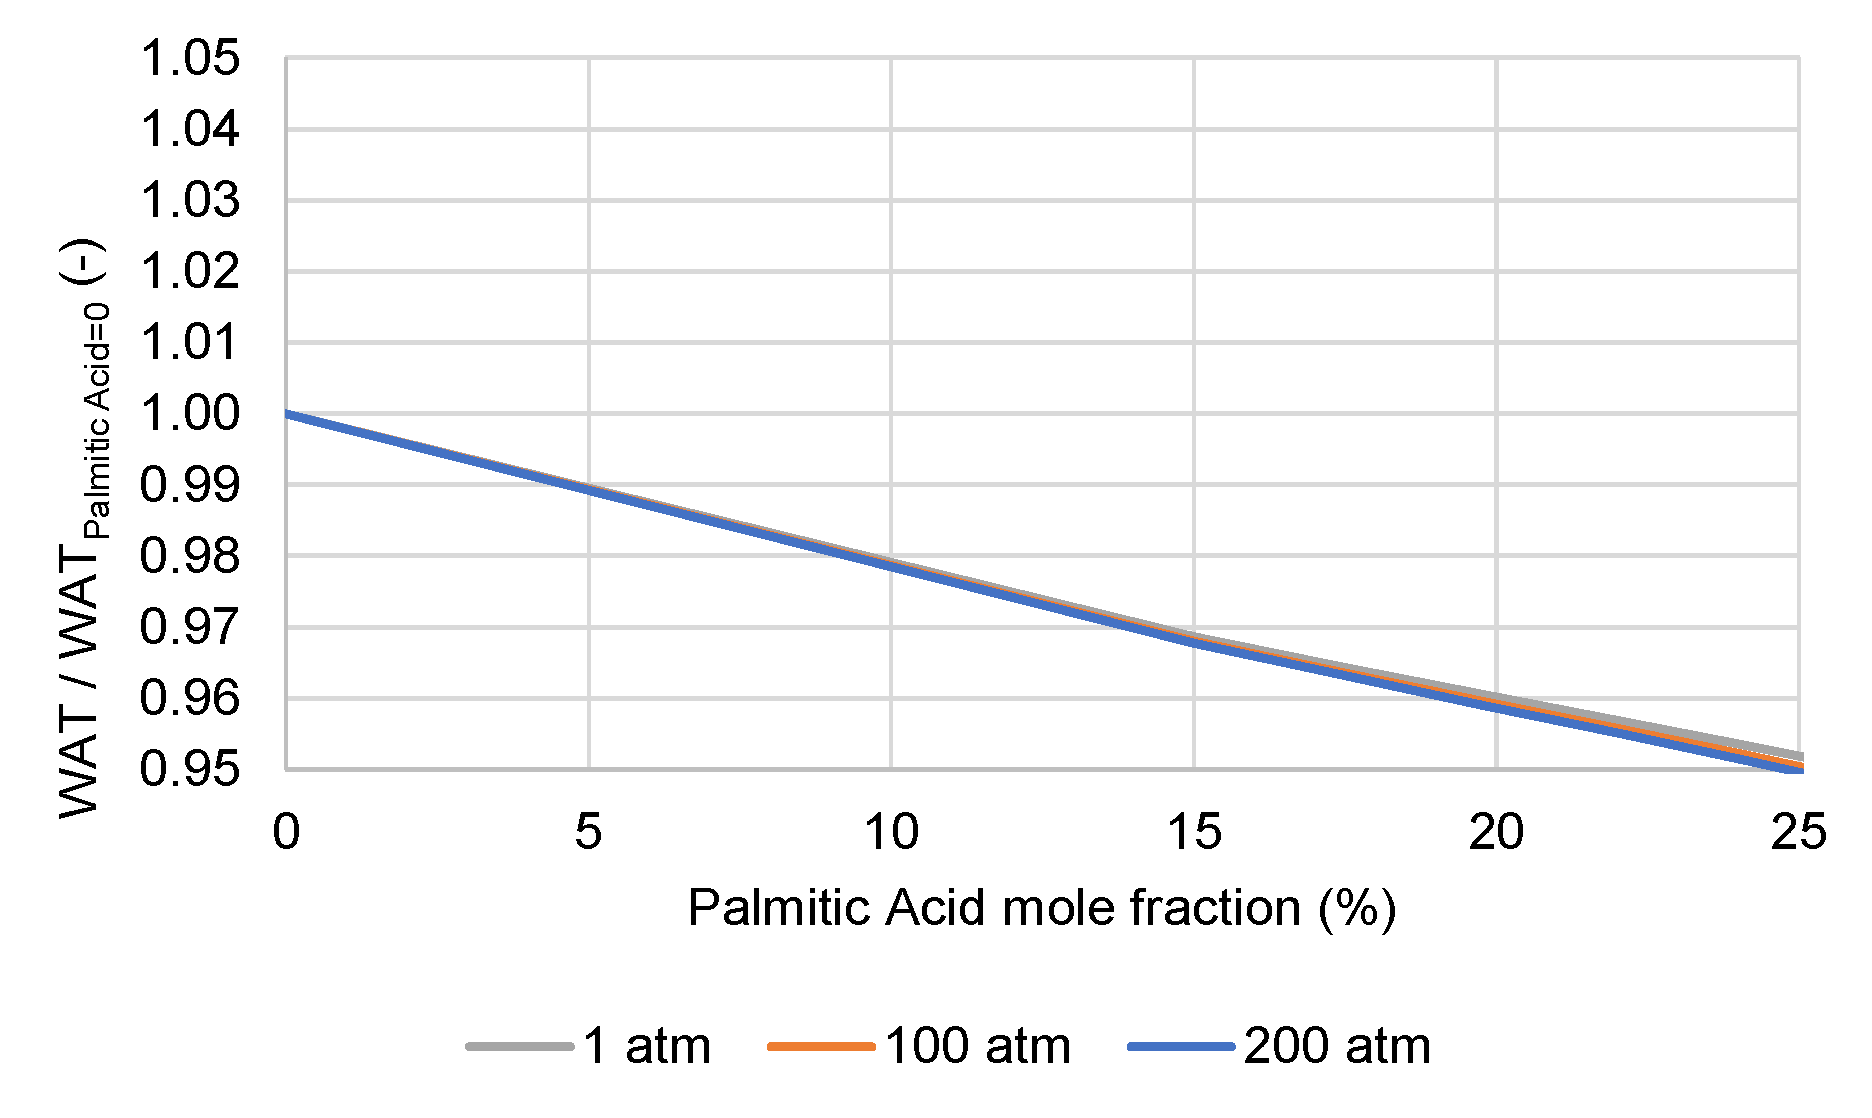
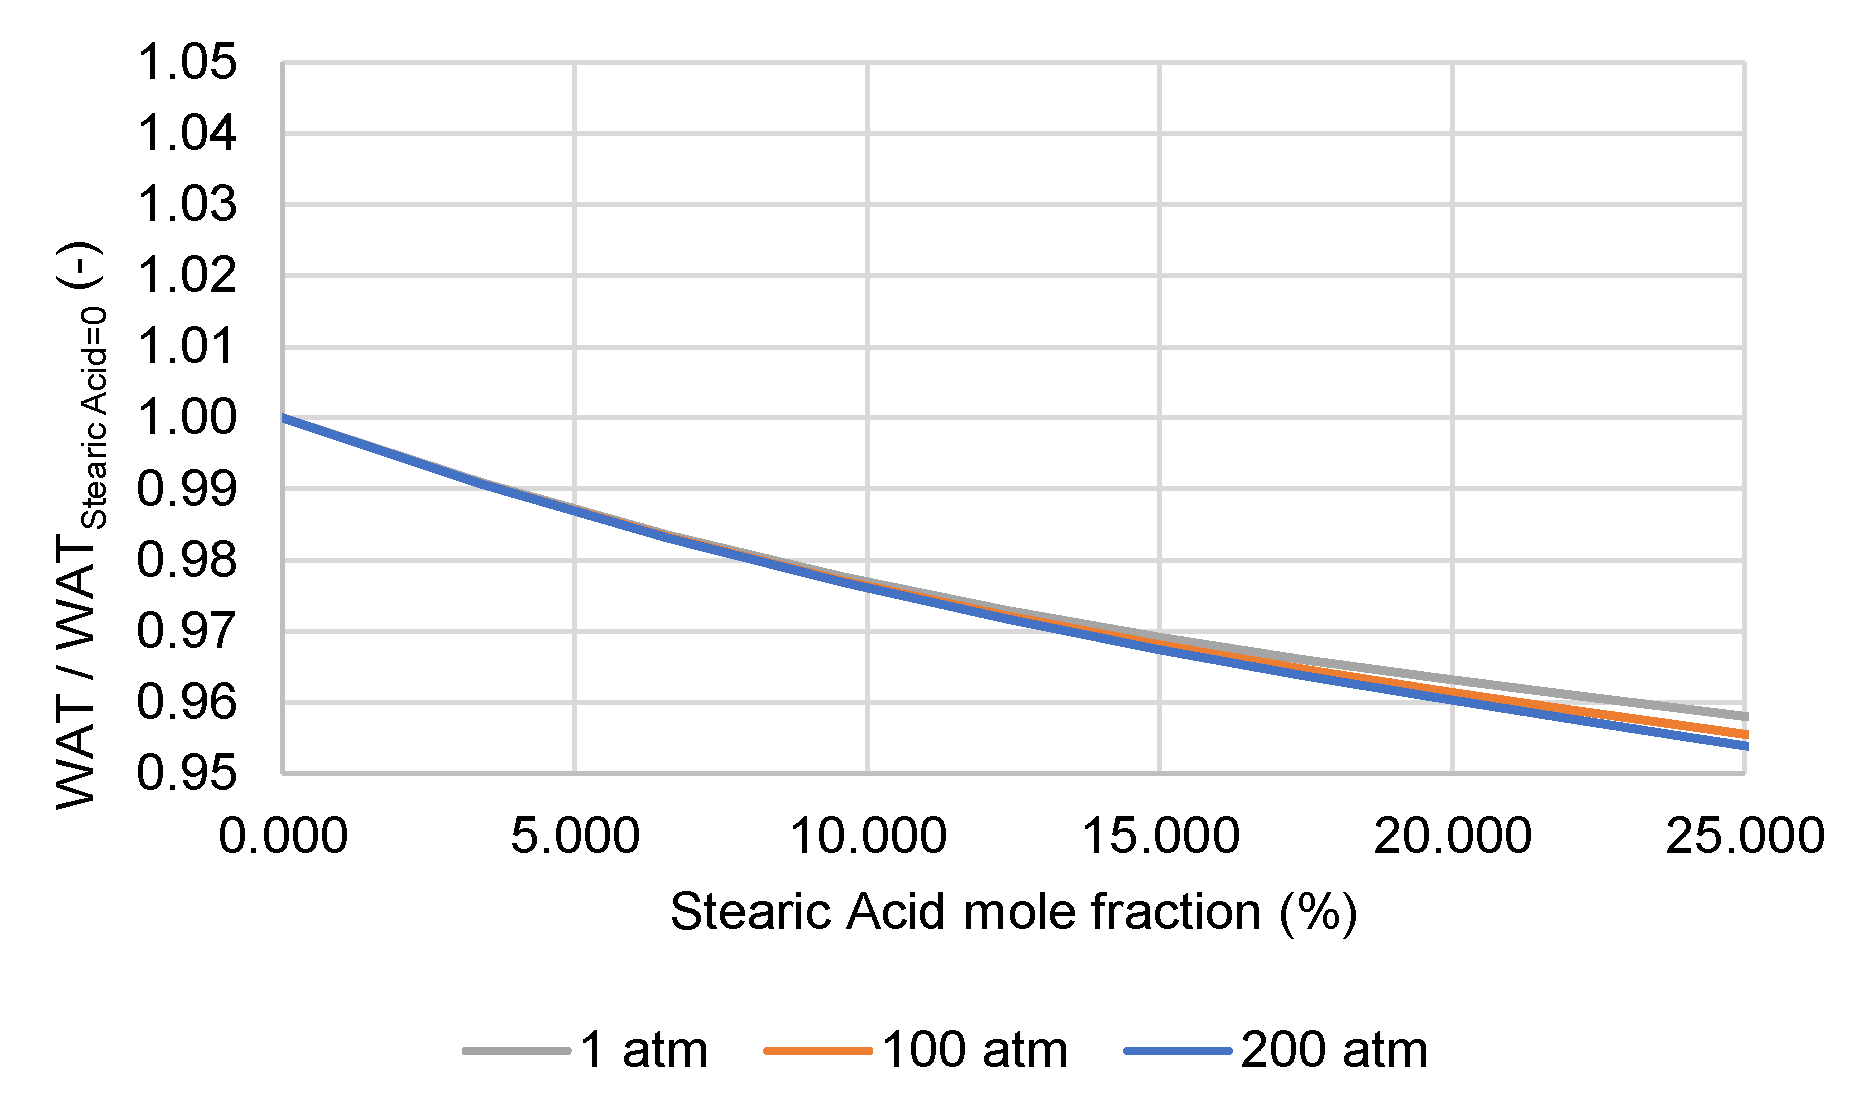
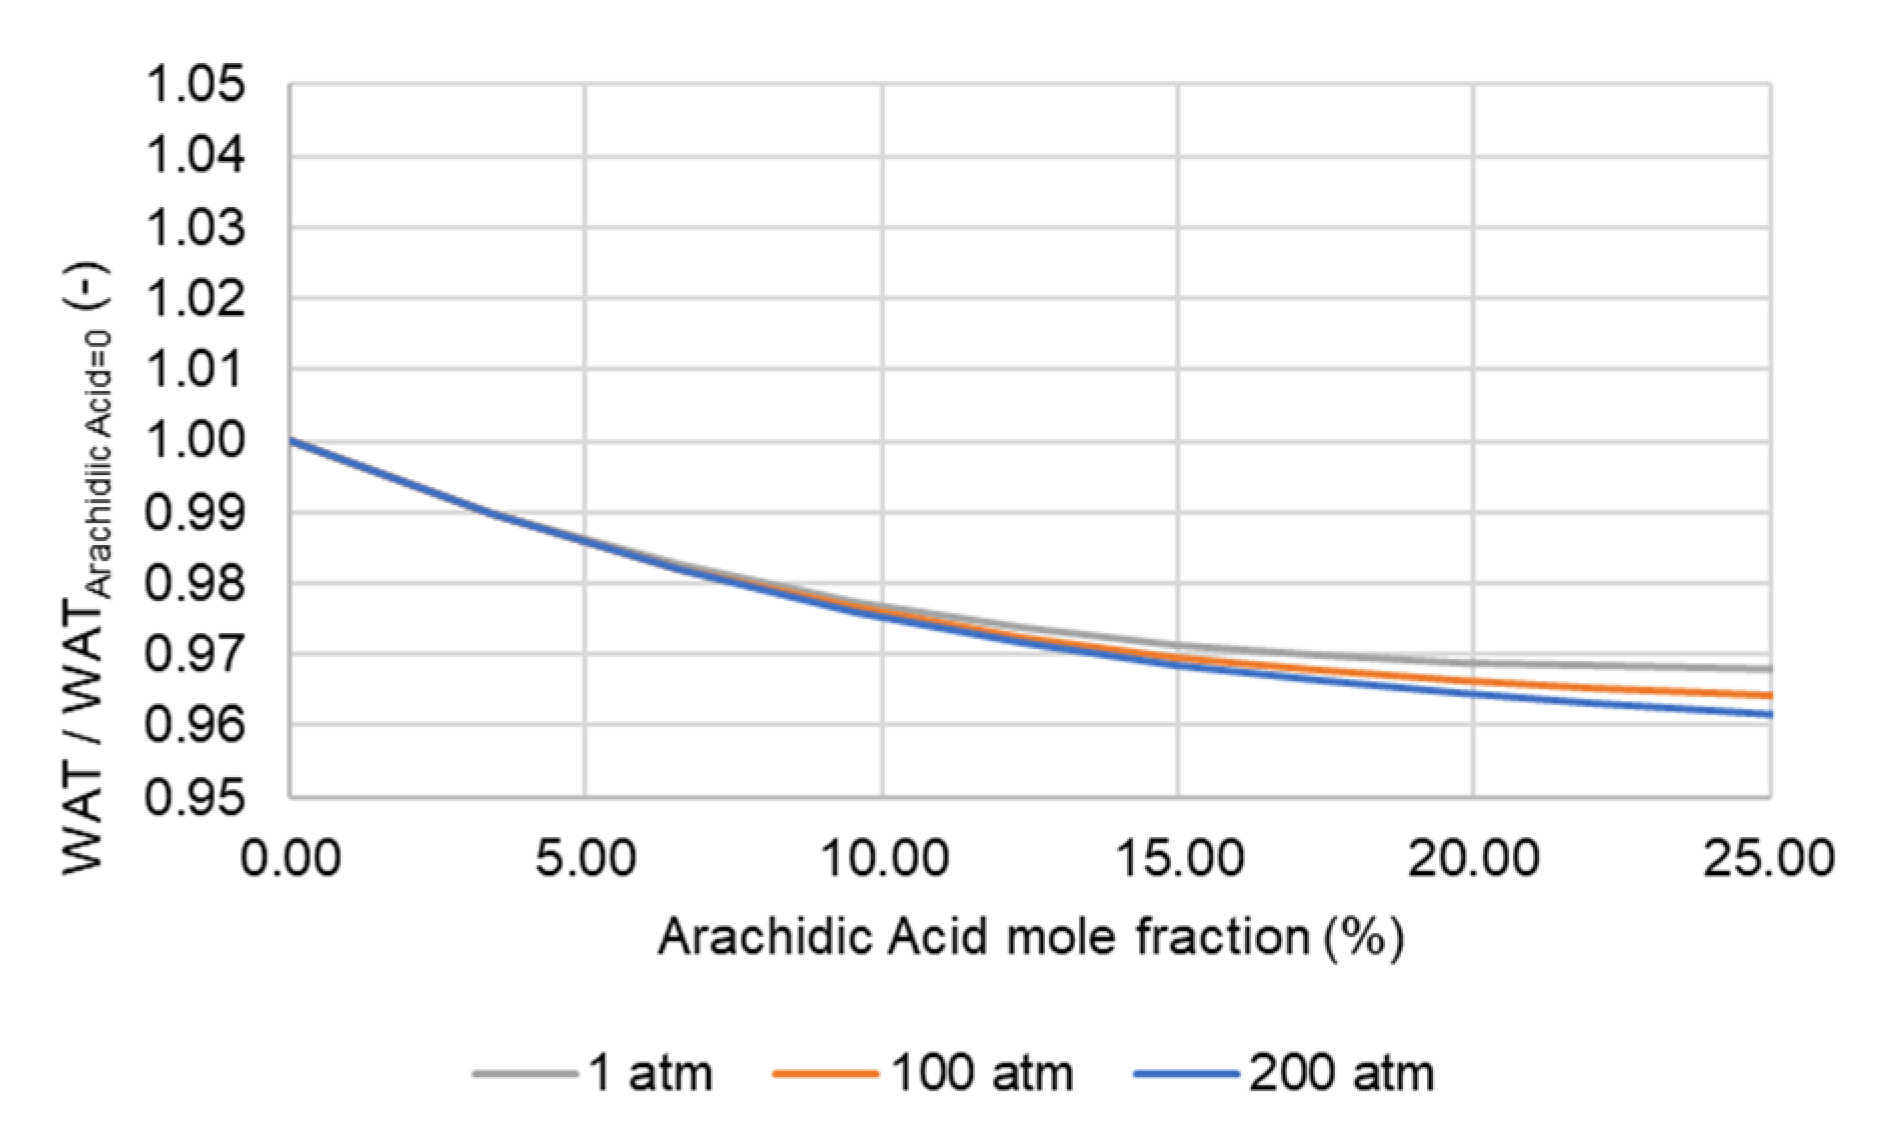
Figure 13, Figure 14, Figure 15, Figure 16, Figure 17, Figure 18, Figure 19 and Figure 20 represent the effect on WAT of adding saturated fatty acids (fatty acids without any double bonds between the carbon atoms) to the waxy crude oil samples. These graphs represent the average as a function of the specific added fatty acid molar fraction.
A general trend towards a decline in the WAT value is shown with an increase in the molar fraction of fatty acids, which leads to the conclusion that adding fatty acids to crude oils may help avoid the precipitation of waxes.
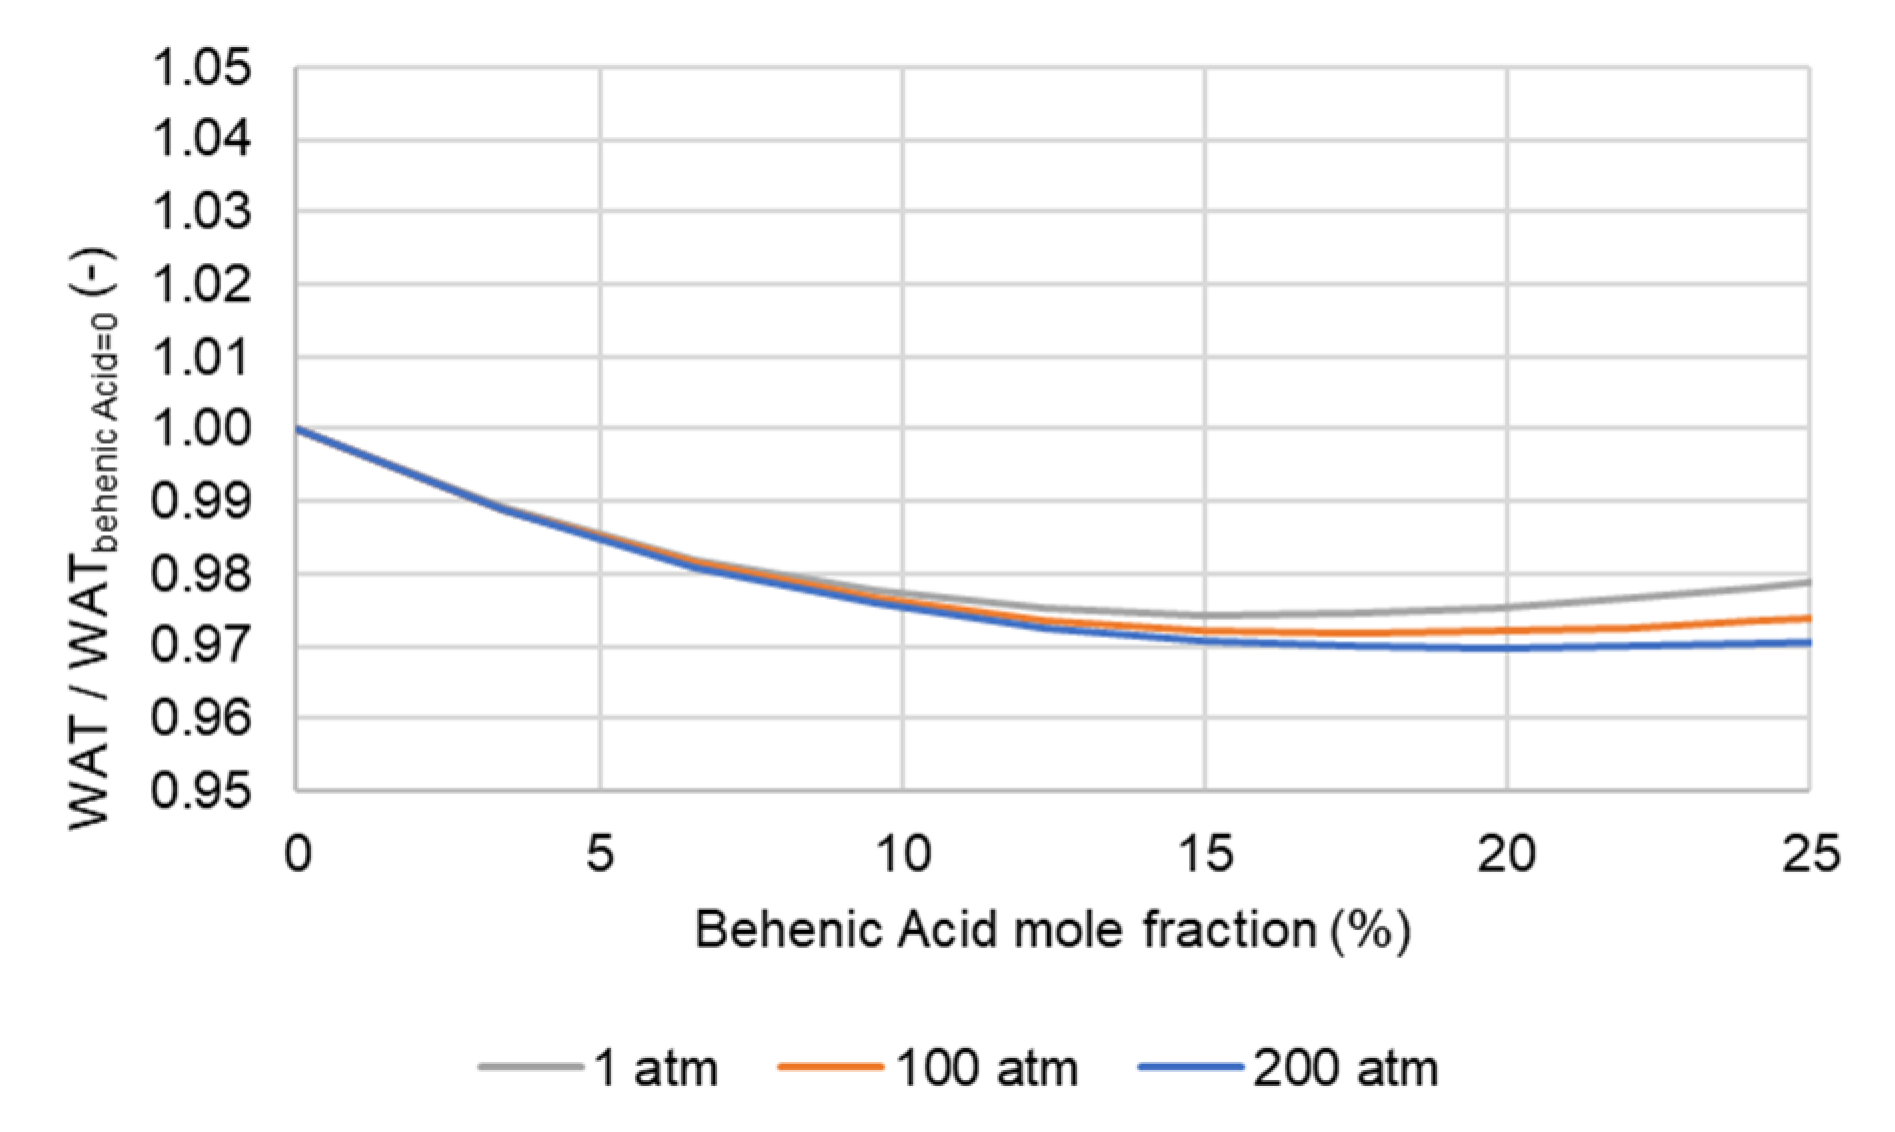
Analysing the previous figures, it is possible to conclude that adding lauric acid (C12:0) or myristic acid (C14:0) to the waxy crude oil samples led to a higher reduction of the expected WAT when compared to the other studied saturated fatty acids. However, some simulations using fatty acids with longer carbon chains, such as the ones performed with stearic acid (C18:0), arachidic acid (C20:0) and behenic acid (C22:0), showed that increasing the mole fraction has a non-linear relationship with the impact on WAT. This indicates that the WAT will not decline linearly, despite the increase in the fatty acid mole fraction. In some circumstances, it may even reverse the overall decreasing trend (as shown in Figure 20). Future research is needed to understand this phenomenon better, namely modelling the intramolecular interactions between hydrocarbons and fatty acids.
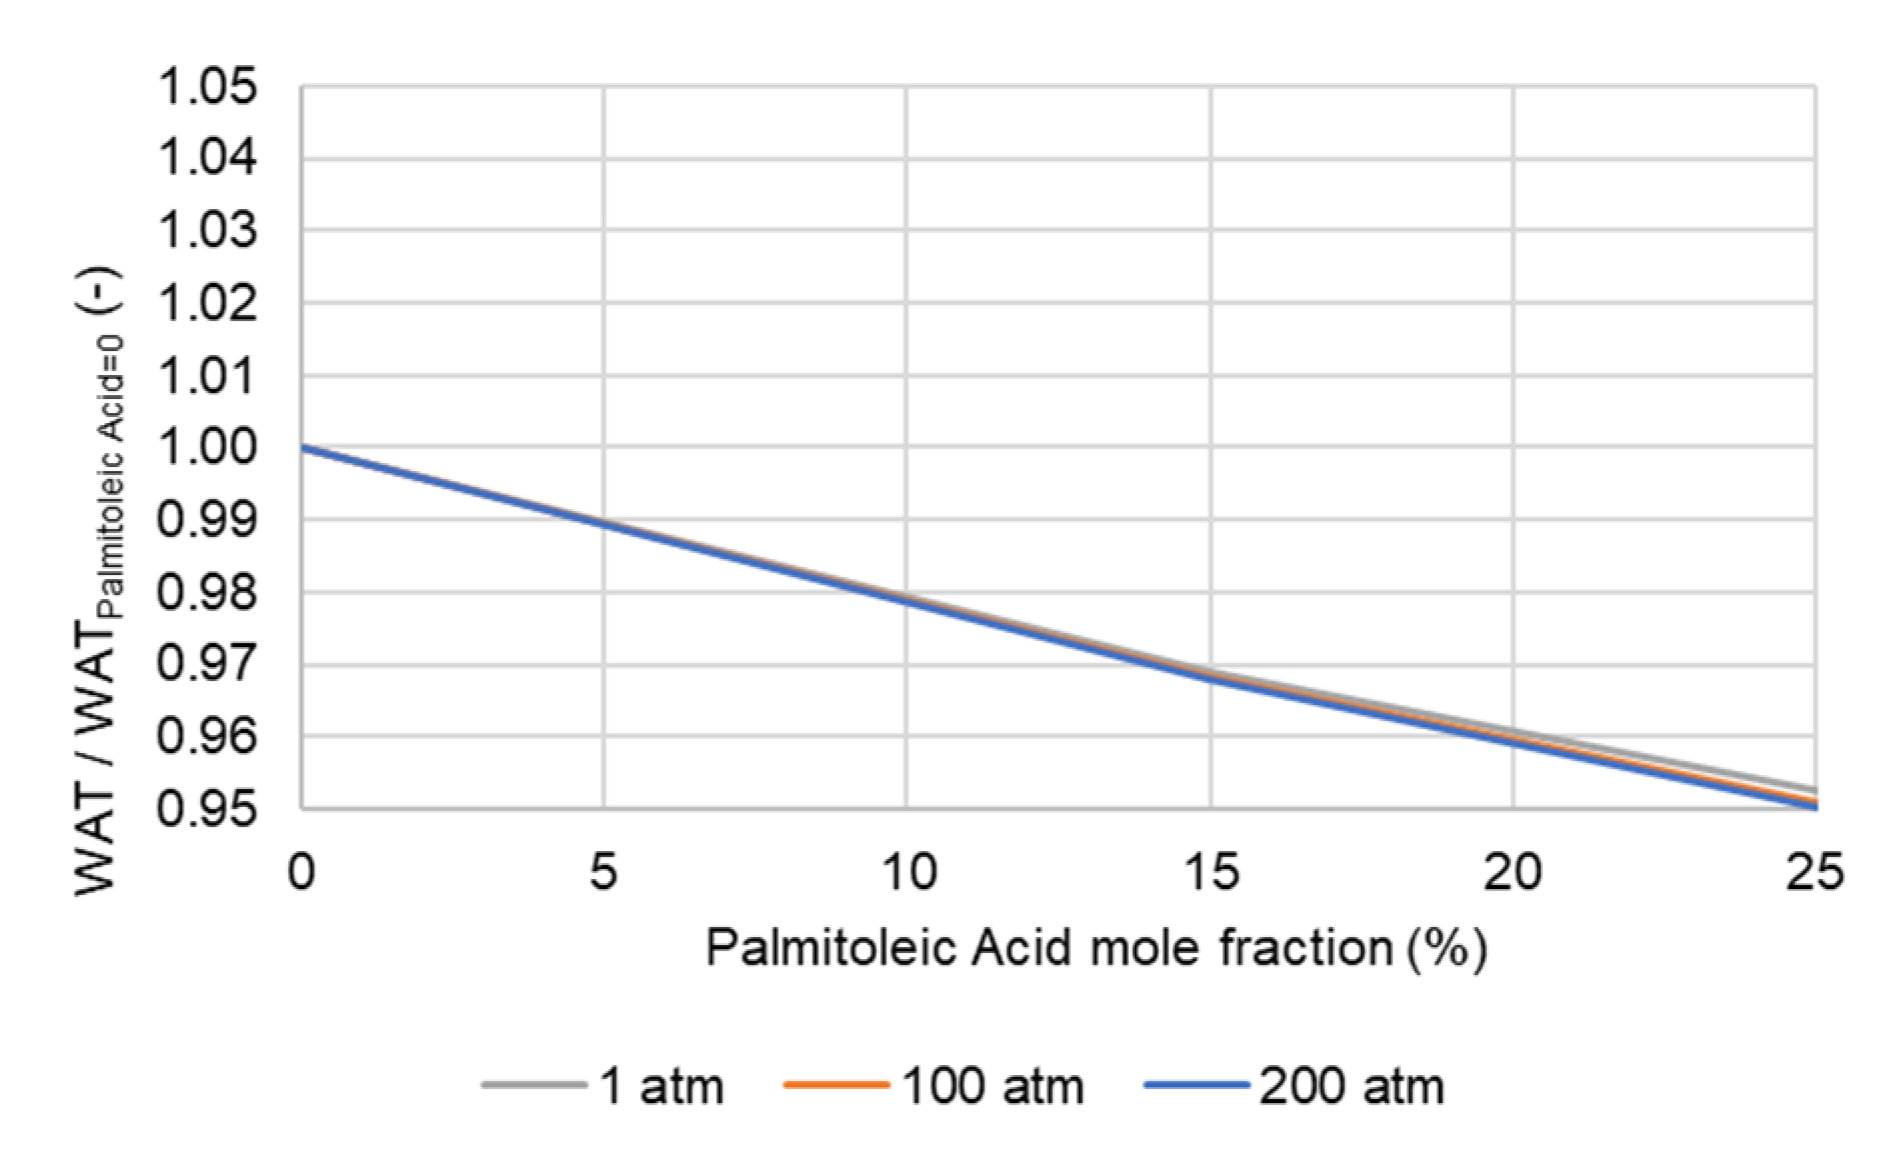
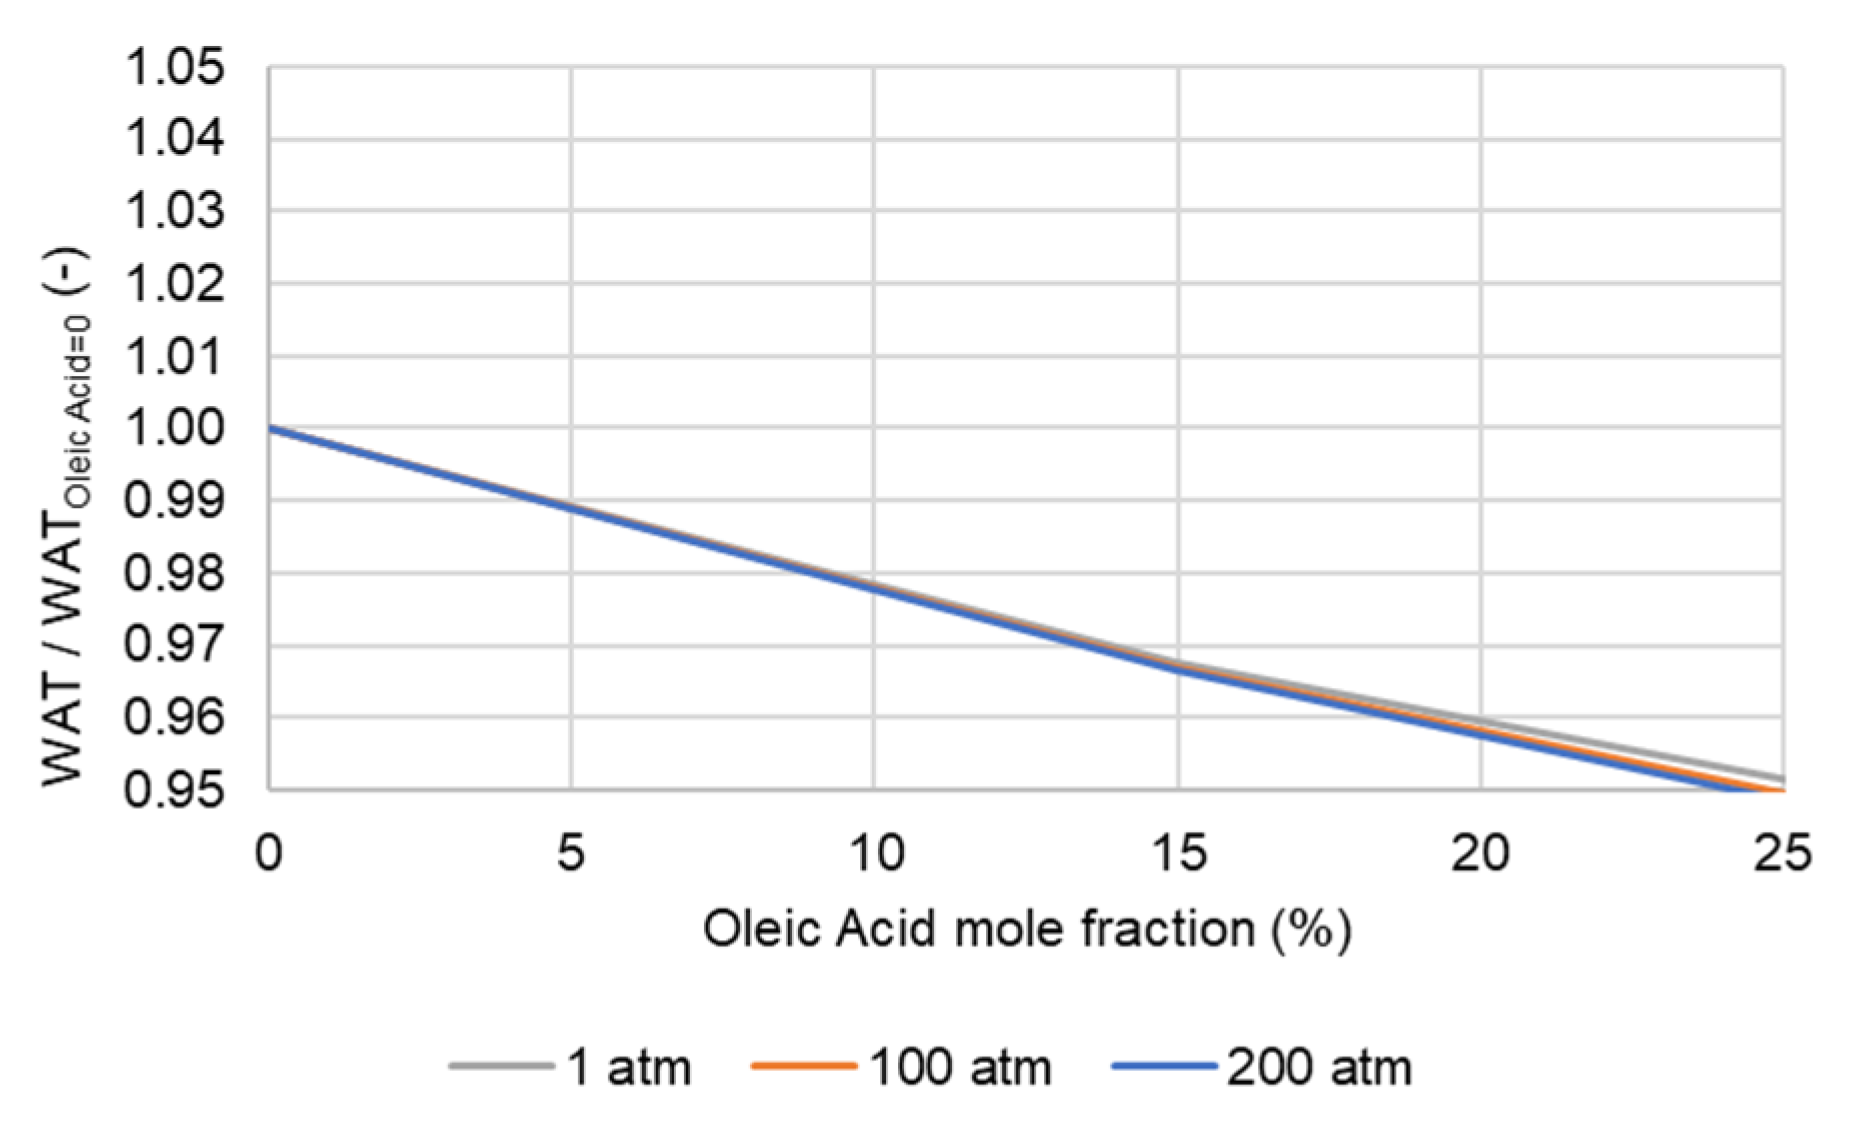
To analyse if the number of double bonds between hydrocarbons will affect the WAT value, palmitoleic acid and oleic acid were evaluated. Figure 21 and Figure 22 show the effect on WAT, after adding monosaturated fatty acids, with one double bond between the carbon atoms, to the waxy crude oil samples.
The results obtained when adding palmitic acid (C16:0) (Figure 17) or palmitoleic acid (C16:1) (Figure 21) to the waxy crude samples showed that the fluid behaved similarly concerning the wax temperature appearance. However, the first one gives slightly better results, which means that although both have sixteen carbons, the existence of a double bond of carbons in the second case can eventually be responsible for that difference.
When comparing the results on WAT after adding stearic acid (C18:0) (Figure 18) and oleic acid (C18:1) (Figure 22), it is possible to conclude that the monosaturated fatty acid is marginally better in avoiding wax precipitation. Thus, it may be inferred that double bonds influenced the outcomes. However, the impact was the opposite of what was observed for C16:0 and C16:1. This conclusion reinforces the need to investigate how the double bound affects the WAT using molecular simulation.
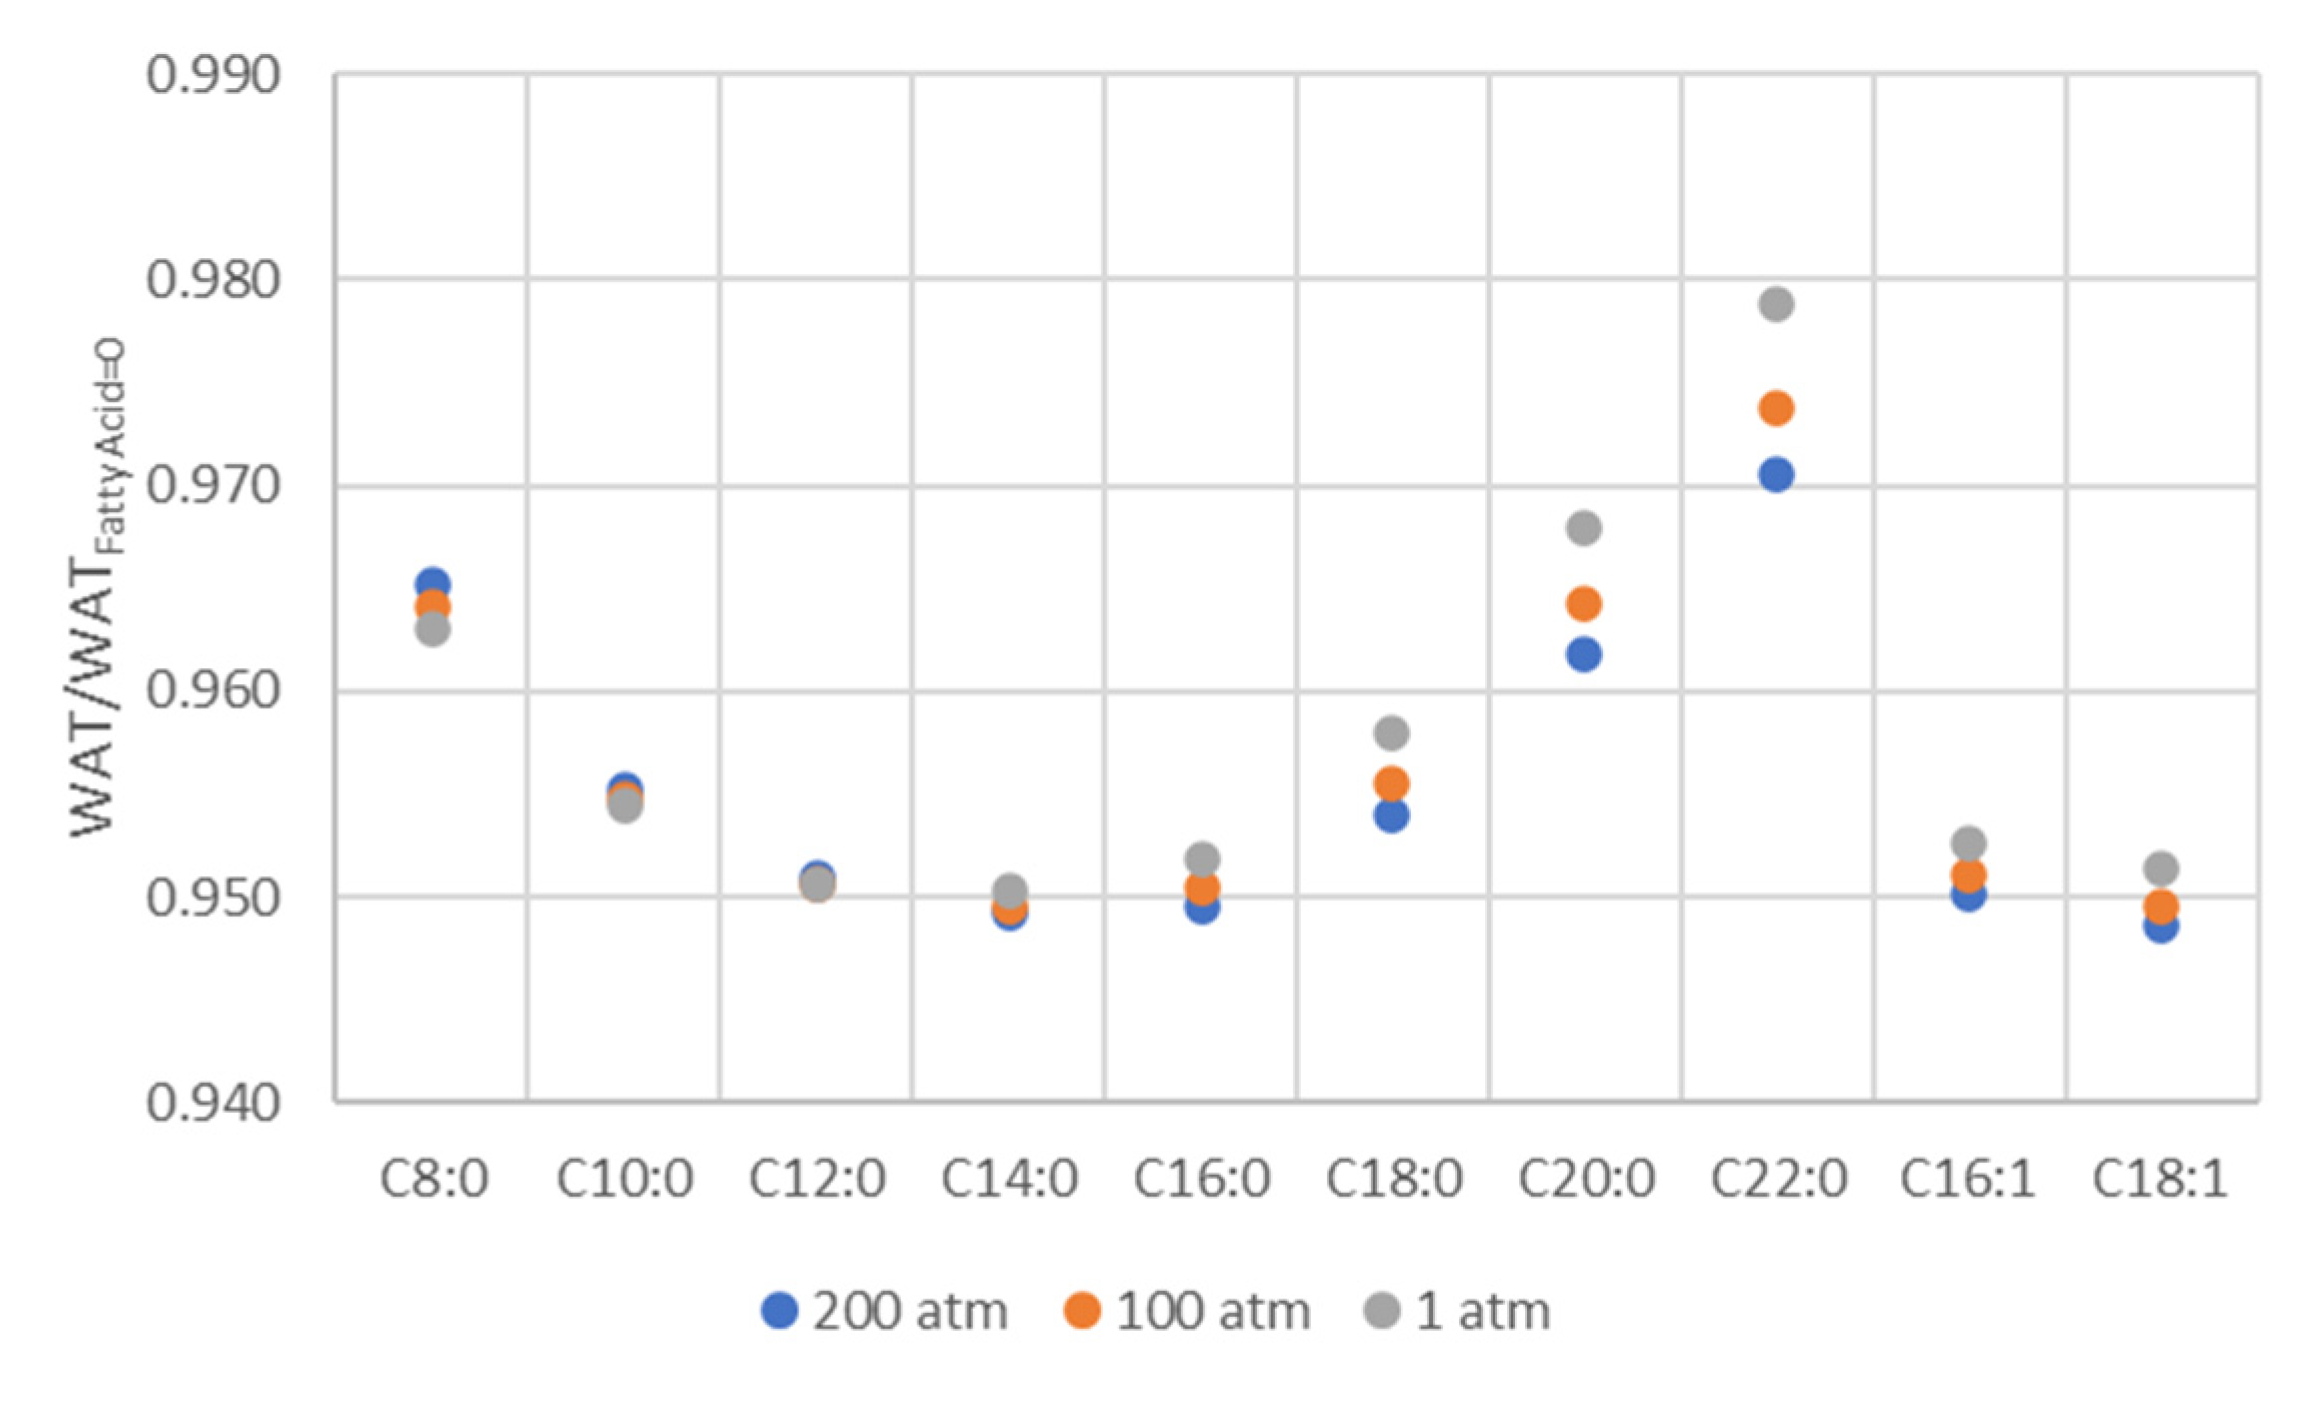
Figure 23 summarizes the values for 25% mole fraction for ten of the studied fatty acids.
As it is possible to observe, myristic acid (C14:0), oleic acid (C18:1), palmitic acid (C16:0), or lauric acid (C12:0) revealed a higher impact on the WAT reduction. The maximum reduction was achieved for , which means that for crude oil sample A, for instance, the WAT is expected to decrease from 59.87 °C to 56.89 °C (@ 1 atm) when myristic acid is added at 25% mole fraction.
5. Conclusions
Crude oil is composed of a set of hydrocarbons which have different structures. When determining a crude oil’s behaviour, all the components, including asphaltenes, resins, lighter distillates, and aromatics, should also be considered. In this case study, true boiling point curves and viscometry enabled full characterization of the samples by defining pseudo components to mimic the crude oil composition.
Results showed that wax appearance temperature (WAT) values are influenced by the pressure to which the fluid is subjected. The greater the pressure is, the greater the WAT value will be, which means that the precipitation of waxes is more likely to occur when the fluid is under higher pressure conditions. The average increase in WAT as a function of the pressure was approximately 1.8 °C/100 bar.
When comparing the impact of adding CH4 or CO2 it was found that the latter has a higher impact on the reduction of WAT. Nevertheless, these gases need to be injected at high pressure to guarantee their effects on preventing wax precipitation.
Unlike the CH4 and CO2 found in standard conditions in the gaseous phase, the studied fatty acids were in the liquid phase. The main conclusion is that the injection of fatty acids prevents the precipitation of waxes. However, the crude oils’ behaviour after adding fatty acids is not similar. In fact, it is possible to observe that when adding C8:0, C10:0, C12:0 and C14:0, the WAT values decrease linearly with the increase of the molar fraction, however, when adding C16:0, C16:1, C18:0, C18:1, C20:0 and C22:0 the behaviour is non-linear.
This work helped to elucidate the wax inhibitors’ effectiveness in reducing WAT values. It enabled us to establish that myristic acid (C14:0), oleic acid (C18:1), palmitic acid (C16:0), or lauric acid (C12:0) allowed a higher reduction in WAT.
Author Contributions
Conceptualisation, A.M.S.; formal analysis, A.M.S.; investigation, A.M.S.; resources, A.M.S.; data curation, A.M.S.; writing—original draft preparation, A.M.S.; writing—review and editing, A.M.S.; visualisation, A.M.S. and T.P.R.; supervision, M.J.P. and H.A.M. All authors have read and agreed to the published version of the manuscript and review.
Funding
The first author would like to acknowledge to Partex Oil & Gas for the technical and financial support, through the Grant UID/ECI/04028/2013 (from September 2017 until March 2018), FCT support through PhD grant number SFRH/BD/131005/2017, COVID/BD/152590/2022, and CERENA (project FCT-UIDB/04028/2020).
Data Availability Statement
Due to confidentiality agreements, supporting data can only be made available to researchers subject to a non-disclosure agreement.
Conflicts of Interest
The authors declare no conflict of interest.
References
- Elsharkawy, A.M.; Al-Sahhaf, T.A.; Fahim, M.A. Wax deposition from Middle East crudes. Fuel 2000, 79, 1047–1055. [Google Scholar] [CrossRef]
- Alcazar-Vara, L.A.; Buenrostro-Gonzalez, E. Characterization of the wax precipitation in Mexican crude oils. Fuel Process. Technol. 2011, 92, 2366–2374. [Google Scholar] [CrossRef]
- Zhang, L.; Qu, S.; Wang, C.; Guan, B. Prediction temperature field and wax deposition based on heat–fluid coupling method. J. Pet. Explor. Prod. Technol. 2018, 9, 639–644. [Google Scholar] [CrossRef] [Green Version]
- Bacon, M.M.; Romero-Zerón, L.B.; Chong, K.K. Determining wax type: Paraffin or naphthene? SPE J. 2010, 15, 969–974. [Google Scholar] [CrossRef]
- Rehan, M.; Nizami, A.-S.S.; Taylan, O.; Al-Sasi, B.O.; Demirbas, A.; Taylan, O.; Al-Sasi, B.O.; Nizami, A.-S.S.; Rehan, M. Determination of wax content in crude oil. Pet. Sci. Technol. 2016, 34, 799–804. [Google Scholar] [CrossRef]
- Souas, F.; Safri, A.; Benmounah, A. A review on the rheology of heavy crude oil for pipeline transportation. Pet. Res. 2021, 6, 116–136. [Google Scholar] [CrossRef]
- Agrawal, K.M.; Khan, H.U.; Surianarayanan, M.; Joshi, G.C. Wax deposition of Bombay high crude oil under flowing conditions. SPE 1990, 69, 794–796. [Google Scholar] [CrossRef]
- Li, S.; Huang, Q.; Wang, C.; Zhao, J.; Liu, K. Research on Transportation Technology and Wax Deposition of Modified Waxy Crude in Oil Pipeline. In Proceedings of the 6th Pacific Rim Conference on Reology, Melbourne, Australia, 20–25 June 2014. [Google Scholar]
- Matzain, A.; Apte, M.S.; Zhang, H.-Q.; Volk, M.; Brill, J.P.; Creek, J.L. Investigation of Paraffin Deposition During Multiphase Flow in Pipelines and Wellbores—Part 1: Experiments. J. Energy Resour. Technol. 2002, 124, 180–186. [Google Scholar] [CrossRef]
- Hammami, A.; Ratulowski, J.; Coutinho, J.A.P. Cloud points: Can we measure or model them? Pet. Sci. Technol. 2003, 21, 345–358. [Google Scholar] [CrossRef]
- Erickson, D.D.; Niesen, V.G.; Brown, T.S. Thermodynamic measurement and prediction of paraffin precipitation in crude oil. In Proceedings of the SPE Annual Technical Conference and Exhibition, Houston, TX, USA, 3–6 October 1993; pp. 933–948. [Google Scholar] [CrossRef]
- Oyekunle, L.; Adeyanju, O. Thermodynamic prediction of paraffin wax precipitation in crude oil pipelines. Pet. Sci. Technol. 2011, 29, 208–217. [Google Scholar] [CrossRef]
- Kök, M.V.; Letoffe, J.M.; Claudy, P. DSC and rheometry investigations of crude oils. J. Therm. Anal. Calorim. 1999, 56, 959–965. [Google Scholar] [CrossRef]
- Hammami, A.; Raines, M.A.M.A. Paraffin Deposition From Crude Oils: Comparison of Laboratory Results with Field Data. SPE J. 1999, 4, 9–18. [Google Scholar] [CrossRef]
- Matlach, W.J.; Newberry, M.E. Paraffin Deposition and Rheological Evaluation of High Wax Content Altamont Crude Oils. SPE J. 1983, 11851, 321–325. [Google Scholar]
- Sousa, A.L.; Matos, H.A.; Guerreiro, L.P. Preventing and removing wax deposition inside vertical wells: A review. J. Pet. Explor. Prod. Technol. 2019, 9, 2091–2107. [Google Scholar] [CrossRef]
- Huang, Z.; Zheng, S.; Fogler, H.S. Wax deposition: Experimental Characterizations, Theoretical Modeling, and Field Practices, 1st ed.; CRC Press: Boca Raton, FL, USA, 2015. [Google Scholar]
- Guerreiro, L.; Carvalho, C.L.B.; Maciel, C.; Sousa, J.; Caetano, H.; Soares, L.P.; Carneiro, S.; Castanho, S.; Machado, V. The challenge of developing Complex Marginal Fields, example of NE Brazil. In Proceedings of the Abu Dhabi International Petroleum Conference and Exhibition, Abu Dhabi, UAE, 11–14 November 2012; pp. 1–12. [Google Scholar] [CrossRef]
- Sousa, A.M.; Ribeiro, T.P.; Pereira, M.J.; Matos, H.A. On the economic impact of wax deposition on the oil and gas industry. Energy Convers. Manag. X 2022, 16, 100291. [Google Scholar] [CrossRef]
- Sousa, A.L.; Ribeiro, T.P.; Relvas, S.; Barbósa-Póvoa, A. Using Machine Learning for Enhancing the Understanding of Bullwhip Effect in the Oil and Gas Industry. Mach. Learn. Knowl. Extr. 2019, 1, 994–1012. [Google Scholar] [CrossRef] [Green Version]
- Sousa, A.M.; Pereira, M.J.; Matos, H.A. Planning pipeline pigging operations with predictive maintenance. E3S Web Conf. 2021, 266, 01017. [Google Scholar] [CrossRef]
- Wang, J.; Xie, H.; Guo, Z.; Guan, L.; Li, Y. Improved thermal properties of paraffin wax by the addition of TiO2 nanoparticles. Appl. Therm. Eng. 2014, 73, 1541–1547. [Google Scholar] [CrossRef]
- Haj-Shafiei, S.; Serafini, D.; Mehrotra, A.K. A steady-state heat-transfer model for solids deposition from waxy mixtures in a pipeline. Fuel 2014, 137, 346–359. [Google Scholar] [CrossRef]
- Duan, J.; Liu, H.; Jiang, J.; Xue, S.; Wu, J.; Gong, J. Numerical prediction of wax deposition in oil–gas stratified pipe flow. Int. J. Heat Mass Transf. 2017, 105, 279–289. [Google Scholar] [CrossRef]
- Derakhshan, T.; Shariati, A. Prediction of wax precipitation temperature in petroleum reservoirs upon methane injection. J. Pet. Sci. Eng. 2012, 98–99, 1–10. [Google Scholar] [CrossRef]
- Vieira, L.C.; Buchuid, M.B.; Lucas, E.F. Effect of pressure on the crystallization of crude oil waxes. II. Evaluation of crude oils and condensate. Energy Fuels 2010, 24, 2213–2220. [Google Scholar] [CrossRef]
- Pan, H.; Firoozabadi, A.; Fotland, P. Pressure and Composition Effect on Wax Precipitation: Experimental Data and Model Results. SPE Prod. Facil. 1997, 12, 250–258. [Google Scholar] [CrossRef]
- Pauly, J.; Coutinho, J.; Daridon, J.L. High pressure phase equilibria in methane + waxy systems. 1. Methane + heptadecane. Fluid Phase Equilib. 2007, 255, 193–199. [Google Scholar] [CrossRef]
- Daridon, J.L.; Pauly, J.; Coutinho, J.A.P.; Montel, F. Solid-liquid-vapor phase boundary of a North Sea waxy crude: Measurement and modeling. Energy Fuels 2001, 15, 730–735. [Google Scholar] [CrossRef]
- Glaser, M.; Peters, C.J.; Van Der Kool, H.J.; Lichtenthaler, R.N. Phase equilibria of (methane + n-hexadecane) and (p, Vm, T) of n-hexadecane. J. Chem. Thermodyn. 1985, 17, 803–815. [Google Scholar] [CrossRef]
- Puri, S.; Kohn, J.P.; Puri, S. Solid-Liquid-Vapor Equilibrium in the Methane-n-Eicosane and Ethane-n-Eicosane Binary Systems. J. Chem. Eng. Data 1970, 15, 372–374. [Google Scholar] [CrossRef]
- Van Der Kooi, H.J.; Flöter, E.; De Loos, T.W. High-pressure phase equilibria of {(1 − x)CH4 + xCH3(CH2)18CH3}. J. Chem. Thermodyn. 1995, 27, 847–861. [Google Scholar] [CrossRef]
- Flöter, E.; de Loos, T.W.; de S. Arons, J. High pressure solid-fluid and vapour-liquid equilibria in the system (methane + tetracosane). Fluid Phase Equilib. 1997, 127, 129–146. [Google Scholar] [CrossRef]
- Machado, J.J.B.; De Loos, T.W. High pressure solid-fluid and vapour-liquid equilibria in model hyperbaric fluids: The system methane + tetracosane + triacontane. Fluid Phase Equilib. 2005, 228–229, 261–268. [Google Scholar] [CrossRef]
- Masoud, M. Comparing Carbon Dioxide Injection in Enhanced Oil Recovery with other Methods. Austin Chem. Eng. 2015, 2, 1019. [Google Scholar] [CrossRef]
- Chukwudeme, E.A.; Hamouda, A.A. Enhanced oil recovery (EOR) by miscible CO2 and water flooding of asphaltenic and non-asphaltenic oils. Energies 2009, 2, 714–737. [Google Scholar] [CrossRef] [Green Version]
- Hosseinipour, A.; Japper-Jaafar, A.B.; Yusup, S. The Effect of CO2 on Wax Appearance Temperature of Crude Oils. Procedia Eng. 2016, 148, 1022–1029. [Google Scholar] [CrossRef] [Green Version]
- Sousa, A.M.; Matos, H.A.; Guerreiro, L. Wax deposition mechanisms and the effect of emulsions and carbon dioxide injection on wax deposition: Critical review. Petroleum 2020, 6, 215–225. [Google Scholar] [CrossRef]
- Hu, R.; Crawshaw, J.P.; Trusler, J.P.M.; Boek, E.S. Rheology of diluted heavy crude oil saturated with carbon dioxide. Energy Fuels 2015, 29, 2785–2789. [Google Scholar] [CrossRef] [Green Version]
- Chen, G.; Bai, Y.; Zhang, J.; Yuan, W.; Song, H.; Jeje, A. Synthesis of new flow improvers from canola oil and application to waxy crude oil. Pet. Sci. Technol. 2016, 34, 1285–1290. [Google Scholar] [CrossRef]
- Alpandi, A.H.; Husin, H.; Sidek, A. A critical review on the development of wax inhibiting agent in facilitating remediation process of contaminated groundwater. Environ. Sci. Pollut. Res. 2021, 29, 51030–51040. [Google Scholar] [CrossRef]
- Elkatory, M.R.; Soliman, E.A.; Nemr, A.E.; Hassaan, M.A.; Ragab, S.; El-nemr, M.A.; Pantaleo, A. Mitigation and Remediation Technologies of Waxy Crude Oils’ Deposition within Transportation Pipelines: A Review. Polymers 2022, 14, 3231. [Google Scholar] [CrossRef]
- Hafiz, A.A.; Khidr, T.T. Hexa-triethanolamine oleate esters as pour point depressant for waxy crude oils. J. Pet. Sci. Eng. 2007, 56, 296–302. [Google Scholar] [CrossRef]
- Patel, M.R.; Chitte, P.S.; Bharambe, D.P. Oleic acid based polymeric flow improvers for Langhnaj (North Gujarat, India) crude oil. Egypt. J. Pet. 2017, 26, 895–903. [Google Scholar] [CrossRef] [Green Version]
- Deka, B.; Sharma, R.; Mahto, V. Synthesis and performance evaluation of poly (fatty esters-co-succinic anhydride) as pour point depressants for waxy crude oils. J. Pet. Sci. Eng. 2020, 191, 107153. [Google Scholar] [CrossRef]
- Akinyemi, O.P.; Udonne, J.D.; Efeovbokhan, V.E.; Ayoola, A.A. A study on the use of plant seed oils, triethanolamine and xylene as flow improvers of Nigerian waxy crude oil. J. Appl. Res. Technol. 2016, 14, 195–205. [Google Scholar] [CrossRef] [Green Version]
- Akinyemi, O.P.; Udonne, J.D.; Oyedeko, K.F. Study of effects of blend of plant seed oils on wax deposition tendencies of Nigerian waxy crude oil. J. Pet. Sci. Eng. 2018, 161, 551–558. [Google Scholar] [CrossRef]
- Akinyemi, O.P.; Udonne, J.D.; Oyedeko, K.F.K. Experimental Study of Utilization of Plant Seed Oil as Pour Point Depressant for Nigerian Waxy Crude Oil. Int. J. Sci. Eng. Res. 2018, 9, 205–209. [Google Scholar]
- Ragunathan, T.; Husin, H.; Wood, C.D. Effects of Crude Palm Oil and Crude Palm Kernel Oil upon Wax Inhibition. ACS Omega 2020, 5, 19342–19349. [Google Scholar] [CrossRef]
- Ragunathan, T.; Wood, C.D.; Husin, H. The influence of palm oil additives on the pour point and wax deposition tendencies of Chenor crude oil. J. Pet. Explor. Prod. Technol. 2022, 12, 589–599. [Google Scholar] [CrossRef]
- Sousa, A.M.; Andrade, T.A.; Errico, M.; Coelho, J.P.; Filipe, R.M.; Matos, H.A. Fatty Acid Content in Biomasses: State-of-the-Art and Novel Physical Property Estimation Methods. Int. J. Chem. Eng. 2019, 2019, 2430234. [Google Scholar] [CrossRef]
- Ragunathan, T.; Zaqwan, J.; Wood, C.D.; Husin, H. The rheological behavior of crude oil in the presence of palm oil additives. J. Pet. Explor. Prod. 2021, 11, 2833–2843. [Google Scholar] [CrossRef]
- Zhang, J.; Guo, Z.; Du, W.; Gu, X.; Wang, M.; Zhang, Z.; Ma, Y.; Chen, G. Preparation and Performance of Vegetable Oils Fatty Acids Hydroxylmethyl Triamides as Crude Oil Flow Improvers. Pet. Chem. 2018, 58, 1070–1075. [Google Scholar] [CrossRef]
- Hansen, J.H.; Fredenslund, A.; Pedersen, K.S.; Rønningsen, H.P. A thermodynamic model for predicting wax formation in crude oils. AIChE J. 1988, 34, 1937–1942. [Google Scholar] [CrossRef]
- Brown, T.S.; Niesen, V.G.; Erickson, D.D. Effects of light ends and high pressure on paraffin formation. In Proceedings of the SPE Annual Technical Conference and Exhibition, New Orleans, AK, USA, 25–28 September 1994; pp. 415–430. [Google Scholar] [CrossRef]
- Prausnitz, J.M.; Lichtenthaler, R.N.; Azevedo, E.G. Molecular Thermodynamics of Fluid-Phase Equilibria, 3rd ed.; Prentice Hall: Hoboken, NJ, USA, 1999; Volume 2. [Google Scholar] [CrossRef]
- Banki, R.; Firoozabadi, A. Modeling of Wax Deposition in Pipelines From Irreversible Thermodynamics. In Proceedings of the SPE Annual Technical Conference and Exhibition, San Antonio, TX, USA, 29 September–2 October 2002; pp. 1–15. [Google Scholar] [CrossRef]
- Coutinho, J.A.P. Predictive local composition models: NRTL and UNIQUAC and their application to model solid-liquid equilibrium of n-alkanes. Fluid Phase Equilib. 1999, 158–160, 447–457. [Google Scholar] [CrossRef]
- Coutinho, J.A.P.; Andersen, S.I.; Stenby, E.H. Evaluation of activity coefficient models in prediction of alkane solid-liquid equilibria. Fluid Phase Equilib. 1995, 103, 23–39. [Google Scholar] [CrossRef]
- Coutinho, J.A.P.; Stenby, E.H. Predictive Local Composition Models for Solid/Liquid Equilibrium in n -Alkane Systems: Wilson Equation for Multicomponent Systems. Ind. Eng. Chem. Res. 1996, 35, 918–925. [Google Scholar] [CrossRef]
- ASTM D4402; ASTM Standard Test Method for Viscosity Determination of Asphalt at Elevated Temperatures Using a Rotational Viscometer. ASTM Standards: West Conshohocken, PA, USA, 2015.
- Huber, M.L.; Hanley, H.J.M. The Corresponding-States Principle: Dense Fluids. In Transport Properties of Fluids Their Correlation, Prediction and Estimation; Cambridge University Press: Cambridge, UK, 1996. [Google Scholar] [CrossRef]
- Sadeghazad, A.; Christiansen, R.L.; Sobhi, G.A.; Edalat, M. The Prediction of Cloud Point Temperature: In Wax Deposition. In Proceedings of the SPE Asia Pacific Oil and Gas Conference and Exhibition, Brisbane, Australia, 16–18 October 2000. [Google Scholar] [CrossRef]
Figure 1.
Typical wax precipitation curve.

Figure 2.
Methodology used to characterise the waxy crude oil samples.

Figure 3.
Volume yield as a function of temperature.

Figure 4.
True Boling Point Curves.

Figure 5.
Specific gravity as a function of TBP.

Figure 6.
Cumulative volume and specific gravity as a function of temperature.

Figure 7.
Tuning the model with the viscosity experimental data.


Figure 8.
Cumulative volume (%) as a function of carbon number.


Figure 9.
Phase diagram. Vapour–liquid equilibrium and wax formation.


Figure 10.
Wax precipitation curve.

Figure 11.
CH4 effect on WAT.

Figure 12.
CO2 effect on WAT.

Figure 13.
Caprylic acid (C8:0) effect on WAT.

Figure 14.
Capric acid (C10:0) effect on WAT.

Figure 15.
Lauric acid (C12:0) effect on WAT.

Figure 16.
Myristic acid (C14:0) effect on WAT.

Figure 17.
Palmitic acid (C16:0) effect on WAT.

Figure 18.
Stearic acid (C18:0) effect on WAT.

Figure 19.
Arachidic acid (C20:0) effect on WAT.

Figure 20.
Behenic acid (C22:0) effect on WAT.

Figure 21.
Palmitoleic acid (C16:1) effect on WAT.

Figure 22.
Oleic acid (C18:1) effect on WAT.

Figure 23.
for different fatty acids for a 25% mole fraction.


Table 1.
Gas composition used in the laboratory tests developed by Vieira et al. [26].
Table 1.
Gas composition used in the laboratory tests developed by Vieira et al. [26].
| Compounds | Gas 1 (%) | Gas 2 (%) | Gas 3 (%) | Gas 4 (%) |
|---|---|---|---|---|
| nitrogen | 99.996 | - | 0.500 | 0.560 |
| carbon dioxide | - | - | 0.400 | 0.620 |
| methane | - | 99.995 | 86.940 | 66.620 |
| ethane | - | - | 10.000 | 13.910 |
| propane | - | - | 2.000 | 11.330 |
| isobutene | - | - | 0.050 | 2.820 |
| n-butane | - | - | 0.040 | 4.080 |
| isopentane | - | - | 0.030 | 0.030 |
| n-pentane | - | - | 0.020 | 0.030 |
| n-hexane | - | - | 0.020 | - |
Table 2.
°API from Brazilian crude oil samples.
| Crude Oil Sample | °API @60°F |
|---|---|
| Sample A | 27.7 |
| Sample B | 26.6 |
| Sample C | 27.2 |
| Sample D | 27.0 |
| Sample E | 26.4 |
| Sample F | 24.3 |
| Sample G | 26.9 |
| Sample H | 27.3 |
| Sample I | 27.0 |
| Sample J | 27.6 |
| Sample K | 26.9 |
| Sample L | 26.6 |
| Sample M | 26.7 |
| Sample N | 26.4 |
| Sample O | 27.4 |
| Sample P | 25.5 |
| Sample Q | 26.2 |
Table 3.
Wax appearance temperature (°C) using cross polar microscopy (CPM) and differential scanning calorimetry (DSC) for different pressures (P).
Table 3.
Wax appearance temperature (°C) using cross polar microscopy (CPM) and differential scanning calorimetry (DSC) for different pressures (P).
| P = 1 atm | P = 100 atm | P = 200 atm | ||||
|---|---|---|---|---|---|---|
| Crude Oil | CPM | DSC | CPM | DSC | CPM | DSC |
| Sample A | 59.87 | 47.75 | 61.71 | 49.57 | 63.56 | 51.39 |
| Sample B | 60.99 | 49.31 | 62.80 | 51.10 | 64.62 | 52.91 |
| Sample C | 60.91 | 49.20 | 62.72 | 50.99 | 64.55 | 52.80 |
| Sample D | 60.02 | 49.22 | 62.86 | 51.03 | 64.72 | 52.86 |
| Sample E | 60.21 | 48.26 | 62.02 | 50.05 | 63.84 | 51.85 |
| Sample F | 61.58 | 50.08 | 63.39 | 51.87 | 65.22 | 53.67 |
| Sample G | 60.07 | 48.08 | 61.87 | 49.86 | 63.69 | 51.66 |
| Sample H | 60.83 | 49.09 | 62.64 | 50.87 | 64.46 | 52.68 |
| Sample I | 61.15 | 49.42 | 62.99 | 51.23 | 64.84 | 53.06 |
| Sample J | 60.94 | 49.25 | 62.75 | 51.04 | 64.58 | 52.84 |
| Sample K | 61.43 | 49.84 | 63.24 | 51.63 | 65.07 | 53.43 |
| Sample L | 61.72 | 50.29 | 63.53 | 52.08 | 65.36 | 53.88 |
| Sample M | 62.52 | 51.59 | 64.34 | 53.38 | 66.17 | 55.19 |
| Sample N | 61.43 | 49.85 | 63.24 | 51.64 | 65.07 | 53.44 |
| Sample O | 60.76 | 48.99 | 62.57 | 50.78 | 64.39 | 52.58 |
| Sample P | 61.91 | 50.60 | 63.72 | 52.39 | 65.55 | 54.20 |
| Sample Q | 59.60 | 47.46 | 61.41 | 49.24 | 63.23 | 51.04 |
Disclaimer/Publisher’s Note: The statements, opinions and data contained in all publications are solely those of the individual author(s) and contributor(s) and not of MDPI and/or the editor(s). MDPI and/or the editor(s) disclaim responsibility for any injury to people or property resulting from any ideas, methods, instructions or products referred to in the content. |
© 2022 by the authors. Licensee MDPI, Basel, Switzerland. This article is an open access article distributed under the terms and conditions of the Creative Commons Attribution (CC BY) license (https://creativecommons.org/licenses/by/4.0/).
Share and Cite
MDPI and ACS Style
Sousa, A.M.; Ribeiro, T.P.; Pereira, M.J.; Matos, H.A. How Do Methane, Carbon Dioxide or Fatty Acids Affect Waxy Crude Oils? Energies 2023, 16, 406. https://doi.org/10.3390/en16010406
AMA Style
Sousa AM, Ribeiro TP, Pereira MJ, Matos HA. How Do Methane, Carbon Dioxide or Fatty Acids Affect Waxy Crude Oils? Energies. 2023; 16(1):406. https://doi.org/10.3390/en16010406
Chicago/Turabian StyleSousa, Ana M., Tiago P. Ribeiro, Maria J. Pereira, and Henrique A. Matos. 2023. "How Do Methane, Carbon Dioxide or Fatty Acids Affect Waxy Crude Oils?" Energies 16, no. 1: 406. https://doi.org/10.3390/en16010406
Note that from the first issue of 2016, this journal uses article numbers instead of page numbers. See further details here.