

Research on Low-Carbon Energy Sharing through the Alliance of Integrated Energy Systems with Multiple Uncertainties
by
 ,
,
Zhihan Shi
1,
Weisong Han
2,
Guangming Zhang
1,*,
Zhiqing Bai
1,
Mingxiang Zhu
1,3 and
Xiaodong Lv
1 1
College of Electrical Engineering and Control Science, Nanjing Tech University, Nanjing 211899, China
2
College of Transportation Engineering, Nanjing Tech University, Nanjing 211899, China
3
Taizhou College, Nanjing Normal University, Taizhou 225300, China
*
Author to whom correspondence should be addressed.
Energies 2022, 15(24), 9604; https://doi.org/10.3390/en15249604
Submission received: 17 November 2022
/
Revised: 15 December 2022
/
Accepted: 15 December 2022
/
Published: 18 December 2022
(This article belongs to the Special Issue Control in Mechanical-Electrical Energy Conversion System)
Abstract
:It is of great significance to introduce the conception of a sharing economy into the electricity industry, which can promote the dispatch of multiple integrated energy systems. On the one hand, it is difficult to reveal the behaviors of complex players with multi-energy coupling through the traditional centralized optimization method of single electric energy. On the other hand, the uncertain fluctuations of renewable energy, such as wind power and photovoltaic, have posed great challenges to market transactions. First, the relationship and the functions of all stakeholders in the system are described in this paper, followed by the establishment of flexible resource models such as demand response and energy storage devices. On this basis, a low-carbon dispatching framework of multiple regional gas–electric integrated energy systems is then constructed under the guidance of cooperative game theory. The contribution indexes are established to measure the degree of energy sharing among the subsystems, and the method of asymmetric Nash bargaining is used to settle the interests of each subsystem. Second, a robust optimization model of multiple regional systems is established in response to multiple uncertainties from renewable energy and load. Finally, the numerical example proves that the proposed mechanism can increase the benefits of each integrated energy system player. Moreover, it helps the system to yield optimal benefits in the face of uncertainties and provides a reference on how to realize energy sharing under uncertainties from source load.
1. Introduction
An integrated energy system (IES), one of the key energy technologies of the future, can effectively solve the large-scale distributed power supply to the grid and reduce the adverse impact on grid operation [1]. However, a traditional stand-alone IES has limited regulation capacity and cannot further consume renewable energy [2]. Multiple integrated energy systems (MIES) [3,4,5] can realize the complementary energy utilization, which has significant advantages in improving the renewable energy consumption rate [6], cutting the system operation cost [7], reducing the power interaction to the main grid [8], and increasing the system’s backup capacity [9]. Due to the role of energy storage devices and flexible loads in IES [10,11], they can participate in energy trading in the power market. However, MIES participation in power market trading will face many problems such as competitive games and trade settlement, and how to build a set of scientific and reasonable MIES energy trading mechanisms has become a hot spot in the MIES energy market.
Meanwhile, in order to promote the consumption of new energy and realize the low-carbon economic operation of the power system, domestic and international scholars have carried out extensive studies on carbon capture and storage (CCS) technology, power to gas (P2G) technology, and the carbon trading mechanism. The finding of Zhou et al. [12] verifies that the incorporation of the traditional carbon emission mechanism can optimize the integrated energy structure and stimulate the carbon emission reduction of the integrated energy system. Alabi et al.’s research [13] presented an in-depth examination of the internal energy flow of coal-fired power plants including CCS, used mathematical models to quantitatively analyze the operating range of CCS, and revealed that CCS has a wider regulation range and a faster response speed. It is indicated that carbon dioxide captured by CCS can be used as high-quality carbon raw material for the process of P2G in [14]. Hou et al. [15] proposed the establishment of a coordination and optimization model for P2G-CCS power plants by taking P2G and CCS as a whole. These references above all point out that P2G and CCS enhance the wind and solar consumption capacity and improve the flexibility and economic performance of the system in patching and operation to a certain extent. Nonetheless, while large-scale new energy is connected to the power grid, the existing unit maintenance and operation joint optimization fails to fully consider the uncertainty of new energy output, resulting in difficulty ensuring the economic performance and robustness of the system at the same time. In [16], the algorithm of Benders decomposition was used to decompose the unit maintenance and operation joint optimization model into the main problems, the auxiliary problems and the power flow subproblems, for simplifying the issue, but the impact of the uncertainty of wind power on unit maintenance and operation was not taken into account. Ref. [17] proposed a maintenance and operation decision-making method combining scenario method and collaborative optimization, to seek the collaborative optimization of maintenance and operation. The results prove the better economic performance of the patching scheme obtained by the maintenance and operation collaborative optimization of thermal power units, where the uncertainty of wind power is considered, but the system does not include a carbon capture device. Moreover, there is no comparative analysis of the impact of different uncertainty methods on the optimization of the system, only focusing on the economic performance of the system. The robustness is not considered, while the uncertainty of wind power is not fully evaluated. The methods to study the uncertainty of WP mainly include stochastic optimization (SO), a method that is unable to accurately determine the probability distribution of stochastic optimization. This paper will use a robust optimization method to improve the robustness of IES.
The articles above are aimed at the optimization of energy suppliers, ignoring the autonomy of energy consumers (users) and the interest interaction between users and IES energy suppliers. Up to now, a large number of scholars have studied MIES under the framework of game theory. Connecting multiple IESs to form MIES can realize complementary coordination of different energies [18]. With the development of multi-energy market mechanism, each IES belongs to different operating entities, so it is urgent to clarify the energy interaction mechanism between IESs and within each IES [19]. At the same time, it is also necessary to explore the cooperative scheduling mechanism suitable for MIES, so that each subject can obtain the optimal revenue. In the cooperative game, the participants generate cooperation surplus through signing a mandatory contract. This way focuses on the overall benefits of the alliance and essentially belongs to centralized optimization. From the perspective of MIES cooperation, an MIES trading model was established in [20] based on a cooperative game, in which MIES were equated to an IES combination, called IES alliance and the Shapley value was used to distribute the gains of each IES. This model improves the benefits of the IES alliance, but equating MIES to an IES alliance fails to consider the constraints from power transmission between different IESs and ignores the impact of energy storage devices. From the perspective of MIES, the economic dispatch of MIES for cold, heat, and electricity were examined in [21], through fully evaluating the impacts of an energy storage battery, a heat and electricity cogeneration unit, a waste heat boiler, and other devices on the collaborative dispatch of MIES. The analysis results showed that the total operation cost of the system could be significantly reduced through interconnection among MIES. In consideration of the influence of demand response on MIES collaborative operation under various factors, it was further revealed in [22] that to demand response can effectively reduce the operation cost of the system and increase the renewable energy consumption rate. It should be noted that Refs. [23,24,25] intended to explore how to improve the overall benefits of the IES alliance. What should be done in the following stage is only to distribute the cooperation surplus obtained by the IES alliance according to a specific distribution method (such as the Shapley value method), so that the benefits of the IES alliance can be higher than the sum of benefits from independent operation, which meets the condition of cooperative game. However, the MIES collaborative trading operation models studied in these references cannot reflect the degree of fairness, and they mostly use the traditional method of Nash bargaining (NB) and the Shapley value distribution method. In fact, under the collaborative operation of MIES, some participants sacrifice their own benefits to maximize the benefits of the IES alliance. Nevertheless, these two distribution methods mean that such participants may gain more from participating in market competition alone than those in cooperation. The traditional model of NB mentioned above cannot further characterize the contribution of each participant, making it difficult to reflect the specific contributions of each participant. In this regard, the model of asymmetric NB overcomes the limitations of the alliance game [26]. The optimization method proposed in this paper belongs to the research field of asymmetric NB.
However, Refs. [27,28,29,30,31,32,33,34] all adopted the centralized solution method, which ignores the privacy protection of each network and the multi-agent characteristics of IES. The alternating direction method of multipliers (ADMM) algorithm can solve the distribution issue of the model in this paper. The computing of each integrated energy system can reduce the computing pressure and also protect the privacy of different integrated energy systems [35].
In summary, in terms of modeling, the model built in this paper is different from the conventional combined heat and power (CHP) model. Considering the requirement on low carbon operation, this paper constructs a new CHP unit model that couples the CCS and P2G converters into the CHP unit [36,37]. We considered multiple uncertainties such as renewable energy output and load forecasting and combined the benefits of each participant in the trading interaction among different single IESs. We comprehensively considered flexible resources and proposed an MIES trading mechanism based on the method of asymmetric NB to improve the benefits of each IES player, providing reference for the energy trading in MIES.
Therefore, the main contributions of this paper can be listed as follows:
- (1)
- A cooperative game model is established to analyze the potential of cooperation between multiple gas–electric IESs. Through energy sharing, multiple subsystems play the role of mutual resource complementation in time and space, thus increasing the overall benefits of the system;
- (2)
- The method of asymmetric Nash bargaining is used to ensure that each participant can obtain benefits fairly and to enhance each individual’s willingness to participate. At the same time, the specific contribution of each participant to the cooperation is specifically considered, making the distribution mechanism more reasonable and effective;
- (3)
- In consideration of multiple uncertainties in renewable energy and source load, a robust optimization model of multiple regional systems is established to provide a solution for the sharing strategy of the alliance among multiple systems under uncertain environments.
The results also provide a reference on how to realize energy sharing under the environment of source-load uncertainty.
2. Basic Framework of the System
The gas–electric IES mainly consists of a photovoltaic electricity generation device, a carbon capture device, a gas-fired unit, an electric-to-gas converter, an energy storage battery, a gas storage tank, and other devices. The basic framework of the system is shown in Figure 1. In this system, if there is still surplus after photovoltaic power and other output units meet the load demand, the electric-to-gas converter can use this surplus electricity to synthesize methane. Part of the carbon dioxide required for the synthesis of methane can be captured and provided by the carbon capture system. The methane obtained can be directly used for the supply of gas load or stored. On the one hand, the completion of electric-to-gas conversion and the coupling relationship between various devices in the system realizes the conversion from electric energy to gas energy and optimizes the utilization of energy; on the other hand, the CO2 captured by the carbon capture system can be fully utilized to realize carbon-to-methane conversion, which improves the overall economic benefits of the system.
The low-carbon energy sharing framework of multiple regional gas–electric integrated energy systems built in this paper is shown in Figure 2. In the traditional single energy system, it is difficult to keep a balance between energy supply and energy demand. Outside the system, energy can be shared with other subsystems, or energy can be traded with the electricity grid and the gas grid; within the system, devices of energy conversion are usually configured to realize the conversion among multiple energy sources such as electricity and gas, so as to solve the problem of energy mismatch in the time and space of the system. However, in the process of energy trading, the system also needs to face the challenges brought about by multiple uncertainties such as load prediction and new energy output.
It can be seen from Figure 2 that electricity and gas are the two main types of energy involved in each IES, and all subsystems are connected to the electricity tie line through gas pipelines, so that multiple types of energy can be shared. Moreover, each subsystem is equipped with a communication device, through which information can be exchanged with adjacent systems. Noticeably, since the research target is the regional IES and multi-IESs are close to each other in the scenarios under consideration, more attention is paid only to the constraints from power interaction between subsystems rather than other constraints from grid power flow security.
3. System Models
In the context of this article, the three systems are regional, the relationship between each is relatively simple, and the distance is very close. For this reason, we have made these assumptions: (1) ignore the changes in the voltage of each system, that is, the normalized value takes (1); (2) no need to consider the influence of reactive power; (3) only active power flow constraints are considered. Therefore, there are only three power interaction constraints between systems in our model.
3.1. Flexible Resource Models
The excavation of flexible resources can effectively reduce wind energy and solar energy waste of the system and improve the economic performance of system operation. The flexible resource models considered in this paper mainly include energy storage devices and comprehensive demand response. The specific models are as follows:
3.1.1. Energy Storage Device
The energy storage system can realize the transfer of energy in time and effectively boost the flexibility of energy in the system. The connection of electric and gas energy storage devices is involved in this paper. From the perspective of energy conversion, the four types of energy storage devices can be represented by a universal and unified model. When the energy storage device participates in coordinating and optimizing operation, there are constraints from the energy storage capacity of the energy storage device and the upper and lower limits of the energy charging and discharging power of the energy storage device, which are expressed as follows:
where Et represents the storage capacity of the energy storage device during the period t; Pchar,t represents the energy storage and charging power of the energy storage device during the period t; Pdis,t represents the energy storage and discharging power of the energy storage device during the period t; ηloss, ηchar and ηdis represent the energy storage loss rate, charging efficiency, and discharging efficiency of the energy storage device, respectively; Emin and Emax represent the upper and lower limits of the energy storage capacity of the energy storage device, respectively; αchar,t and αdis,t represent the charging and discharging state, respectively, which is either 0 or 1, with 1 indicating that the device is in the charging or discharging state and 0 indicating that the device stops the charging and discharging state; and Pchar,max and Pdis,max represent the maximum charging and discharging power of the energy storage device.
3.1.2. Demand Response
The electric–gas integrated energy demand load can be divided into rigid load not participating in the demand response and flexible load participating in the demand response. The electric and gas loads after participating in the demand response are as follows:
where and , respectively, represent the electric and gas loads after participating in the demand response; and , respectively, represent the initial predicted values of the electric and gas loads before participating in the demand response; and and , respectively, represent the changes of the electric and gas load response.
The total amount of flexible load remains unchanged during the demand response process:
The percentage of decrease/increase in the electric and gas loads shall meet the following constraints:
where and , respectively, represent the maximum allowable changes of the electric and gas loads.
3.2. Low-Carbon Energy Sharing Model of Multiple Gas–Electric IESs
An independent IES has problems such as the small capacity of its devices, concentration of various loads, and a low comprehensive utilization rate of its devices. The interconnection of multiple regional IESs can break the mode in which each region plans separately and operates independently and improve the economic performance of each system. Therefore, on the basis of the IES model described above, it is considered important to establish a sharing model of MIESs to give full play to the functions of devices in each subsystem.
3.2.1. Objective Function
The low-carbon economic operation of the gas–electric IES needs to be evaluated from the perspectives of economic performance and low-carbon. The two objective functions of minimum operation cost and minimum CO2 emission of the system are analyzed in this chapter, and the multi-objective problem is converted through weighting into single-objective ones for research and analysis.
The operation cost of the system includes the cost of purchasing electricity and gas from external girds, the cost of generating electricity by coal-fired units, the operation and maintenance cost, and the CO2 emission cost.
where CB, CG, CY, and CC are, respectively, the energy transaction cost, the electricity generation cost, the maintenance cost, and the CO2 emission cost; T represents the total operating cycle; Ce,t and Cg,t are the prices of electricity and gas purchased during the period t; and represent the amount of electricity and gas purchased during the period t; Pi,t is the output power of the coal-fired unit at the time t; CG and YWG, respectively, represent the coal cost and the operation and maintenance cost of the th coal-fired unit at the time t; I represents the total number of coal-fired units; LHVgas is the low heating value of natural gas; ηi,t is the conversion efficiency of the th coal-fired unit at the time t; KYW,i is the maintenance factor of the coal-fired unit; ωe and ωg are, respectively, the amount of CO2 consumed by purchasing electricity from the electricity grid and gas from the natural gas grid; μi is the CO2 emission coefficient of the coal-fired unit; Cg is the cost of CO2 emission in each unit; and is the mass of the captured CO2.
3.2.2. Constraints
The primary constraints of the low-carbon economic model of multiple regional gas–electric IESs can be divided into two categories. The first category is the internal constraints of each gas–electric IES, mainly including unit output constraint, energy purchase constraint, electric-to-gas conversion constraint, and carbon capture constraint in the gas–electric IES. The second category of constraints includes the constraints from the interactive coupling of each gas–electric IES, mainly including constraints from electric power interaction and gas power interaction.
Internal constraints of each gas–electric IES:
- (1)
- Electricity balance constraint:
- (2)
- Gas energy balance constraint:
- (3)
- Unit power constraint:
- (4)
- P2G output constraint:
- (5)
- Carbon capture device constraint:
- (6)
- Constraints from power interactive coupling of each gas–electric IES:
4. Model and Solution of Asymmetric Nash Bargaining
Cooperative game theory is an important solution to fair income distribution among multiple players and can be divided into two parts: alliance and distribution. For alliance, the total income is greater than the sum of the income of each participant’s independent operation; for each participant, the distributed income shall not be less than the income of its independent operation. Distribution is an important part of the game, of which the essential goal is to improve the income of each individual after participating in cooperation, so as to maintain the stability of the cooperative alliance.
The method of NB is not affected by the number of participants and is applied to multiple cooperation scenarios. The specific model is as follows:
where Fi and , respectively, represent the overall operation cost (including risk cost) of the cooperative operation and noncooperative operation of the ith IES, and N is the number of participants in the cooperative game.
However, the traditional model of NB above cannot further characterize the contribution of each participant. Hence, it is difficult to reflect the specific contribution of each participant. Therefore, the modified method of NB, named the model of asymmetric NB model, is used in this paper for distribution. The model of asymmetric NB is specifically expressed as follows:
where di is the bargaining power of the ith integrated energy system, which is specifically expressed as follows:
where and are, respectively, the power provided by other participants and the power obtained from other participants when the th IES is participating in the cooperative game, which can be further expressed as:
Equation (26) is mathematically converted, and the two convex subproblems after conversion are shown in Equations (30) and (31), respectively:
where is the optimal value for the operation of the ith gas–electric IES after solution, and Gi is the cost paid by the ith gas–electric IES after bargaining with other subsystems.
ADMM is suitable for solving a large and complex optimization problem that is composed of multiple convex subproblems. It can realize the coordination and unification of all subproblems through the exchange of a small amount of coupling information. It has advantages in protecting the privacy of subsystems and reducing the burden of large-scale computing.
The ADMM algorithm is used to solve the bargaining model above, thus realizing the distribution calculation of the model. The solution using the algorithm is as follows:
The convex optimization problem in the following form is considered:
Through the method of multipliers, the dual variable z is introduced to construct the augmented Lagrangian function:
where β > 0 is the penalty function. The basic idea of the ADMM algorithm for solving optimization problems is similar to the method of dual ascent: the Lagrangian penalty function is obtained first and then, used to solve the subproblems of x and y alternately to obtain the solution of the original problem, specifically involving the iterative update of the original variables x and y, and the dual variable z. The specific update strategy is as follows:
5. Robust Optimization Model of Multiple Regional IESs and the Process of Solving
In view of the randomness and volatility of renewable energy output, multiple uncertain factors, such as renewable energy output and load prediction, need to be considered in the dispatching of multiple regional gas–electric IESs.
The uncertainty set model of new energy output prediction error is established; the adjustment factor is introduced to characterize the new energy output prediction error power; and the uncertainty deviation zij, the polyhedron uncertainty parameter set U, and the uncertainty deviation set Z are defined.
where represents the predicted value of renewable energy output and load during the period t within a day; represents the maximum deviation of renewable energy output, that is, the precision of renewable energy output and load; zt represents the degree of deviation of actual renewable energy output and load from the predicted renewable energy output and load; and Г represents the uncertain budget, which can be understood as the extent to which uncertainties affect decision-making at the same time. There is no deviation if Г = 0 and the corresponding robust optimization model is equivalent to the deterministic model.
5.1. Algorithm 1: Outer Layer Algorithm
- (1)
- Parameter setting: relevant parameters are set in the modified particle swarm optimization algorithm. The parameters of the system are initialized;
- (2)
- Upper layer optimization: encoding is conducted to form the initial groups of uncertainty sets, that is, to randomly generate N groups of uncertainty scenario sets; the uncertainty scenario sets are transferred to subproblems at the lower layer;
- (3)
- Turning to Algorithm 2;
- (4)
- Returning to upper layer optimization: the current optimal solution (i.e., the worst scenario) is updated and replaced with the minimum f*; new uncertainty sets are generated using algorithm 1; the next step is to return to (4);
- (5)
- Optimum seeking: if convergent f* is obtained through calculation, the worst scenario and the optimization strategy results of problems at the lower layers are saved and the program is ended; otherwise, it is necessary to return to (4);
- (6)
- Finishing optimum seeking.
5.2. Algorithm 2: Inner Layer Algorithm
In the issue of energy sharing, the coupling variable in each system is the electric and gas power interaction. The optimization objective function of the th gas–electric IES under the penalty function is considered to be as follows:
The iterative calculation process shown in Equation (40) is repeated until the electric and gas power interaction of each subsystem reaches convergence.
In the issue of bargaining, the coupling variable is the bargaining cost. The optimization objective function of the ith gas–electric IES under the penalty function is considered to be as follows:
The iterative calculation process shown in Equation (42) is repeated until the bargaining cost interaction of each subsystem reaches convergence.
6. Example Analysis
The first thing to explain is that the three subsystems belong to the regional integrated energy system. The types of energy mainly include electric energy and natural gas. They are interconnected with each other through power lines and natural gas pipelines and can share energy at various times of the day. They operate together and trade energy with the superior distribution network. Specifically, for each system, there are mainly renewable energy, gas turbines, carbon capture devices, power-to-gas, energy storage and other equipment in the system. Among them, the carbon capture devices and power-to-gas belong to low-carbon technology equipment, which can reduce the carbon dioxide generated by power generation in units or power plants. Gas turbines mainly supply power to users in the system, and energy storage realizes flexible transfer of electric energy.
The scenarios considered in this paper cover three kinds of gas–electric IES. The specific parameters are: the upper and lower limits of P2G output are 800 kW and 0, respectively, with the efficiency being 60%; the upper and lower limits of carbon capture output are 100 kW and 0, respectively, with the carbon dioxide capture rate being 90% and the emission intensity being 0.2; the electric and gas loads can be adjusted within a certain range, with the total amount of electric and gas loads before and after adjustment remaining unchanged, and the maximum allowable adjustment proportion of electric and gas loads in each period within a day being 5% and 3%, respectively; the rated capacity and upper limit of charging and discharging power of the energy storage battery are 300 kWh and 60 kW, respectively, with the maximum and minimum values of the state of charge being 0.9 and 0.1, respectively, with the initial value of the state of charge being 0.2, and the charging and discharging efficiency coefficients both being 0.95; and the rated capacity and upper limit of gas storing and discharging power of the gas tank are 60 kWh and 12 kW, respectively, with the maximum and minimum values of the state of charge being 0.9 and 0.1, respectively, with the initial value of the state of charge being 0.5, and the charging and discharging efficiency coefficients both being 0.95. The predicted values of renewable energy output and load in the three subsystems are shown in Figure 3, Figure 4 and Figure 5.
Under the compiling environment of MATLAB 2021a, the Yalmip language was used in this paper to call CPLEX for a solution.
To verify the effectiveness of the model proposed in this paper, the following four scenarios were set:
Scenario 1: each integrated energy park operates independently, without a carbon capture device and electric-to-gas converter.
Scenario 2: each integrated energy park operates independently, with a carbon capture device and electric-to-gas converter.
Scenario 3: all integrated energy parks operate cooperatively, with a carbon capture device and electric-to-gas converter.
Scenario 4: the robust optimization model of multiple regional IESs is considered based on Scenario 3.
Table 1 shows the total cost of the system, the cost of system operation, and the cost of carbon emission under the four scenarios, and Table 2 shows the costs of the three gas–electric IESs.
It can be seen from Table 1 that the total cost of the system, the cost of system operation, and the cost of carbon emission show a decreasing trend from Scenario 1 to Scenario 3, while these costs increase under Scenario 4 compared with Scenario 3. The reason is that under Scenario 1, the lack of energy conversion devices such as an electric-to-gas converter and a carbon capture device in each gas–electric IES leads to the poor energy conversion and carbon dioxide absorption capacity of the system and the highest costs under this scenario; the incorporation of an electric-to-gas converter and carbon capture device under Scenario 2 improves the energy utilization rate in each system and, thereby, reduces the cost of each system; under scenario 3, all subsystems can share electric and gas energy, and the energy coupling utilization among subsystems further enhances the overall energy utilization rate of the system. Because the uncertainties of the system in renewable energy and load are considered under Scenario 4, each cost under the worst scenario is higher than that under Scenario 3, showing the impact of extreme natural scenarios on the dispatching cost of the system.
Table 2 shows that the systems are independent of each other under Scenario 1 and Scenario 2. Compared with Scenario 1, the costs of the subsystems are lower under Scenario 2; compared with Scenario 2, the costs of Subsystem 1 and Subsystem 2 are lower under Scenario 3, but the cost of Subsystem 3 is higher. The reason is that the subsystems are in a cooperative mode under Scenario 3 and Scenario 4. In this case, the objective function is to minimize the total operating cost of the system, resulting in the increase in the costs of some subsystems. For this reason, the method of asymmetric Nash bargaining is used in this paper to reallocate and adjust the cost of each subsystem. Table 3 and Table 4 show the process of each subsystem bargaining under Scenario 3 and Scenario 4, respectively.
It can be seen from Table 3 and Table 4 that after the process of bargaining transfer, the cost of each subsystem has been reduced compared with the cost under independent operation, so that the stability of the alliance and cooperation of gas–electric IESs is enhanced. In addition, the contribution of each subsystem is specifically considered in the process of redistributing the cost of each subsystem. For Scenario 3, the cooperation surpluses of Subsystem 1, Subsystem 2, and Subsystem 3 are CNY 91.6, CNY 207.69, and CNY 116.4, respectively. This shows that Subsystem 2 contributes the most in the process of energy sharing, followed by Subsystem 3 and Subsystem 1. For Scenario 4, the cooperation surpluses of Subsystem 1, Subsystem 2, and Subsystem 3 are CNY 812.8, CNY 21.34, and CNY 1665.04, respectively. This shows that Subsystem 3 contributes the most in the process of energy sharing, followed by Subsystem 1 and Subsystem 2.
In summary, the adopted method of asymmetric Nash bargaining makes each gas–electric IES more profitable than that under independent operation. Meanwhile, the contribution of each IES to energy sharing is evaluated in the distribution process, so that the scheme proposed is more scientific and reasonable.
The iterative convergence of the robust optimization model under Scenario 4 is shown in Figure 6:
It can be seen from Figure 6 that after eight iterations of the upper intelligent algorithm, the total operating cost of the three systems converges to CNY 23,438.66. In other words, the extreme scenario set that leads to the worst economic performance of the three systems is found through iteration, which further illustrates the effectiveness of the algorithm.
Due to the word limit, the results of dispatching under Scenario 4 are taken as the main results. Figure 7, Figure 8 and Figure 9 show the electricity and gas balance diagrams of the three subsystems under Scenario 4.
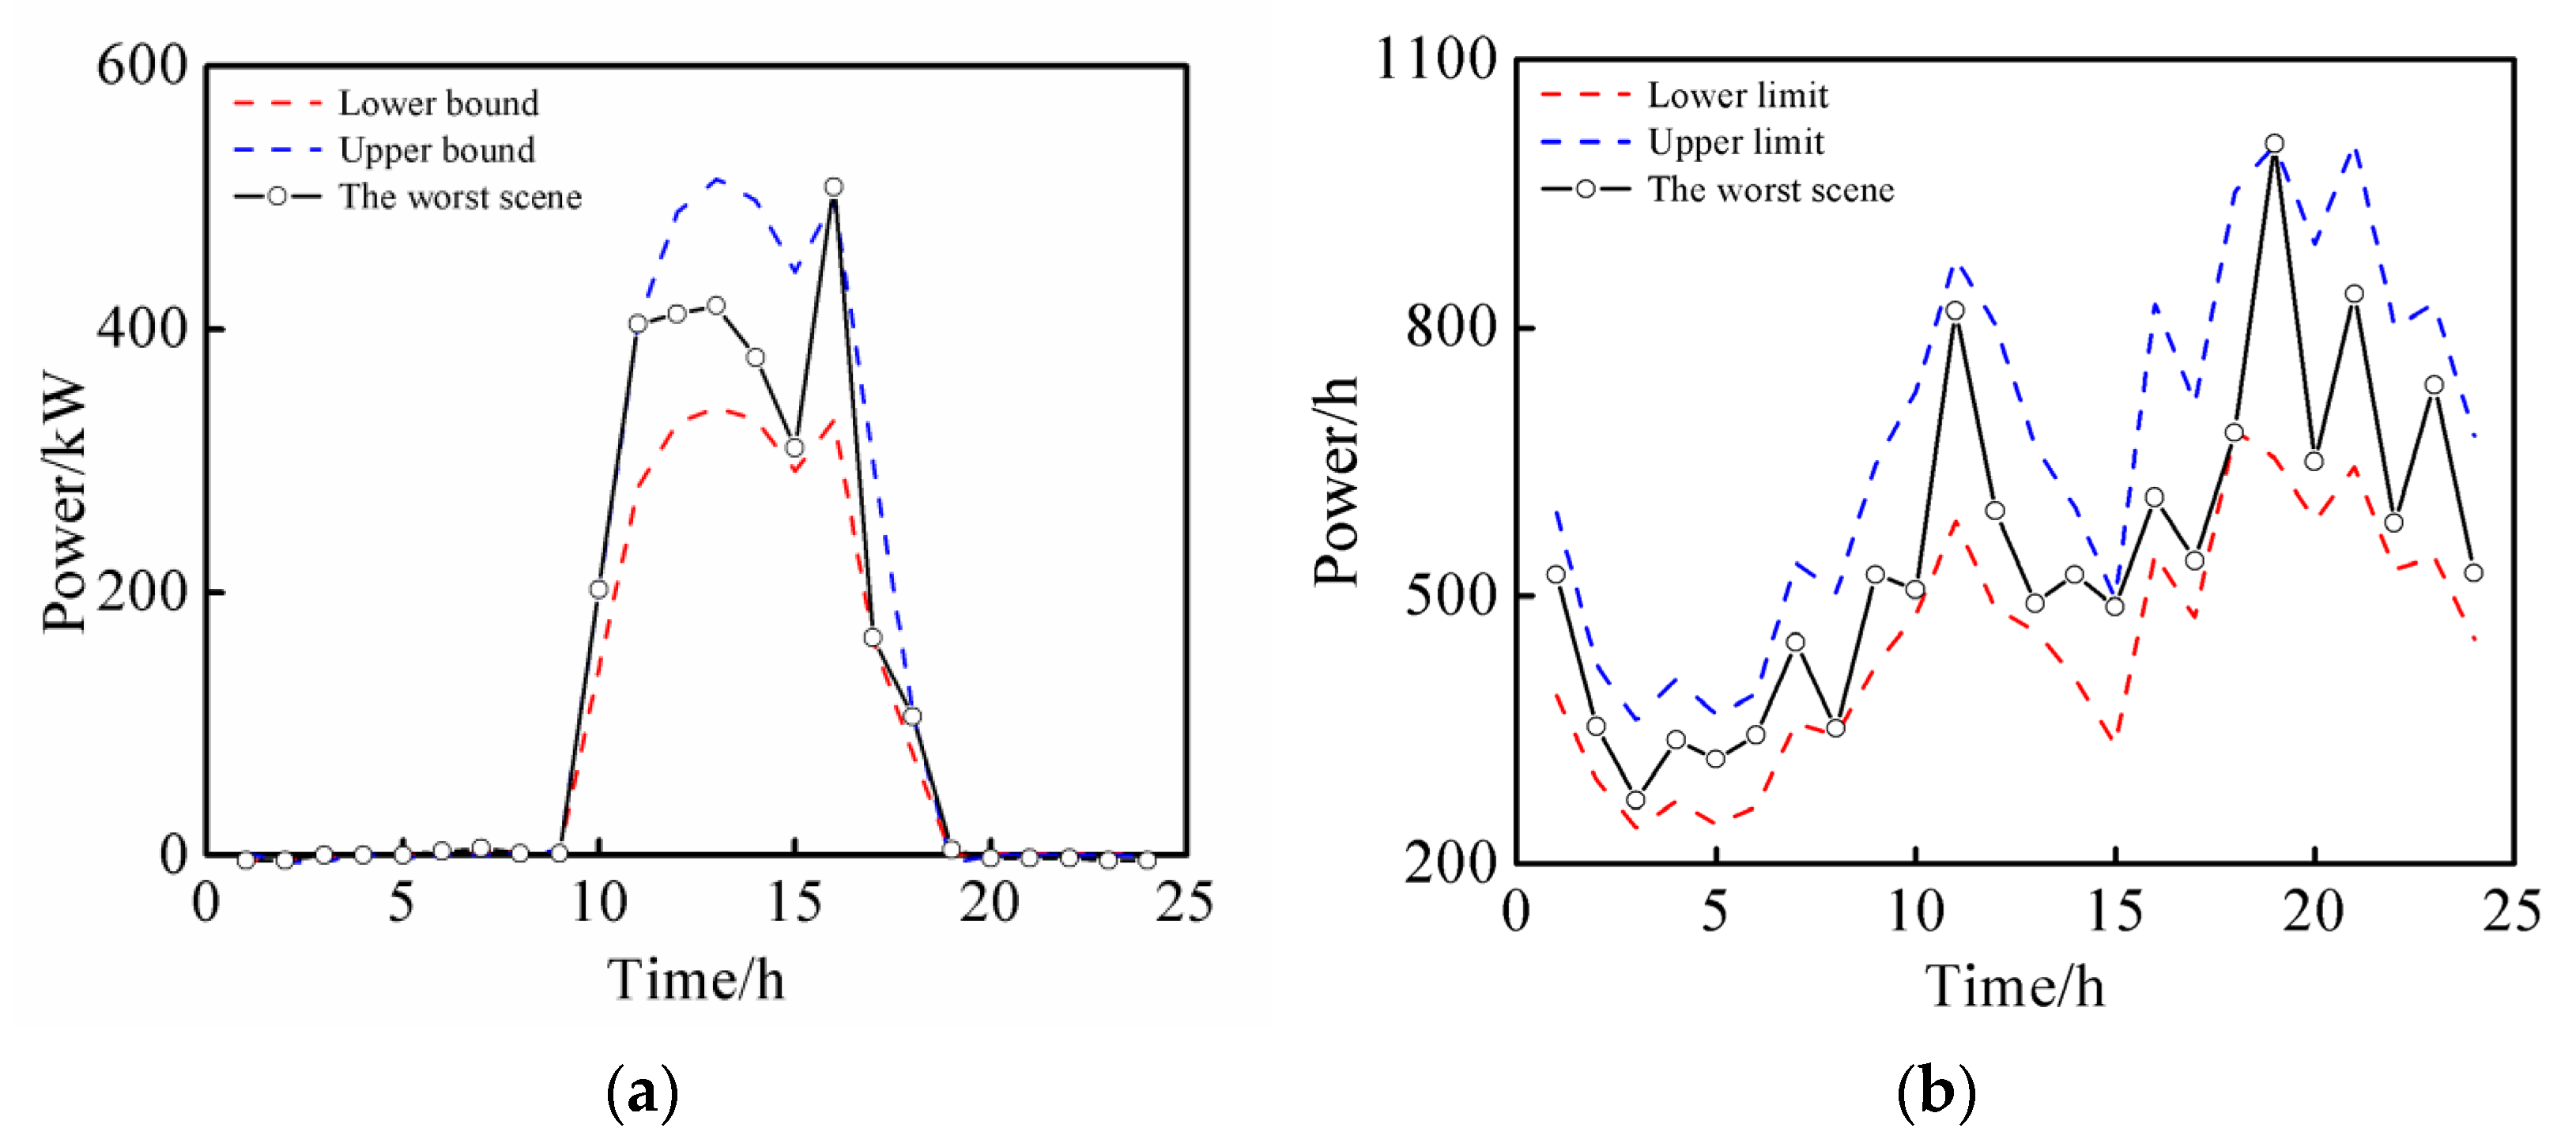
Figure 10, Figure 11 and Figure 12 show the worst source load robust scenario sets of the three IESs:
The rationality of the selection of uncertainty sets: Generally, for renewable energy or load, the selection of uncertainty sets is mainly based on the historical data of previous years to roughly draw its fluctuation range, so as to determine its upper and lower bounds. Based on the historical data of the three systems, this paper roughly draws the boundary between positive and negative 20% fluctuations.
For the elaboration of the robust model: The robustness of an uncertainty model is mainly determined by the composition of its polyhedron uncertainty set. In this paper, the construction of the polyhedron fully considers the upper and lower bounds, and sets the uncertain parameters to adjust and further control the degree of uncertain fluctuation, so as to ensure the robustness of the model.
It can be seen from Figure 10, Figure 11 and Figure 12 that under the worst robust scenario set, each of the three IESs has the highest level of resistance to uncertain risks. This scenario has the highest degree of damage to the economic performance of the system. This provides a solution for the dispatchers of the three IESs on how to share energy and reasonably coordinate resources in each IES under the worst scenario.
7. Conclusions
An energy sharing model of multiple gas–electric IESs was proposed based on cooperative game theory in this paper, in which flexible resources such as an energy storage device and the demand response and multiple uncertainties in the source load were considered.
On the one hand, a cooperative game model was established to analyze the potential of cooperation between multiple gas–electric IESs. Through energy sharing, multiple subsystems play the role of mutual resource complementation in time and space, thus increasing the overall benefits of the system. The method of asymmetric NB is used to ensure that each participant can obtain benefits fairly and to enhance each individual’s willingness to participate. At the same time, the specific contribution of each participant to the cooperation is specifically considered, making the distribution mechanism more reasonable and effective.
On the other hand, in consideration of multiple uncertainties in renewable energy and source load, a robust optimization model of multiple regional systems was established to provide a solution for the sharing strategy of the alliance among multiple systems under uncertain environments. In terms of algorithm, the ADMM algorithm can solve the distribution issue of the model in this paper. The computing of each integrated energy system can reduce the computing pressure, and also protect the privacy of different integrated energy systems.
The gas–electric IESs examined in the model proposed in this paper belong to regional IESs, which are close to each other, so that the constraints from power flow are ignored. However, this method is too simplified. In future research, it is necessary to consider the constraints of these subsystems from grid power flow in the energy trading process.
Author Contributions
Conceptualization, Z.S.; Methodology, Z.S.; Software, W.H.; Validation, M.Z., W.H., and Z.B.; Formal analysis, Z.S.; Data curation, W.H.; Writing—original draft preparation, Z.S.; Writing—review and editing, X.L.; Visualization, X.L.; Supervision, W.H.; Project administration, G.Z.; Funding acquisition, G.Z. All authors have read and agreed to the published version of the manuscript.
Funding
This research received no external funding.
Data Availability Statement
Data sharing not applicable.
Acknowledgments
The authors would like to express their gratitude to all those who helped them during the writing of this paper. The authors would like to thank the reviewers for their valuable comments and suggestions.
Conflicts of Interest
The authors declare no conflict of interest.
References
- Quelhas, A.; Gil, E.; Mccalley, J.D.; Ryan, S.M. A Multiperiod Generalized Network Flow Model of the U.S. Integrated Energy System: Part I—Model Description. IEEE Trans. Power Syst. 2007, 22, 829–836. [Google Scholar] [CrossRef]
- Wei, C.; Qiu, Y.; Chen, J.; Wu, J.; Li, B.; Xu, J.; Gan, P.; Xing, X. Research on Energy Efficiency Evaluation of Independent Integrated Energy System. In Proceedings of the 2019 IEEE 3rd International Electrical and Energy Conference (CIEEC), Beijing, China, 7–9 September 2019. [Google Scholar]
- Liu, J.; Wang, A.; Qu, Y.; Wang, W. Coordinated Operation of Multi-Integrated Energy System Based on Linear Weighted Sum and Grasshopper Optimization Algorithm. IEEE Access 2018, 6, 1. [Google Scholar] [CrossRef]
- Cheng, Y.; Liu, M.; Chen, H.; Yang, Z.; Lund, H.; Kaiser, M.J. Optimization of multi-carrier energy system based on new operation mechanism modelling of power-to-gas integrated with CO2-based electrothermal energy storage. Energy 2021, 216, 11926. [Google Scholar] [CrossRef]
- Habibifar, R.; Khoshjahan, M.; Ghasemi, M.A. Optimal Scheduling of Multi-Carrier Energy System Based on Energy Hub Concept Considering Power-to-Gas Storage. In Proceedings of the IEEE PES Conference on Innovative Smart Grid Technologies North America (ISGT NA 2020), Washington, DC, USA, 17–20 February 2020. [Google Scholar]
- Al-Karaghouli, A.; Kazmerski, L.L. Energy consumption and water production cost of conventional and renewable-energy-powered desalination processes. Renew. Sustain. Energy Rev. 2013, 24, 343–356. [Google Scholar] [CrossRef]
- Zhao, H.; Guo, S. Uncertain Interval Forecasting for Combined Electricity-Heat-Cooling-Gas Loads in the Integrated Energy System Based on Multi-Task Learning and Multi-Kernel Extreme Learning Machine. Mathematics 2021, 9, 1645. [Google Scholar] [CrossRef]
- Yu, S.; Yan, S.; Liu, X.; Liu, B.; Liu, J. Day-ahead optimal dispatch of integrated energy system considering wind power forecasting and integrated demand response. In Proceedings of the 2020 IEEE 1st China International Youth Conference on Electrical Engineering (CIYCEE), Wuhan, China, 2–4 November 2020. [Google Scholar]
- Li, Z.; Zhang, Z. Day-Ahead and Intra-Day Optimal Scheduling of Integrated Energy System Considering Uncertainty of Source & Load Power Forecasting. Energies 2021, 14, 2539. [Google Scholar]
- Arabali, A.; Ghofrani, M.; Etezadi-Amoli, M.; Fadali, M.S. Stochastic Performance Assessment and Sizing for a Hybrid Power System of Solar/Wind/Energy Storage. IEEE Trans. Sustain. Energy 2014, 5, 363–371. [Google Scholar] [CrossRef]
- Gholami, M.; Sanjari, M.J. Multiobjective Energy Management in Battery-integrated Home Energy Systems. Renew. Energy 2021, 177, 967–975. [Google Scholar] [CrossRef]
- Zhou, Y.; Yu, W.; Zhu, S.; Yang, B.; He, J. Distributionally robust chance-constrained energy management of an integrated retailer in the multi-energy market. Appl. Energy 2021, 286, 116516. [Google Scholar] [CrossRef]
- Alabi, T.M.; Lu, L.; Yang, Z. Data-driven optimal scheduling of multi-energy system virtual power plant (MEVPP) incorporating carbon capture system (CCS), electric vehicle flexibility, and clean energy marketer (CEM) strategy. Appl. Energy 2022, 314, 118997. [Google Scholar] [CrossRef]
- Zhou, Y.; Wei, Z.; Sun, G.; Zang, H.; Shahidehpour, M. A Linear Chance Constrained Model for a Virtual Power Plant in Day-ahead, Real-time and Spinning Reserve Markets. In Proceedings of the 2019 IEEE Power & Energy Society General Meeting (PESGM), Atlanta, GA, USA, 4–8 August 2019. [Google Scholar]
- Hou, M.; Li, B.; Tian, S.; Shi, K. Research on the Cooperative and Optimal Scheduling Strategy of Multi-energy Demand Response Based on Cloud-Edge Communication. In Proceedings of the 2021 4th International Conference on Circuits, Systems and Simulation (ICCSS), Kuala Lumpur, Malaysia, 26–28 May 2021. [Google Scholar]
- Binato, S.; Pereira, M.; Granville, S. A new Benders decomposition approach to solve power transmission network design problems. IEEE Power Eng. Rev. 2007, 21, 62. [Google Scholar] [CrossRef]
- Quan, H.; Srinivasan, D.; Khambadkone, A.M.; Khosravi, A. A computational framework for uncertainty integration in stochastic unit commitment with intermittent renewable energy sources. Appl. Energy 2015, 152, 71–82. [Google Scholar] [CrossRef]
- Liu, C.; Wang, H.; Wang, Z.Y.; Liu, Z.; Tang, Y.; Yang, S. Research on life cycle low carbon optimization method of multi-energy complementary distributed energy system: A review. J. Clean. Prod. 2022, 336, 130380. [Google Scholar] [CrossRef]
- Liu, Z.; Cui, Y.; Wang, J.; Yue, C.; Agbodjan, Y.S.; Yang, Y. Multi-objective optimization of multi-energy complementary integrated energy systems considering load prediction and renewable energy production uncertainties. Energy 2022, 254, 121522. [Google Scholar] [CrossRef]
- Tushar, W.; Saha, T.K.; Yuen, C.; Morstyn, T.; Mcculloch, M.D.; Poor, H.V.; Wood, K.L. A Motivational Game-Theoretic Approach for Peer-to-Peer Energy Trading in the Smart Grid. Appl. Energy 2019, 243, 10–20. [Google Scholar] [CrossRef]
- Mussadiq, U.; Mahmood, A.; Razzaq, S. Economic and Climatic Impacts of Different Peer-to-Peer Game Theoretic-based Energy Trading Systems. IEEE Access 2020, 8, 195632–195644. [Google Scholar] [CrossRef]
- Abedinia, O.; Bagheri, M. Power Distribution Optimization Based on Demand Respond with Improved Multi-Objective Algorithm in Power System Planning. Energies 2021, 14, 2961. [Google Scholar] [CrossRef]
- Huang, Y.; Wang, Y.; Liu, N. A two-stage energy management for heat-electricity integrated energy system considering dynamic pricing of Stackelberg game and operation strategy optimization. Energy 2022, 244, 122576. [Google Scholar] [CrossRef]
- Ma, T.; Wu, J.; Hao, L.; Yan, H.; Li, D. A Real-Time Pricing Scheme for Energy Management in Integrated Energy Systems: A Stackelberg Game Approach. Energies 2018, 11, 2858. [Google Scholar] [CrossRef] [Green Version]
- Wang, R.; Cheng, S.; Zuo, X.; Liu, Y. Optimal management of multi stakeholder integrated energy system considering dual incentive demand response and carbon trading mechanism. Int. J. Energy Res. 2022, 46, 6246–6263. [Google Scholar] [CrossRef]
- Chis, A.; Koivunen, V. Coalitional Game-Based Cost Optimization of Energy Portfolio in Smart Grid Communities. IEEE Trans. Smart Grid 2019, 10, 1960–1970. [Google Scholar] [CrossRef]
- Jz, A.; Yi, T.A.; Yong, L.A.; Yc, A.; Yp, A.; Zz, A.; Yn, B.; Yz, B. Distributed Operation for Integrated Electricity and Heat System with Hybrid Stochastic/Robust Optimization—ScienceDirect. Int. J. Electr. Power Energy Syst. 2021, 128, 106680. [Google Scholar]
- Chen, C.; Sun, H.; Shen, X.; Guo, Y.; Guo, Q. Two-stage robust planning-operation co-optimization of energy hub considering precise energy storage economic model. Appl. Energy 2019, 252, 113372. [Google Scholar] [CrossRef]
- Hong, B.; Zhang, W.; Zhou, Y.; Chen, J.; Xiang, Y.; Mu, Y. Energy-Internet-oriented microgrid energy management system architecture and its application in China. Appl. Energy 2018, 228, 2153–2164. [Google Scholar] [CrossRef]
- Altan, A.; Hacıog, R. Model predictive control of three-axis gimbal system mounted on UAV for real-time target tracking under external disturbances. Mech. Syst. Signal Processing 2020, 138, 106548. [Google Scholar] [CrossRef]
- Cao, Y.; Wei, W.; Chen, L.; Wu, Q.; Mei, S. Supply Inadequacy Risk Evaluation of Stand-Alone Renewable Powered Heat-Electricity Energy Systems: A Data-Driven Robust Approach. IEEE Trans. Ind. Inform. 2021, 17, 1937–1947. [Google Scholar] [CrossRef]
- Alabdulwahab, A.; Abusorrah, A.; Zhang, X.; Shahidehpour, M. Coordination of Interdependent Natural Gas and Electricity Infrastructures for Firming the Variability of Wind Energy in Stochastic Day-Ahead Scheduling. IEEE Trans. Sustain. Energy 2017, 6, 606–615. [Google Scholar] [CrossRef]
- Zhou, S.; Sun, K.; Wu, Z.; Gu, W.; Li, J. Optimized operation method of small and medium-sized integrated energy system for P2G equipment under strong uncertainty. Energy 2020, 199, 117269. [Google Scholar] [CrossRef]
- Lu, S.; Gu, W.; Zhou, S.; Yao, S.; Pan, G. Adaptive Robust Dispatch of Integrated Energy System Considering Uncertainties of Electricity and Outdoor Temperature. IEEE Trans. Ind. Inform. 2019, 16, 4691–4702. [Google Scholar] [CrossRef]
- Zhong, J.; Cao, Y.; Li, Y.; Tan, Y.; Zeng, Z. Distributed Modeling Considering Uncertainties for Robust Operation of Integrated Energy System. Energy 2021, 224, 120179. [Google Scholar] [CrossRef]
- Lacy, R.; Molina, M.; Vaca, M.; Serralde, C.; Hernandez, G.; Rios, G.; Guzman, E.; Hernandez, R.; Perez, R. Life-cycle GHG assessment of carbon capture, use and geological storage (CCUS) for linked primary energy and electricity production. Int. J. Greenh. Gas Control 2015, 42, 165–174. [Google Scholar] [CrossRef]
- Ince, A.C.; Colpan, C.O.; Serincan, M.F. CO2 Capture and Utilization for Fuel Synthesis Synthesis. In Renewable Energy Based Solutions; Springer: Cham, Switzerland, 2022; pp. 619–642. [Google Scholar]
Figure 1.
Framework of the regional gas–electric integrated energy system.

Figure 2.
Low-carbon energy sharing framework of multiple regional gas–electric integrated energy systems.
Figure 2.
Low-carbon energy sharing framework of multiple regional gas–electric integrated energy systems.

Figure 3.
Predicted values of renewable energy output and load in system 1.

Figure 4.
Predicted values of renewable energy output and load in system 2.

Figure 5.
Predicted values of renewable energy output and load in system 3.

Figure 6.
Iterative convergence of the robust optimization model under Scenario 4.

Figure 7.
Balance diagram of Subsystem 1 under Scenario 4. (a) Electricity balance. (b) Gas balance.
Figure 7.
Balance diagram of Subsystem 1 under Scenario 4. (a) Electricity balance. (b) Gas balance.

Figure 8.
Balance diagram of Subsystem 2 under Scenario 4. (a) Electricity balance. (b) Gas balance.
Figure 8.
Balance diagram of Subsystem 2 under Scenario 4. (a) Electricity balance. (b) Gas balance.

Figure 9.
Balance diagram of Subsystem 3 under Scenario 4. (a) Electricity balance. (b) Gas balance.
Figure 9.
Balance diagram of Subsystem 3 under Scenario 4. (a) Electricity balance. (b) Gas balance.

Figure 10.
Worst scenario set of Subsystem 1 under Scenario 4. (a) Photovoltaic. (b) Electric load.

Figure 11.
Worst scenario set of Subsystem 2 under Scenario 4. (a) Photovoltaic. (b) Electric load.

Figure 12.
Worst scenario set of Subsystem 3 under Scenario 4. (a) Photovoltaic. (b) Electric load.


Table 1.
Total cost of the system, the cost of system operation, and the cost of carbon emission under four scenarios.
Table 1.
Total cost of the system, the cost of system operation, and the cost of carbon emission under four scenarios.
| Scenario | Cost of System Operation/Yuan | Cost of Carbon Emission/Yuan | Total Cost/Yuan |
|---|---|---|---|
| Scenario 1 | 24,662.07 | 46,820.99 | 71,483.01 |
| Scenario 2 | 22,837.84 | 0 | 22,837.84 |
| Scenario 3 | 22,422.13 | 0 | 22,422.13 |
| Scenario 4 | 23,438.66 | 0 | 23,438.66 |
Table 2.
Costs of three gas–electric IES.
| Scenario | IES 1/Yuan | IES 2/Yuan | IES 3/Yuan |
|---|---|---|---|
| Scenario 1 | 27,497.96 | 21,226.30 | 22,758.74 |
| Scenario 2 | 9993.15 | 6276.47 | 6568.21 |
| Scenario 3 | 7576.17 | 7779.87 | 7066.09 |
| Scenario 4 | 7938.73 | 8096.70 | 7403.22 |
Table 3.
Process of each subsystem bargaining under Scenario 3.
| Mode | Subsystem 1/Yuan | Subsystem 2/Yuan | Subsystem 3/Yuan |
|---|---|---|---|
| Prebargaining | 7576.17 | 7779.87 | 7066.09 |
| Bargaining transfer | +2325.38 | −1711.09 | −614.28 |
| Postbargaining | 9901.55 | 6068.78 | 6451.81 |
Table 4.
Process of each subsystem bargaining under Scenario 4.
| Mode | Subsystem 1/Yuan | Subsystem 2/Yuan | Subsystem 3/Yuan |
|---|---|---|---|
| Prebargaining | 7938.73 | 8096.70 | 7403.22 |
| Bargaining transfer | +1541.62 | −641.57 | −900.05 |
| Postbargaining | 9480.35 | 7455.13 | 6503.17 |
Publisher’s Note: MDPI stays neutral with regard to jurisdictional claims in published maps and institutional affiliations. |
© 2022 by the authors. Licensee MDPI, Basel, Switzerland. This article is an open access article distributed under the terms and conditions of the Creative Commons Attribution (CC BY) license (https://creativecommons.org/licenses/by/4.0/).
Share and Cite
MDPI and ACS Style
Shi, Z.; Han, W.; Zhang, G.; Bai, Z.; Zhu, M.; Lv, X. Research on Low-Carbon Energy Sharing through the Alliance of Integrated Energy Systems with Multiple Uncertainties. Energies 2022, 15, 9604. https://doi.org/10.3390/en15249604
AMA Style
Shi Z, Han W, Zhang G, Bai Z, Zhu M, Lv X. Research on Low-Carbon Energy Sharing through the Alliance of Integrated Energy Systems with Multiple Uncertainties. Energies. 2022; 15(24):9604. https://doi.org/10.3390/en15249604
Chicago/Turabian StyleShi, Zhihan, Weisong Han, Guangming Zhang, Zhiqing Bai, Mingxiang Zhu, and Xiaodong Lv. 2022. "Research on Low-Carbon Energy Sharing through the Alliance of Integrated Energy Systems with Multiple Uncertainties" Energies 15, no. 24: 9604. https://doi.org/10.3390/en15249604
Note that from the first issue of 2016, this journal uses article numbers instead of page numbers. See further details here.