

Research on the Influencing Factors of Coal Industry Transformation Based on the DEMATEL–ISM Method

School of Energy and Mining Engineering, China University of Mining and Technology (Beijing), Beijing 100083, China
*
Author to whom correspondence should be addressed.
Energies 2022, 15(24), 9502; https://doi.org/10.3390/en15249502
Submission received: 25 October 2022
/
Revised: 6 December 2022
/
Accepted: 13 December 2022
/
Published: 14 December 2022
(This article belongs to the Special Issue Risk Assessment of Innovative Energy Systems)
Abstract
:The “carbon peak, carbon neutral” goal and the rapid development of new energy sources such as photovoltaic and hydrogen energy have accelerated the decline of the traditional coal industry. Therefore, the coal industry urgently needs to seize the opportunity for coal transformation and achieve high-quality development to improve its competitiveness. This study used a combination of literature analysis and case supplementation to identify 12 influencing factors of coal industry transformation. The DEMATEL method was used to classify the 12 influencing factors into four groups: strong cause, weak cause, strong outcome, and weak outcome. Then, the ISM method was used to construct a multi-level recursive structure of the factors influencing the transformation of the coal industry. The results show that the influencing factors of coal industry transformation can be divided into a three-layer hierarchical structure. Among them, policy traction is the most critical fundamental influence, technological change has the highest importance in the indirect influence layer, while safety production, related industries and support, and capital funding are the most effective direct influence. It should be the focus of attention.
1. Introduction
As a basic energy source and industrial raw material in China, coal has long pro-vided a strong guarantee for economic and social development and a stable supply of national energy security [1]. In 2020, the total primary energy production in China was 4.0 × 10⁹ t. of which raw coal production was up to 3.9 × 10⁹ t, an increase of 1.3% year on year. The total energy consumption was 4.98 × 10⁹ tce, of which coal consumption accounted for 56.8% [2]. However, coal provides traditional high-carbon fossil energy, and its large-scale development and utilization have brought ecological damage, climate change, environmental pollution, and other problems that are increasingly prominent. Coal development and utilization are the main sources of carbon emissions in China, accounting for approximately 65% of China’s carbon emissions, and are key areas of carbon emission reduction in China [3,4]. As the world’s largest developing country, China has made an aggressive commitment to “peak carbon neutrality”, which has led to systemic changes in the country’s energy sector [5,6,7]. At the same time, the international economic situation is severe, and the competition between major countries has led to a huge challenge in terms of energy security. Coal is a basic input factor for economic and social operations. It is closely related to high-quality economic development. It involves a series of socio-economic issues such as energy security, environmental protection, and safety production [8,9]. At present, China’s economy is in a critical period of changing development mode, optimizing economic structure, and transforming growth momentum, which has a revolutionary and disruptive impact on the traditional energy industry. In the face of complex internal and external factors, the traditional coal industry can no longer meet the needs of the country’s high-quality economic development. Coal consumption and utilization have shown a clean and diversified development mode, and it has become an industrial consensus and trend to promote the high-quality transformation development of the coal industry.
In recent years, academics have conducted a lot of research on the transformation of the coal industry. The main focus is on the following three directions. The first is to re-search the transformation path of the coal industry. For example, Zhang Yaning et al. studied the transformation path of the coal industry to geothermal energy resources development and proposed the transformation concept of expanding geothermal specialized services based on the existing engineering service capacity of the coal industry [10]. Wang G et al. introduced the development trend of China’s coal industry 3.0 and believed that the current stage should be a breakthrough from three key technologies of intelligent coal mining, ecological coal mining, ultra-low emission, and environmental protection [11]. The second is to study the necessity of coal industry transformation. For example, Wang Shufei and Gao Peng, based on the national energy development idea and the requirements of the “double carbon” target on the adjustment of energy supply and demand structure with coal as the main energy source, believe that reducing the total amount of coal energy consumption is the primary choice and clean energy is the main response [12]. Starting from the macro development environment of the coal industry, Sun Xudong et al. systematically analyze the advantages, disadvantages, opportunities, and challenges of China’s coal development in the medium and long term. The development trend and positioning of the coal industry transformation in three different stages are examined, and corresponding response strategies are proposed [13]. Thirdly, there are studies related to the factors influencing the transformation of the coal industry. For example, Zhao YQ et al. took the transformation of Jiaozuo as an example, summarized the lessons learned during the growth of Jiaozuo, and proposed the importance of resource endowment on the transformation of the coal industry [14]. Wang JQ et al. took the impact of renewable energy that Chinese coal enterprises are currently facing as the entry point and proposed that coal enterprises urgently need to make green transformation decisions, which illustrated the importance of market demand on the transformation of the coal industry [15].
Through the above literature, we can see that scholars’ research on the transformation and development of the coal industry mainly focuses on the direction of its transformation, the necessity of transformation, and the importance of individual fac-tors in transformation. There is a lack of research on the systemic influencing factors of the coal industry transformation. Additionally, research on the identification of key factors of coal industry transformation is severely lacking. As the cornerstone of China’s energy industry, it is a key issue to achieve high-quality development of the coal industry by identifying its transformation influencing factors, exploring its transformation and upgrading paths, and achieving sustainable development of the coal industry. Given this, this paper uses a combination of literature and cases to derive a system of influencing factors for the transformation of China’s coal industry. The DEMATEL–ISM model is used to analyze the influencing factors. The key influencing factors are identified and the mechanism of each influencing factor on the transformation development of the coal industry is clarified to provide some reference value for the high-quality transformation development of the coal industry.
2. Identification of Influencing Factors
2.1. Overview of Coal Industry Transformation
The transformation of the coal industry is mainly divided into two routes. One is to extend the industry chain based on the original industry chain, such as coal to oil and gas, coal to chemical, and coal to hydrogen. The other is the transformation of the layout of new energy fields such as energy storage (sodium ion batteries, flywheel energy storage, etc.), wind power photovoltaic operation, hydrogen, etc.
2.1.1. Analysis of the Coal Industry Chain in China
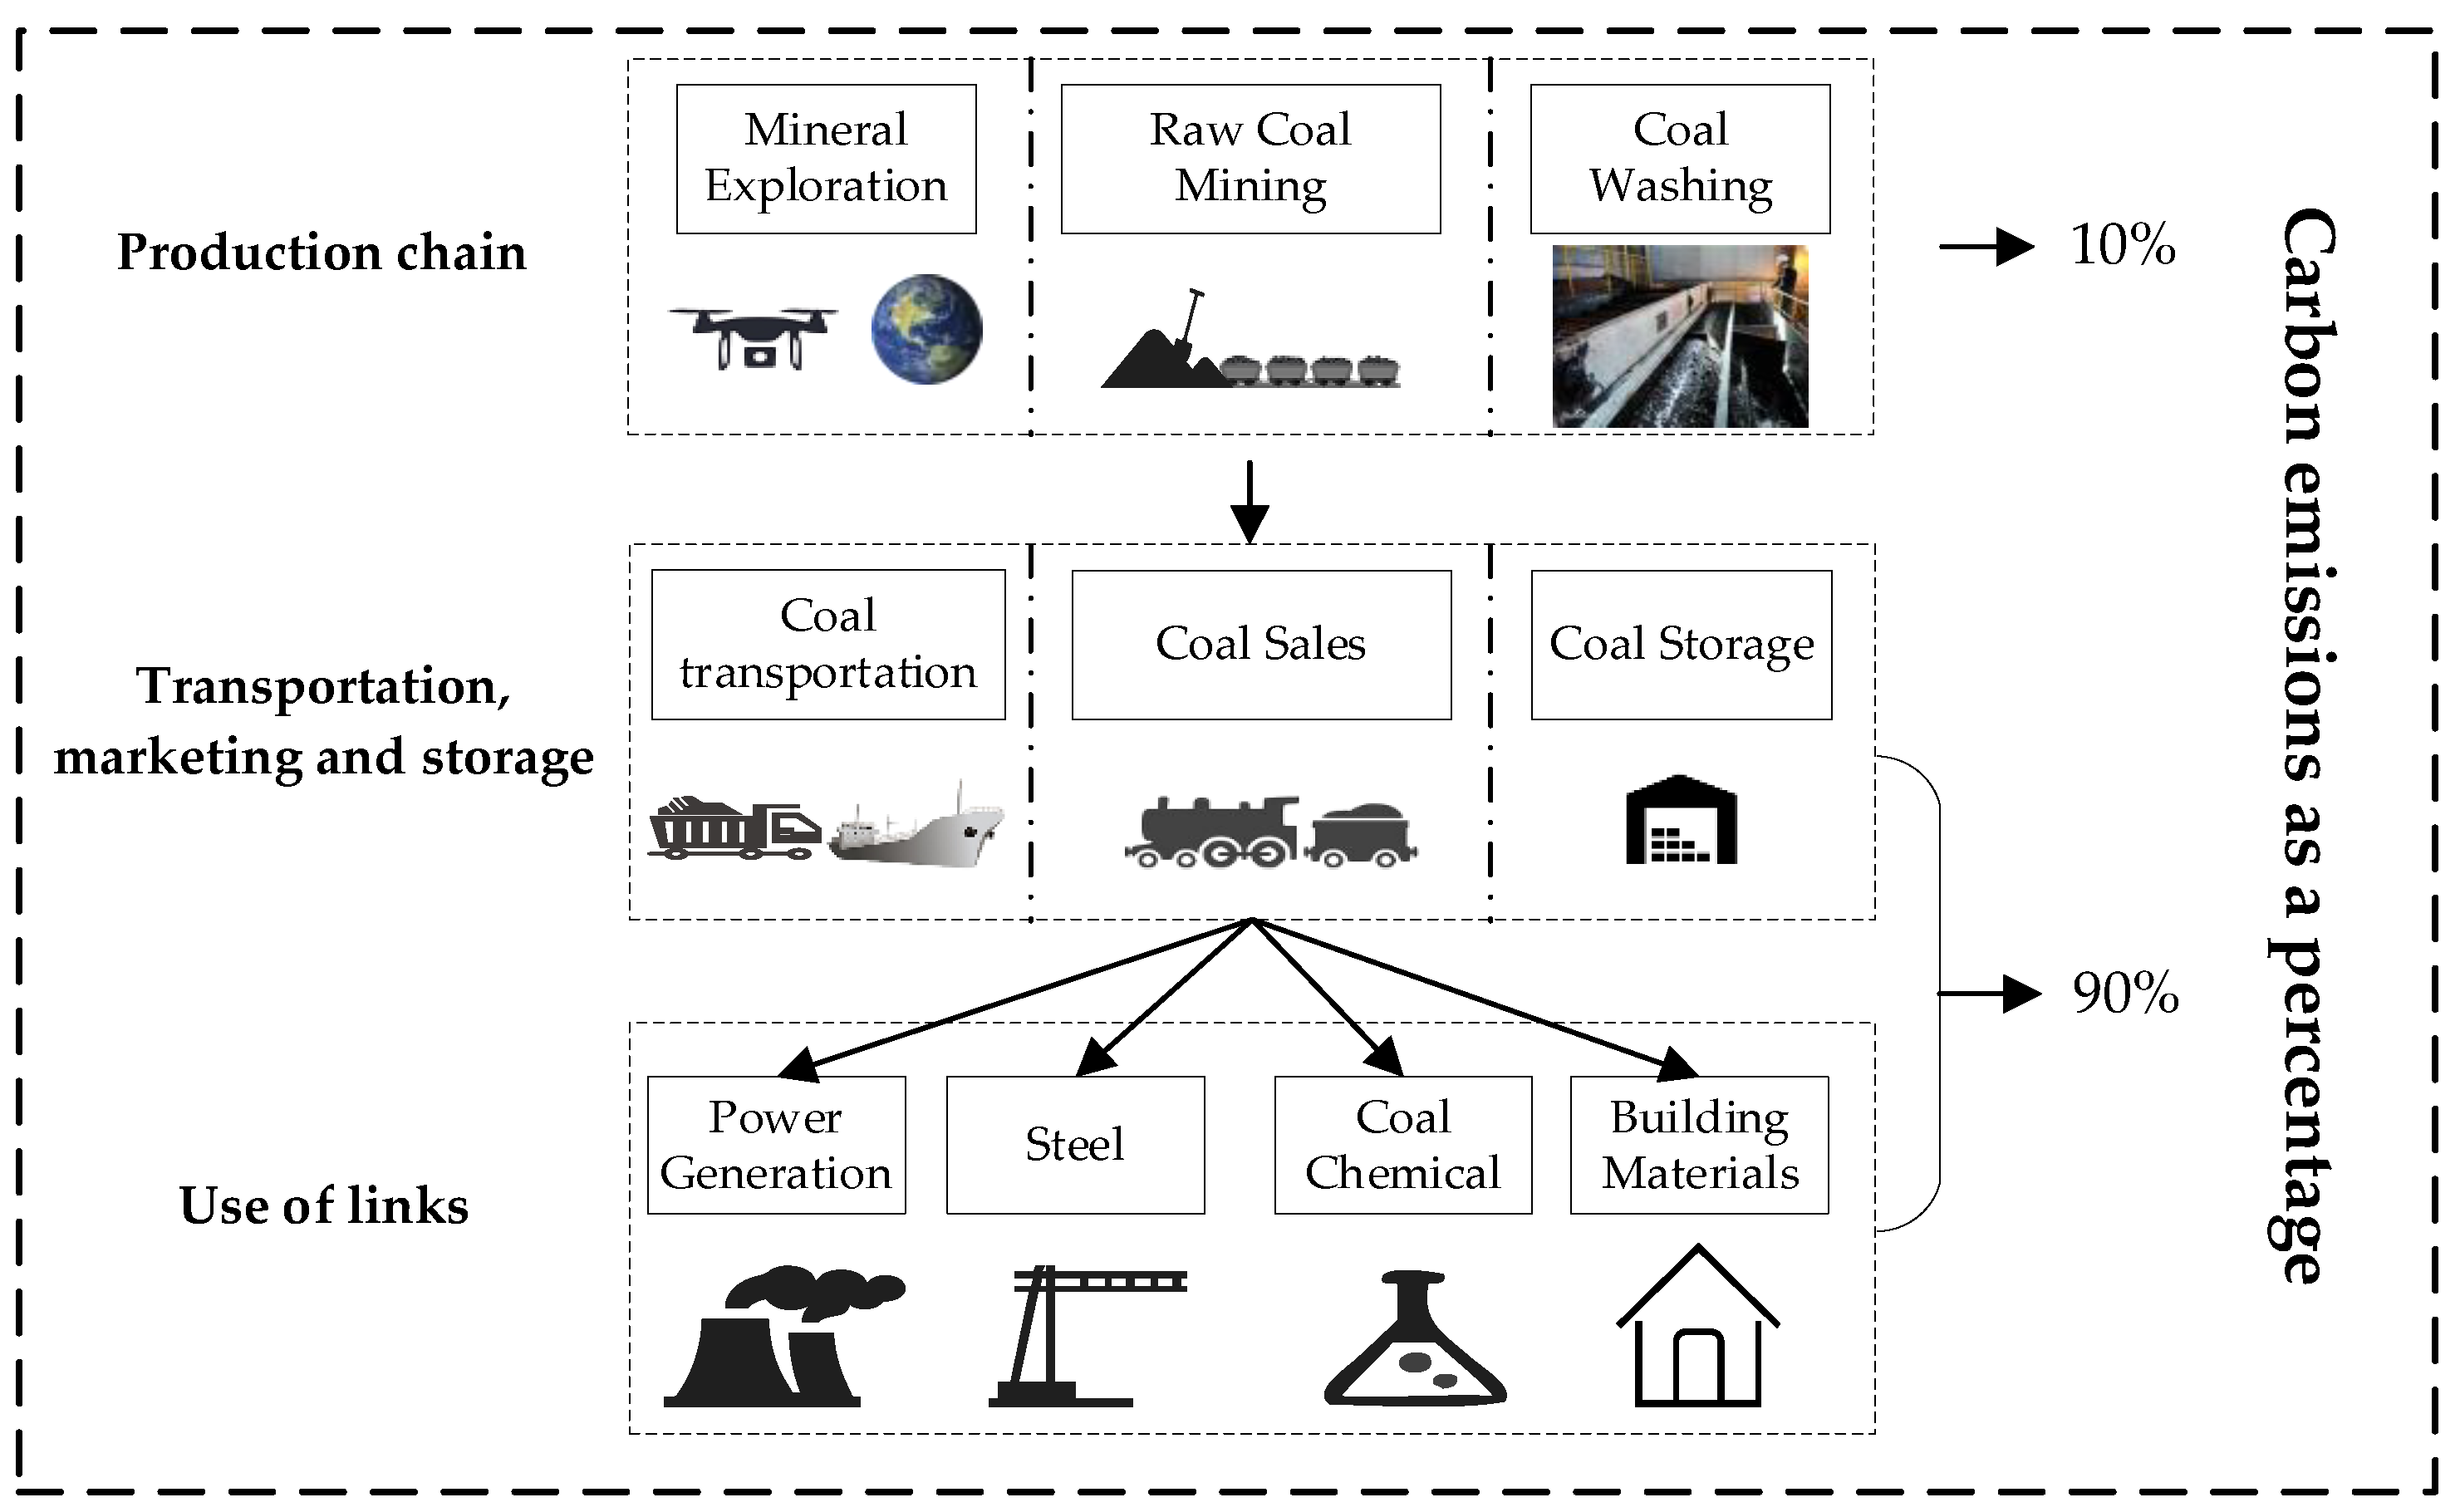
The coal industry chain refers to the strategic assemblage of upstream and downstream enterprise relationships formed in industrial production to carry out production activities around coal resources. Coal has a complete industrial chain in China. It consists of upstream coal production, midstream transportation, sales and storage, and downstream consumption and utilization (Figure 1). From the whole industrial chain process of coal, the carbon emission from coal production accounts for approximately 10%, and the carbon emission from coal transportation, sales, storage, and utilization accounts for nearly 90% [4,16,17].
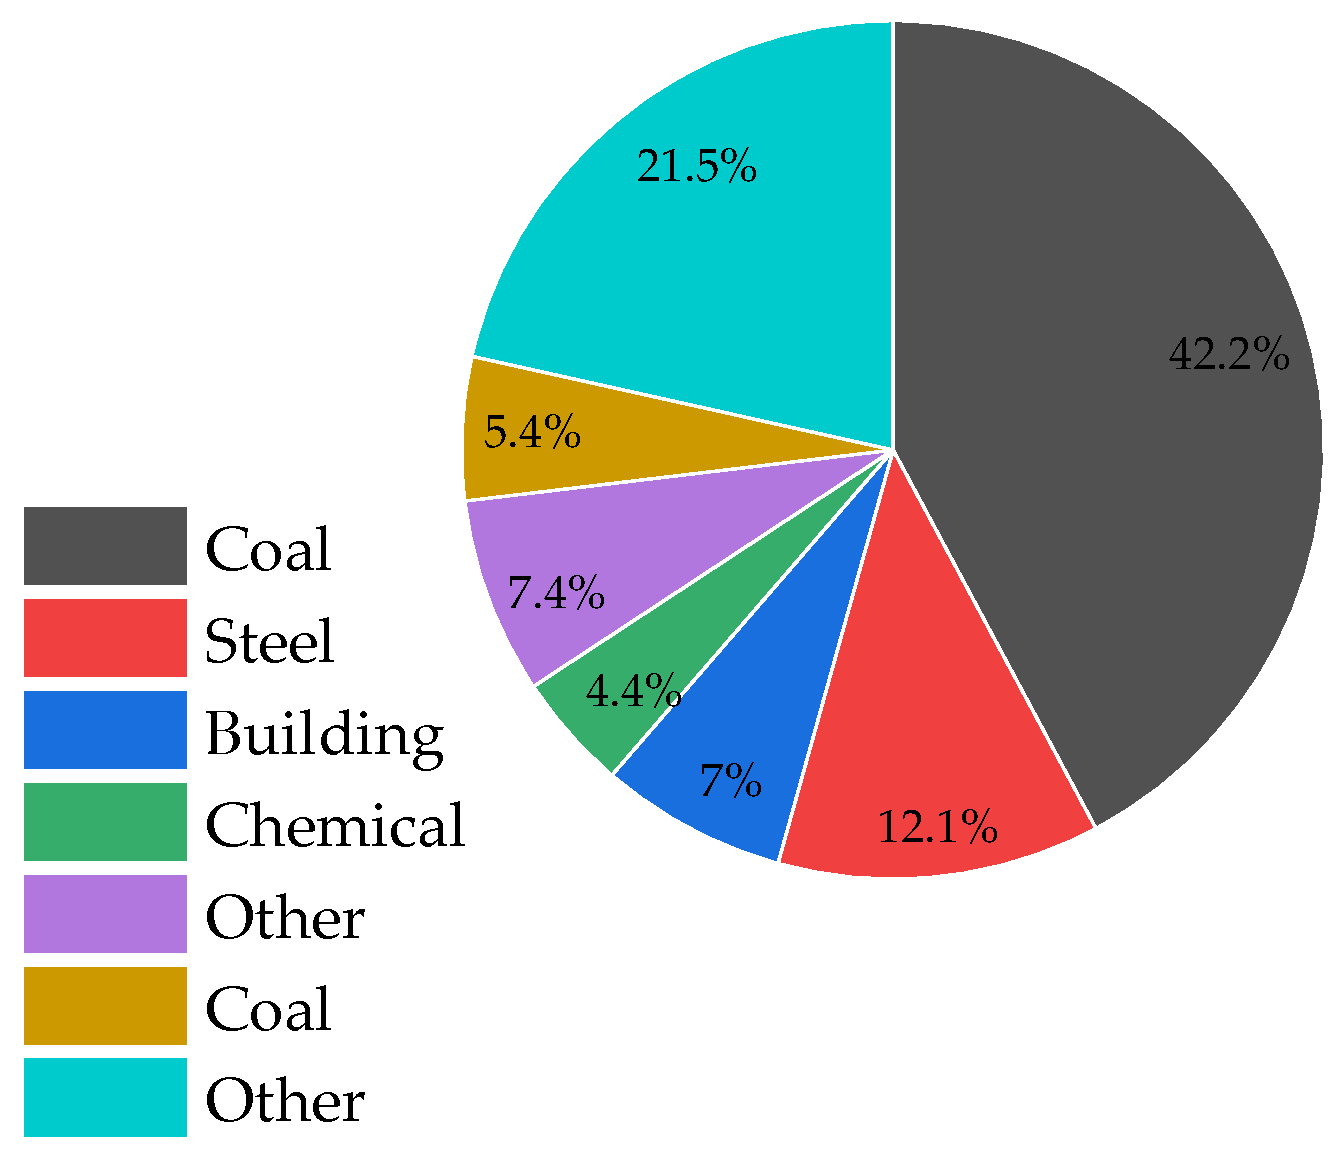
The utilization pathways of coal point to the steel, coal chemical, power generation, and building materials industries, respectively. Their carbon emissions account for the carbon emissions of energy activities in China as shown in Figure 2.
Based on their resource endowment and strategic layout, more coal enterprises in China have formed a more mature coal-power industry chain and coal-chemical industry chain. The coal-electricity industry chain mainly uses less coalified bituminous coal and brown coal for the burning of power. Using the heat generated by burning coal, the thermal energy is converted into electrical energy that can be more easily stored and used. In the coal-chemical industry chain, the modern coal chemical industry, as an alternative supplement to petroleum products, has a large one-time construction investment, a long capital recovery period, and therefore high depreciation and amortization costs. The chemical products are mainly converted from coal, and the raw materials and power fuels mainly come from coal. There is high coal consumption per unit of chemical products, and high resource consumption. There is also high volatility of coal market price and high raw material and fuel costs. In addition, coal chemical products have not yet achieved complete substitution for petrochemical products, and do not have a dominant position in the product market, so product sales revenue is greatly affected by fluctuations in international oil prices.
2.1.2. Analysis of Coal Industry Transformation
The development of the coal industry led by the traditional crude development has been difficult to adapt to the macro environment under the new economic normal. Further, the dramatic deterioration of the ecological environment marks the decline in the carrying capacity of natural resources. This all means that the various problems that have been concealed by the sustained high rate of development over the years have become bottlenecks that the entire industry must face and breakthrough.
The essence of industrial transformation and upgrading is to follow the development of the times, to transform the previous extensive development and abandon the previous backward development methods. The previous extensive development method did bring a good impact and rich profits to the economy. However, if we keep insisting on this way of development, it will only bring damage to the environment and depletion of resources for human beings. Only through industrial transformation, the integration of various industries drives development. Through industrial transformation, the integration of various industries can bring the greatest social benefits and meet the diversified market demand under the premise of ensuring the ecological environment.
For these reasons, the coal industry has to extend the existing industrial chain for transformation and development, or invest in the layout of new energy fields—both to meet the objective requirements of the external business environment changes, but also to improve internal resource allocation, improve operational efficiency, and effectiveness of the inevitable choice.
2.2. Identification of Influencing Factors of Coal Industry Transformation
There are many factors influencing the transformation of the coal industry. However, the research on the transformation of the coal industry in domestic academic circles started late, and there are fewer studies on the influencing factors for the transformation and development of the coal industry. It is difficult to reflect the influencing factors of the coal industry transformation comprehensively through the literature research method alone. Based on this, in order to comprehensively extract the influencing factors of coal industry transformation development, a combination of literature and case study methods is used to identify the influencing factors.
Literature research method. The keywords “coal transformation” and “coal industry transformation” were used in this part to search the relevant literature through the platforms of “China National Knowledge Infrastructure” (https://www.cnki.net/ accessed on 28 April 2022) and “Web of Science” (https://www.webofscience.com/ accessed on 28 April 2022). When screening the literature, we focused on the relationship between its influencing factors and coal transformation. The final ten well-researched pieces of literature were screened. The influencing factors mentioned therein were also summarized and organized to obtain a preliminary list of influencing factors.
Then, the influencing factors are revised through the expert interview method. The 12 influencing factors are finally determined. The specific interpretations are shown in Table 1.
3. DEMATEL–ISM Analysis Methods
The DEMATEL method and the ISM method, as two commonly used system analysis methods to study the relationship between the components of complex systems, have been widely used in many fields [26,27,28,29]. The DEMATEL method creates a relationship matrix by an expert assessment of the inter-influence relationships between the factors in the system. It uses the influence degree, influenced degree, centrality degree, and cause degree to determine the category of each factor, that is whether the factor is a causal factor or an outcome result factor, and the degree of influence the factor has on the complex system. Finally, it determines the key factors of the system. However, this method cannot effectively identify the hierarchical structure of the factors in the system. ISM focuses on analyzing the hierarchical relationship between each element.
This paper adopts a combination of DEMATEL and ISM. Firstly, the influence degree among the factors is calculated by the DEMATEL model to find out the key factors. Then, the hierarchical recursive structure among the influencing factors of coal industry transformation is constructed by the ISM model, and the directed topological diagram among the factors is drawn. The specific implementation steps are as follows.
(1) Clarify the elements of the system. Explicitly analyze the elements of which the system is composed, which can be marked as .
(2) Examine the influence relationship between different factors and set the corresponding scale, compare the influence of on by expert scoring method, so as to determine the degree of direct influence between different factors, and the direct influence matrix can be obtained.
where factor indicates the degree of direct influence of factor on factor . If , then .
(3) Normative direct influence matrix. In this paper, the normalization is performed using the row and maximum value method. First, each row of matrix is summed. Then, the maximum value is taken among these values. Finally, the factors of the matrix are normalized to obtain the normalized direct influence matrix. According to Formula (1), the direct influence matrix is normalized to obtain the normalized direct influence matrix .
(4) Calculate the comprehensive influence matrix T among the system influencing factors. The comprehensive influence matrix represents the combined effect of direct and indirect influences among system factors. (the normalized direct influence matrix) will converge to 0 for all values of the matrix after self-multiplication all the time, that is . Therefore, the comprehensive impact matrix () is obtained by the following formula.
where is the unit matrix.
(5) Calculate the influence degree, influenced degree, centrality degree, and cause degree of each factor.
The influence degree refers to the sum of the values of each row in . It represents the combined influence value of the corresponding element of each row on all other elements. It is denoted as .
The degree of being influenced is the sum of the values of each column in . It represents the combined influence value of the corresponding element in each column on the other elements. It is denoted as .
The centrality indicates the position of the factor in the evaluation system and the magnitude of its role. The centrality of factor is the sum of the degree of influence and the degree of being influenced. It is denoted as .
The cause degree is obtained by subtracting the influence degree and the influenced degree of factor denoted as .
If the cause degree is greater than 0, this means that the element has a great influence on other elements and is called the cause element. On the contrary, it is called the result element.
(6) Plotting cause–effect diagrams. Using the centrality degree as the horizontal coordinate and the cause degree as the vertical coordinate, a cause–effect diagram is drawn.
(7) Determine the global impact matrix. The global impact matrix is composed of the comprehensive impact matrix plus the unit matrix .
(8) Determine the reachable matrix. Here, it is necessary to introduce a threshold value to eliminate relationships with a small degree of influence between factors and to facilitate the division of the hierarchical structure. the value of is usually determined by experts or decision makers according to the actual situation. The elements in matrix are processed by introducing the threshold to obtain the reachable matrix .
(9) Delineate the hierarchy. The reachable set is the set of factors in the corresponding rows of the -element of the reachable matrix that contain 1. denotes the set of all factors that can be reached from factor . The antecedent set is the set of factors in the corresponding columns of the -element of the reachable matrix that contain 1. denotes the set of all factors that can be reached from the factor .
If and satisfy , this means that all the factors corresponding to can find the antecedents in . The factor is called a factor at a higher level. Then, the corresponding rows and columns are crossed out from the reachable matrix . The highest-level factors are then extracted from the remaining matrix. The process is repeated until all rows and columns are crossed out.
(10) Plotting the multi-level structure model between factors. Plot the multi-level recursive structure of the multi-layer topology between the factors of the system according to the order in which the factors are delimited.
4. Model Construction and Analysis
This section may be divided into subheadings. It should provide a concise and precise description of the experimental results, their interpretation, as well as the experimental conclusions that can be drawn.
4.1. DEMATEL–ISM Model Construction
According to the constructed list of influencing factors of coal industry transformation (Table 1), 10 experts and scholars of coal industry transformation were invited to score the relationships of influencing factors in Table 1 by using the Delphi method. To ensure the reliability of the scoring results, the invited experts are those closely in-volved in the coal transition. These include university teachers, corporate researchers, coal industry managers, and employees.
The degree of influence between two influencing factors is indicated by assigning values to each of five levels, such as no influence (0 points), less influence (1 point), general influence (2 points), greater influence (3 points), and very great influence (4 points). The direct influence matrix of the coal industry transformation impact factors is constructed. 10 initial direct influence matrices are averaged to eliminate individual differences in expert scoring (rounded). The final obtained direct influence matrix of coal industry transformation influencing factors is shown in Table 2.
The matrix of Table 2 is normalized by applying the row and maximum value method. The calculated row sum maximum is 24. The canonical influence matrix can be obtained according to Formula (2). The canonical influence matrix is calculated according to Formula (3), and the comprehensive influence matrix can be obtained, which is shown in Table 3.
Calculating Table 3 according to Formulas (4)–(7), the centrality degree and cause degree of each influencing factor can be obtained, as shown in Table 4.
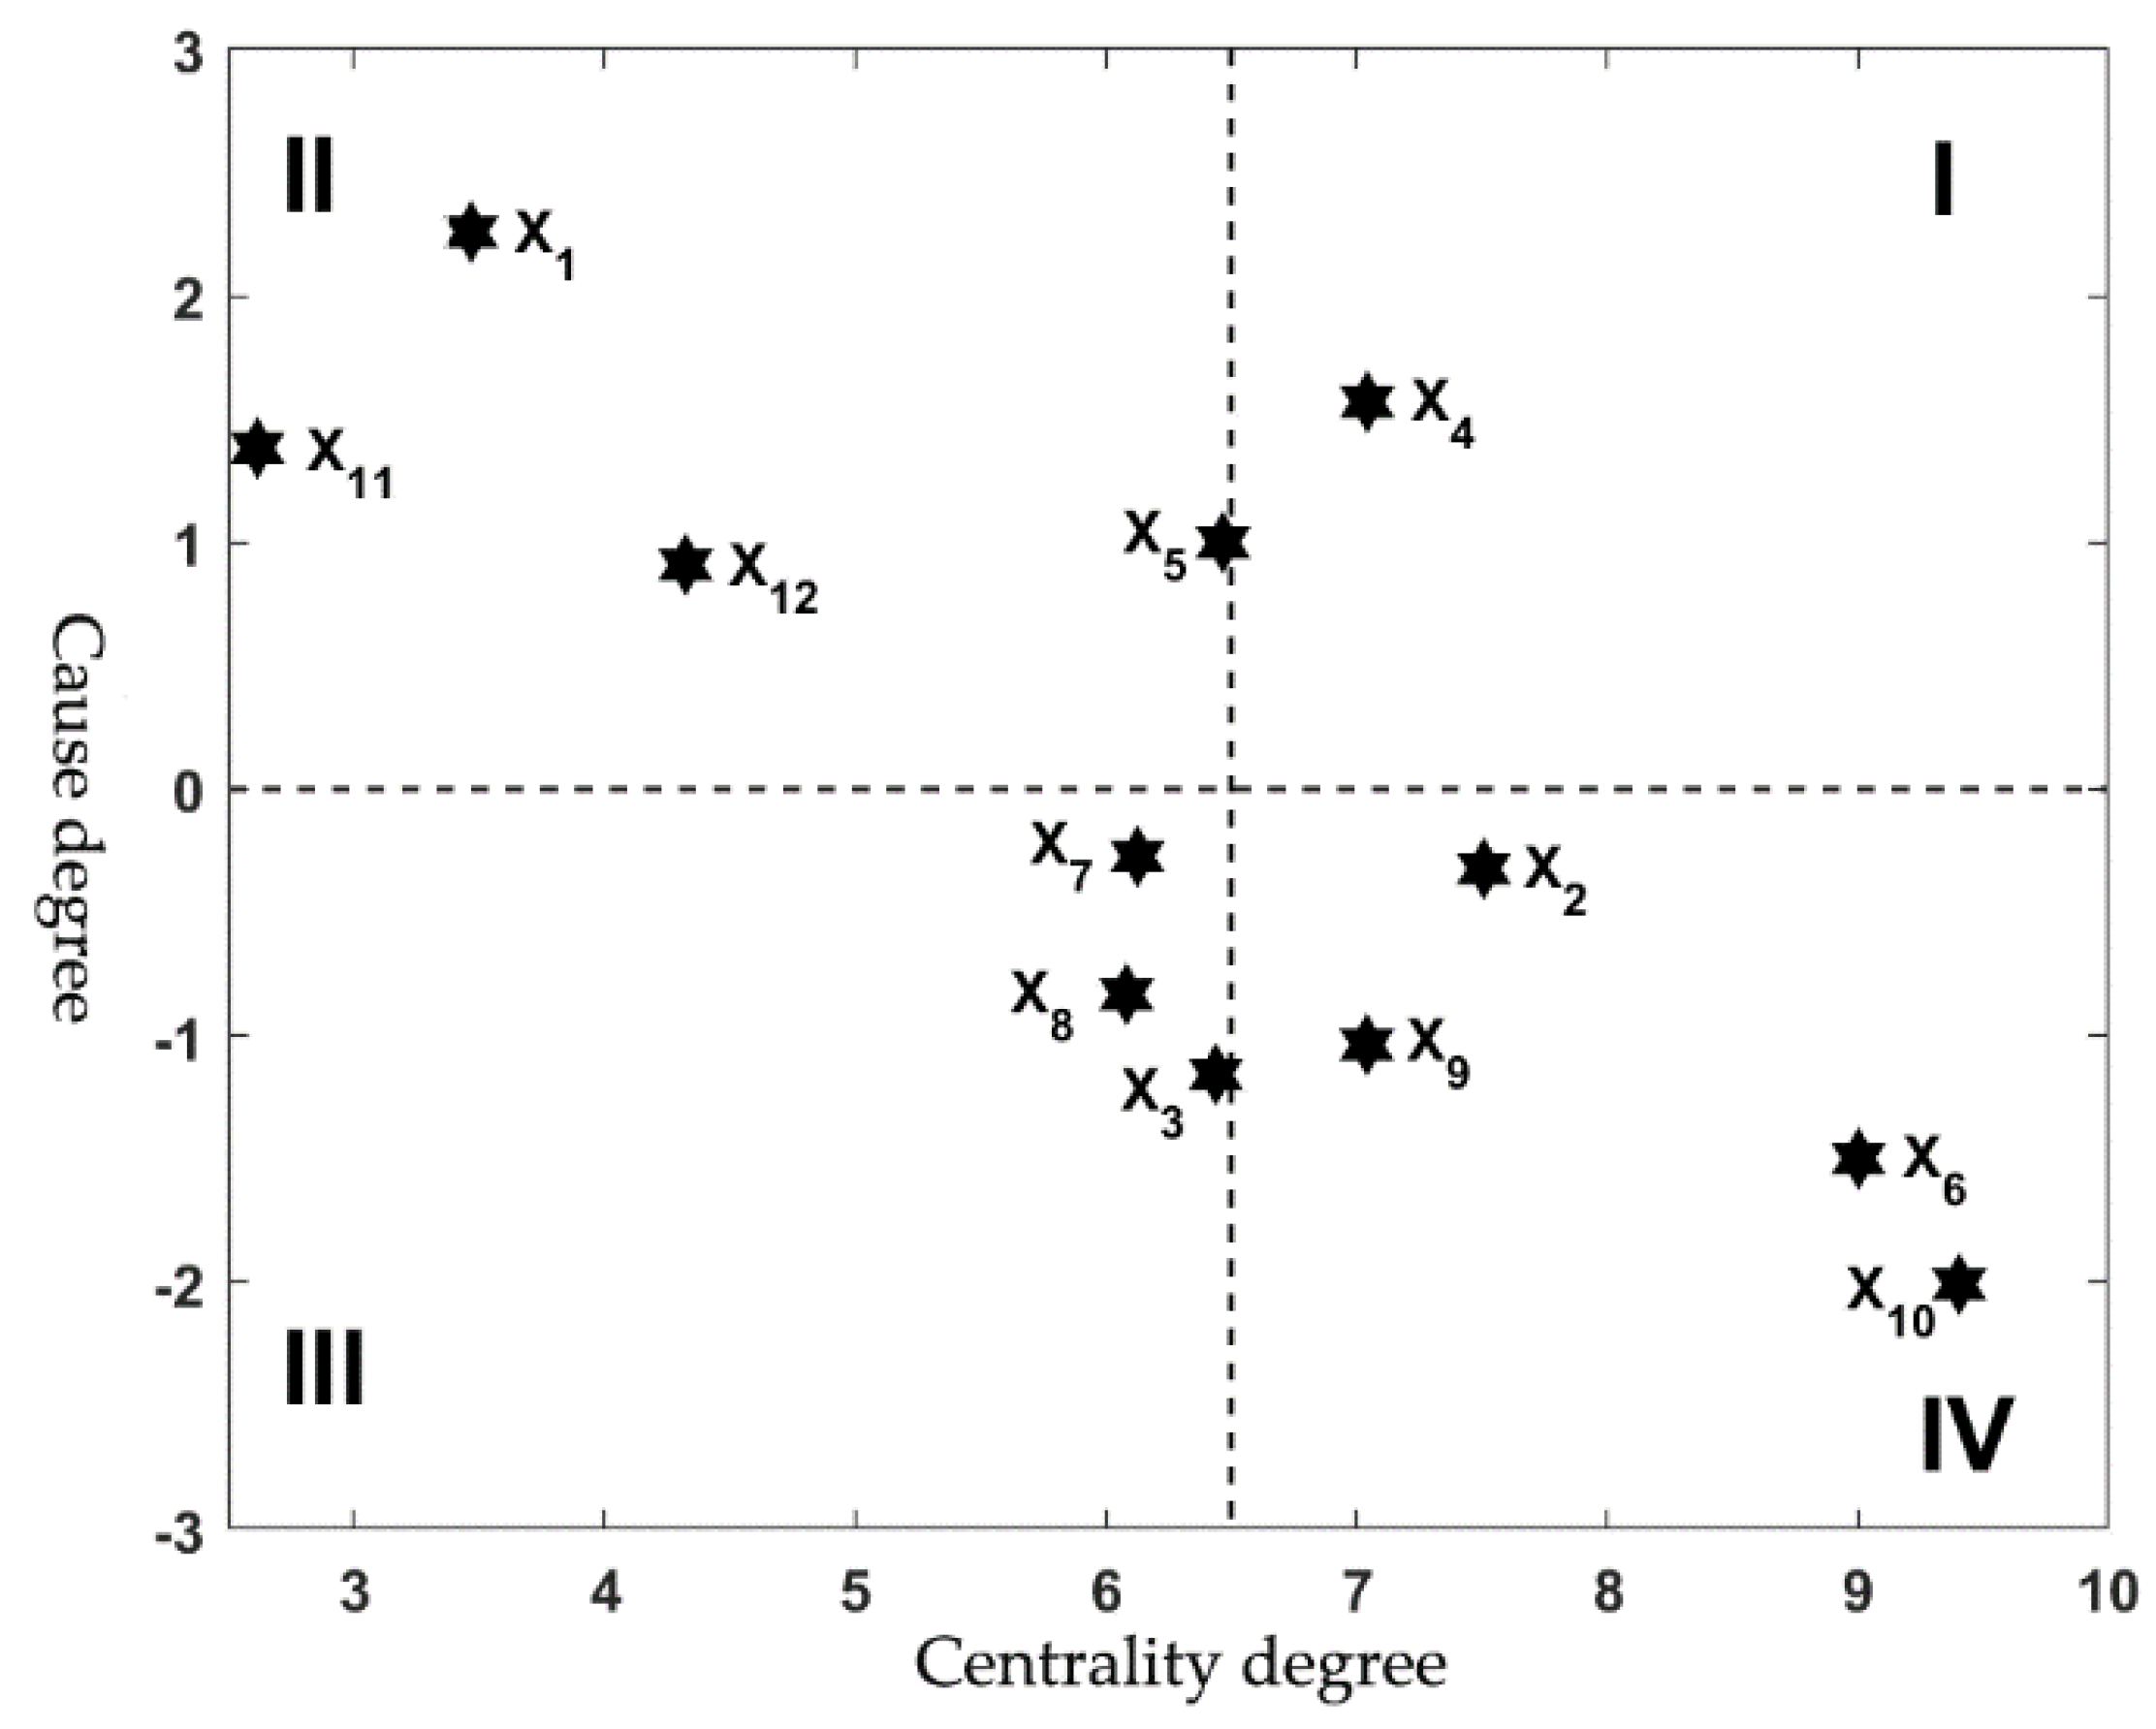
Based on the centrality and cause degree values of each influencing factor calculated in Table 4, the cause–effect diagram of coal industry transformation influencing factors is drawn using MATLAB 9.7 R2019b software, as shown in Figure 3.
The global impact matrix is obtained by adding the comprehensive impact matrix of Table 3 to the unit matrix . The global impact matrix calculated is shown in Table 5.
In order to obtain the reachable matrix, it is necessary to introduce a threshold value to eliminate relationships with a small degree of influence. Selecting the value of based on expert experience is less objective. Additionally, using the calculation of the sum of mean and standard deviation based on statistical distribution can reduce the influence of subjectivity [18,19]. Therefore, the threshold value is calculated as follows.
In the formula, is the mean of all factors in the combined influence matrix ; is the standard deviation of all factors, calculate the threshold λ according to the above formula and the results are as follows: .
The global influence matrix (Table 5) is simplified according to the value of , and thus the reachable matrix in the ISM model is calculated. According to Formula (8), the reachable matrix of the factors influencing the transformation of the coal industry is shown in Table 6.
The reachable set, the antecedent set, and the intersection of the two factors are determined from the reachable matrix . When , then is the highest-level factor. Repeat this operation after dividing the hierarchical factors. Until all the levels of the influencing factors are divided, the multi-level recursive structure of the multi-layer topology is obtained.
The first calculation results of the system structure analysis are shown in Table 7.
The elements satisfying Formula (9) are x2, x3, x8, x9, x10, and x11. Then, safe production, environmental protection, labor, related industries and support, capital funding, and location advantage are the factors of the first level.
The second calculation results of the system structure analysis are shown in Table 8.
Factors x1, x6, x7, and x12 meet the requirements of Formula (9), then resource endowment, technological change, horizontal competition, and social responsibility are the factors of the second level.
The third calculation results of the system structure analysis are shown in Table 9.
The factors that meet the requirements of Formula (9) are x4 and x5, so policy traction and market demand are at the third level.
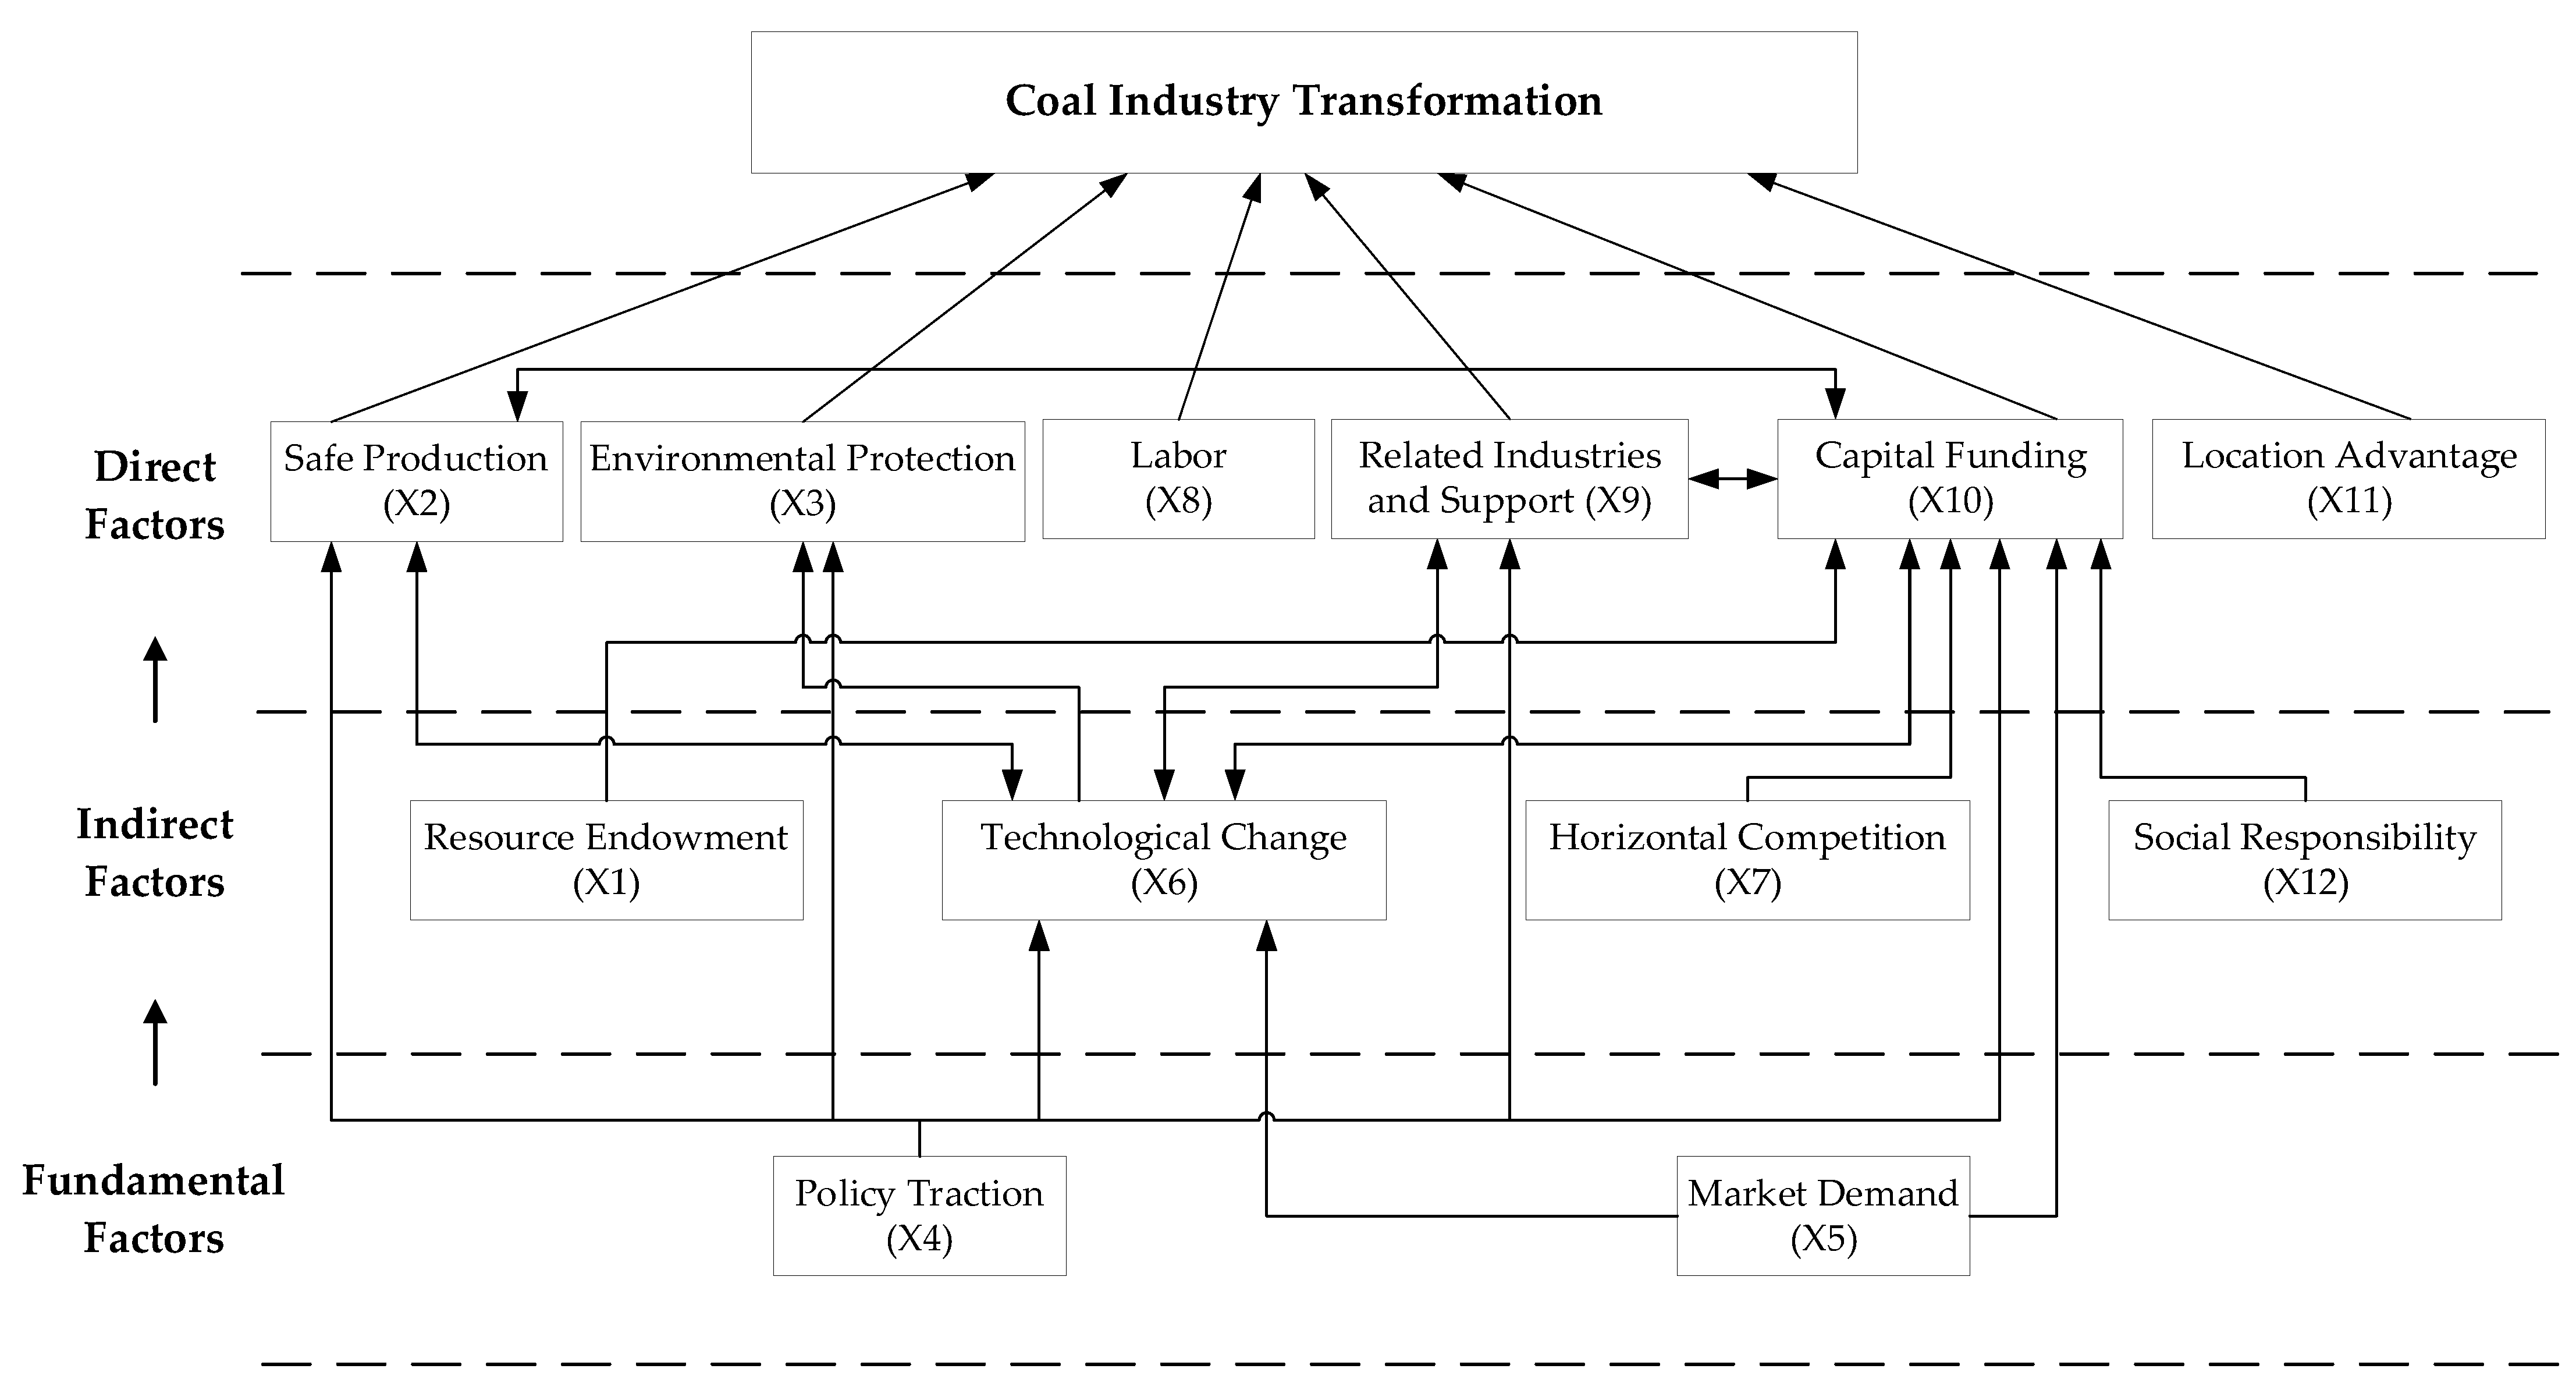
To sum up, the system structure can be divided into three levels: L1 = {x2, x3, x8, x9, x10, x11}, L2 = {x1, x6, x7, x12}, L3 = {x4, x5}. The multi-level structure model is shown in Figure 4.
4.2. Analysis of Results
4.2.1. DEMATEL Analysis
The centrality degree of the factor indicates the importance and the role of the factor in the transformation of the coal industry. The greater the centrality, the greater the degree of influence of the factor on the transformation of the coal industry. The influencing factor with the degree of a cause greater than zero is the cause factor. Additionally, the greater the degree of cause, the stronger the influence on other factors. For an influencing factor whose cause degree is less than zero, the factor is the resulting factor.
The relationship diagram (Figure 1) of coal industry transformation influencing factors obtained from the DEMATEL calculation shows that coal industry transformation influencing factors can be divided into four categories. The first category is the set of strong causal factors (Area I). This type of factor has a very significant influence on the transformation of the coal industry and has a greater influence on other outcome-type factors. The second category is the set of weak causal factors (Area II). This type of factor also has an influence on the coal industry transformation and has some influence on other outcome-type factors. The 3rd category is the set of weak outcome factors (Area III). This type of factor is the result of the combined effect of other cause-type factors and has a certain influence on the transformation of the coal industry. The fourth category is the strong outcome factor set (Area IV). This type of factor is also the result of the combined effect of other cause-type factors and has a very important influence on the transformation of the coal industry. The greater the centrality, the greater the degree of its influence. Therefore, we need to focus on the strong cause factor set in Area I and the strong result factor set in Area IV, which are capital financing (), technological change (), safety production (), policy traction (), and related industries and support () in descending order of centrality.
4.2.2. ISM Analysis
The ISM method can visually present the interaction relationship and hierarchical structure among the factors influencing the transformation of the coal industry.
From the results of ISM analysis (Figure 4), it can be seen that there are more complex relationships among coal industry transformation influencing factors such as homogeneous or cross-level linkages. In this model, coal industry transformation factors are divided into three major factor sets: direct factors, indirect factors, and fundamental factors. Among them, safety production (), environmental protection (), labor (), related industries and support (), capital financing (), and location advantage () are the direct factors of the coal industry transformation. Resource endowment (), technological change (), horizontal competition (), and social responsibility () are the indirect factors of the coal industry transformation. Policy traction () and market demand () are the fundamental factors of the coal industry transformation.
In the ISM model, the factors with more node degrees are safety production (), environmental protection (), policy traction (), market demand (), technological change (), related industries and support (), and capital financing (). These factors are generally consistent with the factors with large centrality values analyzed by DEMATEL and need to be focused on.
4.2.3. DEMATEL–ISM Integrated Analysis
A comprehensive analysis of DEMATEL–ISM reveals that the indirect influencing factors of technological change () in ISM is the strong set of outcome factors that DEMATEL focuses on. Another three strong sets of outcome factors of safety production (), related industries and support (), and capital financing () are the direct factors that ISM focuses on. The two fundamental factors (policy traction and market demand) in the ISM analysis are exactly those causal factors in the DEMATEL analysis. The factor with the lowest node degree in the ISM model is a locational advantage. It is consistent with the value of the least centrality in the DEMATEL analysis. From the above analysis, it can be found that there is a high degree of consistency between the two methods in terms of importance and type of classification of factors influencing the transformation of the coal industry. This is further evidence of the scientific validity and accuracy of the model analysis.
The comprehensive analysis results show that policy traction () is the most critical fundamental influencing factor. In the indirect influencing factor layer, technological change () has the highest importance. Among the direct influencing factors, safety production (), related industries and support (), and capital funding () are important to the coal industry transformation.
5. Conclusions and Recommendations
(1) Based on the combination of literature research and cases, the influencing factors are then revised by the expert interview method. Twelve influencing factors of the coal industry transformation were finally identified.
(2) The attributes of each influencing factor of coal industry transformation were derived using DEMATEL modeling. Five key influencing factors with high importance were screened out based on the cause–effect relationships between factors. Among them, policy traction is the causal factor, and capital financing, technological change, safety production, related industries and support are the outcome factors. The interactions among the influencing factors were analyzed in depth using the ISM method.
(3) The analysis results show that policy traction and market demand are the fundamental influencing factors of the coal industry transformation. Based on this, corresponding strategies and suggestions are proposed for the transformation of the coal industry.
At present, research on coal transformation mainly focuses on path studies and the impact of a particular factor on coal transformation. This study selects 12 factors, including resource endowment, policy traction, market demand, peer competition, and social responsibility, and adopts the DEMATEL–ISM method to study the impact of these factors on coal transformation and the extent of their influence, and further investigates the interactions between these factors. This study is informative and comprehensive, and the findings can provide a reference for further research on the coal industry transformation.
Author Contributions
S.Z. contributed to the conception of this study; K.Y. performed the experiment and contributed significantly to analysis and manuscript preparation; D.L. helped perform the analysis with constructive discussions and wrote the manuscript. All authors have read and agreed to the published version of the manuscript.
Funding
This research was funded by the National Key Research and Development Plan (Grant no. 2017YFC1503103).
Data Availability Statement
The data that support the findings of this study are available from the corresponding author, Kangdi Yang, upon reasonable request.
Acknowledgments
The authors wish to acknowledge financial support from the National Key Research and Development Plan (Grant no. 2017YFC1503103).
Conflicts of Interest
The authors declare no conflict of interest.
References
- Liu, F.; Cao, W.J.; Zhang, J.M.; Cao, G.M.; Guo, L.F. Current technological innovation and development direction of the 14th five-year plan period in China coal industry. J. China Coal Soc. 2021, 46, 1–15. [Google Scholar] [CrossRef]
- National Bureau of Statistics. China Energy Statistics Yearbook, 2021; China Statistics Press: Beijing, China, 2022. [Google Scholar]
- Xie, H.P.; Ren, S.H.; Xie, Y.C.; Jiao, X.M. Development opportunities of the coal industry towards the goal of carbon neutrality. J. China Coal Soc. 2021, 46, 2197–2211. [Google Scholar] [CrossRef]
- Ren, S.H.; Xie, Y.C.; Jiao, X.M.; Xie, H.P. Characteristics of carbon emissions during coal development and technical approaches for carbon neutral development. Adv. Eng. Sci. 2022, 54, 60–68. [Google Scholar] [CrossRef]
- Xi, J.P. Building on the Past to Start a New Journey in the Global Fight against Climate Change—Speech at the Climate Ambition Summit. People’s Daily, 3 December 2020. [Google Scholar]
- Xi, J.P. Address to the General Debate of the 75th Session of the United Nations General Assembly. People’s Daily, 23 September 2020. [Google Scholar] [CrossRef]
- Carbon Peaking Action Plan by 2030. People’s Daily, 27 October 2021. [CrossRef]
- Yin, T.F. Literature review of evaluation system and path of coal industry's high-quality development. Coal Eng. 2021, 53, 179–183. [Google Scholar]
- Liang, Z.; Ye, X.D.; Zhao, G.Y.; Zeng, W.G. China's energy security situation and measures to promote coal to ensure energy supply. Coal Econ. Res. 2021, 41, 9–13. [Google Scholar] [CrossRef]
- Zhang, Y.N.; Ren, S.H.; Zheng, D.Z.; Jiao, X.M.; Guo, C.C. Path analysis of the transformation and expansion of the coal industry to the development and expansion of geothermal energy resources. Coal Econ. Res. 2022, 42, 39–46. [Google Scholar] [CrossRef]
- Wang, G.; Xu, Y.; Ren, H. Intelligent and ecological coal mining as well as clean utilization technology in China: Review and prospects. Int. J. Min. Sci. Technol. 2019, 29, 161–169. [Google Scholar] [CrossRef]
- Wang, S.F.; Gao, P. Exploration of the necessity and path of the coal industry transformation under the goals of carbon peak and carbon neutrality. China Coal 2022, 48, 9–14. [Google Scholar] [CrossRef]
- Sun, X.D.; Zhang, L.X.; Zhang, B. Research on the coal industry development and transition in China under the background of carbon neutrality. China Min. Mag. 2021, 30, 1–6. [Google Scholar]
- Zhao, Y.Q.; Yang, Y.; Leszek, S. Experience in the transformation process of “coal city” to “beautiful city”: Taking Jiaozuo City as an example. Energy Policy 2021, 150, 11216. [Google Scholar] [CrossRef]
- Wang, J.Q.; Cao, H.J. Improving competitive strategic decisions of Chinese coal companies toward green transformation: A hybrid multi-criteria decision-making model. Resour. Policy 2022, 75, 102483. [Google Scholar] [CrossRef]
- Yu, S.M.; Zhu, S.L.; Zhang, J.L. An approach to estimate the emission factor of fugitive CO2 emissions from underground coal mining activities in China. Energy China 2018, 40, 10–33. [Google Scholar]
- Liu, J.L.; Wang, K.; Zou, J. The implications of coal consumption in the power sector for China’s CO2 peaking target. Appl. Energy 2019, 253, 113518. [Google Scholar] [CrossRef]
- The “14th Five-Year Plan” to Greet the Changes, Where Is the Coal Road. Available online: http://www.ccoalnews.com/news/202001/15/c120778.html (accessed on 19 October 2022).
- He, B. Exploring the Transformation of Coal Enterprises to Achieve High-Quality Development in the New Era. Mod. Enterp. 2020, 40–41. Available online: https://kns.cnki.net/kcms/detail/detail.aspx?dbcode=CJFD&dbname=CJFDLAST2021&filename=XDQY202012022&uniplatform=NZKPT&v=nvfkBK0ayQhFPfthMROFzvBwXNlXtpJPby_Ekp1hlk3EnZlvXB9VPjbnEvn_jyrh (accessed on 14 October 2022).
- Gao, Q.Q. Research on Transformation Policy of Coal Industry—A Case Study of Diaobingshan City, Liaoning Province. Master’s Thesis, Nanjing Agricultural University, Nanjing, China, 2019. [Google Scholar] [CrossRef]
- Wang, G.F.; Liu, F.; Pang, Y.H.; Ren, H.W.; Ma, Y. Coal mine intellectualization: The core technology of high quality development. J. China Coal Soc. 2019, 44, 349–357. [Google Scholar] [CrossRef]
- Huang, Y. Transformation and Development of Corporate Culture in the Context of Transformation of State-Owned Enterprises. Bus. Cult. 2020, 20–21. Available online: https://kns.cnki.net/kcms/detail/detail.aspx?dbcode=CJFD&dbname=CJFDLAST2020&filename=SYWH202018005&uniplatform=NZKPT&v=NvYQ4VsVQLgStsGso5gPu6NLCeAz6ArQNhp4RQ9L8tmf6JdLtmHzCM2uXCcH36g9 (accessed on 18 October 2022).
- Diluiso, F.; Walk, P.; Manych, N. Coal transitions—Part 1: A systematic map and review of case study learnings from regional, national, and local coal phase-out experiences. Environ. Res. Lett. 2021, 16, 113003. [Google Scholar] [CrossRef]
- Li, X.; Nan, Y.; Li, T. Research on the Development of Western Coal Industry Under the Background of Big Data. In Proceedings of the International Conference on Cyber Security Intelligence and Analytics, Shenzhen, China, 1 July 2019; Springer: Cham, Switzerland, 2019; pp. 1360–1365. [Google Scholar]
- Cui, G.R. Measurement and evaluation on high-quality industrial development level in China. Stat. Decis. 2022, 38, 85–90. [Google Scholar] [CrossRef]
- He, Y.M.; Kang, J.; Pei, Y.L.; Ran, B.; Song, Y.T. Research on influencing factors of fuel consumption on superhighway based on DEMATEL-ISM model. Energy Policy 2021, 158, 112545. [Google Scholar] [CrossRef]
- Liang, Y.; Wang, H.C.; Zhao, X.Y. Analysis of factors affecting economic operation of electric vehicle charging station based on DEMATEL-ISM. Comput. Ind. Eng. 2022, 163, 107818. [Google Scholar] [CrossRef]
- Dai, X.Z.; Hu, C.X. Research on influencing factors of serious traffic accidents on freeway based on improved DEMATEL-ISM. J. Saf. Environ. 2022, 22, 1217–1226. [Google Scholar] [CrossRef]
- Chen, W.Q.; Zhang, N.; Zhang, Y.S.; Cheng, J.; Zhang, Y. Study on influencing factors of urban disaster resilience based on DEMATEL-ISM. J. Catastrophology 2021, 36, 1–17. [Google Scholar]
Figure 1.
Coal Industry Chain.

Figure 2.
Percentage of carbon emissions from various energy activities in China.

Figure 3.
Relation diagram of influencing factors.

Figure 4.
Hierarchical structure model.


Table 1.
List of factors influencing the transformation of the coal industry.
| Number | Influencing Factor | Influencing Factors Interpretation |
|---|---|---|
| Resource Endowment | Refers to the coal industry which is based on coal mining, and its transformation and development are inevitably limited by the coal mine resource reserves, the amount available for mining, as well as the annual design capacity of the mine, scenic resources, and other factors [14] | |
| Safe Production | Refers to the coal industry in the process of transformation and development affected by safety production factors [18] | |
| Environmental Protection | Refers to the transformation of the coal industry influenced by current environmental protection factors such as low carbonization and cleanliness [19] | |
| Policy Traction | Refers to the coal industry as a strong policy traction industry, its transformation and development are influenced by national and regional policies [20] | |
| Market Demand | Refers to the influence of market demand on coal industry transformation under different paths of coal industry transformation [15] | |
| Technological Change | Refers to the technological development progress, brought about by the impact of the transformation of the coal industry [21] | |
| Horizontal Competition | Refers to the influence of horizontal competition in the process of transformation and development of the coal industry [22] | |
| Labor | Refers to the coal industry facing a serious age discontinuity and the impact of different transformation paths on the corporate workforce [23] | |
| Related Industries and Support | Refers to the impact of the transformation process of the coal industry, the upstream and downstream of the industry chain, and the support of related industries [23] | |
| Capital Funding | Refers to the impact of sustained capital funding support on the transformation of the coal industry in the process of transformation | |
| Location Advantage | Refers to the impact of the transformation process of the coal industry, and the enterprise’s location advantages on the transformation [24] | |
| Social Responsibility | Refers to the impact of social responsibility undertaken by the company itself on the transformation of the coal industry [25] |
Table 2.
Direct influence matrix .
| 0 | 0 | 0 | 0 | 2 | 1 | 3 | 0 | 4 | 3 | 3 | 1 | |
| 1 | 0 | 2 | 3 | 0 | 3 | 0 | 3 | 2 | 4 | 0 | 2 | |
| 2 | 1 | 0 | 1 | 0 | 3 | 0 | 3 | 1 | 2 | 0 | 2 | |
| 0 | 4 | 3 | 0 | 3 | 3 | 1 | 2 | 3 | 4 | 0 | 1 | |
| 0 | 2 | 2 | 1 | 0 | 4 | 3 | 2 | 2 | 4 | 1 | 0 | |
| 0 | 3 | 3 | 2 | 2 | 0 | 2 | 1 | 3 | 4 | 1 | 0 | |
| 0 | 1 | 2 | 1 | 3 | 2 | 0 | 2 | 2 | 3 | 0 | 0 | |
| 0 | 2 | 2 | 2 | 1 | 3 | 1 | 0 | 0 | 2 | 0 | 1 | |
| 0 | 1 | 1 | 2 | 2 | 3 | 3 | 0 | 0 | 3 | 0 | 1 | |
| 0 | 3 | 2 | 1 | 1 | 4 | 3 | 2 | 4 | 0 | 0 | 1 | |
| 0 | 1 | 0 | 0 | 3 | 0 | 3 | 0 | 2 | 2 | 0 | 0 | |
| 0 | 3 | 3 | 0 | 0 | 2 | 0 | 4 | 0 | 3 | 0 | 0 |
Table 3.
Comprehensive impact matrix .
| 0.0273 | 0.2236 | 0.2154 | 0.1573 | 0.2537 | 0.3451 | 0.3277 | 0.1894 | 0.3970 | 0.4449 | 0.1534 | 0.1289 | |
| 0.0852 | 0.3055 | 0.3695 | 0.3252 | 0.1948 | 0.5115 | 0.2299 | 0.3758 | 0.3763 | 0.5678 | 0.0401 | 0.2117 | |
| 0.1117 | 0.2587 | 0.2113 | 0.1919 | 0.1425 | 0.3990 | 0.1704 | 0.3035 | 0.2576 | 0.3839 | 0.0365 | 0.1745 | |
| 0.0595 | 0.5066 | 0.4610 | 0.2591 | 0.3404 | 0.5979 | 0.3155 | 0.3933 | 0.4714 | 0.6564 | 0.0465 | 0.1990 | |
| 0.0473 | 0.3833 | 0.3760 | 0.2616 | 0.2101 | 0.5619 | 0.3616 | 0.3418 | 0.3937 | 0.5860 | 0.0797 | 0.1312 | |
| 0.0517 | 0.4195 | 0.4106 | 0.2994 | 0.2834 | 0.4197 | 0.3226 | 0.3106 | 0.4306 | 0.5882 | 0.0774 | 0.1392 | |
| 0.0377 | 0.2812 | 0.3122 | 0.2133 | 0.2753 | 0.4088 | 0.1955 | 0.2870 | 0.3219 | 0.4566 | 0.0332 | 0.1043 | |
| 0.0371 | 0.3011 | 0.2951 | 0.2340 | 0.1794 | 0.4054 | 0.2004 | 0.1976 | 0.2222 | 0.3880 | 0.0290 | 0.1363 | |
| 0.0361 | 0.2926 | 0.2866 | 0.2522 | 0.2489 | 0.4482 | 0.3130 | 0.2217 | 0.2580 | 0.4707 | 0.0336 | 0.1415 | |
| 0.0486 | 0.4146 | 0.3755 | 0.2648 | 0.2442 | 0.5571 | 0.3496 | 0.3420 | 0.4534 | 0.4378 | 0.0395 | 0.1719 | |
| 0.0212 | 0.1964 | 0.1566 | 0.1160 | 0.2349 | 0.2264 | 0.2594 | 0.1412 | 0.2478 | 0.3130 | 0.0219 | 0.0644 | |
| 0.0412 | 0.3325 | 0.3279 | 0.1617 | 0.1262 | 0.3693 | 0.1540 | 0.3531 | 0.2088 | 0.4124 | 0.0258 | 0.1041 |
Table 4.
Calculation results of centrality and cause degree.
| Factors | Centrality Degree | Cause Degree |
|---|---|---|
| 3.4682 | 2.2590 | |
| 7.5087 | −0.3221 | |
| 6.4393 | −1.1561 | |
| 7.0432 | 1.5702 | |
| 6.4679 | 1.0005 | |
| 9.0034 | −1.4976 | |
| 6.1266 | −0.2728 | |
| 6.0828 | −0.8313 | |
| 7.0417 | −1.0358 | |
| 9.4048 | −2.0067 | |
| 2.6158 | 1.3826 | |
| 4.3241 | 0.9101 |
Table 5.
Global impact matrix .
| 1.0273 | 0.2236 | 0.2154 | 0.1573 | 0.2537 | 0.3451 | 0.3277 | 0.1894 | 0.3970 | 0.4449 | 0.1534 | 0.1289 | |
| 0.0852 | 1.3055 | 0.3695 | 0.3252 | 0.1948 | 0.5115 | 0.2299 | 0.3758 | 0.3763 | 0.5678 | 0.0401 | 0.2117 | |
| 0.1117 | 0.2587 | 1.2113 | 0.1919 | 0.1425 | 0.3990 | 0.1704 | 0.3035 | 0.2576 | 0.3839 | 0.0365 | 0.1745 | |
| 0.0595 | 0.5066 | 0.4610 | 1.2591 | 0.3404 | 0.5979 | 0.3155 | 0.3933 | 0.4714 | 0.6564 | 0.0465 | 0.1990 | |
| 0.0473 | 0.3833 | 0.3760 | 0.2616 | 1.2101 | 0.5619 | 0.3616 | 0.3418 | 0.3937 | 0.5860 | 0.0797 | 0.1312 | |
| 0.0517 | 0.4195 | 0.4106 | 0.2994 | 0.2834 | 1.4197 | 0.3226 | 0.3106 | 0.4306 | 0.5882 | 0.0774 | 0.1392 | |
| 0.0377 | 0.2812 | 0.3122 | 0.2133 | 0.2753 | 0.4088 | 1.1955 | 0.2870 | 0.3219 | 0.4566 | 0.0332 | 0.1043 | |
| 0.0371 | 0.3011 | 0.2951 | 0.2340 | 0.1794 | 0.4054 | 0.2004 | 1.1976 | 0.2222 | 0.3880 | 0.0290 | 0.1363 | |
| 0.0361 | 0.2926 | 0.2866 | 0.2522 | 0.2489 | 0.4482 | 0.3130 | 0.2217 | 1.2580 | 0.4707 | 0.0336 | 0.1415 | |
| 0.0486 | 0.4146 | 0.3755 | 0.2648 | 0.2442 | 0.5571 | 0.3496 | 0.3420 | 0.4534 | 1.4378 | 0.0395 | 0.1719 | |
| 0.0212 | 0.1964 | 0.1566 | 0.1160 | 0.2349 | 0.2264 | 0.2594 | 0.1412 | 0.2478 | 0.3130 | 1.0219 | 0.0644 | |
| 0.0412 | 0.3325 | 0.3279 | 0.1617 | 0.1262 | 0.3693 | 0.1540 | 0.3531 | 0.2088 | 0.4124 | 0.0258 | 1.1041 |
Table 6.
Reachable matrix .
| 1 | 0 | 0 | 0 | 0 | 0 | 0 | 0 | 0 | 1 | 0 | 0 | |
| 0 | 1 | 0 | 0 | 0 | 1 | 0 | 0 | 0 | 1 | 0 | 0 | |
| 0 | 0 | 1 | 0 | 0 | 0 | 0 | 0 | 0 | 0 | 0 | 0 | |
| 0 | 1 | 1 | 1 | 0 | 1 | 0 | 0 | 1 | 1 | 0 | 0 | |
| 0 | 0 | 0 | 0 | 1 | 1 | 0 | 0 | 0 | 1 | 0 | 0 | |
| 0 | 1 | 1 | 0 | 0 | 1 | 0 | 0 | 1 | 1 | 0 | 0 | |
| 0 | 0 | 0 | 0 | 0 | 0 | 1 | 0 | 0 | 1 | 0 | 0 | |
| 0 | 0 | 0 | 0 | 0 | 0 | 0 | 1 | 0 | 0 | 0 | 0 | |
| 0 | 0 | 0 | 0 | 0 | 1 | 0 | 0 | 1 | 1 | 0 | 0 | |
| 0 | 1 | 0 | 0 | 0 | 1 | 0 | 0 | 1 | 1 | 0 | 0 | |
| 0 | 0 | 0 | 0 | 0 | 0 | 0 | 0 | 0 | 0 | 1 | 0 | |
| 0 | 0 | 0 | 0 | 0 | 0 | 0 | 0 | 0 | 1 | 0 | 1 |
Table 7.
Results of the first-level calculation.
| , | |||
| ,, | ,,, | ,, | |
| ,, | |||
| ,,,,, | |||
| ,, | |||
| ,,,, | ,,,,, | ,,, | |
| , | |||
| ,, | ,,, | ,, | |
| ,,, | ,,,,,,,, | ,,, | |
| , |
Table 8.
Results of the second-level calculation.
| , | |||
| , | |||
| ,, | |||
Table 9.
Results of the third-level calculation.
Publisher’s Note: MDPI stays neutral with regard to jurisdictional claims in published maps and institutional affiliations. |
© 2022 by the authors. Licensee MDPI, Basel, Switzerland. This article is an open access article distributed under the terms and conditions of the Creative Commons Attribution (CC BY) license (https://creativecommons.org/licenses/by/4.0/).
Share and Cite
MDPI and ACS Style
Zhong, S.; Lin, D.; Yang, K. Research on the Influencing Factors of Coal Industry Transformation Based on the DEMATEL–ISM Method. Energies 2022, 15, 9502. https://doi.org/10.3390/en15249502
AMA Style
Zhong S, Lin D, Yang K. Research on the Influencing Factors of Coal Industry Transformation Based on the DEMATEL–ISM Method. Energies. 2022; 15(24):9502. https://doi.org/10.3390/en15249502
Chicago/Turabian StyleZhong, Shuheng, Dan Lin, and Kangdi Yang. 2022. "Research on the Influencing Factors of Coal Industry Transformation Based on the DEMATEL–ISM Method" Energies 15, no. 24: 9502. https://doi.org/10.3390/en15249502
Note that from the first issue of 2016, this journal uses article numbers instead of page numbers. See further details here.