
Reference Test Method for Calculating the Thermal Effect of Coal Spontaneous Combustion
1
College of Safety and Engineering, Xi’an University of Science and Technology, Xi’an 710054, China
2
Xi’an Tianhe Mining Technology Co., Ltd., Xi’an 710054, China
*
Author to whom correspondence should be addressed.
Energies 2022, 15(20), 7707; https://doi.org/10.3390/en15207707
Submission received: 22 August 2022
/
Revised: 16 September 2022
/
Accepted: 14 October 2022
/
Published: 18 October 2022
(This article belongs to the Special Issue Fluid Flow and Heat Transfer Analysis in Industrial Applications)
Abstract
:During a heating experiment, there are two sources of heat that increase the temperature of a coal sample: the heat released by the oxidation reaction of the coal itself, and the heat provided by the experimental system. Here, we propose a method for measuring the thermal effect of oxidation and self-ignition through a reference experiment conducted with a material that is physically similar to coal but does not combust. The reference material used was an aggregate of alumina, fly ash, and concrete, and experiments were conducted on both materials simultaneously. The temperature of the coal sample was obtained under self-heating conditions, and compared with that of the non-combusting material. The relationship of temperature as a function of time for both materials was determined from the data, the comparison of which allowed for the thermal effect of oxidation and coal spontaneous combustion (CSC) to be calculated. The reliability of the thermal effect data obtained by the experiment was verified by chemical bond energy estimation. These results provide theoretical guidance for on-site fire prevention and extinguishing in coal mines, and are important for the further development of the understanding of CSC.
1. Introduction
China currently produces approximately half of the total worldwide coal energy [1]. Coal spontaneous combustion (CSC) is a major hazard of coal mining [2,3,4], resulting in production losses, environmental pollution, and casualties [5,6,7,8]. CSC has the characteristics of making it difficult to detect, locate, prevent, and control the fire source. Most coal mine fires in China are caused by CSC [9]. The amount of coal lost due to CSC reaches 4.42 million tons every year. CO2 and CH4 produced by CSC have a certain impact on global warming, and H2S and SO2 produced by CSC pose great harm to the human body [10,11]. Understanding the spontaneous combustion process is therefore important for predicting and mitigating potential hazards.
The spontaneous combustion of coal is a complex physical and chemical reaction process, ultimately driven by the thermal effect of oxidation, which is reflected in the intensity of heat released [12,13,14,15]. In the 1980s, Luo et al. [16,17], Fushun Branch of Coal General Hospital, took the lead in testing the CSC tendency by the chromatographic oxygen absorption identification method to characterize the thermal effect of coal oxidation and spontaneous combustion, and implemented it as a national standard in 2006 (GB/T20104-2006). In the laboratory, quantifying the thermal effects of oxidation is typically accomplished with thermal analysis techniques, including thermogravimetric analysis, differential thermal analysis, and differential scanning calorimetry [18,19,20,21,22]. The Merrick model [23] relates the heat transfer process in coal pyrolysis. Li et al. [24] quantified the controlling parameters and variability of the exothermic intensity of spontaneous combustion through large-scale laboratory experiments. In order to explore the law of CSC, Cao and Wang [25] carried out an experimental study on coal exothermic characteristics under lean oxygen conditions by using an adiabatic spontaneous combustion device. Hu [26] carried out a study on the microscopic physical and chemical characteristics and macroscopic thermal effect of coal during spontaneous combustion and oxidation in a gas-containing atmosphere. Li [27] studied the thermal oxidation reaction, thermal effect, heat conduction, and dynamic characteristics of coal under different oxygen deprivation levels by combining experimental tests and theoretical analysis. Pan et al. [28] studied the maximum exothermic temperature, heat absorption, and heat release in the process of coal oxidation by using a differential scanning calorimetry (DSC) experiment of coal temperature-programmed oxidation, and calculated the activation energy in the oxidation process according to the thermal effect data of the DSC experiment. Fan et al. [29] monitored the variation in the heat flow and heat release of coal samples at different oxygen concentrations in the process of gradual warming. Chen [30] studied the combustion process of white anthracite oxidation by a C80 microcalorimeter, and analyzed its exothermic characteristics and activation energy changes. Kuchta J.M. et al. [31] proposed characterizing the thermal effect of CSC with the gas production rate.
Simulating CSC in the laboratory is an effective method for better understanding the underlying processes. Aiming at the problems existing in the research field of the thermal effect of coal spontaneous combustion and oxidation, based on the leading heating and reference test methods, this paper effectively tests the thermal effect of coal spontaneous combustion by constructing a physical similarity reference test experimental system. This can effectively test the macroscopic characteristic parameters in the process of coal spontaneous combustion. On this basis, more in-depth research is carried out. Through theoretical analysis and a self-made small coal quantity test bench, combined with the microstructure change characteristics of the coal low-temperature oxidation process, the thermal effect of coal spontaneous combustion is tested quickly and accurately, and the basic theory of coal spontaneous combustion is further improved and enriched. We provide basic parameters for predicting the spontaneous combustion law under real conditions. This provides basic theoretical support and solutions for on-site prevention and control, and has high basic theoretical value and important scientific and practical significance.
2. Theory
During heating, there is a positive temperature difference between the coal sample and the surrounding experimental apparatus. To facilitate calculation and theoretical derivation, the different types of heat in the system are defined as follows. We maintain the total heat of the coal sample as Qc, which is the sum of Qm (total heat of self-oxidation of coal sample) and Qk (compensation heat of coal sample by experimental system). From these definitions, the relationship between these values is given by
Heat may be transferred to the sample by conductive heat (Qd) and radiation (Qf,) of the coal sample tank to the coal sample, and convective heat dissipation of the air current to the coal sample (Qs) [32,33]. Other heat during coal spontaneous combustion is Qt. The relationship of these values is thus
Heat transferred to the sample by conduction, radiation, and convection is straightforward to quantify, but other heat (Qt) is difficult to calculate from theory. The contribution from this heat (Qk) may, however, be empirically determined by heating a material that is physically similar to coal but which does not react with oxygen or combust. If the properties of this reference material (i.e., the thermal conductivity and density) change with temperature in a manner similar to that of coal, the factor Qk can be assumed to be equal for both samples. Then, the total heat of self-oxidation of coal sample (Qm) can be expressed as
The relationship between the total heat of the coal sample (Q) and the temperature difference of a system during heating (ΔT) is given by
where C represents the specific heat capacity (J/g∙°C); M represents the mass of the coal sample (g). Defining the final temperature of the coal sample reached as Tf allows for ΔT to be written as
A function for the final temperature with respect to time can be obtained empirically from the experimental data, and expressed as . Combining this with Equations (4) and (5) results in an expression for maintaining the total heat (Qc) of the coal sample:
where the superscript b denotes the reference coal sample. A similar expression can be written for the comparison material, denoted with the superscript u, which does not have a Qm component:
If Cb = Cu and Mb = Mu, according to Equations (3), (6), and (7), Qm can be written:
Thus, the heat released by the coal sample during heating (Qm) can be determined from and , which can be experimentally determined.
The heat release intensity of the coal sample (q0t) is defined as the heat released per unit time, so the relationship between the heat release and the heat release intensity can be expressed as
During the experiment, as the temperature increases, the coal sample first undergoes physical and chemical adsorption with oxygen supplied by inflowing air, which generates adsorption heat. When the temperature reaches a critical temperature, the coal begins to chemically react with oxygen. In this process, oxygen is consumed while producing CO, CO2, and other gases, and releasing chemical reaction heat.
If it is assumed that the thermal effects of coal all result from the reaction of coal with oxygen, and we assume that all consumed oxygen has reacted to oxidize the coal, the calculated thermal effect is too large. Similarly, if it is assumed that the oxygen consumed is incorporated into the production of CO and CO2, with only the remaining fraction chemically adsorbed, the calculated thermal effect is too small. Therefore, without considering the error introduced by the temperature differences of the experimental apparatus, the q0t should be between these constraints, the minimum heat release intensity of the coal sample (qmin) and the maximum heat release intensity of the coal sample (qmax). That is, the relationship between the three should be
Thus, if the value of q0t calculated from the experimental data satisfies Equation (10), the accuracy of the method of heating a physically similar reference material would be verified.
3. Materials and Methods
3.1. Thermal Properties of Test Sample
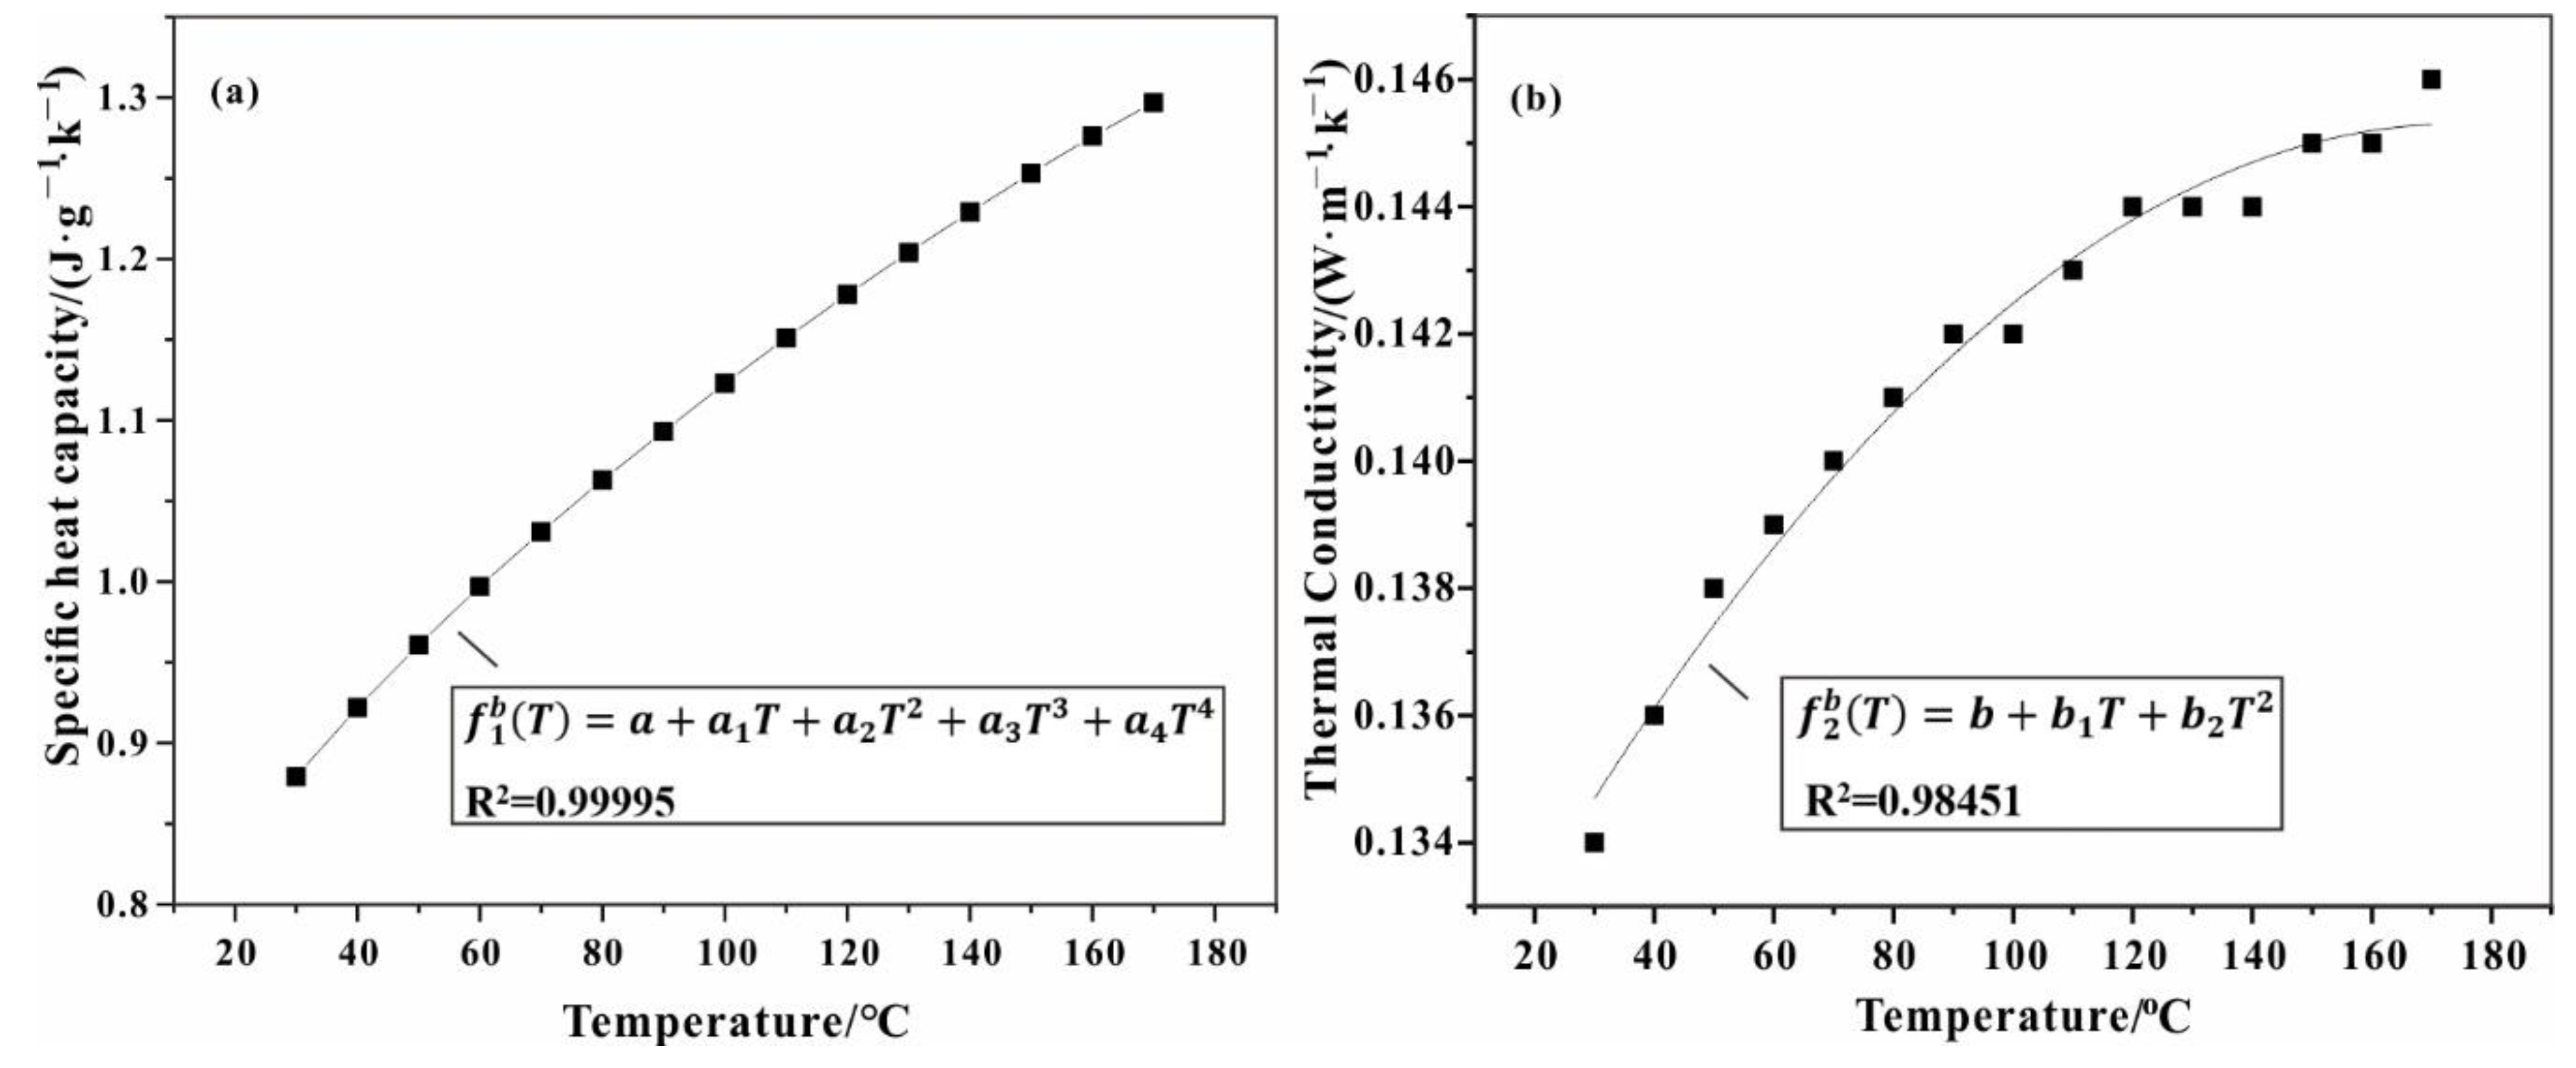
The coal used in this study was sampled from the Pansan Mine (hereinafter denoted as PS). A laser thermal conductivity meter (NETZSCH LFA 457, Selb, Germany) was employed to measure the thermal conductivity and specific heat capacity. The resulting heat capacity data were fit to the model proposed by Tomeczek and Palugniok [34], and thermal conductivity data were fit to the model developed by Zhumagulov [35]. The fit results given in Equations (11) and (12), respectively, and the statistical data on basic thermophysical parameters are shown in Table 1. The resulting curves are shown in Figure 1a,b.
where T represents the temperature (°C); f1(T) represents the specific heat capacity fitting formula; f2(T) represents the thermal conductivity fitting formula; a, a1, a2, a3, a4, b, b1, b2 represent the fitting parameters.
From Figure 2 and Figure 3, it can be seen that the thermal conductivity of coal samples increases rapidly with temperature changes. When the temperature reaches approximately 110 °C, the growth trend slows down. This is because, during the heating process, the thermal motion of coal molecules is enhanced, resulting in enhanced thermal convection capacity in coal pores, so that the thermal conductivity of the experimental sample increases gradually.
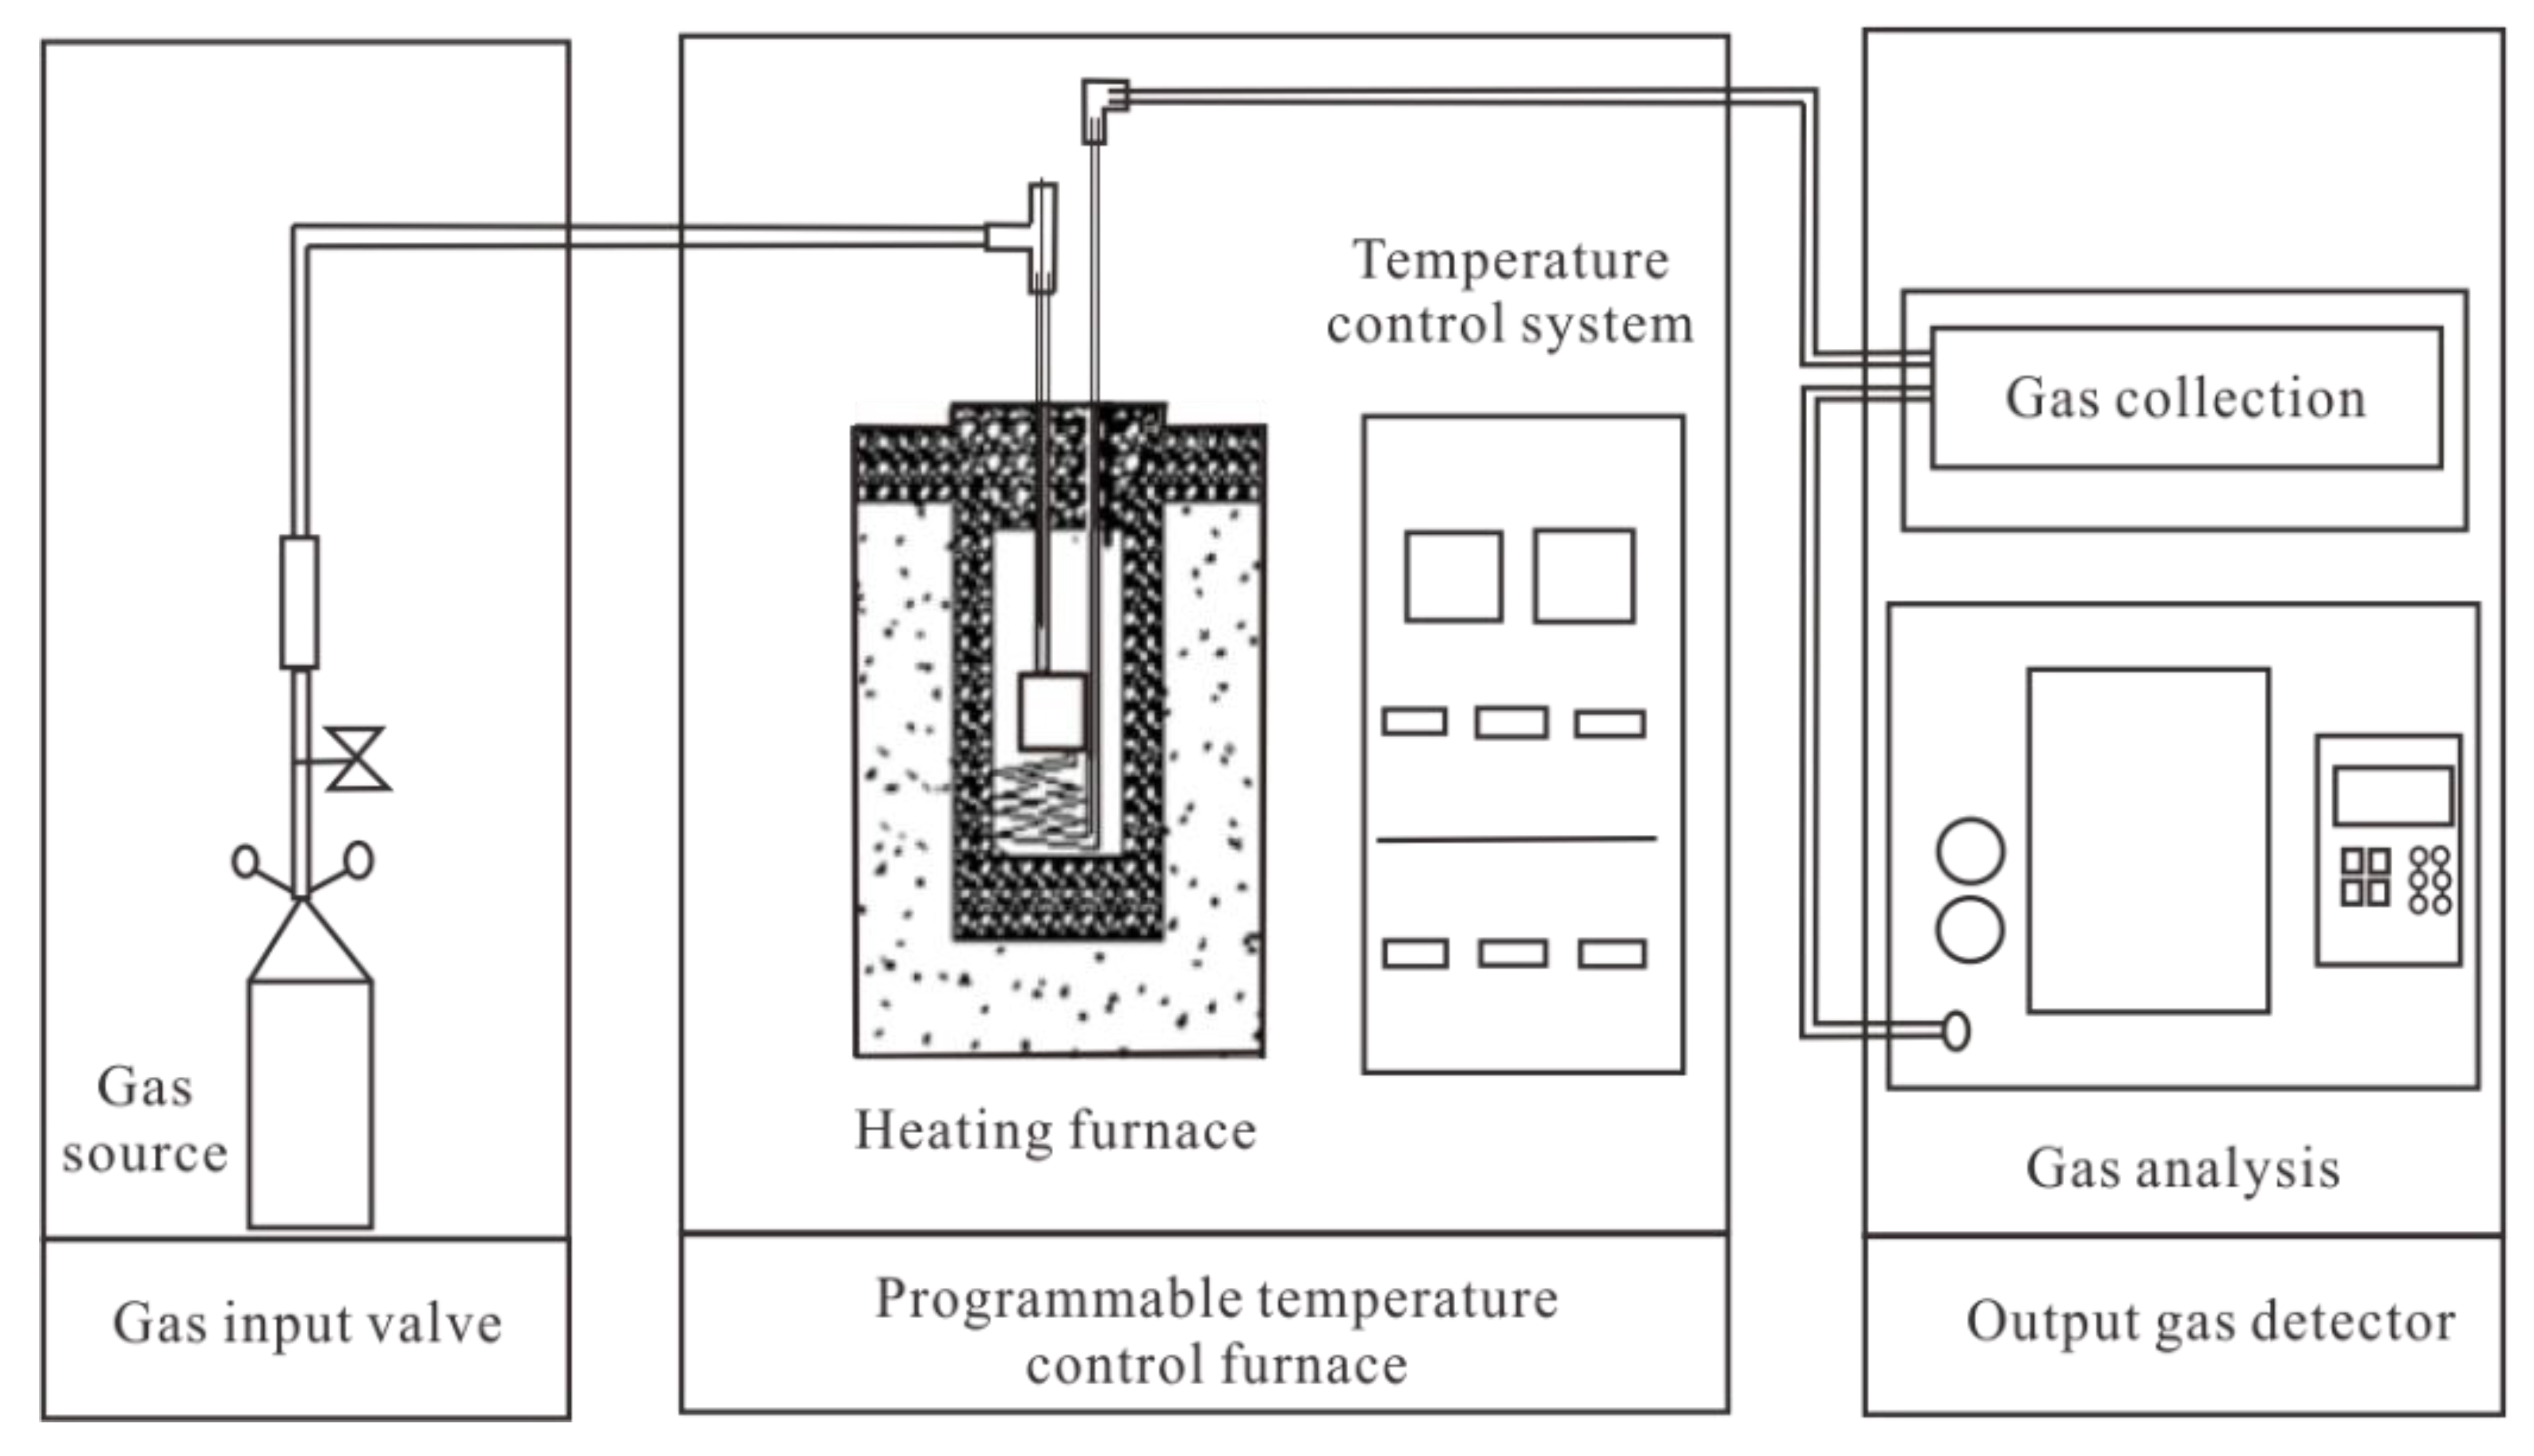
3.2. Experimental System
For this work, we constructed an experimental system consisting of a gas input valve, a furnace with programmable temperature control and an output gas detector (Figure 2). The gas required for the experiment is regulated by flow and pressure to achieve stable inflow, and enters the sample chamber after preheating. The reactor controls the output power by maintaining a constant temperature difference between the furnace and the sample, referred to as the leading temperature. The temperature of the sample is recorded in real time. Output gas from the coal is monitored and analyzed by a meteorological chromatographer after drying.
3.3. Thermophysical Parameters of Reference Sample
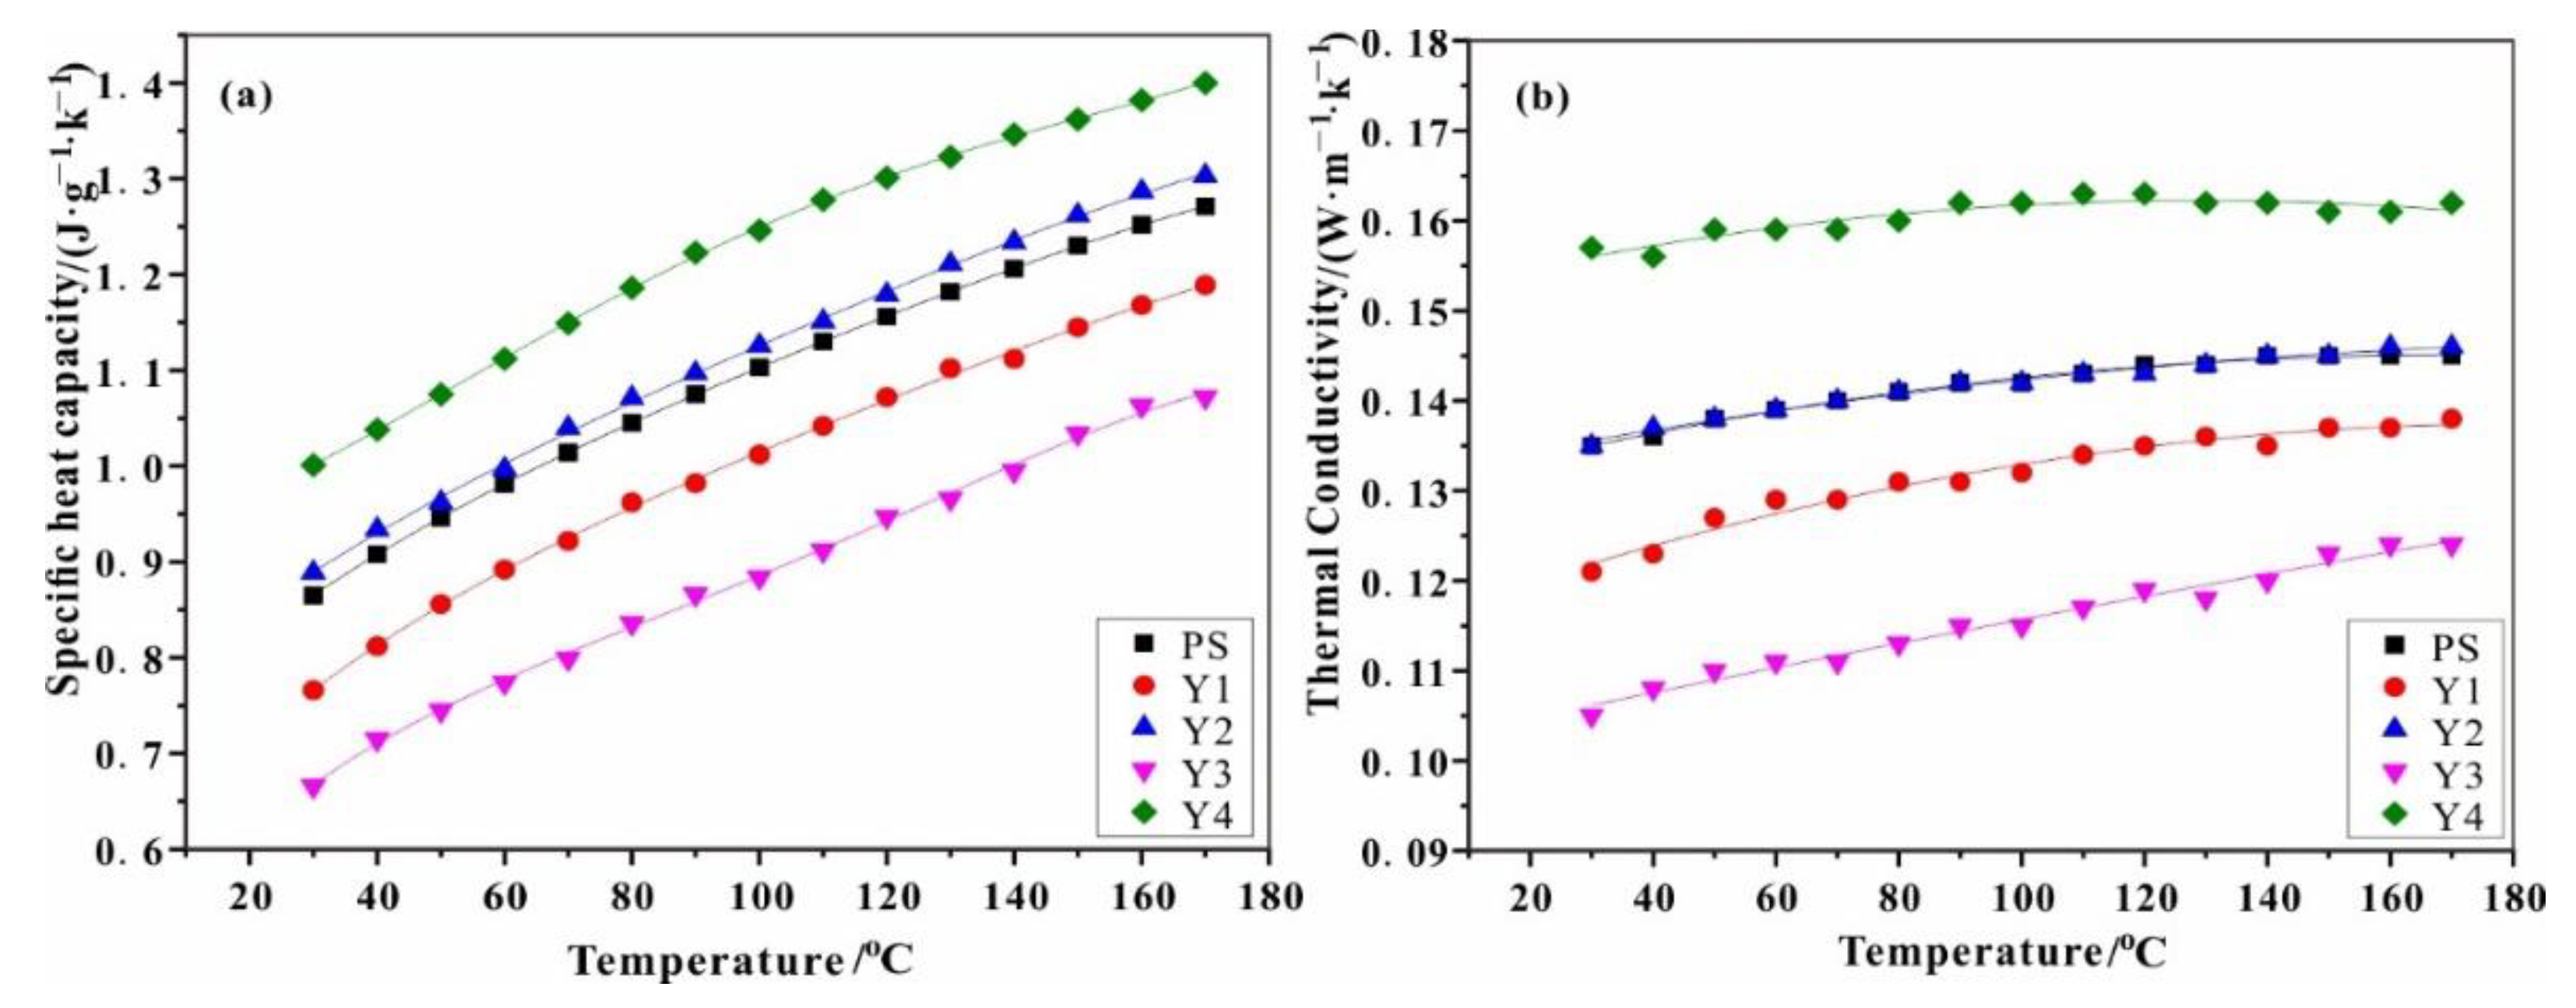
This study requires reference samples that have similar physical properties to coal and do not react with oxygen. Previous studies had shown that if the temperature of alumina remains below 350 °C, the thermal conductivity is less than 0.12 W/(m·K), and the density is 3.5–3.9 g/cm3 [36]. The thermal conductivity of alumina is lower and the density is higher than that of the PS coal samples. Therefore, other components with higher thermal conductivities and lower densities than PS must be added to the alumina, such that the properties of the aggregate accurately mirror the properties of coal. Fly ash [37] (thermal conductivity 0.18–0.21 W/(m·K), density 0.55–0.78 g/cm3) and cement [38] (thermal conductivity 1.64–1.78 W/(m·K), density 3–3.15 g/cm3) meet these requirements. Four reference samples were prepared with different ratios of these three components, referred to as Y1, Y2, Y3, and Y4. The ratios of the components are listed in Table 2. Data for the specific heat capacity and thermal conductivity of the four prepared reference samples were obtained and fit to the same empirical curves described above. The results are shown in Figure 3a,b, respectively. The data indicate that the sample Y2 most closely mirrors the data from the PS sample; thus, Y2 was selected as the reference sample composition (denoted DB) for comparison with coal to calculate Qk.
3.4. Calculation of Thermal Parameters
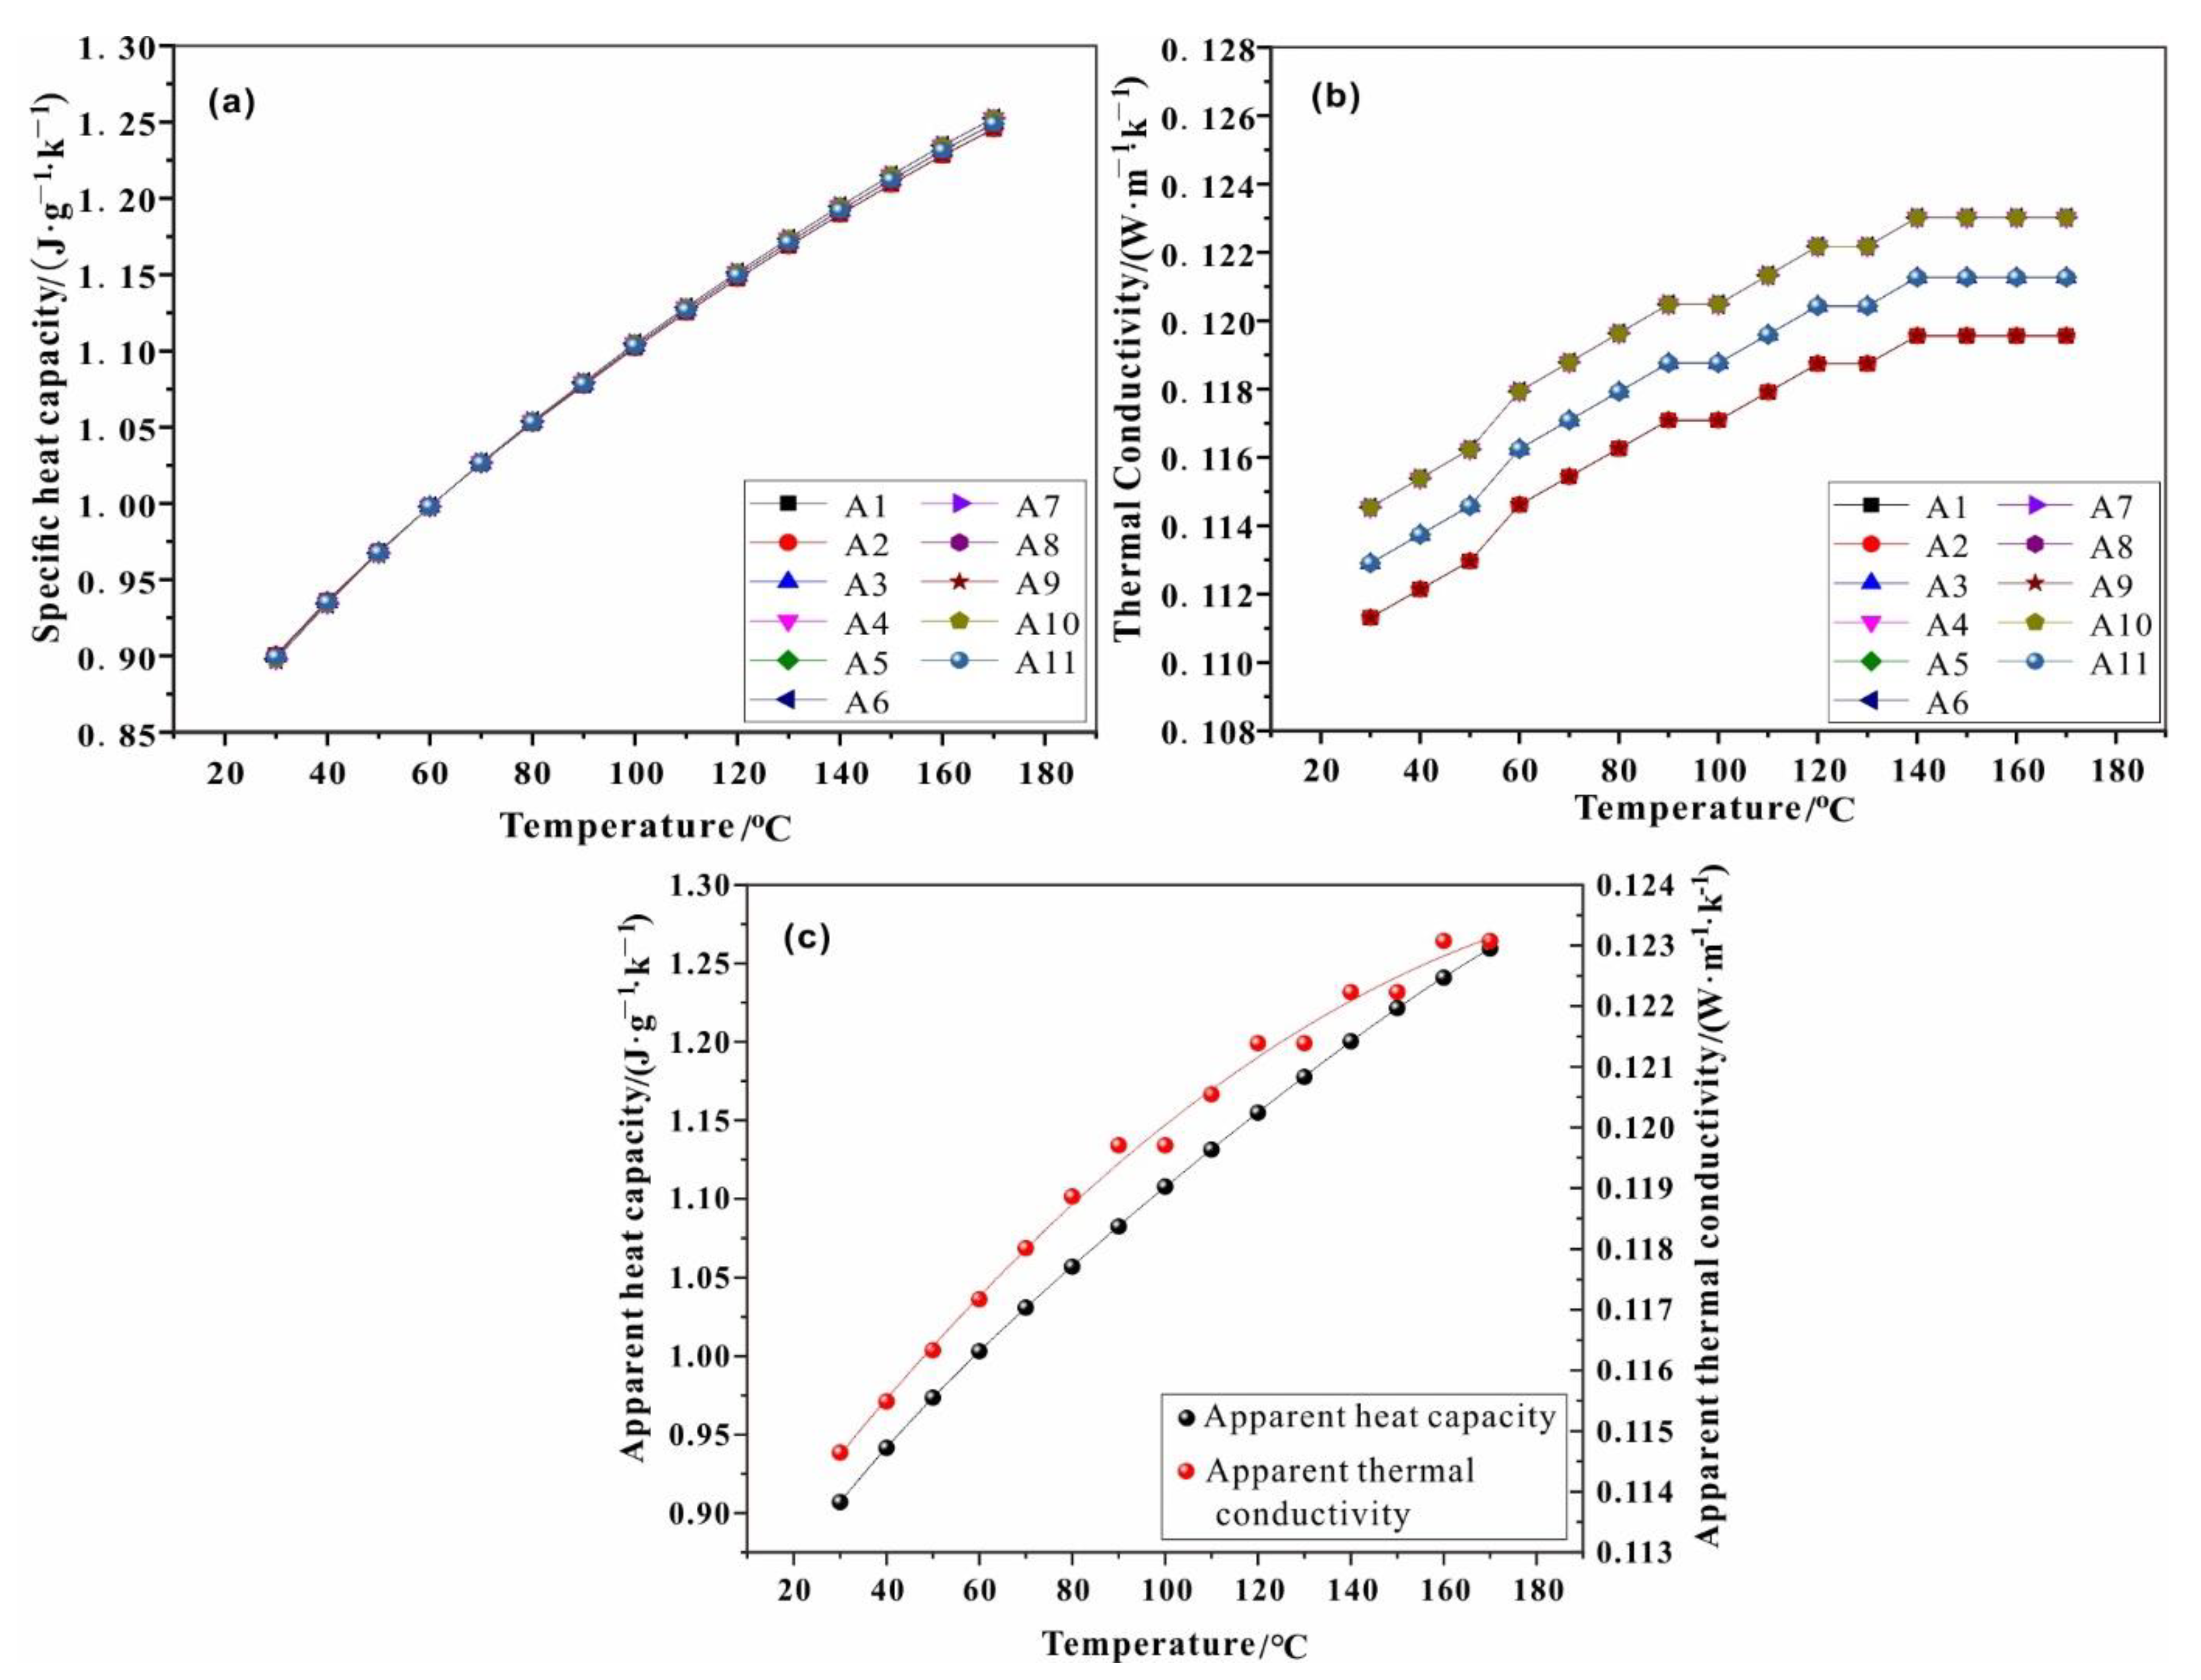
To calculate the thermal effect of the coal samples using the leading temperature method, the true density and thermal conductivity of the samples are required. The true density of the PS and DB samples was determined experimentally as follows. First, 160 g of sample was extracted from a vacuum-sealed belt in a drying dish and placed into a sample cylinder. The height was measured, and basic parameters such as void ratio and bulk density were determined. The true density of PS and DB is 1.392 and 1.383 g/cm3, respectively. The data are listed in Table 3.
The apparent thermal parameters are calculated with the following:
where λm, λg, Cm, and Cg are constants: λm = 0.0012 J/(cm·s·°C), λg = 0.000265 J/(cm·s·°C), Cm = 1.53 J/(g·°C), and Cg = 1.0035 J/(g·°C). λc is the apparent thermal conductivity, and n is the void ratio.
The true density is calculated with Equations (11) and (12), and curves fitted to the specific heat capacity and thermal conductivity data collected from PS and DB samples are shown in Figure 4a–c.
The data indicate that the apparent specific heat capacity of DB has a nearly linear relationship. The apparent thermal conductivity has minor fluctuations. During the physical similarity reference experiment, the DB and PS samples were simultaneously heated with the same temperature difference, allowing for the function of temperature with respect to time to be determined. The coal oxidation temperature data could subsequently be obtained, and the heating rate calculated. Finally, the thermal effect of coal self-oxidation could be calculated.
4. Calculation
4.1. Thermal Effect Calculation
The constant positive temperature difference used in this experiment drove the experiment. Simultaneous experiments were performed with the prepared coal sample (PS) and reference sample (DB). Samples of each were placed in the two sample chambers, and temperature data during the heating process of PS and DB were obtained. The data were subsequently fit to a curve, and the results from different leading temperatures are shown in Figure 5a–l.
The data demonstrate that as the leading temperature increases, the slope of the sample temperature curve increases. This is because the heat, Q, is proportional to the temperature. With an increase in the temperature difference, the external heat, Qk, increases, resulting in a gradual increase in the slope of the Qc curve, assuming that the thermal effect of the coal does not vary.
According to the theory and method of the physical similarity reference test, the selected physical similarity reference sample is basically the same as the basic physical parameters of the test coal sample. Then, the test heat (Qc) is the thermal effect of the coal sample in each time period (Qm), which is equal to the sum of the thermal effect released in the same time period and the leading increased thermal effect (Qk). According to the theory of coal–oxygen composites and quantum chemistry theory of CSC, the thermal effect in the process of CSC is related to temperature, at the same time leading the heat with the temperature difference into a linear proportional relationship. Therefore, the comprehensive thermal effect of the experimental test of the same coal sample under different leading temperature differences is a fixed value, which is related to the internal factors of the coal sample itself. The main reason for the increase in the slope of the test curve is the increase in the leading heat.
Therefore, under the same thermophysical parameters, the experimental test curve of the reference sample can be regarded as the heating curve of the coal sample without any physical and chemical reaction and no heat release effect.
Origin Pro 2016 software was used to curve fit the temperature data and time parameters of the test experiment under each leading temperature difference. The temperature functions of PS and DB at the same time were determined as shown in (15) and (16), respectively. The fit parameters of the equations are listed in Table 4.
where t represents the time; f(t) represents the coal sample temperature as a function of time; y0, x0, A1, t1, A2, t2, a, b represent the fitting parameters.
Because the apparent thermal properties of PS and DB are the same, the difference in temperature between the samples must therefore be a result of the heat generated by the coal oxidation process. A mathematical relationship is obtained by fitting the data, and the PS self-heating rate (VT) can be calculated at different leading temperatures.
Because the heating rate is the external reaction of the thermal effect, the thermal effect can be calculated by the heating rate. From Equations (4), (9), and (17), we can obtain
The exothermic intensities of the oxidation process of PS coal under different leading temperatures are calculated from Equation (18), and are listed in Table 5.
It can be concluded from Table 5 that under the same temperature, the thermal effect parameters of coal samples are basically the same under different leading temperature differences, which is basically consistent with the inference of the relationship between the thermal effect and temperature in the heating process of coal samples in theoretical analysis. This can prove that the calculation of the adiabatic spontaneous combustion heat effect in the process of CSC can basically meet the requirements of the experimental test of coal adiabatic spontaneous combustion and the needs of field verification by the positive temperature difference leading experiment.
4.2. Thermal Effect Verification
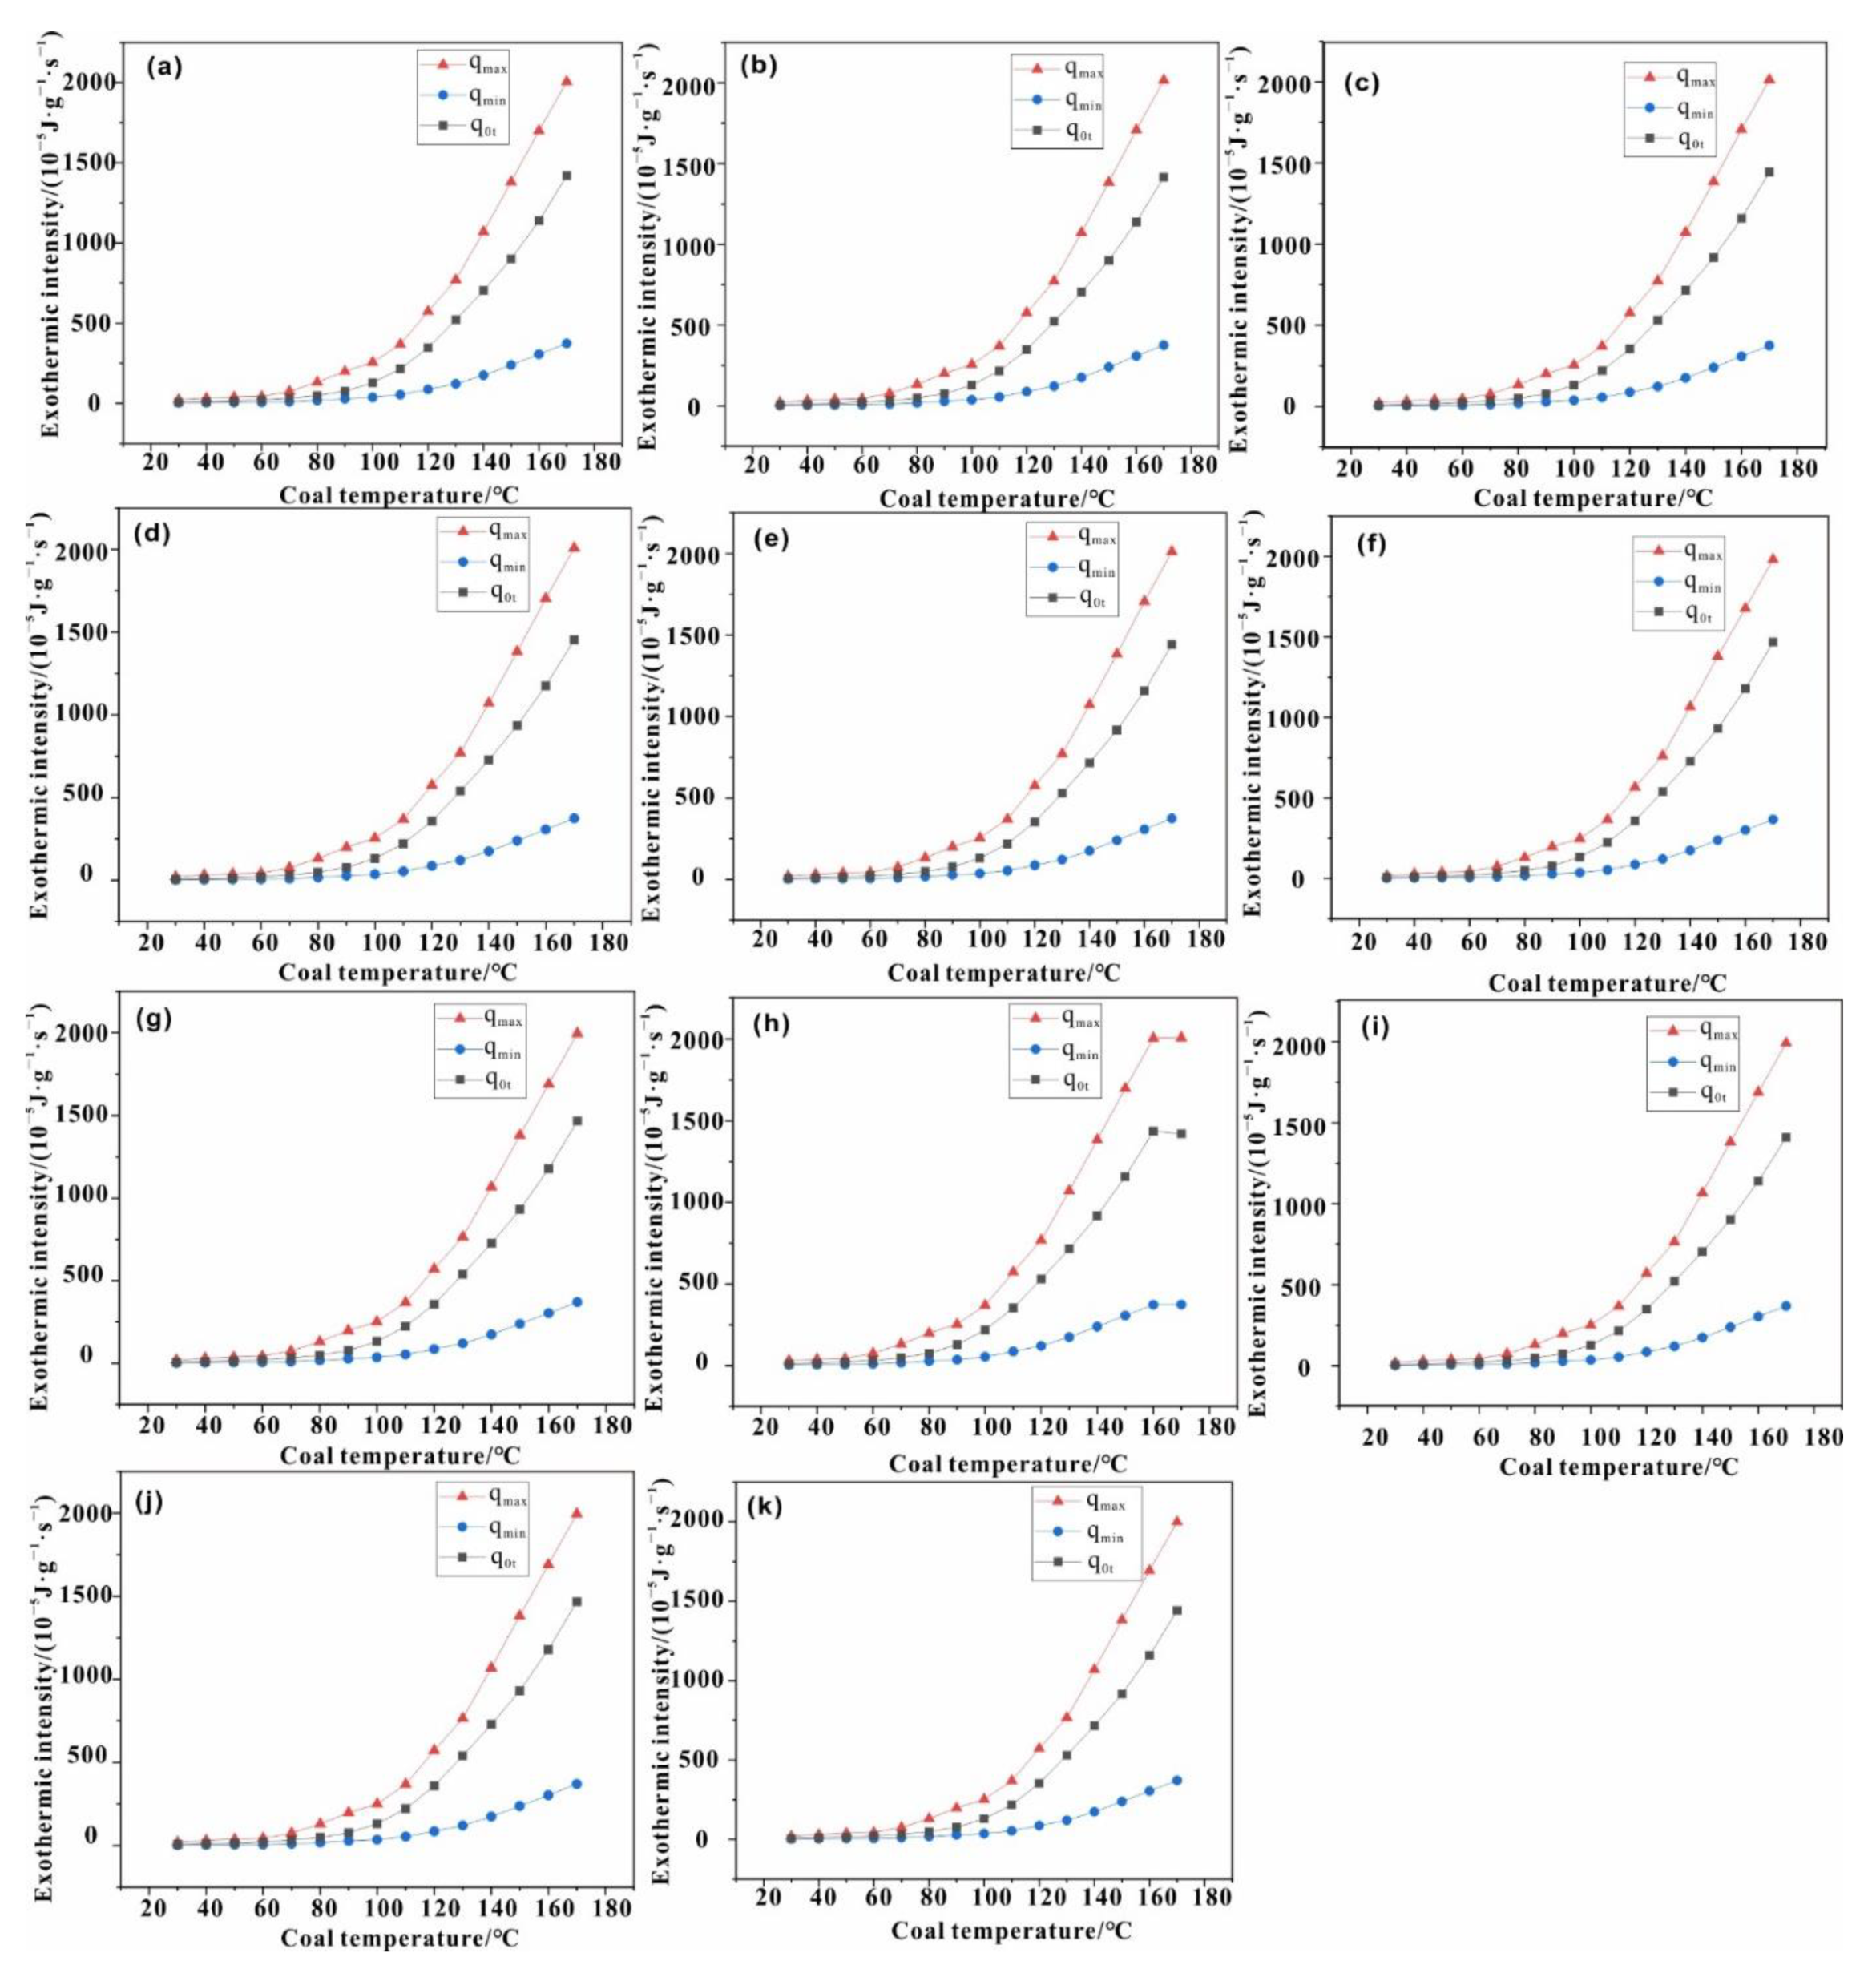
For the same coal sample, the reactivity of its surface molecular structure will vary with temperature. Therefore, the estimated energy of the chemical bonds in the coal molecule was used to compare the calculated exothermic intensity, q0t, to qmin and qmax. Curves of the three for different leading temperature differences are shown in Figure 6a–k.
The data in Figure 6a–k indicate that the heat release intensity calculated for the PS samples is within the qmin and qmax constraints, which conforms to the results from the theoretical prediction. This supports the conclusion that data from a physical similarity reference experiment can be used to calculate the thermal effect of coal oxidation.
5. Conclusions
In this paper, the main conclusions are as follows:
- Through theoretical analysis, a mathematical model for the thermal effect of CSC was constructed;
- To test the model, a purpose-built experimental system was constructed and data from a physically similar reference material were collected and compared with those of coal;
- The thermal effect of the coal depends primarily on the coal temperature and is less affected by the ambient temperature;
- The thermal effect of the coal increases with the increase in its temperature; the intensity of heat released measured during the experiment is within the constraints imposed by chemical bond energy estimation, lending support to the mathematical model.
Author Contributions
Conceptualization, W.L.; methodology, W.L.; software, S.M. and Z.Z.; validation, W.L. and W.Z.; formal analysis, W.L.; data curation, W.L. and S.M.; writing—original draft preparation, W.L.; writing—review and editing, W.L., W.Z. and Z.Z.; visualization, W.L.; supervision, W.L.; project administration, W.L.; funding acquisition, W.L. All authors have read and agreed to the published version of the manuscript.
Funding
This research was funded by the “Research project on mechanism of spontaneous combustion of coal under high temperature, low oxygen and reburning in Shendong”, grant number “2016JM5022”.
Data Availability Statement
Not applicable.
Acknowledgments
We thank Shaanxi Key Laboratory of Prevention and Control of Coal Fire, Xi’an University of Science and Technology, for providing technical and platform support for the analyses, and we thank all the authors for their contributions to this study.
Conflicts of Interest
The authors declare no conflict of interest.
Nomenclature
| Qc | Maintaining the total heat of the coal sample (J/g) |
| Qm | Total heat of self-oxidation of coal sample (J/g) |
| Qk | Compensation heat of coal sample by experimental system (J/g) |
| Qd | Conduction heat of coal sample tank to coal sample (J/g) |
| Qf | The radiant heat of the coal sample tank to the coal sample (J/g) |
| Qs | Convective heat dissipation of air current to coal sample (J/g) |
| Qt | Other heat during coal spontaneous combustion (J/g) |
| Q | Total heat of coal sample (J/g) |
| C | Specific heat capacity of coal sample (J/g∙°C) |
| M | The mass of the coal sample (g) |
| ΔT | Temperature difference (°C) |
| Tf | Final temperature of coal sample (°C) |
| T0 | Initial temperature of coal sample (°C) |
| f(t) | Coal sample temperature as a function of time |
| q0t | Heat release intensity of coal sample (105 J/(s∙cm3)) |
| t | Time (s) |
| qmin | Minimum heat release intensity of coal sample (105 J/(s∙cm3)) |
| qmax | Maximum heat release intensity of coal sample (105 J/(s∙cm3)) |
| f1(T) | Specific heat capacity fitting formula |
| T | Temperature (°C) |
| f2(T) | Thermal conductivity fitting formula |
| Cc | Apparent heat capacity (J/g∙°C) |
| N | Void ratio |
| λc | Apparent thermal conductivity (J/(cm·s·°C) |
| VT | PS self-heating rate (°C/s) |
References
- Xiao, Y.; Lü, H.F.; Yi, X.; Deng, J.; Shu, C.M. Treating bituminous coal with ionic liquids to inhibit coal spontaneous combustion. J. Therm. Anal. Calorim. 2019, 135, 2711–2721. [Google Scholar] [CrossRef]
- Liu, Y.; Wen, H.; Guo, J.; Jin, Y.F.; Wei, G.M.; Yang, Z.W. Coal spontaneous combustion and N2 suppression in triple goafs: A numerical simulation and experimental study. Fuel 2020, 271, 117625. [Google Scholar] [CrossRef]
- Querol, X.; Zhuang, X.; FonO, T.; Izquierdo, M.; Alastuey, A.; Castro, I.; Drooge, B.L.; Moreno, T.; Grimalt, J.O.; Elvira, J.; et al. Influence of soil cover on reducing the environmental impact of spontaneous coal combustion in coal waste gobs: A review and new experimental data. Int. J. Coal Geol. 2011, 85, 2–22. [Google Scholar] [CrossRef]
- Onifade, M.; Genc, B. A review of research on spontaneous combustion of coal. J. Min. Sci. Technol. Engl. Ed. 2020, 30, 303–311. [Google Scholar] [CrossRef]
- Li, J.L.; Lu, W.; Cao, Y.J.Z.; Kong, B.; Zhang, Q.S. Method of pre-oxidation treatment for spontaneous combustion inhibition and its application. Process Saf. Environ. Prot. 2019, 131, 169–177. [Google Scholar] [CrossRef]
- Wu, Z.Y.; Hu, S.S.; Jiang, S.G.; He, X.J.; Shao, H.; Wang, K.; Fan, D.Q.; Li, W.R. Experimental study on prevention and control of coal spontaneous combustion with heat control inhibitor. J. Loss Prev. Process Ind. 2018, 56, 272–277. [Google Scholar] [CrossRef]
- Song, Z.Y.; Huang, X.Y.; Jiang, J.C.; Pan, X.H. A laboratory approach to CO2 and CO emission factors from underground coal fires. Int. J. Coal Geol. 2020, 219, 103382. [Google Scholar] [CrossRef]
- Deng, J.; Li, B.; Xiao, Y.; Ma, L.; Wang, C.P.; Lai, W.B.; Shu, C.M. Combustion properties of coal gangue using thermogravimetry-Fourier transform infrared spectroscopy. Appl. Therm. Eng. 2017, 116, 244–252. [Google Scholar] [CrossRef]
- Wang, L.C. Study on Critical Transition Characteristics of Coal Oxidation and Spontaneous Combustion; University of Science and Technology of China: Hefei, China, 2021. [Google Scholar]
- Liu, Z.J.; Xu, Y.L.; Wen, X.L.; Lv, Z.G.; Wu, J.D.; Li, M.J.; Wang, L.Y. Thermal Properties and Key Groups Evolution of Low-Temperature Oxidation for Bituminous Coal under Lean-Oxygen Environment. ACS Omega 2021, 6, 15115–15125. [Google Scholar] [CrossRef]
- Zhang, Y.B.; Zhang, Y.T.; Li, Y.Q.; Shi, X.Q.; Xia, S.W.; Guo, Q. Determination and dynamic variations on correlation mechanism between key groups and thermal effect of coal spontaneous combustion. Fuel 2022, 310, 122454. [Google Scholar] [CrossRef]
- Shen, J.; Zhu, H.Q.; Zhang, Z. Experiment analysis of relationship between oxygen concentration and coal oxidation characteristics. Metall. Min. Ind. 2015, 7, 617–622. [Google Scholar]
- Zhang, Y.L.; Wang, J.F.; Xue, S.; Wu, Y.; Li, Z.F.; Chang, L.P. Evaluation of the susceptibility of coal to spontaneous combustion by a tg profile subtraction method. Korean J. Chem. Eng. 2016, 33, 862–872. [Google Scholar] [CrossRef]
- Xu, J.C.; Xue, H.L.; Wen, H.; Li, L. Analysis on influential factors of thermal effect in coal oxidation. China Saf. Sci. J. 2001, 11, 34–39. [Google Scholar]
- Yang, Y.L.; Li, Z.H.; Si, L.L.; Hou, S.S.; Li, Z.W.; Li, J.H. Study on test method of heat release intensity and thermophysical parameters of loose coal. Fuel 2018, 229, 34–43. [Google Scholar] [CrossRef]
- Liang, Y.T. Experimental study on the free diffusing characteristics of oxygen in different granularity loose coal. J. China Coal Soc. 2003, 28, 470–472. [Google Scholar]
- Luo, H.Z.; Liang, Y.T. Current status and perspective of forecast and prediction techniques for spontaneous combustion of coal. China Saf. Sci. J. 2003, 13, 76–78. [Google Scholar]
- Zhou, L.M.; Luo, T.A.; Huang, Q.W. Co-pyrolysis characteristics and kinetics of coal and plastic blends. Energy Convers. Manag. 2008, 50, 705–710. [Google Scholar] [CrossRef]
- Sharma, S.; Ghoshal, A.K. Study of kinetics of co-pyrolysis of coal and waste LDPE blends under argon atmosphere. Fuel 2010, 89, 3943–3951. [Google Scholar] [CrossRef]
- Antonio, J.L.p.; Tromp Peter, J.J.; Moulijn, J.A. Quantitative heat effects associated with pyrolysis of coals, ranging from anthracite to lignite. Fuel 1989, 68, 999–1005. [Google Scholar] [CrossRef]
- Tromp, P.J.J.; Kapteijn, F.; Moulijn, J.A. Characterization of coal pyrolysis by means of differential scanning calorimetry. 1. Quantitative heat effects in an inert atmosphere. Fuel Process. Technol. 1987, 15, 45–57. [Google Scholar] [CrossRef]
- Ma, Q.L.; Han, L.J.; Huang, G.Q. Quantitative characterization of rape straw combustion and gas emissions using tg/dsc-ftir-ms technology. Trans. Chin. Soc. Agric. Mach. 2014, 45, 196–201. [Google Scholar]
- Wang, T.; Li, C.; Zhou, B.X.; Zhang, Y.; Zhang, M.; Yang, H.R.; Wang, Z.Q. Experimental investigation of thermal effect in coal pyrolysis process. Fuel Process. Technol. 2020, 200, 106269. [Google Scholar] [CrossRef]
- Li, L.; Chen, J.C.; Jiang, D.Y.; Chen, J.; Fan, J.Y.; Chu, T.X. Experimental study of the impact of ash on spontaneous combustion characteristics of coal. Chongqing Univ. 2017, 40, 85–92. [Google Scholar]
- Cao, K.; Wang, D.M. Experimental study on heat release characteristics of coal spontaneous combustion under oxygen depletion condition. China Saf. Sci. J. 2015, 25, 127–132. [Google Scholar]
- Hu, X.C. Micro Physicochemical Properties and Macro Thermal Effect of Coal Influenced by Methane-Containing Environment during Oxidation; China University of Mining and Technology: Xuzhou, China, 2017. [Google Scholar]
- Li, Q.W. Fundamental Study on the Thermokinetics Process of Coal Oxidation under Oxygen-Depleted Atmosphere; Xi’an University of Science and Technology: Xi’an, China, 2018. [Google Scholar]
- Pan, L.S.; Yang, Y.G. Study on activation energy of coal low temperature oxidation based on calorimetry analysis. Coal Eng. 2013, 45, 102–105. [Google Scholar]
- Fan, N.; Zhong, K.Q.; Su, L. Thermal kinetics characteristics of coal oxidation spontaneous combustion under different oxygen concentrations. Shaanxi Coal 2022, 41, 12–17. [Google Scholar]
- Chen, L.Z.; Bai, C.W.; Qi, X.Y.; Huang, J.; Ji, Y.C.; Liu, Y.W. Study on exothermic characteristics of oxidation process of Baijiao anthracite Based on Microcalorimetry Technology. Coal Technol. 2018, 37, 305–307. [Google Scholar]
- Kuchta, J.M.; Rowe, V.R.; Burgess, D.S. Spontaneous Combustion Susceptibility of U.S. Coals; U.S. Department of the Interior, Bureau of Mines: Pittsburgh, PA, USA, 1980; Volume 8474, pp. 1–34. [Google Scholar]
- Wang, Y.M.; Shi, G.Q.; Guo, Z.X. Heat transfer and thermodynamic processes in coal-bearing strata under the spontaneous combustion condition. Numer. Heat Transf. Part A Appl. 2017, 71, 1–16. [Google Scholar] [CrossRef]
- Chen, X.K.; Li, H.T.; Wang, Q.H.; Zhang, H.W. Development and application of experimental device for studying oxygen absorption by high temperature loose coal. China Saf. Sci. J. 2015, 25, 29–34. [Google Scholar]
- Tomeczek, J.; Palugniok, H.; Ochman, J. Modelling of deposits formation on heating tubes in pulverized coal boilers. Fuel 2004, 83, 213–221. [Google Scholar] [CrossRef]
- Zhumagulov, M.G. Experimental study of thermophysical properties of Shubarkol coal. Chem. Technol. Fuels Oils 2013, 49, 100–107. [Google Scholar] [CrossRef]
- Beck, M.P.; Yuan, Y.H.; Warrier, P.; Teja, A.S. The effect of particle size on the thermal conductivity of alumina nanofluids. J. Nanoparticle Res. 2008, 11, 1129–1136. [Google Scholar] [CrossRef]
- Wang, W.; Lu, C.F.; Li, Y.X.; Li, Q.T. An investigation on thermal conductivity of fly ash concrete after elevated temperature exposure. Constr. Build. Mater. 2017, 148, 148–154. [Google Scholar] [CrossRef]
- Benazzouk, A.; Douzane, O.; Mezreb, K.; Laidoudi, B.; Quéneudec, M. Thermal conductivity of cement composites containing rubber waste particles: Experimental study and modelling. Constr. Build. Mater. 2008, 22, 573–579. [Google Scholar] [CrossRef]
Figure 1.
(a) Specific heat capacity curve of PS; (b) thermal conductivity curve of PS.

Figure 2.
Physical similarity reference test experimental system diagram.

Figure 3.
(a) Specific heat capacity curve of reference sample and coal sample; (b) thermal conductivity curve of reference sample and coal sample.
Figure 3.
(a) Specific heat capacity curve of reference sample and coal sample; (b) thermal conductivity curve of reference sample and coal sample.

Figure 4.
(a) Determination curve of apparent specific heat capacity of PS; (b) apparent thermal conductivity measurement curve of PS; (c) curve of specific heat capacity and thermal conductivity of DB.
Figure 4.
(a) Determination curve of apparent specific heat capacity of PS; (b) apparent thermal conductivity measurement curve of PS; (c) curve of specific heat capacity and thermal conductivity of DB.

Figure 5.
PS and DB lead temperature data fitting curve. (a–k) represents different leading temperatures; (l) PS leading the heating curve.
Figure 5.
PS and DB lead temperature data fitting curve. (a–k) represents different leading temperatures; (l) PS leading the heating curve.

Figure 6.
Curve of heat release intensity of PS. (a–k) represent different leading temperatures.


Table 1.
Statistical data on basic thermophysical parameters of PS.
| a | a1 | a2 | a3 | a4 | b1 | b2 | b3 |
|---|---|---|---|---|---|---|---|
| 0.7209 | 0.0062 | −3.5902 × 10⁻⁵ | 1.7916 × 10⁻⁷ | −3.8416 × 10⁻¹⁰ | 0.1298 | 1.7720 × 10⁻⁴ | −5.0743 × 10⁻⁵ |
Table 2.
Raw material ratios of reference samples.
| Reference Sample | White Corundum | Fly Ash | Cement |
|---|---|---|---|
| Y1 | 1 | 8 | 1 |
| Y2 | 1 | 7 | 2 |
| Y3 | 2 | 7 | 1 |
| Y4 | 1.5 | 7 | 1.5 |
Table 3.
Basic parameters of PS and DB.
| Leading Temperature | Weight (g) | Volume (mm3) | Bulk Density | Porosity | Block Volume | Coal Sample Height (mm) | Residual Height (mm) |
|---|---|---|---|---|---|---|---|
| 1 °C | 160 | 139 | 1.148 | 0.1755 | 114.94 | 71 | 4 |
| 2 °C | 160 | 139 | 1.148 | 0.1755 | 114.94 | 71 | 4 |
| 3 °C | 160 | 137 | 1.164 | 0.1637 | 114.94 | 70 | 5 |
| 5 °C | 160 | 135 | 1.181 | 0.1516 | 114.94 | 69 | 6 |
| 7 °C | 160 | 137 | 1.164 | 0.1637 | 114.94 | 70 | 5 |
| 9 °C | 160 | 135 | 1.181 | 0.1516 | 114.94 | 69 | 6 |
| 11 °C | 160 | 135 | 1.181 | 0.1516 | 114.94 | 69 | 6 |
| 15 °C | 160 | 137 | 1.164 | 0.1637 | 114.94 | 70 | 5 |
| 20 °C | 160 | 139 | 1.148 | 0.1755 | 114.94 | 71 | 4 |
| 25 °C | 160 | 135 | 1.181 | 0.1516 | 114.94 | 69 | 6 |
| 30 °C | 160 | 137 | 1.164 | 0.1637 | 114.94 | 70 | 5 |
| DB | 160 | 137 | 1.164 | 0.1571 | 115.86 | 70 | 5 |
Table 4.
Temperature function fit parameters.
| Leading Temperature/°C | PS | DB | ||||||
|---|---|---|---|---|---|---|---|---|
| y0 | x0 | A1 | t1 | A2 | t2 | a | b | |
| 1 | 8.404 | 42.099 | 0.01 | 5.664 | 47.511 | 55.917 | 30.026 | 0.17 |
| 2 | −1.679 | 31.145 | 0.013 | 5.219 | 57.365 | 54.449 | 30.023 | 0.000038 |
| 3 | −10.632 | 25.376 | 0.016 | 4.792 | 66.821 | 52.767 | 30.016 | 0.0000585 |
| 5 | −27.208 | 16.313 | 0.006 | 3.631 | 82.17 | 46.807 | 30.034 | 0.00011 |
| 7 | −63.794 | 10.241 | 0.019 | 3.714 | 115.135 | 51.23 | 30.028 | 0.000168 |
| 9 | −94.199 | 4.032 | 0.009 | 3.427 | 134.679 | 51.887 | 30.017 | 2.25 |
| 11 | −144.933 | −4.021 | 0.003 | 3.467 | 163.523 | 58.03 | 30.029 | 2.85 |
| 15 | −185.04 | −4.646 | 0.001 | 2.684 | 196.846 | 51.54 | 30.021 | 4.072 |
| 20 | −292.803 | −8.579 | 4.704 | 2.376 | 276.923 | 55.567 | 30.031 | 5.72 |
| 25 | −382.815 | −9.604 | 1.152 | 1.975 | 347.541 | 55.628 | 29.998 | 7.323 |
| 30 | −168.739 | 7.466 | 3.312 | 0.112 | 272.058 | 24.176 | 30.004 | 9.024 |
Table 5.
PS self-exothermic intensity (Units 105 J/(s∙cm3)).
| Temperature/°C | Leading the Temperature Difference/°C | ||||||||||
|---|---|---|---|---|---|---|---|---|---|---|---|
| 1 | 2 | 3 | 5 | 7 | 9 | 11 | 15 | 20 | 25 | 30 | |
| 30 | 6.4 | 6.4 | 6.6 | 6.5 | 6.4 | 6.5 | 6.5 | 6.4 | 6.4 | 6.5 | 6.4 |
| 40 | 10.2 | 10.2 | 9.9 | 10.9 | 10.6 | 10.5 | 10.2 | 10.3 | 10.5 | 10.6 | 10.2 |
| 50 | 14.8 | 14.5 | 14.3 | 14.7 | 14.7 | 15.0 | 14.7 | 14.4 | 14.4 | 14.9 | 14.6 |
| 60 | 22.1 | 21.8 | 22.1 | 22.4 | 22.1 | 22.6 | 22.4 | 22.1 | 21.8 | 22.5 | 22.2 |
| 70 | 32.4 | 31.8 | 32.7 | 32.8 | 32.5 | 33.1 | 33.0 | 32.5 | 31.9 | 33.0 | 32.5 |
| 80 | 48.1 | 47.7 | 48.4 | 49.1 | 48.6 | 49.3 | 49.1 | 48.4 | 47.8 | 49.3 | 48.5 |
| 90 | 75.2 | 74.5 | 75.9 | 76.8 | 76.0 | 77.1 | 77.0 | 75.8 | 74.7 | 77.1 | 75.9 |
| 100 | 127.8 | 127.6 | 129.7 | 131.3 | 129.7 | 131.8 | 131.7 | 129.5 | 127.5 | 131.8 | 129.7 |
| 110 | 215.3 | 215.6 | 219.1 | 222.2 | 218.9 | 222.4 | 222.6 | 218.9 | 215.4 | 222.4 | 219.0 |
| 120 | 347.4 | 347.0 | 352.9 | 358.0 | 352.8 | 358.6 | 358.5 | 352.5 | 346.9 | 358.6 | 352.8 |
| 130 | 521.9 | 521.9 | 530.4 | 539.6 | 530.4 | 539.2 | 539.2 | 530.6 | 522.1 | 539.2 | 530.4 |
| 140 | 704.5 | 704.2 | 715.9 | 727.5 | 716.0 | 728.0 | 727.9 | 715.7 | 704.1 | 728.0 | 716.0 |
| 150 | 900.9 | 900.6 | 916.1 | 935.3 | 915.9 | 931.5 | 931.5 | 917.8 | 902.6 | 931.5 | 915.9 |
| 160 | 1138.8 | 1138.9 | 1158.0 | 1177.0 | 1158.1 | 1178.1 | 1178.0 | 1157.5 | 1138.3 | 1178.1 | 1158.1 |
| 170 | 1420.1 | 1416.2 | 1444.3 | 1453.1 | 1442.4 | 1467.5 | 1467.4 | 1436.3 | 1411.2 | 1467.5 | 1442.4 |
Publisher’s Note: MDPI stays neutral with regard to jurisdictional claims in published maps and institutional affiliations. |
© 2022 by the authors. Licensee MDPI, Basel, Switzerland. This article is an open access article distributed under the terms and conditions of the Creative Commons Attribution (CC BY) license (https://creativecommons.org/licenses/by/4.0/).
Share and Cite
MDPI and ACS Style
Liu, W.; Zhang, W.; Ma, S.; Zhang, Z. Reference Test Method for Calculating the Thermal Effect of Coal Spontaneous Combustion. Energies 2022, 15, 7707. https://doi.org/10.3390/en15207707
AMA Style
Liu W, Zhang W, Ma S, Zhang Z. Reference Test Method for Calculating the Thermal Effect of Coal Spontaneous Combustion. Energies. 2022; 15(20):7707. https://doi.org/10.3390/en15207707
Chicago/Turabian StyleLiu, Wenyong, Wenzhao Zhang, Shuai Ma, and Ze Zhang. 2022. "Reference Test Method for Calculating the Thermal Effect of Coal Spontaneous Combustion" Energies 15, no. 20: 7707. https://doi.org/10.3390/en15207707
Note that from the first issue of 2016, this journal uses article numbers instead of page numbers. See further details here.