Article

An Approach for Pricing of Charging Service Fees in an Electric Vehicle Public Charging Station Based on Prospect Theory †

1
National Active Distribution Network Technology Research Center (NANTEC), Beijing Jiaotong University, Beijing 100044, China
2
China Railway Engineering Design and Consulting Group Co., Ltd., Beijing 100055, China
3
Department of Electrical and Computer Engineering, University of Denver, Denver, CO 80210, USA
*
Author to whom correspondence should be addressed.
This paper is an extended version of our paper with best paper award presented in International Conference on Electric and Intelligent Vehicles (ICEIV2021), Nanjing, China, 25–28 June 2021.
Energies 2022, 15(14), 5308; https://doi.org/10.3390/en15145308
Submission received: 23 June 2022 / Revised: 16 July 2022 / Accepted: 20 July 2022 / Published: 21 July 2022

Abstract

:
Within the context of sustainable development and a low-carbon economy, electric vehicles (EVs) are regarded as a promising alternative to engine vehicles. Since the increase of charging EVs brings new challenges to charging stations and distribution utility in terms of economy and reliability, EV charging should be coordinated to form a friendly and proper load. This paper proposes a novel approach for pricing of charging service fees in a public charging station based on prospect theory. This behavioral economics-based pricing mechanism will guide EV users to coordinated charging spontaneously. By introducing prospect theory, a model that reflects the EV owner’s response to price is established first, considering the price factor and the state-of-charge (SOC) of batteries. Meanwhile, the quantitative relationship between the utility value and the charging price or SOC is analyzed in detail. The EV owner’s response mechanism is used in modeling the charging load after pricing optimization. Accordingly, by using the particle swarm optimization algorithm, pricing optimization is performed to achieve multiple objectives such as minimizing the peak-to-valley ratio and electricity costs of the charging station. Through case studies, the determined time-of-use charging prices by pricing optimization is validated to be effective in coordinating EV users’ behavior, and benefiting both the station operator and power systems.

1. Introduction

As an important section of ecology and sustainable development in the field of transportation, electric vehicles (EVs) have already been recognized as a global solution to the energy crisis and greenhouse gas emissions [1,2]. Among different technical routes, battery electric vehicles have been chosen by most of the automobile manufacturers (e.g., Tesla motors and BYD, etc.), and even countries [3,4]. Charging facilities, especially public charging stations, are of paramount importance for the promotion of electric vehicles. Figure 1 depicts the number of development trends of EVs and public charging piles (also called charging points) in China. Obviously, both of them are in a period of rapid development in recent years, and the vehicle–pile ratios are almost the same from 2018 to 2021, at about 7.2. By the end of 2021, EV parc surged to more than 7.8 million units in China, and hence huge charging demand is starting to emerge. From the perspective of urban service and alleviating mileage anxiety, public charging stations provide a useful supplement beyond household charging [5,6].
As elaborated in the literature, the increase of charging EVs will result in new problems for charging stations and distribution utilities due to the randomness of EV users’ charging behavior. An impact assessment of EV integration on the voltage profiles and power lines’ congestion levels was made in ref. [7]. Its results indicated that the load in the peak hour increases 85% in the scenario with 52% of integrated EVs compared to that without EVs, and significantly affects the voltage profiles and congestion levels. Power losses and voltage deviations in the distribution grid caused by charging EVs was analyzed in refs. [8,9]. Similarly, with the increment of EV penetration levels, power losses and maximum voltage deviations will rise significantly. In addition, uncontrolled dumb charging may cause unbalance or overloading in transformers [10,11], or harmonic problems.
To reduce the impacts of EVs on power system daily load profiles, power losses and voltage deviations, etc., academia and industry are actively exploring relevant methods to coordinate the charging of EVs. In general, coordinated charging can be achieved by several approaches, of which two mainstream ideas are: (1) direct control, which is based on the intention of management and can be implemented by the charging station operator or the EV aggregator, etc. A decentralized charging time switching control was applied to accomplish approximate valley-filling in ref. [12]. Similarly, interruptions during the charging process were performed to minimize the total charging cost in ref. [13]. A hierarchical coordinated charging framework was presented in ref. [14], and charging power was allocated to achieve electricity cost minimization and peak load controlling. In ref. [15], Silvestre et al. devised an optimal strategy to control the recharge start time for a given parking lot to minimize feeder losses or purchased energy cost. This type of coordination regulates the charging time or power directly, ignoring EV user’s demand and benefit. (2) Indirect guidance, which is user-friendly and based on the principle of demand-side response; the price mechanism is often adopted here. For example, an optimization model for determining the configuration of a distributed generation and storage system, as well as the optimal charging prices for EVs, was presented to maximize the EV-parking lot owner’s profit in ref. [16], and EV charging was coordinated to absorb excess wind energy via two-stage time-of-use tariff schemes in ref. [17]. In addition to the coordination achieved by user-friendly guidance, a positive economic effect on the station operator and its customers may be achieved in this price-based mechanism. The charging price mechanism may benefit both the charging station operators and their customers. In addition, there is also another research line concentrated on the so-called market-based approach. Such an approach analyzes the possibilities of coordination by pricing the bids submitted by participants [18]. In ref. [19], the optimal charging schedule of buses with restricted access to charging stations from the market-based perspective of an electric bus aggregator in a day-ahead energy auction was introduced to realize cost-minimization.
One of the crucial issues in daily operation of a public charging station is the charging price mechanism, i.e., the pricing of the charging fee [5]. Usually, the charging fee should include two parts: electricity charge and service charge. The service charge means a fee collected to pay for services related to the charging in a public station.
Currently, there are only a few studies that have conducted research related to charging pricing. In ref. [20], the fixed admission fee is charged when an EV joins the charging service system of a charging station. From the perspective of the business model based on charging service fee, ref. [21] proposed a mobile charging service mode with high service fees or low service fees depending on different service efficiency. Pricing should consider the interests of different entities. A payment distribution mechanism based on the cooperative game theory was proposed to balance the interests of the employer who built the charging station and the employee (EV owner) in ref. [22]. Based on static non-cooperative game theory, a model about charging service fee was proposed in ref. [23], which considers the interests of the three parties: the government, the charging facility operators, and consumers. In ref. [24], the price model of fast charging price including a service fee was proposed through solving the Stackelberg game problem between grid-owned stations and third-party stations to maximize stations’ profits, and the relationship between charging service fee and electricity production cost is analyzed. In addition, the profit of power systems should also be considered in the pricing process. With the node voltage of power systems as the optimization target, ref. [25] introduced the idea of the alliance game pricing model to conduct a preliminary study to balance interests among the power grid, charging station operators and EV users in the initial stage of an open charging market. To alleviate the peak-valley pressure of charging load, refs. [26,27] proposed the time period division method for the EV charging service fee pricing based on affinity propagation clustering. Different from refs. [26,27], which considered the profit of power systems only, a bi-level model was formulated in ref. [28], to optimally determine charging service fees for guiding EVs and minimizing the total social cost, which means reducing the traffic congestion and improving the integration of renewable energy. Each station was assigned a charging service fee to regulate the spatial distribution of the charging load of different stations. In ref. [28], for a specific station, the charging service fee was fixed, which meant that the time-based adjustment of the charging service fee in the station was not involved. In the above studies, the charging price was mostly constant for a charging station, or the interests of different entities were often not taken into account simultaneously.
In addition, there are some studies related to charging selection and decision making. Most of them focused on EVs’ charging station selection decisions from the perspective of spatial selection; the choice of the charging station was made by game theory in refs. [29,30], and by fuzzy multi-criteria decision-making method in ref. [31]. From the perspective of temporal selection, a charging pricing algorithm was introduced to maximize the total welfare of the charging system in ref. [32] by adopting the concept of utility function from microeconomics. The decision-making problem of determining the start time of charging and discharging was solved by prospect theory in ref. [33], and by the combination of the Roth–Erev algorithm and prospect theory in ref. [34]. Few works have addressed the problem of charging pricing considering the service fee for a charging station based on user response from the perspective of behavioral economics, especially with the objectives such as minimizing the peak-to-valley difference and the operation expenses of a charging station, reducing solar curtailment, and minimizing the peak power of a solar-assisted charging station.
In this paper, a novel approach based on behavioral economics—prospect theory—for pricing of charging service fees in an EV public charging station is proposed. Considering the adjustability of people’s charging decision and behavior, this behavioral economics-based pricing mechanism will guide EV users to coordinated charging spontaneously. By the obtained daily time-varying charging price that consisted of the time-of-use (TOU) electricity price and time-varying charging service fees, although EV owners will respond differently based on one’s specific demand and status, the holistic time-based adjustment of charging loads will be achieved to benefit power systems, charging station operators, and finally EV users, such as minimizing the peak-to-valley difference ratio and the operation expenses of a charging station, and reducing solar curtailment and the peak power at the point of common coupling (PCC) of the solar-assisted charging station.
This paper is organized into the following sections. The main problems and motivation for this paper are described in Section 2. Section 3 introduces prospect theory to model the EV user’s price response behavior towards different charging prices and state-of-charge (SOC). Then, on the basis of the EV user’s response mechanism and pricing optimization, the modeling of optimal charging loads are pursued to obtain the daily time-varying charging price and achieve multiple objectives of coordinated charging in Section 4. In Section 5, case studies are presented to demonstrate the effectiveness of the novel approach. Finally, conclusions are drawn in Section 6.

2. Motivating Scenarios

For a public charging station, how to reduce its passive impacts on power systems and operation costs of the charging station, especial the electricity costs, is a problem that should be taken into consideration. As elaborated above, a proper charging price mechanism is absolutely essential. Currently, a charging service fee is charged in Beijing when an EV is charged in the station, according to the policy of the government administration. The upper limit of the charging service fee per kWh is 15% of the maximum retail price per liter of 92# gasoline, and the charging station operator can set specific charging service prices within the maximum limit. Meanwhile, similar to other loads of power systems, a large industrial electricity fee is charged as well, according to the TOU electricity tariff shown in Figure 2.
In other words, in the public charging stations of China, the charging prices Prchg,t can be represented as the sum of the TOU electricity price Prgrid,t and the charging service price (fee) Prservice,t, and hence P r c h g , t = P r g r i d , t + P r s e r v i c e , t . Therefore, it is possible to realize the coordinated charging of EVs by considering the manner in which the charging service prices are time-varying and flexibly formulated.
This study was motivated by the problems that exist in fast charging stations. Considering the operation costs and the promotion of sustainable energy generation, a charging station is likely to be equipped with a photovoltaic (PV) distributed generation system. A typical topology of a fast charging station, in which PV is included, is depicted in Figure 3. Since the power at the PCC affects the distribution networks to some extent, it is necessary to improve the daily load curve at this point.
In addition, an information framework for the proposed pricing approach is also depicted in Figure 3. Within this framework, the EV user will sign a contract with the station. The station publishes their charging price determined by the novel pricing approach in this paper, based on which EVs will respond artificially or automatically by an on-board intelligent terminal. This on-board intelligent terminal is an electronic unit that can provide bidirectional communications between the charging station and vehicles. In general, the response of an EV to the charging price can be made automatically by the on-board intelligent terminal in the manner of the pre-embedded program of the EV user’s price response model. If an individual EV user cannot abide by the terms of the contract and ignores the recommendation of the intelligent terminal, uncertainty of the EV response will emerge, and the effect of coordinating charging will be diminished to some extent. In this paper, the EV response is assumed to be almost certain, since the same response mechanism was applied in pricing and automatic response of the on-board intelligent terminal; hence, we do not take behavior uncertainty into consideration in this paper.

3. EV User’s Response to Price

The price mechanism can be applied to guide EV users’ charging behaviors because of the price sensitivity. For instance, in the case of TOU electricity prices, EVs may change their charging behaviors depending on the price information provided by the charging station, and contribute to off-peak power consumption of power systems. This can be even more flexible, provided that there is a proper mechanism. In addition, the operation expenses of the station will be reduced to some extent. Prospect theory in behavioral economics is introduced to describe the EV’s response behavior to charging prices in this paper.

3.1. Prospect Theory of Behavioral Economics

As a theory in cognitive psychology and behavioral economics, prospect theory, proposed by Dr. Kahneman, is often used to precisely characterize the decision-making process [35,36,37]. Prospect theory demonstrates that people make decisions based on expected utility relative to a reference point rather than final outcomes. It is a behavioral model for real-life choices that can describe how EV users make charging choices between different options or prospects based on charging price mechanisms.
The value function of prospect theory has the following features. Firstly, most people are risk-averse towards gains. Secondly, most people are risk-biased towards losses. Thirdly, the sensitivity to losses compared to gains is much higher. Kahneman’s value function of prospect theory is defined in Equation (1).
V ( x ) = x α     x 0 λ ( x ) β x < 0
where x is the potential outcome; α and β exhibit the level of unevenness in gain value and loss value, respectively; and λ is the losses-to-gains ratio. Calibrated by Kahneman, α = β = 0.88, and λ = 2.25. Recent literature shows that the parameters calibrated by Kahneman may not be suitable for decision-making in other contexts [38,39]. Therefore, the suitable parameters for pricing require a mass of real operational data in our proposed approach. A closed-loop and iterative correction of the parameters based on collected data and the actual effect of coordination is necessary.
In this paper, we introduce the concept of value function of prospect theory to obtain the charging price utility value at a point in time to EV users.

3.2. Response Modeling

The factors which affect user’s charging behavior include the charging price and the SOC of EV. Based on these two influencing factors, the charging value function can be established.

3.2.1. Response Model Only Considering the Price Factor

The reference point is significant in determining the model [40], and the reference points among different people may be different [41,42]. The charging prices before pricing optimization are chosen as the reference point at every time point without considering this difference among EV users, since the response can be implemented by the same on-board intelligent terminal rather than people whose behavior is not rational enough [43]. Hence, there are three reference points according to the TOU electricity tariff and the original service fee, which are the peak rate, the flat rate, and the valley rate, respectively, depending on the time of the day.
According to prospect theory, if the charging price after optimization is smaller than the price of the reference point at a specific time point, the charging decision will be considered to be the gain; on the contrary, the charging decision will be considered to be the loss. In the case of considering the influencing factor of charging price only, the value functions describing charging and no-charging can be defined as follows:
V c g , t = P r * c g , t P r c g , t α   P r * c g , t P r c g , t λ P r c g , t P r * c g , t β P r * c g , t < P r c g , t
V n o c g , t = P r c g , t P r * c g , t α   P r * c g , t < P r c g , t λ P r * c g , t P r c g , t β P r * c g , t P r c g , t  
where Vcg,t and Vnocg,t stand for the value functions of the decision of whether to charge or not charge made by the electric vehicle while only considering the price factor, respectively; Pr*cg,t and Prcg,t stand for the charging price at the time index t before and after optimized pricing, respectively. As discussed above, Pr*cg,t is the sum of the TOU electricity tariff and the original service fee at time t.
According to Equation (2), Figure 4 depicts the charging values in different periods (peak charging price periods, flat charging price periods, and valley charging price periods, respectively) of the original charging tariff before optimal pricing. The detailed reference prices are based on the charging prices in Beijing, that being 1.8044 CNY/kWh in peak hours, 1.495 CNY/kWh in flat hours, and 1.1946 CNY/kWh in valley hours. Take the situation in peak charging price hours as an example; if the determined charging price after optimization is higher than the peak price reference, it means losses to users, and the charging value is relatively low. On the contrary, if the determined charging price is lower compared to the peak price reference, it means gains to users, and the charging value is relatively high.
As shown in Figure 4, the value function is steeper for losses than gains, indicating that losses outweigh gains since people are more sensitive to losses compared to gains. In addition, the charging value function at peak times of the original charging tariff exhibits a higher value than that at flat or valley times. This is because if the determined charging price after optimization is 1 CNY/kWh, it means a 0.8044 CNY/kWh reduction at peak times and a 0.1946 CNY/kWh reduction at valley times. The higher reduction will lead to more profits, and thus a greater probability of changing the charging decision of EV users in a certain period. In other words, in Figure 4, the similar slopes in different periods of the original charging price tariff indicates that if the charging price changes the same, the charging utility values of the three different periods would be the same, which means with the same price changes, users behave the same.
Due to the similarity of the analysis, the value function of not charging will not be detailed here.

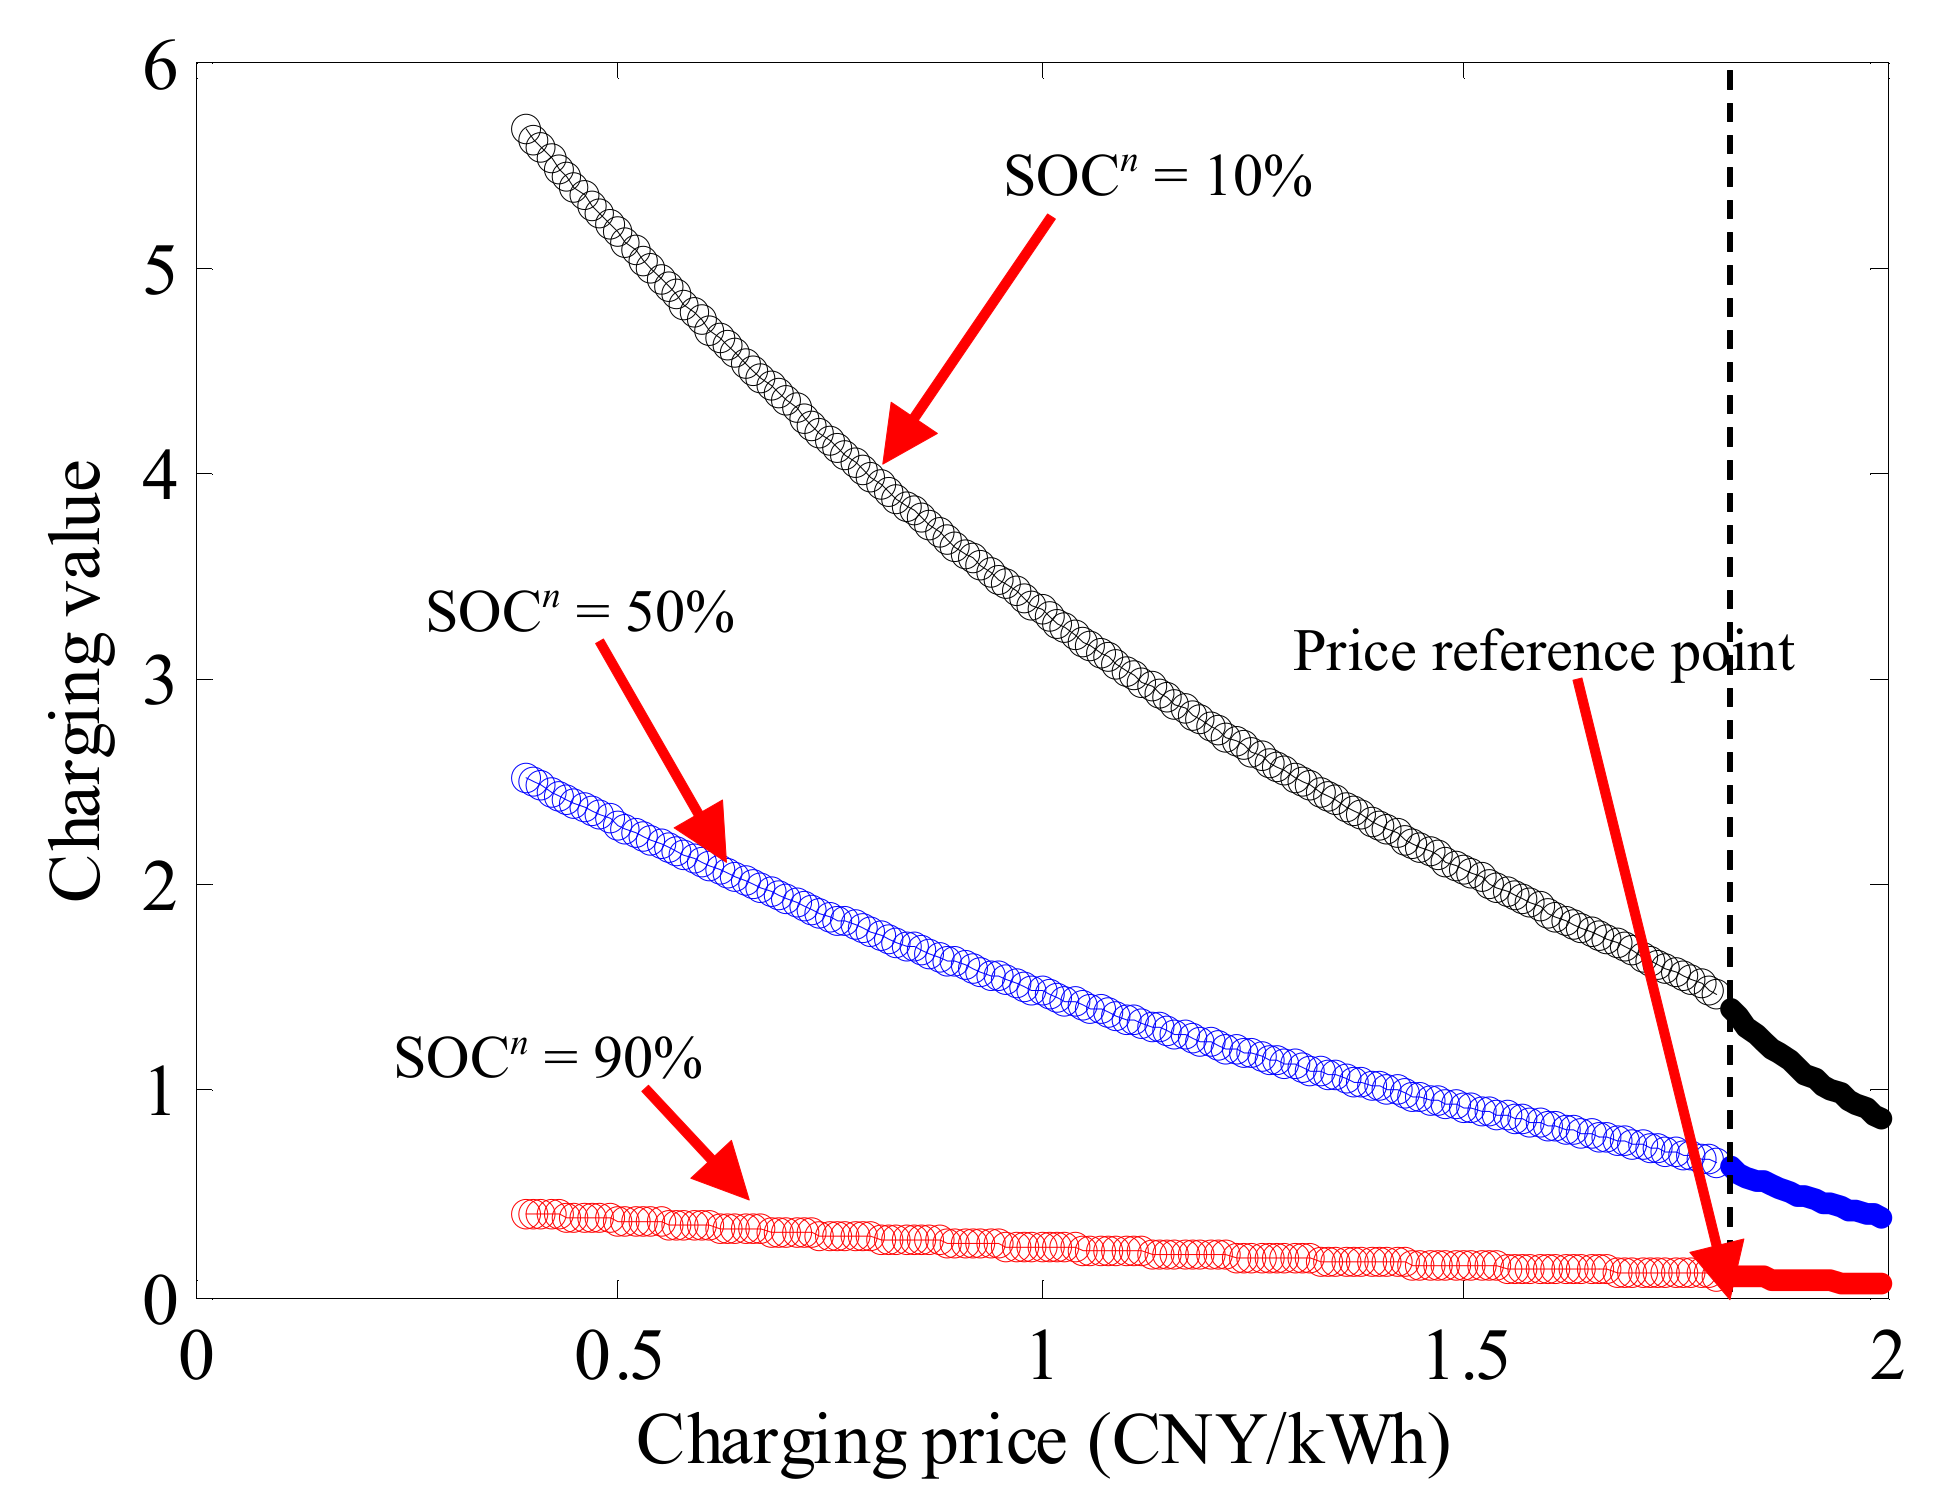
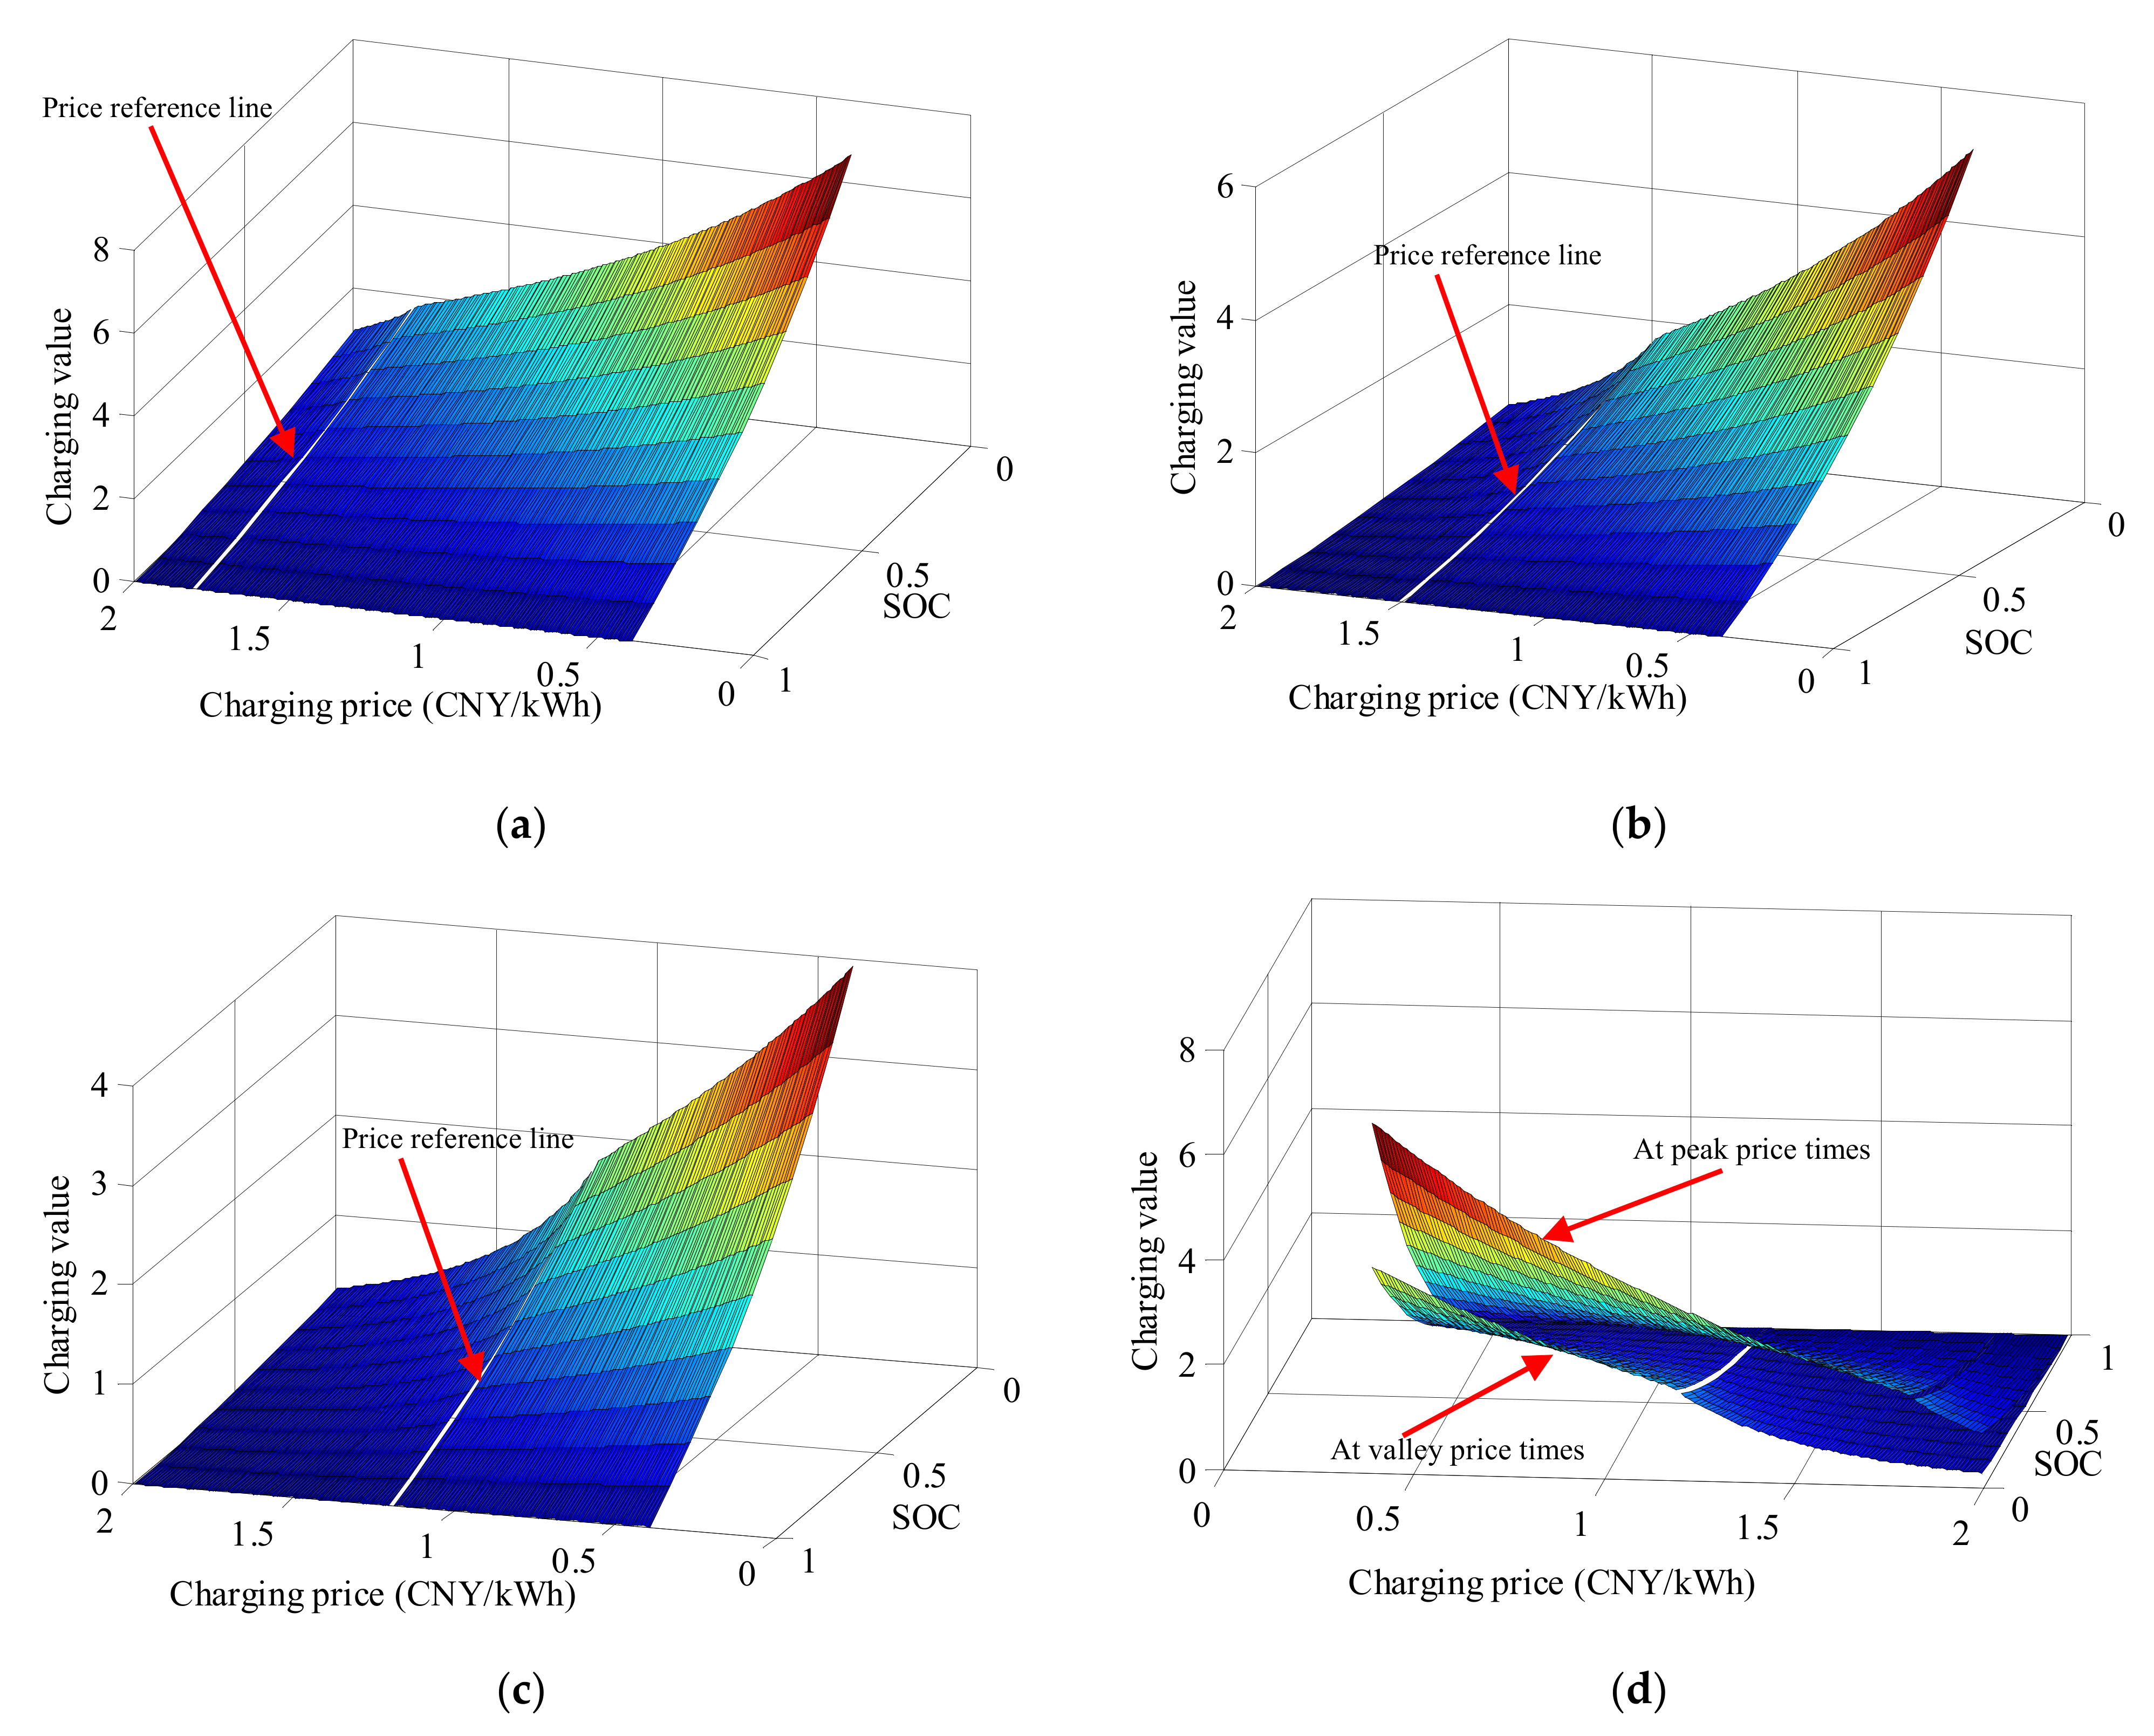
3.2.2. Response Model Considering Both the Price Factor and SOC

In addition to the charging price, the current SOC of an electric vehicle is another factor that affects the charging behavior of electric vehicles. Assuming that current SOC of an electric vehicle is 100%, this means that this vehicle no longer needs to be charged anymore, no matter whether the charging price is higher or lower than the original price reference. Hence, the charging value is zero. If the SOC of an EV is almost 100%, the charging value for this vehicle is relatively low. Similarly, when the SOC of an EV is close to the minimum SOC, the demand for charging is significantly increased, and the charging value at this time is relatively high.
Therefore, based on the willingness of EV users, the value functions represent charging and no-charging, considering both price factors and SOC, can be defined as:
V n c g , t = e V c g , t e 1 SOC n 1
V n n o c g , t = e V n o c g , t e soc n soc min 1 SOC n SOC min 0 SOC n < SOC min
where n stands for the number of electric vehicles; SOCn stands for the state-of-charge of vehicle n; SOCmin is the minimum allowable SOC of EVs; and Vncg,t and Vnnocg,t are value functions represent charging and no-charging decisions of electric vehicle n while only considering the price factor and SOC, respectively.
According to Equation (4), Figure 5 depicts the charging values of different SOCs at peak price times of the original charging tariff. It can be deduced that a smaller SOC corresponds to larger charging values at the same time. When the SOC of EV approaches 100%, charging is not an absolute necessity anymore, and the charging value for the EV user is close to zero at this moment. At a certain SOC, the charging value function still follows the basic value function of Equation (2), except the natural exponential function is introduced to express the law of natural growth. This is because, when the SOC is smaller, the charging value brought by the part e 1 SOC n 1 of Equation (4) increases faster compared to the higher SOC, which can be easily derived from the derivative operation of e 1 SOC n 1 .
Figure 6 shows the three-dimensional plots of the charging values considering both the price factor and SOC, in which the relationship between charging price, SOC and charging value defined by the equation is clearly revealed. As shown in Figure 6a–c, both the lower charging price after pricing optimization and the lower SOC of EVs will result in a higher charging utility value. The highest charging value will appear at the lowest charging price and the lowest SOC, indicating the demand for charging and the willingness for price response. If the SOC is 100%, there is no battery capacity for charging. Thus, the charging value at this moment is zero, since the charging price and SOC are always independent. In addition, as depicted in Figure 6d, the charging values are higher at peak price times compared to that at the valley price times. This is due to the same reason as is shown in Figure 4, and can be described by the following: for the same charging price after optimization, EV users are more likely to change their charging behaviors at peak price times compared to valley times because of the bigger reduction in charging price.
Similarly, due to similarity of the analysis, the value function of not charging will not be detailed here.

4. Charging Load Model and Pricing Optimization

4.1. Typical Charging Load

Assume that the charging power of electric vehicles is constant, and vehicles charged in the station will be fully charged every time. Hence, for each electric vehicle, the charging duration, the charging ending time and the charging capacity of EV batteries can be calculated according to the charging starting time and the initial SOC. Subsequently, the number of electric vehicles to be charged, and the charging load of all vehicles can be counted to obtain the total charging load of electric vehicles at each moment in the charging station. The related equations are as follows:
T n c h g = ( 1 SOC n ) × E b a t / P
T n e = T n s + T n c h g
P n l o a d , t = P T n s t < T n e 0 t < T n s t T n e
P e v , t = n = 1 n s u m P n l o a d , t  
where Tns, Tne, and Tnchg stand for the charging starting time, the charging ending time, and the charging duration, respectively; Ebat is the capacity of EV; P is the rated charging power of an individual vehicle; Pnload,t is the charging power of EV n at time t; nsum is the total number of EVs; and Pev,t is the total charging power of the charging station at time t.

4.2. Optimal Pricing Based on EV Response Model

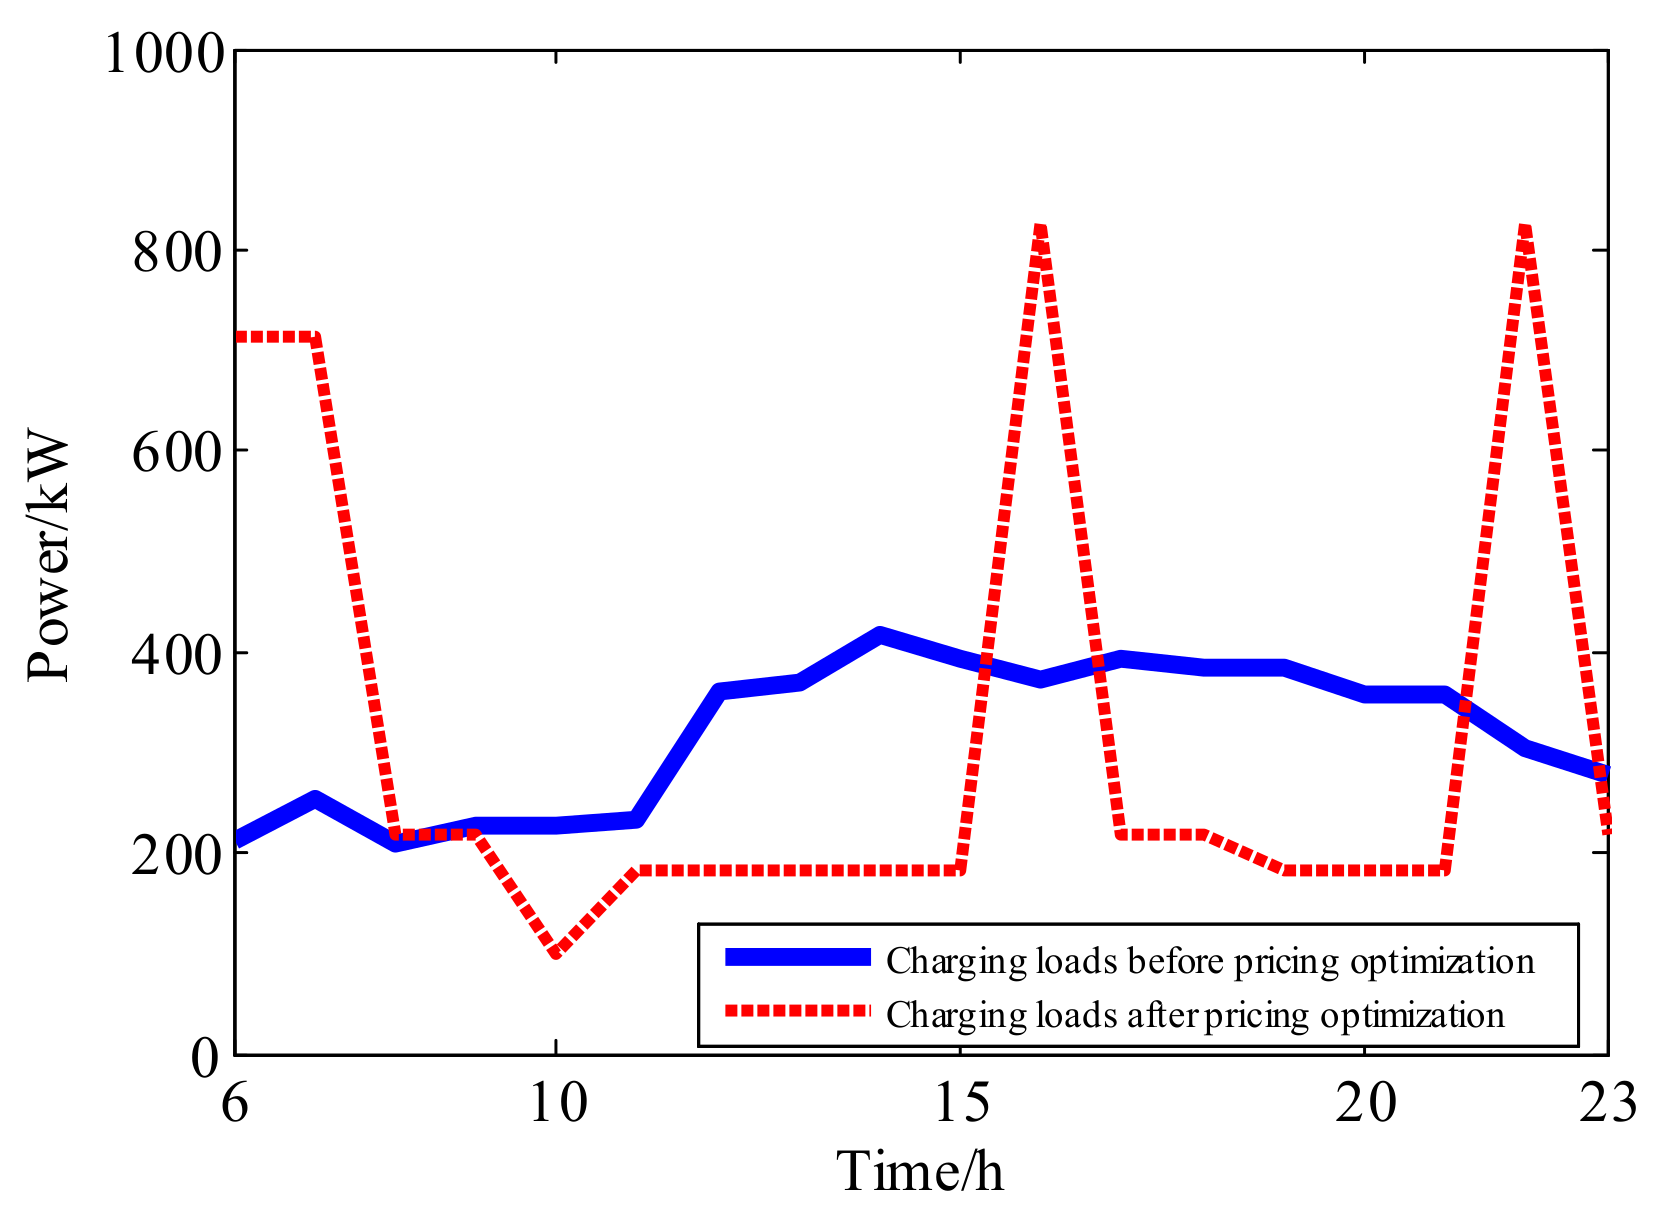
4.2.1. Charging Load Model after Pricing Optimization Based on Prospect Theory

Denote the charging probability of vehicle n at time t by P ˜ nchg,t, and the probability of not charging by P ˜ nnochg,t. Hence,
P ˜ c h g , t n + P ˜ n o c h g , t n = 1  
Based on Equations (4) and (5), the charging probability of the nth vehicle at the time point t is:
P ˜ c h g , t n = V n c g , t V n c g , t + V n n o c g , t
Then, the matrix of charging probability of all n vehicles at every time point can be obtained by their charging values.
M P ˜ , c h g = P ˜ c h g , 1 1 P ˜ c h g , 1 2 P ˜ c h g , 1 n P ˜ c h g , 2 1 P ˜ c h g , t 1 P ˜ c h g , t n
Since the sum of the charging probabilities at all times for an electric vehicle is 1, for each column of the above matrix, the normalization should be performed according to Equation (13).
P ˜ c h g , t n = P ˜ c h g , t n t = 1 t s u m P ˜ c h g , t n
where tsum is the number of the time index considered in the optimization.
According to Equations (12) and (13), and the charging capacity of vehicles derived from the state-of-charge at the charging beginning time, the optimized charging power with pricing is depicted as:
M P e v = P l o a d , 1 1 P l o a d , 1 2 P l o a d , 1 n s u m P l o a d , 2 1 P l o a d , t s u m 1 P l o a d , t s u m n s u m
where Pnload,t is the equivalent charging load of the nth vehicle at time t.
Thus, the total charging loads of the charging station after pricing optimization is:
P e v , t = n = 1 n s u m P l o a d , t n

4.2.2. Objective Functions of the Pricing Optimization

Take charging prices of the tariff as the optimization variables, the objective functions for coordinated charging of the electric vehicle charging station will be presented in the following description.
Since the charging loads may bring new impacts to the power grid, usually it is expected that the charging load curve of the station will be relatively stable during operation. Therefore, one objective function of the coordinated charging pricing optimization should be minimizing the peak-to-valley ratio of the charging station, shown as Equation (16).
min f 1 = min ( P p e a k P v a l l e y ) / P p e a k = min max P e v , t min P e v , t max P e v , t t 1 , 2 , , t s u m
where Ppeak and Pvalley stand for the maximum and minimum daily charging loads of the charging station, respectively.
In addition, to reduce the operation cost and benefit the operator of the charging station, the EV user can be guided to charge at valley price times of the TOU electricity tariff by flexibly pricing the charging service fee under the premise of not increasing user’s charging cost, thereby reducing electricity costs of the charging station. This objective function is as follows:
min f 2 = min t = 1 t s u m P e v , t × P r g r i d , t
Since the decision variables of Equations (16) and (17) are the charging prices after optimization, these two objectives are coupled to each other. Therefore, a multi-objective optimization can be performed following this function:
min f 3 = min ω 1 f 1 max f 1 + ω 2 f 2 max f 2
where ω 1 and ω 2 stand for the weight coefficients of the two objectives, ω 1 + ω 2 = 1 , and hence transfer the multi-objective optimization problem to a single-objective optimization.
In a charging station with PV distributed generation system integrated, the most ideal operation mode is to realize the local consumption of photovoltaic power by charging load. At the same time, if the photovoltaic system is not integrated to the power grid, it is necessary to maximize the utilization of photovoltaic power and reduce the impact of the charging load on the power grid. Therefore, reducing solar curtailment can be chosen as the objective function for a PV charging station.
min f 4 = t = 1 t s u m P c u r t a i l , t τ P c u r t a i l , t = P p v , t P e v , t   P p v , t P e v , t 0     P p v , t < P e v , t
where Pcurtail,t and Ppv,t stand for the power of solar curtailment at time t and the power generated by the PV system, respectively; and τ stands for the time interval.
When the PV power is equal to the power of the charging load of EVs, the charging station does not need to purchase electricity from the power grid. When the PV power is insufficient to supply the charging of EVs vehicle at that time, the charging station needs to purchase electricity from the power grid to compensate for the power difference, as shown in the Equation (20). In order to reduce the impact of EVs on the utility grid, it is necessary to minimize the peak load of the charging station, and hence reduce the capacity electricity price cost; the objective function is as shown in Equation (20).
min f 5 = max P p c c , t t 1 , 2 , , t s u m P p c c , t = P e v , t P p v , t P e v , t P p v , t 0 P e v , t < P p v , t
where Ppcc,t is the power at the PCC of the charging station; that is, the demanded power of the whole station to the utility grid.

4.2.3. Constrains of the Pricing Optimization

The constraint conditions that should be satisfied in the pricing optimization for coordinated charging are outlined as follows:
For conservation of energy, the total charging loads of the charging station before and after pricing optimization are the same since the same time interval is considered, as shown in Equation (21).
t = 1 t s u m P e v , t = t = 1 t s u m P e v , t *
where P*ev,t is the charging load without pricing optimization at time t.
The number of EVs in charging should not exceed the number of charging piles Npile, as shown in Equation (22).
max P e v , t P N p i l e t 1 , 2 , , t s u m
The power at the PCC of the charging station should not exceed the capacity of the distribution transformer Pgrid, as shown in Equation (23).
max P p c c , t P g r i d t 1 , 2 , , t s u m
Usually, the government administration tends to give a ceiling for the charging service fee, as shown in Equation (24).
P r s e r v i c e , t P r l i m i t t 1 , 2 , , t s u m
where Prlimit stands for the upper limit of the charging service fee, which is considered to be 30% of the price of 92# gasoline on that day in this paper.

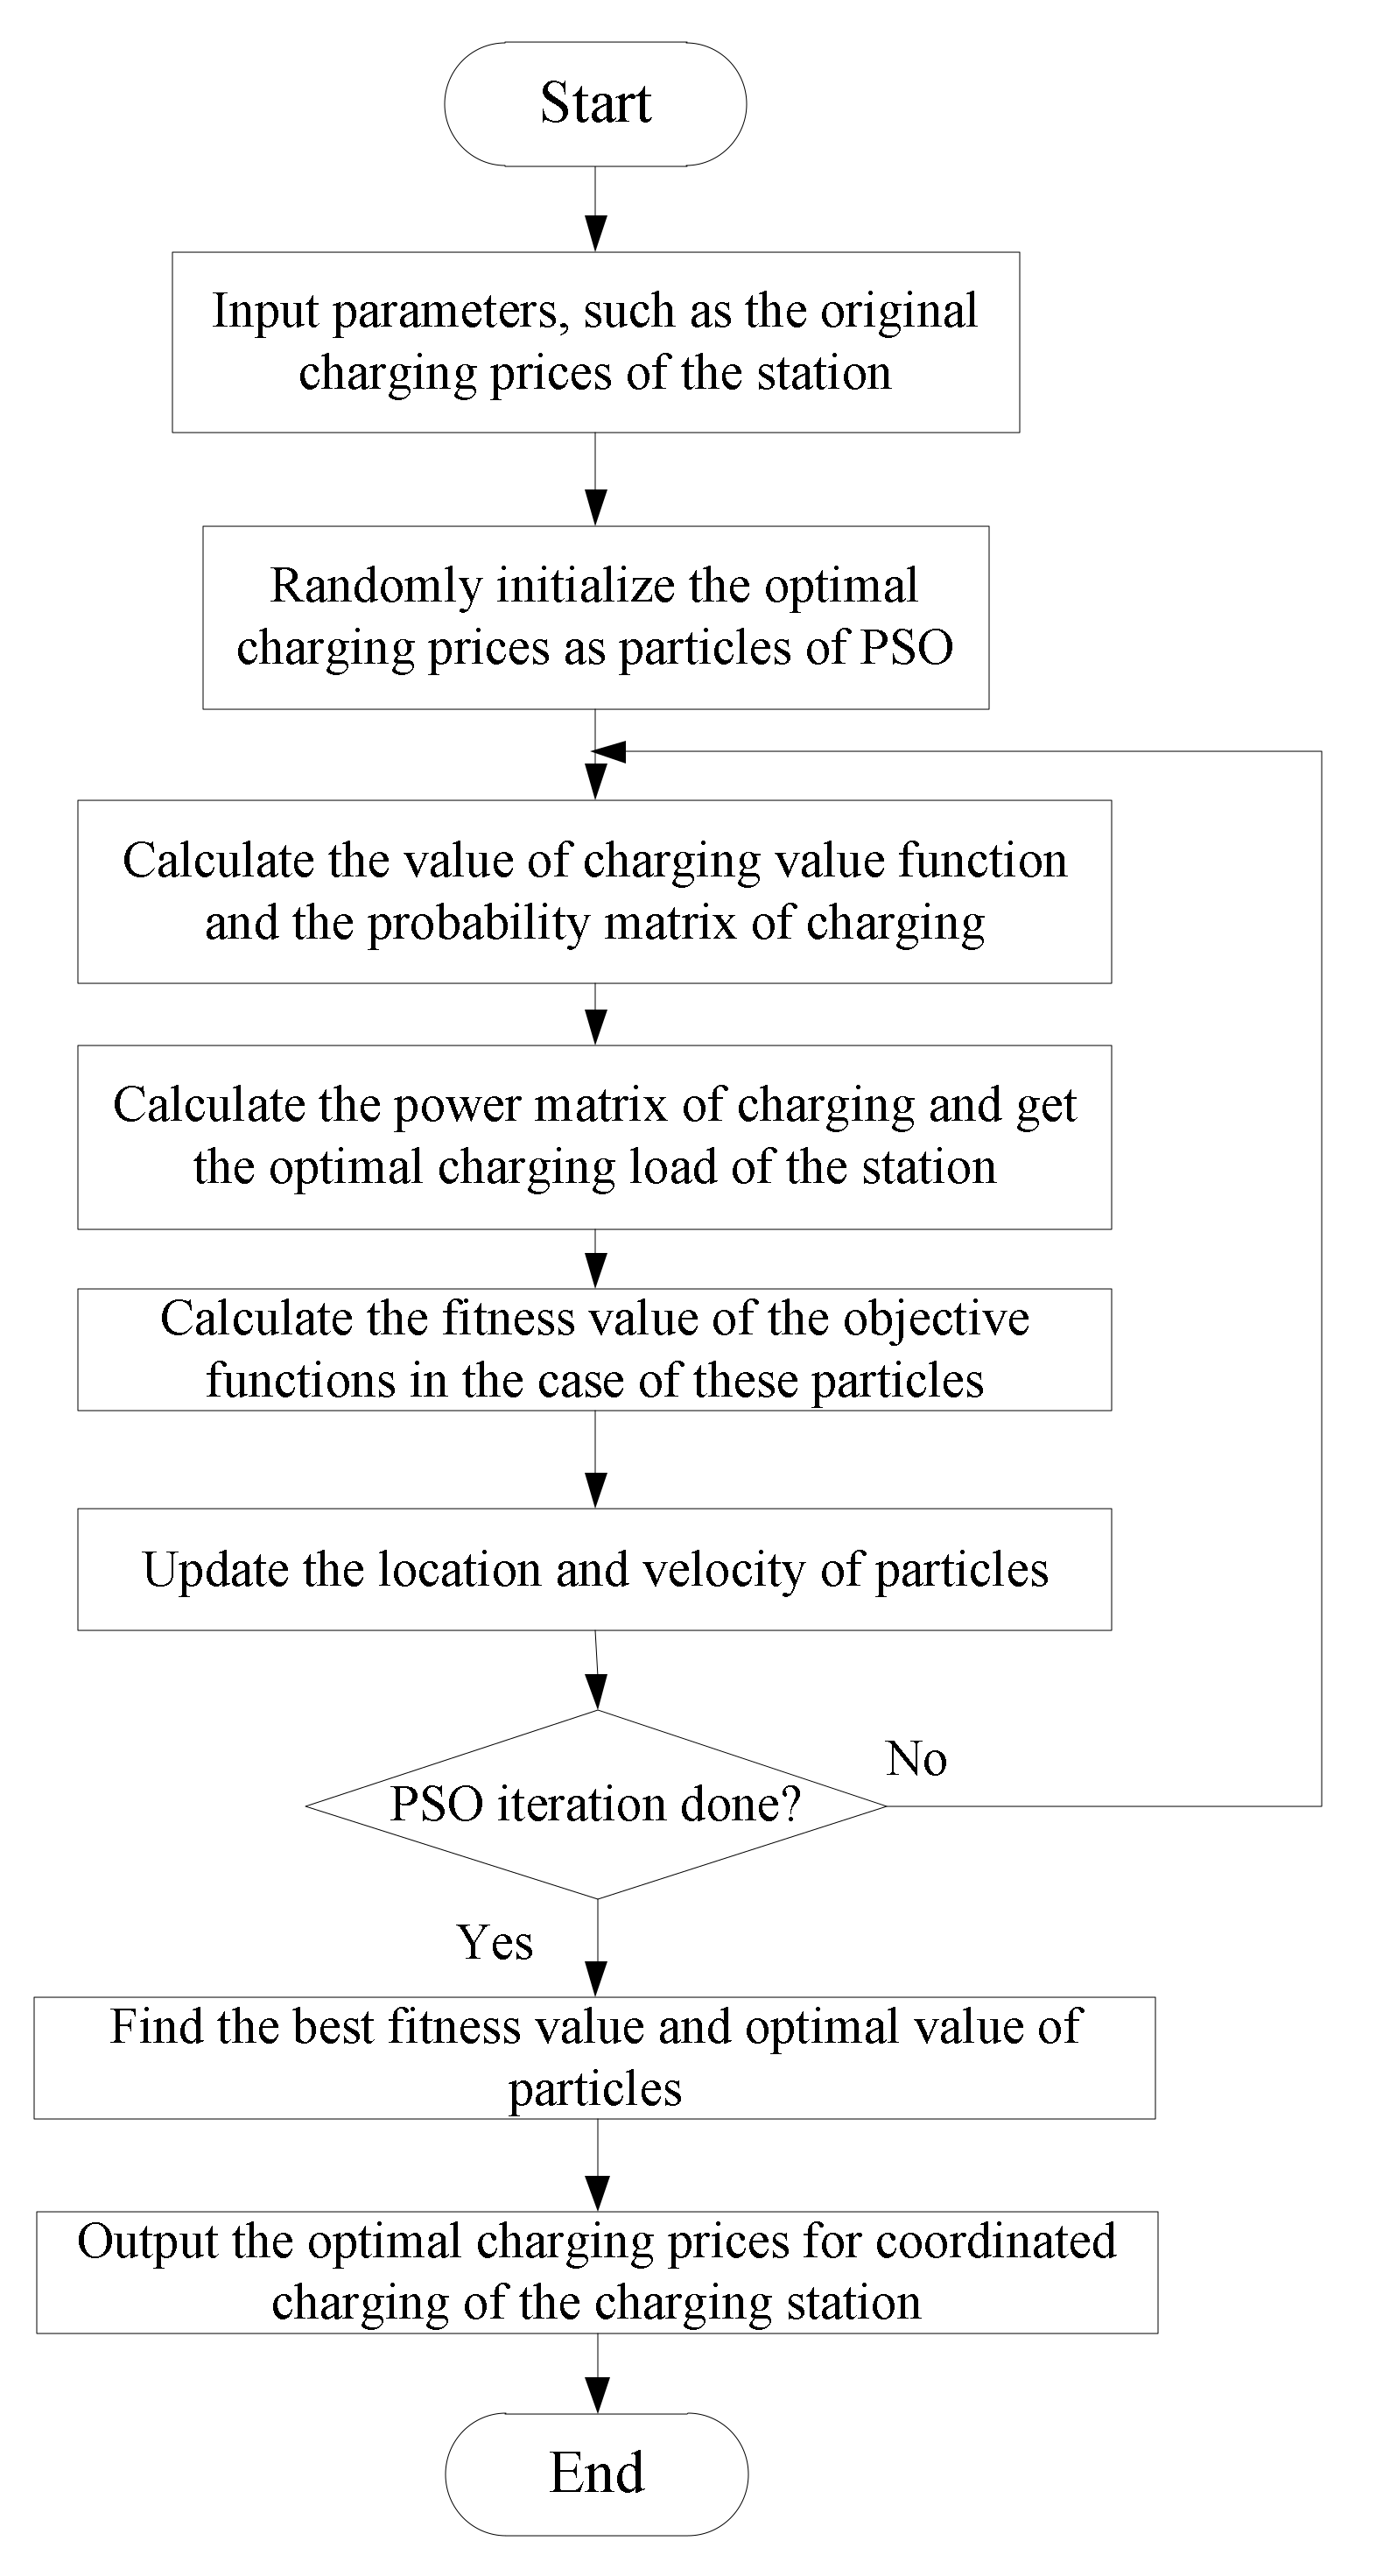
4.3. Optimization Process and Solution

Considering the complexity of the constrained non-linear optimization, the improved particle swarm optimization (PSO) algorithm is adopted to solve the problem in this paper. PSO is one of the random search heuristic algorithms, which has excellent performance for continuous solution space. For simplicity, its basic principle and equations will not be detailed here.
The solution of the optimization is the daily charging service prices with the maximum dimension 24 × 1, and for each dimension, the solution is a real number within the range of zero to the upper limit of the charging service fee defined in Equation (24). The lower dimensions and limited solution space will result in small computational cost, which makes PSO qualified for the pricing optimization. It should be noticed that the proposed pricing method is mainly used for day-ahead or same-day pricing, and can be used for ultra-short term pricing.
Figure 7 is the flow chart of the proposed pricing approach for coordinated charging of the charging station based on prospect theory. Through optimization, the charging prices at each time step can be obtained, together with the ideal coordinated charging loads of the charging station based on this obtained tariff.
Specific steps are as follows.
Step 1: Input the relevant parameters of the pricing optimization, such as the original charging prices which are composed of the TOU electricity tariff and the original charging service fee, and the initial SOC of the EVs, etc.
Step 2: Randomly initialize the optimal charging prices as particles of PSO, considering the constraint of the upper limit of the charging service fee. Start the first iteration of PSO.
Step 3: Calculate the value of charging value function only considering the price factor at first. Afterward, calculate the value of charging value function considering both the price factor and SOC. Then, calculate the charging probability matrix of vehicles at each time based on the charging values of these vehicles, and normalize each element in the matrix. Finally, based on the charging probability matrix and the energy demand of each vehicle, calculate the optimal charging power with pricing optimization.
Step 4: Calculate the fitness value of the objective functions in the case of these particles.
Step 5: Update the location and velocity of particles according to rules of improved PSO.
Step 6: Determine whether the iteration process of PSO is finished. If so, continue to step 7. Otherwise, go back to step 3, and start a new iteration until the iteration is done.
Step 7: Find the best fitness value and optimal value of particles.
Step 8: Output the optimal charging prices for coordinated charging of the charging station to guide the EVs.

5. Case Studies and Validation

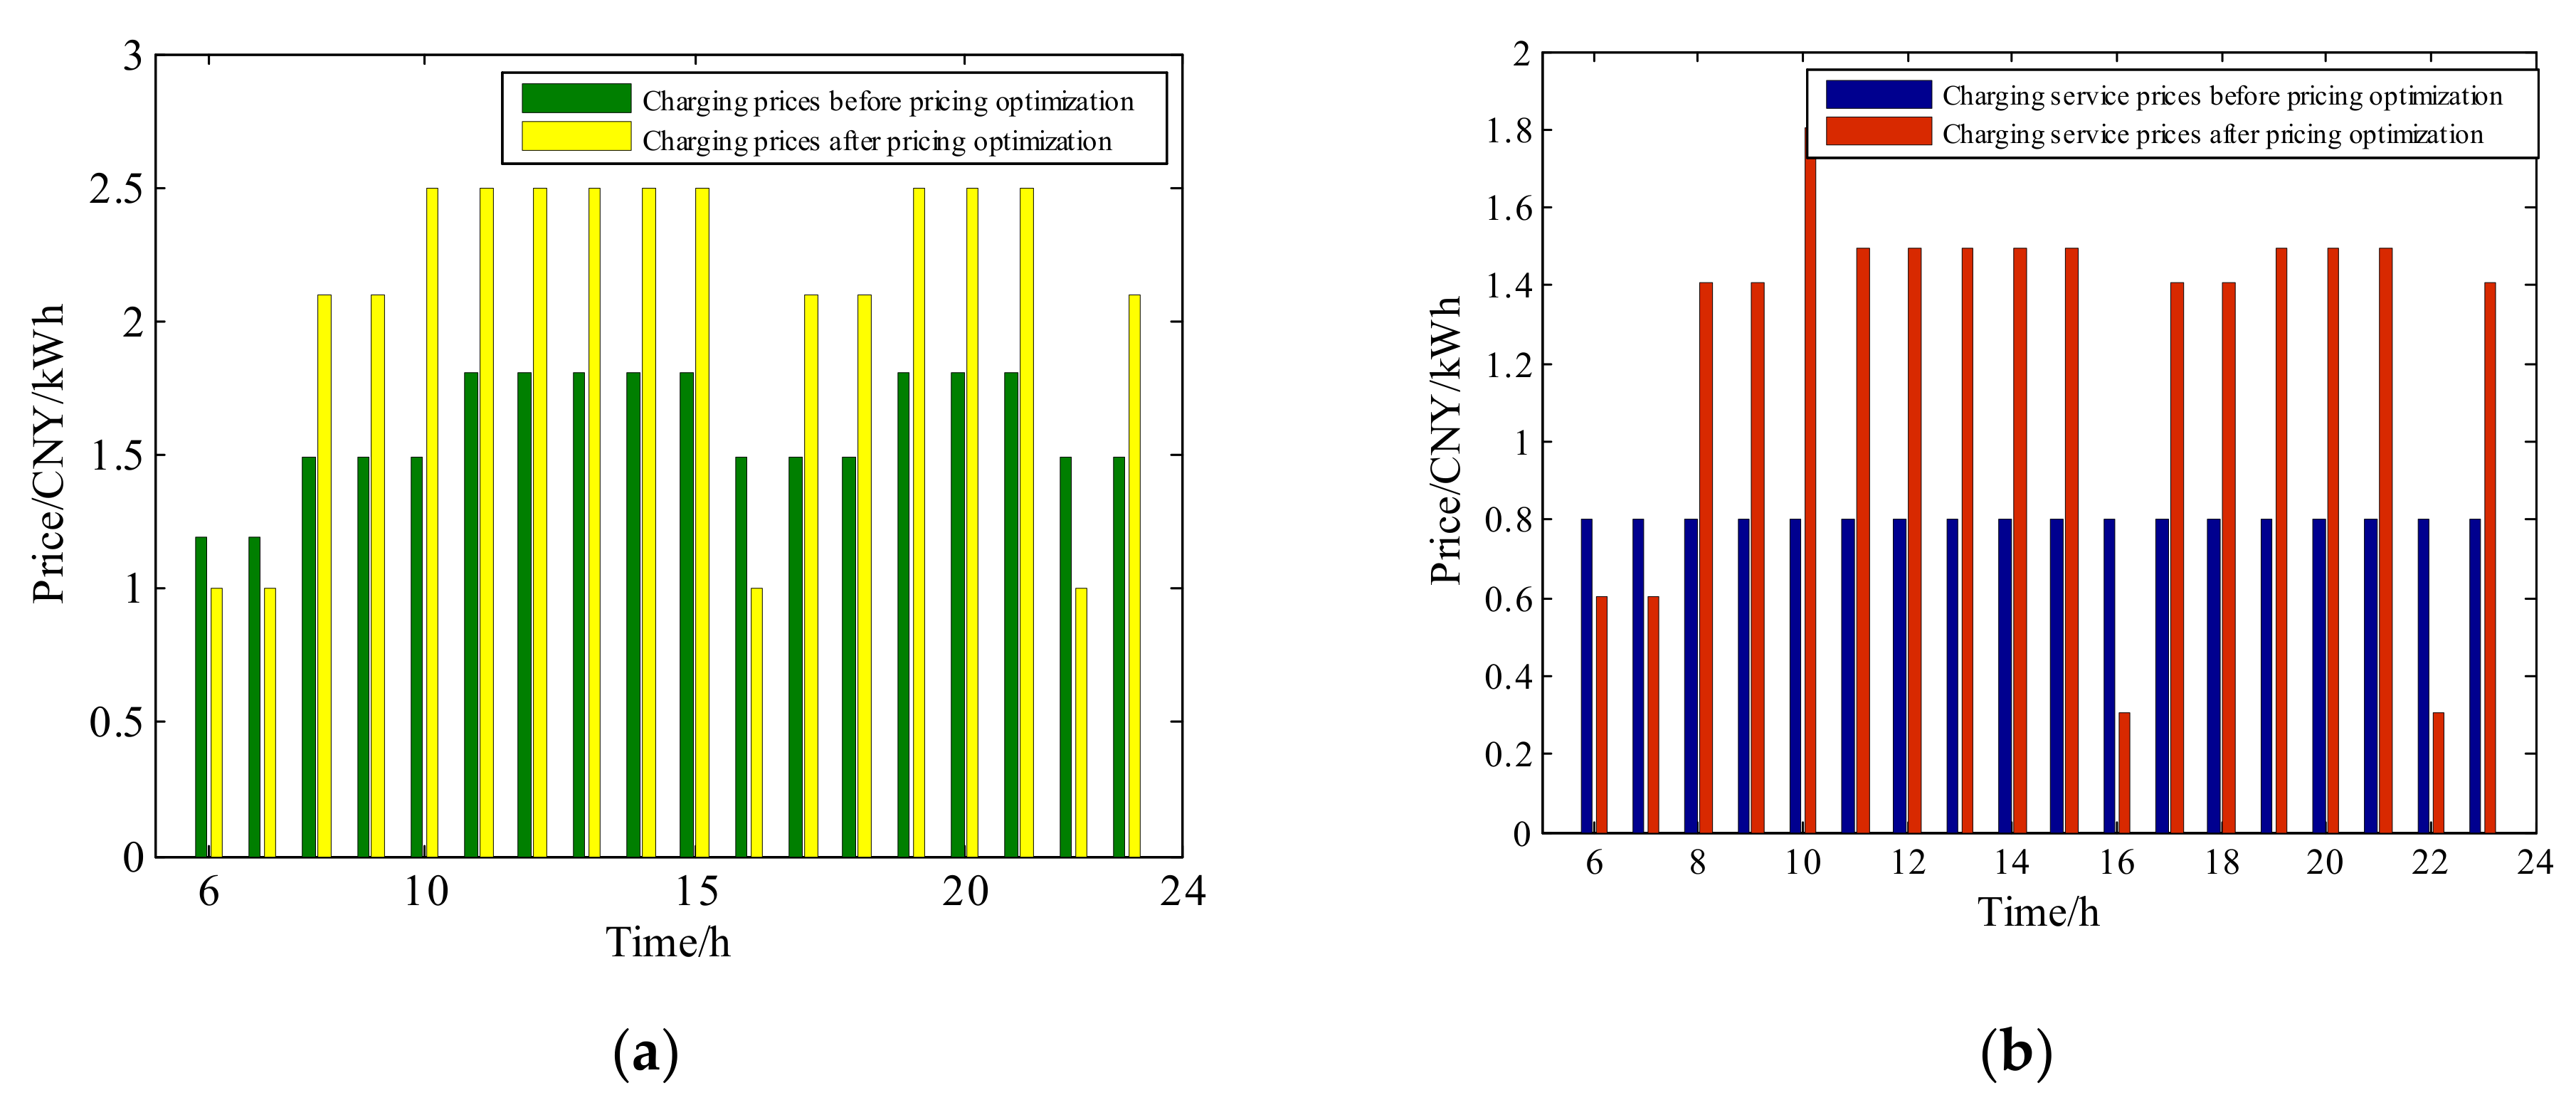
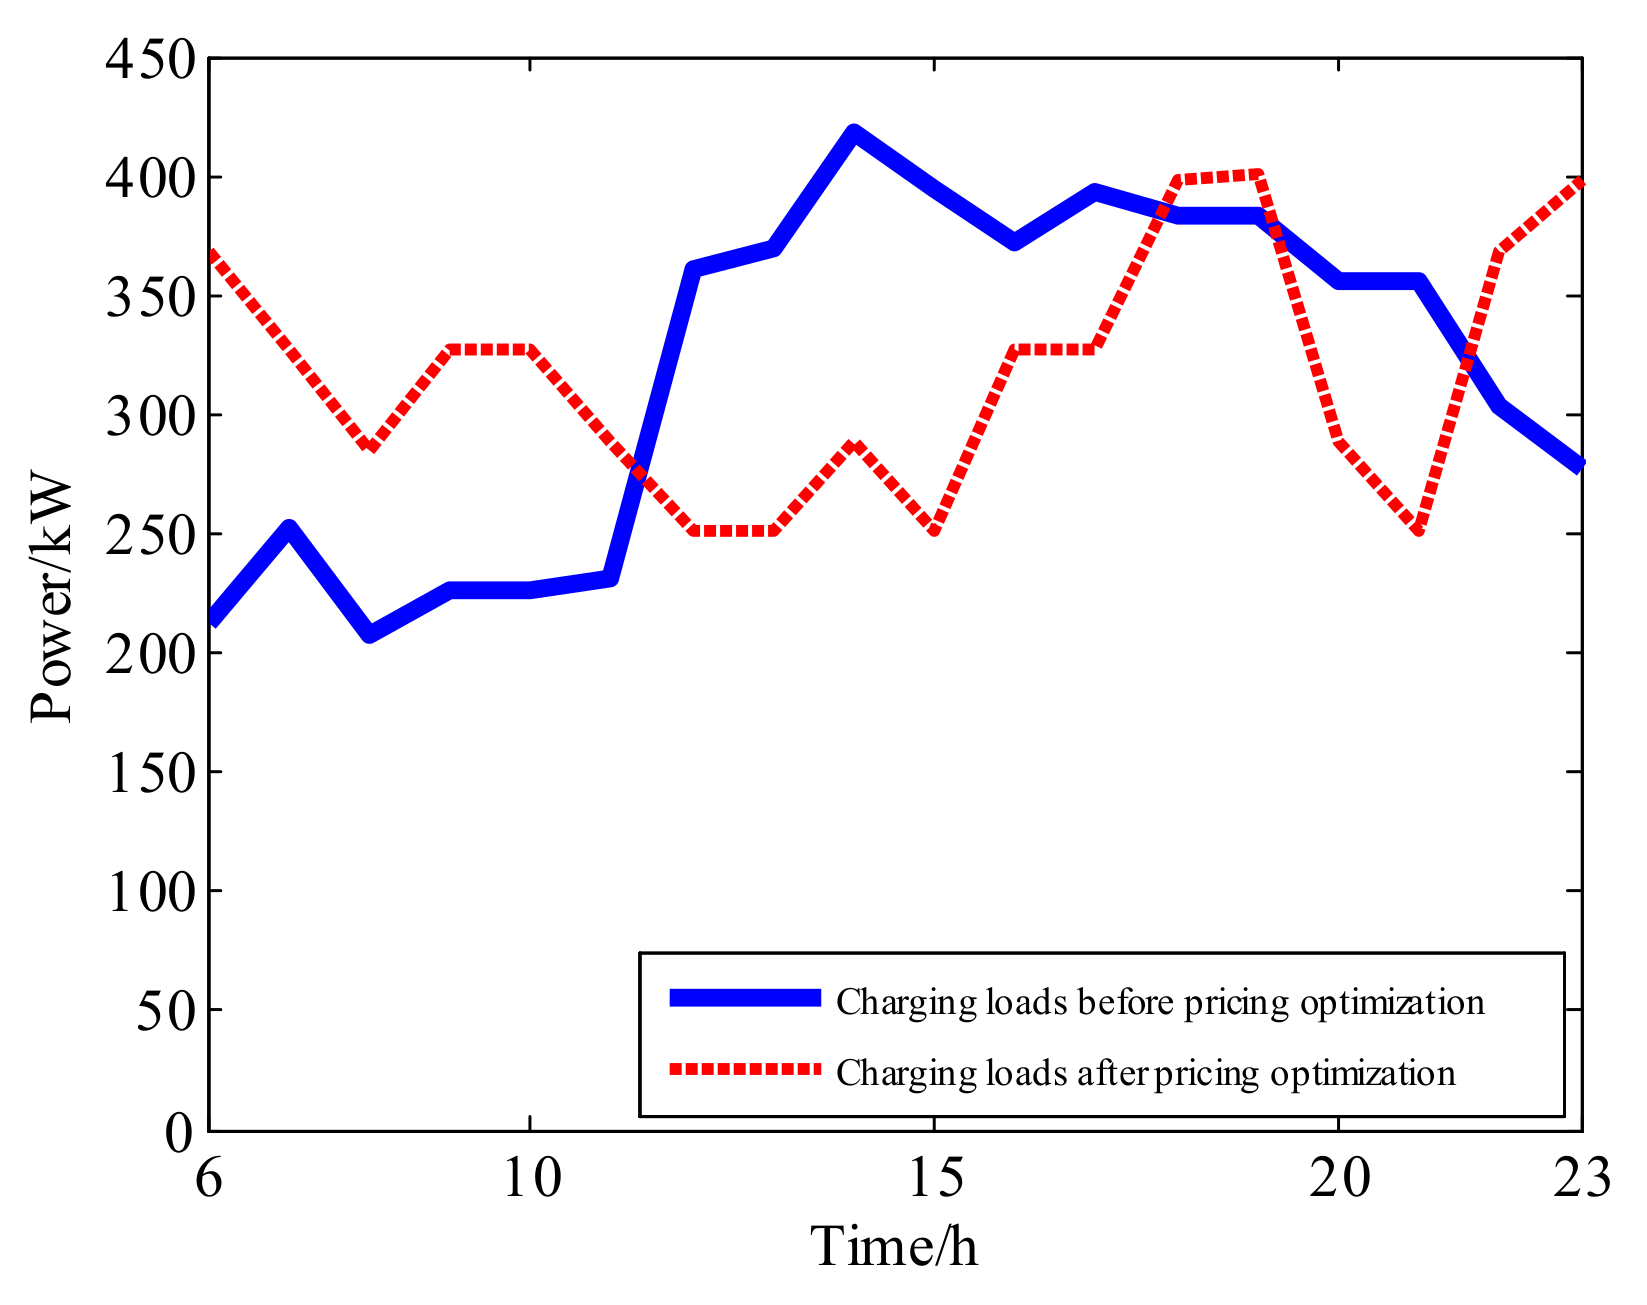
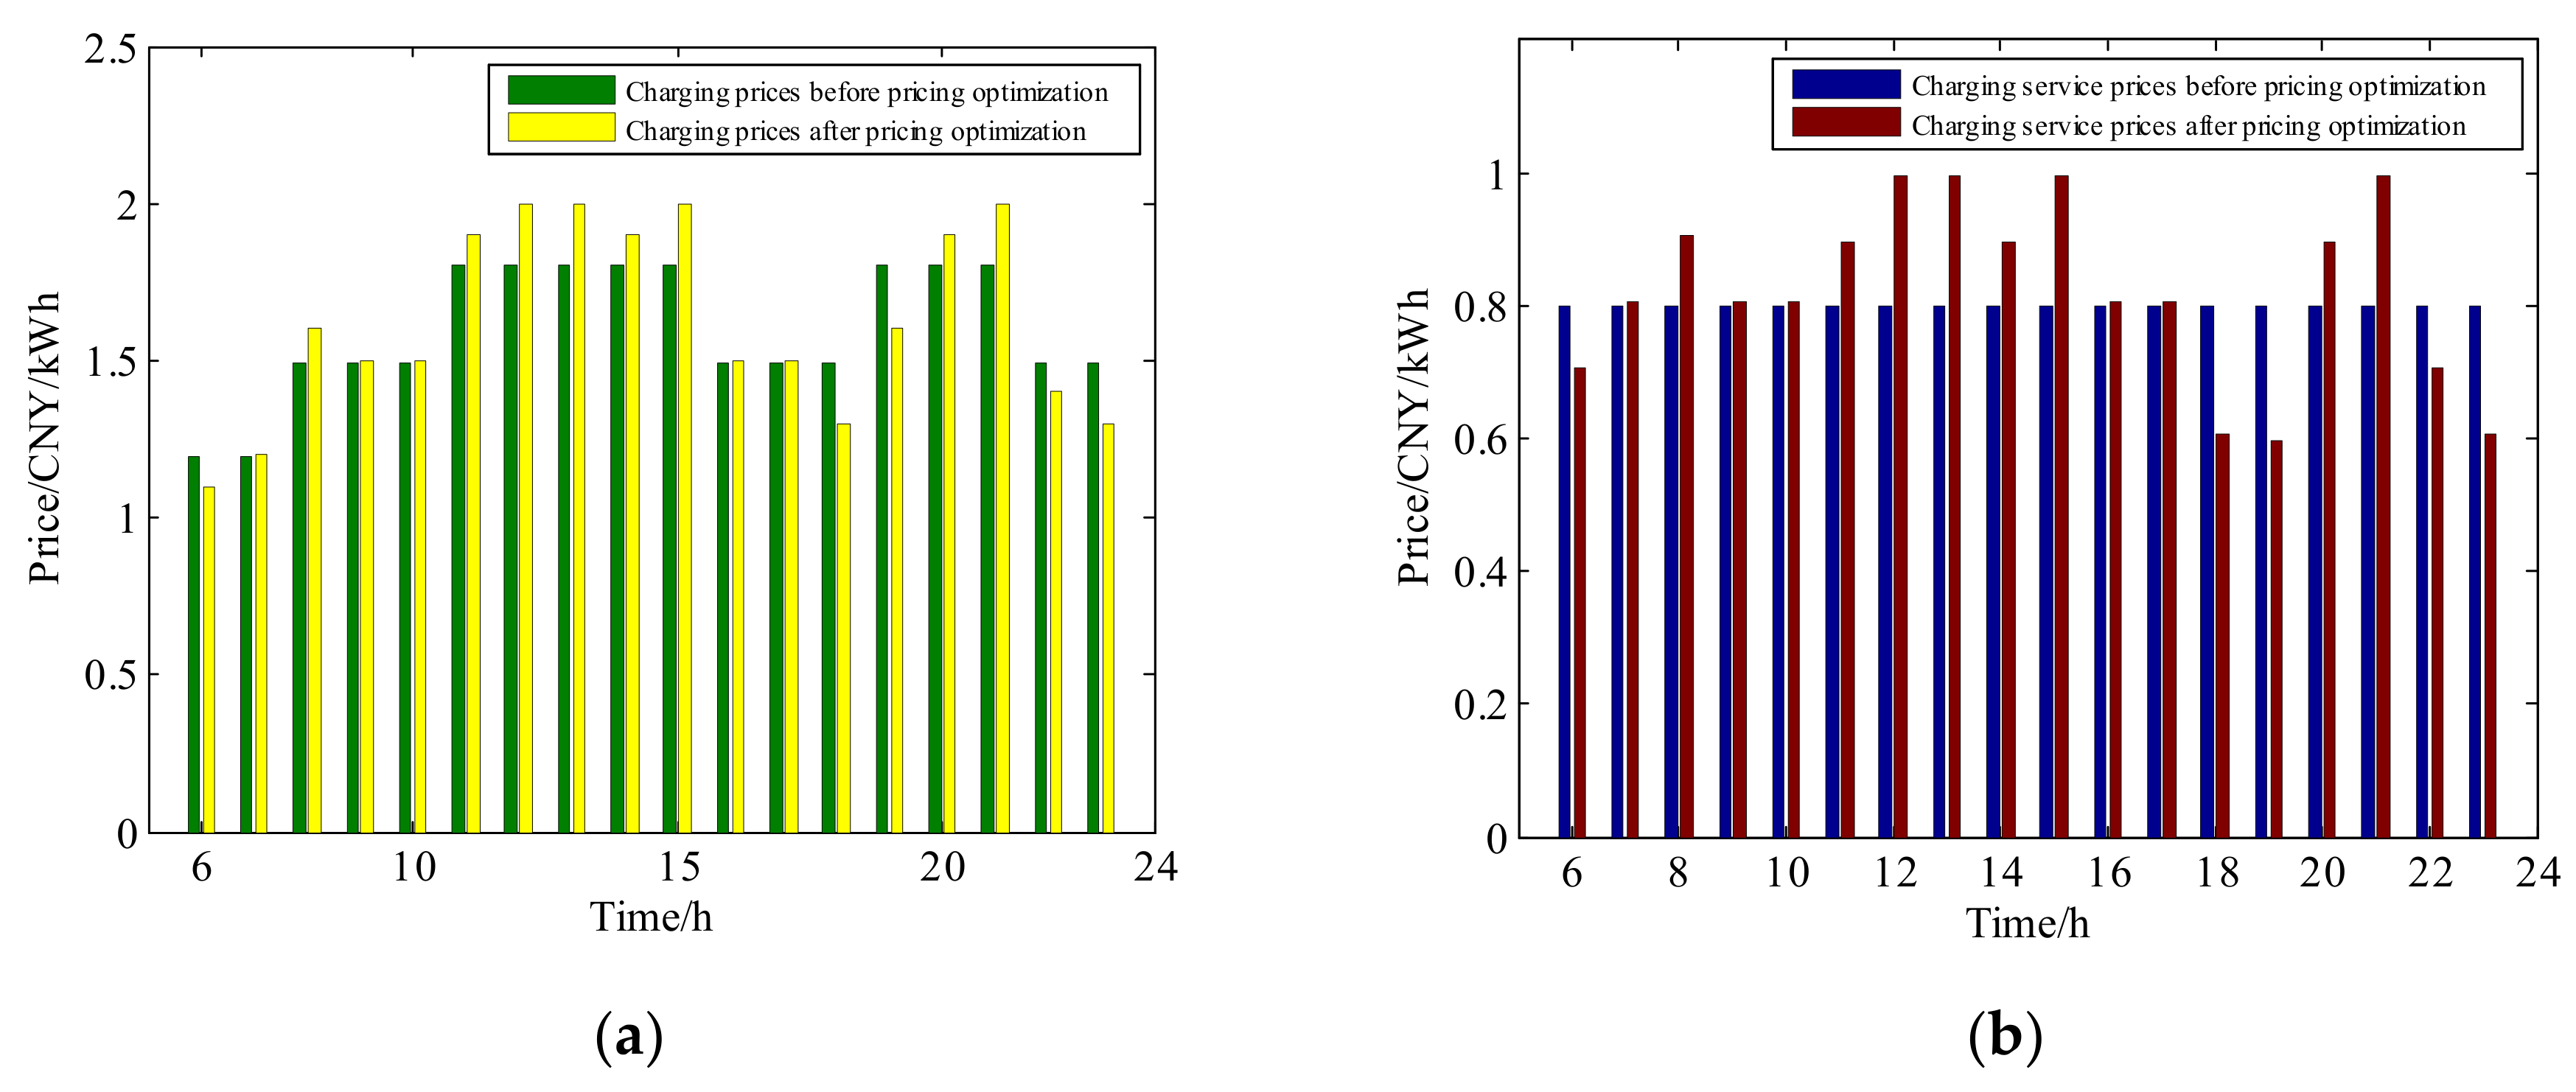
5.1. Scenario I—A Fast Charging Station for Electric Taxis

A fast charging station with 45 units of 25 kW fast chargers is chosen as the first case study. This charging station is located in Beijing and serves 428 electric taxis daily. The energy capacity of the electric taxi is 30 kWh. Through investigation and statistics, the minimum SOC for electric taxis is 30%, and the initial SOC when the vehicle arrives at the station is distributed normally with mean μ = 0.5471 and standard deviation σ = 0.1335 . The charging station operator charges vehicles based on the charging prices. The original charging prices are composed of the TOU electricity tariff of Beijing and a constant 0.8 CNY/kWh charging service fee. This paper intends to set the optimal charging service prices for a taxi driver who works during the daytime. The charging period is from 6:00 to 23:00, and hence the length of the period for optimization is 18.
To decrease the operation expenses, if we take minimizing the electricity purchase cost of the charging station as the objective function, results of pricing optimization-based coordinated charging are shown in Figure 8 and Figure 9.
As shown in Figure 8, in the case of uncoordinated charging, the peak-to-valley ratio was 0.502. However, with the coordination of optimal charging prices, the peak-to-valley ratio increased to 0.8797, and the load peak increased significantly, which may cause the overload of the distribution transformer. This is because the model of the pricing optimization is a single-objective problem, only considering the operation cost of the charging station. By calculating based on the prices in Figure 9, the electricity purchase cost of the charging station reduced to 4002.4 CNY/day with price based coordinated charging, from 4727.1 CNY/day in the case of the original charging prices. Moreover, the revenue of the station operator increased from 4580.6 CNY/day to 5256.4 CNY/day. Thus, an additional 14% of profits are earned by the proposed pricing optimization.
The results before and after pricing optimization in Scenario I, only considering the reduction of operation cost, are shown in Table 1.
Through the above analysis, it can be determined that single-objective optimization of the charging prices may result in undesired results. Hereby, a multi-objective optimization with the objectives of reducing both the peak-to-valley ratio and the operation cost is performed in this paper. As shown in Figure 10 and Figure 11, due to the balancing of the two objectives, the peak-to-valley ratio of charging loads of the station is reduced to 0.3714 from the value 0.502 before pricing optimization, and the value 0.8797 while considering the operation cost only. At the same time, the electricity purchase cost of the charging station is reduced to 4474.1 CNY/day with price-based coordinated charging, from 4727.1 CNY/day in the case of the original charging prices. The revenue of the station operator increased slightly from 4580.6 CNY/day to 4591.8 CNY/day since the EV users’ charging cost has reduced to some extent. It is obvious that both the regulation of charging loads and the cost reduction for EV users and station operators has been realized by adjusting the charging service fee from a constant value to variable values.
The results before and after pricing optimization in Scenario I, considering the reduction of both the peak-to-valley ratio and the operation cost, are shown in Table 2.

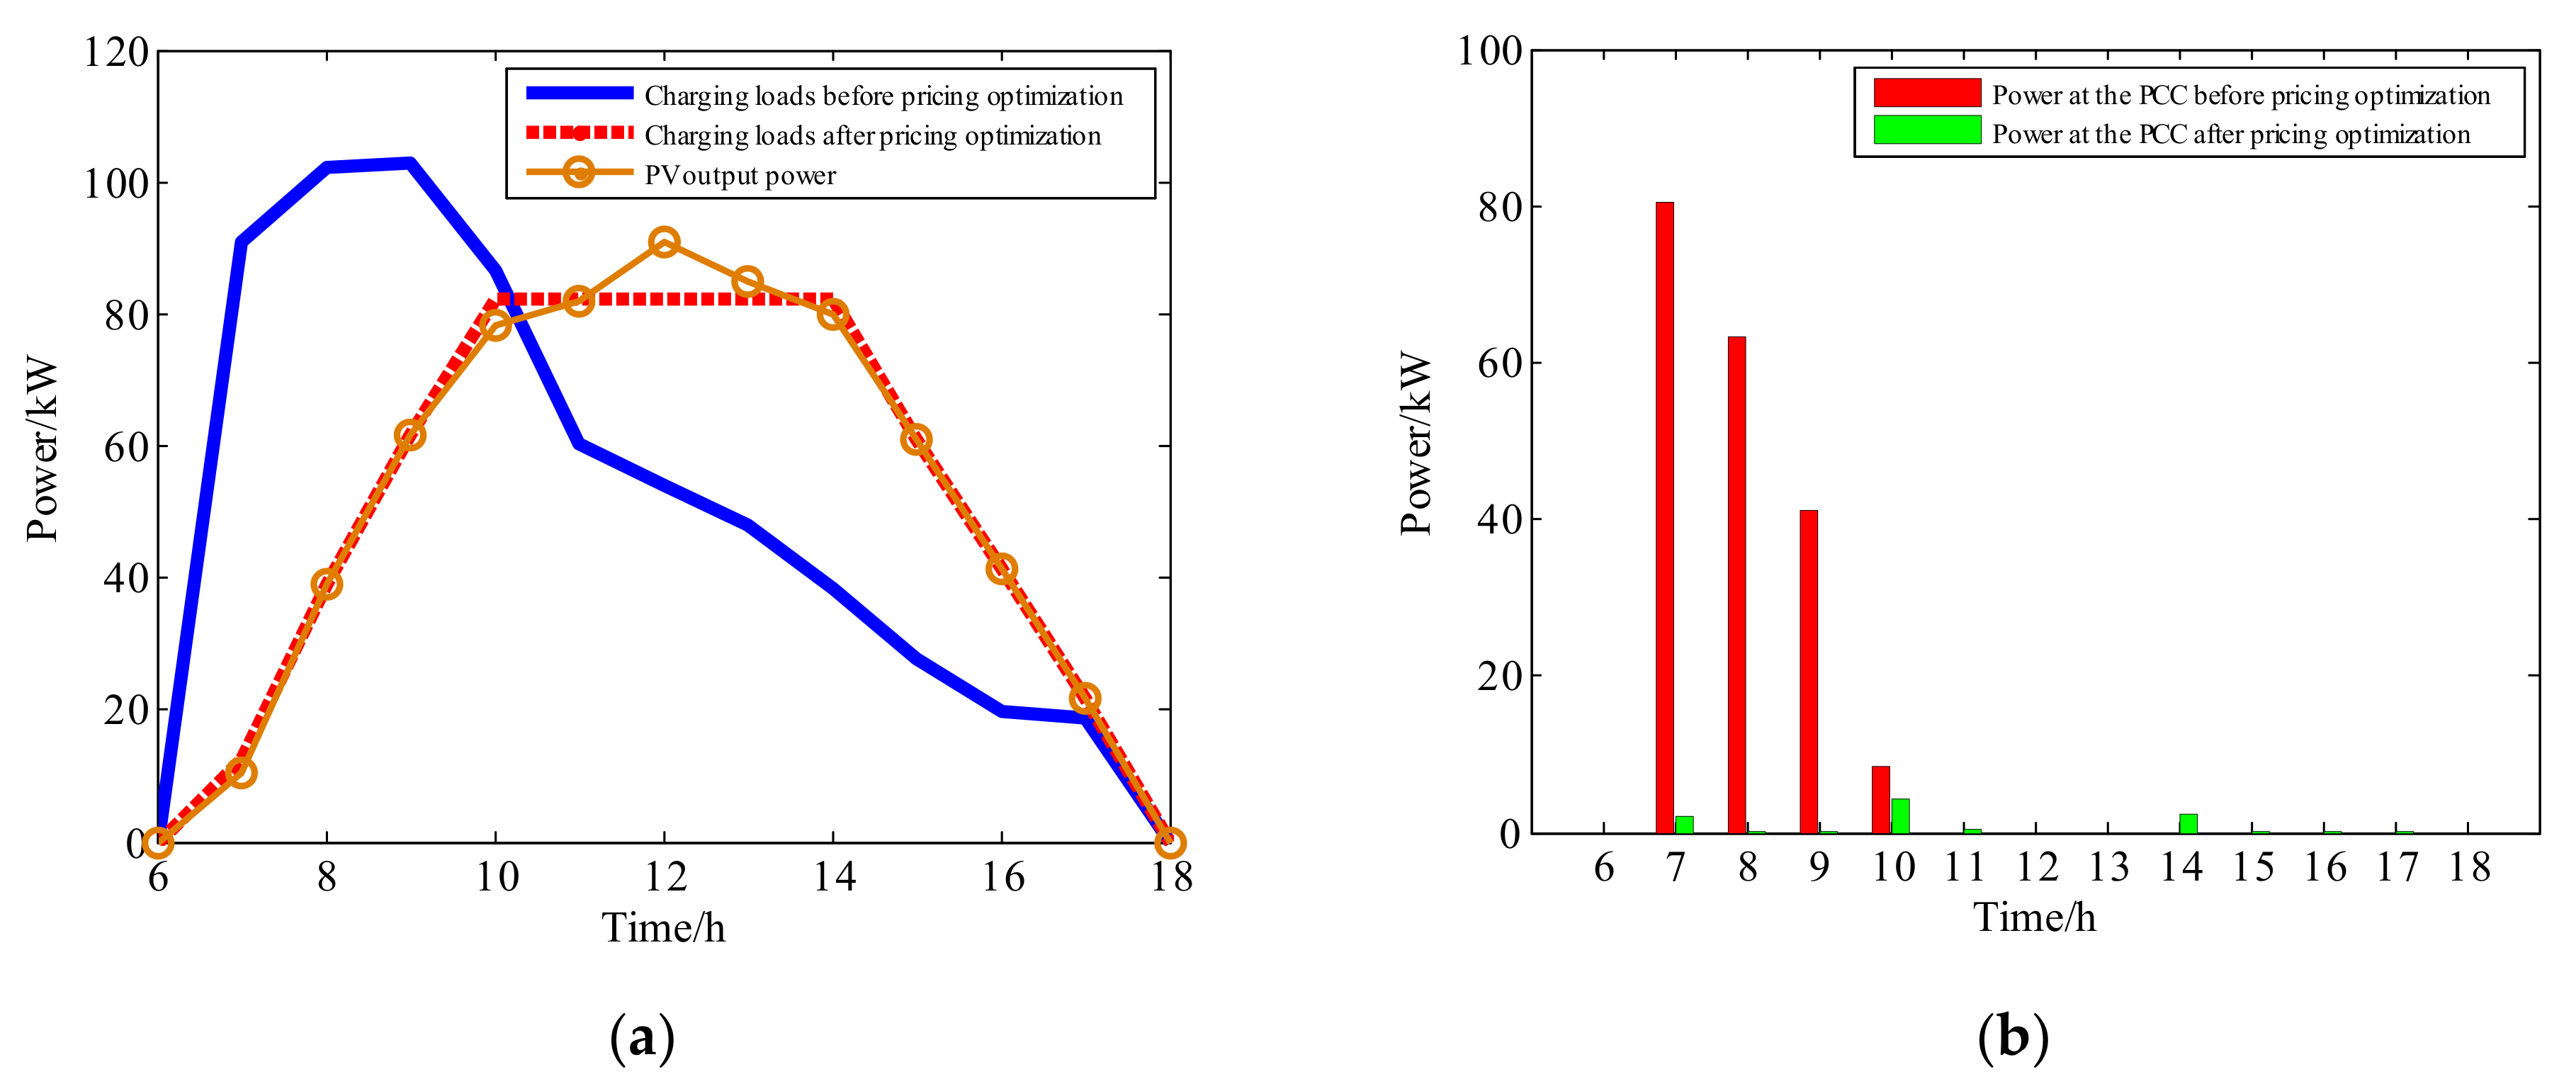
5.2. Scenario II—A Fast Charging Station with PV Integrated

In this case, the fast charging station with 120 kWp PV integrated is studied. This PV system only provides energy to the station, and excess energy generated cannot be fed back to the grid. Therefore, solar curtailment occurs frequently. The rated charging power of piles in the station that serves 50 commuting vehicles is 25 kW. The battery energy of EVs is 30 kWh. The original charging price in this charging station is constant, at 1.2 CNY/kWh, including 0.4 CNY/kWh electricity price and 0.8 CNY/kWh charging service fee. Since only office hours from 7:00 to 17:00 are taken into consideration in the pricing optimization, the number of the time index is 11.
In this case, considering the existence of solar curtailment and the peak power effect on the utility gird, a multi-objective optimization of reducing solar curtailment and minimizing the peak power at the PCC of the charging station is performed to generate an optimal charging price tariff for a PV charging station.
Optimized by PSO, Figure 12a depicts the charging loads before and after pricing optimization in Scenario II. It can be seen that solar curtailment exists between the times of 11:00 and 16:00 because of the mismatch of uncoordinated commuting charging and PV generation. Through the application of coordinated charging based on optimal charging prices, the daily solar curtailment has been reduced from 195.24 kWh to 11.15 kWh. The solar curtailment rate has also been reduced from 30% to 1.7%. Meanwhile, the peak power at the PCC of the charging station has been reduced significantly, from 80.52 kW to 4.27 kW, which can be seen clearly in Figure 12b. The power capacity demand for the utility grid decreases significantly. Therefore, it is conceivable that the basic electricity fee of the charging station is expected to decrease as well.
As shown in Figure 13, the charging prices have changed from the constant 1.2 CNY/kWh to variable values. Based on prospect theory, since the EV users will change their charging behavior according to the charging prices, the PV power curve and the optimal charging prices are generally opposite in trends. The electricity purchase cost of the charging station has reduced to 3.66 CNY/day with price-based coordinated charging, from 77.3 CNY/day in the case of the original charging prices. The revenue of the station operator has increased slightly from 702.23 CNY/day to 755.64 CNY/day at the same time. Thus, it can be determined that the purpose of coordinated charging is achieved. The results before and after pricing optimization in Scenario II, considering the reduction of both solar curtailment and the peak power at the PCC, are shown in Table 3.

6. Conclusions

Towards a proper charging price mechanism and coordinated charging, this paper proposes a novel approach for pricing of charging service fees in an EV public charging station based on prospect theory. Firstly, the EV user’s response to price is modelled on the basis of prospect theory, including the response model considering the price factor and the response model considering both the price factor and SOC. The quantitative relationship between the utility value and the charging price or SOC is analysed in detail. Secondly, on the basis of the price response model, charging load model after pricing optimization is established. Finally, charging pricing optimization can be performed to achieve multiple objectives such as minimizing the peak-to-valley difference and electricity expenses of the station, and reducing solar curtailment and the peak power at the PCC of the charging station using the PSO algorithm. The results of the case studies indicate that: (1) EV users’ charging behavior, which directly corresponds to the charging loads, is related to the charging prices and current SOC. The introduction of prospect theory for the quantitative description of decision making can effectively characterize the price response behavior of EV users during charging. (2) Based on the policy of China, the flexible pricing of time-varying charging prices with the proposed novel pricing approach can guide EV users to adjust charging hours, and hence coordinated charging of the charging station is achieved. The reduction of electricity costs, solar curtailment, and peak power at the PCC of the charging station could benefit both the station operator and power systems. In addition, based on the limitations of this paper that need to be addressed, many potential extensions of the work reported in this paper are possible, such as:
  • The EV response is assumed to be almost certain since the same response mechanism was applied in the pricing and automatic response of the on-board intelligent terminal, and hence we do not take behavior uncertainty into consideration in this paper. EV user’s behavior modeling with uncertainty is worth studying in the future, especially in the case of manual response.
  • Since the parameters of prospect theory calibrated by Kahneman may not be suitable for decision-making in other contexts, the suitable parameters for pricing require a mass of real operational data. It is necessary to perform case studies based on the precise description of the price response model in a charging station when real operational data are collected, or assuming that massive historical data are available.
  • Since the response can be implemented by the same on-board intelligent terminal, we did not consider reference points difference among different people in modeling. The reference point is significant in determining the response model, and the reference points among different people may be different. This is another limitation that needs to be addressed in future research.

Author Contributions

Conceptualization, Y.B. and W.Z.; methodology, Y.B. and F.C.; software, F.C.; validation, F.C.; formal analysis, Y.B. and F.C.; investigation, Y.B. and F.C.; resources, J.S., P.Y. and F.C.; data curation, F.C. and P.Y.; writing—original draft preparation, Y.B.; writing—review and editing, Y.B. and D.W.G. All authors have read and agreed to the published version of the manuscript.

Funding

This research was funded by the Fundamental Research Funds for the Central Universities, grant number 2022JBMC059, and the National Natural Science Foundation of China, grant number 52177206.

Institutional Review Board Statement

Not applicable.

Informed Consent Statement

Not applicable.

Data Availability Statement

Not applicable.

Conflicts of Interest

The authors declare no conflict of interest.

References

  1. Chan, C.C. The State of the Art of Electric, Hybrid, and Fuel Cell Vehicles. Proc. IEEE 2007, 95, 704–718. [Google Scholar] [CrossRef]
  2. Madina, C.; Zamora, I.; Zabala, E. Methodology for assessing electric vehicle charging infrastructure business models. Energy Policy 2015, 89, 284–293. [Google Scholar] [CrossRef] [Green Version]
  3. Bjerkan, K.Y.; Nørbech, T.E.; Nordtømme, M.E. Incentives for promoting Battery Electric Vehicle (BEV) adoption in Norway. Transp. Res. Part D Transp. Environ. 2016, 43, 169–180. [Google Scholar] [CrossRef] [Green Version]
  4. Guo, Y.; Kelly, J.A.; Clinch, J.P. Variability in total cost of vehicle ownership across vehicle and user profiles. Commun. Transp. Res. 2022, 2, 100071. [Google Scholar] [CrossRef]
  5. Serradilla, J.; Wardle, J.; Blythe, P.; Gibbon, J. An evidence-based approach for investment in rapid-charging infrastructure. Energy Policy 2017, 106, 514–524. [Google Scholar] [CrossRef]
  6. Xiong, R.; Chen, H.; Wang, C.; Sun, F. Towards a smarter hybrid energy storage system based on battery and ultracapacitor—A critical review on topology and energy management. J. Clean. Prod. 2018, 202, 1228–1240. [Google Scholar] [CrossRef]
  7. Lopes, J.A.P.; Soares, F.J.; Almeida, P.M.R. Integration of Electric Vehicles in the Electric Power System. Proc. IEEE 2011, 99, 168–183. [Google Scholar] [CrossRef] [Green Version]
  8. Clement-Nyns, K.; Haesen, E.; Driesen, J. The Impact of Charging Plug-In Hybrid Electric Vehicles on a Residential Distribution Grid. IEEE Trans. Power Syst. 2010, 25, 371–380. [Google Scholar] [CrossRef] [Green Version]
  9. Shafiee, S.; Fotuhi-Firuzabad, M.; Rastegar, M. Investigating the impacts of plug-in hybrid electric vehicles on power distribution systems. IEEE Trans. Smart Grid 2013, 4, 1351–1360. [Google Scholar] [CrossRef]
  10. Gray, M.K.; Morsi, W.G. Power Quality Assessment in Distribution Systems Embedded with Plug-In Hybrid and Battery Electric Vehicles. IEEE Trans. Power Syst. 2015, 30, 663–671. [Google Scholar] [CrossRef]
  11. Turker, H.; Bacha, S.; Chatroux, D.; Hably, A. Low-Voltage Transformer Loss-of-Life Assessments for a High Penetration of Plug-In Hybrid Electric Vehicles (PHEVs). IEEE Trans. Power Deliv. 2012, 27, 1323–1331. [Google Scholar] [CrossRef]
  12. Zhang, W.; Zhang, D.; Mu, B.; Wang, L.Y.; Bao, Y.; Jiang, J.; Morais, H. Decentralized Electric Vehicle Charging Strategies for Reduced Load Variation and Guaranteed Charge Completion in Regional Distribution Grids. Energies 2017, 10, 147. [Google Scholar] [CrossRef] [Green Version]
  13. Han, J.; Park, J.; Lee, K. Optimal Scheduling for Electric Vehicle Charging under Variable Maximum Charging Power. Energies 2017, 10, 933. [Google Scholar] [CrossRef]
  14. Xu, Z.; Hu, Z.; Song, Y.; Zhao, W.; Zhang, Y. Coordination of PEVs charging across multiple aggregators. Appl. Energy 2014, 136, 582–589. [Google Scholar] [CrossRef]
  15. Di Silvestre, M.L.; Sanseverino, E.R.; Zizzo, G.; Graditi, G. An optimization approach for efficient management of EV parking lots with batteries recharging facilities. J. Ambient Intell. Humaniz. Comput. 2013, 4, 641–649. [Google Scholar] [CrossRef]
  16. Awad, A.; Shaaban, M.; El-Fouly, T.; El-Saadany, E.; Salama, M. Optimal resource allocation and charging prices for benefit maximization in smart PEV-parking lots. IEEE Trans. Sustain. Energy 2017, 3, 906–915. [Google Scholar] [CrossRef]
  17. Liu, P.; Yu, J.; Fan, K.; Eissa, M. PEV charging coordination to absorb excess wind energy via group differentiated dual-tariff schemes. Electr. Power Syst. Res. 2017, 151, 208–217. [Google Scholar] [CrossRef]
  18. Faddel, S.; Al-Awami, A.T.; Mohammed, O.A. Charge Control and Operation of Electric Vehicles in Power Grids: A Review. Energies 2018, 11, 701. [Google Scholar] [CrossRef] [Green Version]
  19. Zoltowska, I.; Lin, J. Optimal Charging Schedule Planning for Electric Buses Using Aggregated Day-Ahead Auction Bids. Energies 2021, 14, 4727. [Google Scholar] [CrossRef]
  20. Kong, C.; Bayram, I.S.; Devetsikiotis, M. Revenue Optimization Frameworks for Multi-Class PEV Charging Stations. IEEE Access 2015, 3, 2140–2150. [Google Scholar] [CrossRef]
  21. Cui, S.; Yao, B.; Chen, G.; Zhu, C.; Yu, B. The multi-mode mobile charging service based on electric vehicle spatiotemporal distribution. Energy 2020, 198, 117302. [Google Scholar] [CrossRef]
  22. Zima-Bockarjova, M.; Sauhats, A.; Petrichenko, L.; Petrichenko, R. Charging and discharging scheduling for electrical vehicles using a Shapley-Value approach. Energies 2020, 13, 1160. [Google Scholar] [CrossRef] [Green Version]
  23. Zhang, L.; Yang, M.; Zhao, Z. Game analysis of charging service fee based on benefit of multi-party participants: A case study analysis in China. Sustain. Cities Soc. 2019, 48, 101528. [Google Scholar] [CrossRef]
  24. Shi, Y.; Zhang, D.; Zhou, Y.; Feng, D.; Wu, D. Stackelberg game based fast charging service fee price model in consideration of electric vehicles’ promotion. In Proceedings of the 8th Renewable Power Generation Conference, Shanghai, China, 24–25 October 2019; pp. 1–7. [Google Scholar]
  25. Su, S.; Wang, W.; Yan, H.; Ding, N. Alliance game pricing model of charging service fee under market competition mode. In Proceedings of the IEEE International Conference on Energy Internet, Nanjing, China, 27–31 May 2019; pp. 426–431. [Google Scholar]
  26. Liu, J. Research on pricing segmentation method of electric vehicle charging service fee. In Proceedings of the IEEE PES Innovative Smart Grid Technologies Asia, Chengdu, China, 21–24 May 2019; pp. 704–709. [Google Scholar]
  27. Liu, J.; Chen, Y.; Zou, D.; Zuo, G.; Lu, L. Study on segmented pricing method of electric vehicles charging service fee based on clustering algorithms. In Proceedings of the 11th International Conference on Intelligent Human-Machine Systems and Cybernetics, Hangzhou, China, 24–25 August 2019; pp. 76–79. [Google Scholar]
  28. Qian, T.; Shao, C.; Li, X.; Wang, X.; Shahidehpour, M. Enhanced Coordinated Operations of Electric Power and Transportation Networks via EV Charging Services. IEEE Trans. Smart Grid 2020, 11, 3019–3030. [Google Scholar] [CrossRef]
  29. Bayram, I.S.; Michailidis, G.; Devetsikiotis, M. Unsplittable Load Balancing in a Network of Charging Stations Under QoS Guarantees. IEEE Trans. Smart Grid 2015, 6, 1292–1302. [Google Scholar] [CrossRef] [Green Version]
  30. Yuan, W.; Huang, J.; Zhang, Y.J.A. Competitive charging station pricing for plug-in electric vehicles. IEEE Trans. Smart Grid 2017, 8, 627–639. [Google Scholar]
  31. Seyedyazdi, M.; Mohammadi, M.; Farjah, E. A Combined Driver-Station Interactive Algorithm for a Maximum Mutual Interest in Charging Market. IEEE Trans. Intell. Transp. Syst. 2020, 21, 2534–2544. [Google Scholar] [CrossRef]
  32. Lu, Z.; Qi, J.; Zhang, J.; He, L.; Zhao, H. Modelling dynamic demand response for plug-in hybrid electric vehicles based on real-time charging pricing. IET Gener. Transm. Distrib. 2017, 11, 228–235. [Google Scholar] [CrossRef]
  33. Liu, L.; Lyu, X.; Jiang, C.; Xie, D. Decision-Making of Determining the Start Time of Charging/Discharging of Electrical Vehicle Based on Prospect Theory. J. Electr. Eng. Technol. 2014, 9, 803–811. [Google Scholar] [CrossRef] [Green Version]
  34. Gao, J.; Yang, Y.; Gao, F.; Wu, H. Collaborative optimization of electric vehicles based on multiagent variant Roth–Erev algorithm. Energies 2022, 15, 125. [Google Scholar] [CrossRef]
  35. Kahneman, D.; Tversky, A. Prospect Theory: An Analysis of Decision under Risk. Econometrica 1979, 47, 263. [Google Scholar] [CrossRef] [Green Version]
  36. Tversky, A.; Kahneman, D. Advances in prospect theory: Cumulative representation of uncertainty. J. Risk Uncertain. 1992, 5, 297–323. [Google Scholar] [CrossRef]
  37. Barberis, N.C. Thirty years of prospect theory in economics: A review and assessment. J. Econ. Perspect. 2012, 27, 173–195. [Google Scholar] [CrossRef] [Green Version]
  38. Gao, K.; Yang, Y.; Qu, X. Diverging effects of subjective prospect values of uncertain time and money. Commun. Transp. Res. 2021, 2, 100007. [Google Scholar] [CrossRef]
  39. Li, Z.; Hensher, D. Prospect Theoretic Contributions in Understanding Traveller Behaviour: A Review and Some Comments. Transp. Rev. 2011, 31, 97–115. [Google Scholar] [CrossRef]
  40. Stathopoulos, A.; Hess, S. Revisiting reference point formation, gains-losses asymmetry and non-linear sensitivities with an emphasis on attribute specific treatment. Transp. Res. Part A Policy Pract. 2012, 46, 1673. [Google Scholar] [CrossRef] [Green Version]
  41. Xu, H.; Lou, Y.; Yin, Y.; Zhou, J. A prospect-based user equilibrium model with endogenous reference points and its application in congestion pricing. Transp. Res. Part B Methodol. 2011, 45, 311–328. [Google Scholar] [CrossRef]
  42. Ortúzar, J.D.D. Future transportation: Sustainability, complexity and individualization of choices. Commun. Transp. Res. 2021, 1, 100010. [Google Scholar] [CrossRef]
  43. Bao, Y.; Chang, F.; Shi, J.; Zhang, W. An approach for pricing of charging service fees in an electric vehicle public charging station. In Proceedings of the International Conference on Electric and Intelligent Vehicles, Nanjing, China, 25–28 June 2021; pp. 1–6. [Google Scholar]
Figure 1. Development trends of EVs and public charging piles in China.
Energies 15 05308 g001
Figure 2. TOU (Time-of-use) electricity prices for large industrial customers in Beijing.
Energies 15 05308 g002
Figure 3. Typical topology of the charging station and its information framework for the proposed approach.
Energies 15 05308 g003
Figure 4. Charging values in different periods of the original charging tariff.
Energies 15 05308 g004
Figure 5. Charging values of different SOCs at peak price times of the original charging tariff.
Energies 15 05308 g005
Figure 6. Charging values considering both the price factor and SOC: (a) At peak price times of the original charging price tariff; (b) at flat price times of the original charging price tariff; (c) at valley price times of the original charging price tariff; (d) comparison of charging values at peak and valley price times of the original charging price tariff.
Energies 15 05308 g006
Figure 7. Flow chart of the proposed pricing approach.
Energies 15 05308 g007
Figure 8. Comparison of charging loads before and after pricing optimization in Scenario I, only reducing the operation cost as the objective.
Energies 15 05308 g008
Figure 9. Comparison of prices before and after pricing optimization in Scenario I, only reducing the operation cost as the objective: (a) Original and optimal charging prices; (b) original and optimal charging service prices.
Energies 15 05308 g009
Figure 10. Comparison of charging loads before and after pricing optimization in Scenario I, reducing both the peak-to-valley ratio and the operation cost as the objectives.
Energies 15 05308 g010
Figure 11. Comparison of prices before and after pricing optimization in Scenario I, reducing both the peak-to-valley ratio and the operation cost as the objectives: (a) Original and optimal charging prices; (b) original and optimal charging service prices.
Energies 15 05308 g011
Figure 12. Comparisons before and after pricing optimization in Scenario II, reducing both solar curtailment and the peak power at the PCC as the objectives: (a) Charging loads; (b) power at the PCC.
Energies 15 05308 g012
Figure 13. Comparison of the charging prices whether with the optimal pricing or not in Scenario II, reducing both solar curtailment and the peak power at the PCC as the objectives.
Energies 15 05308 g013
Table 1. Results before and after pricing optimization in Scenario I, only reducing the operation cost as the objective.
IndexBefore Pricing OptimizationAfter Pricing Optimization
Peak-to-valley ratio of the charging station0.5020.8797
Electricity purchase cost of the station (CNY/day)4727.14002.4
Revenue of the station operator (CNY/day)4580.65256.4
EV users charging cost (CNY/day)9307.79258.8
Table 2. Results before and after pricing optimization in Scenario I, reducing both the peak-to-valley ratio and the operation cost as the objectives.
IndexBefore Pricing OptimizationAfter Pricing Optimization
Peak-to-valley ratio of the charging station0.5020.3714
Electricity purchase cost of the station (CNY/day)4727.14474.1
Revenue of the station operator (CNY/day)4580.64591.8
EV users’ charging cost (CNY/day)0.5020.3714
Table 3. Results before and after pricing optimization in Scenario II, reducing both solar curtailment and the peak power at the PCC as the objectives.
IndexBefore Pricing OptimizationAfter Pricing Optimization
Solar curtailment (kWh/day)195.2411.15
Peak power at the PCC (kW)80.524.27
Electricity purchase cost of the station (CNY/day)77..33.66
Revenue of the station operator (CNY/day)702.23755.64
EV users’ charging cost (CNY/day)779.53759.29
Publisher’s Note: MDPI stays neutral with regard to jurisdictional claims in published maps and institutional affiliations.

