Article

Experimental Study of Oil Displacement and Gas Channeling during CO2 Flooding in Ultra—Low Permeability Oil Reservoir

1
School of Petroleum Engineering, Xi’an Shiyou University, Xi’an 710065, China
2
State Key Laboratory of Reservoir Geology and Development, Southwest Petroleum University, Chengdu 610500, China
3
Changqing Oilfield Company, Petro China, Xi’an 710018, China
4
Institute of Unconventional Oil and Gas Science and Technology, China University of Petroleum (Beijing), Beijing 102249, China
5
Changqing Engineering Design Co., Ltd., Petro China, Xi’an 710018, China
*
Author to whom correspondence should be addressed.
Energies 2022, 15(14), 5119; https://doi.org/10.3390/en15145119
Submission received: 24 May 2022 / Revised: 29 June 2022 / Accepted: 6 July 2022 / Published: 14 July 2022
(This article belongs to the Section H1: Petroleum Engineering)

Abstract

:
Aiming to solve the problems of poor CO2 displacement efficiency and serious gas-channeling and low well-opening rates in ultra-low permeability reservoirs, we carry out CO2 displacement experiments under different permeability reservoirs by using different development methods, water drive to gas drive procedures, and different fracture positions to clarify the effects of physical formation properties, injection methods, and fracture parameters on CO2 displacement efficiency in C8 ultra-low permeability reservoirs. The experimental results show that the recovery degree of CO2 miscible drive increases with an increase in permeability. When the gas–oil ratio is greater than 2000 m3/m3, serious gas channeling can be observed in both the miscible drive and immiscible drive. In addition, when the water drive is altered to be a gas drive, the water cut of 0.45 mD and 0.98 mD cores decreased, and the recovery degree increased by 13.4% and 16.57%, respectively. A long fracture length will deteriorate gas channeling and lower the CO2 oil-displacement efficiency. However, the fracture location is found to have little impact on the recovery of CO2 displacement.

1. Introduction

With the deepening of oil and gas field exploration and development, the proportion of ultra-low permeability oilfield production increases. An ultra-low permeability reservoir is usually characterized by low permeability, low porosity, natural fracture development, and serious heterogeneity [1,2]. Water-injection development has a slow effect, inadequate recovery, and serious water channeling along with artificial fractures, which results in ineffective water injection in ultra-low permeability reservoirs. CO2 flooding has become the most important EOR technology after water flooding, and has been used as a long-term tertiary oil-recovery technology by many oil companies around the world. Therefore, it is necessary to seek new production methods to further improve the oil recovery of ultra-low permeability reservoirs [3,4,5]. The mobility of CO2 is usually quite high, which can effectively help CO2 flow into micropores to improve the sweeping efficiency and expand the oil-displacement sweep area. CO2 is easily soluble in crude oil, effectively reduces the viscosity and interfacial tension of crude oil, improves formation pressure, overcomes the Jamin effect, effectively uses small-pore throat crude oil, greatly improves oil-displacement efficiency, and is easy to capture and cheap. Therefore, CO2 flooding is an important technology to improve the production efficiency and recovery efficiency of low-permeability reservoirs. CO2 injection can meet the dual needs of oil displacement and storage, and is the main position for CCUS implementation [6,7,8,9], playing a dual role in improving economic benefits and protecting the environment, and has broad application prospects.
Numerous field-scale applications show that CO2 flooding is one of the most promising oil-increase measures to improve the development effect of ultra-low permeability reservoirs [10,11,12,13,14]. There are a total of 136 CO2 oil-displacement projects in the United States, of which low-permeability reservoir projects account for 63.67%, with average porosity and permeability of 13.23% and 38.1 mD, respectively, and enhanced oil recovery by 8.00–25%, and oil change rate by 0.28–0.72 t/t [15,16]. Zhang Meng [17] studied the influence of core permeability and heterogeneity on the effect of water alternate gas (WAG) displacement. The lower the permeability, the later the gas-channeling time becomes; the smaller the permeability difference, and the higher the gas–water ratio, and the better the oil displacement becomes. Zou Jirui [18] aims at the problem of gas channeling occurring during the CO2 injection in the fractured low-permeability reservoir. Shutting in gas channeling wells can effectively inhibit gas channeling and further excavate the remaining oil, and the recovery is increased by 7.52%. With the production well diversion control method, Wang Zhixing [19] adopts the methods of low-permeability priority and low-permeability, high-pressure difference to prolong the gas breakthrough time, and increases the liquid production of production wells, and the recovery degree by 19.39% and 23.31%, respectively. By using conventional PVT multiple contact experiments, Hu Wei [20] carried out gas-injection displacement experiments and gas–water alternate displacement experiments at different water cut stages. Under different water cuts, CO2 flooding will form different three-phase seepage and distribution characteristics of oil, gas, and water in the reservoir, thus affecting the recovery degree. Yuxia Wang [21] studied the influence of macroheterogeneity on CO2 recovery efficiency with indoor experiments and field data. The injection wells located in high permeability areas and production wells located in low-permeability areas can ensure CO2 gas injection capacity and improve the CO2 oil displacement effect of tight sandstone reservoirs. Hao Shen [22] developed a new type of channeling plugging agent for low-permeability fractured reservoir with rheological experiment, which can effectively inhibit gas channeling and improve oil recovery by 21.7%. Zheng Chen [23] found that the existence of water inhibits the contact between supercritical CO2 and crude oil and reduces the diffusion of CO2 to crude oil. It leads to an early CO2 intrusion and a good injection capacity. In different water-bearing stages, it is essential to select appropriate gas-injection time. Hongda Hao [24] has set a high-strength temporary plugging agent through laboratory experiments. A three-dimensional radial flow model with complex cracks and heterogeneity has been designed according to the actual oilfield. The recovery factor increased by 15.09% through high-strength gel and gas–water alternation.
However, due to the low viscosity of CO2 and the formation of an adverse mobility ratio, viscous fingering and gas channeling very easily occur, which seriously lowers the recovery degree of gas drive EOR [25,26,27]. Therefore, with the indoor physical simulation experiment of core displacement, the effects of different permeability, different development methods, water drive to gas drive, and the different fracture positions on the CO2 displacement effect and the gas-channeling law of ultra-low permeability reservoirs are studied. The feasibility of CO2 flooding in ultra-low permeability reservoirs to improve crude oil recovery is clarified to provide theoretical guidance and reference for improving the recovery efficiency of CO2 flooding technology in oilfields.

2. Experimental Materials and Equipment

2.1. Experimental Materials

The H3 District of the Changqing oilfield is located in Yanchi County of Ningxia Autonomous Region with an altitude of 1500~1800 m and an area of 170 km2. The sedimentary environment of Chang 8 reservoir in H3 District belongs to delta front facies. The reservoir sand body is mainly underwater distributary channel sand, and the local sand bodies are estuary bar sand, underwater crevasse fan sand, and sheet sand. The reservoir is mainly feldspathic lithic sandstone, followed by lithic feldspathic sandstone. The buried depth is about 2600 m, the average sand body thickness is 17.5 m, and the average oil layer thickness is 15.7 m.
Core samples were collected from the C8 layer in the H3 area of Ordos Basin. The pulse method is used to determine permeability and porosity. The core test results of this experiment are shown in Table 1. The average porosity is 10.77%, and the average permeability is 0.51 md, making it a low-porosity–ultra-low porosity and ultra-low permeability reservoir.

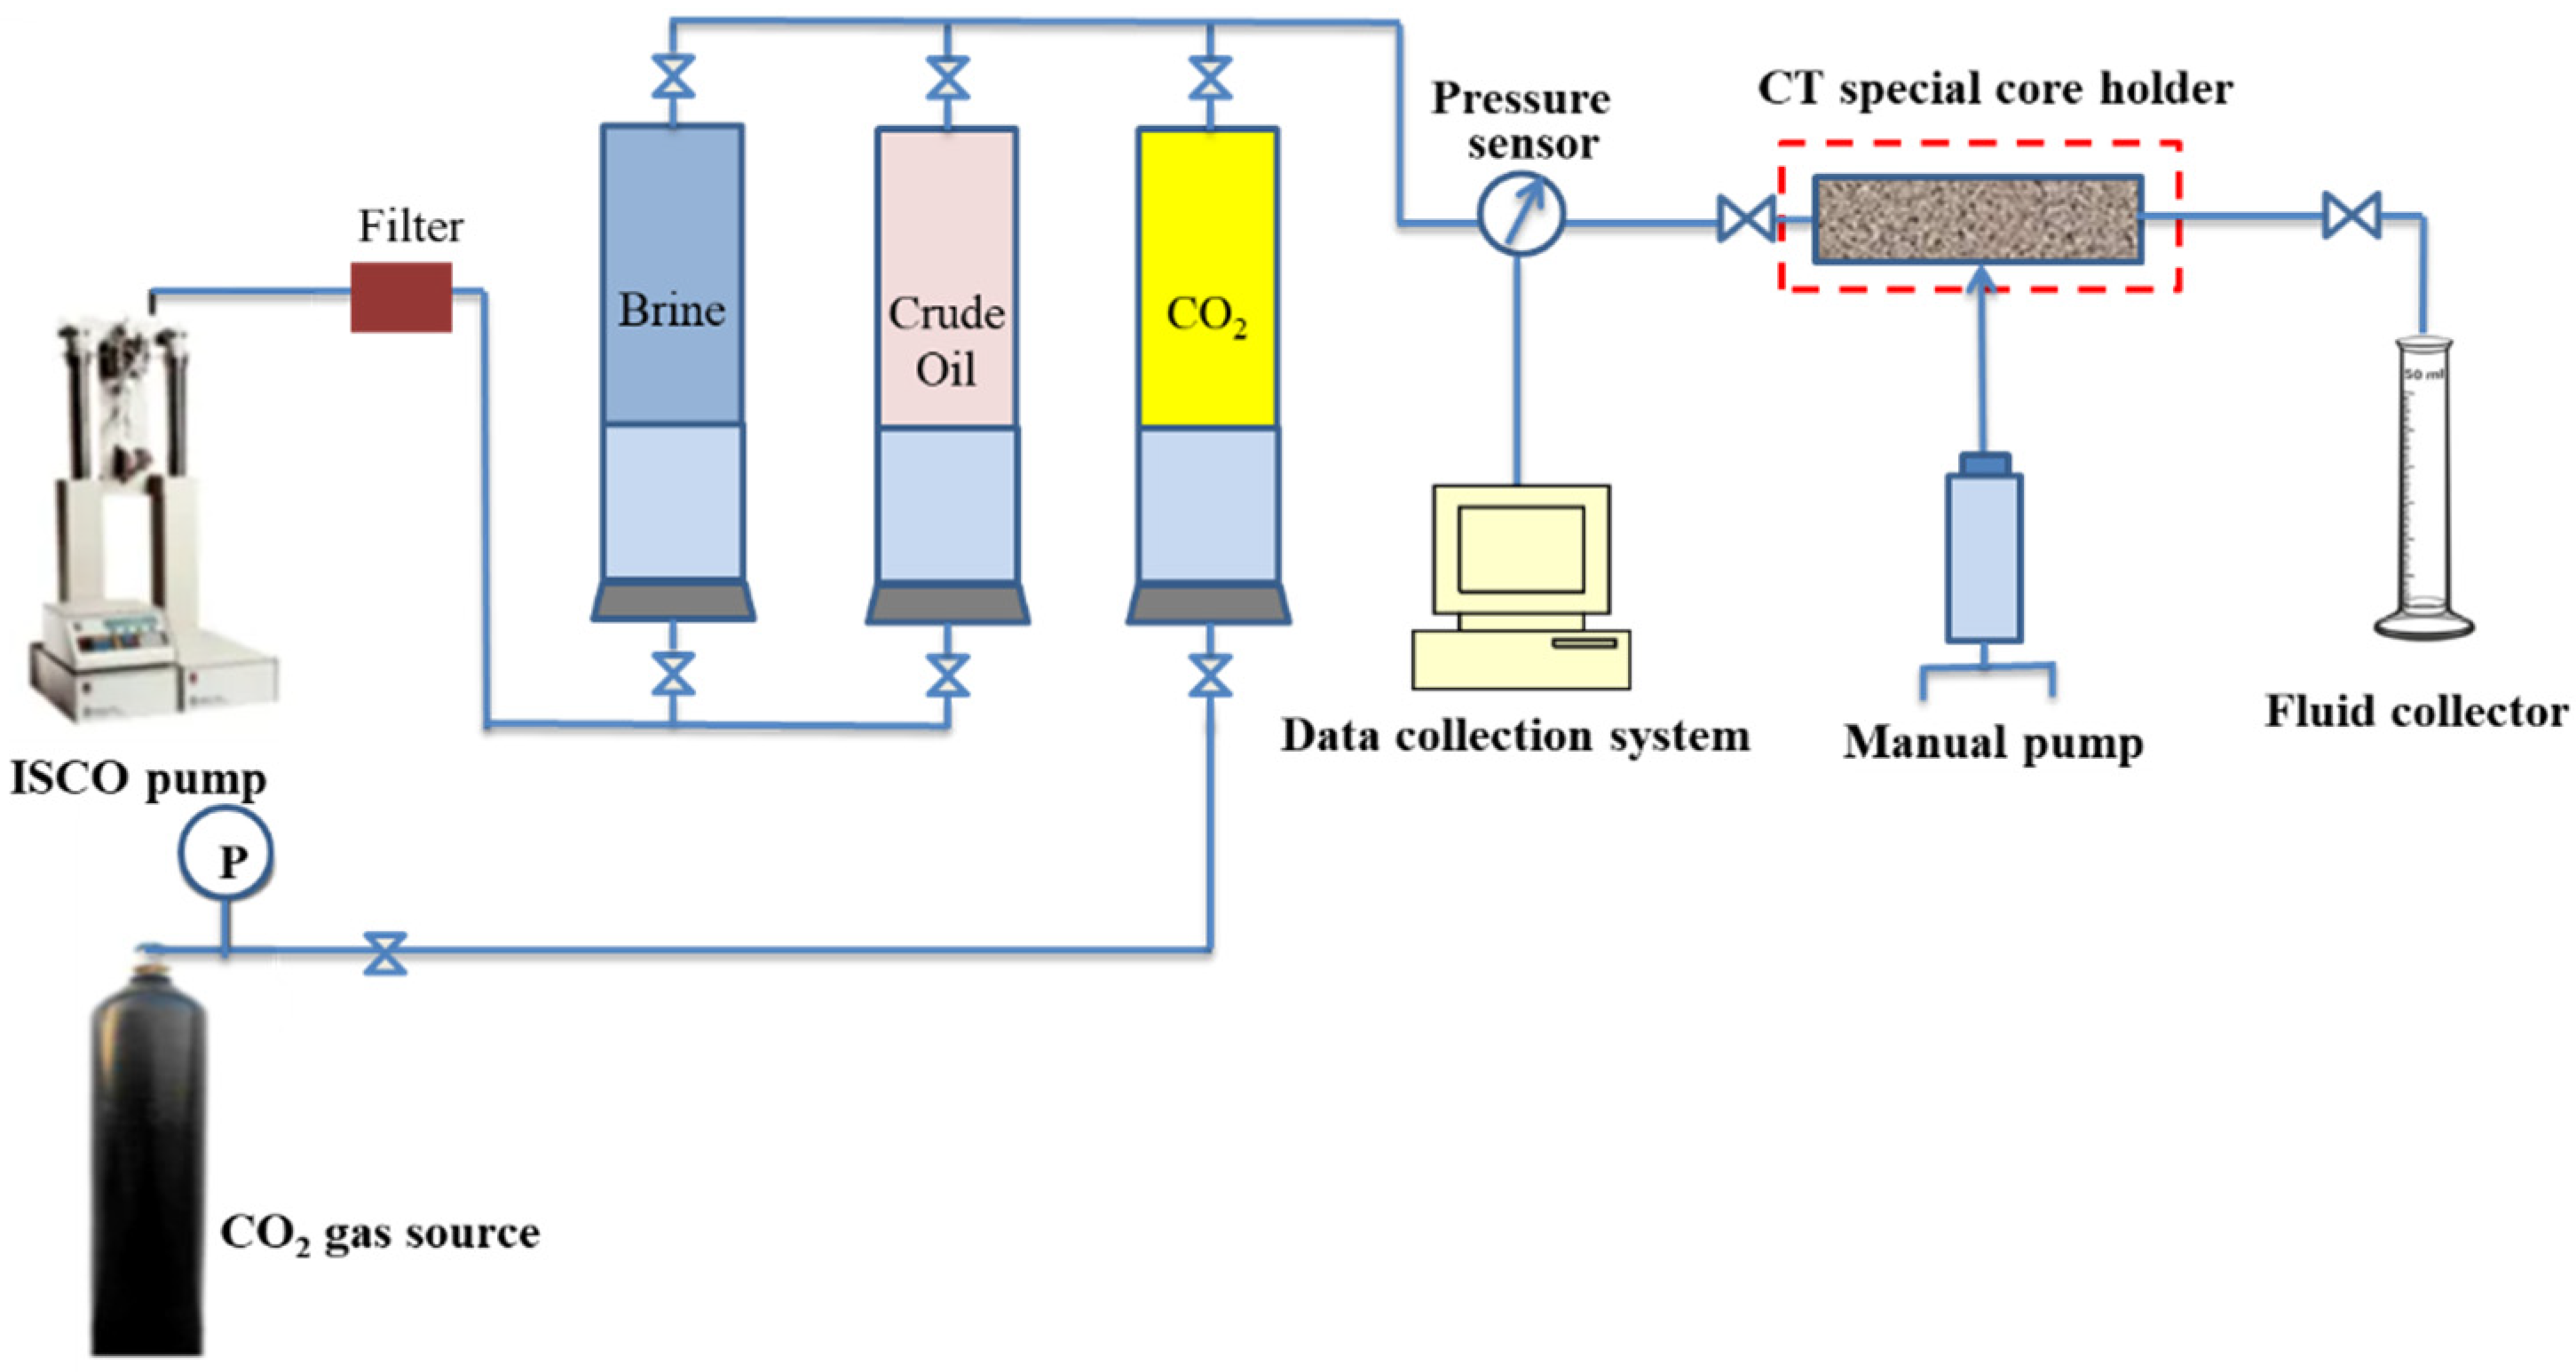
2.2. Experimental Equipment

Two control test groups are designed for different permeabilities, which are divided into two states: miscible and immiscible. To ensure that the oil and gas are always miscible, the injection pressure of the miscible experiment is 20 MPa, and the backpressure at the outlet end is 15 MPa. The injection pressure of immiscible group is 13 MPa, and the backpressure at the outlet is 8 MPa. The injection production pressure difference in the above experiments is 5 MPa. This experiment adopts the multifunctional core displacement experimental device independently developed by the Engineering Research Center of the Ministry of Education for developing and treating Western low-permeability–ultra-low permeability oil fields of Xi’an Shiyou University (Figure 1).

3. Experimental Method

3.1. Core Displacement Experiment

The experimental procedure of core displacement is as follows,
(1)
Dry the core in an oven at 110 °C, then inject formation water at a pressure of 15 MPa, and the core saturates the formation water.
(2)
Inject the formation oil into the core with an injection pressure of 15 MPa, saturate the formation oil by displacing the formation water, establish irreducible water saturation, and stop eviction after the liquid volume at the outlet is stable.
(3)
Inject CO2 at a predesigned pressure, then measure the oil and gas production under different injection times at a time interval of 1 min, and record the injection volume, water yield, and oil yield, and calculate the water cut and recovery degree. When the oil yield is unnoticeable, stop water injection, inject CO2 at the set pressure and constant pressure, measure the oil yield and gas production at different injection times at 0.5-min intervals, and calculate the recovery degree and gas–oil ratio.

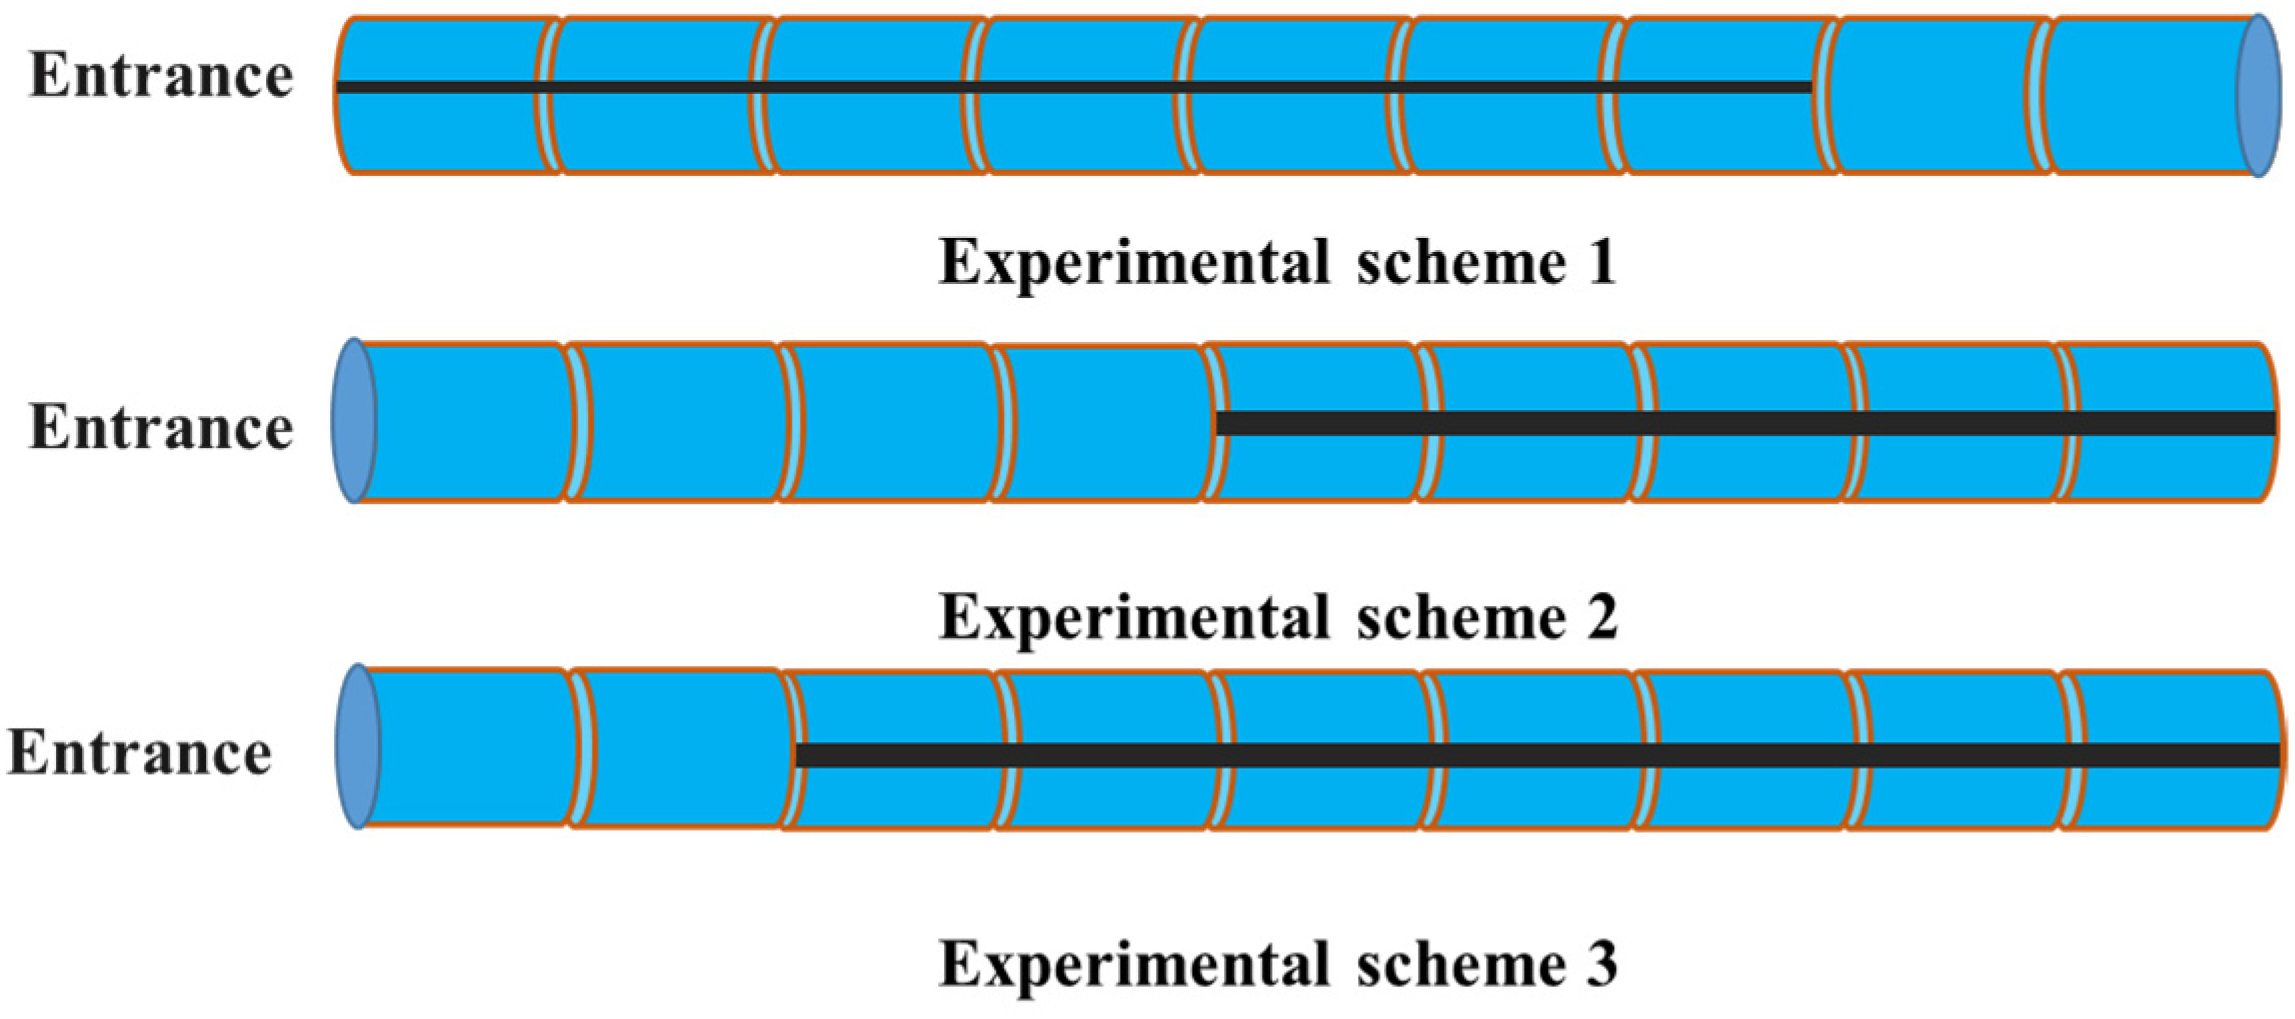
3.2. Displacement Experiment of Long Fractured Core

The following three experiments shown in Figure 1 are designed for fractures of different scales and positions to clarify their impact on the CO2 flooding. In Scheme 1 of Figure 1, there are nine cores in total, and seven cores with artificial fractures are located at the entrance. In Scheme 2, there are nine cores in total, and five cores with artificial fractures are located at the outlet. In Scheme 3, there are nine cores in total, and seven cores with artificial fractures are located at the outlet (Figure 2).
Experimental process:
  • Artificial fractures are produced in the core, and the mass and permeability of the core are measured.
  • The core is vacuumed and the saturated formation oil is weighed to calculate the volume of saturated oil.
  • Put the core into the core holder in a particular order, then set the confining pressure to be 30 MPa, drive CO2 into the rock core of the design scheme with 25 MPa constant pressure, and record the pump inlet, oil output, and gas output at different times until there is no oil output.

4. Experimental Results and Discussion

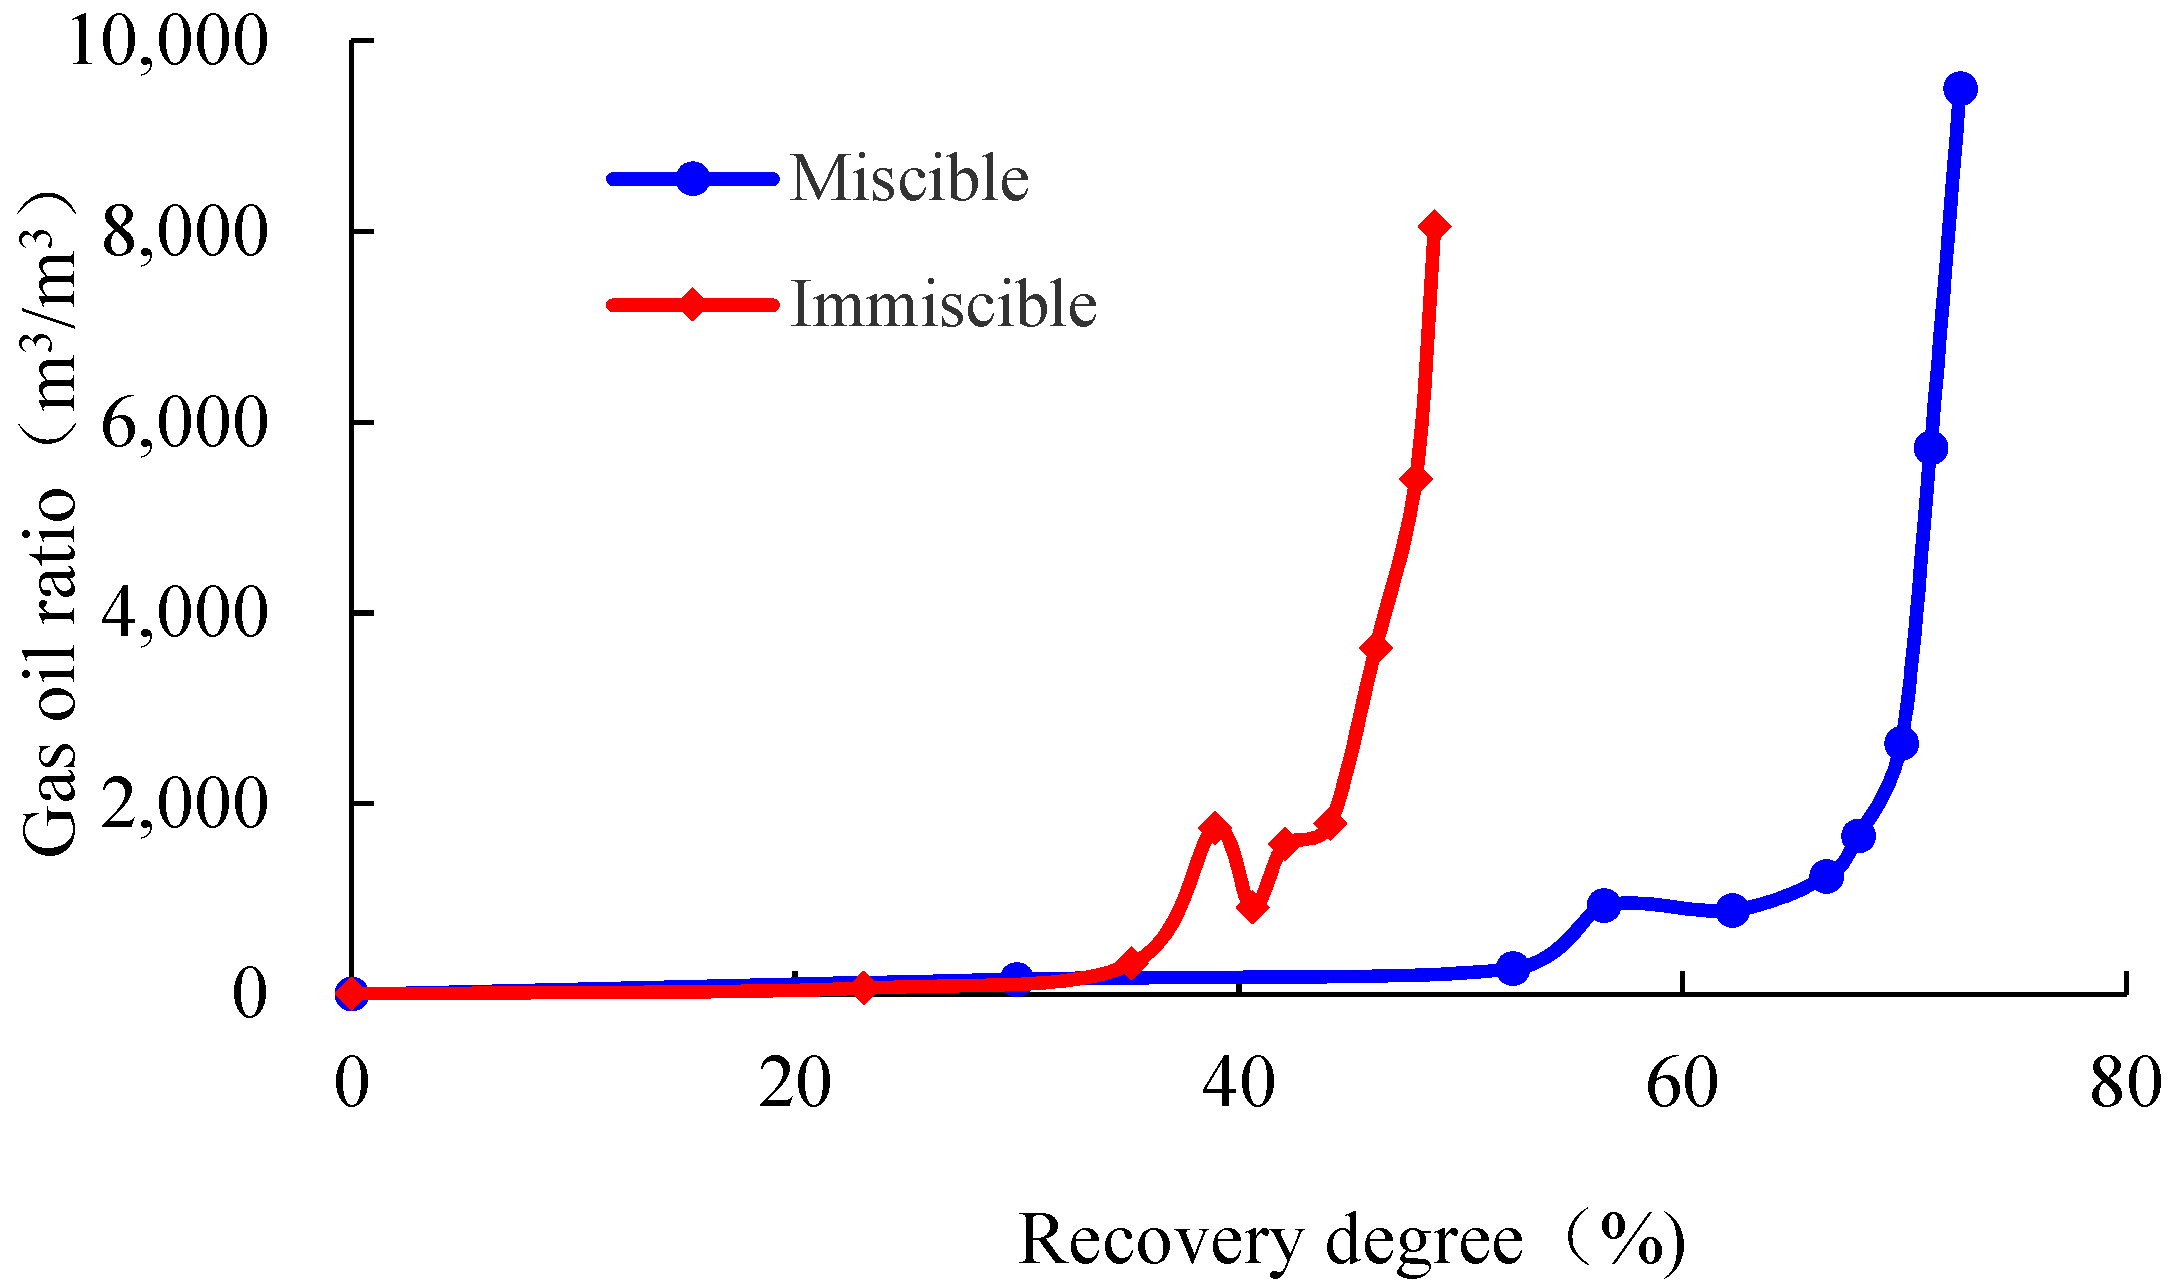
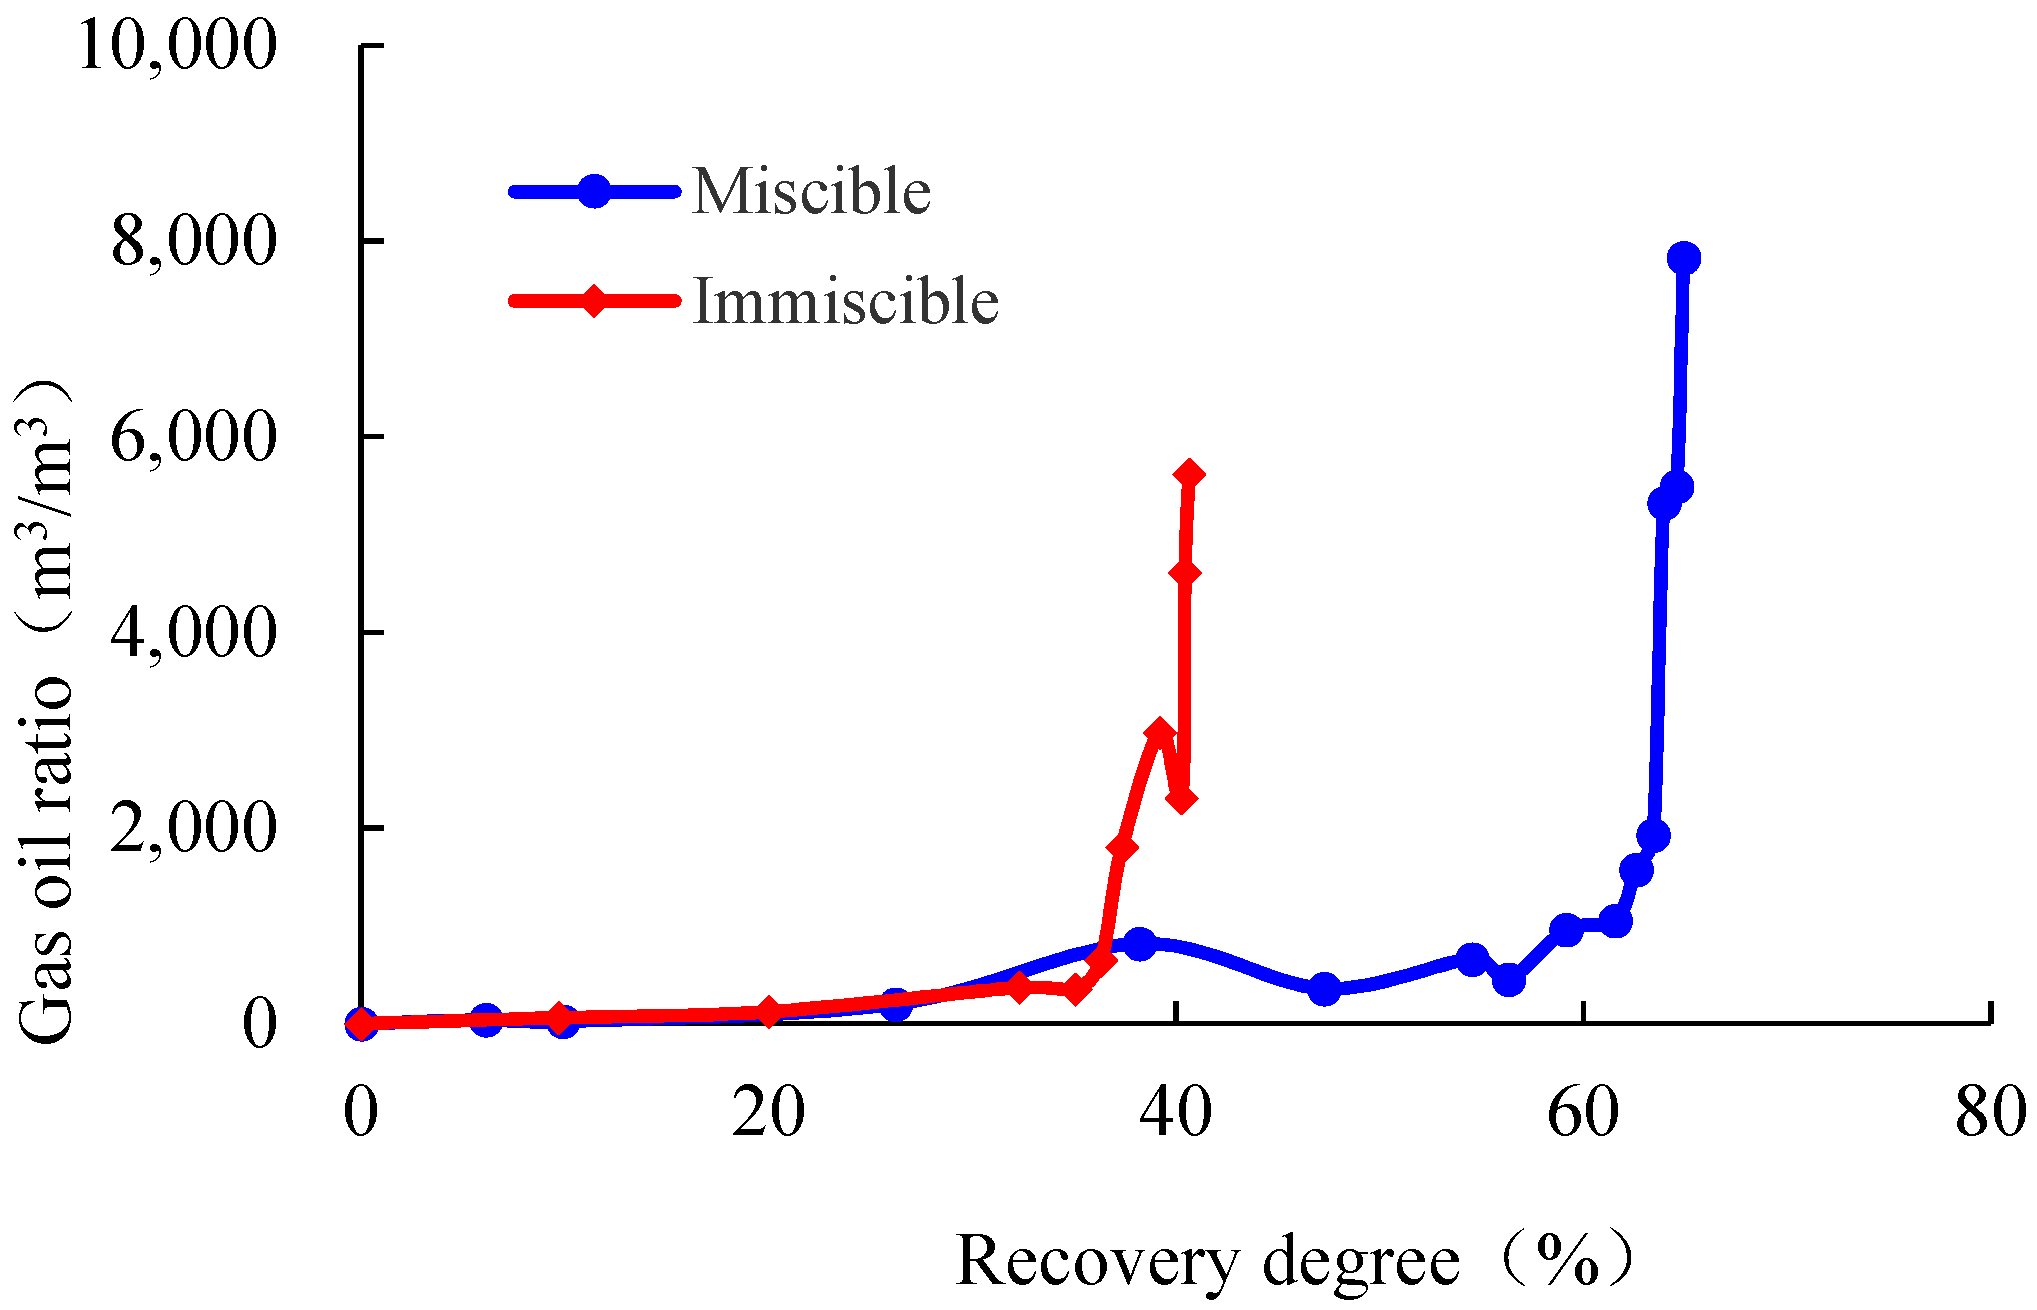
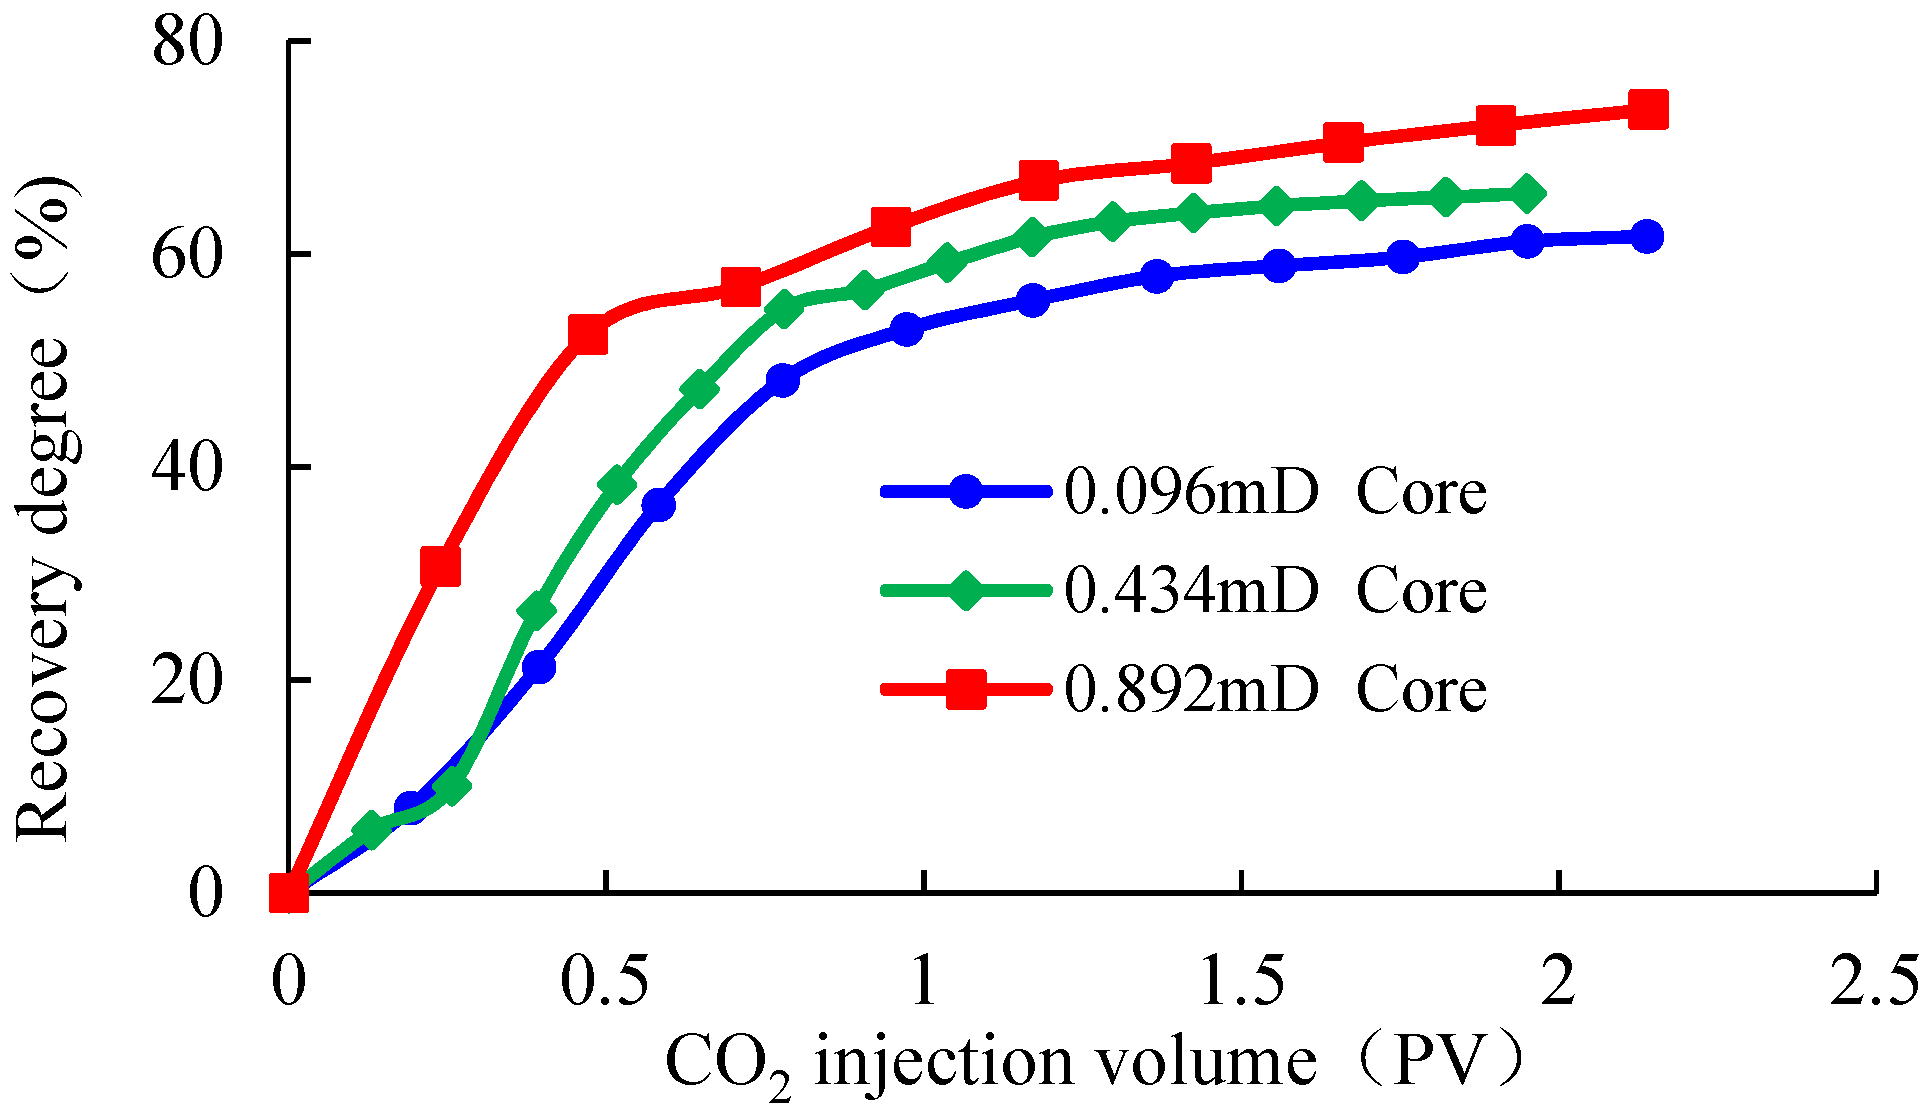
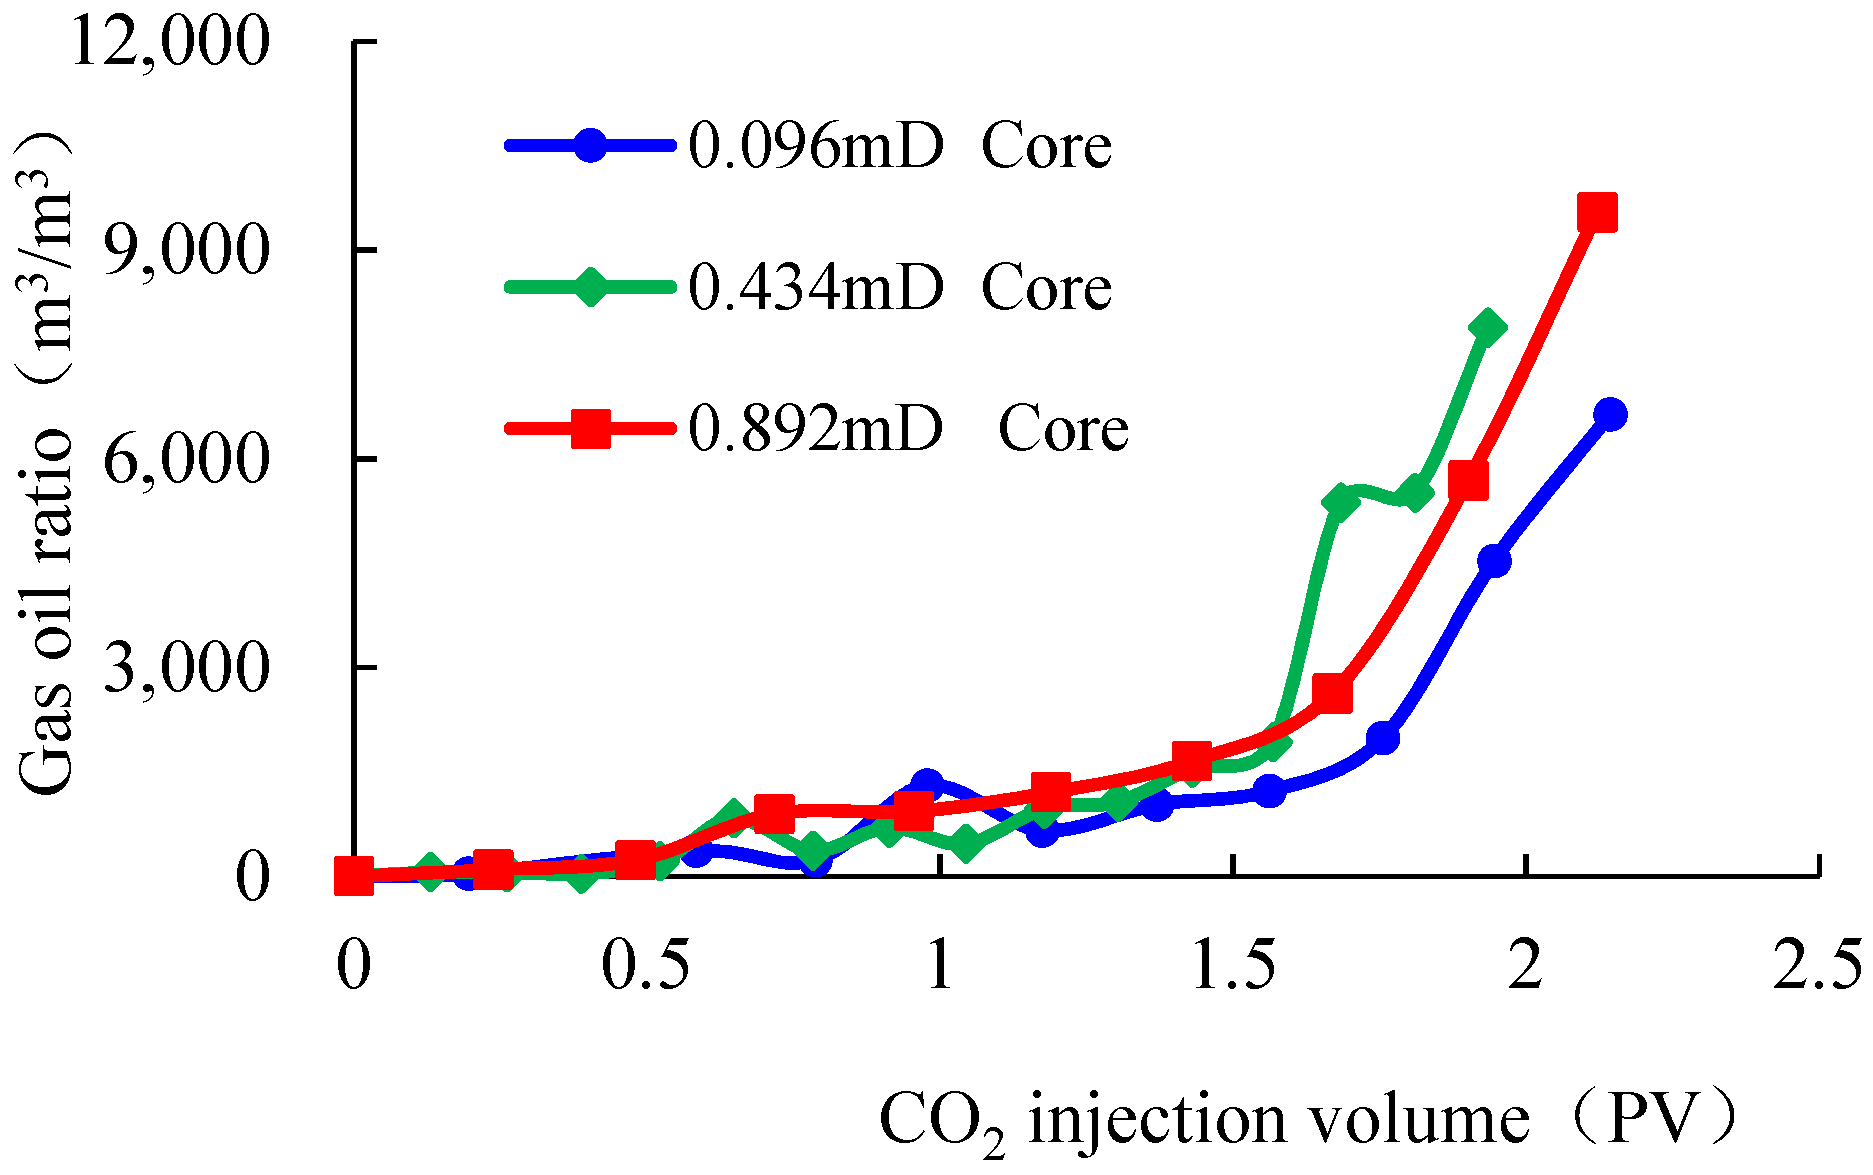
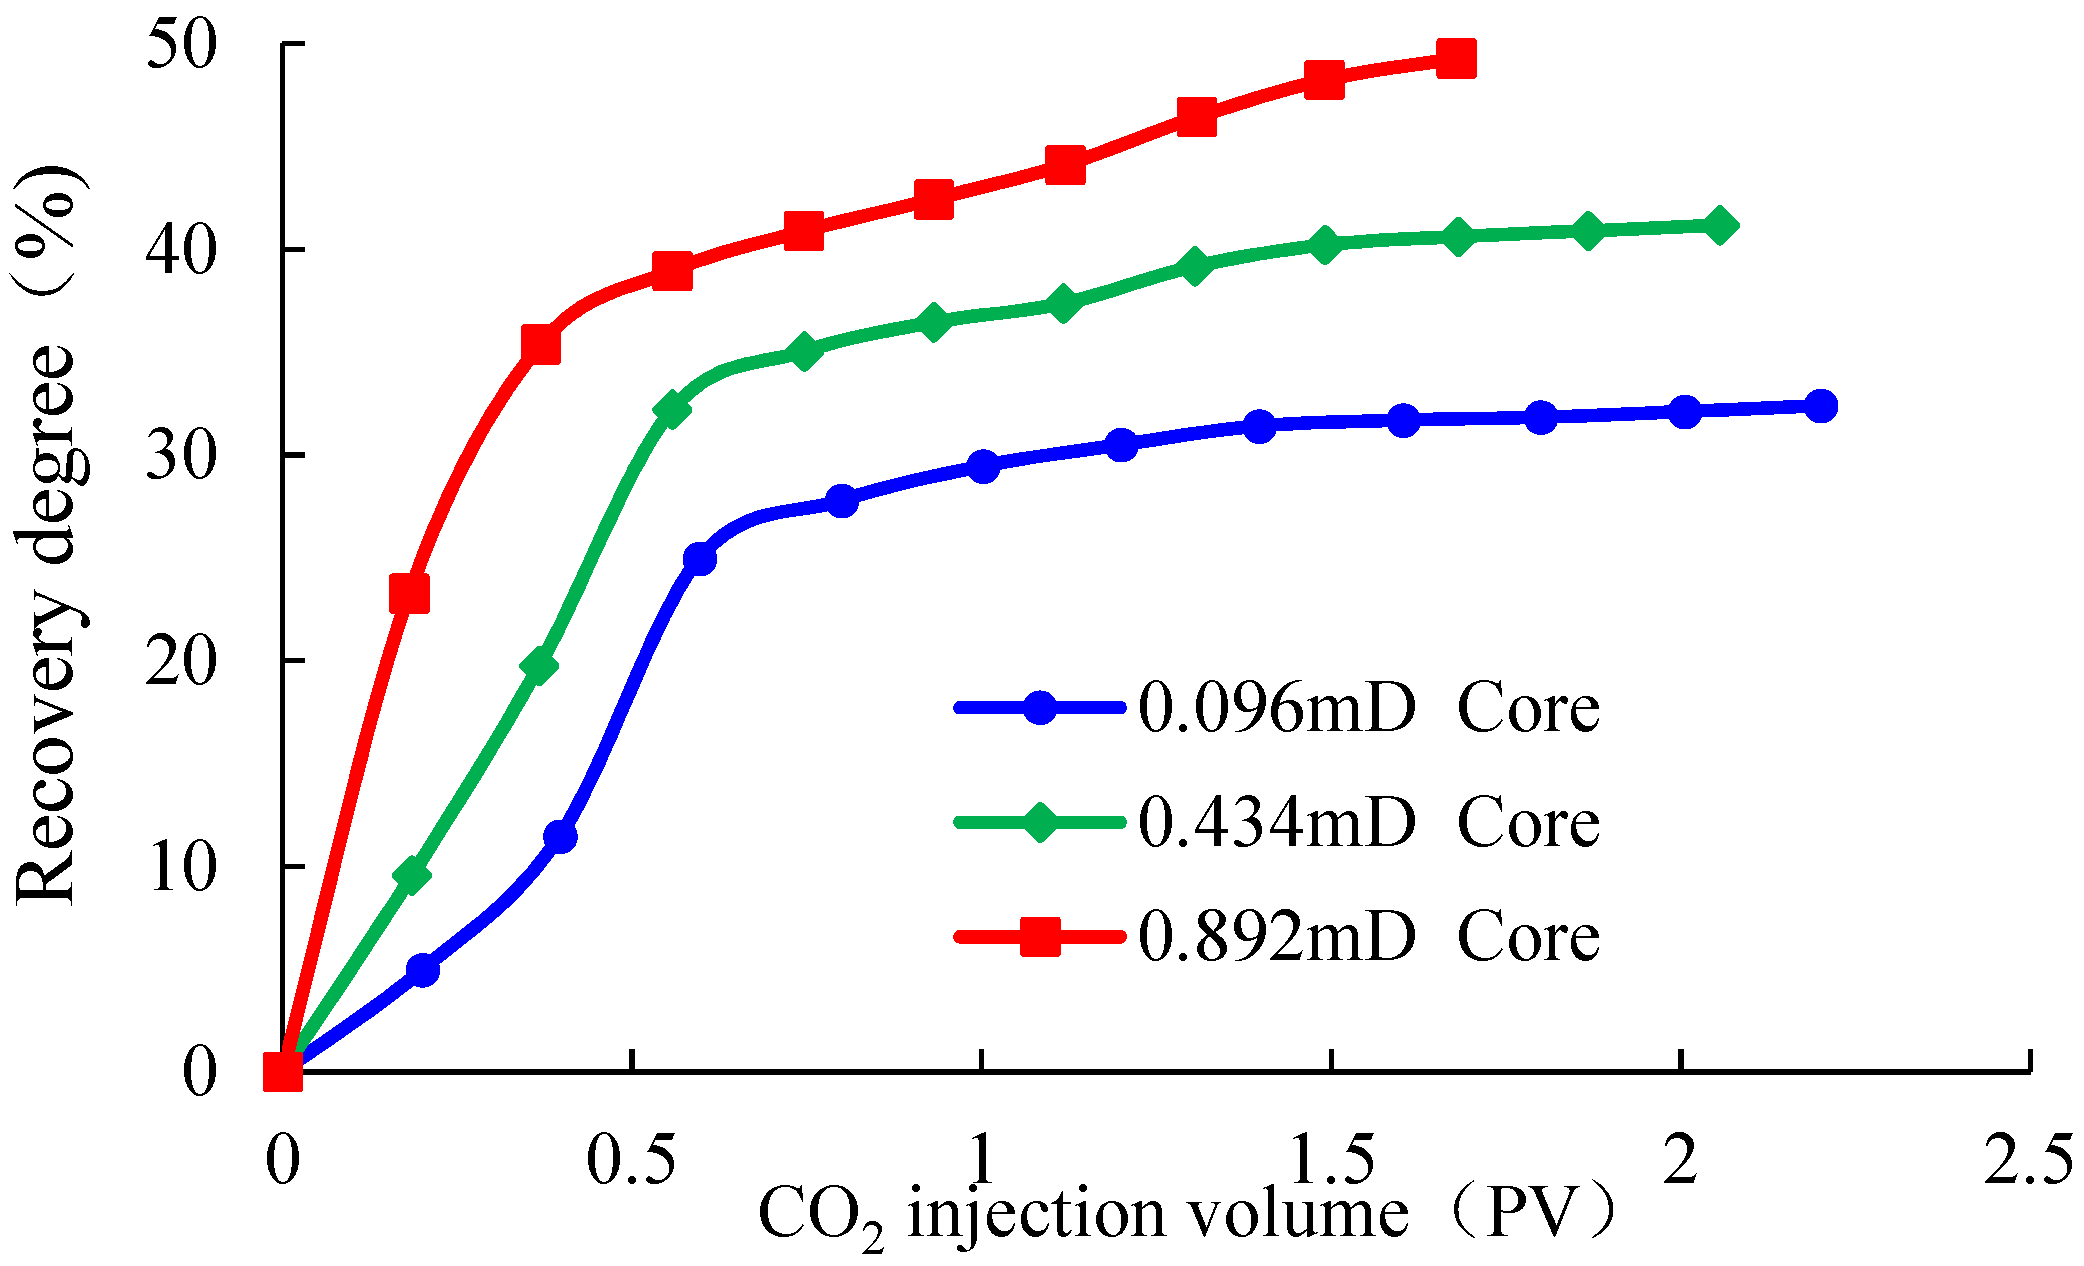
4.1. Analysis of Core Displacement Experiment Results

With an increase in recovery degree, the gas–oil ratio in the initial stage decreases. When the gas–oil ratio is greater than 2000 m3/m3, the gas–oil ratio increases rapidly, and the gas channeling of immiscible flooding occurs earlier. Correspondingly, the recovery efficiency of gas channeling is much lower than that of miscible flooding. The gas–oil ratio of miscible flooding after gas channeling is higher than that of immiscible flooding. The recovery of CO2 miscible flooding in ultra-low permeability core is 21~24% higher than that of immiscible flooding (Figure 3, Figure 4 and Figure 5).
With an increase in CO2 injection volume, the recovery degree of miscible flooding increases. However, when the injection volume is greater than 1.5 PV, the increment of recovery degree slows down. The higher the core permeability, the greater the recovery degree of miscible flooding becomes (Figure 6). Before the injected CO2 volume reaches 0.5 PV, it is at the gas-free oil production stage; the gas seeing stage is 0.5~1.5 PV, and the gas–oil ratio is less than 2000 m3/m3. After injecting about 1.5 PV gas, it enters the gas channeling stage, and the gas–oil ratio after gas channeling is 6621 m3/m3, 7843 m3/m3, and 9516 m3/m3, respectively (Figure 7).
With an increase in CO2 injection volume, the recovery degree of core immiscible flooding increases. However, when the injection volume exceeds 0.5 PV, the increment of recovery degree gradually decreases. The greater the core permeability, the higher the recovery degree of immiscible flooding becomes (Figure 8). A CO2 injection volume of 0.0 to 0.5 PV is the stage of gas-free production, and the stage of gas breakthrough is 0.5 PV~1.3 PV. The CO2 gas channeling of immiscible displacement is faster than that of miscible displacement. The gas–oil ratio is less than 2000 m3/m3. After injecting about 1.3 PV gas, it enters the gas channeling stage. The gas–oil ratio can reach 4901 m3/m3, 5566 m3/m3, and 8010 m3/m3, respectively (Figure 9).
Before CO2 breakthrough, the main oil displacement mechanisms are dissolved gas drive, CO2 extraction, and volume expansion. The mass transfer and extraction of CO2 are enhanced, with a reduction in the interfacial tension. In addition, more gas enters the small pores, and unlocks crude oil in the small pores. The viscosity of crude oil is reduced and then increases the oil mobility. After CO2 breakthrough, due to the formation of a gas-channeling channel, carbon dioxide forms a fingering phenomenon in the displacement process, resulting in the reduction of oil recovery. Therefore, the development of tight sandstone reservoir by carbon dioxide injection and the improvement of miscibility are conducive to the improvement of oil recovery.

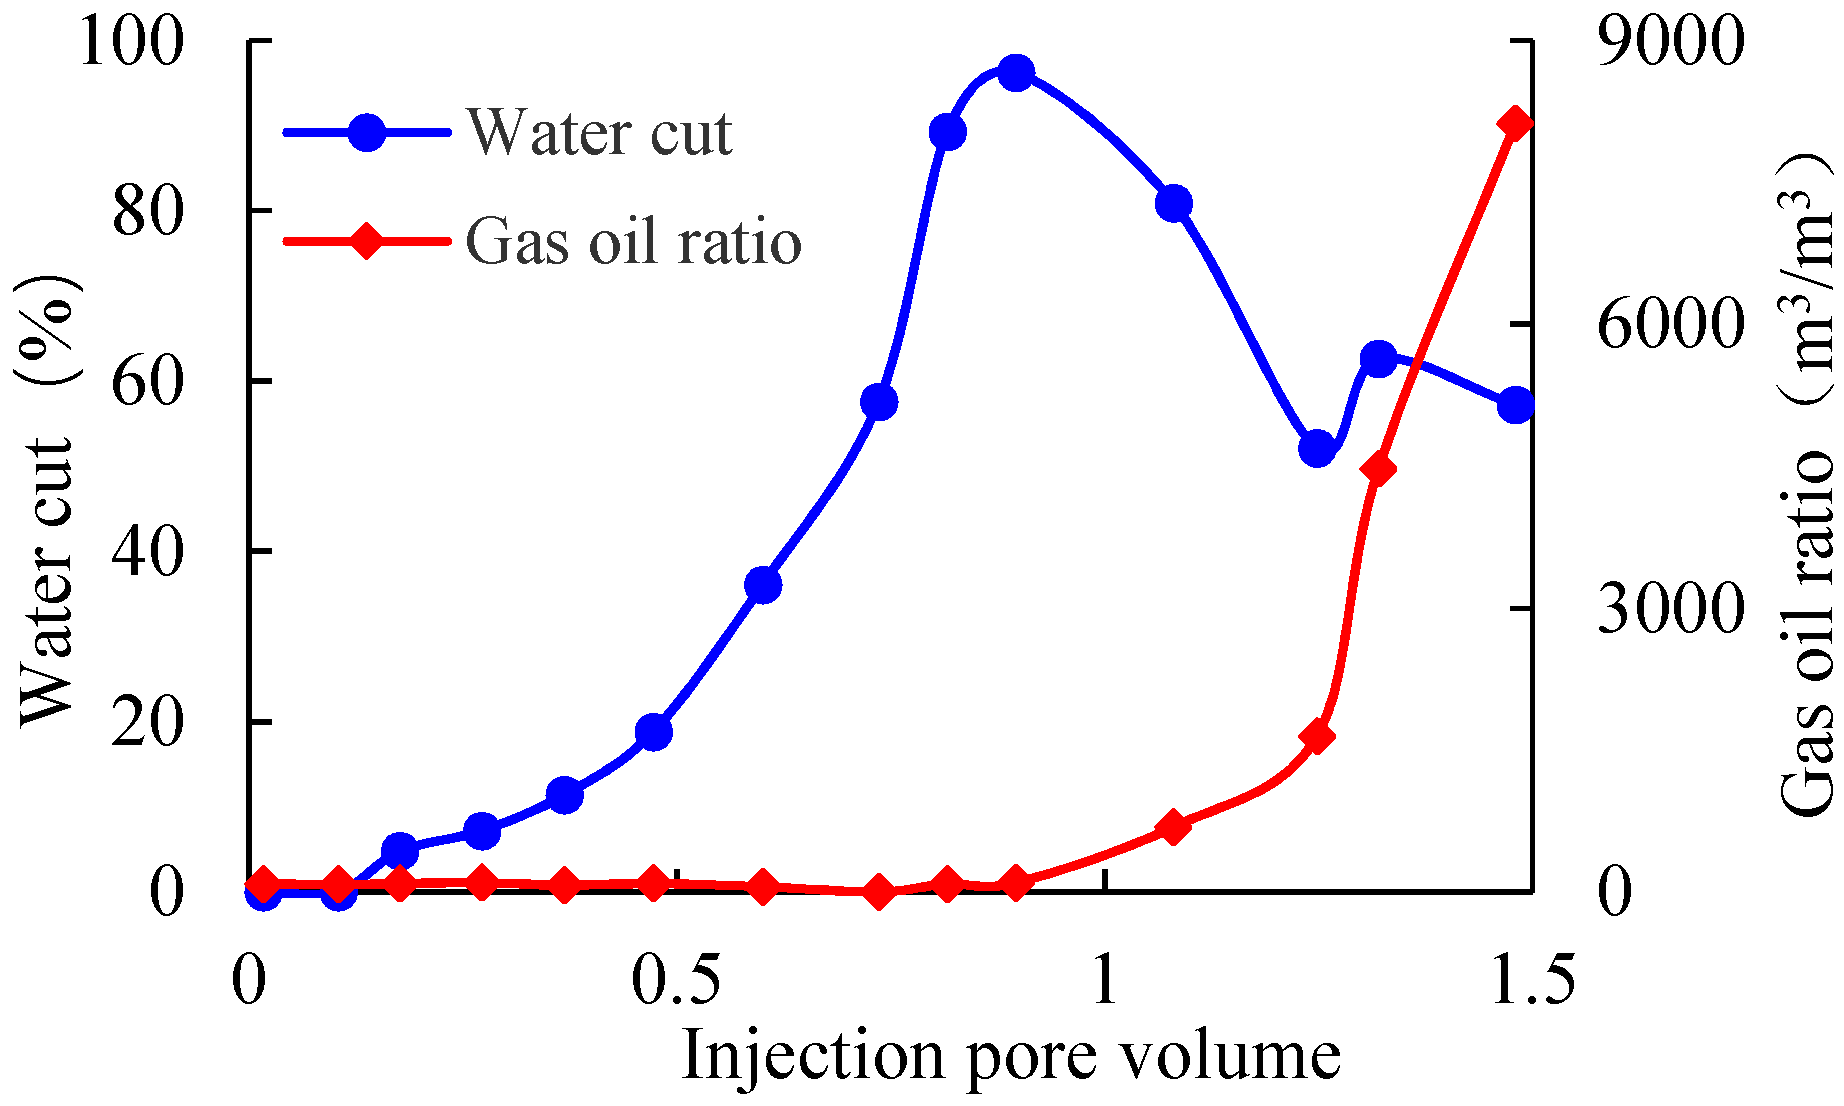
4.2. Analysis of Experimental Results of Water Drive to Gas Drive

(1)
Oil displacement of 0.45 mD core
When the injection pressure of the core is 20 MPa, and the outlet pressure is 15 MPa, the oil displacement potential of water injection to CO2 injection in 0.45 mD core is studied. With an increase in injected water volume, the recovery degree of crude oil increases. After 1.02 PV water is injected into the core, the water content reaches 91.2%, and the recovery factor is 38.21%. When the core was alternated to CO2 flooding, the water cut began to decline after a slight increase. After injecting 0.47 PV of gas, the gas broke through, and the recovery reached 46.53%, which was 8.32% higher than that of water injection (Figure 10 and Figure 11). When the core was injected with CO2 again, the recovery increased slightly.
(2)
Oil displacement of 0.98 mD core
The oil displacement potential of 0.98 mD core under the condition of water injection to gas injection is studied. After 0.82 PV is injected into the water drive stage. The water content reaches 89.3%, and the recovery degree is 55.31%. When the displacement method is altered to CO2 flooding, the water cut increases by 6% after gas injection and decreases rapidly. After gas injection of 0.45 PV, the gas breakthrough occurs. At this time, the recovery is 71.42%, which is 16.11% higher than that of water injection (Figure 12 and Figure 13). The recovery increment of CO2 injection in 0.45 md core is small.
During the process of water-injection development of an ultra-low permeability reservoir, water can easily enter the larger pores, then drives out the crude oil in the large pores instead of the oil contained in micropore spaces, which apparently results in a low recovery degree. CO2 has a strong fluidity compared with water and can easily enter the micropores, so as to drive out the original oil in the pores and achieve the purpose of enhanced oil recovery. Water helps to increase the oil scavenging area of carbon dioxide and reduce the channeling of carbon dioxide. The injected carbon dioxide is mixed with crude oil, which reduces the interfacial tension between oil and water and the viscosity of crude oil, and improves the fluidity of crude oil. Therefore, in the high water cut stage of ultra-low permeability reservoir, the conversion of water injection to CO2 injection can not only reduce the water cut but also improve the degree of crude oil recovery.

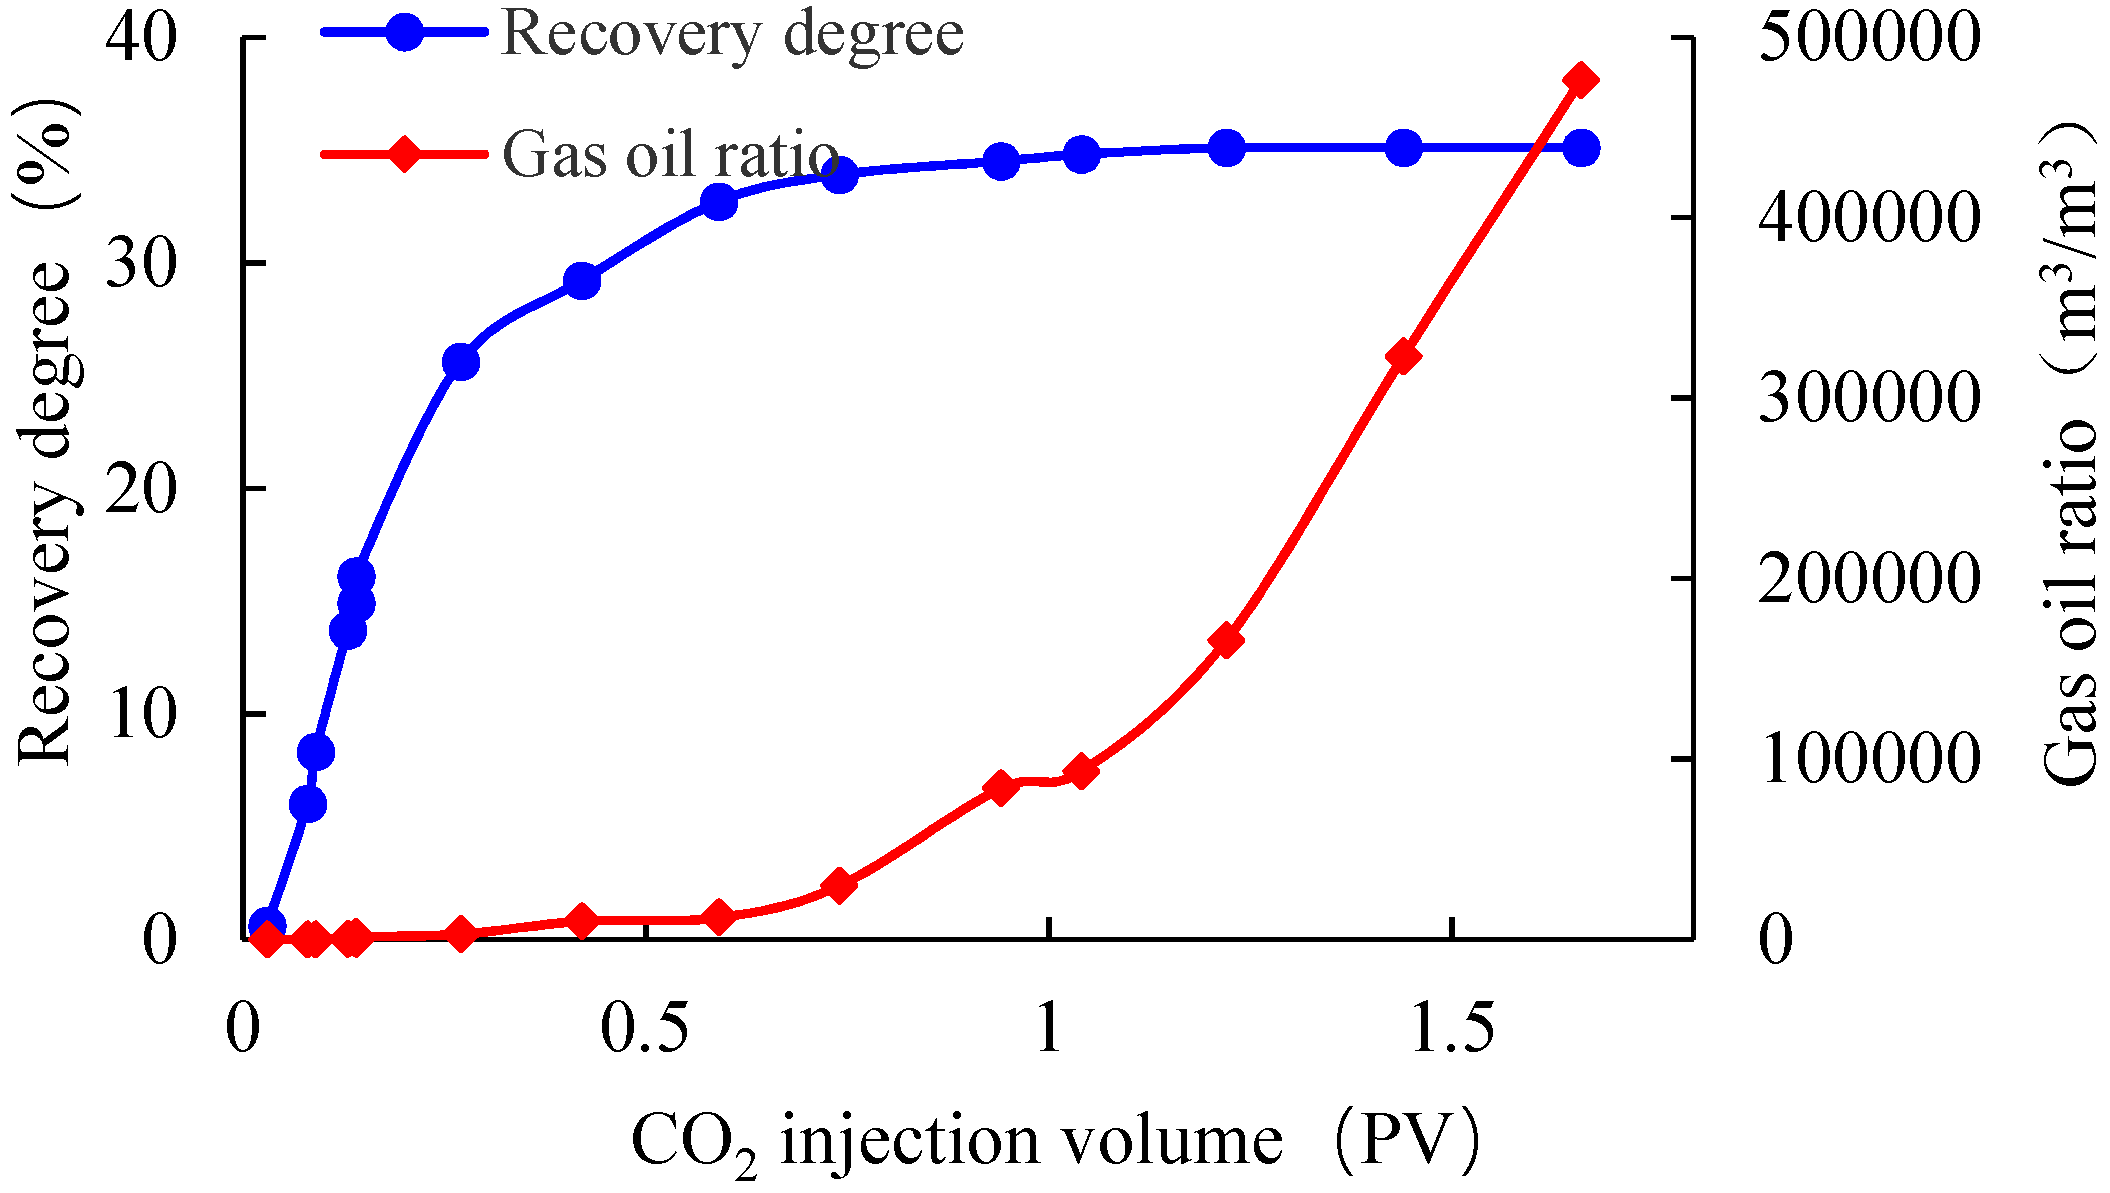
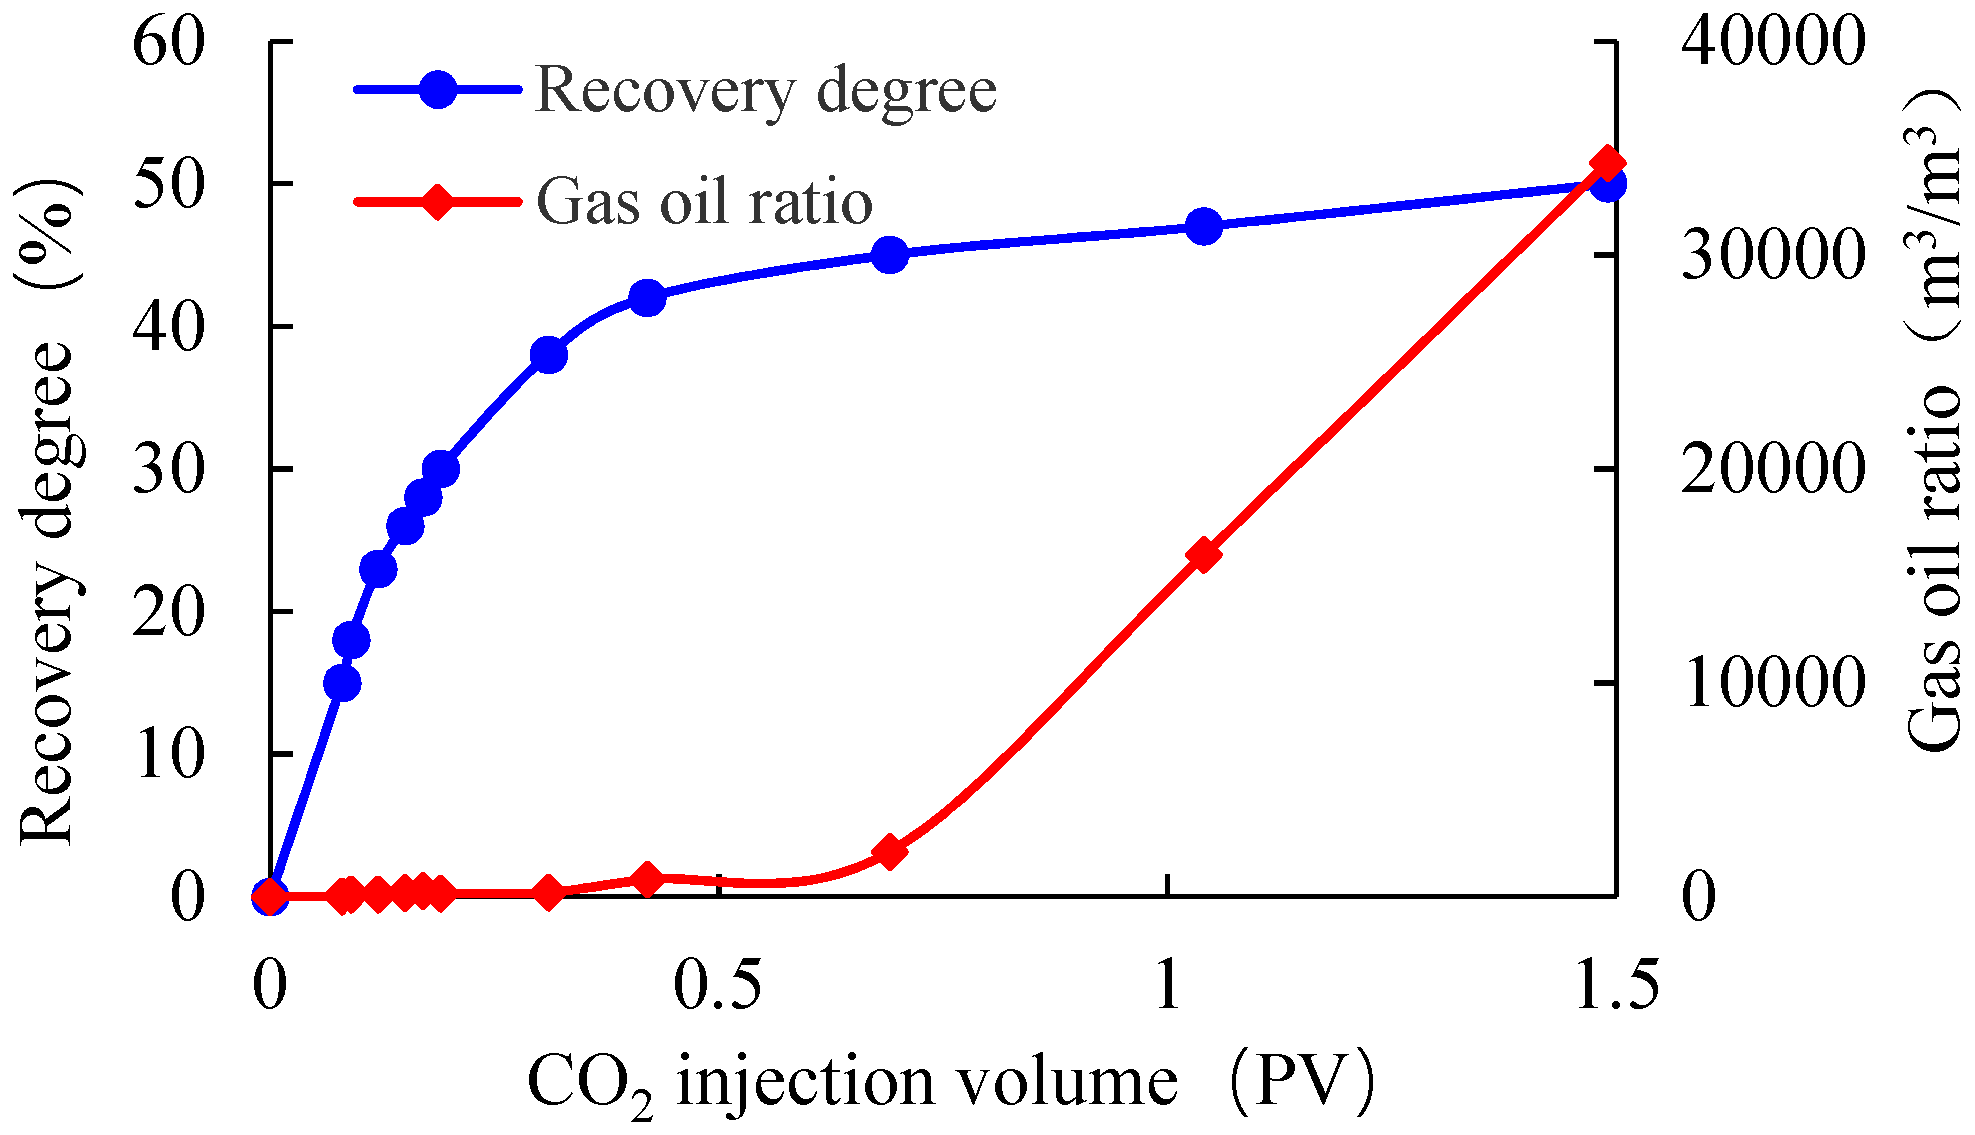
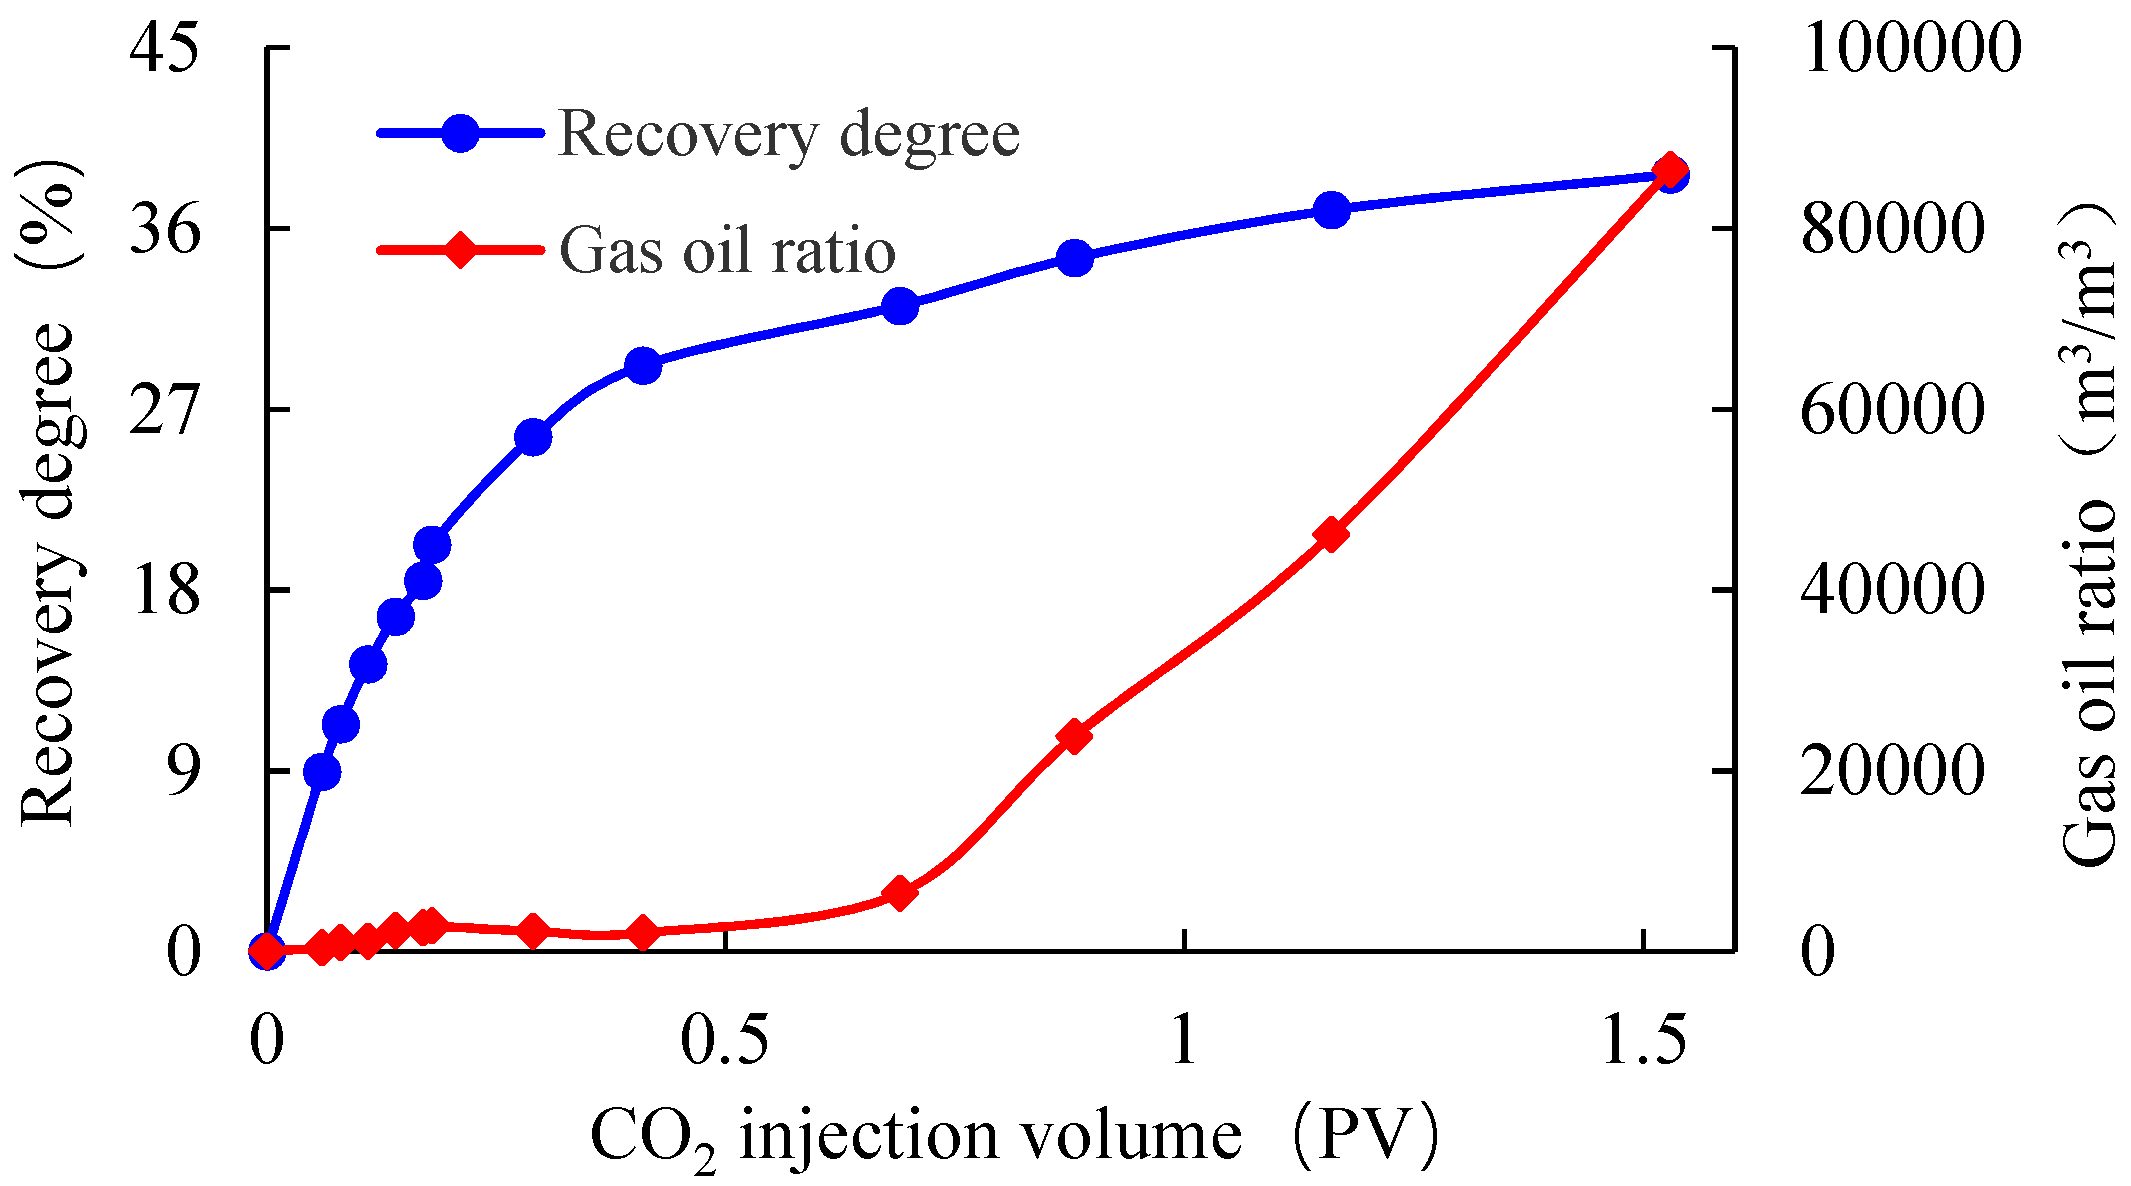
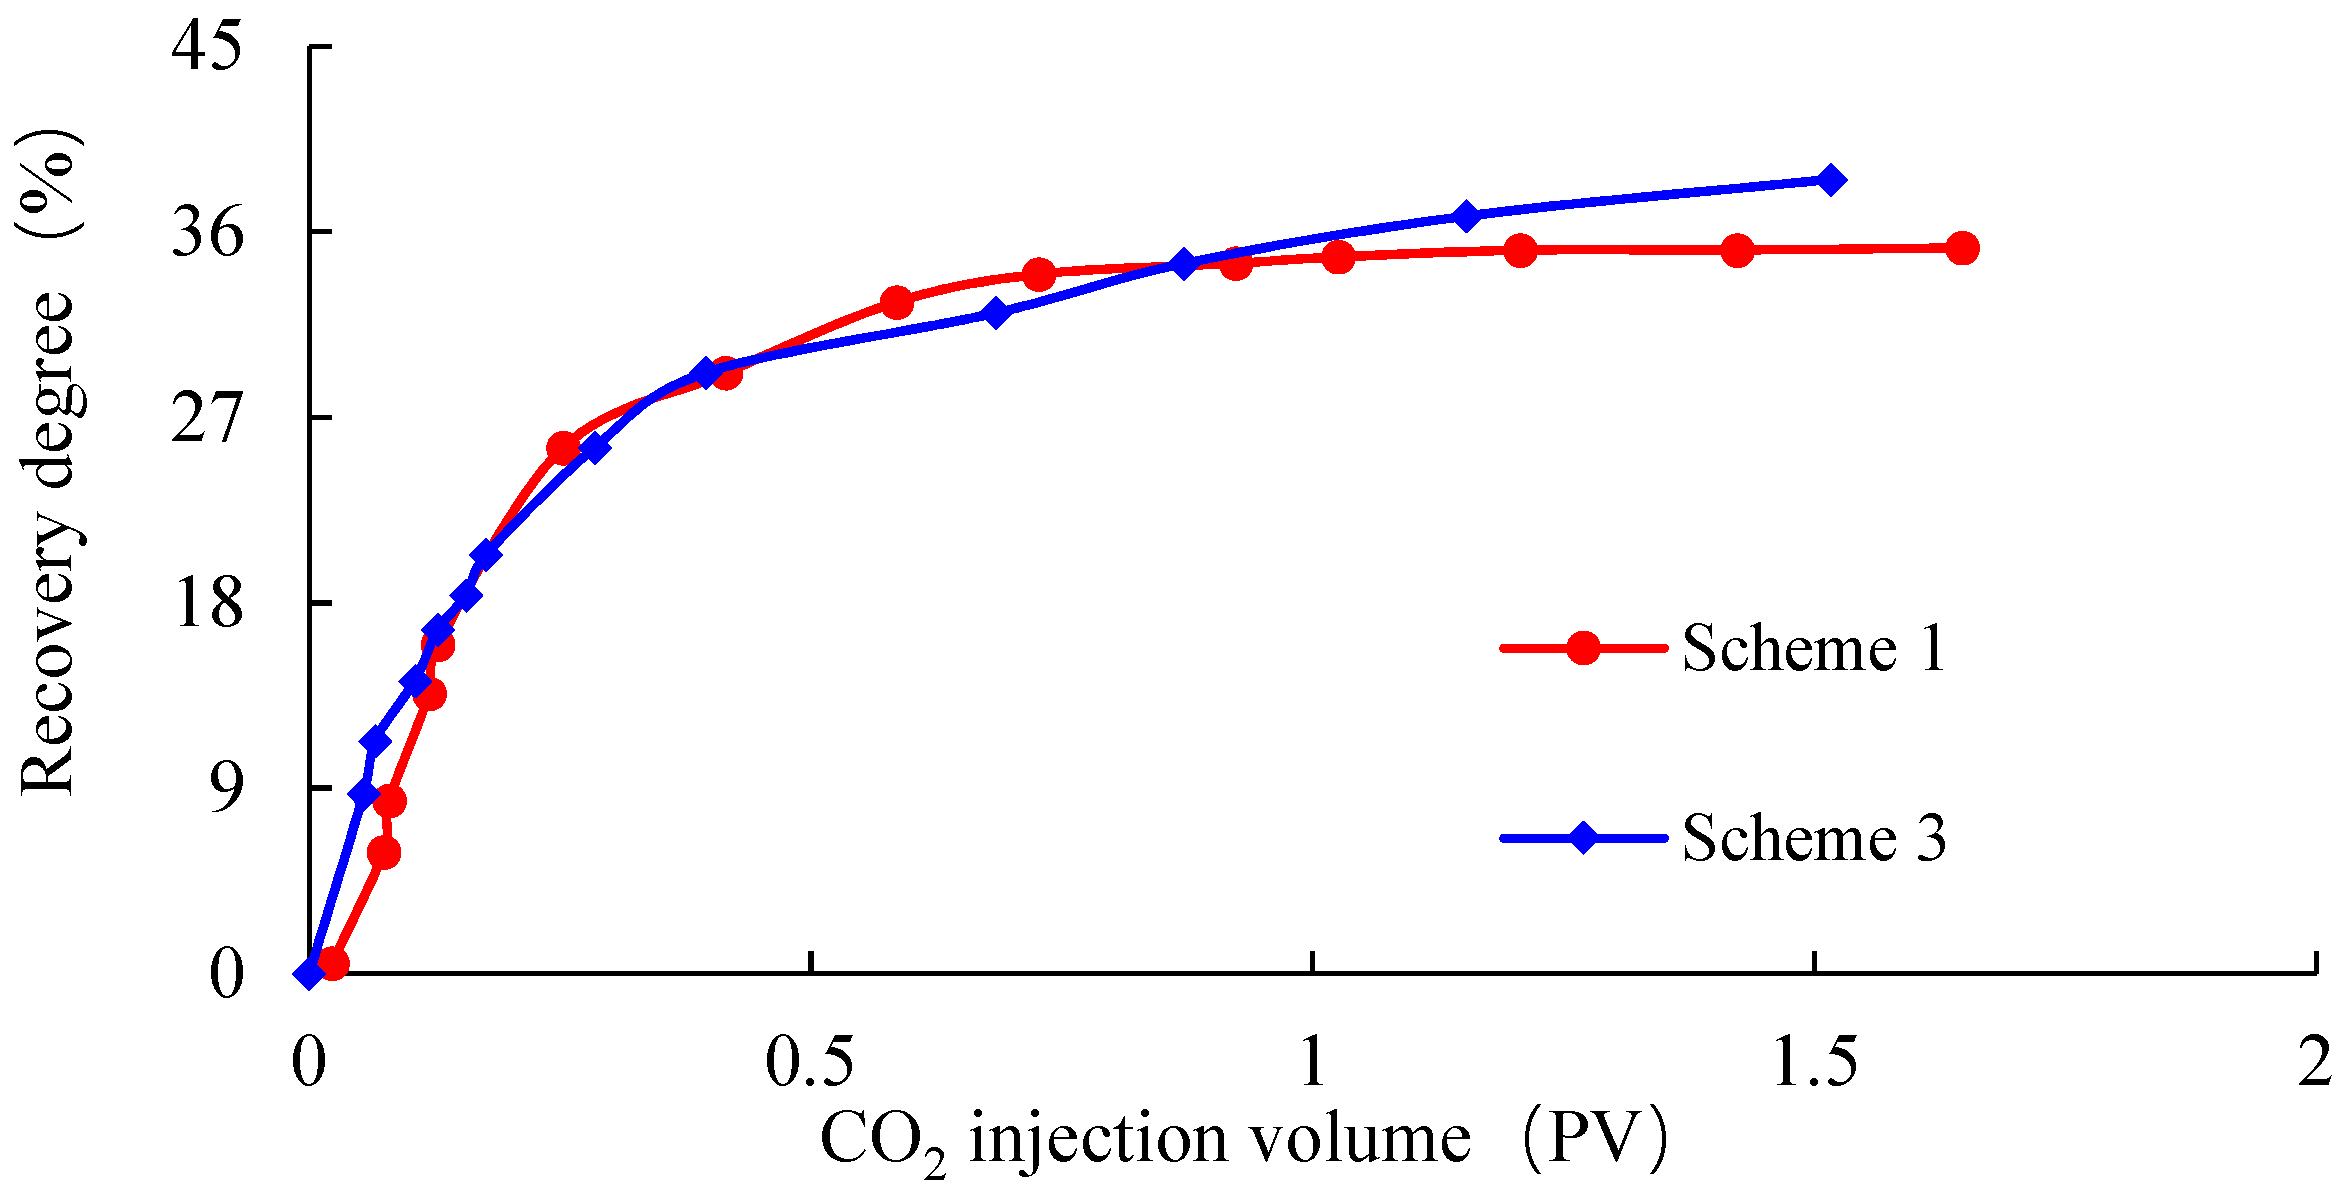
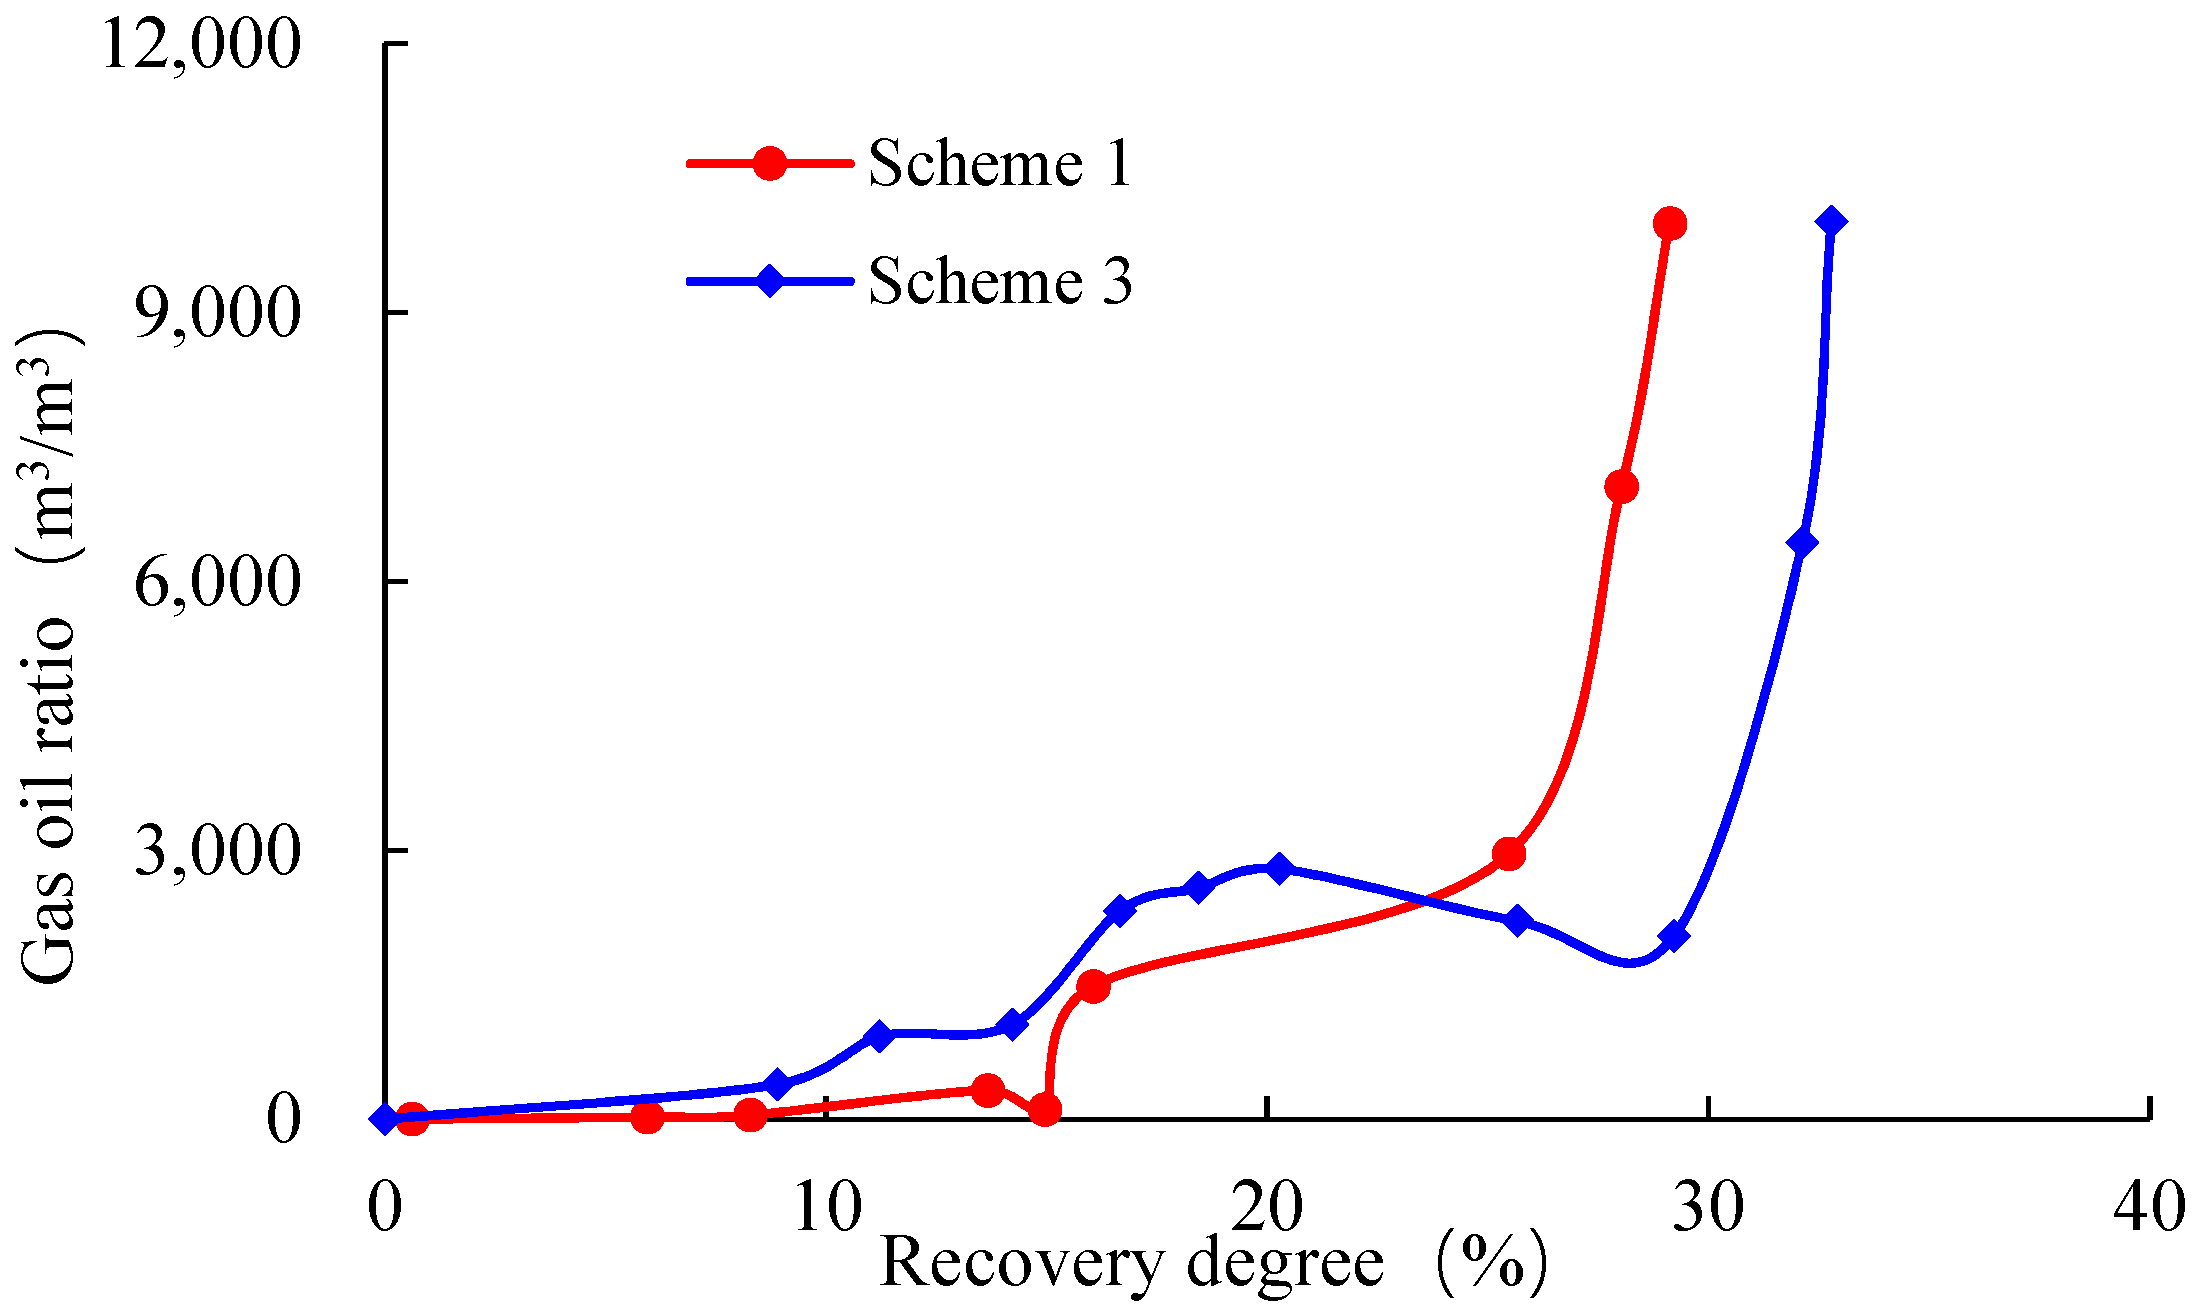
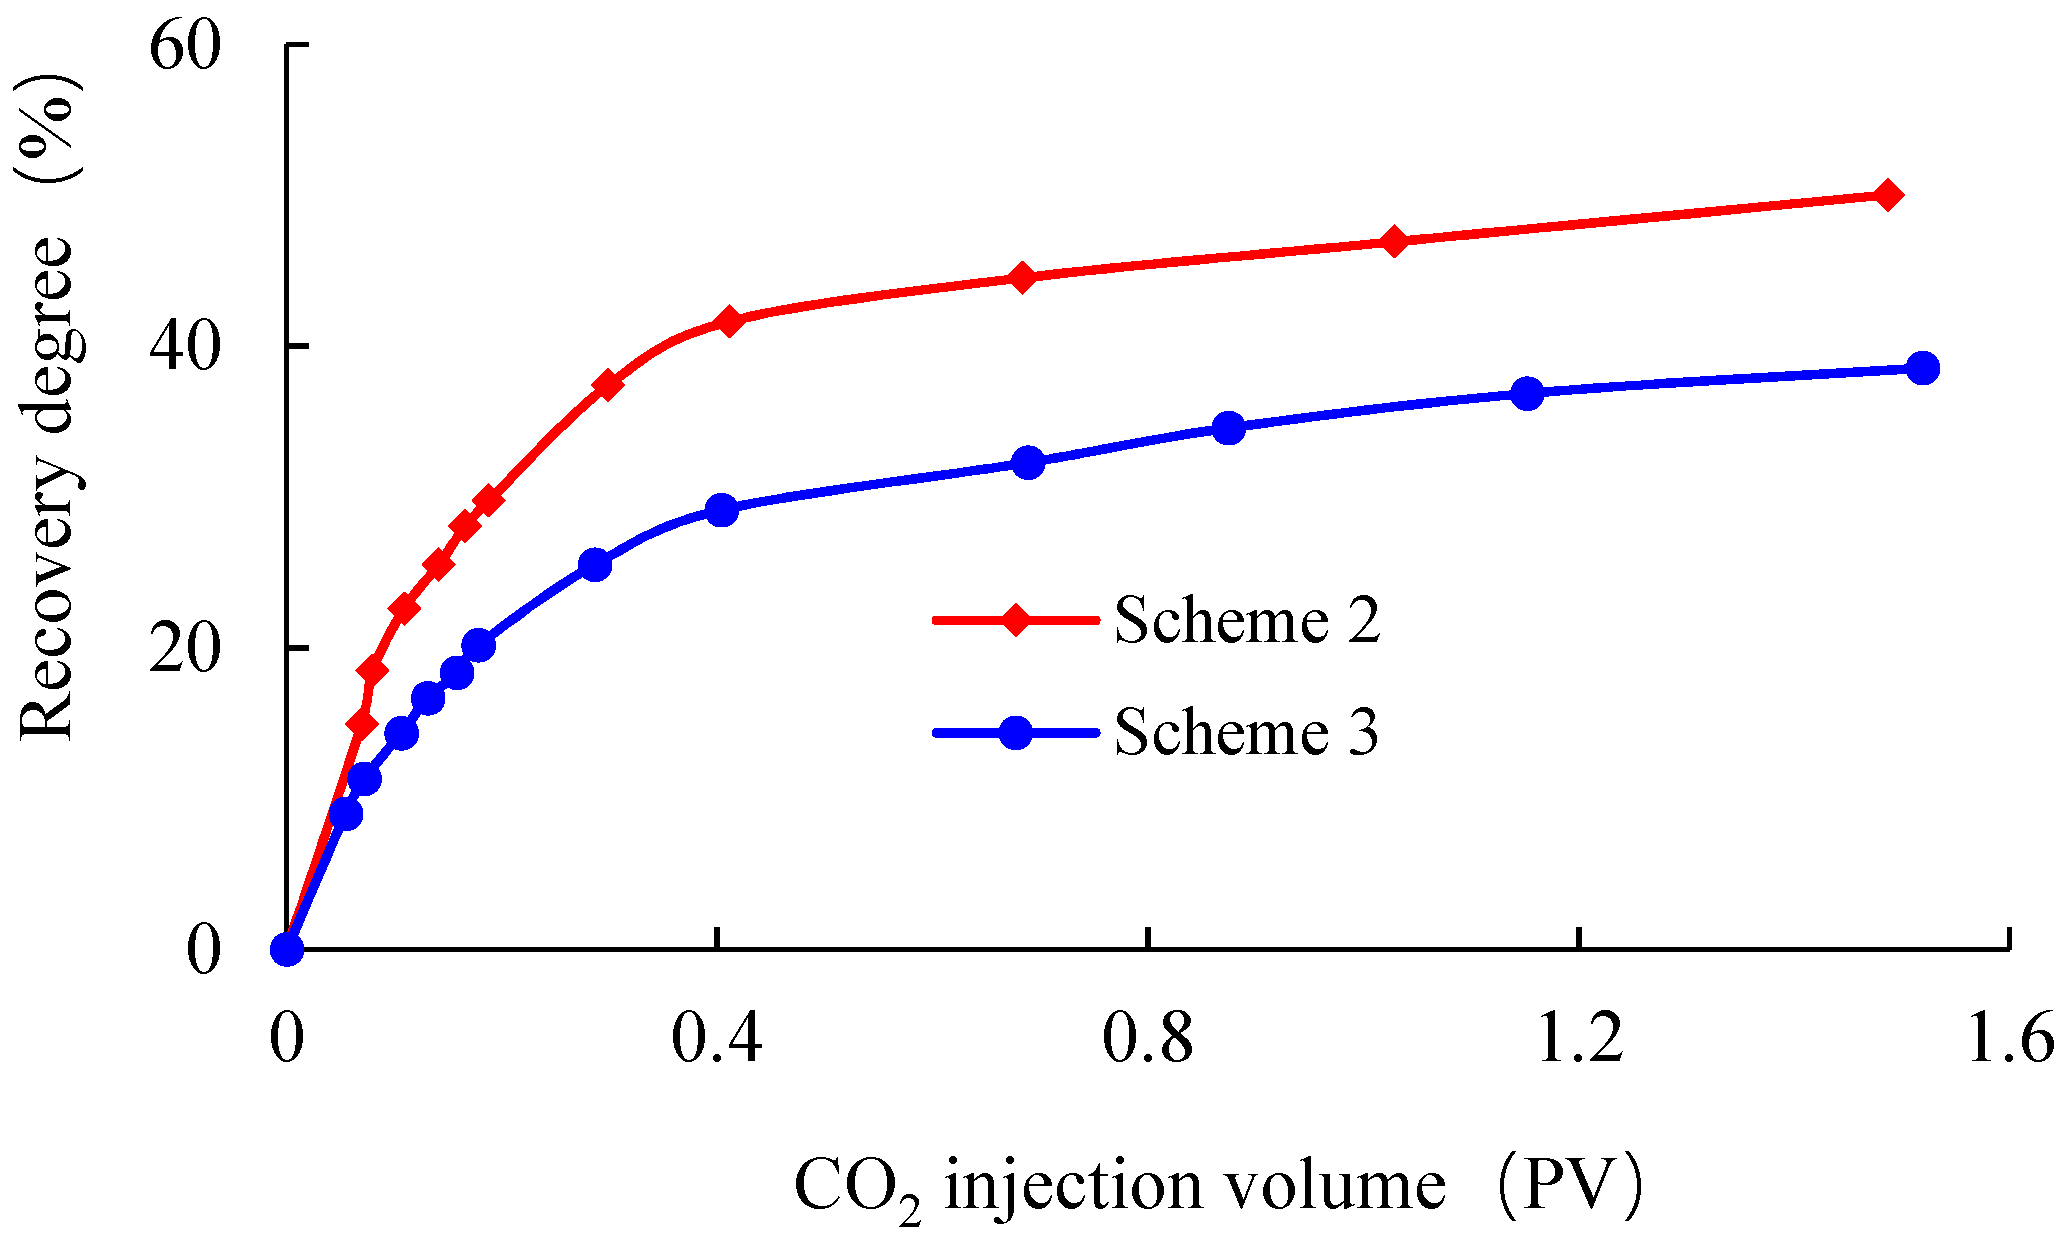
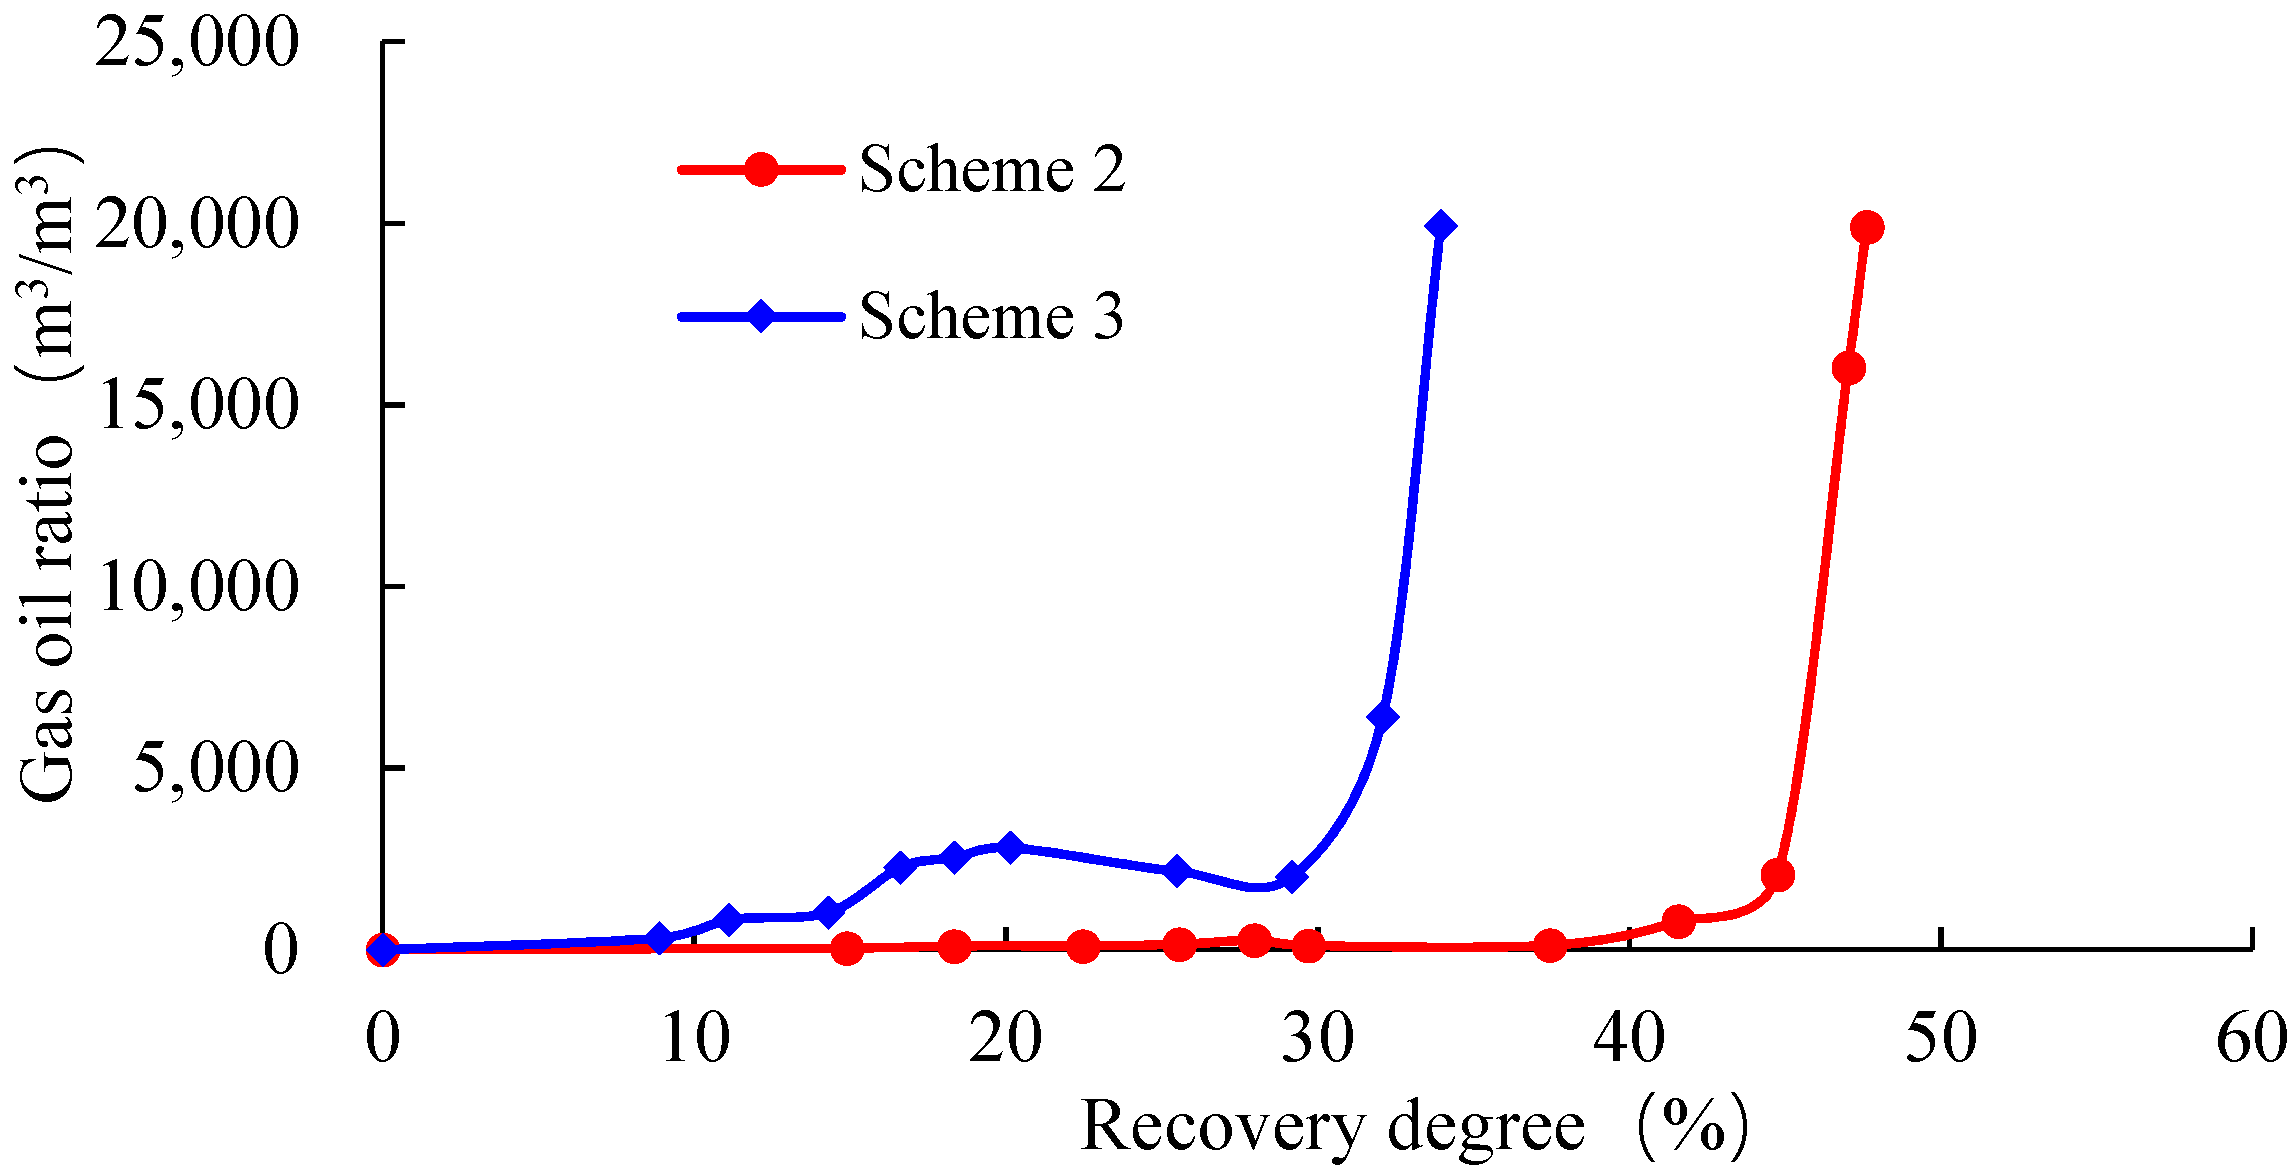
4.3. Analysis of Displacement Test Results of Fractured Core

(1)
Scheme 1 core oil displacement efficiency.
The core injection pressure is 25 MPa and the outlet pressure is 15 MPa. CO2 and crude oil should be in a miscible state. The gas channeling of seven cores with artificial fractures at the inlet end under miscible conditions is studied. With an increase in CO2 injection volume, the recovery degree and gas–oil ratio increase (Figure 14). When 0.74 PV of CO2 is injected, the recovery degree of CO2 displacement in the fractured long core is 33.9%. With a continuous increase in injected CO2 volume, the increase of recovery degree is gentle. After the injection amount reaches 0.74 PV, the core gas channeling, and the gas–oil ratio is about 29,750 m3/m3. Then the gas–oil ratio rises rapidly. After the gas channeling, we continue to inject 0.92 PV CO2, and the recovery degree is only increased by about 1.2%.
(2)
Analysis of core oil displacement efficiency in Scheme 2.
The gas channeling of five cores with artificial fractures at the outlet under miscible conditions is studied. The experimental conditions are the same as in Scheme 1. With an increase in CO2 injection volume, the core recovery degree and gas oil ratio also increases (Figure 15). When CO2 is injected at 0.69 PV, the recovery degree of CO2 flooding in the fractured long core is 45%. When CO2 is injected continuously, gas channeling occurs in the core, and the gas oil ratio is about 2096 m3/m3. Then the gas–oil ratio rises rapidly. After gas channeling, 0.8 PV CO2 gas is injected continuously, the gas–oil ratio is about 34,290 m3/m3, and the recovery factor is only increased by about 5%.
(3)
Analysis of core oil displacement efficiency in Scheme 3.
The experimental conditions are the same as Scheme 1 (Figure 16). With an increase in CO2 injection volume, the core recovery degree and gas oil ratio increase, which is similar to Scheme 1 and Scheme 2. When CO2 of 0.71 PV, the recovery degree of long fracture core experiment is 32.14%. When CO2 is injected continuously, gas channeling occurs in the core, and the gas oil ratio is about 6435 m3/m3. After that, the gas–oil ratio rises rapidly. After gas channeling, 0.84 PV CO2 gas is injected continuously, and the gas–oil ratio is about 86,450 m3/m3, and the recovery factor is only increased by about 6.55%.
The matrix core of Scheme 1 is located at the outlet. CO2 is produced late at the outlet end, which can inhibit gas channeling. The gas–oil ratio during gas channeling is 3000~4000 m3/m3. The recovery degree of Scheme 1 is slightly lowered. After gas channeling, some crude oil is still produced in Scheme 2, and the recovery factor is 4% higher than Scheme 1. The fracture location has little impact on the CO2 oil displacement (Figure 17 and Figure 18).
By analyzing the CO2 displacement characteristics with different fracture lengths, it can be seen that the larger the fracture scale, the lower the core oil displacement efficiency. The ultimate recovery degree of Scheme 2 is 51%, and that of Scheme 3 is 39%, which is 12% lower than that of Scheme 2. The larger the fracture scale, the shorter the gas channeling time, and the greater the production gas oil ratio with the same recovery degree (Figure 19 and Figure 20).
Fractures provide favorable flow channels for both oil and gas. The existence of fractures increases the contact area between CO2 and crude oil. During oil production, the resistance of crude oil seepage decreases. CO2 first flows along the fractures, mainly producing crude oil in the macropores around the fractures. The large capillary pressure caused by the small size of pores seriously impedes the flow of crude oil out of the matrix. The pressure in the fractures decreases slowly. The crude oil in the matrix flows to the fractures under the action of differential pressure. The CO2 has a strong extraction ability, and it plays an important role during the development of ultra-low permeability reservoirs. Light and medium hydrocarbons in crude oil are extracted in the gas phase. The saturation of crude oil in the matrix is different from that in the fracture, and crude oil flows from the matrix to the fracture. However, the uneven distribution of fractures in the formation will aggravate the occurrence of gas channeling and reduce the development effect of gas flooding. The sweep volume is difficult to expand, and the EOR effect is poor. The development of ultra-low permeability reservoir by CO2 injection needs to set a reasonable fracture penetration ratio, prolong the soak time, and improve CO2 extraction and differential diffusion of the crude oil concentration.

5. Conclusions

(1)
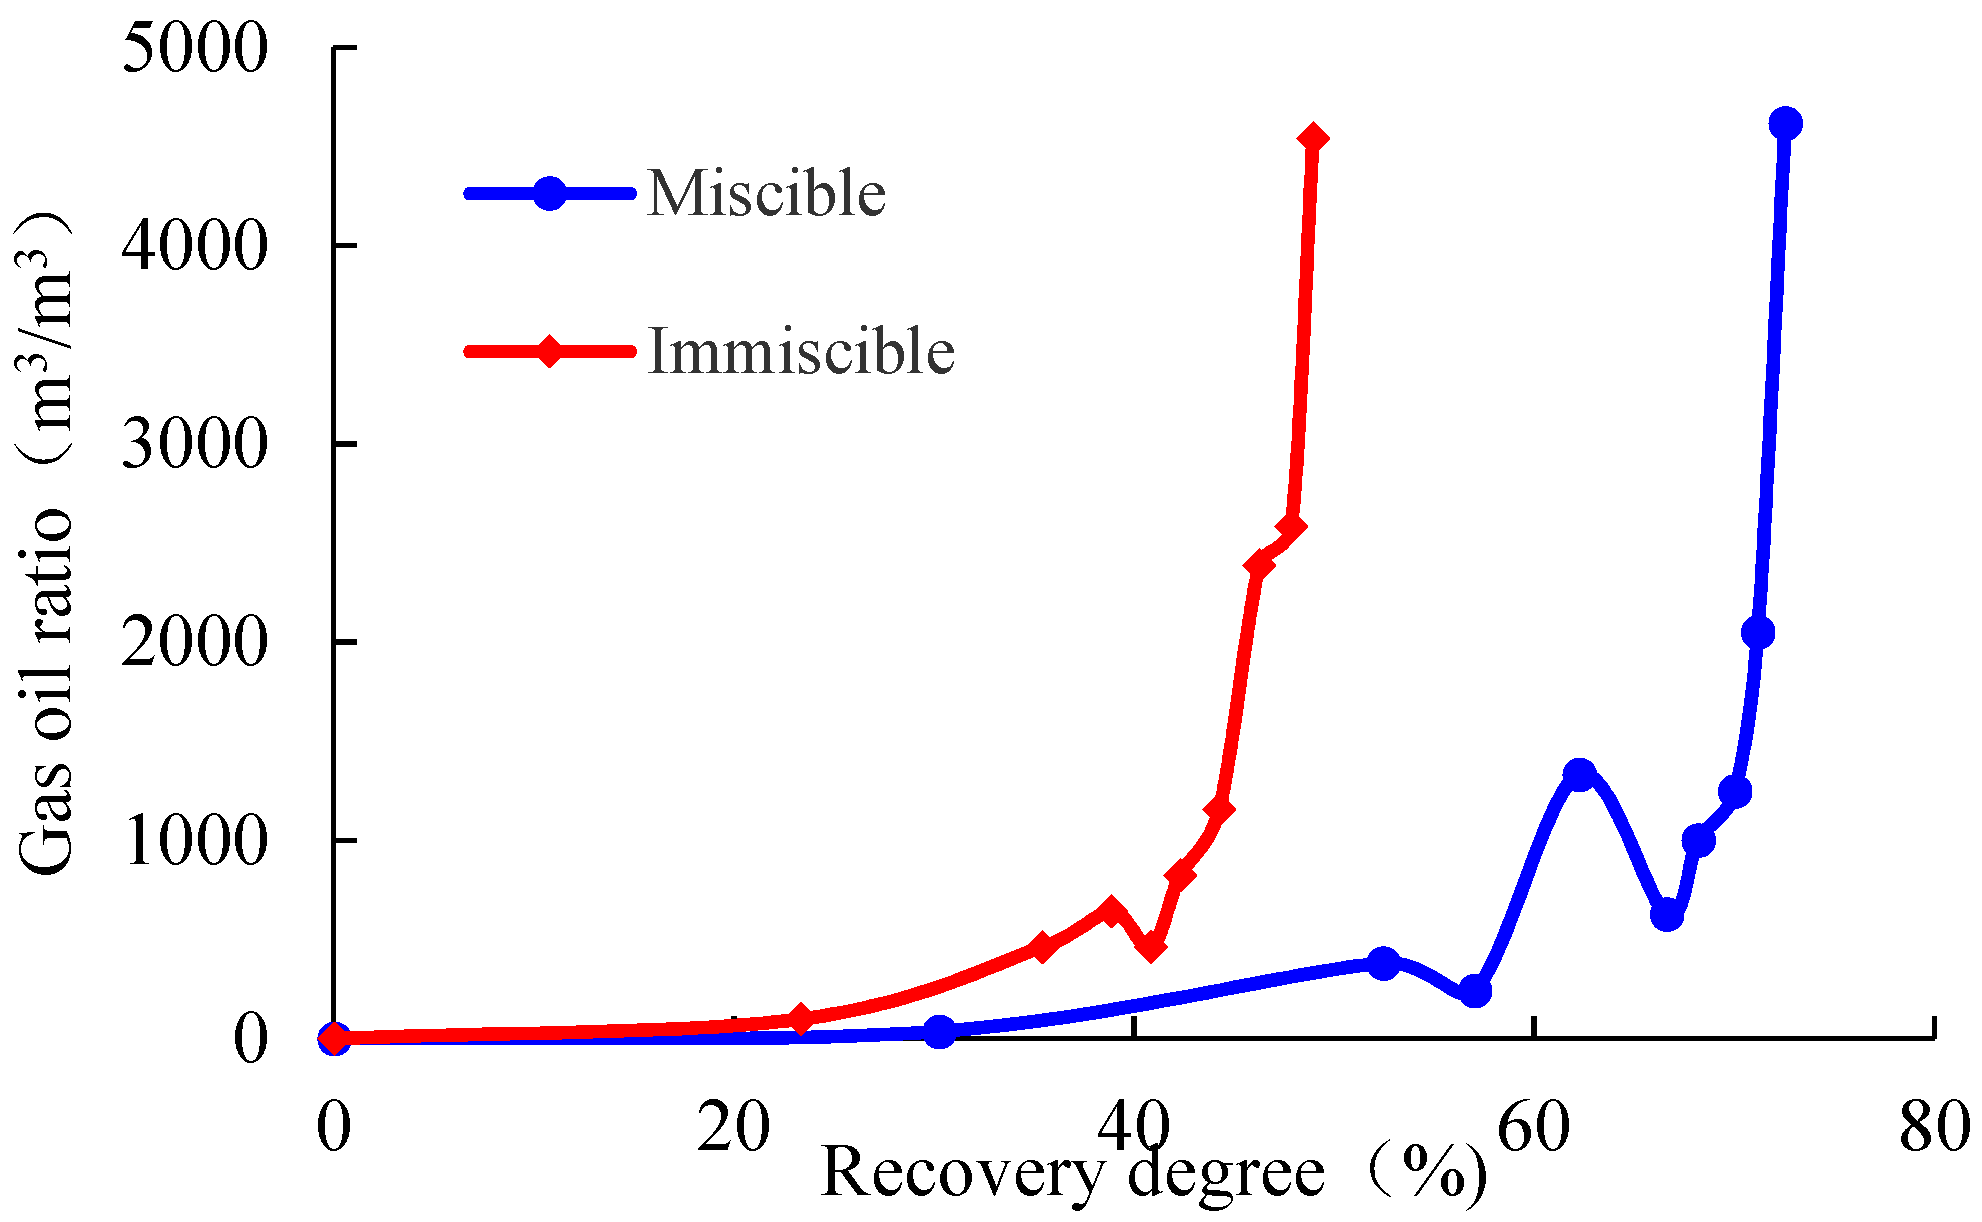
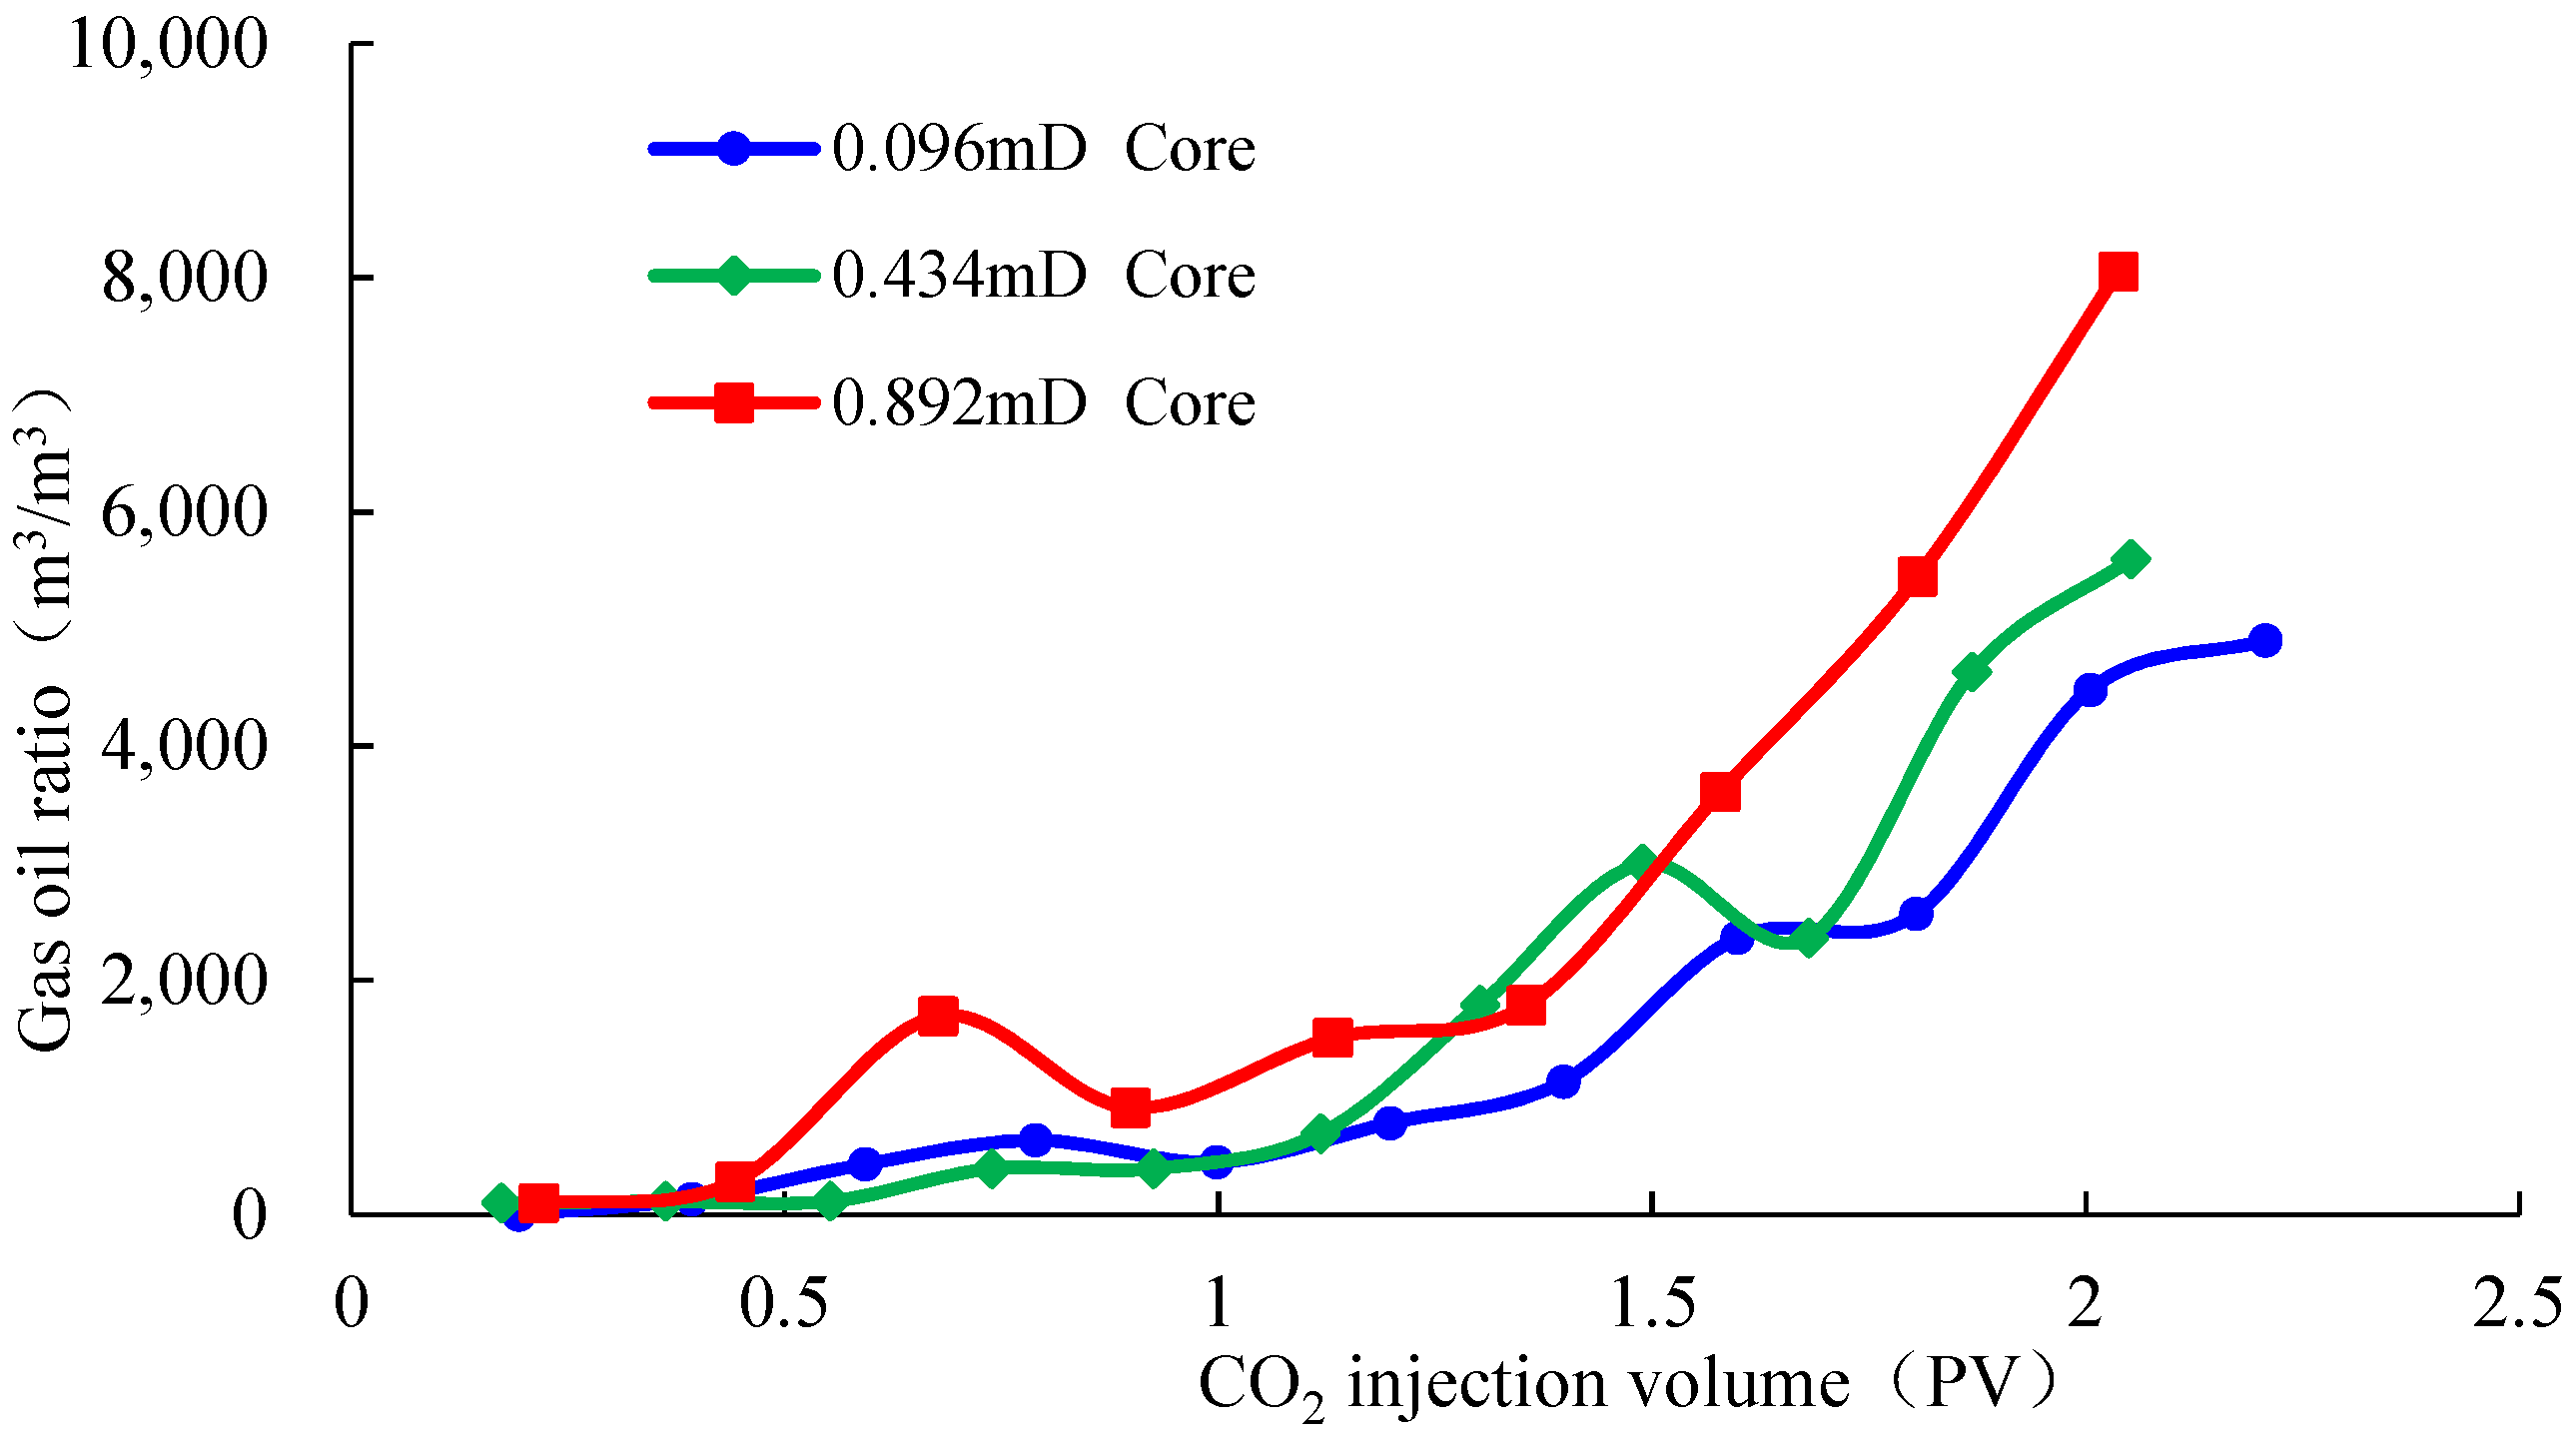
For ultra-low permeability cores, the recovery rate of CO2 miscible flooding is 21~24% higher than that of immiscible flooding. Before the injected CO2 volume reaches 0.5 PV, the gas production stage of core miscible flooding is in the range of 0.5~1.5 PV, the gas production stage of core immiscible flooding is in the range of 0.5~1.3 PV, and the gas–oil ratio in the gas production stage is less than 2000 m3/m3. When the gas–oil ratio is greater than 2000 m3/m3, the core enters the gas channeling stage, and the gas–oil ratio increases rapidly.
(2)
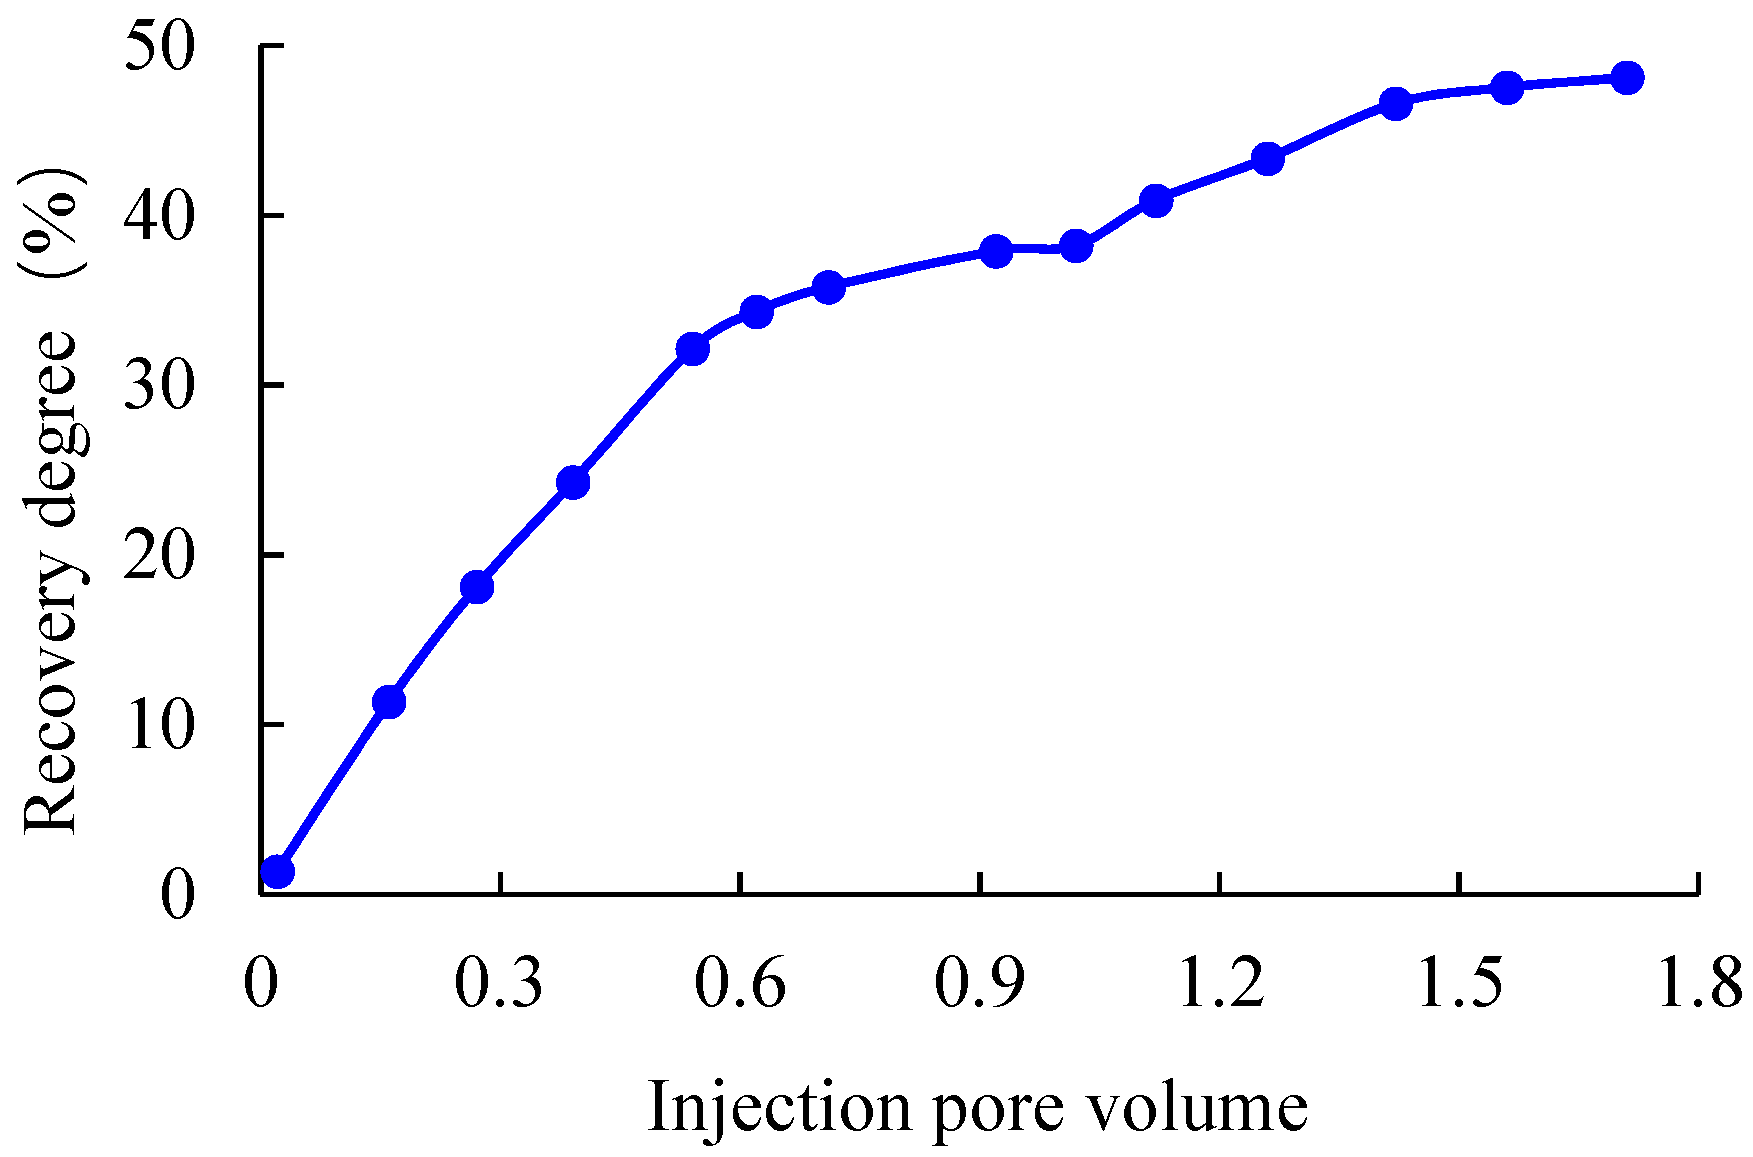
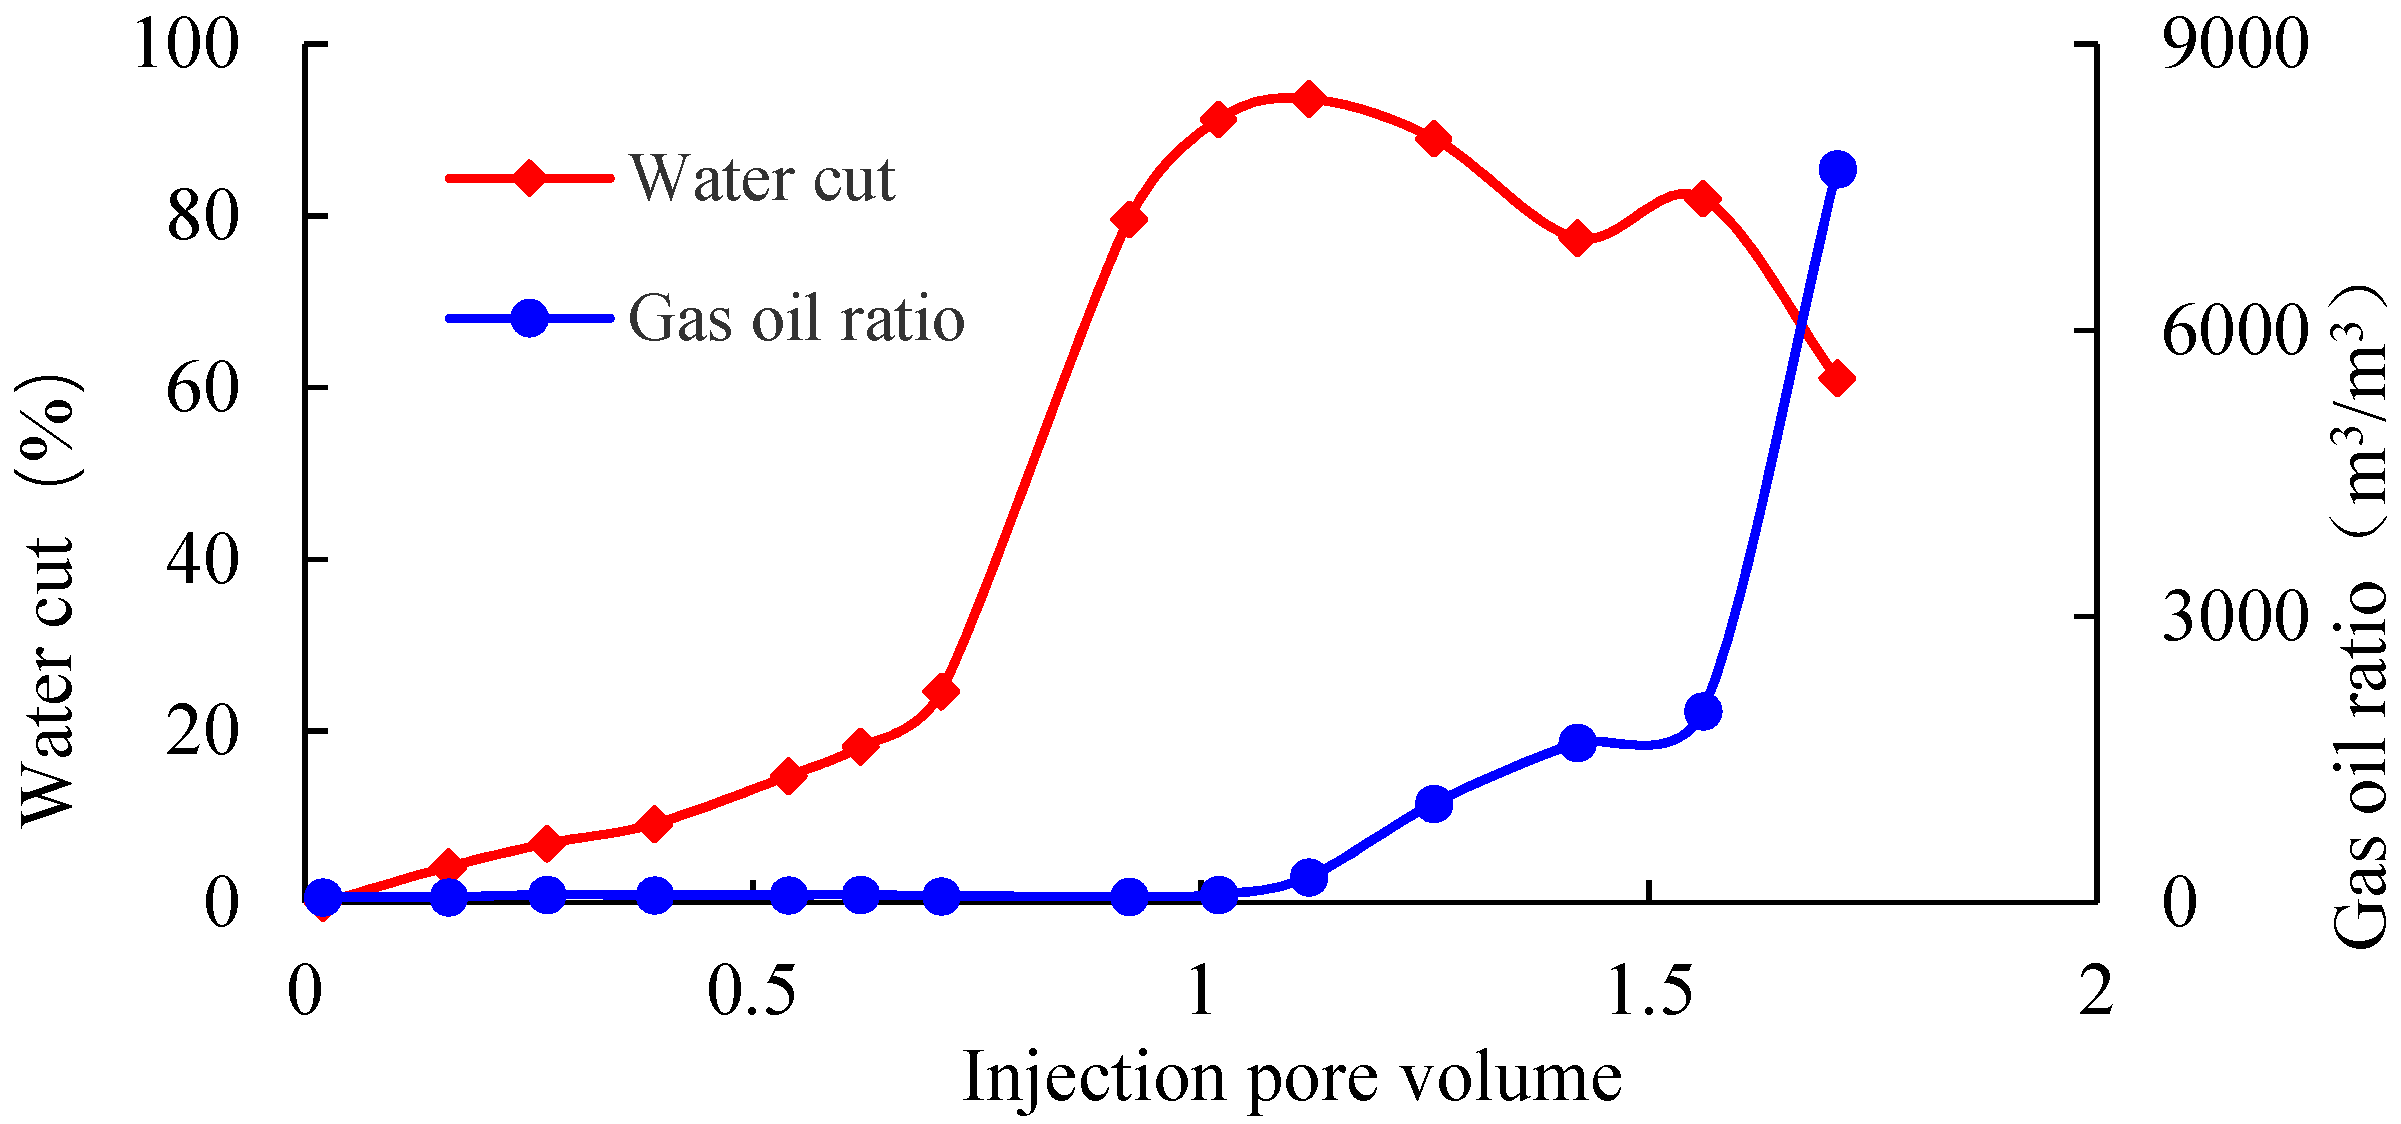
With an increase in water injection volume, the recovery degree of crude oil increases, and the core is replaced by CO2 injection. The water content increases slightly and then begins to decrease. Compared with water injection, the recovery of CO2 injection into 0.45 mD and 0.98 mD cores is increased by 8.32% and 16.11%, respectively. After the breakthrough of core gas injection, the increase in CO2 injection recovery is small.
(3)
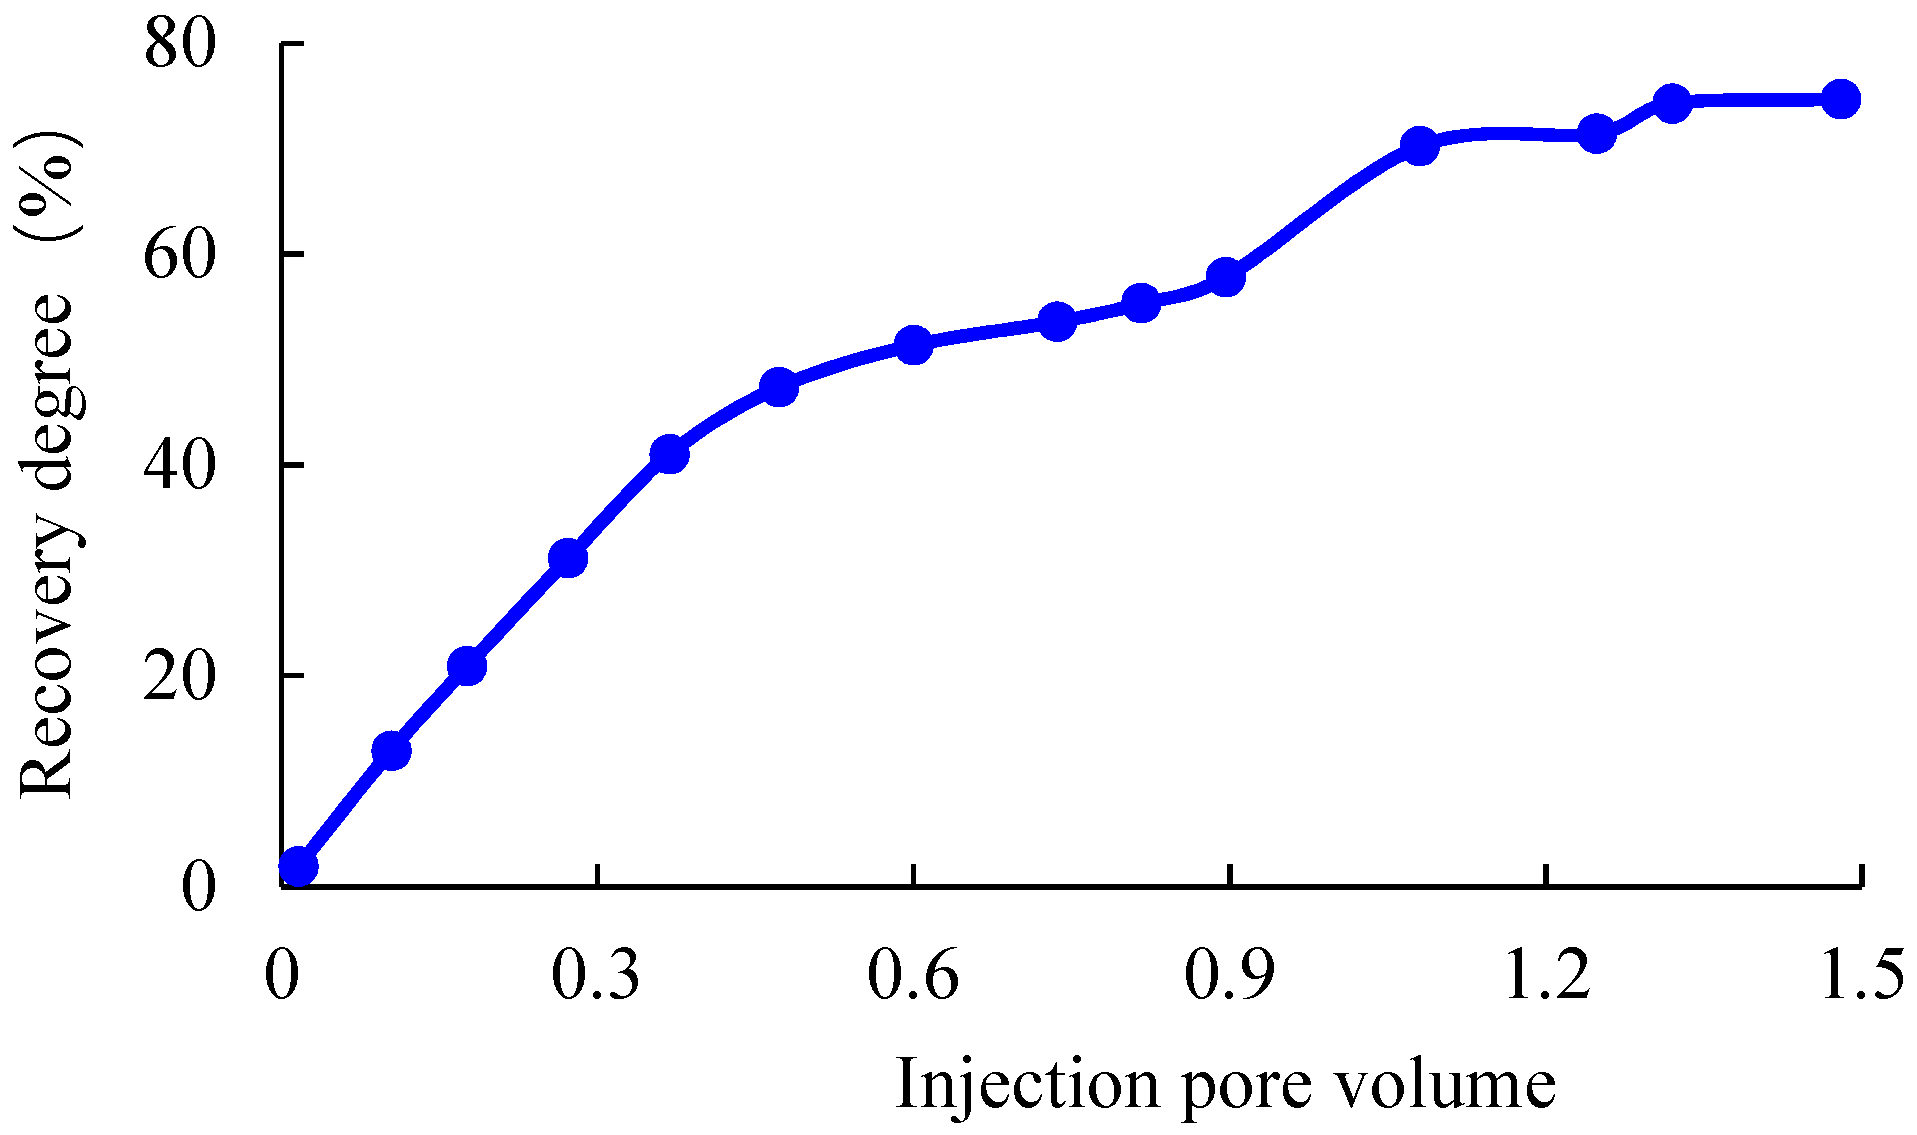
With an increase in CO2 injection volume, the recovery degree and gas–oil ratio of long cores with artificial fractures increase. The ultra-low permeability core crude oil is mainly produced before gas channeling. After the core gas channeling, the increase of the recovery degree is small. The fracture location has little impact on the CO2 oil-displacement effect. The larger the fracture scale is, the lower the core oil-displacement efficiency becomes, the shorter the gas-channeling time is, and the greater the production gas oil ratio with the same recovery degree is. A reasonable fracture penetration ratio should be set for CO2 oil injection.
(4)
Enhanced miscibility, water–gas alternate displacement, reasonable fracture penetration ratio and reasonable contact time between carbon dioxide and crude oil can all improve the recovery of ultra-low permeability reservoirs.

Author Contributions

Conceptualization, methodology, validation, formal analysis, project administration and writing—original draft preparation F.L.; software, data curation, visualization, supervision and funding acquisition, P.Y.; investigation, Q.W., G.Y. and J.Z.; resources, X.W.; methodology, Q.F. Review and editing, X.L. All authors have read and agreed to the published version of the manuscript.

Funding

This research was funded by the National Natural Science Foundation of China (Grant No. 51804253, No. 51974253, No.51874239).

Institutional Review Board Statement

Not applicable.

Informed Consent Statement

Not applicable.

Data Availability Statement

Not applicable.

Conflicts of Interest

The authors declare no conflict of interest.

References

  1. Infant, R.; Tuo, L.; Ming, Q.; Lizhi, X.; Jirui, H.; Chenggang, X. Preparation of CO2 responsive nanocellulose gel for mobility control in enhanced oil recovery. J. Dispers. Sci. Technol. 2021, 42, 2014–2021. [Google Scholar]
  2. Hongze, M.; Gaoming, Y.; Yuehui, S.; Yongan, G. A new hybrid production optimization algorithm for the combined CO2-cyclic solvent injection (CO2-CSI) and water/gas flooding in the post-CHOPS reservoirs. J. Pet. Sci. Eng. 2018, 6, 267–279. [Google Scholar]
  3. Dexiang, L.; Liang, Z.; Yanmin, L.; Wanli, K.; Shaoran, R. CO2-triggered gelation for mobility control and channeling blocking during CO2 flooding processes. Pet Sci. 2016, 13, 247–258. [Google Scholar]
  4. Ping, Y.; Rujie, Z.; James, J.S.; Gaoming, Y.; Feng, L. Study on the influential factors of CO2 storage in low permeability reservoir. Energies 2022, 15, 2–10. [Google Scholar]
  5. Fenglan, Z.; Peng, W.; Shijun, H.; Hongda, H.; Meng, Z.; Guoyong, L. Performance and applicable limits of multi-stage gas channeling control system for CO2 flooding in ultra-low permeability reservoirs. J. Pet. Sci. Eng. 2020, 192, 136–148. [Google Scholar]
  6. Juan, Z.; Huixiao, Z.; Liyan, M.; Yi, L.; Liang, Z. Performance evaluation and mechanism with different CO2 flooding modes in tight oil reservoir with fractures. J. Pet. Sci. Eng. 2020, 188, 426–439. [Google Scholar]
  7. Xinjie, L.; Pengfei, Z.; Ke, G.; Bing, W.; Yujun, F. Thermo-and CO2-triggered viscosifying of aqueous copolymer solutions for gas channeling control during water-alternating-CO2 flooding. Fuel 2021, 291, 426–441. [Google Scholar]
  8. Mingxing, G.; Jun, N.; Xianxian, W.; Bin, M.; Hongjuan, W. Experimental study on effects of CO2 flooding in ultra-low permeability reservoir under different parameters. J. Xi’an Shiyou Univ. 2020, 35, 60–65. [Google Scholar]
  9. Kaifeng, J.; Yuxia, W.; Shilu, W.; Dongchao, J.; Bin, L.; Ruiyao, Z.; Jindong, G. Influences of reservoir heterogeneity on gas channeling during CO2 flooding in low permeability reservoirs. Xinjiang Pet. Geol. 2019, 40, 208–212. [Google Scholar]
  10. Fanqun, K. Experimental study on gas channeling during CO2 immiscible flooding for low-permeability oil reservoirs. J. China Univ. Pet. 2021, 45, 97–103. [Google Scholar]
  11. Chengyuan, L.; Rui, W.; Shuxia, Z.; Zengmin, L.; Maolei, C.; Xin, W. Study on displacement characteristic curve in CO2 immiscible flooding for low permeability reservoirs. Pet. Geol. Recovery Effic. 2017, 24, 111–114. [Google Scholar]
  12. Wanshan, L.; Jian, W.; Zhenyu, R.; Hetaer, M. Gas-channeling control experiment with carbon dioxide gas-soluble foam in low-permeability oil reservoir. Spicial Oil Gas Reserv. 2019, 26, 136–141. [Google Scholar]
  13. Xisen, Z.; Lihua, S.; Weibo, W.; Yuan, B.; Feng, T. CO2 channeling sealing in ultra-low-permeability reservoirs. J. Southwest Pet. Univ. 2017, 39, 131–139. [Google Scholar]
  14. Daqing, Y.; Qinghua, S.; Shaojing, J.; Chunxia, H.; Ruijia, T. A study about influence law of permeability on gas channeling of CO2 flooding under low permeability reservoirs. J. Southwest Pet. Univ. 2014, 36, 137–141. [Google Scholar]
  15. Ruijia, T.; Heyi, W.; Huagui, Y.; Weibo, W.; Longlong, C. Effect of water and gas alternate injection on CO2 flooding. Fault-Block Oil Gas Field 2016, 23, 358–362. [Google Scholar]
  16. Chenglong, L. Gas channeling influencing factors and patterns of CO2-flooding in ultra—Low permeability oil reservoir. Spicial Oil Gas Reserv. 2018, 25, 82–86. [Google Scholar]
  17. Meng, Z.; Fenglan, Z.; Guangzhong, L.; Jirui, H.; Liguang, S.; Hairu, F.; Deming, Z. Gas-water alternation improves the adaptive limit of CO2 flooding. Oilfield Chem. 2020, 27, 279–286. [Google Scholar]
  18. Jirui, Z.; Xiang’an, Y.; Yanjun, K.; Junbin, Z.; Lijuan, Z.; Jueshun, Z. Injection experiment of carbon dioxide flooding in low-permeability fissure reservoirs. Fault-Block Oil Gas Field 2016, 23, 800–803. [Google Scholar]
  19. Zhixing, W.; Fenglan, Z.; Guangzhong, L.; Jirui, H.; Meng, Z.; Peng, W.; Hongda, H. Shunt control improves CO2 sweep efficiency of low permeability planar heterogeneous reservoirs. Oilfield Chem. 2018, 35, 654–660. [Google Scholar]
  20. Wei, H.; Chengyuan, L.; Rui, W.; Maolei, C.; Yang, Y.; Xin, W. Porous flow mechanisms and mass transfer characteristics of CO2 miscible flooding after water flooding. Acta Pet. Sin. 2018, 39, 201–207. [Google Scholar]
  21. Yuxia, W.; Qinghua, S.; Lifa, Z.; Zunsheng, J. Utilizing macroscopic areal permeability heterogeneity to enhance the effect of CO2 flooding in tight sandstone reservoirs in the Ordos Basin. J. Pet. Sci. Eng. 2021, 196, 107633. [Google Scholar]
  22. Hao, S.; Zihao, Y.; Xiaochen, L.; Ying, P.; Meiqin, L.; Juan, Z.; Zhaoxia, D. CO2-responsive agent for restraining gas channeling during CO2 flooding in low permeability reservoirs. Fuel 2021, 292, 120306. [Google Scholar]
  23. Zheng, C.; Yuliang, S.; Lei, L.; Fankun, M.; Xiaomei, Z. Characteristics and mechanisms of supercritical CO2 flooding under different factors in low-permeability reservoirs. Pet. Sci. 2022, 1, 85–96. [Google Scholar]
  24. Hongda, H.; Jirui, H.; Fenglan, Z.; Zhaojie, S.; Libin, H.; Zhixing, W. Gas channeling control during CO2 immiscible flooding in 3D radial flow model with complex fractures and heterogeneity. J. Pet. Sci. Eng. 2016, 146, 890–901. [Google Scholar]
  25. Xinhui, L.; Zigang, Z.; Guangming, Y.; Kang, Z. Response characteristics of gas-water alternate flooding with CO2 after water flooding in ultra-low permeability reservoirs. Spicial Oil Gas Reserv. 2020, 27, 113–117. [Google Scholar]
  26. Wanju, T.; Xuefeng, D.; Yulin, L.; Ping, W.; Rong, S.; Zhifeng, Z. Oil displacement experiment of CO2 flooding in tight reservoir. Fault-Block Oil Gas Field 2018, 25, 757–760. [Google Scholar]
  27. Daqing, Y.; Shaojing, J.; Qinghua, S.; Huagui, Y.; Chunxia, H.; Ruijia, T. Effect of gas injection pressure on gas channeling in CO2 flooding in ultra-low permeability reservoir. Drill. Prod. Technol. 2014, 37, 63–65. [Google Scholar]
Figure 1. The flow chart of the CO2 flooding experiment.
Energies 15 05119 g001
Figure 2. Schematic diagram of different crack test schemes.
Energies 15 05119 g002
Figure 3. The relationship between recovery degree and gas–oil ratio (0.892 mD core).
Energies 15 05119 g003
Figure 4. The relationship between recovery degree and gas–oil ratio (0.434 mD core).
Energies 15 05119 g004
Figure 5. The relationship between recovery degree and gas–oil ratio (0.096 mD core).
Energies 15 05119 g005
Figure 6. The recovery degree of cores with different permeability under miscible conditions.
Energies 15 05119 g006
Figure 7. The gas–oil ratio of cores with different permeability under miscible conditions.
Energies 15 05119 g007
Figure 8. The recovery degree of cores with different permeability under immiscible conditions.
Energies 15 05119 g008
Figure 9. The gas–oil ratio of cores with different permeability under immiscible conditions.
Energies 15 05119 g009
Figure 10. The relationship between injected pore volume and recovery degree of 0.45 mD core.
Energies 15 05119 g010
Figure 11. The relationship between injected pore volume and water cut, gas–oil ratio (0.45 mD core).
Energies 15 05119 g011
Figure 12. The relationship between injected pore volume and recovery degree of 0.98 mD core.
Energies 15 05119 g012
Figure 13. The relationship between injected pore volume and water cut, gas–oil ratio (0.98 mD core).
Energies 15 05119 g013
Figure 14. The relationship between CO2 injected volume and recovery degree, gas–oil ratio (Scheme 1).
Energies 15 05119 g014
Figure 15. The relationship between CO2 injected volume and recovery degree, gas oil ratio (Scheme 2).
Energies 15 05119 g015
Figure 16. The relationship between CO2 injected volume and recovery degree, gas oil ratio (Scheme 3).
Energies 15 05119 g016
Figure 17. The relationship between CO2 injected volume and recovery degree (Scheme 1 and Scheme 3).
Energies 15 05119 g017
Figure 18. The relationship between recovery degree and gas oil ratio (Scheme 1 and Scheme 3).
Energies 15 05119 g018
Figure 19. The relationship between CO2 injected volume and recovery degree (Scheme 2 and Scheme 3).
Energies 15 05119 g019
Figure 20. The relationship between recovery degree and gas–oil ratio (Scheme 2 and Scheme 3).
Energies 15 05119 g020
Table 1. Porosity and permeability test results of experimental core.
Core NumberLength
(mm)
Diameter
(mm)
Mass
(g)
Permeability
(mD)
Porosity
(%)
148.7325.0157.390.89212.33
248.7325.0157.390.89212.33
350.1125.3360.210.4349.94
450.1125.3360.210.4349.94
550.1125.3360.210.4349.94
650.1125.3360.210.4349.94
750.0325.3158.330.0969.46
850.0325.3158.330.0969.46
949.0525.5454.490.4511.87
1048.8625.5254.320.9812.47
Publisher’s Note: MDPI stays neutral with regard to jurisdictional claims in published maps and institutional affiliations.

