

Numerical Study on R32 Flow Condensation in Horizontally Oriented Tubes with U-Bends

1
Key Laboratory of Thermo-Fluid Science and Engineering, Ministry of Education, School of Energy and Power Engineering, Xi’an Jiaotong University, Xi’an 710049, China
2
Department of Refrigeration & Cryogenic Engineering, School of Energy and Power Engineering, Xi’an Jiaotong University, Xi’an 710049, China
3
Guangdong Midea Refrigeration Equipment Co., Ltd., Foshan 528311, China
*
Author to whom correspondence should be addressed.
Energies 2022, 15(13), 4799; https://doi.org/10.3390/en15134799
Submission received: 8 June 2022
/
Revised: 23 June 2022
/
Accepted: 27 June 2022
/
Published: 30 June 2022
Abstract
:In this paper, the flow condensation heat transfer characteristics of R32 in a horizontally oriented tube with a horizontal U-bend (HUB tube) and a horizontally oriented tube with a vertical U-bend (VUB tube) were numerically investigated. The volume of fluid (VOF) multiphase model with the mass transfer assumption by Lee is adopted to simulate the flow condensation behavior of R32, which are validated by well-known empirical correlations. The influence of structural parameters, mass flux and vapor quality on the heat transfer coefficient (HTC) and liquid film distribution is investigated. Meanwhile, the local liquid film thickness (LLFT) and local heat transfer coefficient (LHTC) are also depicted. The phase transition at the U-bend section is captured. Results show that the U-bend has remarkable disturbance on the flow pattern and LHTC due to the effect of centrifugal force where the LLFT is changed, inducing strong secondary flow. The LHTC is increased by a maximum of 8.47% and 11.86% in VUB tube and HUB tube, respectively, when compared to the case in a horizontally straight oriented tube at the same operating conditions.
1. Introduction
People’s awareness of environmental protection has been significantly increased in recent years. The environmental concerns caused by chlorofluorocarbons (CFCs), such as ozone layer depletion and the greenhouse effect, have attracted more and more attention [1]. The signing of the “Montreal Protocol” and “Kyoto Protocol” promotes the research improvement on environmental protection alternative refrigerants. At present, the widely used alternative refrigerants are R410a, R407C, etc., but these refrigerants still show high global warming potential (GWP) values. The R32, as a representative of the new environmental protection refrigerant, has the advantages of low GWP value and zero ozone depletion potential (ODP) value, and it has similar basic thermodynamic parameters to R22. Compared with traditional refrigerants, the application of R32 in heating, ventilation and air-conditioning (HVAC) systems always show cleanness, low toxicity and safety characteristics. In an HVAC system, the condenser is one of the major components in which tubes are horizontally oriented with U-bends [2]. The application of U-bend tubes is a commonly effective way for improving the heat exchanger compactness [3]. However, it should be noted that the U-bend section always shows significant influence on the flow and heat transfer characteristics, and the flow pattern of the two-phase working medium would be changed significantly due to the presence of centrifugal force [4].
Studies have focused on the heat transfer and pressure drop characteristics during the refrigerant flow condensation in horizontally oriented tubes or inclined tubes. Liu et al. [5,6] conducted a set of experiments on the flow condensation of R32, R152a and R22 in a circular (D = 1.152 mm) and two square (D = 0.952 and 1.304 mm) horizontal minichannels. Effects of vapor quality, mass flux, saturation temperature, channel geometry and thermophysical properties on the flow condensation of the heat transfer coefficient (HTC) and pressure drop were investigated. Results showed that the HTC and pressure loss might increase with the increase in mass flux and vapor quality and the decrease in saturation temperature and channel diameter. It was also demonstrated that R32 is a good substitute for R22 due to the similar condensation heat transfer characteristics. Mudawar et al. [7] experimentally investigated the flow condensation heat transfer in a smooth stainless-steel tube with 7.12 mm diameter under different orientations including vertical upper flow, vertical downflow and horizontal flow. It was noted that the tube orientation has greater impact at low mass velocities, and it was also reported that the mass flux and vapor quality are the dominant and secondary associated factors for condensation heat transfer process, respectively. Dalkilic et al. [8] measured the condensation heat transfer of R134a in vertical downward flow at high mass flux and proposed a new correlation for the condensation HTC. Cavallini et al. [9] measured the condensation HTC and pressure drop in a smooth tube by pure HFC refrigerants (R134a, R125, R236ea, R32) and R410a. It was examined that the effects of saturation temperature, mass flux, vapor quality and thermophysical properties on the condensation process, and the experimental results were compared with empirical correlations results. Moreira et al. [10] investigated the HTC of convective condensation of R134a, R600a, R290, R1270, and their zeotropic binary mixtures working medium in a horizontal tube with D = 9.43 mm. Results show that the mixtures provided smaller HTC than the pure fluids at low mass flux while the shear stress effect might dominate the condensation heat transfer. Chu et al. [11] reviewed the two-phase flow behavior of refrigerants impacting by lubricant oil and studied the flow regimes of refrigerant/oil mixtures both in macro-scale and micro-scale flow channels.
On the other hand, the computational fluid dynamic (CFD) method was also applied to investigate the flow condensation process for exploring more detailed information. Zhang et al. [12] employed the numerical simulation method to calculate the three-dimensional steady-state flow condensation in horizontal circular mini/micro-tubes. The detailed liquid–vapor interfaces and stream-traces were used to better understand the condensation flow process and results on HTC and pressure drop predictions agreed well with the well-known empirical correlations. Qiu et al. [13] has applied the volume of fraction (VOF) multiphase flow model coupled with Lee’s phase change model to investigate the flow condensation process of R290 in horizontal circular minichannels with different diameters. It was found that the tube diameter shows a remarkable effect on the two-phase flow pattern, HTC, pressure drop and suggested refrigerant charge ratio. Qiu et al. [14] also employed the numerical simulation method to study the three-dimensional flow condensation of R290 in inclined tubes. It is noted that the HTC and pressure drop increase with the increasing inclined angle, while the optimal inclined angle is 90° (downward flow) for the highest HTC. Gu et al. [15] explored the condensation annular flow of R1234ze(E) inside an inclined tube with a diameter of 4.57 mm by numerical simulation. The numerical results illustrated the effects of inclination on the liquid film distribution, LLFT, LHTC and velocity profile. Abadi et al. [16] discussed the influence of inclination angle on flow condensation heat transfer and pressure drop in a smooth tube, while results showed that the inclination angle between −30° to −15° is an optimum option for condensation heat transfer. Guo et al. [17] investigated the effect of tube inclination on the heat transfer of gravity-driven granular flow around tube out-wall, and they suggested the inclination angle should be between 15° and 37.5° for better heat transfer performance. Wen et al. [18] studied the influence of surface tension, gravity and turbulence on condensation patterns of R1234ze(E) in horizontal tubes with different diameters. It is noted that the surface tension played an important role in the heat transfer by enhancing the flow convection between liquid film and wall surface while gravity effect was negligible in mini-channels. In addition, many studies also focused on the flow condensation process of various refrigerants (R1234ze(E), R134a, R290, R410a, R450a, etc.) in various flow channels, including square [19], triangle [20], horizontal flattened [21], convergent [22] and micro-fin tubes [23].
Consequently, many studies have revealed the dominant factors such as mass flux, boundary condition, vapor quality, saturated temperature and tube diameter that may influence the thermohydraulic performance during flow condensation. However, the U-bends always exist in practical application which may also affect the flow behavior and heat transfer characteristics. Ahmadpour et al. [3] experimentally investigated the heat transfer characteristics of hydrocarbon refrigerant R600a-oil mixture during condensation inside a horizontally oriented tube with U-bends. Results showed that the local and average HTC were maximally increased by 34% and 29.7%, respectively, when compared to a horizontally straight tube. Lee et al. [24] studied heat transfer characteristics of R290 (propane), R600a (iso-butane), R1270 (propylene) and R22 during the condensing and evaporating process in a horizontal tube with a U-bend. They found that R1270 has the maximum value of condensing HTC, while R22 has the minimum value among the tested refrigerants. Hence, it is important to understand the flow development and local heat transfer characteristics of the R32 flow condensation process in horizontally oriented tubes with U-bends for the heat exchangers optimization in the air conditioning systems. Note that studies rarely focused on the thermodynamic performance of refrigerants in tubes with U-bends. Meanwhile, the local temperature distribution as well as changes in flow pattern and liquid film thickness at U-bends are still not clear.
In the present paper, the three-dimensional model based on VOF multiphase flow is developed and applied to study the flow condensation process of R32 in a straight horizontally orientated (HO) tube, a horizontally oriented tube with a horizontal U-bend (HUB tube) and a horizontally oriented tube with a vertical U-bend (VUB tube). The development of liquid film thickness along the flow direction as well as its effect on local HTC is illustrated. Meanwhile, the influence operating conditions such as mass flux and vapor quality on the average HTC in three types of tubes are also quantitatively compared. Results obtained in the present paper may help to better understand the flow condensation process of R32 in horizontally oriented tubes with U-bends, and then guide the design, optimization and application of heat exchangers in the heating, ventilation and air-conditioning (HVAC) systems.
2. Model Description
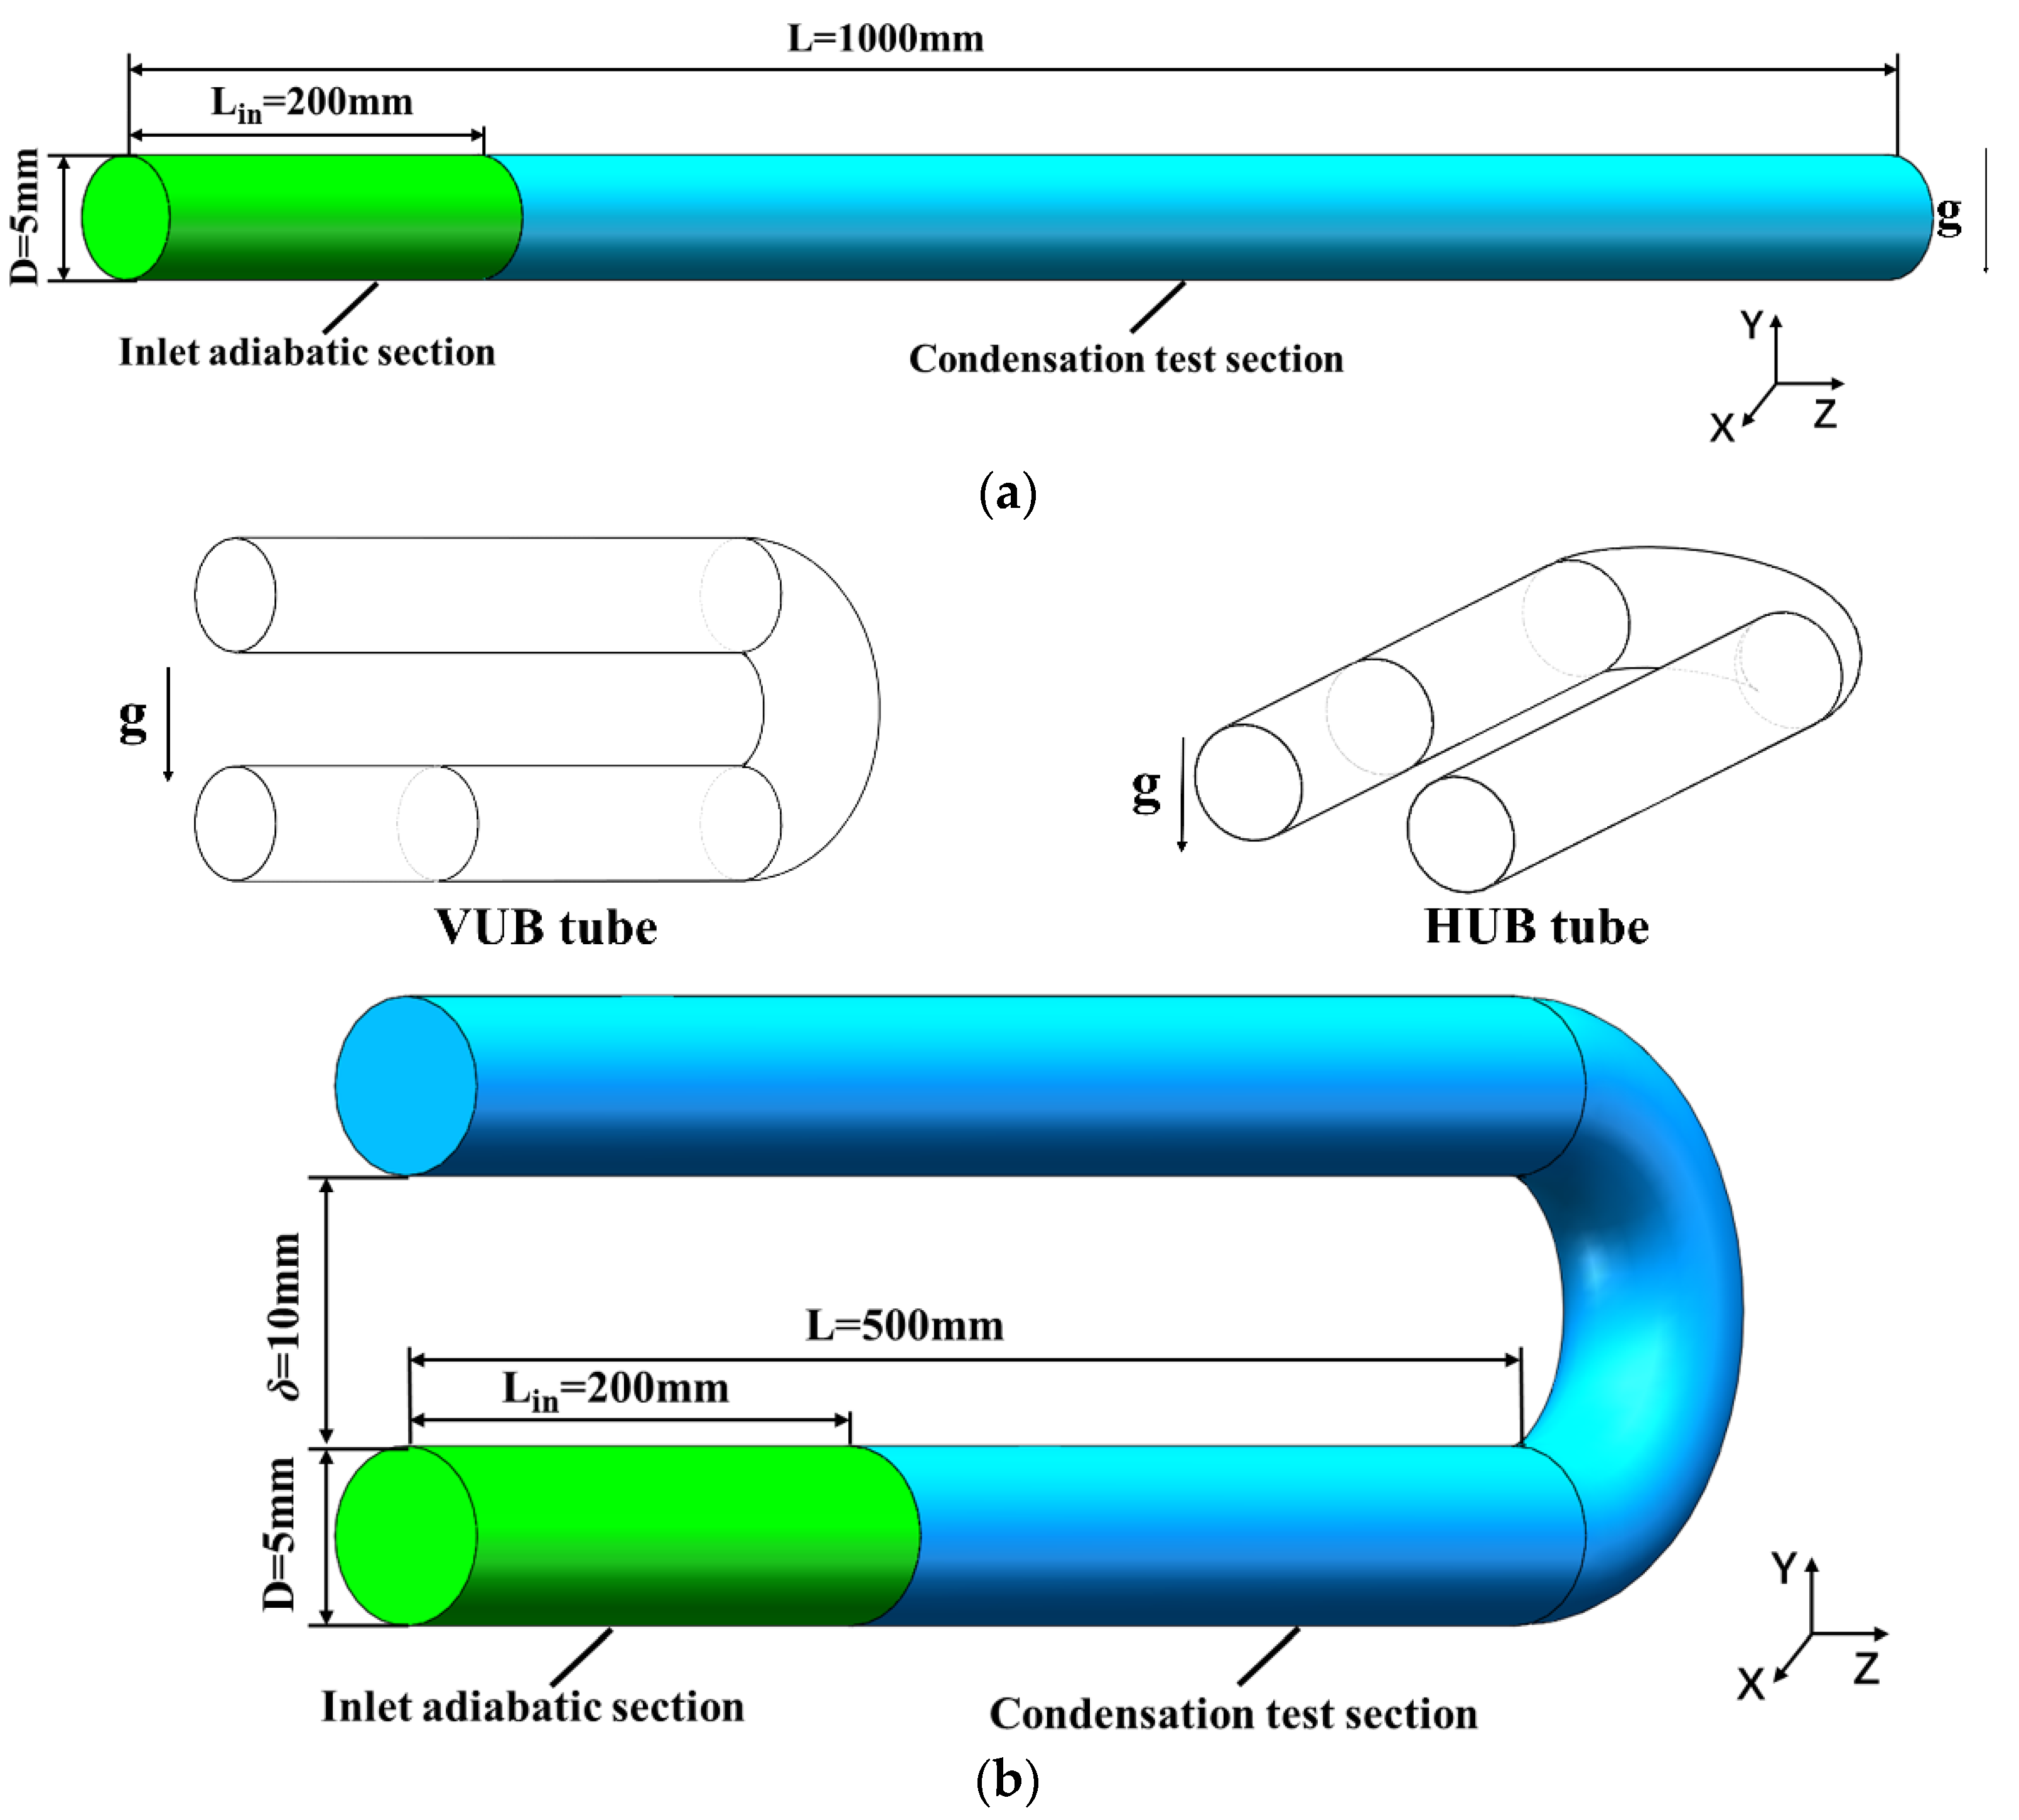
The three-dimensional horizontally oriented tube model has been established which is shown in Figure 1. Three different tube models are involved, including HUB tube, VUB tube and HO tube. The tube diameter (D) is fixed at 5.0 mm. The inlet is extended with the adiabatic boundary in order to reduce the entrance effect. The vapor quality at inlet is assumed as unit and the saturation temperature of the fluid is assumed at 323.15 K. The velocity boundary and zero pressure boundary are applied at the inlet and outlet, respectively. The range of mass flux studied in this paper is from 200 to 400 kg/(m2·s), and the inlet velocity is calculated by mass flux. The tube wall is regarded as a smooth and non-thick surface with a no-slip boundary condition. The constant temperature of 308.15 K is set to the wall (15 K lowering than the saturation temperature). The fluid properties of R32 were taken from the National Institute of Standard and Technology (REFPROP 9.0 database), and the detailed information is shown in Table 1. The ANSYS ICEM software is utilized to generate the mesh system, and the ANSYS Fluent is applied to conduct the simulation with finite volume method (FVM).
2.1. Volume of Fluid Model
The volume of fluid (VOF) model defined by Hirt and Nichols [25] is employed in the present paper. The VOF model proposed a concept of volume fraction, indicating that the percentage of volume occupied by each phase in the computation domain. With the consideration of boiling and condensing processes, the summation volume of the liquid phase and vapor phase is uniform in each control volume. The weighted summation of the volume fractions method is used to determine the fluid physical properties such as density and viscosity, which can be illustrated by Equations (1) and (2):
where αv, αl, ρv, ρl, μv and μl mean the volume fractions, densities and viscosities of vapor and liquid phase, respectively. The variables of ρ and μ represent the average density and viscosity of the control volume.
The following are the continuity equations for the vapor and liquid phases:
where is the velocity vector and Sl, Sv stand for the mass source term caused by phase change process. The calculation of Sl, Sv will be discussed in phase change model (Section 2.3). The VOF model solves a set of momentum equations in the computational domain and the velocity are shared by all phase components. The momentum equations are as follows:
where is the gravity acceleration, P is the pressure and I is the unit tensor, FCSF is surface tension. The continuum surface force model (CSF) is used to calculate the surface force between liquid phase and vapor phase which is shown in Equation (6) [26].
where σ is the surface tension coefficient. Cv and Cl are surface curvature of vapor and liquid, respectively, which can be written as follows:
The energy equation is also shared by all phase components in the control volume, which can be seen as follows:
where λ and T means the average thermal conductivity and temperature of the two phases, Se stands for the source term of energy equation caused by phase change, E means the internal energy of the fluid and can be calculated by the following equation through mass average method.
2.2. Turbulence Model
The turbulence model has a significant influence on the flow pattern and heat transfer characteristics of two-phase flow. It was inspired by other research [15,22,27] in which the shear stress transport (SST) k-ω turbulence model was adopted, which is also applied in this paper due to its great predictive performance in both liquid phase and vapor phase during the flow condensing process. The transport equations for the specific dissipation rate and its turbulent kinetic energy are shown as follows:
The value of empirical constants σk,1, σω,1, σk,2 and σω,2 are 1.176, 2.0, 1.0 and 1.168, respectively. The detailed information of the empirical closure equations in the turbulence model can be found in the reference [28].
2.3. Phase Change Model
The flow condensation mass and heat transfer process of R32 are determined by Lee’s phase change model [29]. Based on the Hertz–Knudsen equation [30], the source term caused by the phase changing process in the continuity equations can be obtained as follows:
where Sl, Sv are the source term in the continuity equation, T and Tsat are the temperature of the control volume and saturation temperature, respectively, βl and βv are the relaxation factors which control the mass transfer rate between the phase surface.
The above equations illustrate that the temperature difference between the fluid at the control volume and the saturation temperature is the driving force of mass transfer process. When the fluid temperature at the control volume is lower than the saturation temperature, flow condensation occurs if αv is greater than 0. The relation factor β controls the amount of mass transfer during the phase change process, so a suitable value of β is critical for the accuracy of numerical simulation. Note that a smaller assumed β may lead to inaccurate calculation results, while a larger value may also cause significant divergence. Previous studies pointed out that the appropriate value of β is influenced by various factors such as the fluid properties, geometry, boundary conditions and even mesh size [31,32]. Table 2 summarizes the recent literature [13,15,16,21,22,27,33,34,35,36] on numerical simulation of flow condensation using VOF model coupled with Lee’s phase change model. Inspired by the previous literature [13], the value of β is chosen to be 1 × 10⁴ to 5 × 10⁴ based on the simulation conditions by a trial and error method, taking into account the influence of calculation accuracy and calculation time. In addition, the correctness of the β value should be also verified by model validation.
The source term in the energy equation is defined as follows:
where Hlv is the latent heat of R32 in the specific saturation temperature. In this study, compiled user defined function (UDF) was used to deal with the source term in continuity equation and energy equation.
2.4. Model Setup
The calculation is based on the pressure solver and PISO algorithm to deal with the coupling between pressure and velocity. The Least Square Cell-Based method and PRESTO! algorithm were used for gradient solving and pressure discrete term, respectively. The momentum equation and energy equation are discretized by the second-order upwind scheme in order to improve the calculation accuracy. The Geo-Reconstruct method is adopted for VOF model and the implicit body force is used to improve the convergence of the solution. The variable time stepping method is applied in the present study in order to ensure the global Courant number is less than 0.2. The initial time step size is set at 2 × 10⁻⁵ s. The residual of 1 × 10⁻⁶ is regarded as the convergence criteria for momentum and energy equations, and 1 × 10⁻⁴ for continuity equation.
3. Validation on Model and Mesh System
3.1. Model Validation
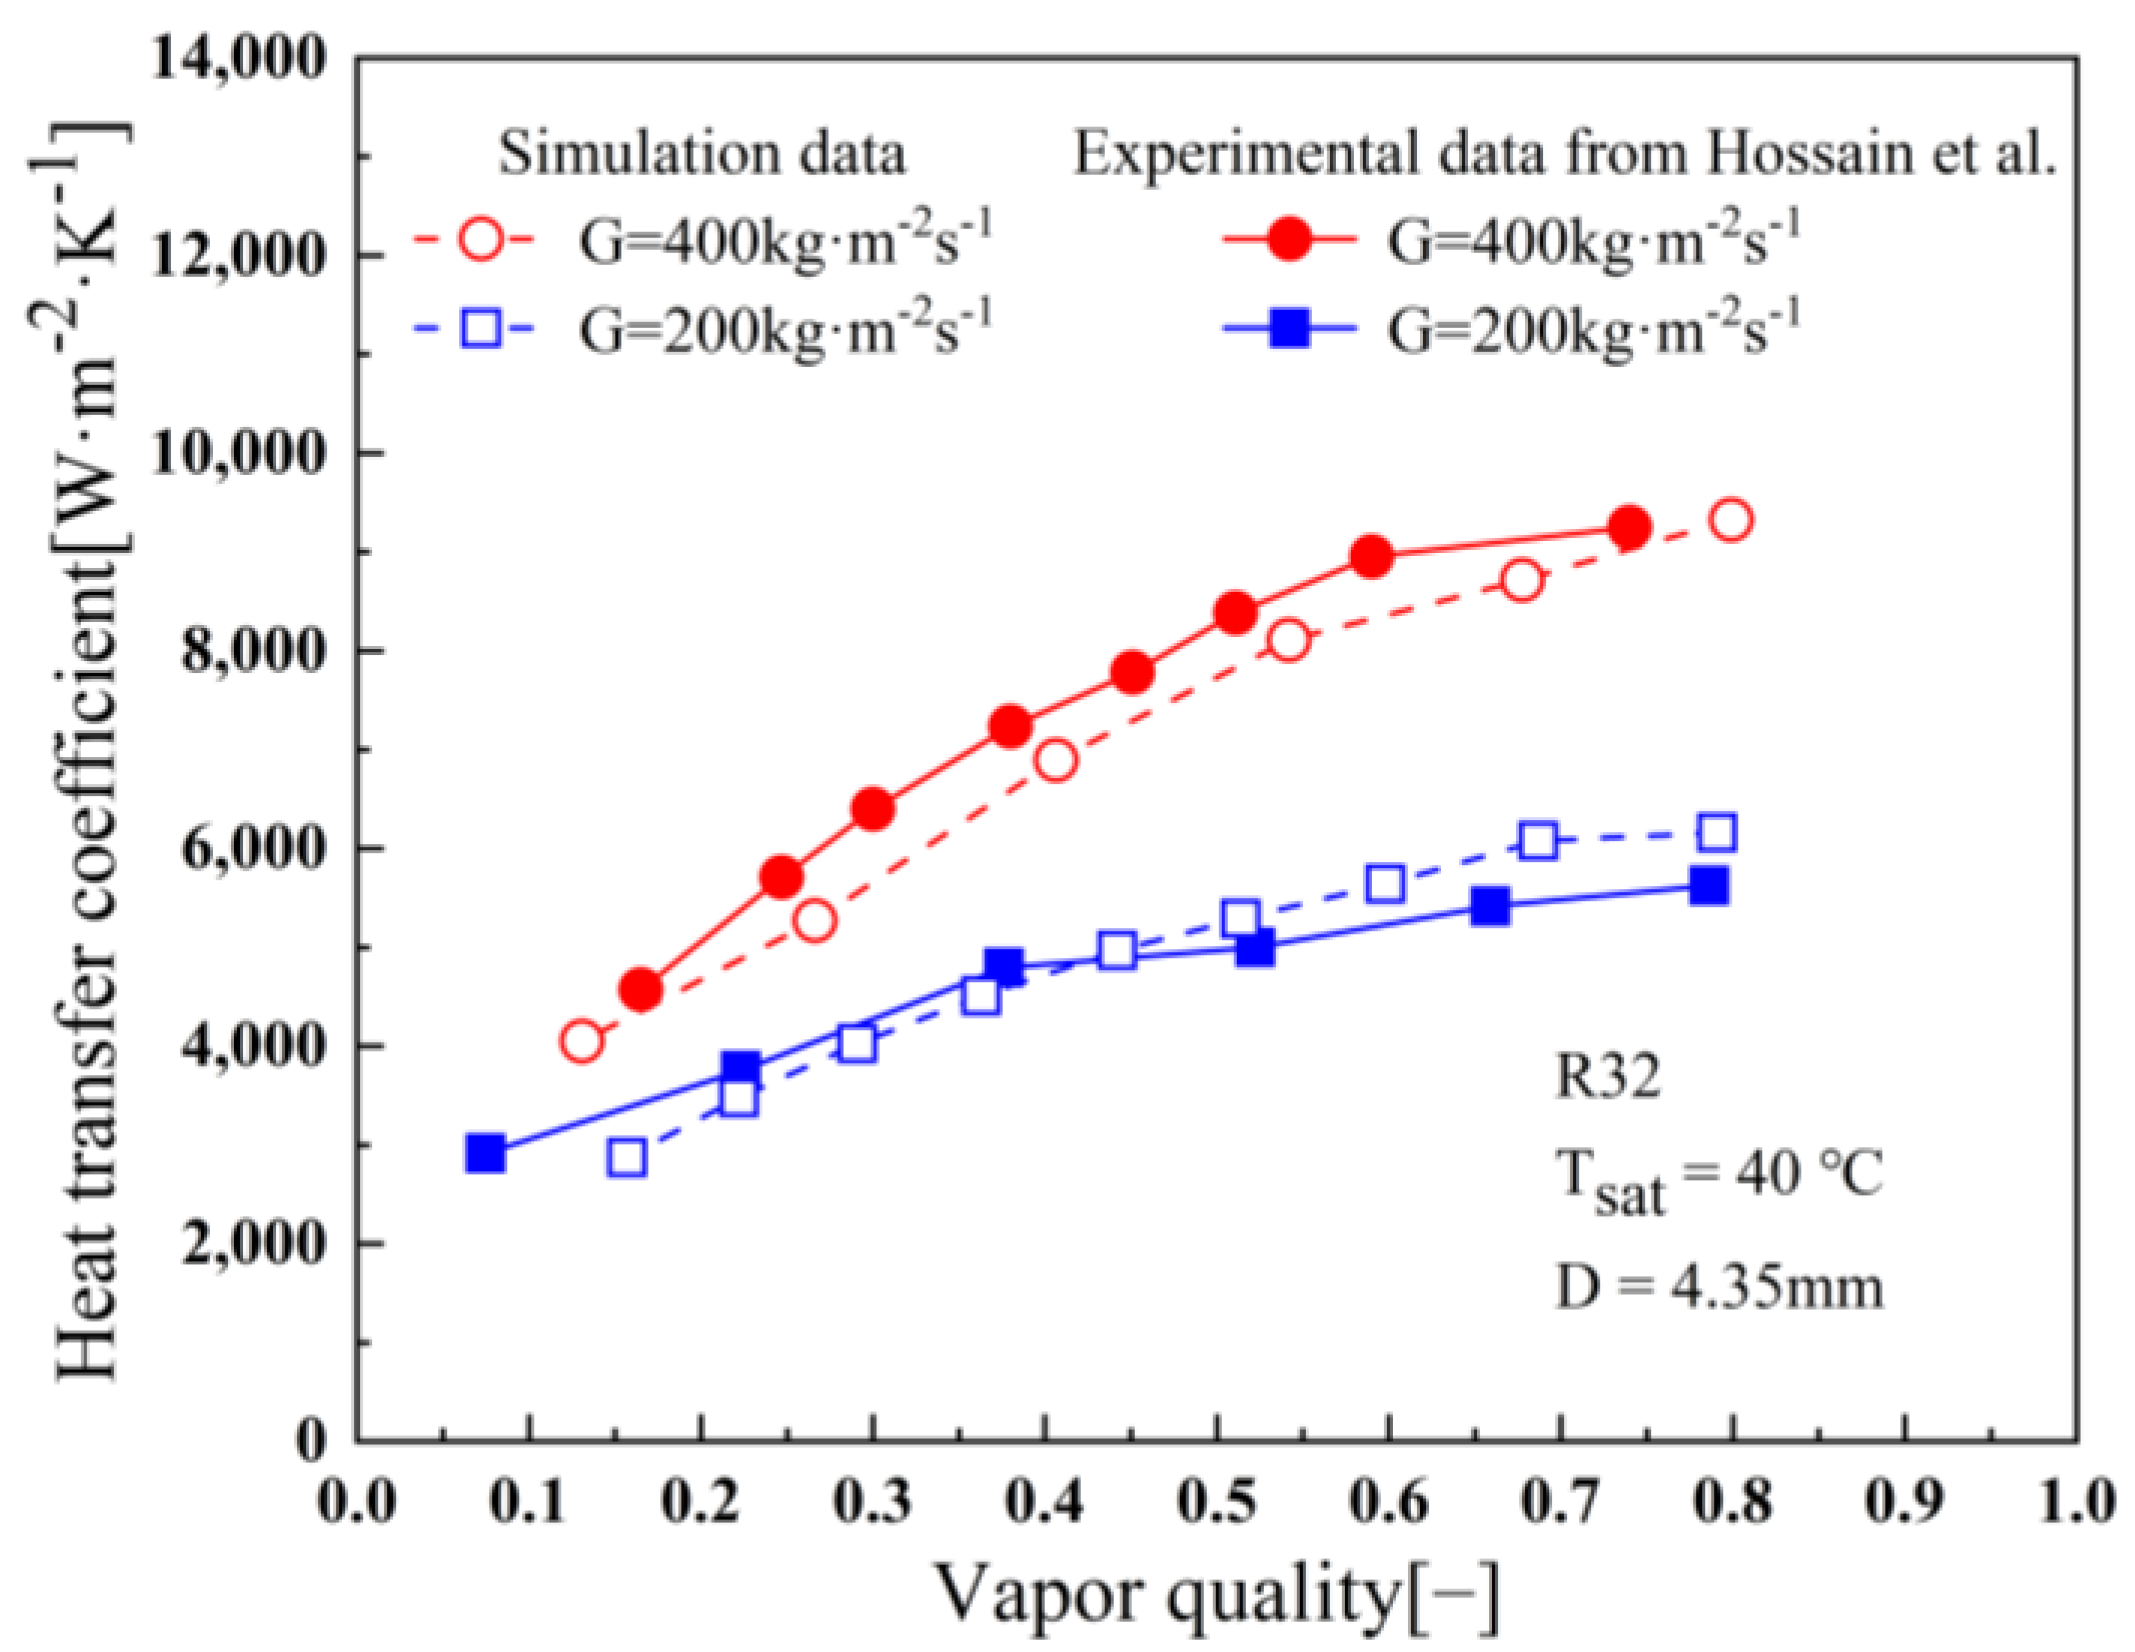
The adopted numerical model is validated by comparing with the experimental results in the reference published by Hossain et al. [37], in which the R32 flow condensation in a 4.35 mm diameter horizontal straight tube was tested. Cases with the operating conditions of G = 200 kg/(m2·s) and G = 400 kg/(m2·s) are introduced while the saturation temperature is 40 °C. The variation of HTC along with vapor quality is shown in Figure 2, while the HTC is calculated by Equation (20),
where h is the HTC, q means heat flux, Tw and Tsat stand for the local wall temperature and the saturation temperature, respectively. Note that the HTC prediction in numerical simulation agree well with the experimental results from Hossain et al. [37]. The relative error can be lowered within 15%. Hence, it is proved that the developed numerical model is reliable.
3.2. Comparison with Empirical Correlations
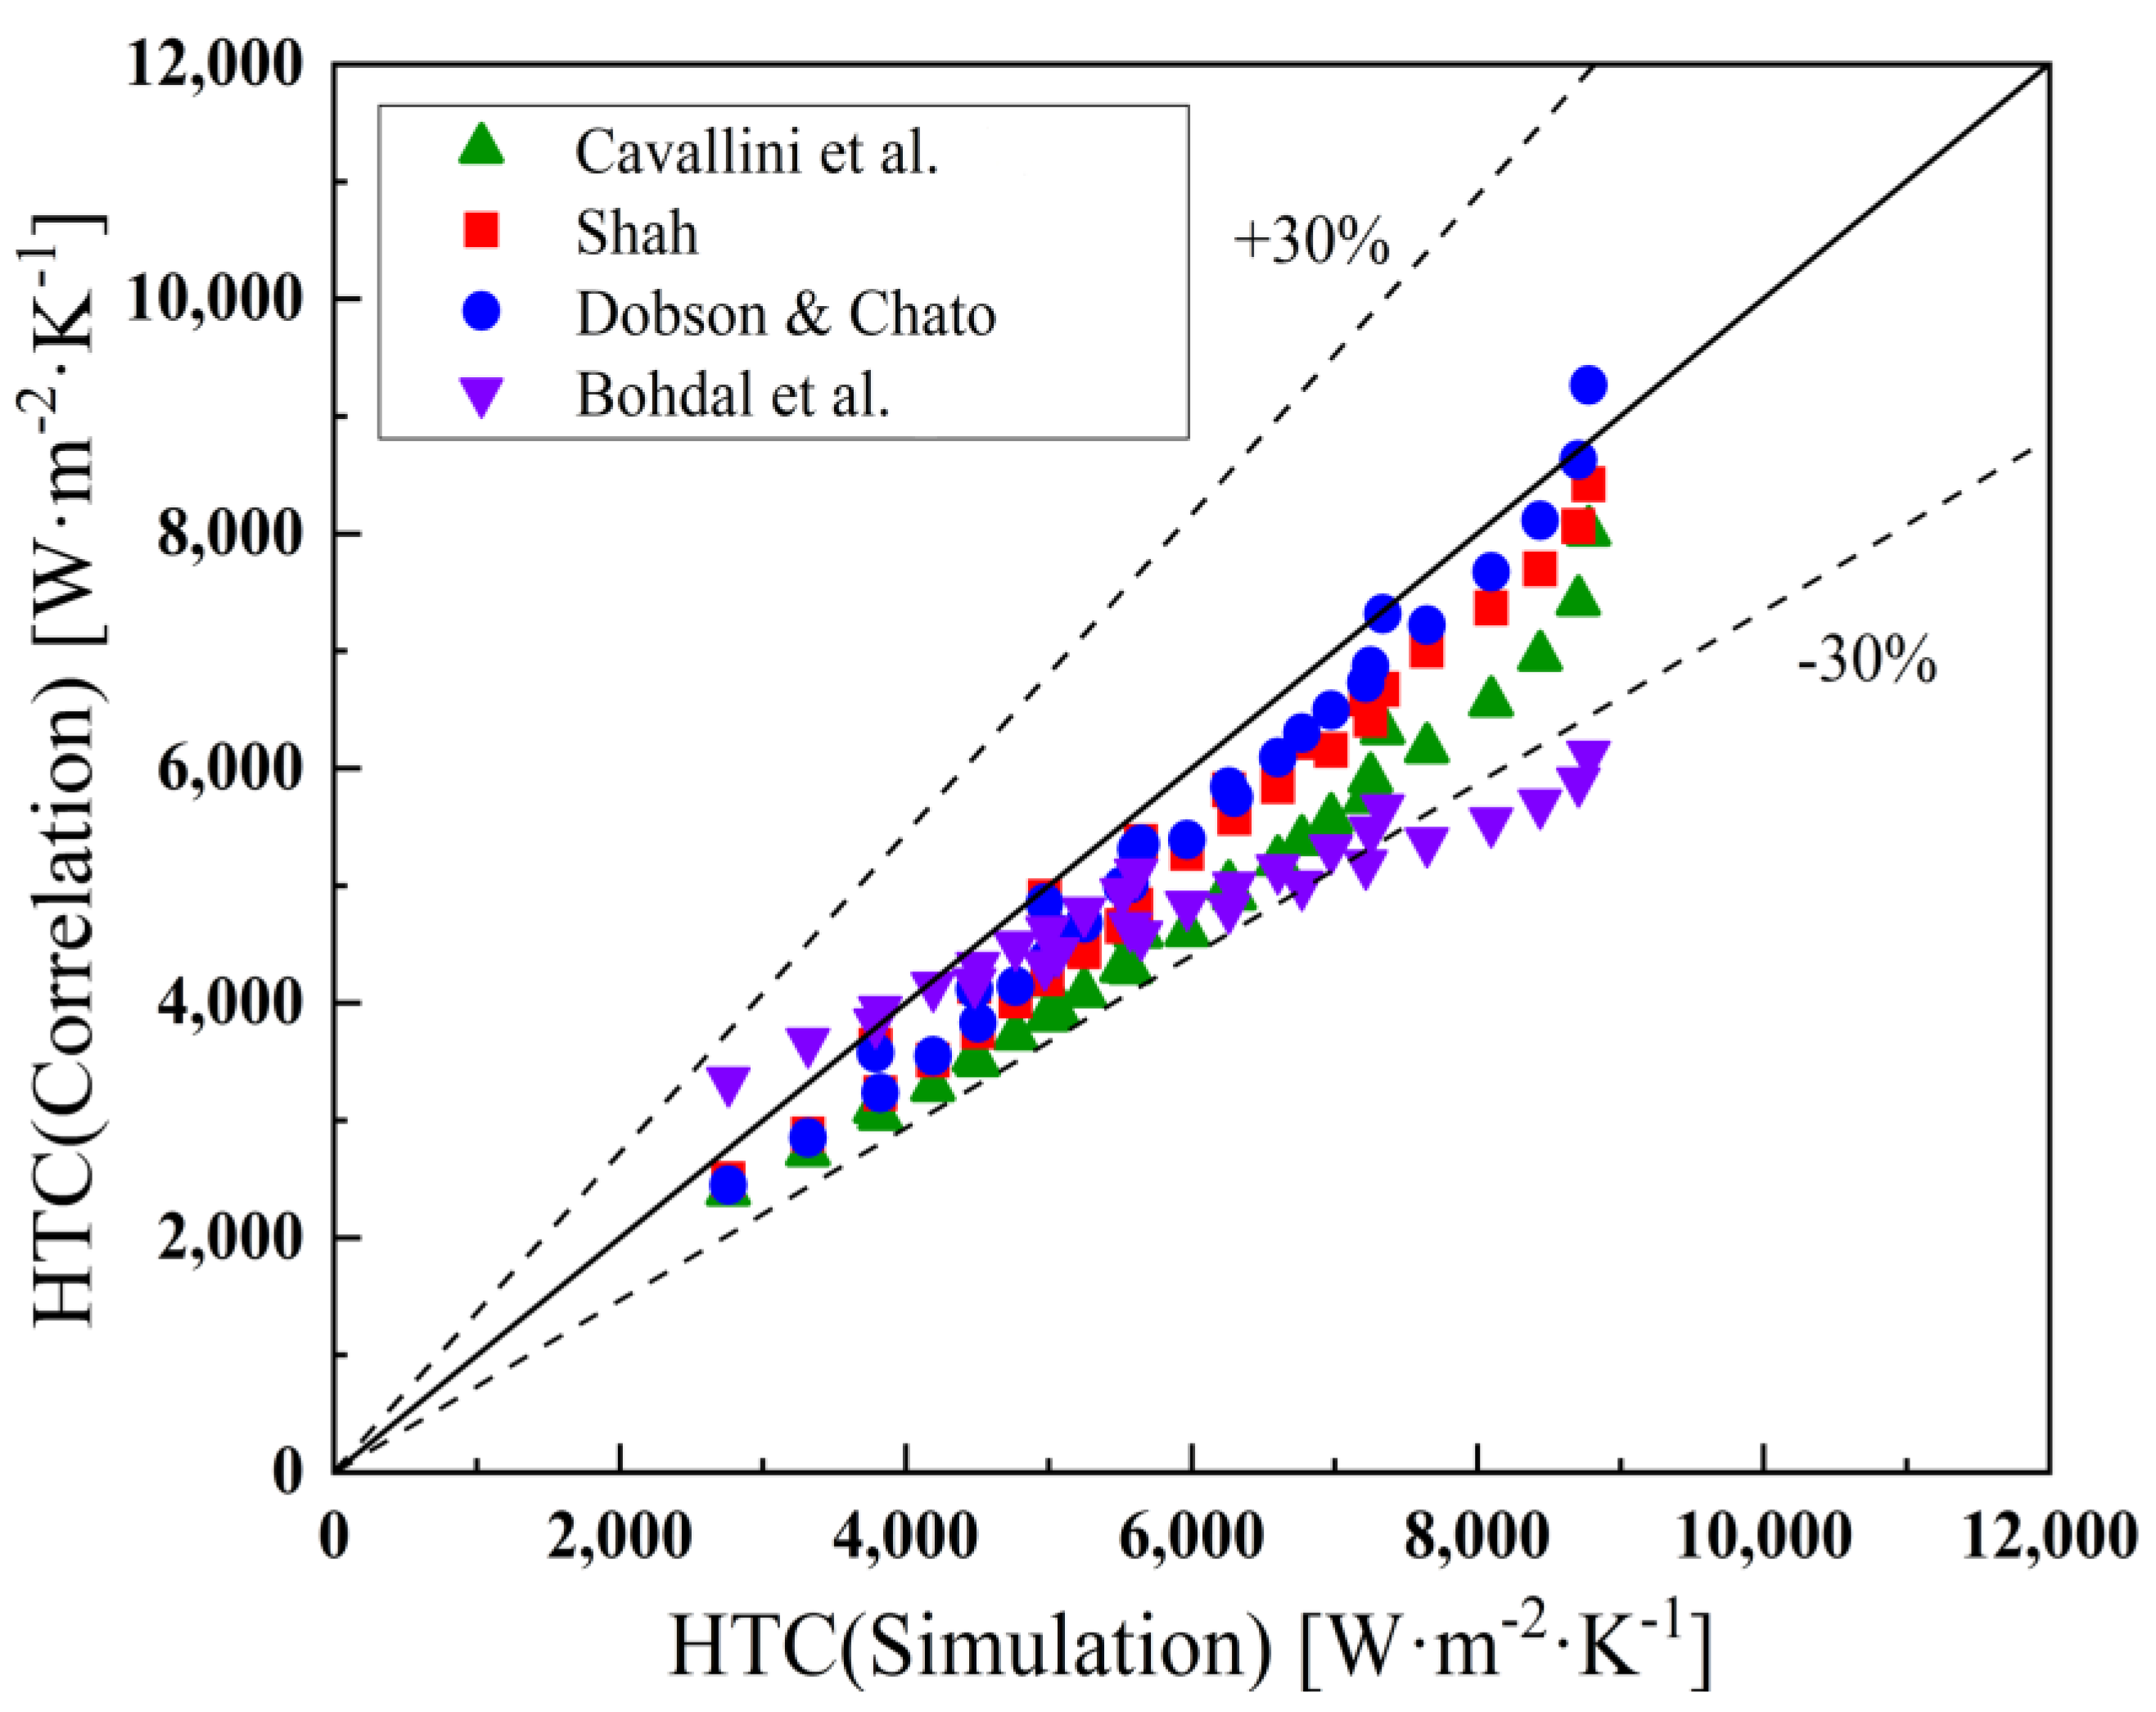
To further validate the reliability of the numerical model and the accuracy of results obtained in this paper, four widely used empirical correlations by Cavallini et al. [38], Shah [39], Dobson and Chato [40], and Bohdal et al. [41] are involved for comparing the HTC, which is shown in Figure 3.
The predicted HTC by Cavallini et al. [38], Shah [39], and Dobson and Chato [40] are smaller than that in the simulation, especially operating at low mass fluxes. Bohdal et al. [41] predicts a larger value than the simulated results at low mass flux, while the predicted value gets smaller than the simulated value at high mass flux. Note that the predicted value of Bohdal et al. [41] correlations display a small range, showing insensitive features to mass flux and vapor quality under the current working conditions. A comprehensive comparison shows that the correlation proposed by Dobson and Chato [40] shows the highest accuracy in comparison to the simulated results in this paper.
The mean absolute deviation (MAD) and mean relative deviation (MRD) values are calculated using Equations (21) and (22) to evaluate the reliability of correlational predictions.
where hpre means the value of correlation predicted, hsim means the simulated value and N means the number of the data. The MAD reflects the agreement between the predicted and simulated values and MRD indicates under-prediction or over-prediction of the corresponding data by its negative or positive sign. It can be seen from Table 3 that the correlation proposed by Dobson and Chato [40] demonstrates relatively similar predictive accuracy with MAD and MRD values of 8.08% and −7.71%, respectively.
3.3. Mesh Independence Verification
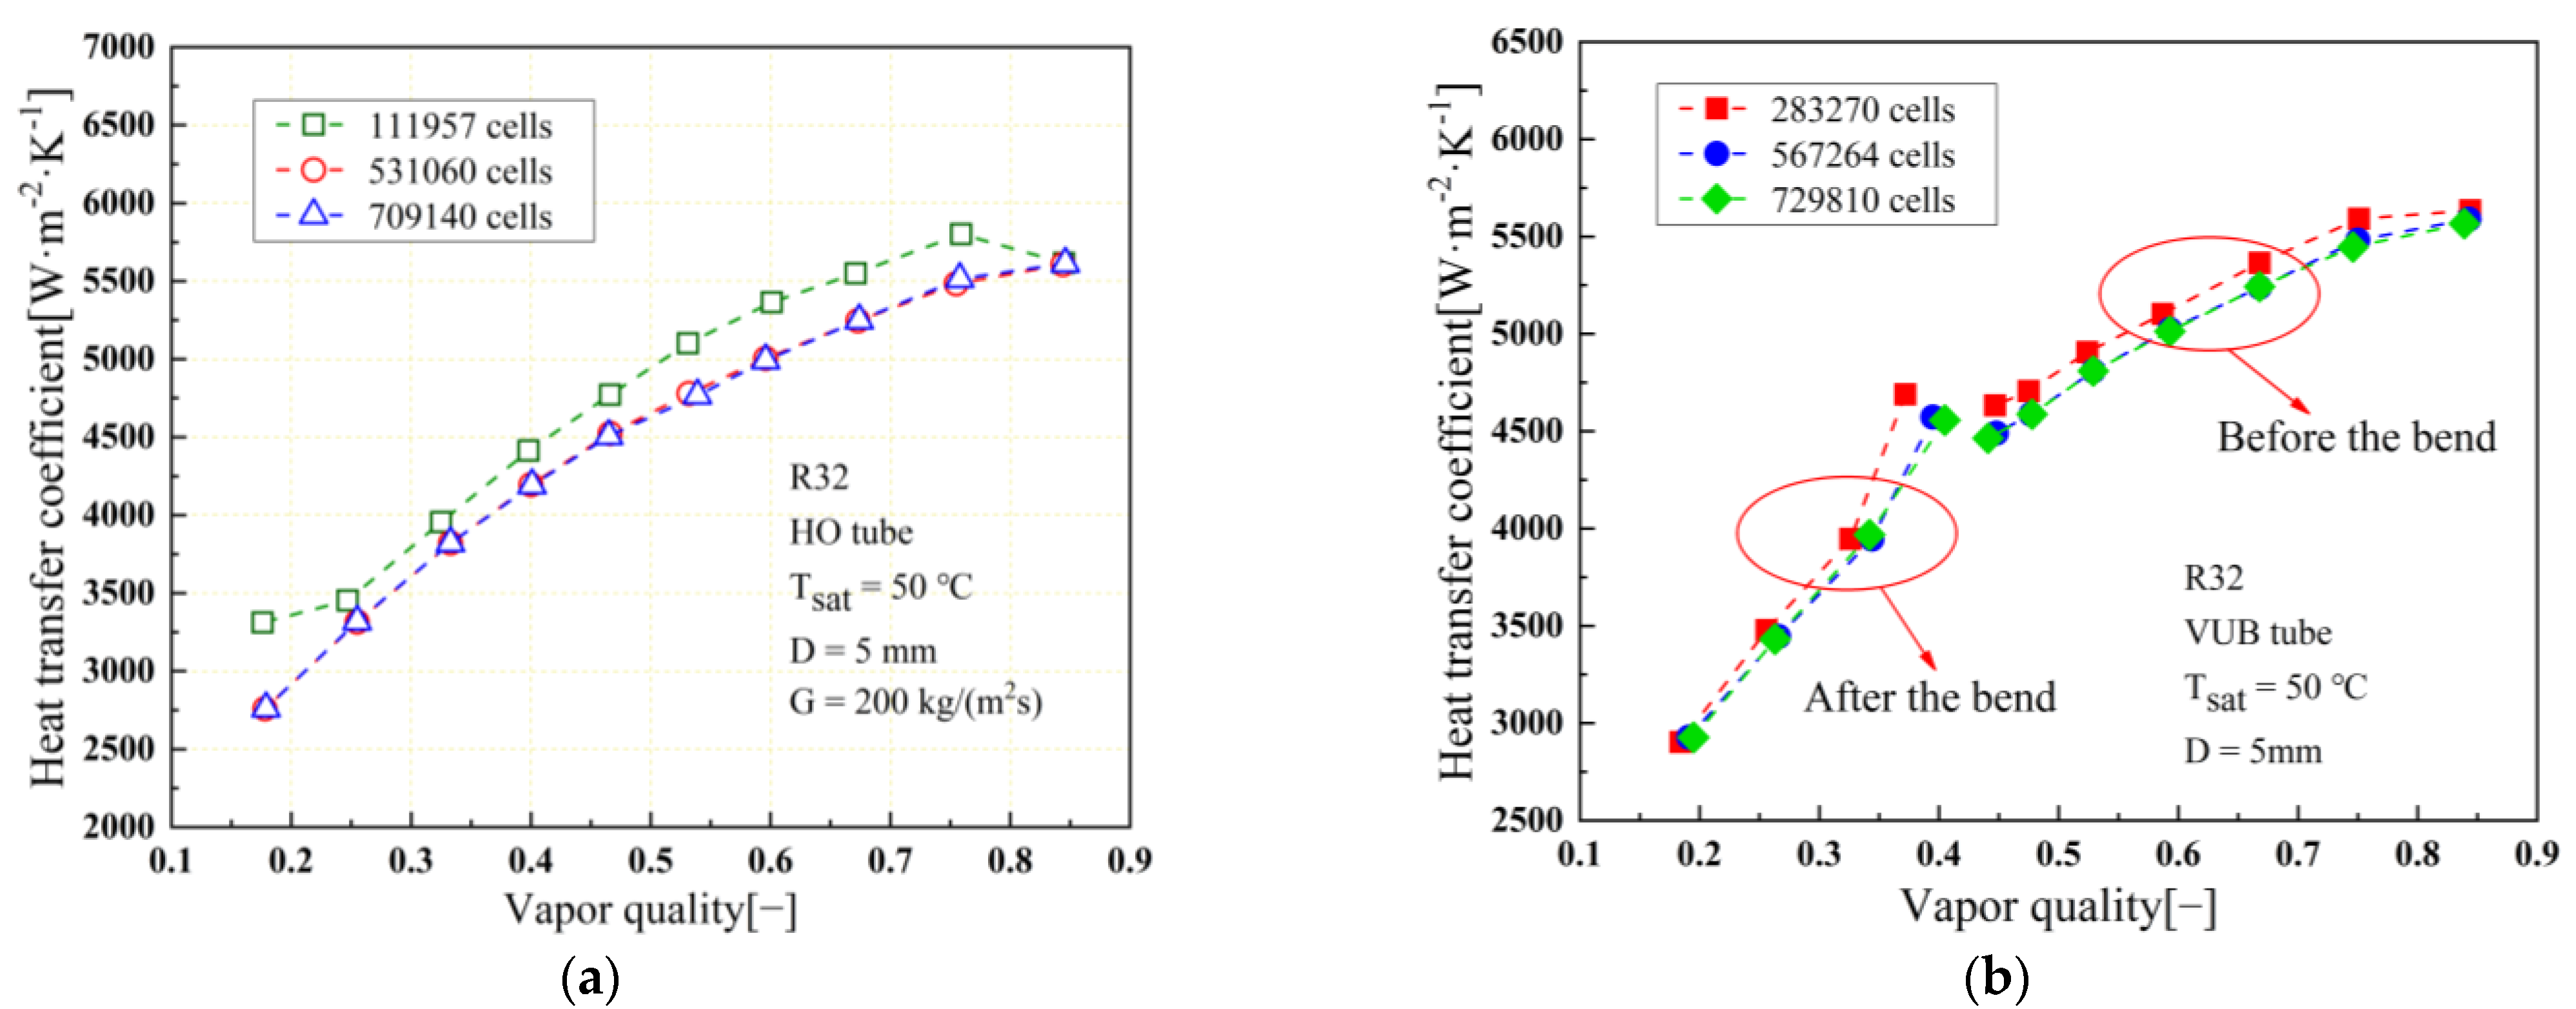
The hexahedral mesh system is generated to fill the computational domain. In order to capture detailed information of liquid film as well as ensure the Y+ value less than 1.0, the minimum size of the grid near the wall was divided within 0.001 mm. A total of three mesh systems for HO tube and VUB tube are calculated. The case with G = 200 kg/(m2·s) is selected while the transient simulation is applied until reaching the time average steady statement. Figure 4 depicts the comparison of HTC when applying three different mesh systems. It can be seen that the HTC shows a slight decrease with the increase in the mesh cell number. For the HO tube, results with 531,060 cells and 709,140 mesh cells are almost the same. For VUB tube, results with 567,264 and 729,810 mesh cells show rare differences. Considering the time cost and the simulation accuracy, cases with 531,060 and 567,264 mesh cells are applied for the future investigation for HO tube and HUB/VUB tube, respectively.
4. Results and Discussion
4.1. Analysis on Local Characteristics
As mentioned previously, the HTC is related to the refrigerant thermal properties and operating conditions due to the changes of surface tension, gravity, shear stress and turbulence effects, which was concluded by Wen et al. [18]. In order to demonstrate the effect of mass flux and vapor quality on the two-phase flow pattern and local HTC of R32 flow condensation in the HO tube, the liquid–vapor phase distribution, phase interface and local liquid film thickness (LLFT) as well as local heat transfer coefficient (LHTC) are depicted, respectively.
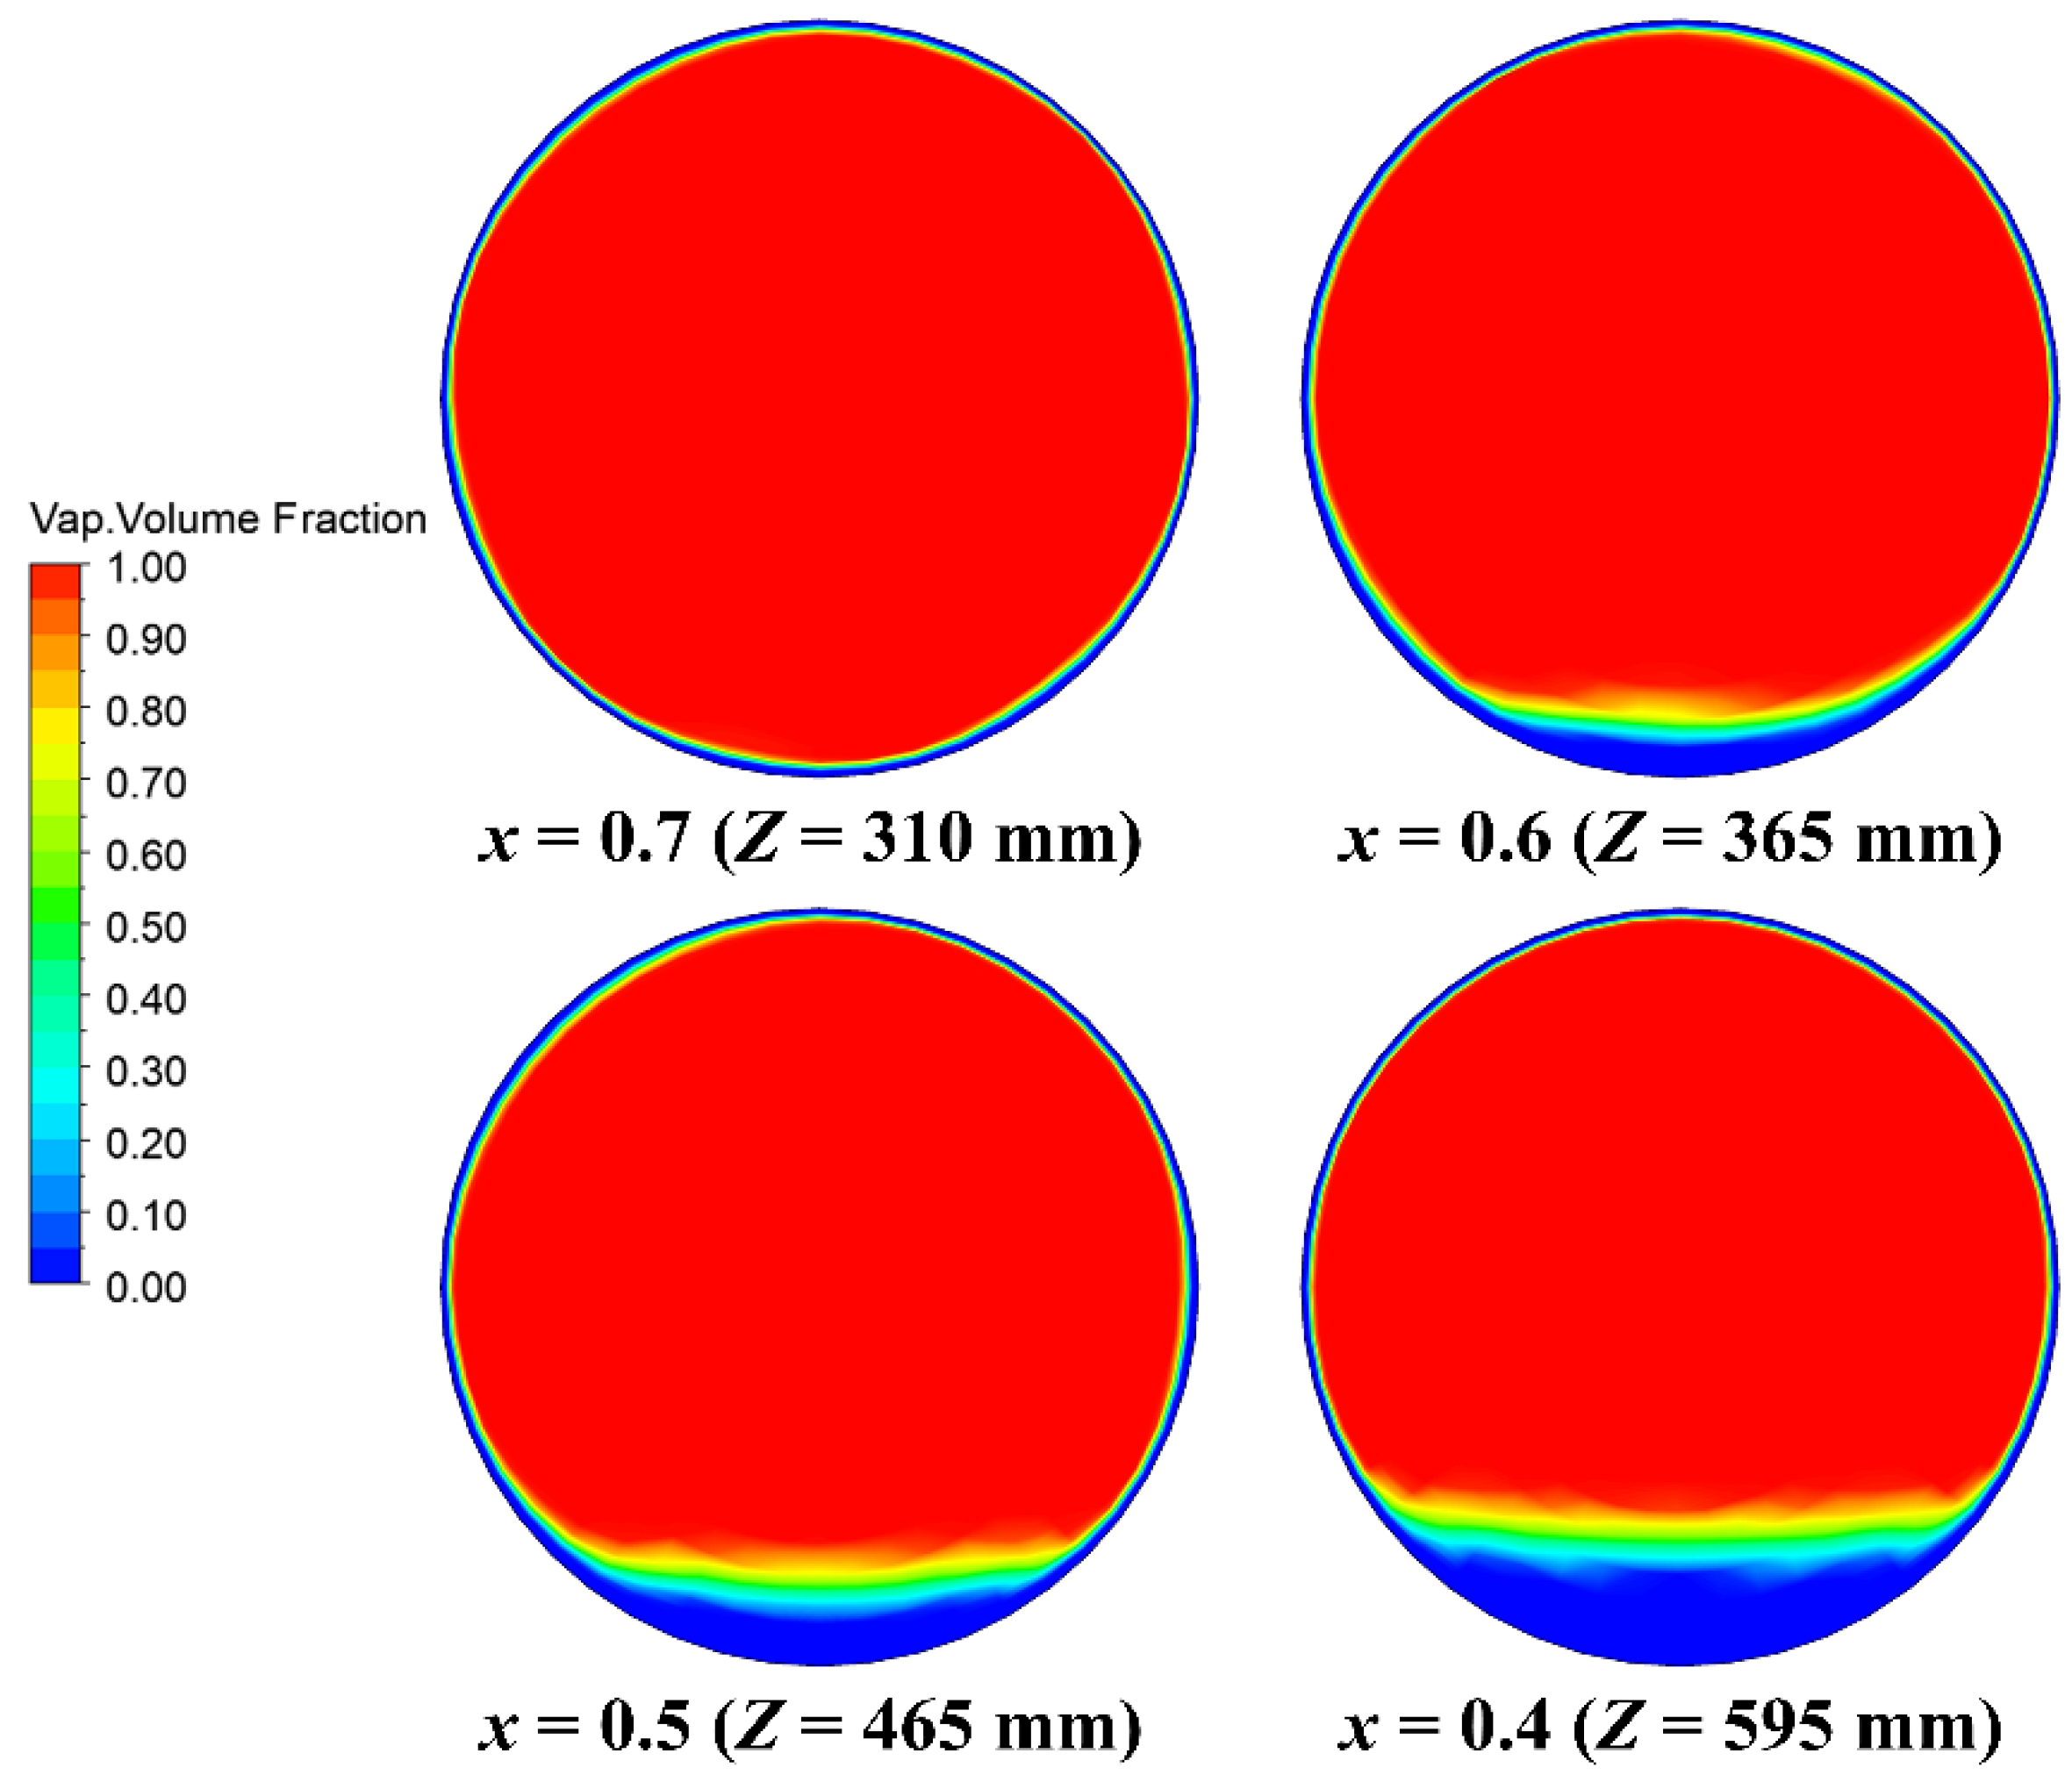
Figure 5 shows the cross-sectional distribution of vapor phase volume fraction at different vapor quality under mass flux G = 400 kg/(m2·s). The positions of each intersection in the Z direction are also marked. It can be found that as the vapor quality decreases, the length required to change the same vapor quality (Δx = 0.1) becomes bigger, which indicates that the condensation heat transfer performance gradually decreases with the vapor quality decreases. Additionally, it can be found that in a relatively large range of vapor qualities, the two-phase flow of R32 reaches annular flow. The vapor phase with high velocity is distributed in the center of the tube, while the liquid phase is distributed near the tube wall due to the condensation at the low temperature wall. When the vapor quality increases to about 0.7, the liquid phase surrounding the inner tube wall is almost uniform along the circumferential direction due to the inertial effect. With the decrease in the vapor quality, the liquid phase is gradually extended and the average velocity of the fluid gradually drops. Meanwhile, the gravity starts to dominate the distribution of the liquid phase, pulling the liquid phase from the rest part down to the bottom of the tube due to the relative higher density of liquid phase. As a result, the liquid phase gradually accumulates at the bottom of the tube. In addition, the surface tension is also taken into account, which aims to avoid the high interfacial curvature in the two-phase distribution in order to reduce surface energy. Note that the phase interface distribution of vapor–liquid presents a smooth arc shape in annular flow.
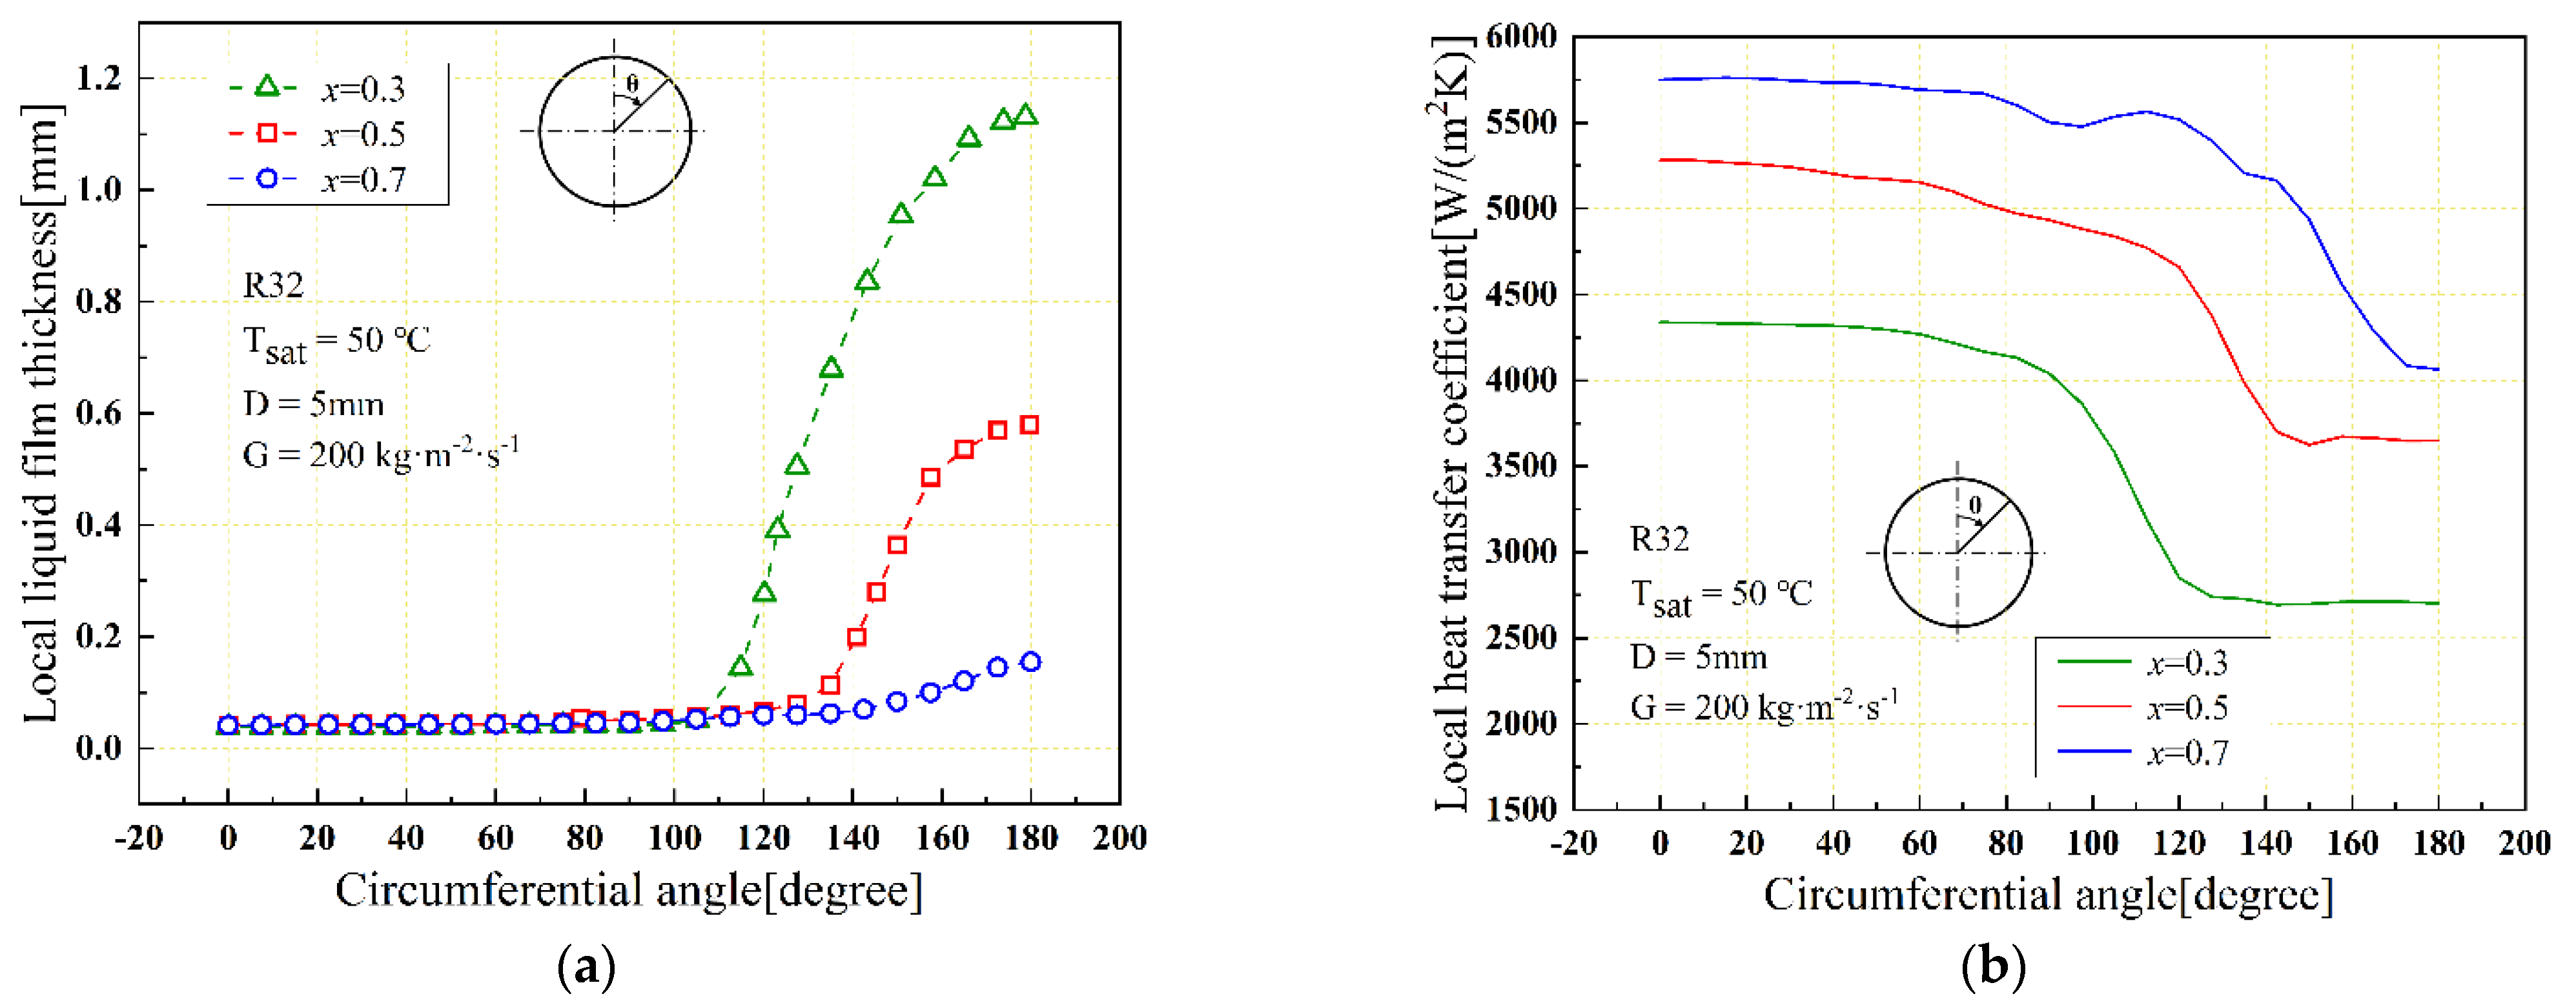
The LLFT and LHTC versus circumferential angle at different vapor quality under mass flux G = 200 kg/(m2·s) in the HO tube is shown in Figure 6. From Figure 6a, it can be seen that the LLFT maintains a relatively stable state with rare changes from θ = 0 to 100°. Then, it increases rapidly with the increase in angle after reaching the angle where the local liquid film thickness starts to increase rapidly. The dramatic change point might move forward with the decrease in vapor quality and the growth rate of LLFT as well as the peak LLFT increase with the decrease in vapor quality. When applying x = 0.3, the average thickness of circumferential liquid film is about 0.3435 mm and the maximum LLFT reaches 1.1311 mm while the average thickness of circumferential liquid film is 0.0669 mm and the maximum LLFT is 0.1551 mm when vapor quality raising to 0.7. Meanwhile, from Figure 6b, the maximal LHTC is at the top part of the tube which could maintain a period of steady state and then start to drop sharply. The LLFT plays negative influence on LHTC due to the constant wall temperature boundary condition is applied. The thinner the LLFT is, the greater the local temperature gradient is. In the present case, the heat transfer effect accounts for about 75% of the total circumferential region with the range of θ between 0 and 120°, indicating that the relatively larger heat transfer thermal resistance in the thick liquid film region.
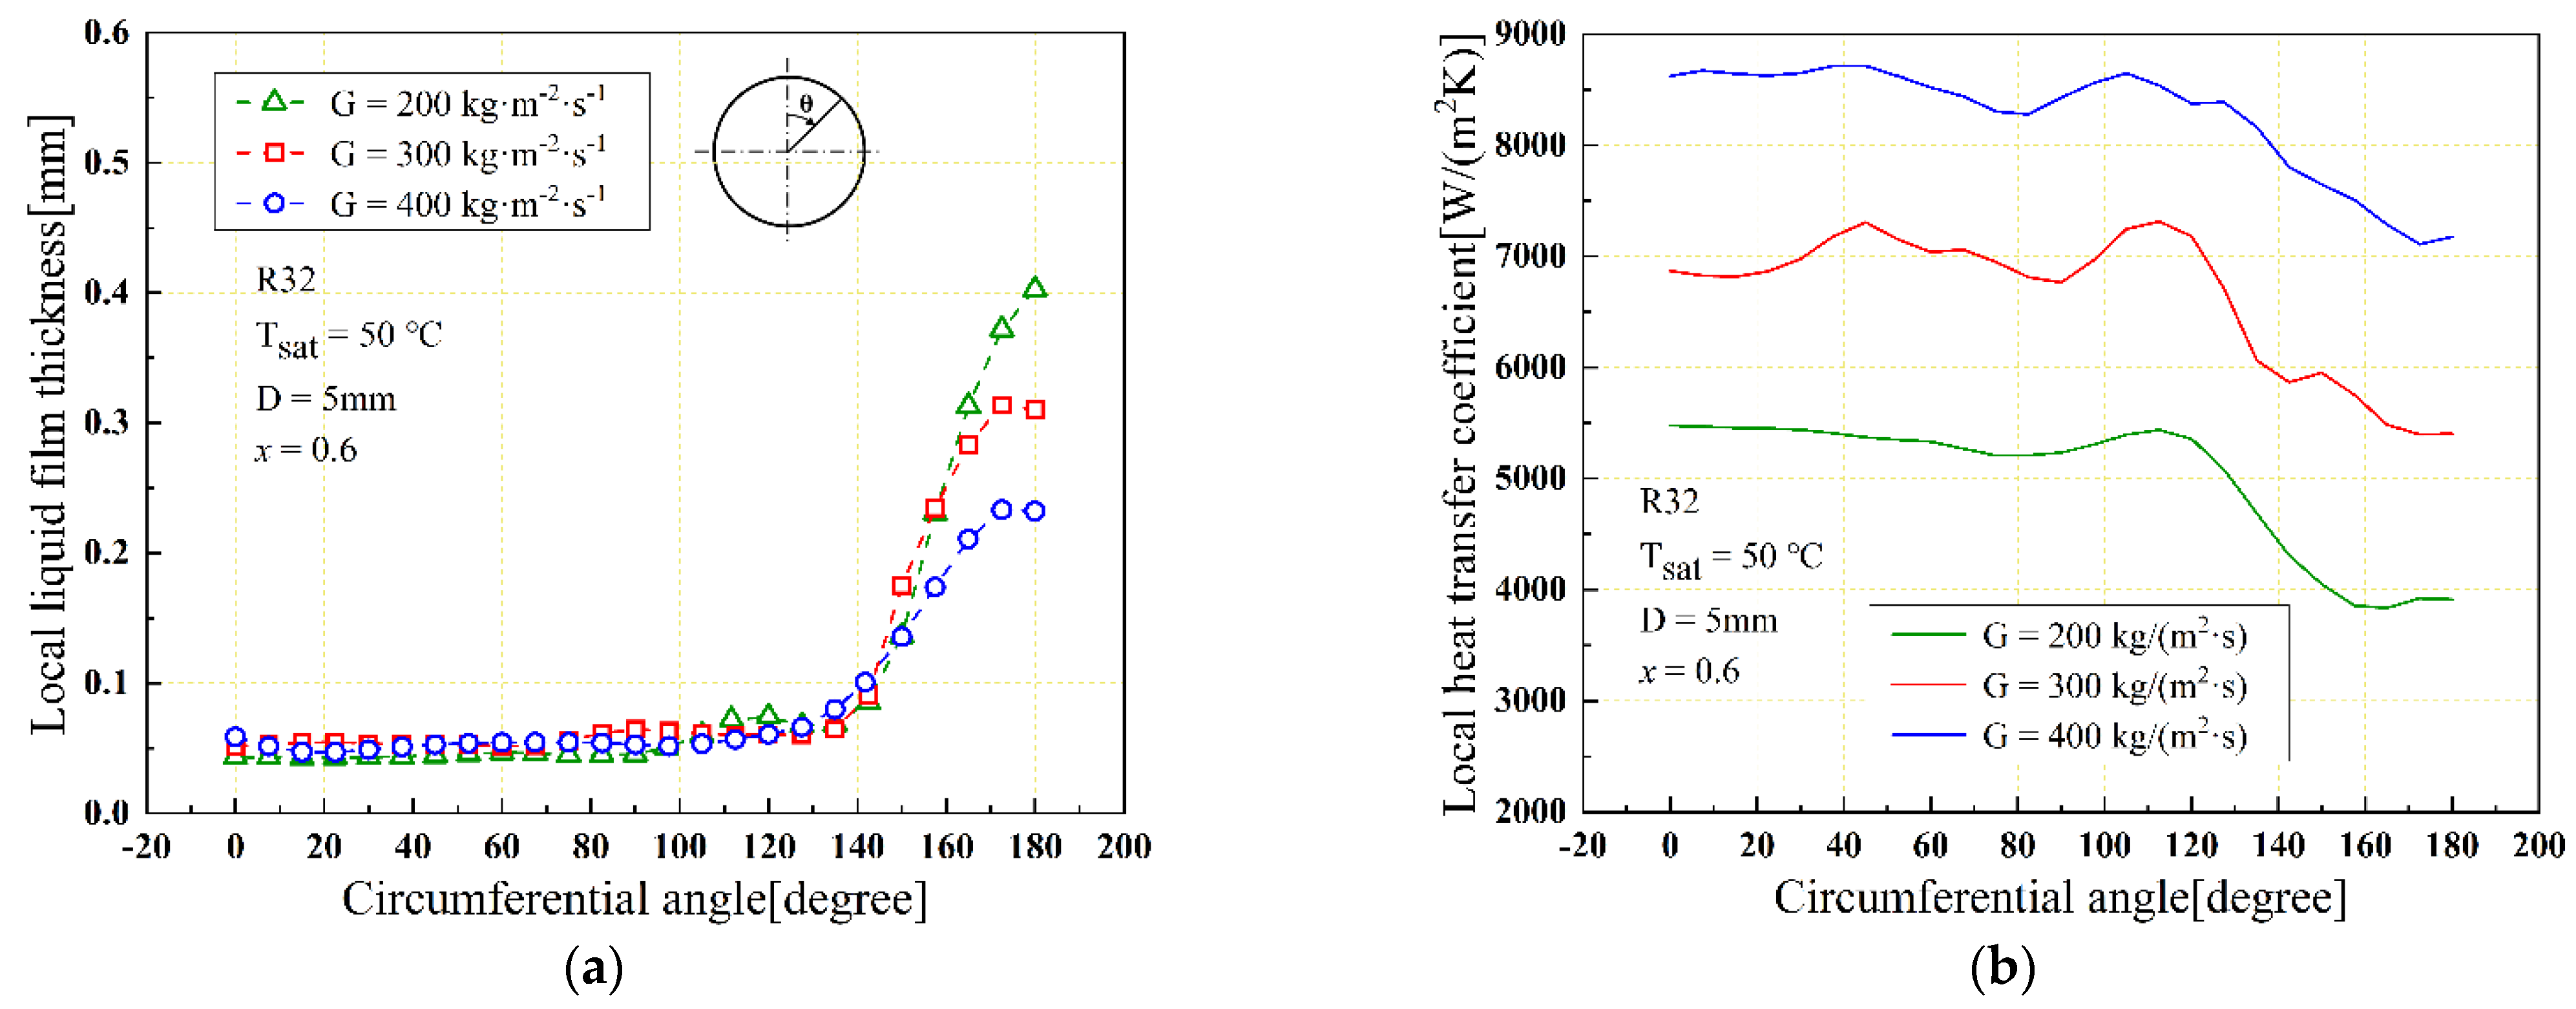
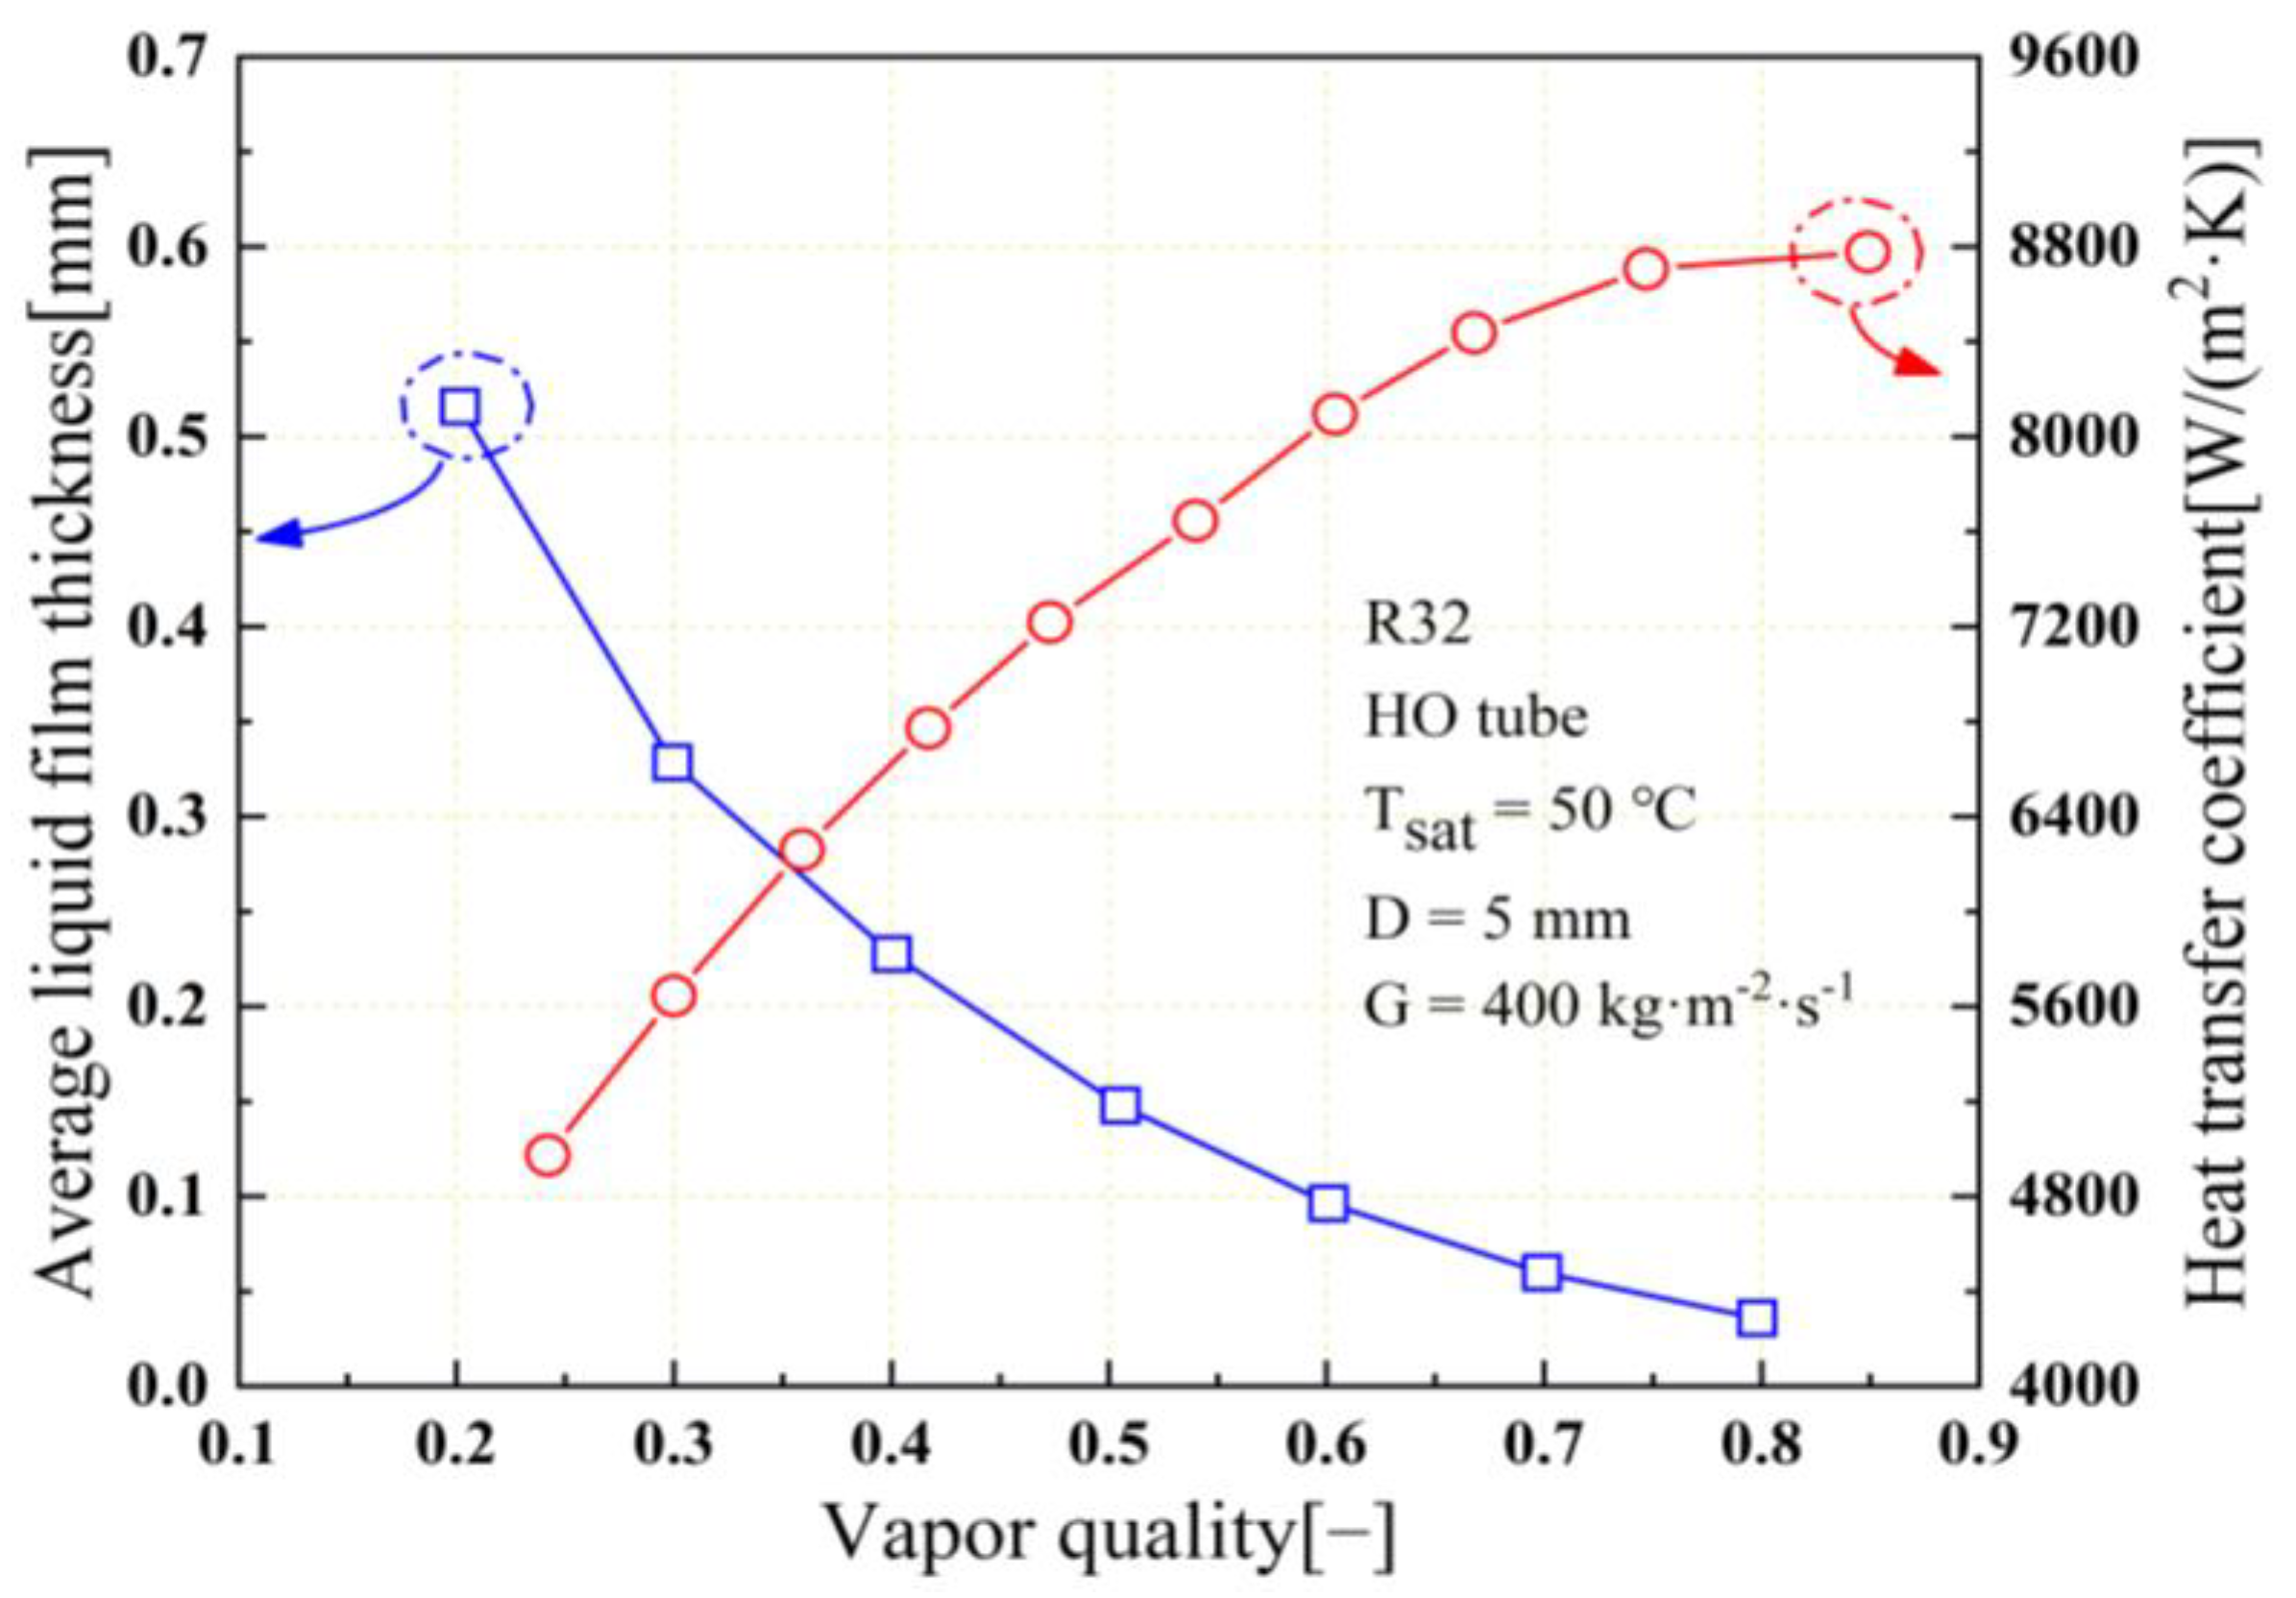
Figure 7 illustrates the LLFT and LHTC versus the circumferential angle at different mass flux under the vapor quality of 0.6 in the HO tube. The mass flux might impact the circumferential liquid film distribution and LHTC. With the increase in mass flux, the growth rate of LLFT at the bottom part of tube and the maximum LLFT gradually increases due to the weakening inertia effect caused by the flow velocity reduction. In this regard, the LLFT at the top part of tube is slightly thinner when operating at low mass flux under the same vapor quality. When applying G = 200 kg/(m2·s), the maximum LLFT is 0.4026 mm, and the average liquid film thickness in the upper half part of the tube (θ = 0~90°) is 0.0442 mm. After the mass flux increases to 300 kg/(m2·s), the maximum LLFT decreases to 0.3102 mm, while the average liquid film thickness in the upper half part of the tube rises to 0.0546 mm. The mass flux shows tiny impact on the sharp change point of LLFT. However, the sharp change point angle of the LHTC shows smaller value than that of the LLFT, which is because that the LHTC is simultaneously influenced by the surrounding vapor–liquid distribution. Zhang and Li [12] pointed out that the turbulent thermal conductivity also affects the HTC when considering the turbulence effect while the turbulent thermal conductivity is higher at the bottom part of the tube. The local HTC is influenced by both the local liquid film thickness as well as the effective thermal conductivity. The distribution of average liquid film thickness and HTC under different vapor quality in the HO tube is shown in Figure 8. Note that the HTC and the average liquid film thickness might change with the vapor quality inversely. The slope of trend becomes progressively slower with the increase in vapor quality. It can be concluded that the liquid film thickness plays an important role in the thermal resistance of heat transfer during flow condensation.
4.2. Flow Pattern Variation with U-Bends
As mentioned previously, the phase distribution might affect the heat transfer and pressure drop during flow condensation process [18]. In order to investigate the phase distribution of R32 in HUB tube and VUB tube, the flow pattern, local liquid film accumulation characteristics and local condensation heat transfer characteristics after passing through U-bends are studied.
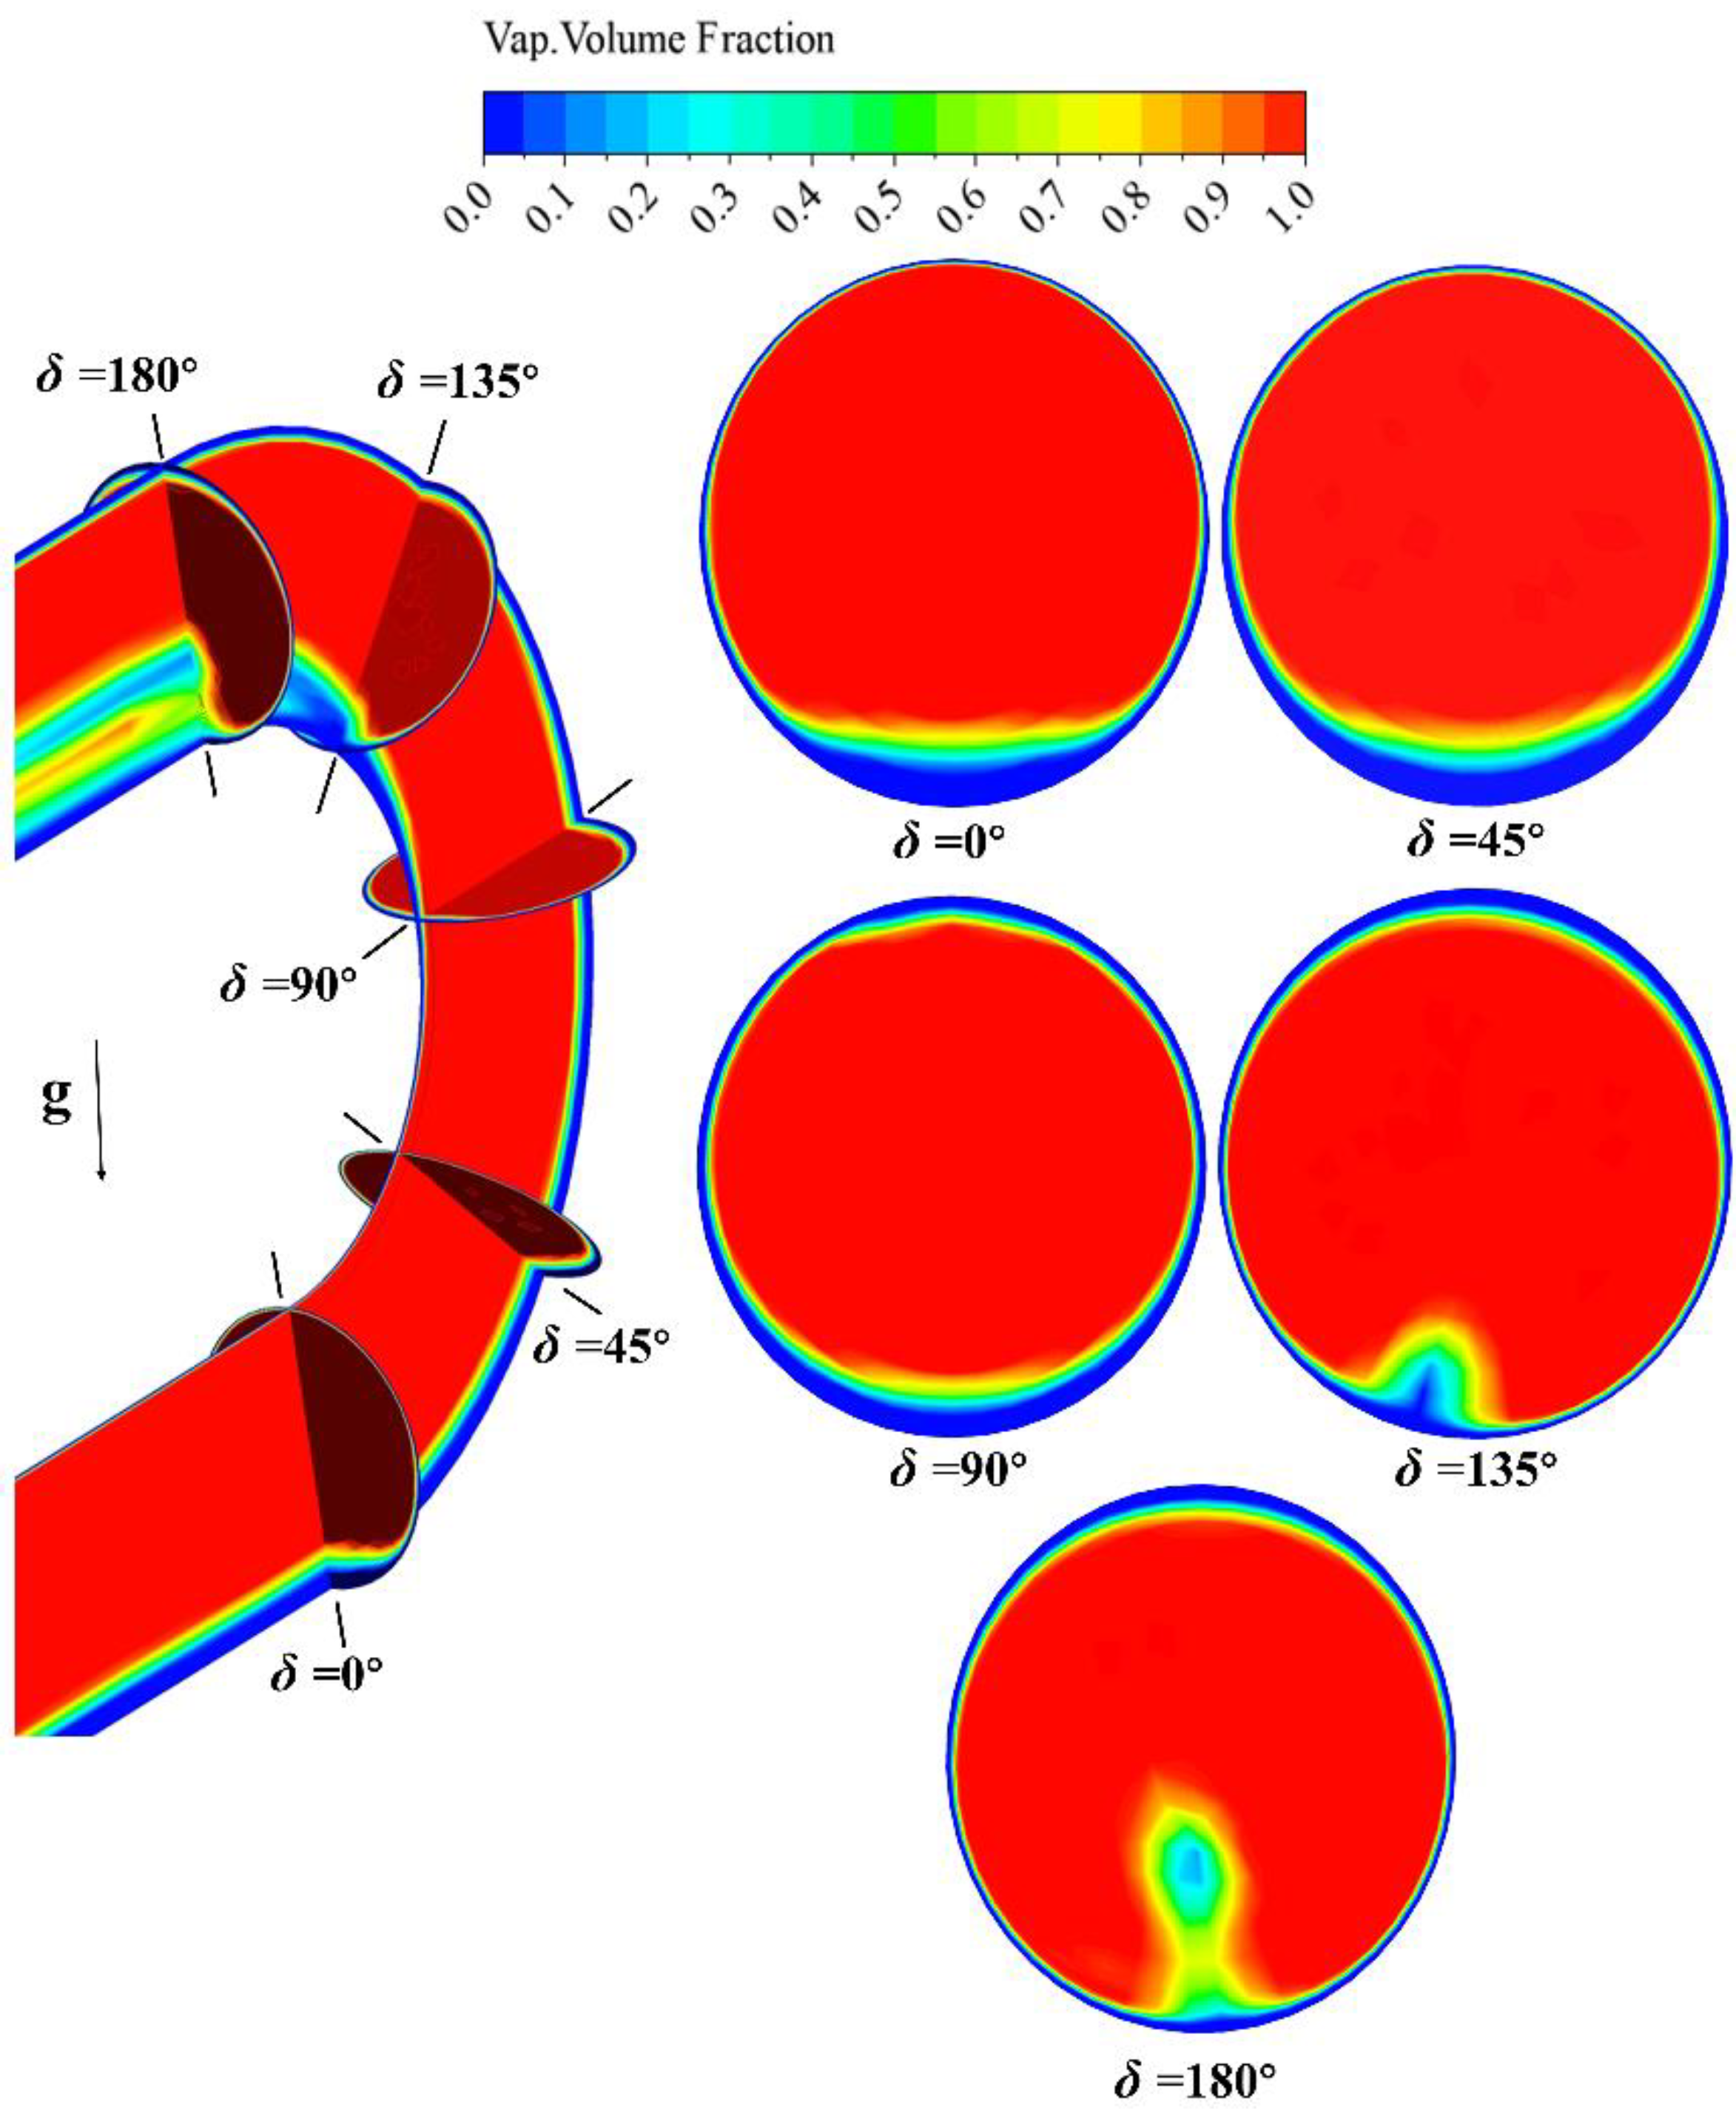
Figure 9 and Figure 10 show the distribution of volume fraction of vapor phase at the U-bend section under G = 300 kg/(m2·s) in VUB tube and HUB tube, respectively. The colors represent the volume fraction of vapor phase. Note that the flow enters the U-bend section under annular flow pattern with vapor quality between 0.4 to 0.5. Before entering the U-bend section, the vapor–liquid interface is distributed with a smooth arc shape due to the exist of gravity, surface tension, inertia and shear stress. After entering the U-bend section, the centrifugal force becomes dominant for the distribution of two phases and the flow condensing process. The phase distribution at the U-bend section is relatively complex because of the intense flow mixing between vapor and liquid causing by the geometry factor and the secondary flow.
For the VUB tube, the angle between gravity and centrifugal force becomes progressively larger as the flow proceeds, gradually changing from 0° to 180°. As shown in Figure 9, along with the flow direction from δ = 0° to 90° (δ stands for the U-bend section angle), the liquid phase distribution near the tube wall gradually becomes uniform due to the gradual smaller component of gravity in the normal direction. With the joint action of gravity and centrifugal force, the liquid film around the tube wall gradually becomes uniform. However, the liquid film at centrifugal part of tube is thicker. Along with the flow from δ = 90° to 180°, the centrifugal action tends to pull the denser liquid phase toward the centrifugal part of tube, resulting in the thicker liquid film. Eventually, the thickness gradually exceeds that at the lower part of the tube (pericenter part). It is also noticed that, with the influence of inertia, the liquid phase in the pericenter part gradually breaks away from the tube wall and then forms larger droplets suspended into the gas phase, showing a significant effect on the local heat transfer characteristics.
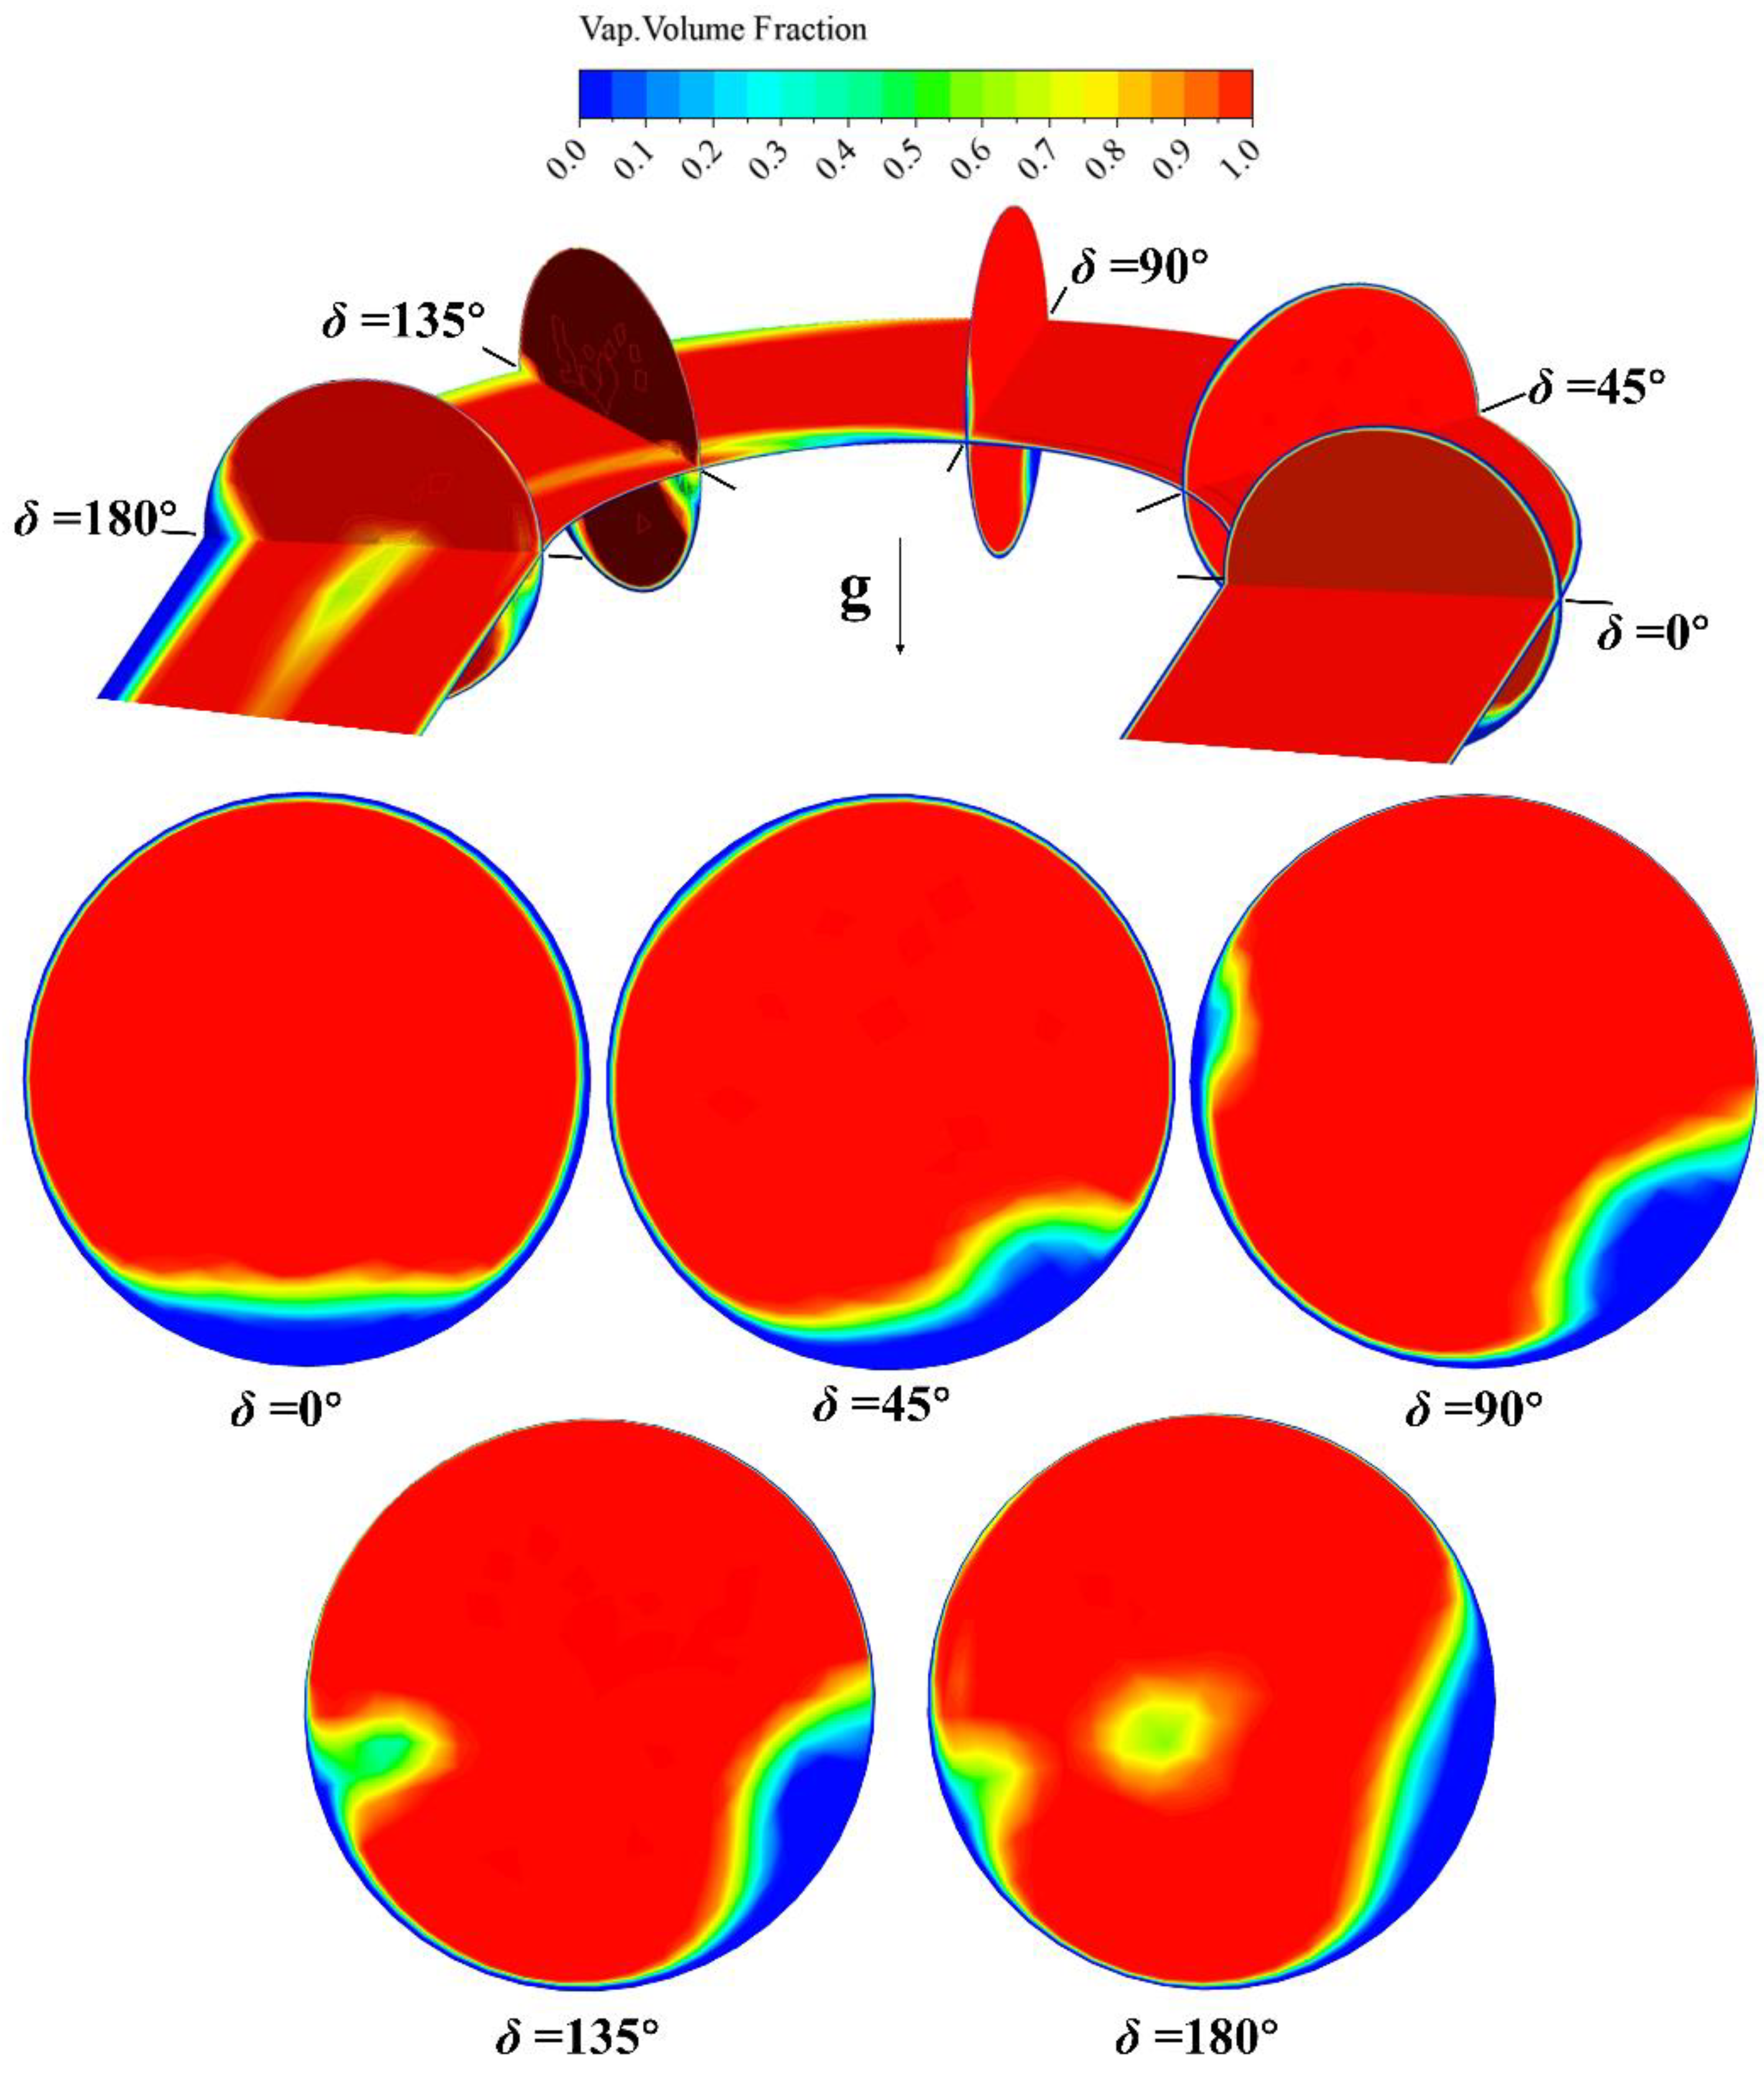
In the HUB tube, the angle between the centrifugal force and the gravity maintains at 90°, and the centrifugal action tends to pull the denser liquid phase toward the centrifugal part of tube while the gravitational action tends to keep the denser liquid phase at the bottom part of tube. As shown in Figure 10, during the flow through U-bend section in HUB tube, the main liquid phase gradually moves from the bottom part of the tube to the right side of the tube. As the result, the maximum LLFT point gradually moves from θ = 180° to 100°. This is similar to the case in VUB tube when δ reaching over 90°, part of the liquid phase in the pericenter part of tube gradually breaks away from the wall due to inertia, gradually forming liquid droplets. Then, the combination of gravity and centrifugal force might pull the liquid phase straight to the bottom-right part of the tube, thinning the liquid film in the rest part of the tube, especially in the upper part. After flowing through the U-bend section, the gravity again dominates the distribution of the gas–liquid phase, indicating that the flow pattern quickly changes back to the status as that in the horizontal straight tube.
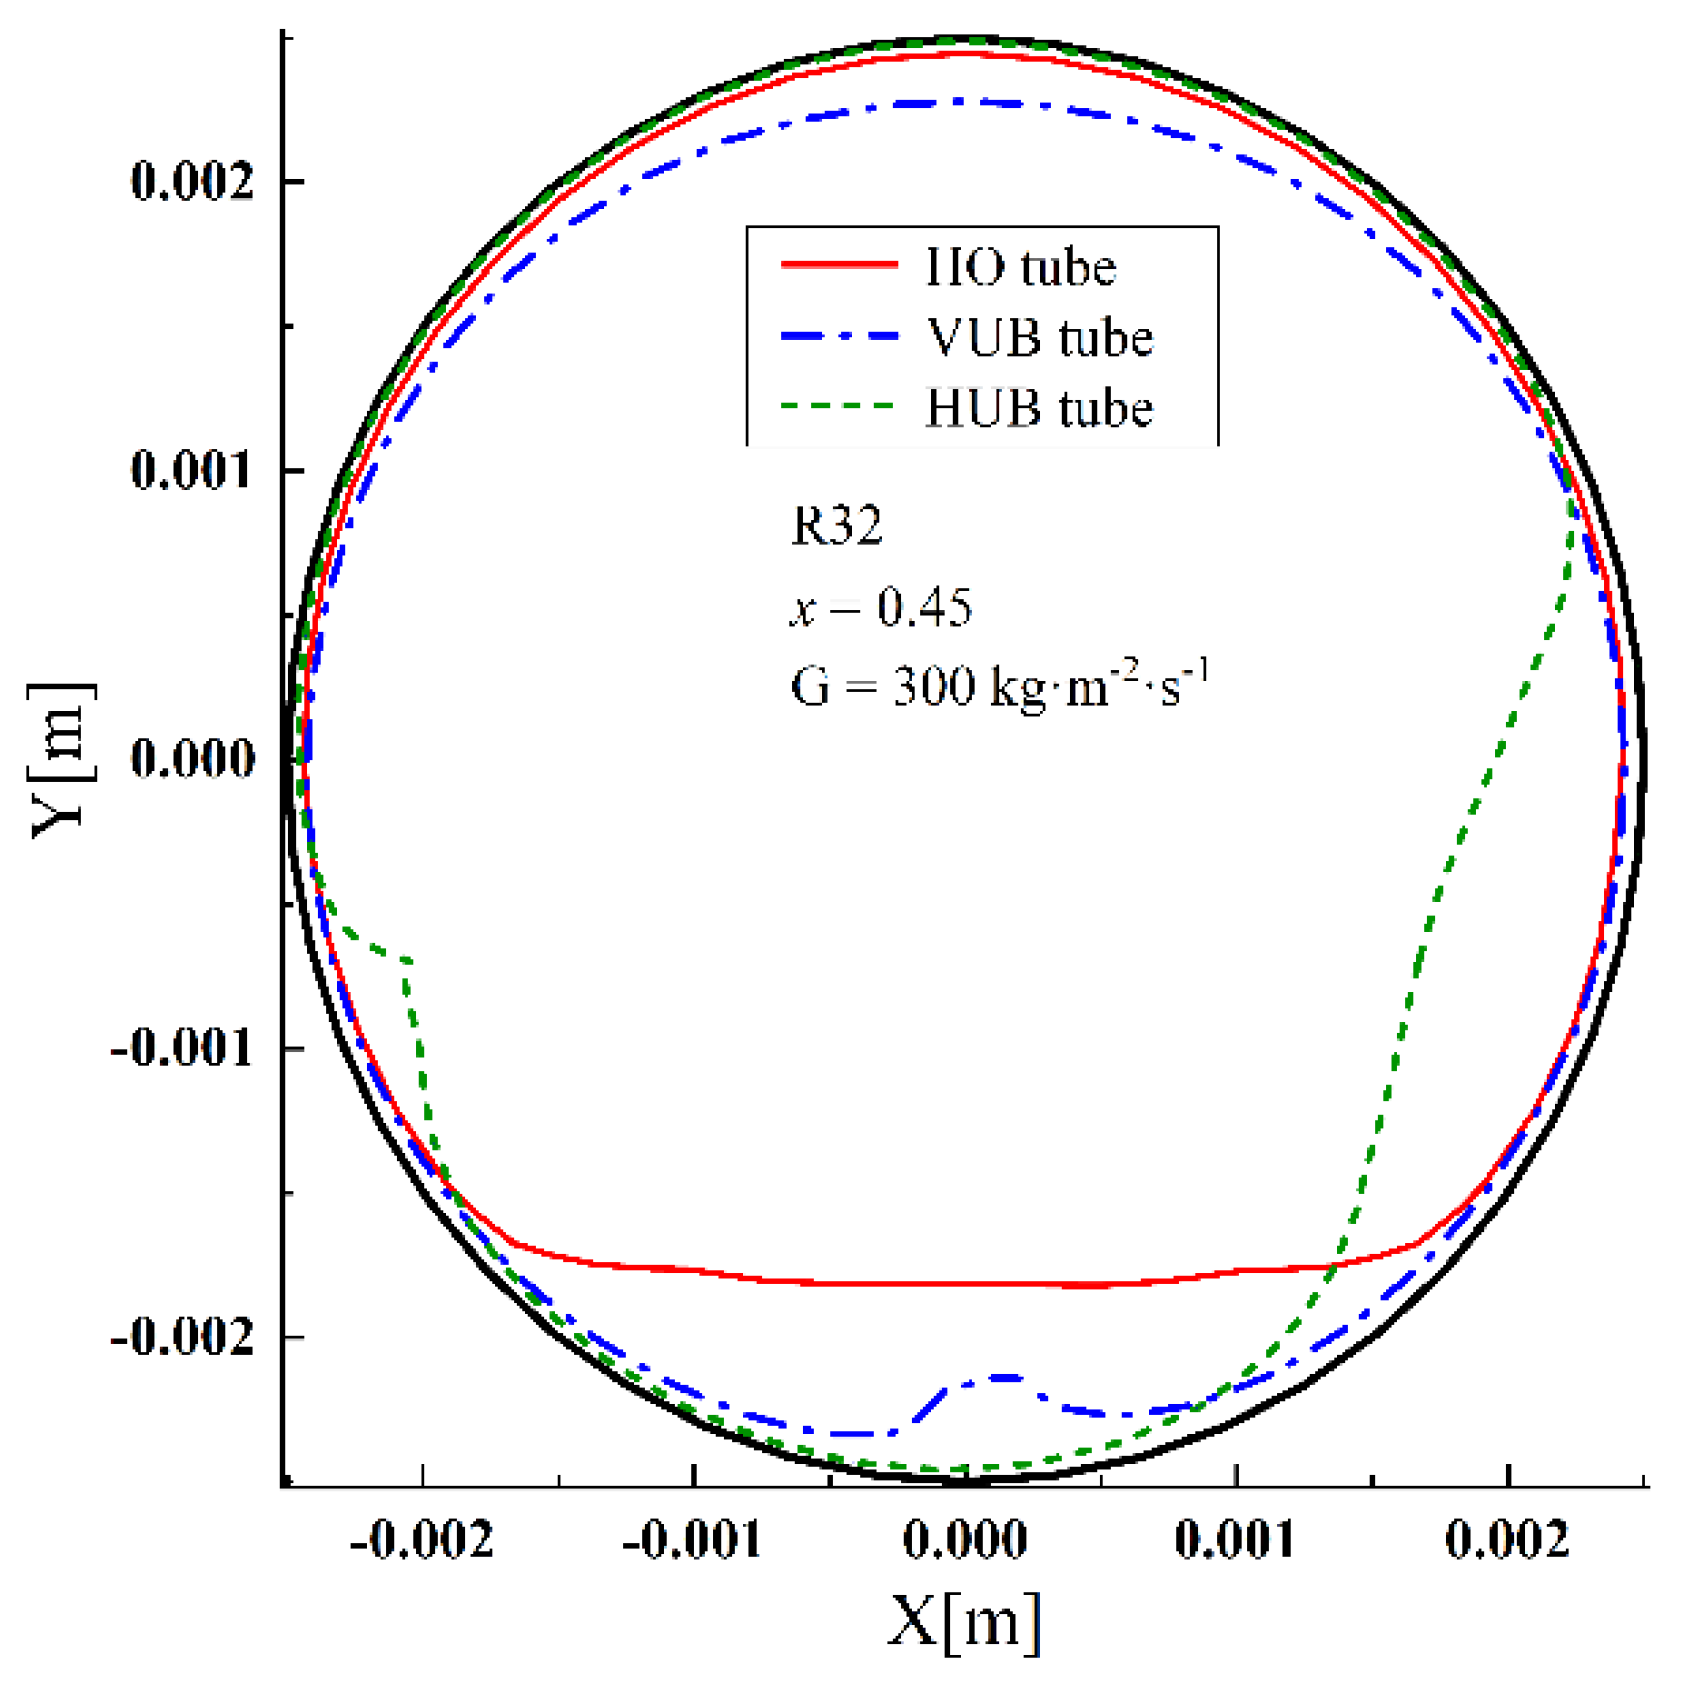
Figure 11 shows the distribution of vapor–liquid interface at the cross-section surface of δ = 180° in VUB, HUB and HO tubes under the same vapor quality. It can be found that the LLFT at bottom part of the tube is significantly thinner in VUB tube and HUB tube compared to that in HO tube. This is because of the combined effect of centrifugal and gravitational forces. On the other hand, the liquid film distribution in the left and right sides of VUB tube is almost the same with that in HO tube while the LLFT in the upper part is thicker due to the presence of centrifugal effect. Meanwhile, the liquid phase in the HUB tube is mainly concentrated in the bottom-right part of the tube, which makes the LLFT in the rest relatively small.
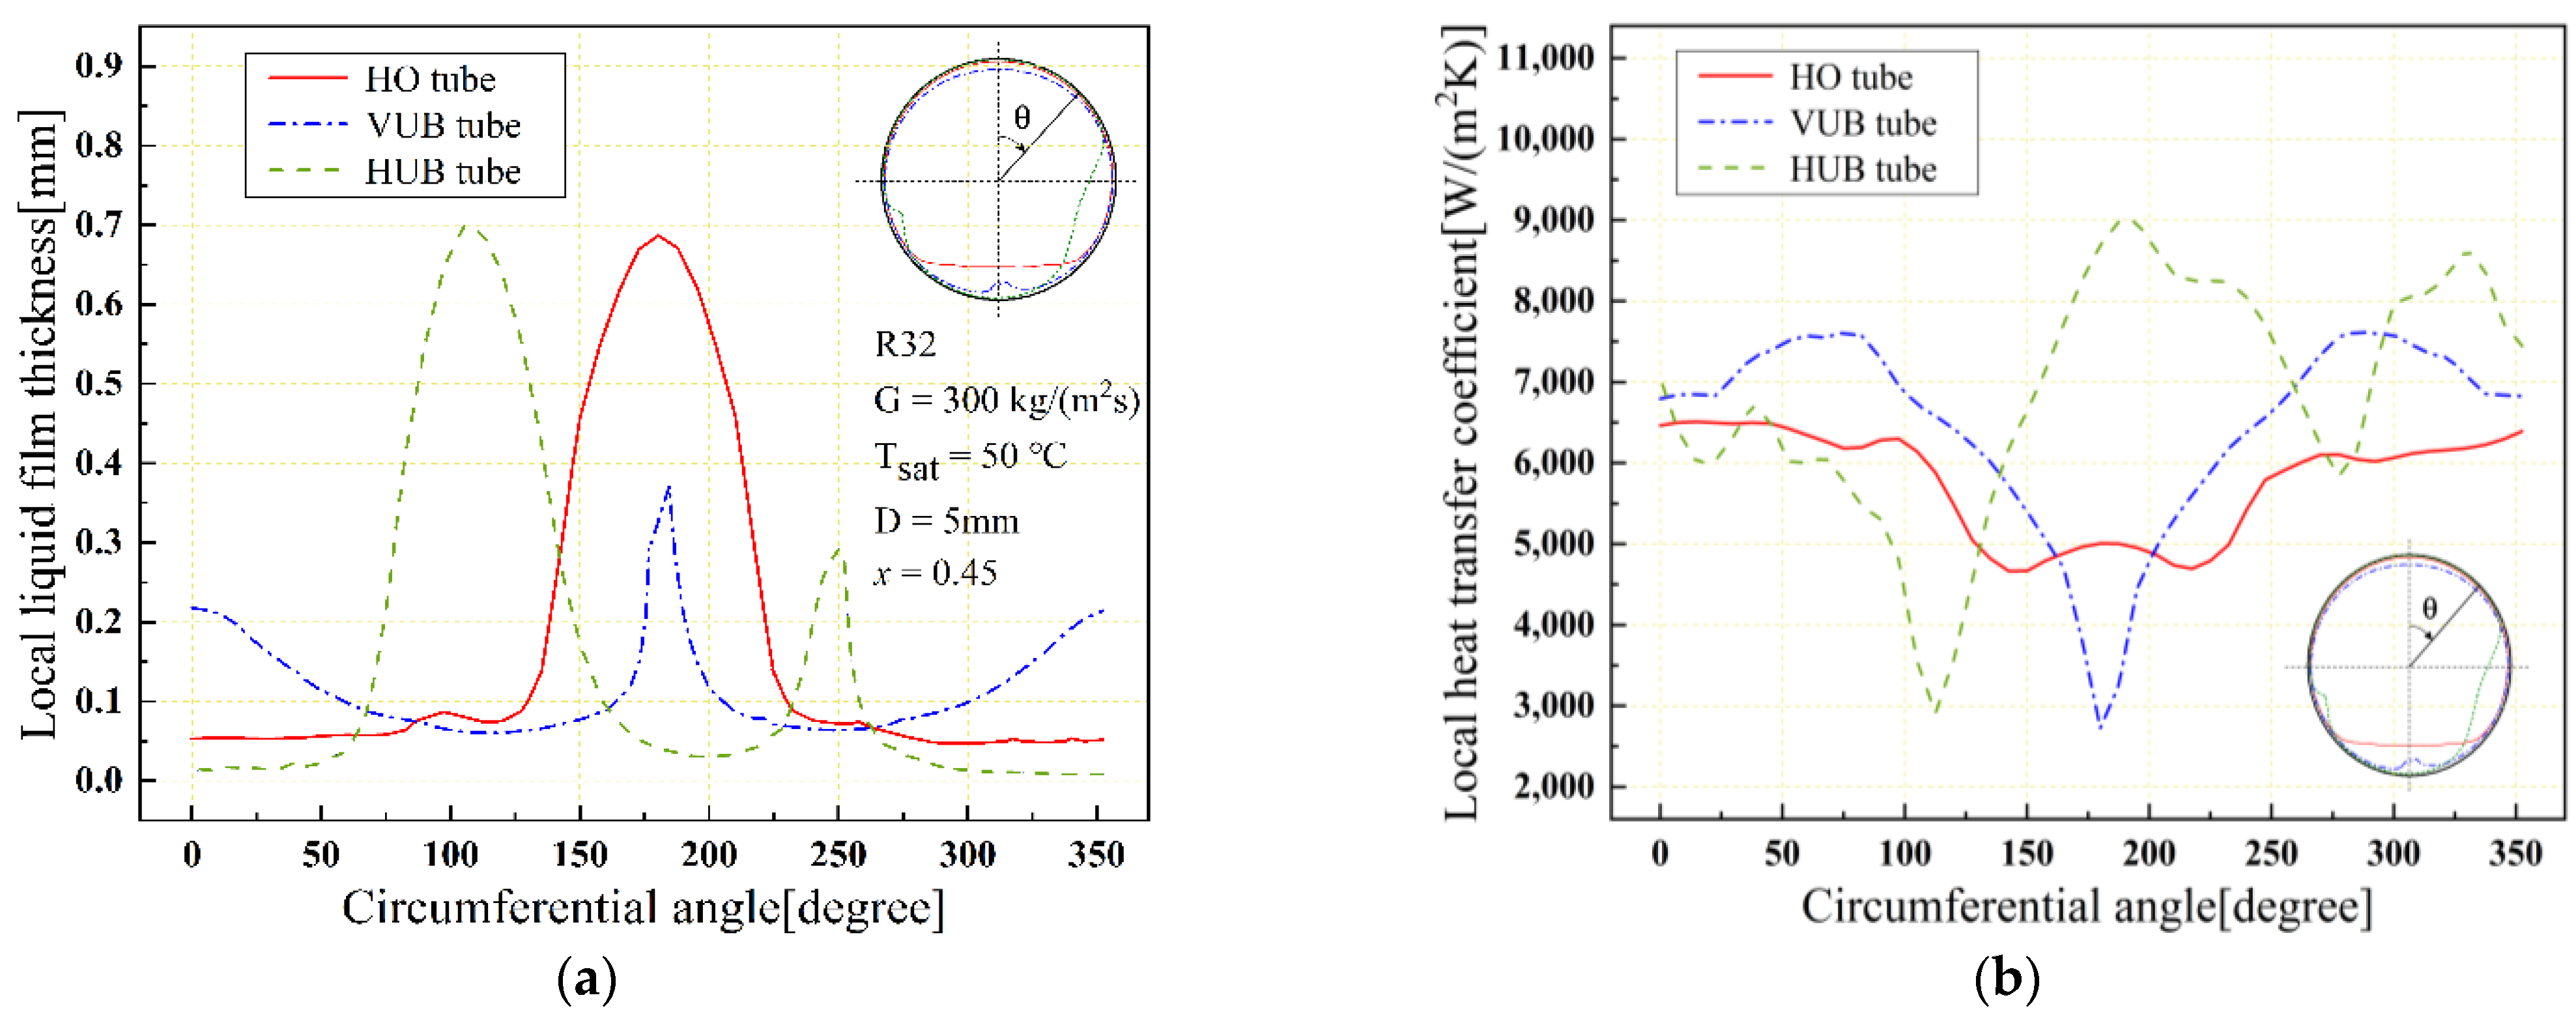
Figure 12 shows the distribution of LLFT and LHTC along the circumferential angle at δ = 180° cross-section surface in VUB, HUB and HO tube at mass flux G = 300 kg/(m2∙s) under x = 0.45. Note that a significant variability can be found in the distribution pattern of the LLFT for all cases. Moreover, the distribution of LLFT and LHTC in the HO tube is with an axis symmetric distribution with θ = 180°. The distribution of LLFT in VUB tube is also approximately axisymmetric. When θ changes from 0 to 180°, the LLFT decreases at first and then rises gradually, while the LHTC shows an inverse changing trend with the LLFT. Note that the LHTC at θ = 180° is relatively small, which is even smaller than that at the same position in the HO tube. This can be explained that the gradual detachment of small liquid bubbles near the tube wall is oriented by inertia as shown in Figure 9, indicating smaller local fluid velocity and showing negative effect on the LHTC. Simultaneously, the LLFT and LHTC in the HUB tube show a bimodal distribution. The varying range of LLFT in the HUB tube is the largest with a relatively large area where a small liquid film thickness is shown. Therefore, after passing through the U-bend section, the heat transfer improvement becomes greater in the HUB tube compared to the VUB tube.
4.3. Flow Condensation HTC
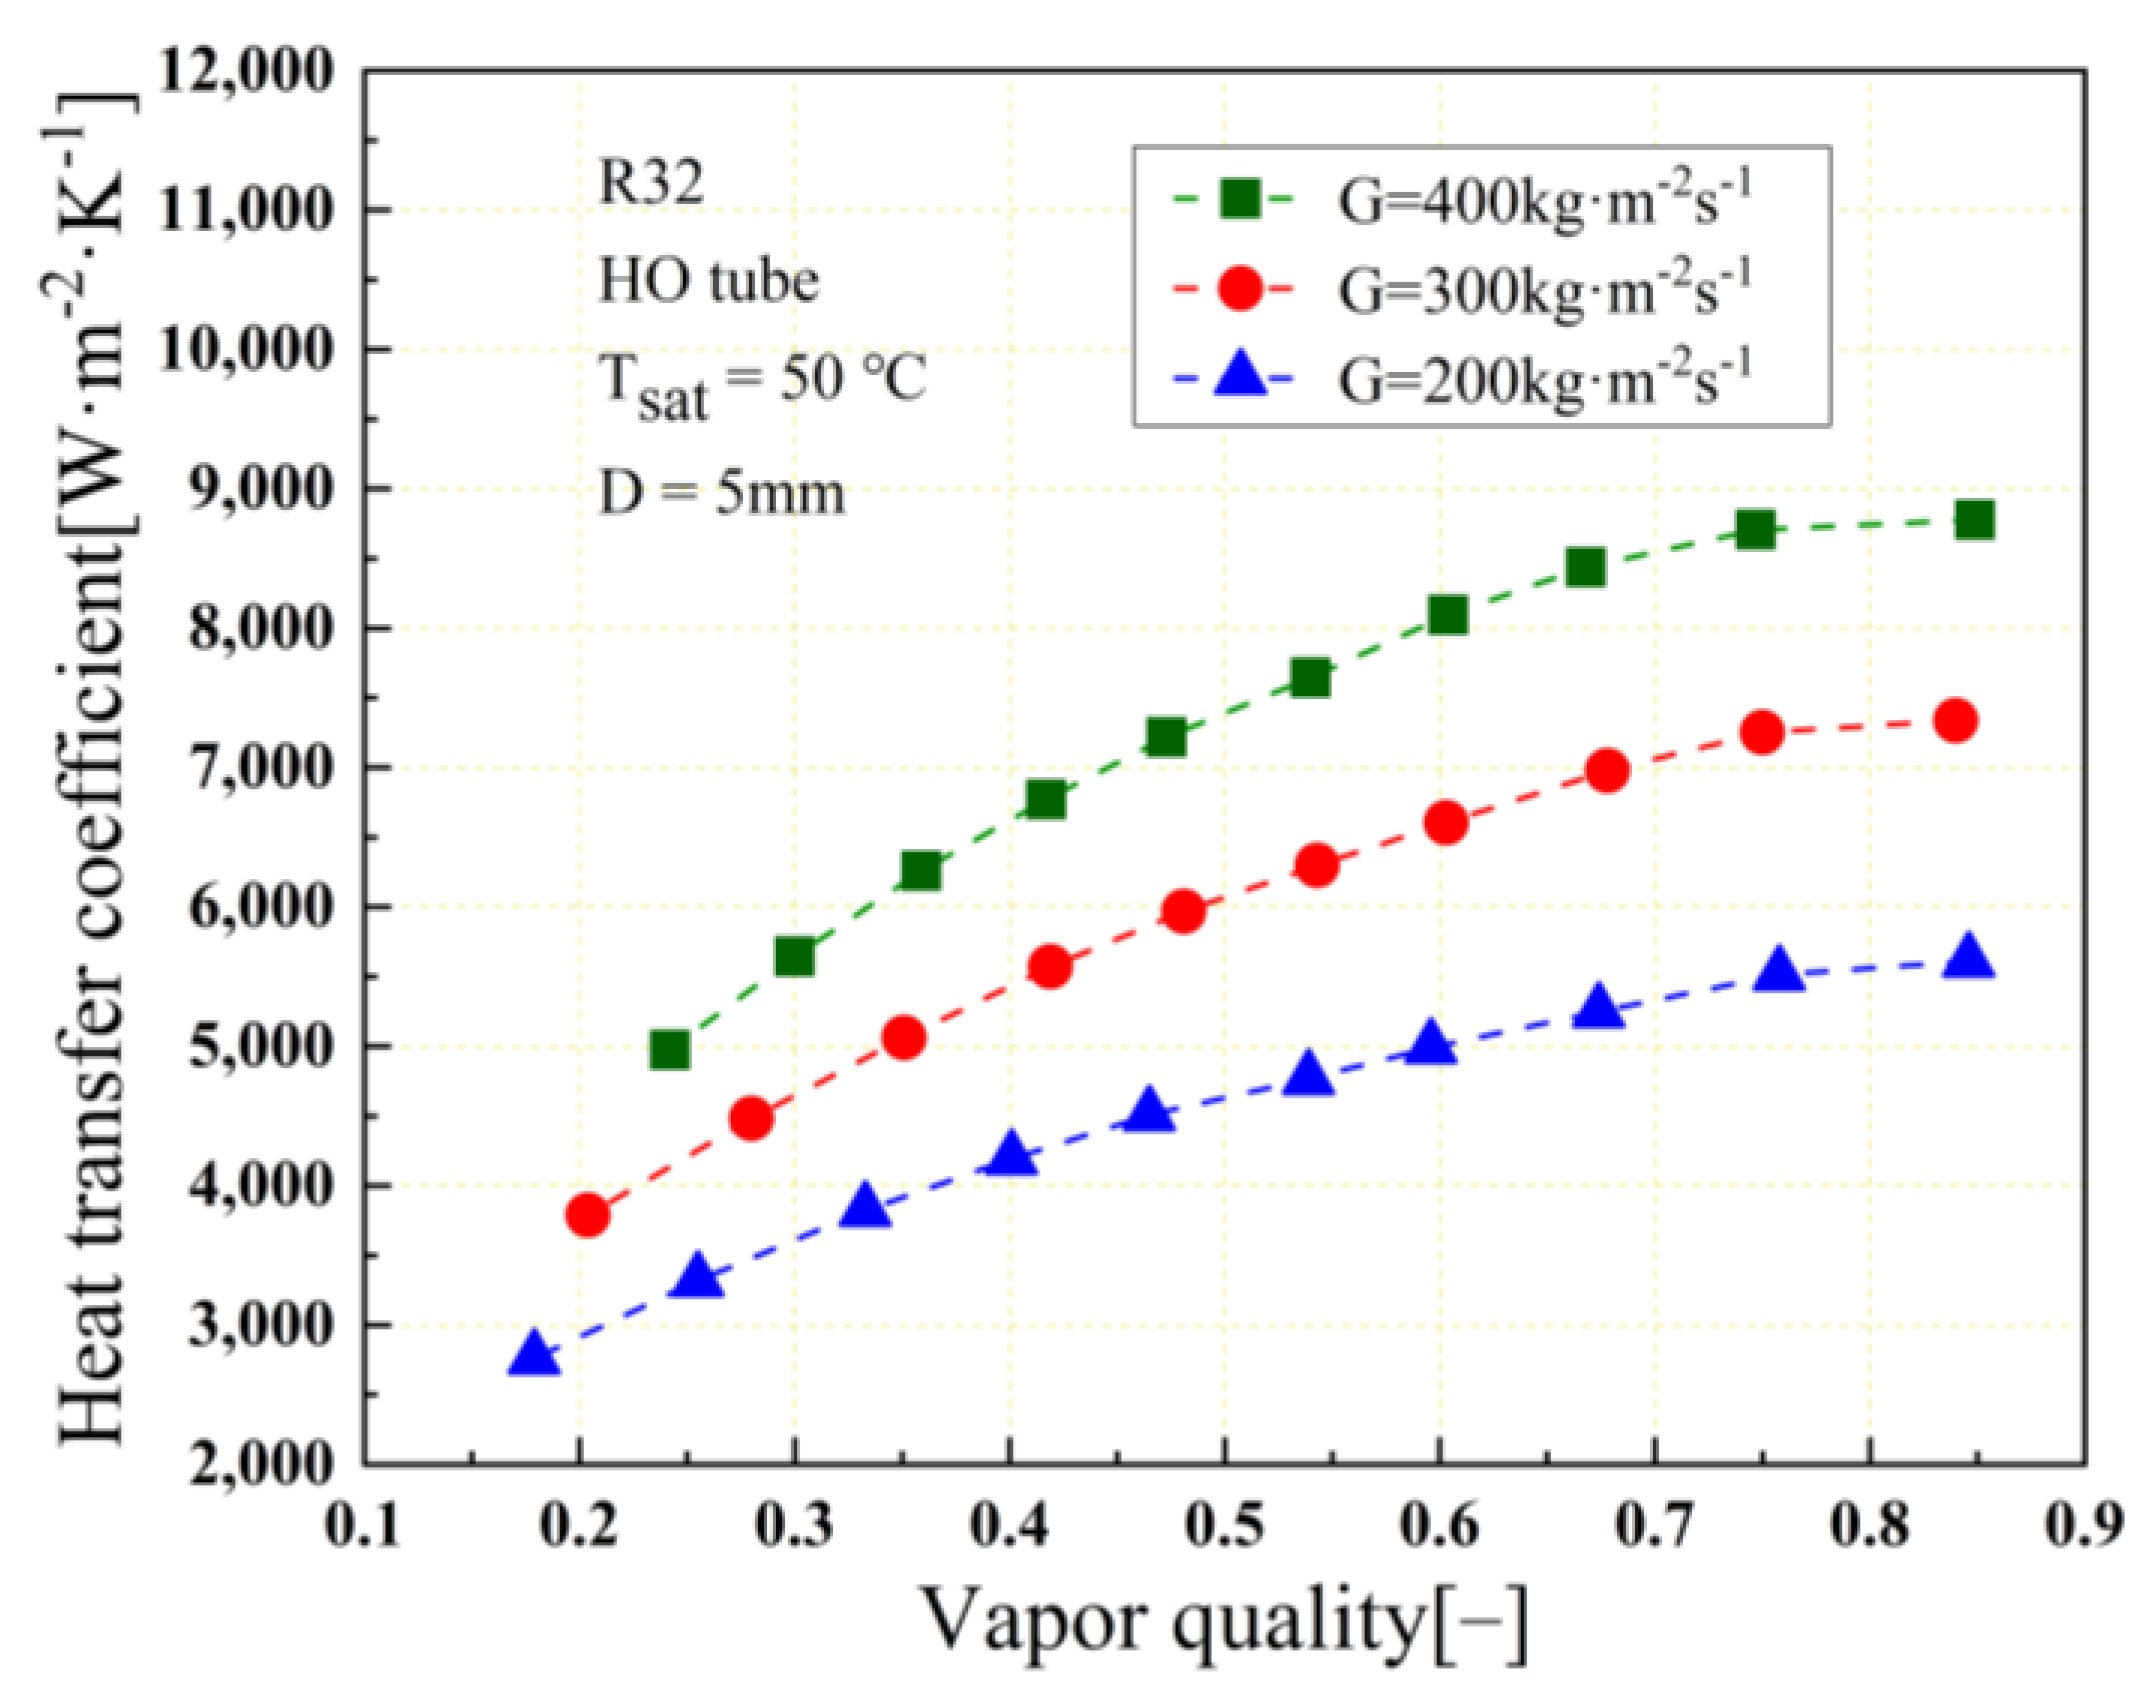
Figure 13 shows the variation of condensation HTC with vapor quality in the HO tube at different mass flux. Note that the condensation HTC increases gradually with increasing mass flux and vapor quality. At the same mass flux, the HTC might increase by about by 54.7% at x = 0.8 compared to the case with x = 0.3. Meanwhile, the condensation HTC increases by about 59.6% when the mass flux increases from G = 200 kg/(m2·s) to 400 kg/(m2·s) at fixed vapor quality.
Basically, the condensation HTC should increase with the increase in vapor quality and mass flux, which was reported in prior studies [5,9,13]. It can be explained that the refrigerant flow at a higher mass flux or vapor mass could provide a much higher flow velocity to enhance the interfacial shear stress and reduce the liquid film thickness. In addition, the turbulence effect inside the liquid film is more pronounced at higher mass flux, which could increase the effective thermal conductivity of the liquid film. The enhanced effective thermal conductivity may also improve the HTC of the flow condensation process. The hybrid heat transfer mechanism of conduction and convection within the liquid film by probing the slope changing of the dimensionless temperature relative to the dimensionless length, which was also concluded by Lee et al. [22]. Moreover, a larger mass flux or vapor quality will result in a larger fluid velocity, thereby a more intense momentum exchange between the gas and liquid phases can be obtained, which also intensify the condensation heat transfer process [42].
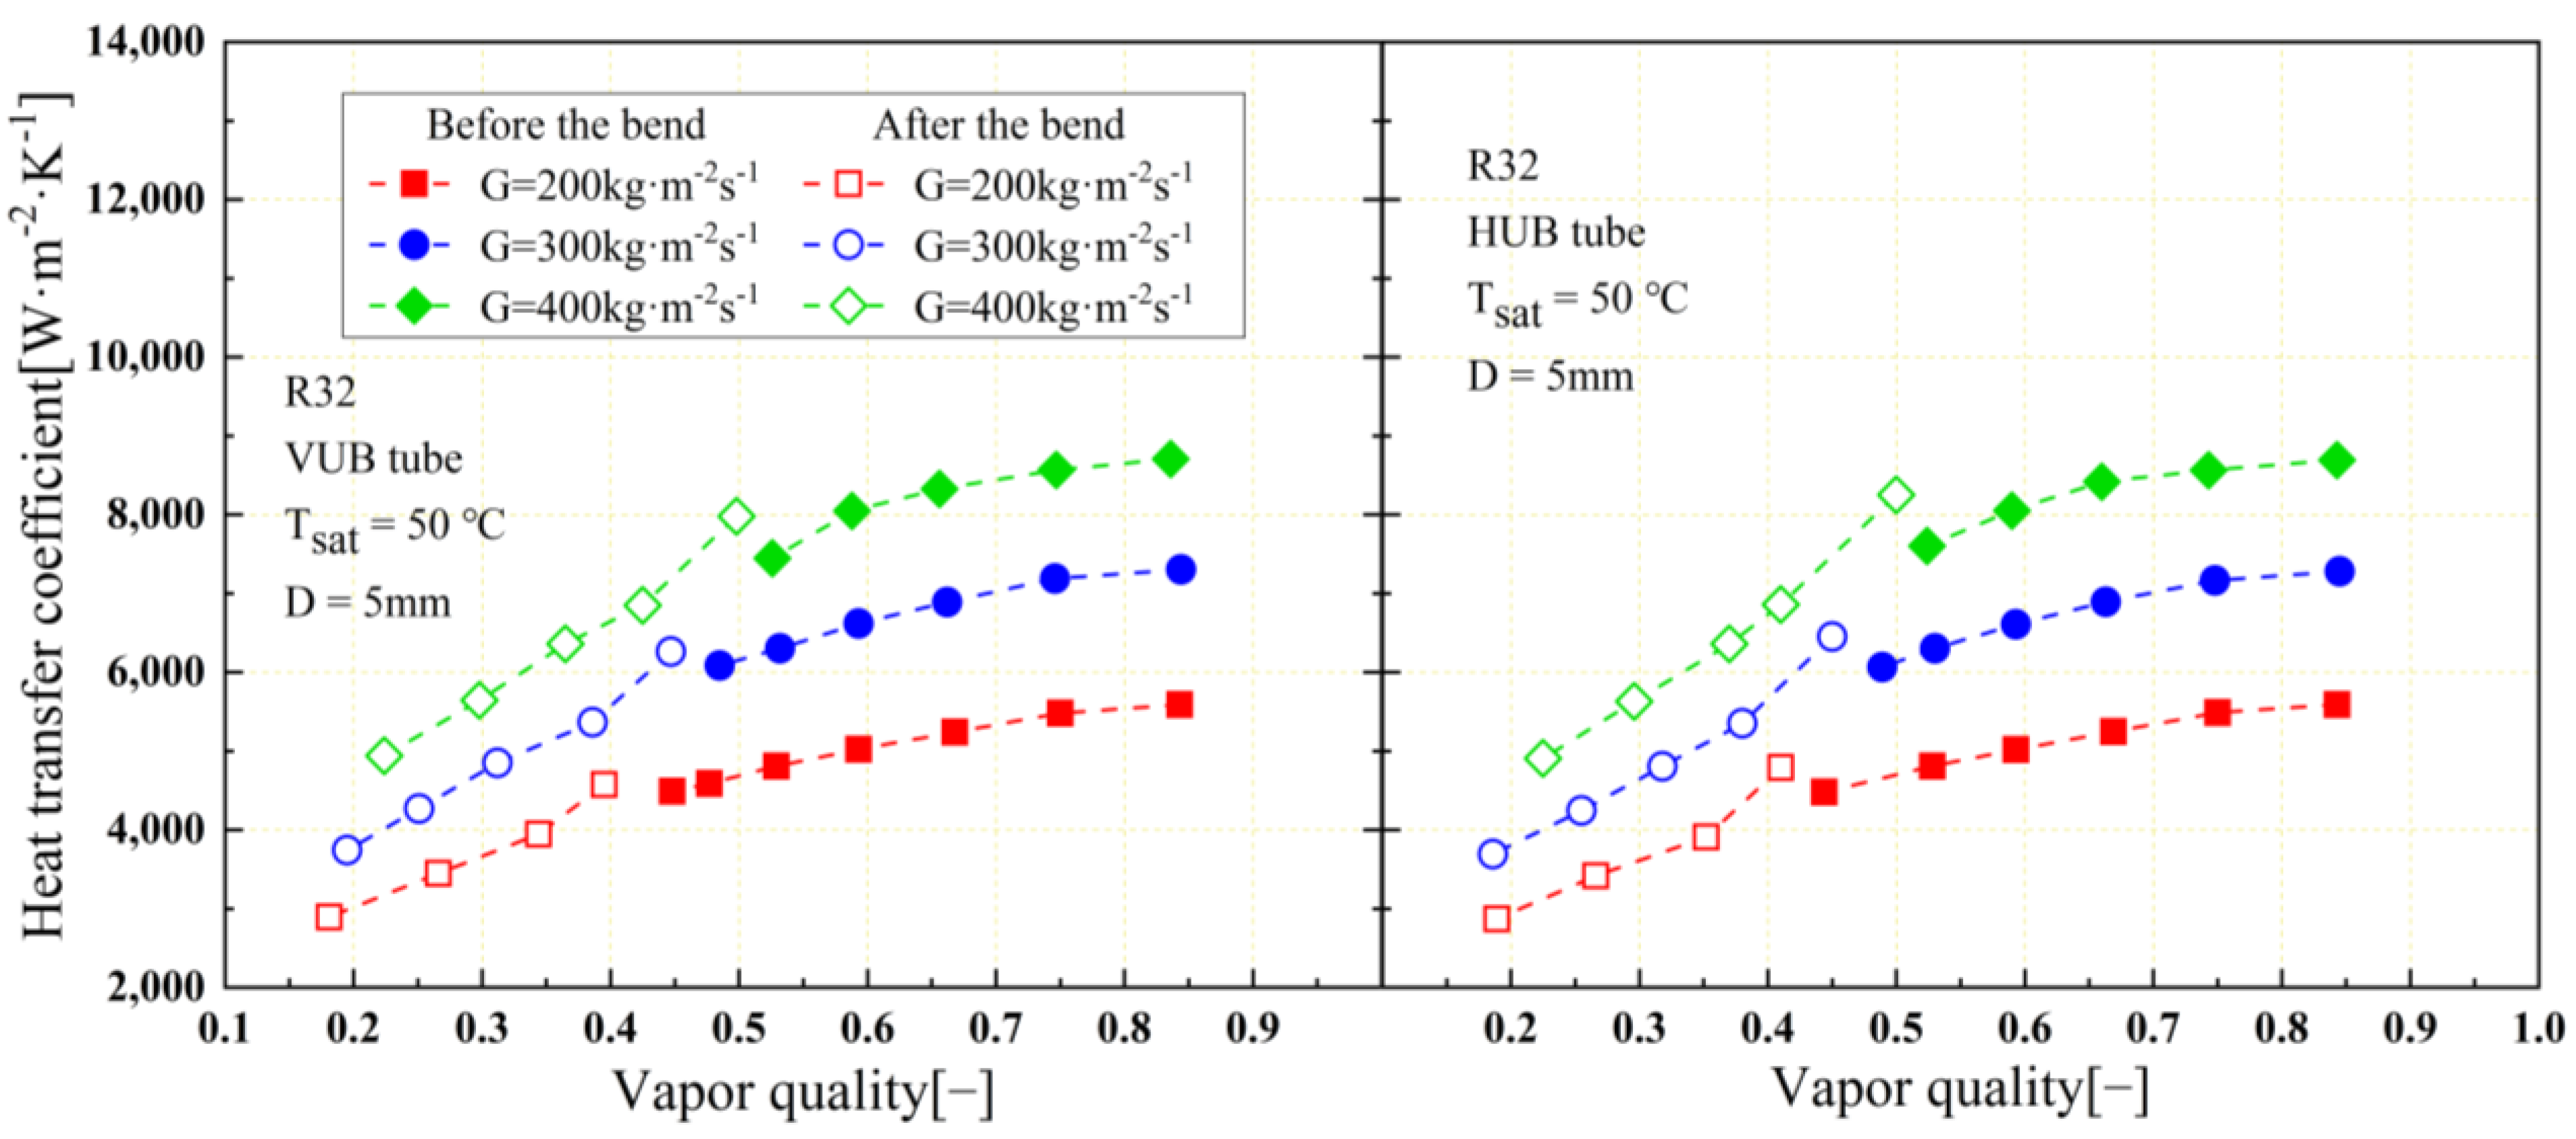
Figure 14 illustrates the variation of condensation HTC with vapor quality in VUB and HUB tubes at different mass flux. Note that HTC always rises after increasing mass flux for both HUB and VUB tubes. The HTC declines roughly with the decrease vapor quality. However, it increases significantly after flowing through the U-bend section. As explained in the prior section, this can be mainly attributed to the flow disturbance caused by centrifugal force. Refrigerant R32 flowing under annular pattern will generate a strong secondary flow when it goes through the U-bend section, which will enhance the mixing of temperature and velocity fields of gas and liquid phases. The HTC during the U-bend section becomes much higher than that before entering the bend, and HTC might reach the maximum after the bend. Then, it decreases rapidly and the two-phase flow soon returns to a similar state as same as that in a horizontal straight tube. This phenomenon was also reported by Jatutu et al. [4], who investigated R134a two-phase flow in U-bend tubes. After the U-bend section, the HTC can be increased by a maximum of 7.82% to 12.29% compared to the HO tube under the same vapor quality depending on the mass flux and the tube arrangement (HUB or VUB).
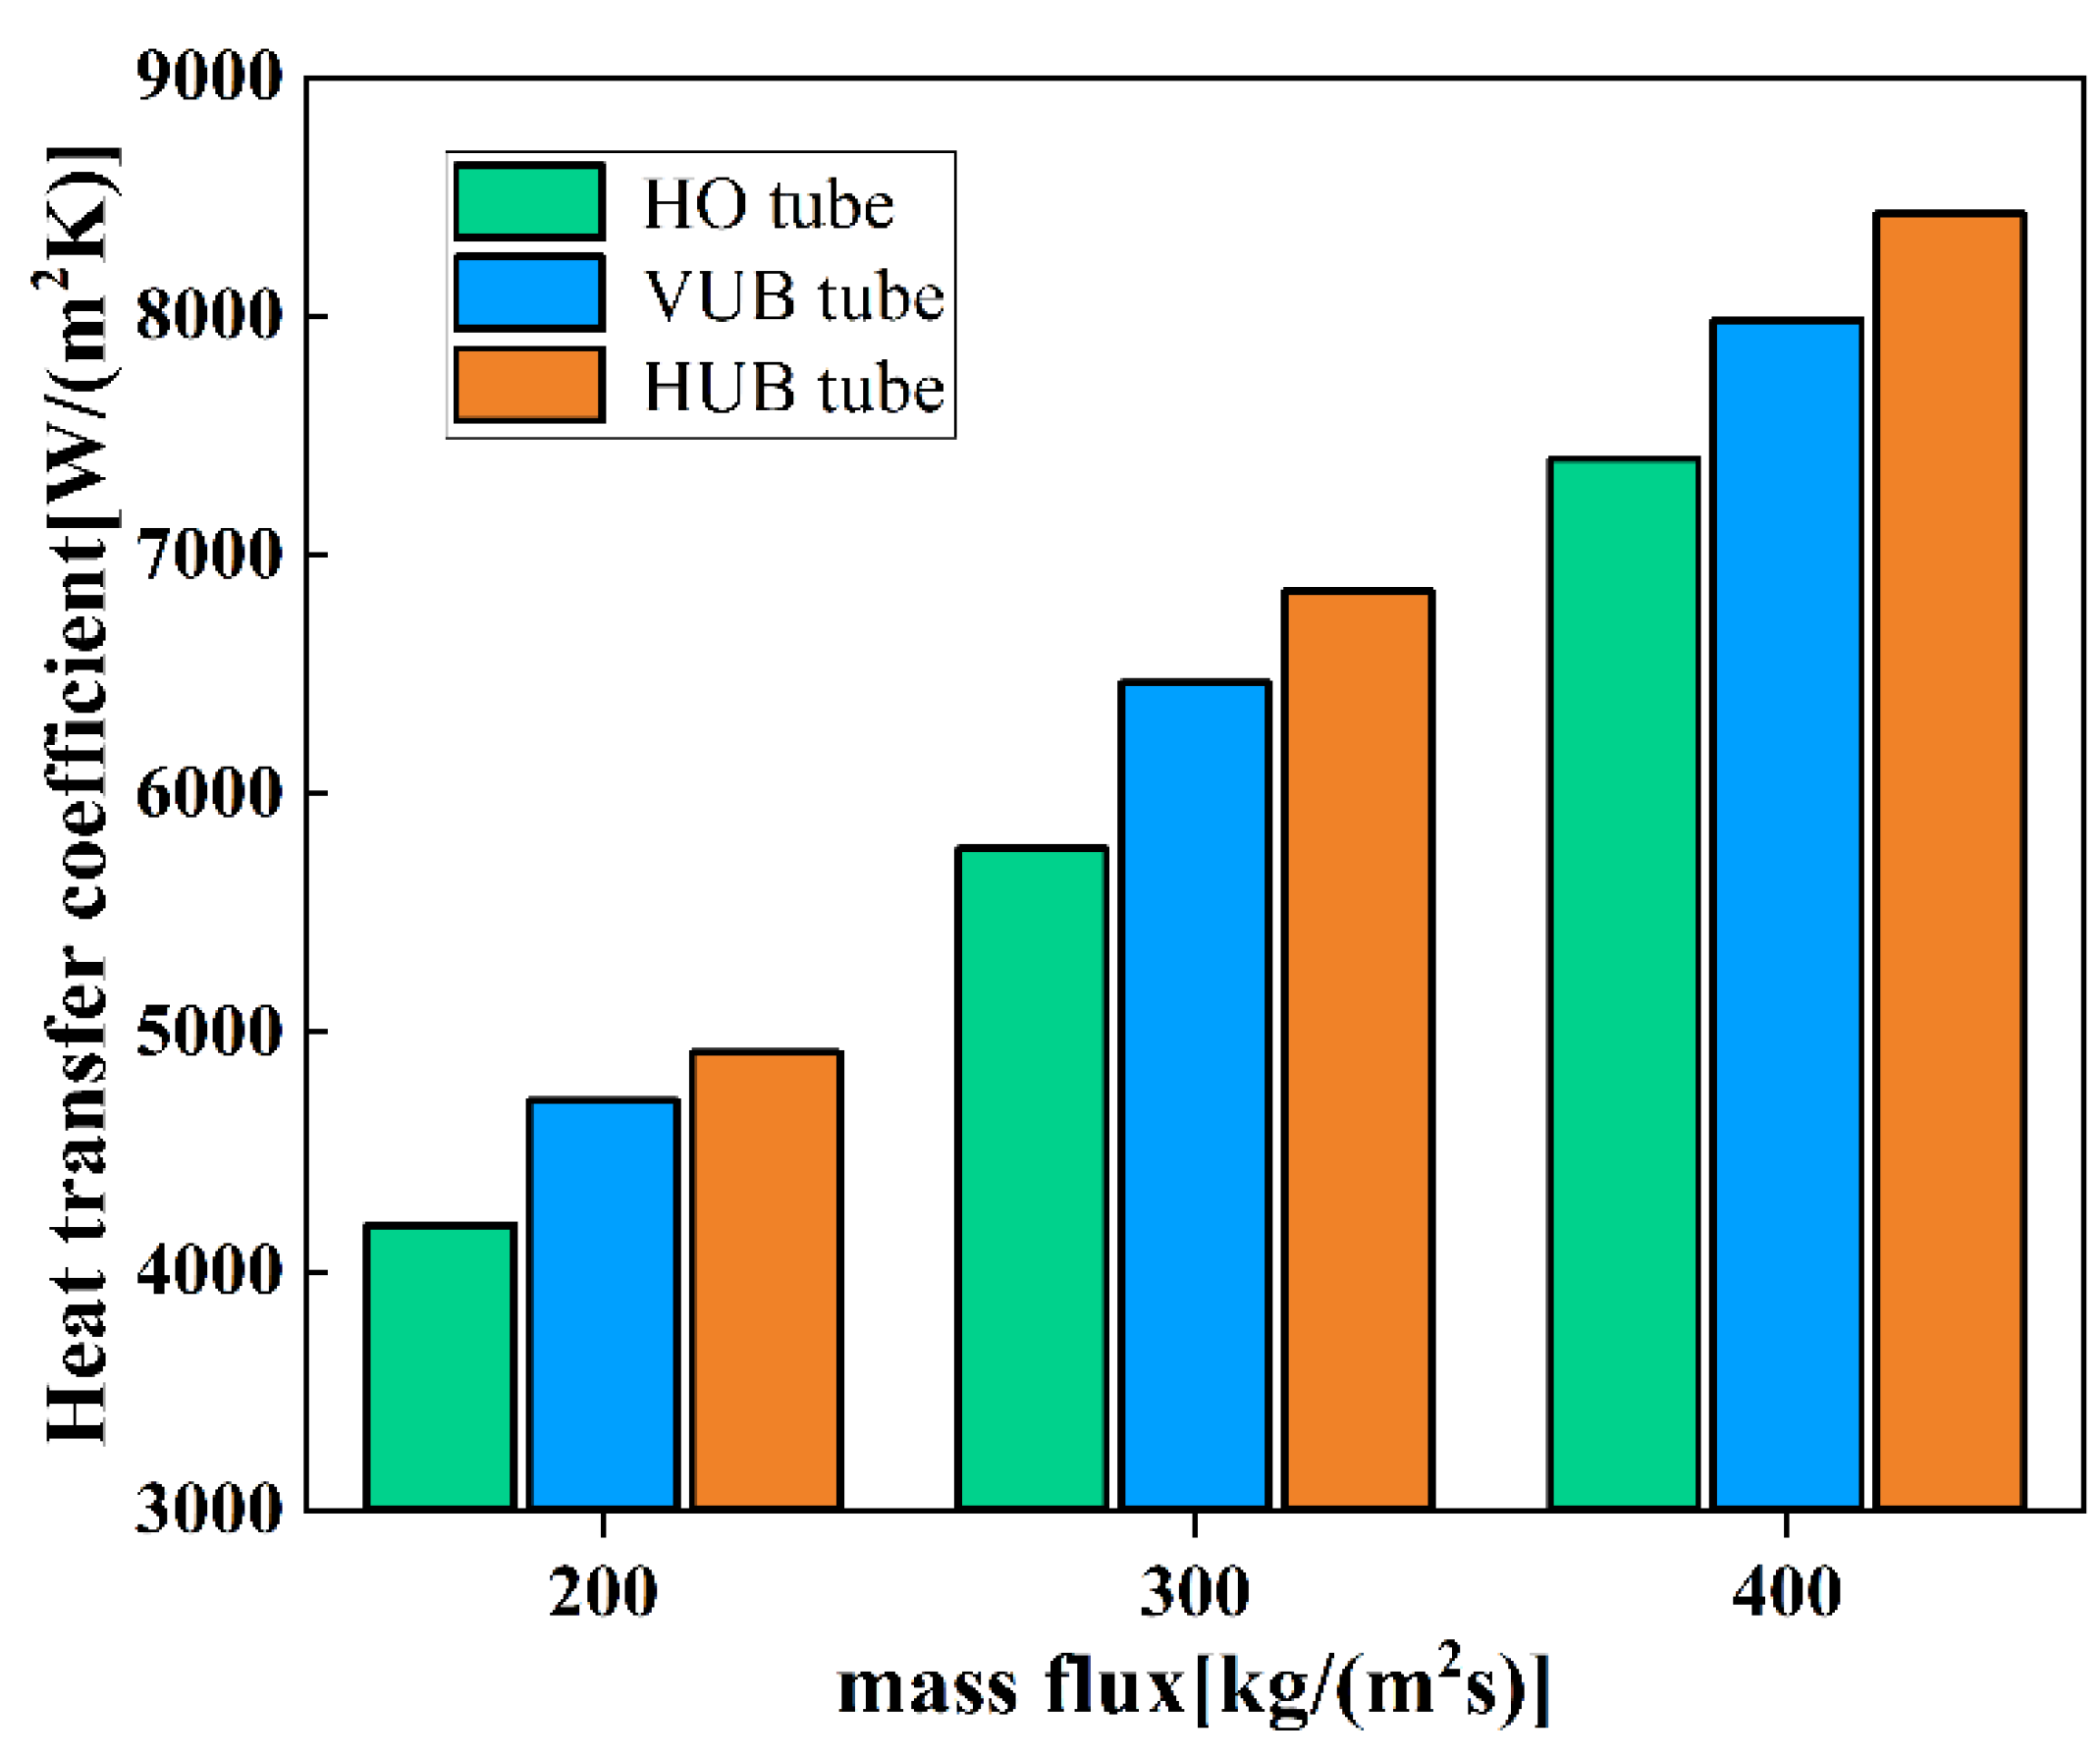
Figure 15 shows the comparison of the HTC at the surface passing through the U-bend section (δ = 180°) of HUB, VUB and HO tubes under the same vapor quality. It can be found that the HTC of U-bend tubes is obviously larger than that in HO tube. With the increase in mass flux, the enhancement effect of U-bend section for HTC is slightly increased, and the increasing trend of HTC in HUB tube becomes more obvious compared to the case in VUB tube. As the result, the HTC can be increased by about 11.86% and 8.47% when changing HO tube to HUB tube and VUB tube, respectively. The result shows applicable guidance in practical industrial applications. More horizontally arranged U-bend structures can achieve a higher HTC while meeting the fixed heat exchanger size and strength requirements. After the two-phase fluid passing through the U-bend section, the vapor and liquid phase distribution as well as the local heat transfer characteristics are influenced by the combination of centrifugal force, gravity, surface tension, shear stress and tube geometry.
5. Conclusions
In this paper, the two-phase flow condensation model is developed, and the heat transfer characteristics of R32 in the horizontally oriented tubes with U-bends at mass flux ranging from G = 200 to 400 kg/(m2·s) were numerically investigated. The effect of vapor quality, mass flux and the tube geometry on the flow pattern, film thickness and condensation HTC are discussed. The main conclusions can be described as follows:
- (1)
- The VOF multiphase flow model coupled with Lee’s phase change model with a proper and validated mass transfer relaxation factor are applied to study the flow condensation of R32 refrigerant. Results show good agreement with the experimental data in published research, and the relative error of the condensation heat transfer coefficient is within 15%, which illustrates reliable accuracy.
- (2)
- The detailed liquid–vapor interface distribution, local liquid film thickness and local HTC are investigated to figure out the effect of mass flux and vapor quality on the condensation heat transfer characteristics of R32. At high vapor quality and high mass flux, the liquid–vapor interface shows a nearly circular distribution, while the local liquid film in the bottom part of the tube becomes thicker and the top part becomes thinner at relative smaller vapor quality due to the influence of gravity. The local HTC is affected by the local liquid film thickness and the gravity, surface tension, shear stress and inertia effect are combined to impact the distributions of the liquid and vapor phase.
- (3)
- The U-bend section has a significant effect on the flow pattern development, liquid–vapor phase distribution and local heat transfer characteristics of R32. The centrifugal force, gravity and inertia dominate the two-phase distribution in the U-bend section. The liquid phase might be redistributed due to the secondary flow after R32 passes through the U-bend section, showing significant effect on flow condensation heat transfer. A slight difference in the intensification effect between HUB tube and VUB tube can be noticed due to the direction of centrifugal force.
- (4)
- The condensation HTC increases gradually with increasing vapor quality and mass flux in the three different tubes. Results show that the HTC for HO tube agrees well with four widely used empirical correlations. The HTC can be enhanced after flowing through the U-bend section, and the enhancement is more pronounced for the HUB tube compared to the VUB tube. Note that the mechanism of the flow pattern of R32 in the U-bend section is still complex, which is eligible to be further investigated with experimental tests in the future.
Author Contributions
Conceptualization, Z.C. and W.C.; methodology, Z.C. and H.Z.; validation, Z.C., W.C., G.Y. and Q.W.; formal analysis, Z.C., H.M. and W.C.; investigation, Z.C., H.M. and H.Z.; resources, H.Z., W.C., G.Y. and Q.W.; data curation, Z.C. and H.M.; writing—original draft preparation, Z.C.; writing—review and editing, Z.C., H.Z. and W.C.; supervision, Q.W.; project administration, H.Z., W.C., G.Y. and Q.W. All authors have read and agreed to the published version of the manuscript.
Funding
This research was funded by the Foundation for Innovative Research Groups of the National Natural Science Foundation of China (No. 51721204) and the Guangdong Midea refrigeration equipment Company Limited (No. GL0120111100137).
Data Availability Statement
The study did not report any data.
Acknowledgments
The authors would like to thank the Foundation for Innovative Research Groups of the National Natural Science Foundation of China (No. 51721204) and the Guangdong Midea refrigeration equipment Company Limited (No. GL0120111100137) for their support.
Conflicts of Interest
The authors declare no conflict of interest.
Nomenclature
| C | surface curvature |
| cp | specific heat capacity, J/(kg·K) |
| D | hydraulic diameter, mm |
| E | internal energy, J |
| F | force, N |
| G | mass flux, kg/(m2·s) |
| g | acceleration of gravity, m/s2 |
| H | latent heat, J/kg |
| h | heat transfer coefficient, W/(m2·K) |
| I | unit tensor |
| N | number of data |
| p | pressure, Pa |
| q | heat flux, W/m2 |
| S | mass source term, kg/(m3∙s) |
| Se | energy source term, W/m3 |
| v | velocity, m/s |
| T | temperature, K |
| t | time, s |
| x | vapor quality |
| Greek symbols | |
| α | volume fraction |
| β | time relaxation coefficient, s−1 |
| δ | U-bend section angle, ° |
| λ | thermal conductivity, W/(m·K) |
| σ | surface tension coefficient, N/m |
| ρ | density, kg/m3 |
| θ | circumferential angle, ° |
| μ | viscosity, kg/(m·s) |
| Subscripts | |
| exp | experimental results |
| l | liquid phase |
| pre | predicted value |
| sat | saturation condition |
| sim | simulated value |
| v | vapor phase |
| w | wall |
| Abbreviations | |
| CFCs | chlorofluorocarbons |
| CFD | computational fluid dynamic |
| CSF | continuum surface force model |
| FVM | finite volume method |
| GWP | global warming potential |
| HFC | hydrofluorocarbons |
| HO | horizontally oriented |
| HTC | heat transfer coefficient |
| HUB | horizontal U-bend |
| HVAC | heating, ventilation and air-conditioning |
| LHTC | local heat transfer coefficient |
| LLFT | local liquid film thickness |
| MAD | mean absolute deviation |
| MRD | mean relative deviation |
| ODP | ozone depletion potential |
| VOF | volume of fluid |
| VUB | vertical U-bend |
| UDF | user defined function |
References
- Mota-Babiloni, A.; Navarro-Esbrí, J.; Makhnatch, P.; Molés, F. Refrigerant R32 as lower GWP working fluid in residential air conditioning systems in Europe and the USA. Renew. Sustain. Energy Rev. 2017, 80, 1031–1042. [Google Scholar] [CrossRef]
- Wu, H.L.; Peng, X.F.; Ye, P.; Gong, Y.E. Simulation of refrigerant flow boiling in serpentine tubes. Int. J. Heat Mass Transf. 2007, 50, 1186–1195. [Google Scholar] [CrossRef]
- Ahmadpour, M.M.; Akhavan-Behabadi, M.A.; Sajadi, B.; Salehi-Kohestani, A. Effect of lubricating oil on condensation characteristics of R600a inside a horizontal U-shaped tube: Experimental study. Int. J. Therm. Sci. 2019, 145, 106007. [Google Scholar] [CrossRef]
- Jatau, T.; Bello-Ochende, T. Heat transfer and flow pattern map development of R134A in a U-bend tube for flow boiling evaporation. Int. Commun. Heat Mass Transf. 2021, 128, 105629. [Google Scholar] [CrossRef]
- Liu, N.; Li, J. Experimental study on condensation heat transfer of R32, R152a and R22 in horizontal minichannels. Appl. Therm. Eng. 2015, 90, 763–773. [Google Scholar] [CrossRef]
- Liu, N.; Li, J. Experimental study on pressure drop of R32, R152a and R22 during condensation in horizontal minichannels. Exp. Therm. Fluid Sci. 2016, 71, 14–24. [Google Scholar] [CrossRef]
- O’Neill, L.E.; Balasubramaniam, R.; Nahra, H.K.; Hasan, M.M.; Mudawar, I. Flow condensation heat transfer in a smooth tube at different orientations: Experimental results and predictive models. Int. J. Heat Mass Transf. 2019, 140, 533–563. [Google Scholar] [CrossRef]
- Dalkilic, A.S.; Laohalertdecha, S.; Wongwises, S. Experimental investigation of heat transfer coefficient of R134a during condensation in vertical downward flow at high mass flux in a smooth tube. Int. Commun. Heat Mass Transf. 2009, 36, 1036–1043. [Google Scholar] [CrossRef]
- Cavallini, A.; Censi, G.; Del Col, D.; Doretti, L.; Longo, G.A.; Rossetto, L. Experimental investigation on condensation heat transfer and pressure drop of new HFC refrigerants in a horizontal smooth tube. Int. J. Refrig. 2001, 24, 73–87. [Google Scholar] [CrossRef]
- Moreira, T.A.; Ayub, Z.H.; Ribatski, G. Convective condensation of R600a, R290, R1270 and their zeotropic binary mixtures in horizontal tubes. Int. J. Refrig. 2021, 130, 27–43. [Google Scholar] [CrossRef]
- Chu, W.; Yan, G.; Zhang, H.; Zhao, F.; Wang, Q.; Wang, Q. A review on experimental investigations of refrigerant/oil mixture flow boiling in horizontal channels. Appl. Therm. Eng. 2021, 196, 117270. [Google Scholar] [CrossRef]
- Zhang, J.; Li, W. Numerical study on heat transfer and pressure drop characteristics of R410A condensation in horizontal circular mini/micro-tubes. Can. J. Chem. Eng. 2016, 94, 1809–1819. [Google Scholar] [CrossRef]
- Qiu, G.; Li, M.; Cai, W. The condensation heat transfer, frictional pressure drop and refrigerant charge characteristics of R290 in minichannels with different diameters. Int. J. Heat Mass Transf. 2020, 158, 119966. [Google Scholar] [CrossRef]
- Qiu, G.; Li, M.; Cai, W. The effect of inclined angle on flow, heat transfer and refrigerant charge of R290 condensation in a minichannel. Int. J. Heat Mass Transfer. 2020, 154, 119652. [Google Scholar] [CrossRef]
- Gu, X.; Wen, J.; Tian, J.; Wang, S.; Tu, J. Numerical study on condensation annular flow of R1234ze(E) inside an inclined tube. Appl. Therm. Eng. 2019, 163, 114359. [Google Scholar] [CrossRef]
- Abadi, S.N.R.; Meyer, J.P.; Dirker, J. Numerical simulation of condensation inside an inclined smooth tube. Chem. Eng. Sci. 2018, 182, 132–145. [Google Scholar] [CrossRef]
- Guo, Z.; Yang, J.; Tan, Z.; Tian, X.; Wang, Q. Numerical study on gravity-driven granular flow around tube out-wall: Effect of tube inclination on the heat transfer. Int. J. Heat Mass Transf. 2021, 174, 121296. [Google Scholar] [CrossRef]
- Wen, J.; Gu, X.; Liu, Y.; Wang, S.; Li, Y. Effect of surface tension, gravity and turbulence on condensation patterns of R1234ze(E) in horizontal mini/macro-channels. Int. J. Heat Mass Transf. 2018, 125, 153–170. [Google Scholar] [CrossRef]
- Lei, Y.; Chen, Z. Numerical Study of Condensation Heat Transfer in Curved Square and Triangle Microchannels. Heat Transf. Eng. 2019, 41, 768–778. [Google Scholar] [CrossRef]
- Gu, X.; Wen, J.; Zhang, X.; Wang, C.; Wang, S. Effect of tube shape on the condensation patterns of R1234ze(E) in horizontal mini-channels. Int. J. Heat Mass Transf. 2019, 131, 121–139. [Google Scholar] [CrossRef]
- Wen, J.; Gu, X.; Wang, S.; Li, Y.; Tu, J. Numerical investigation on condensation heat transfer and pressure drop characteristics of R134a in horizontal flattened tubes. Int. J. Refrig. 2018, 85, 441–461. [Google Scholar] [CrossRef]
- Lee, Y.T.; Hong, S.; Chien, L.H.; Lin, C.J.; Yang, A.S. Heat transfer and pressure drop of film condensation in a horizontal minitube for HFO1234yf refrigerant. Appl. Energy 2020, 274, 115183. [Google Scholar] [CrossRef]
- Zhang, J.; Li, W.; Minkowycz, W.J. Numerical simulation of R410A condensation in horizontal microfin tubes. Numer. Heat Transf. Part A Appl. 2017, 71, 361–376. [Google Scholar] [CrossRef]
- Lee, H.S.; Yoon, J.I.; Kim, J.D.; Bansal, P.K. Characteristics of condensing and evaporating heat transfer using hydrocarbon refrigerants. Appl. Therm. Eng. 2006, 26, 1054–1062. [Google Scholar] [CrossRef]
- Hirt, C.W.; Nichols, B.D. Volume of Fluid (VOF) Method for the Dynamics of Free Boundaries. J. Comput. Phys. 1981, 39, 201–225. [Google Scholar] [CrossRef]
- Brackbill, J.U.; Kothe, D.B.; Zemach, C. A Continuum Method for Modeling Surface-Tension. J. Comput. Phys. 1992, 100, 335–354. [Google Scholar] [CrossRef]
- Zhang, J.; Li, W.; Minkowycz, W.J. Numerical simulation of condensation for R410A at a different saturation temperature in mini/micro tubes. Numer. Heat Transf. Part A Appl. 2016, 69, 825–840. [Google Scholar] [CrossRef]
- Menter, F.R. Two-equation eddy-viscosity turbulence models for engineering applications. AIAA J. 1994, 32, 1598–1605. [Google Scholar] [CrossRef] [Green Version]
- Lee, W.H. A Pressure Iteration Scheme for Two-Phase Modeling; Technical Report LA-UR 79–975; Los Alamos Scientific Laboratory: Los Alamos, NM, USA, 1979. [Google Scholar]
- Knudsen, M.; Partington, J.R. The Kinetic.Theoryof Gases. Some Modern Aspects. J. Phys. Chem. 1935, 39, 307. [Google Scholar] [CrossRef]
- Chen, G.; Nie, T.; Yan, X. An explicit expression of the empirical factor in a widely used phase change model. Int. J. Heat Mass Transf. 2020, 150, 307. [Google Scholar] [CrossRef]
- Liu, H.; Tang, J.; Sun, L.; Mo, Z.; Xie, G. An assessment and analysis of phase change models for the simulation of vapor bubble condensation. Int. J. Heat Mass Transf. 2020, 157, 119924. [Google Scholar] [CrossRef]
- Dai, Y.; Zhu, S.; Guo, Y.; Zou, S. Numerical study on condensation heat transfer of R290 inside a 4-mm-ID horizontal smooth tube. J. Braz. Soc. Mech. Sci. Eng. 2022, 44, 1–15. [Google Scholar] [CrossRef]
- Tang, W.; Li, W.; Minkowycz, W.J. A numerical investigation of convective condensation in micro-fin tubes of different geometries. Numer. Heat Transf. Part A Appl. 2020, 78, 697–705. [Google Scholar] [CrossRef]
- Dey, P.; Raj, D.; Saha, S.K. A Numerical Study on Condensation Heat Transfer Characteristics of R134a in Microchannel Under Varying Gravity Conditions. Microgravity Sci. Technol. 2021, 33, 1–20. [Google Scholar] [CrossRef]
- Liu, Y.; Wen, J.; Xu, P.; Khan, M.; Wang, S.; Tu, J. Numerical investigation on the condensation of R134a, R1234ze(E) and R450A in mini-channels. Int. J. Refrig. 2021, 130, 305–316. [Google Scholar] [CrossRef]
- Hossain, M.A.; Onaka, Y.; Miyara, A. Experimental study on condensation heat transfer and pressure drop in horizontal smooth tube for R1234ze(E), R32 and R410A. Int. J. Refrig. 2012, 35, 927–938. [Google Scholar] [CrossRef]
- Cavallini, A.; Col, D.D.; Doretti, L.; Matkovic, M.; Rossetto, L.; Zilio, C.; Censi, G. Condensation in Horizontal Smooth Tubes: A New Heat Transfer Model for Heat Exchanger Design. Heat Transf. Eng. 2006, 27, 31–38. [Google Scholar] [CrossRef]
- Shah, M.M. A general correlation for heat transfer during film condensation inside pipes. Int. J. Heat Mass Transf. 1979, 22, 547–556. [Google Scholar] [CrossRef]
- Dobson, M.K.; Chato, J.C. Condensation in smooth horizontal tubes. J. Heat Transf. Trans. Asme 1998, 120, 193–213. [Google Scholar] [CrossRef]
- Bohdal, T.; Charun, H.; Sikora, M. Comparative investigations of the condensation of R134a and R404A refrigerants in pipe minichannels. Int. J. Heat Mass Transf. 2011, 54, 1963–1974. [Google Scholar] [CrossRef]
- Jung, D.; Song, K.H.; Cho, Y.; Kim, S.J. Flow condensation heat transfer coefficients of pure refrigerants. Int. J. Refrig. 2003, 26, 4–11. [Google Scholar] [CrossRef]
Figure 1.
Geometric model of the simulation domain. (a) HO tube; (b) horizontally oriented tube with U-bend.
Figure 1.
Geometric model of the simulation domain. (a) HO tube; (b) horizontally oriented tube with U-bend.

Figure 2.
Comparison of simulated data with experimental data from Hossain et al. [37].
Figure 2.
Comparison of simulated data with experimental data from Hossain et al. [37].

Figure 3.
Comparison of calculated results of heat transfer coefficient from empirical correlations with simulated results. Cavallini et al. [38], Shah [39], Dobson and Chato [40], and Bohdal et al. [41].

Figure 4.
Simulated results of the heat transfer coefficient of R32 under different cells. (a) HO tube; (b) VUB tube.
Figure 4.
Simulated results of the heat transfer coefficient of R32 under different cells. (a) HO tube; (b) VUB tube.

Figure 5.
Cross-section distribution of vapor phase volume fraction at different vapor quality under mass flux G = 400 kg/(m2·s).
Figure 5.
Cross-section distribution of vapor phase volume fraction at different vapor quality under mass flux G = 400 kg/(m2·s).

Figure 6.
Local liquid film thickness and local heat transfer coefficient versus circumferential angle at different vapor quality under mass flux G = 200 kg/(m2·s). (a) Local liquid film thickness; (b) local heat transfer coefficient.
Figure 6.
Local liquid film thickness and local heat transfer coefficient versus circumferential angle at different vapor quality under mass flux G = 200 kg/(m2·s). (a) Local liquid film thickness; (b) local heat transfer coefficient.

Figure 7.
Local liquid film thickness and local heat transfer coefficient versus circumferential angle at different mass flux under vapor quality x = 0.6. (a) Local liquid film thickness; (b) local heat transfer coefficient.
Figure 7.
Local liquid film thickness and local heat transfer coefficient versus circumferential angle at different mass flux under vapor quality x = 0.6. (a) Local liquid film thickness; (b) local heat transfer coefficient.

Figure 8.
Distribution of average liquid film thickness and heat transfer coefficient under different vapor quality.
Figure 8.
Distribution of average liquid film thickness and heat transfer coefficient under different vapor quality.

Figure 9.
Distribution of volume fraction of vapor phase in the U-bend section under G = 300 kg/(m2·s) in VUB tube.
Figure 9.
Distribution of volume fraction of vapor phase in the U-bend section under G = 300 kg/(m2·s) in VUB tube.

Figure 10.
Distribution of volume fraction of vapor phase in the U-bend section under G = 300 kg/(m2·s) in HUB tube.
Figure 10.
Distribution of volume fraction of vapor phase in the U-bend section under G = 300 kg/(m2·s) in HUB tube.

Figure 11.
Vapor–liquid interface of R32 at different tubes.

Figure 12.
Distribution of local liquid film thickness and local heat transfer coefficient under different tubes. (a) Local liquid film thickness; (b) local heat transfer coefficient.
Figure 12.
Distribution of local liquid film thickness and local heat transfer coefficient under different tubes. (a) Local liquid film thickness; (b) local heat transfer coefficient.

Figure 13.
Predicted average heat transfer coefficient over HO tube with varied vapor qualities.

Figure 14.
Predicted average heat transfer coefficient over VUB tube and HUB tube with varied vapor qualities.
Figure 14.
Predicted average heat transfer coefficient over VUB tube and HUB tube with varied vapor qualities.

Figure 15.
Comparison of the heat transfer coefficients of the three kinds of tubes.


Table 1.
Thermophysical properties of R32 at Tsat = 323.15 K and Psat = 3.1412 MPa.
| Properties | R32-Vapor | R32-Liquid |
|---|---|---|
| Density (kg/m3) | 98.55 | 839.26 |
| Enthalpy (kJ/kg) | 507.10 | 297.49 |
| Specific heat capacity, Cp (kJ/(kg·K)) | 2.4773 | 2.4385 |
| Thermal conductivity (W/(m·K)) | 0.0228 | 0.107 |
| Viscosity (kg/(m·s)) | 0.0000147 | 0.0000832 |
| Surface tension (N/m) | 0.0030553 | 0.0030553 |
Table 2.
Summary of literature about condensation coupled Lee model with VOF model.
| Reference | Working Fluid | Geometry | Boundary Condition | Mass Transfer Relation Factor β (s−1) | Calculation Model |
|---|---|---|---|---|---|
| Dai et al. [33] | R290 | Horizontal circular smooth tube (Dh = 4 mm) | Velocity inlet; pressure outlet; Tw = constant | 3 × 10³ to 104 | Steady |
| Wen et al. [21] | R134a | Horizontal flattened tube | Velocity inlet; pressure outlet; Tw = constant | 4.5 × 10⁵ to 1.1 × 10⁶ | Steady |
| Lee et al. [22] | HFO1234yf | Horizontal straight and convergent tube | Velocity inlet; pressure outlet; qw = constant | 8 × 10⁵ to 8 × 10⁶ | Transient |
| Tang et al. [34] | R410a | Horizontal micro-fin tube | Velocity inlet; pressure outlet; Tw = constant | 1.5 × 10⁶ | Steady |
| Dey et al. [35] | R134a | Horizontal micro-channel (Dh = 0.1 mm) | Mass flow inlet; outflow outlet; Tw = constant | 5 × 10³ | Transient |
| Qiu et al. [13] | R290 | Horizontal circular smooth tube (Dh = 0.5/1.0/2.0 mm) | Mass flow inlet; outflow outlet; qw = constant | 1 × 10⁴ | Transient |
| Abadi et al. [16] | R134a | Inclined smooth tube (Dh = 8.38 mm) | Mass flow inlet; Pressure outlet; qw = constant | 5.5 × 10³ | Transient |
| Liu et al. [36] | R134a/R1234ze(E)/R450a | Horizontal circular smooth tube (Dh = 1/2 mm) | Velocity inlet; pressure outlet; Tw = constant | 3.0 × 10⁵ to 1.5 × 10⁶ | Steady |
| Gu et al. [15] | R1234ze(E) | Inclined circular tube (Dh = 4.57 mm) | Velocity inlet; pressure outlet; Tw = constant | 4.5 × 10⁵ to 1.1 × 10⁶ | Steady |
| Zhang et al. [27] | R410a | Horizontal circular smooth tube (Dh = 0.25/1/4 mm) | Velocity inlet; pressure outlet; Tw = constant | 1.5 × 10⁶ | Steady |
Publisher’s Note: MDPI stays neutral with regard to jurisdictional claims in published maps and institutional affiliations. |
© 2022 by the authors. Licensee MDPI, Basel, Switzerland. This article is an open access article distributed under the terms and conditions of the Creative Commons Attribution (CC BY) license (https://creativecommons.org/licenses/by/4.0/).
Share and Cite
MDPI and ACS Style
Cao, Z.; Zhang, H.; Mei, H.; Yan, G.; Chu, W.; Wang, Q. Numerical Study on R32 Flow Condensation in Horizontally Oriented Tubes with U-Bends. Energies 2022, 15, 4799. https://doi.org/10.3390/en15134799
AMA Style
Cao Z, Zhang H, Mei H, Yan G, Chu W, Wang Q. Numerical Study on R32 Flow Condensation in Horizontally Oriented Tubes with U-Bends. Energies. 2022; 15(13):4799. https://doi.org/10.3390/en15134799
Chicago/Turabian StyleCao, Zehan, Hao Zhang, Haohan Mei, Gang Yan, Wenxiao Chu, and Qiuwang Wang. 2022. "Numerical Study on R32 Flow Condensation in Horizontally Oriented Tubes with U-Bends" Energies 15, no. 13: 4799. https://doi.org/10.3390/en15134799
Note that from the first issue of 2016, this journal uses article numbers instead of page numbers. See further details here.