
Natural Energy Stored in Groundwater Deposits as a New Way of Obtaining Green Energy for Urban Planners, Architects and Environmentalists


1
Faculty of Civil Engineering and Architecture, Lublin University of Technology, Nadbystrzycka 40, 20-618 Lublin, Poland
2
WAKAD, 20-250 Lublin, Poland
*
Author to whom correspondence should be addressed.
Energies 2022, 15(13), 4716; https://doi.org/10.3390/en15134716
Submission received: 25 May 2022
/
Revised: 21 June 2022
/
Accepted: 24 June 2022
/
Published: 27 June 2022
(This article belongs to the Special Issue Energy Saving for Sustainable Built Environment, Climate, and City)
Abstract
:It is now highly likely that with the rise in fuel, gas and electricity prices, groundwater deposits will become the third primary source of renewable energy, alongside photovoltaic cells and wind turbines. These deposits are characterized by unlimited clean and environmentally friendly energy with constant parameters independent of the fluctuations of wind and solar energy. This paper presents innovative low-carbon solutions for converting groundwater energy into heating and cooling energy in FCH HVAC. A good example of a significant reduction in CO2 emissions achieved by this technology is a study describing the system implemented in the Integrative Sports and Recreation Center in Łomianki. New installations for the FCH technology in the abovementioned center will reduce the consumption of heating and cooling energy as well as CO2 emissions by at least 50%. The aim of this article was to present the energy from underground waters and how to use it in HVAC installations. The authors show a new direction for the use of forgotten energy that is not only available in unlimited quantities at all latitudes but also has a very small carbon footprint and can significantly reduce CO2 emissions.
1. Introduction
The last decade has seen an increase in the use of renewable energy sources on the global market [1]. In 2022, as the world faces a shift from the traditional employment model and the rapid progress of information technology development while struggling with the pandemic, the war in Ukraine and limited supplies of coal, oil and gas, the existing energy carriers will need to change. Regulations on the reduction of CO2 emissions introduced by the European Union force numerous changes dictated by economic factors and related to environmental protection [2,3,4]. To reduce CO2 emissions, the EU has introduced a system related to CO2 emission allowances (ETS) [5,6,7]. The aim of these activities is to reduce CO2 emissions and use more environmentally friendly technologies in EU countries [8,9,10]. Electricity generated in developing countries is mainly based on fossil fuels [11,12]. This technology has the lowest operating costs and the largest CO2 emissions. The replacement of traditional heating systems is thus recommended by the European Union (EU) [13]. This leads to significant emissions to air and greenhouse gases, including CO2 [14]. In a search for alternative, renewable and green energy sources, the world will be moving towards reducing the use of nonrenewable energy sources and turning to renewable energy, which will help it cut CO2 emissions. On the basis of the information resources published on the wysokienapiecie.pl [15] website and the archived results of testing traditional HVAC systems, as well as the tests of FCH HVAC systems over the last 7 years, the authors demonstrate the environmental importance of natural energy stored in groundwater deposits.
Every ecological solution for building installations that we have on the market today emits a carbon footprint, and this is always linked to CO2 emissions in the initial phase [16]. It is also true that the energy of the sun and wind is limited in time, and without energy storage, it does not give us full security [17]. As accidents at nuclear power stations have shown, here, too, having a choice between nuclear energy and environmentally friendly energy in the ground, people should in future years, until other alternative solutions are available, focus more attention on the energy with the smallest carbon footprint which is available indefinitely and in sufficient quantities to secure every building in Poland and throughout the world.
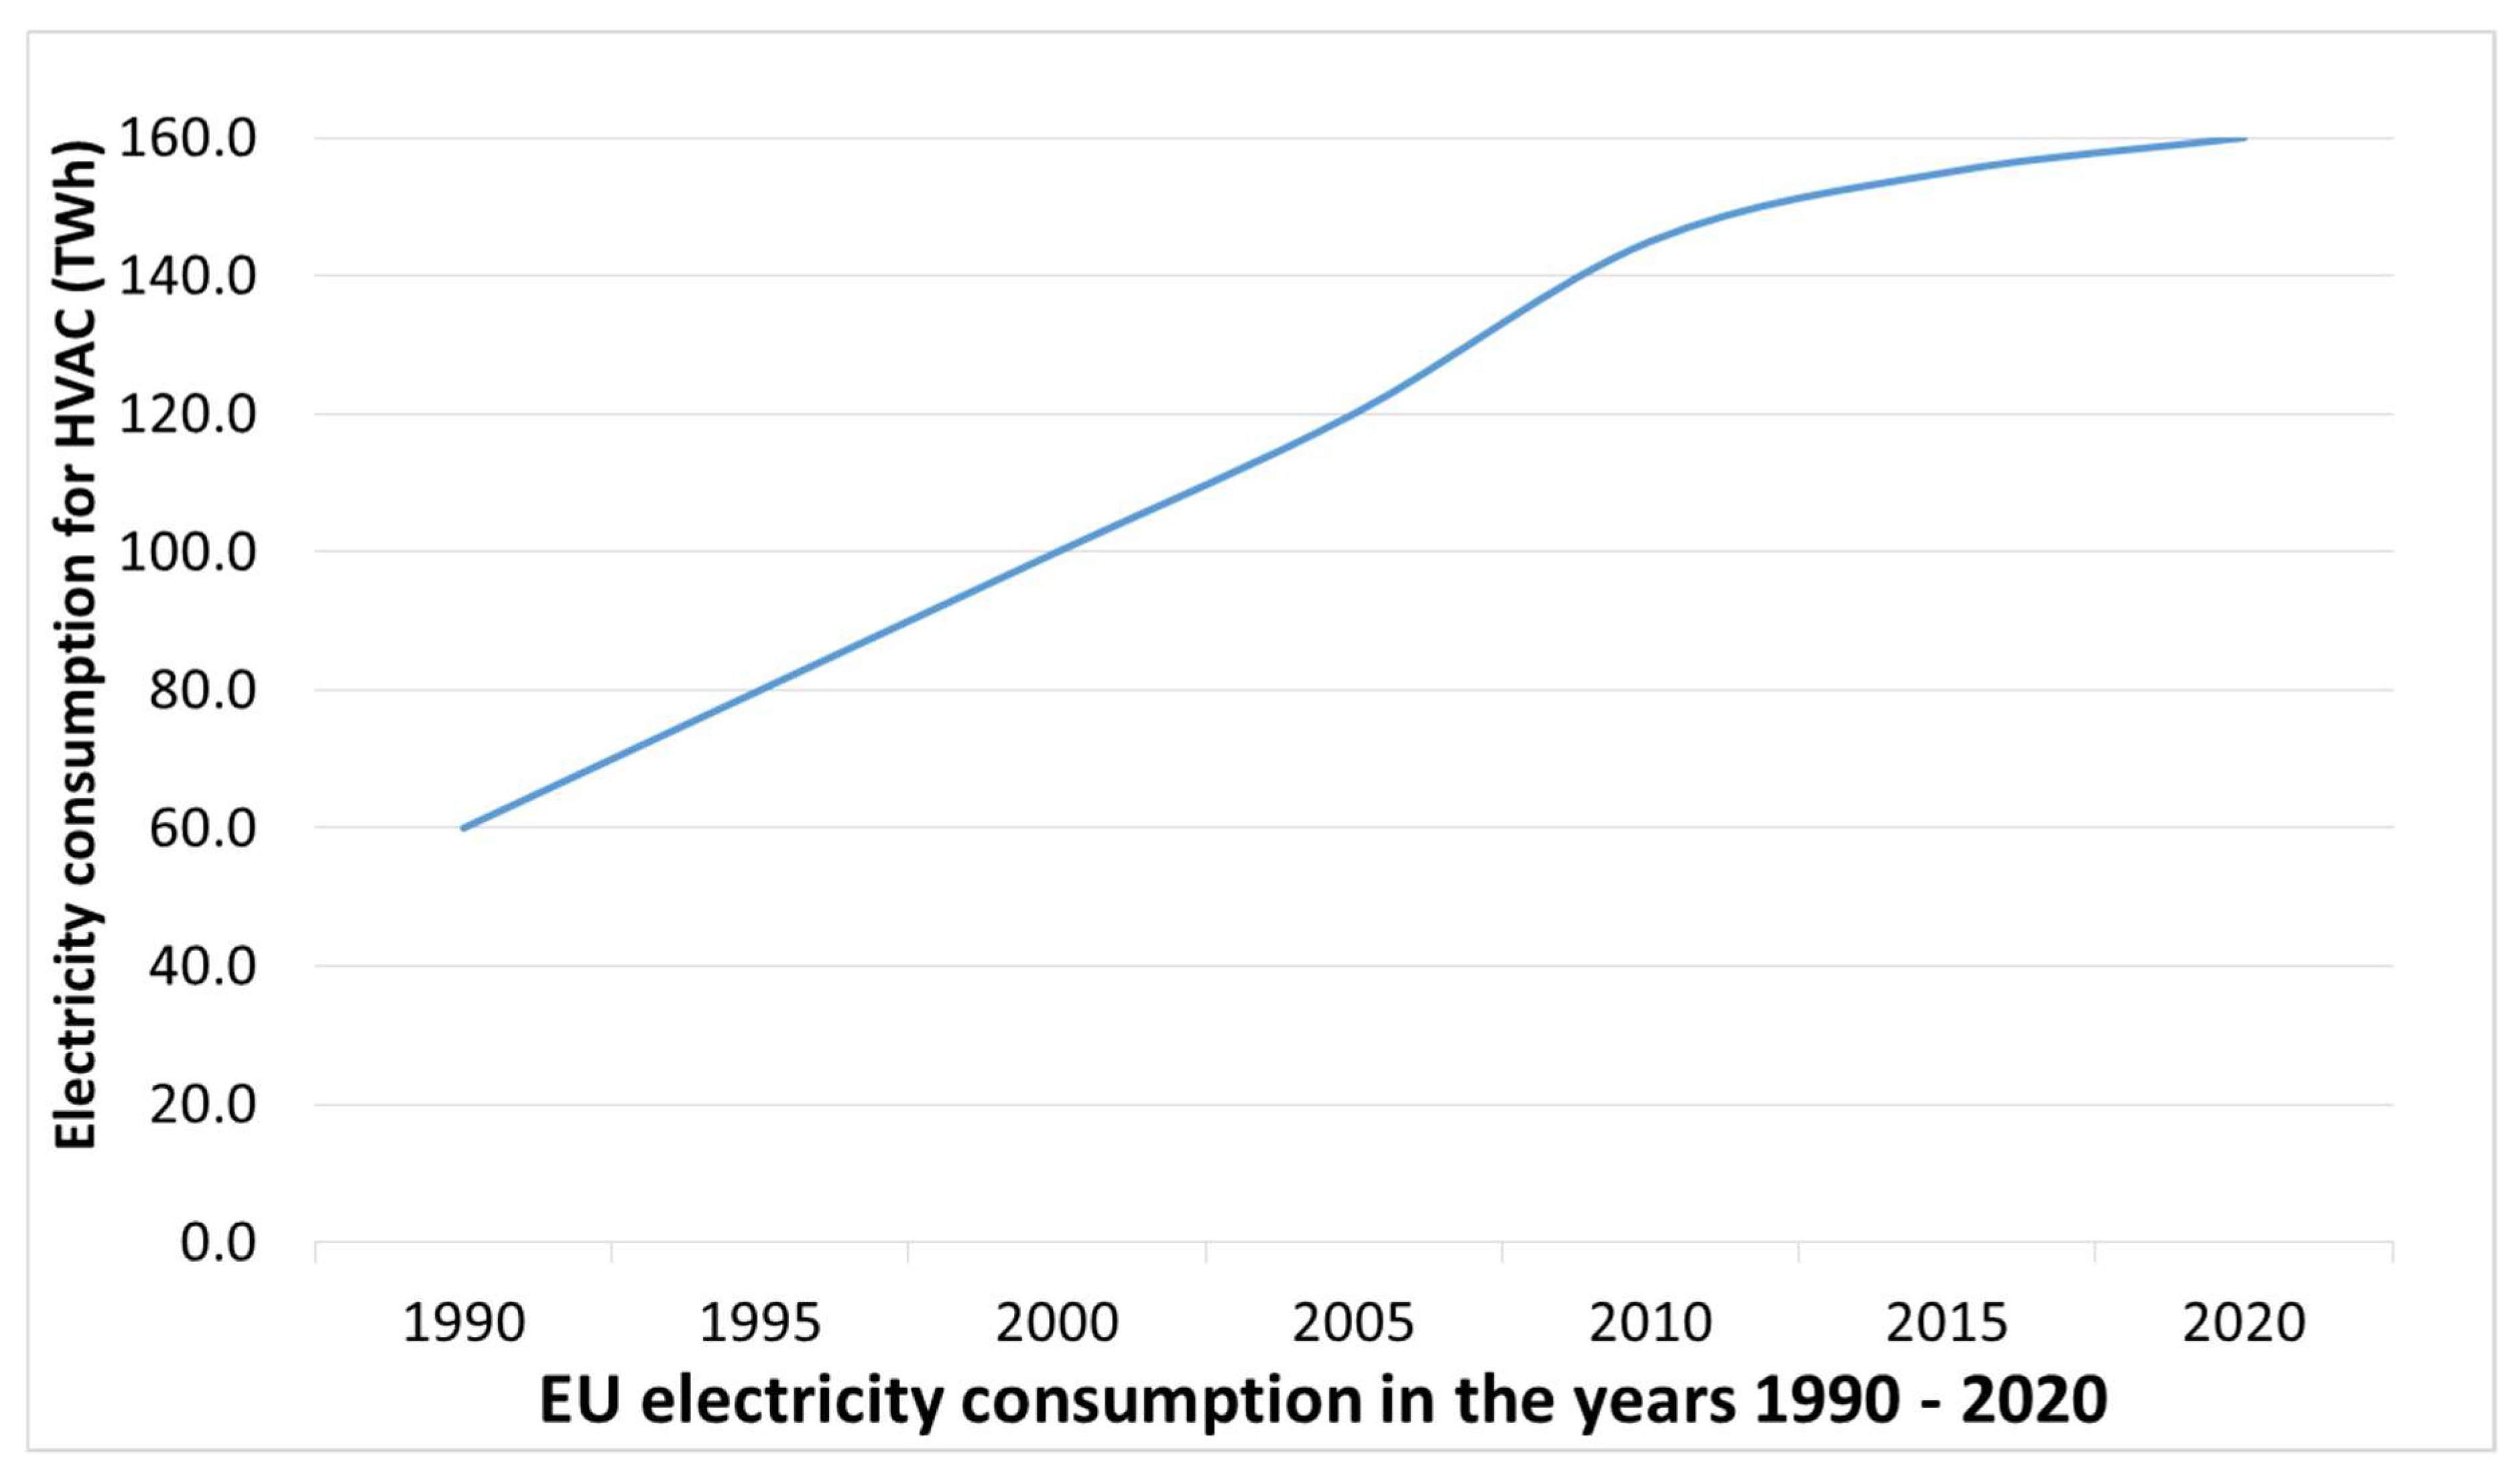
The analysis is based on the studies performed between 2014 and 2021 at several representative buildings in Poland, such as in Warszawa Targówek [18] and Mielec Navigator [19], with a total area of FCH HVAC systems of over 90,000 m2. This paper discusses the results of these studies, with final energy (FE) and primary energy (PE) reductions and CO2 emissions reduction by 50%. Figure 1 presents energy consumption in EU buildings for cooling purposes, 150 TWh.
Taking energy consumption for cooling, we can determine energy consumption for heating in a similar way. The EU expected energy consumption reduction for cooling with the FCH technology is 150 TWh × 50% = 75 TWh. The EU expected energy consumption reduction for heating with the FCH technology is 150 TWh × 50% = 75 TWh. The expected total energy consumption reduction in EU FCH HVAC systems for heating and cooling will be over 150 TWh, which translates into 90% of total energy consumption in Poland.
A good option for the new decade of fighting CO2 emissions in the new reality of 2022 will be energy stores of green energy deposited in groundwater and available to every land owner in Poland and globally. The parameters of groundwater at the average depth of 10 m in winter (+10 °C) and in summer (+10 °C) are perfect for heating and cooling using the FCH technology. These parameters have a huge impact on the operating costs of any investment project, which will be explored further in this paper. An example of future implementations may be the “WICA” Eastern Innovation Center of Architecture [20] and the Potocki Palace and Park Complex in Radzyń Podlaski [21] representing value of the architecture in nodal places of the city. The palace in Radzyń Podlaski functions as a integrating monument [22].
2. Materials and Methods
Description of the FCH Technology (Free Cooling and Heating)
Air conditioning, cooling and heating systems account for a significant proportion of total electricity consumption [12]. A number of patents obtained by the author (W.S.) in this field are the basis for the research carried out on this subject [23,24,25,26,27]. The goal of the FCH technology, which the authors present here along with the study results, is to source heating and cooling energy from groundwater in order to supply it to special FCH air handling units, which involve a system of coolers and heaters to cool or heat fresh air to a set temperature.
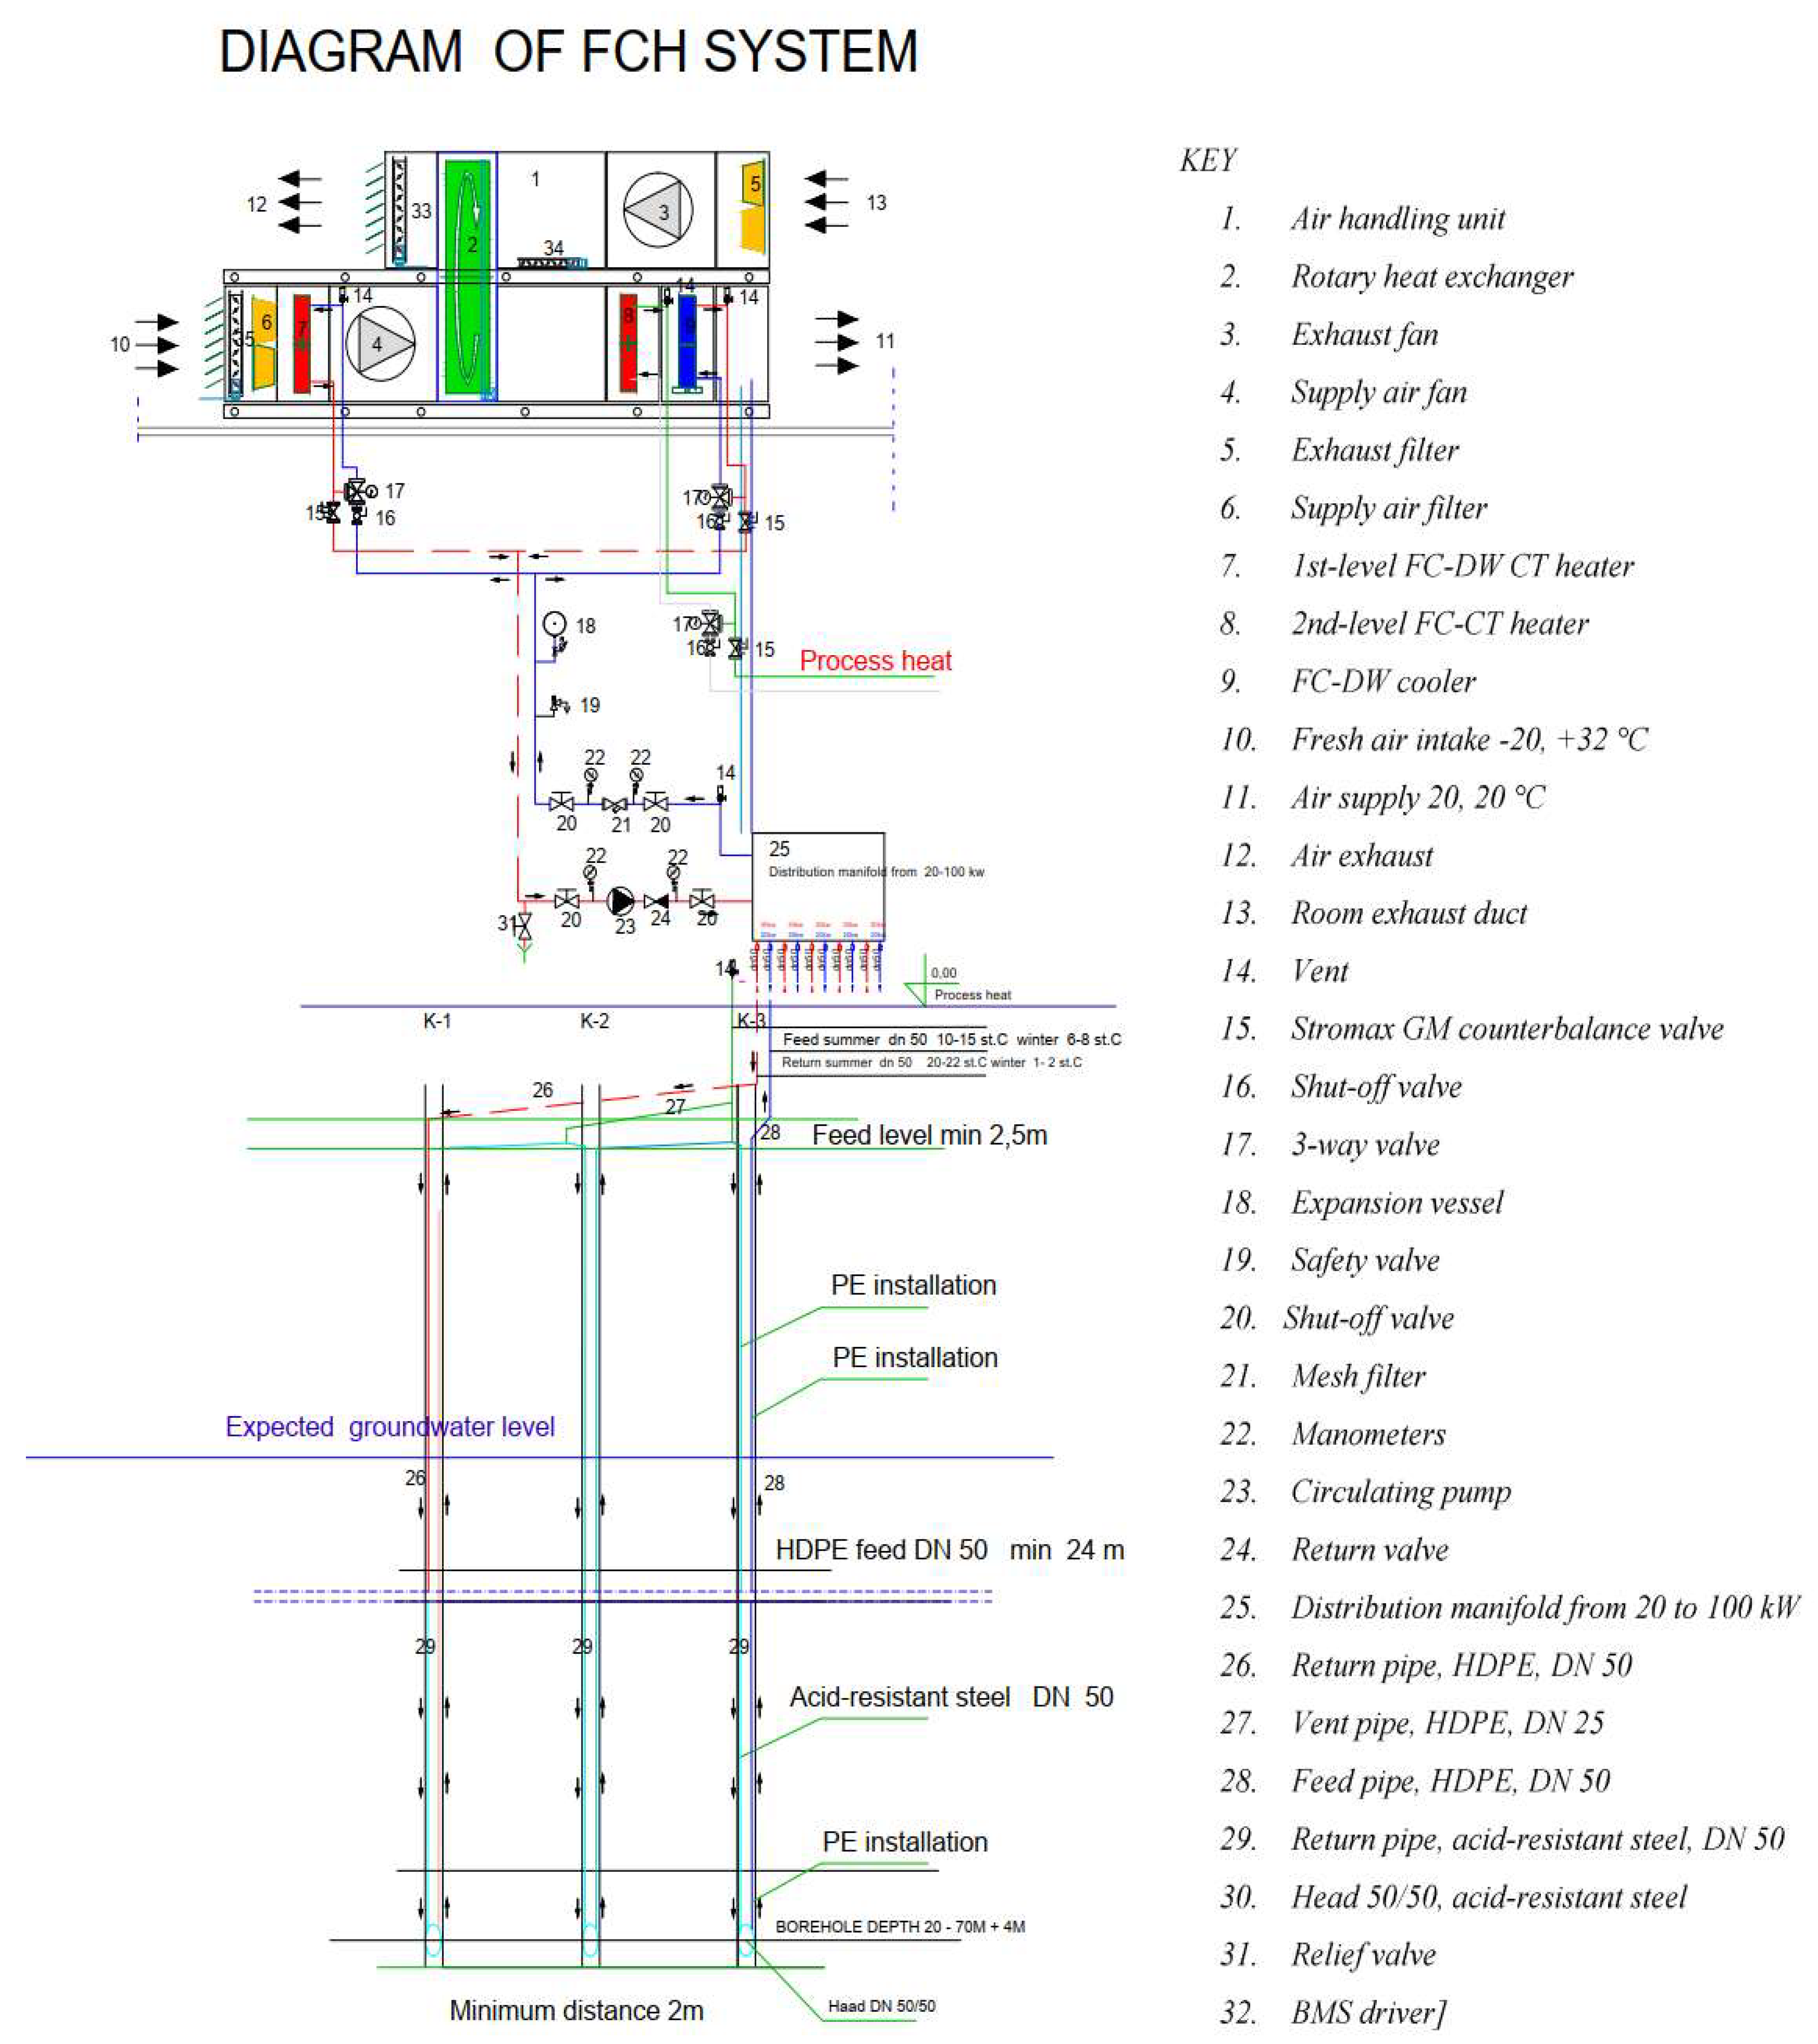
The described technology provides a way to use the renewable energy of groundwater to reduce CO2 emissions. Figure 2 presents the detailed information and a diagram of the system. Currently, in the traditional system, cooling energy is produced, e.g., in water chillers, where chilled water is produced with electrical energy [28], to achieve the following parameters: 7 °C feed and 12 °C return.
The diagram presented in Figure 2 shows the structure of the system below the ground level with an air distribution manifold and the underground system from the distribution manifold well to the vertical exchanger system crowned with a head. Energy exchange occurs in vertical exchangers made of steel tubes placed in a borehole with a depth of about 20 to 70 m. Vertical exchangers are conduits which in dry areas are made of PEHD 100 PN10 SDR17 polyethylene tubes and in groundwater areas feature steel inserts made of acid-resistant tubes that improve the exchange of heating/cooling.
The presented scheme in Figure 2 shows us a method of extracting energy from groundwater with a control unit [1] responsible for the distribution of hot and cold energy to the rooms in buildings connected to a circulation pump [25] responsible for energy transport connected to a distributor [27] providing energy from the groundwater zone taken from the installation (K-1,2,3).
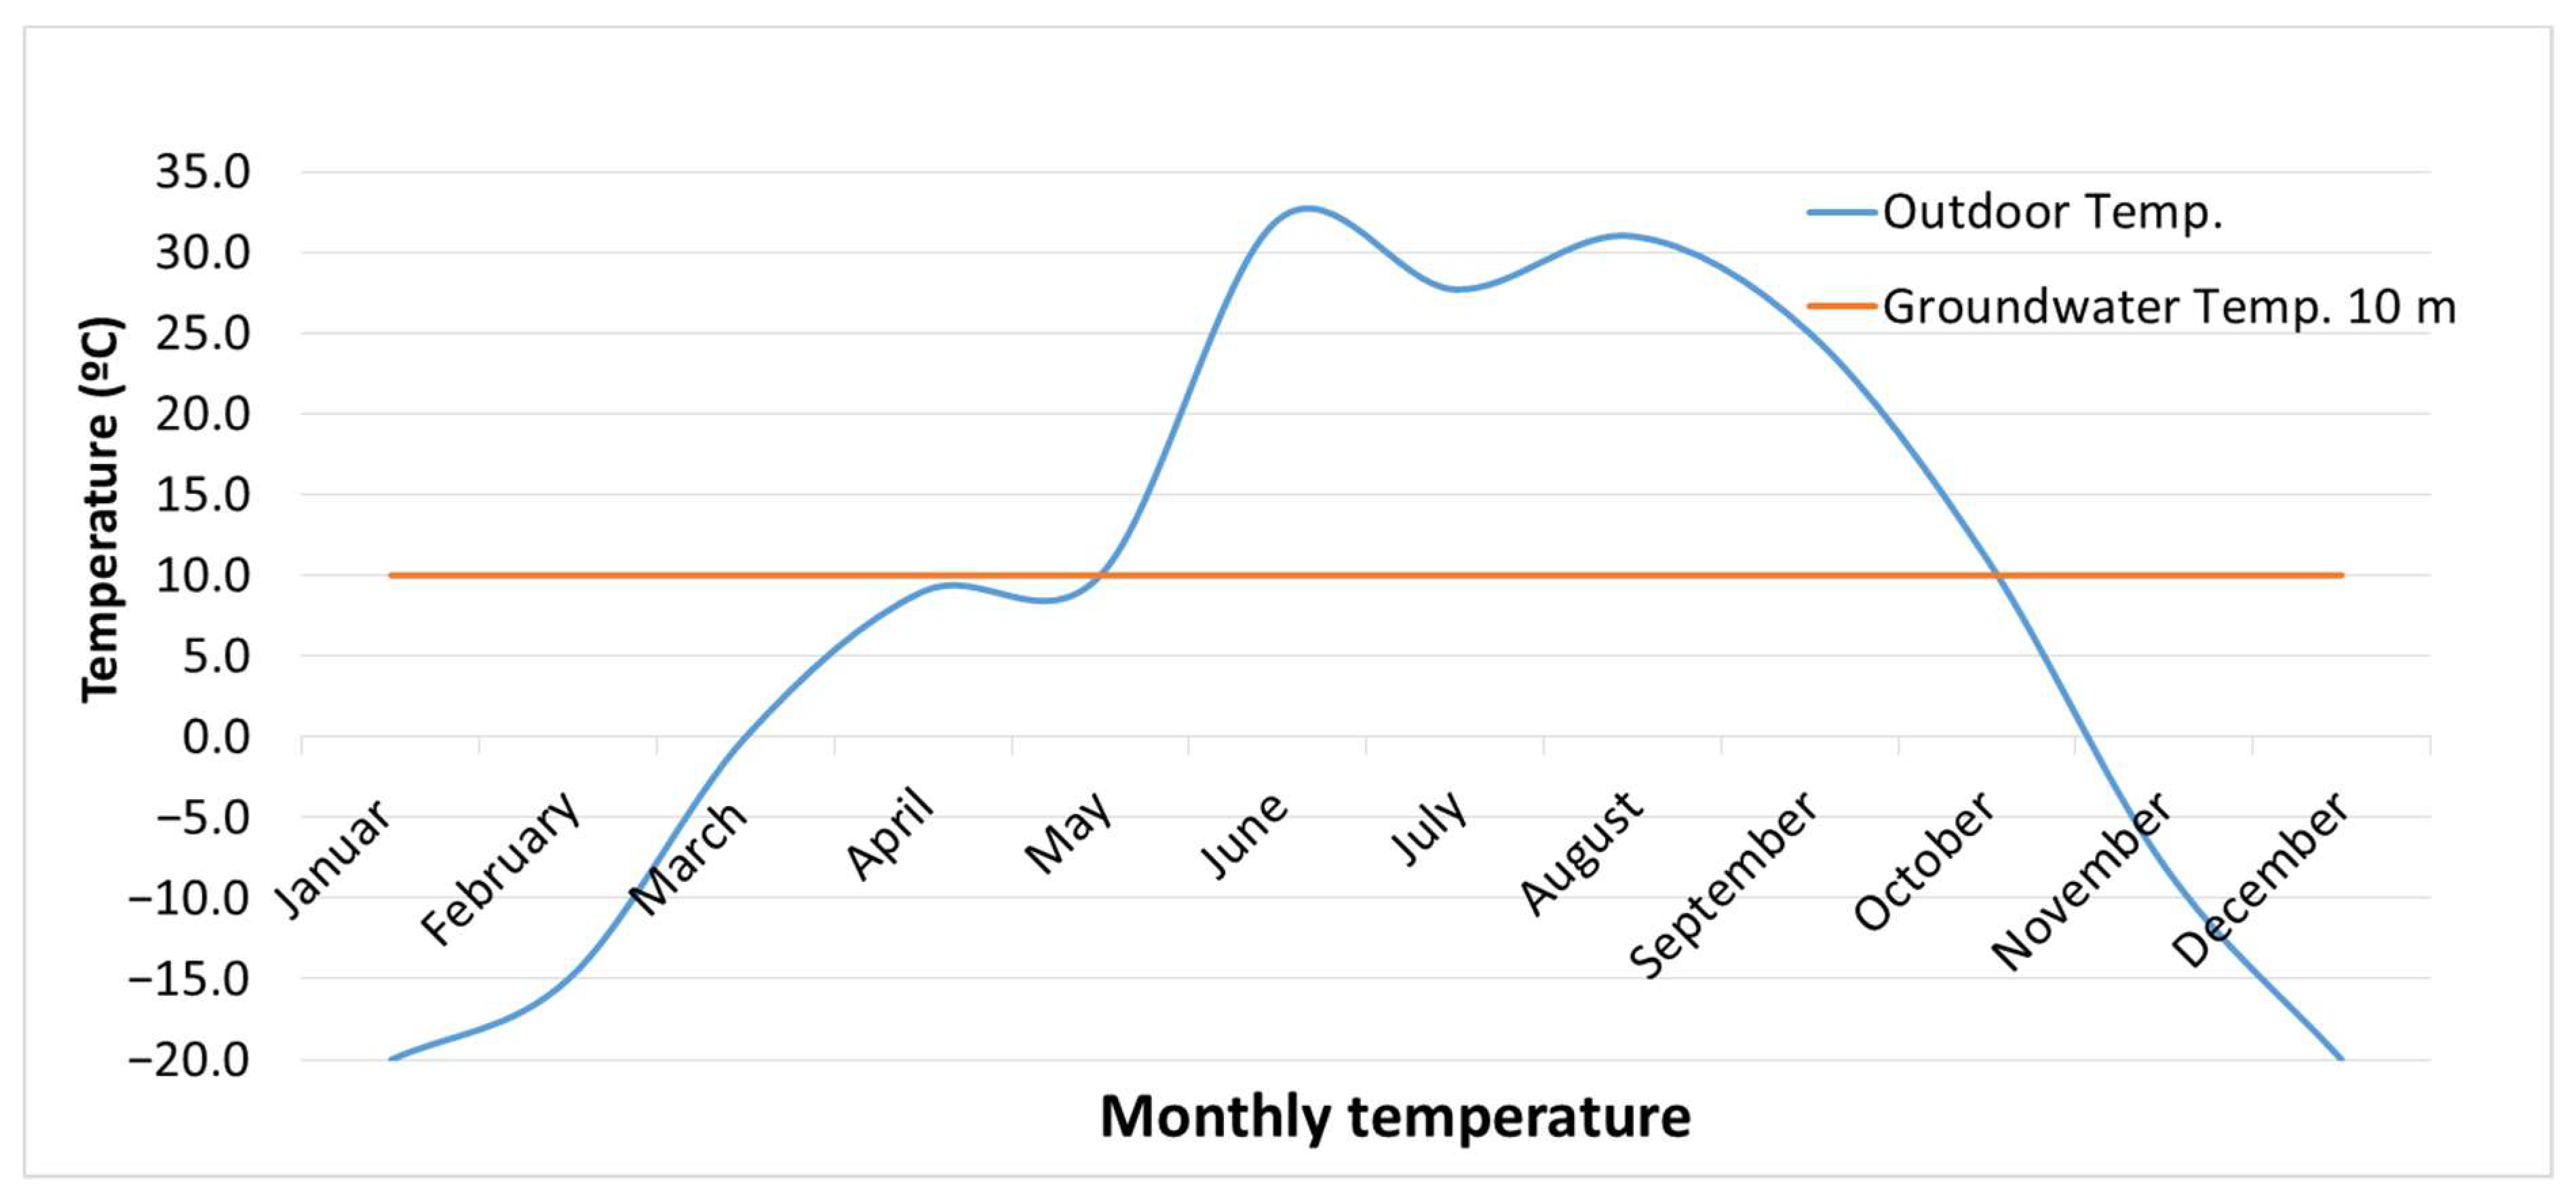
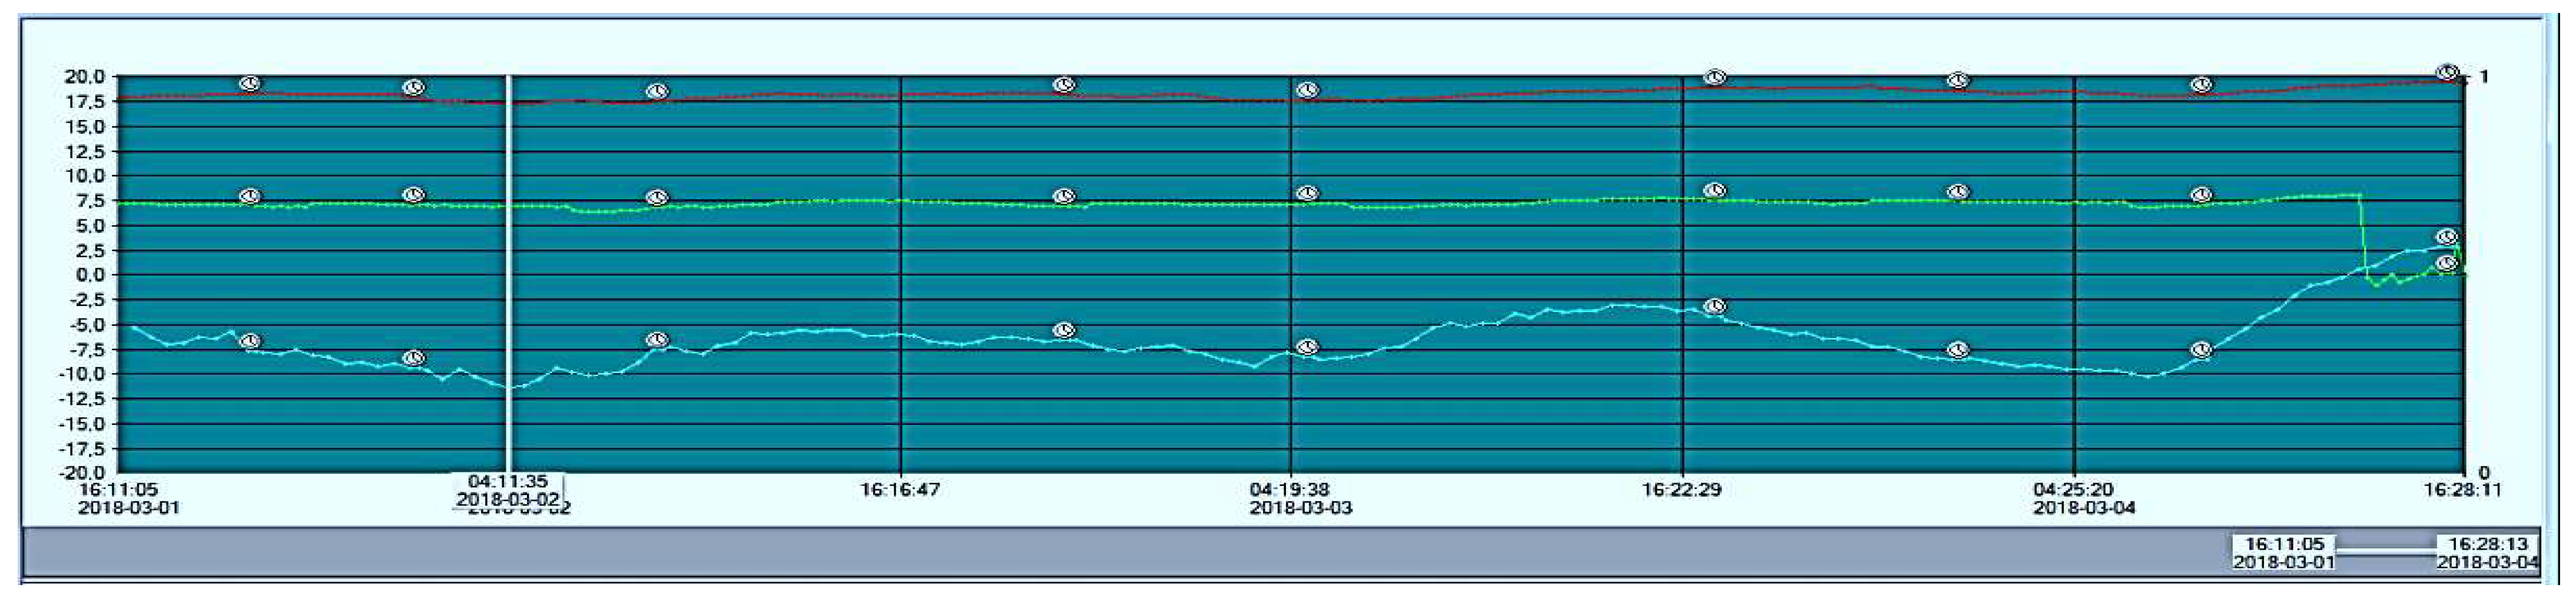
Energy extraction, as shown in the schematic diagram of the FCH technology (Figure 2), is continuous, and groundwater is a large-scale storage that operates 24 h a day without interruption and at constant parameters (Figure 3), i.e., 10 °C at a depth of 10 m. This storage is the ideal energy for cooling, (described in detail in Section 3.2—Figures 9 and 10 with an outdoor temperature of 36 °C (heat reduction of 50%) and, where the outdoor temperature was taken to 65 °C during the installation test (the cooling energy also reduced the temperature by 50%). The question of how the ventilation air can be heated with these constant parameters is answered by a diagram from the BMS (Figure 4) in which we can see the constant temperature of cold reduction, where at an outside temperature of −11.3 °C the energy stored in groundwater, via a glycol-based system, heats the cold outside air to +6.9 °C, giving us an energy of 97.45 kW.
The diagram (Figure 2) shows us some very important information that will allow us to draw some very bold conclusions at the end:
- -
- FCH plants are an innovative solution and show great unlimited energy storage.
- -
- Energy is constant 24 h a day.
- -
- Energy is available without limitations.
- -
- The technology extracts energy from groundwater in a closed system, i.e., after releasing energy in units [1], the water returns to the ground to the vertical exchangers intact, with only a small temperature change (not exceeding 0–26 °C).
- -
- The technology does not consume groundwater.
- -
- Energy is available in every country.
- -
- The technology has a very small carbon footprint (around 10% of other solutions), is natural, can reduce CO2 emissions from HVAC by up to 50% and, most importantly, is 100% renewable.
- -
- The technology is also 100% ecological as it is a closed system that has no impact on groundwater levels.
The systems are implemented as forced-circulation double-pipe closed-circuit systems. The elements that ensure the desirable flow parameters of the agent in the system are circulator pumps rather than heat pumps installed at the supply duct for the air handling units. A 35% solution of ethylene glycol protects the system from low temperatures and ensures its continuous operation in the period of low temperatures.
The basis of the FCH technology described in this paper is groundwater temperature, which at the depth of 10 m (Figure 3) has a temperature of about 10 °C. As shown in the figure, the natural environment provides us with free energy which has identical parameters to the energy produced in CFC-based systems. The described parameter of groundwater at 10 °C is decisive in directly utilizing groundwater with the omission of water chillers for the FCH HVAC technology, which leads to a dramatic reduction in operating costs of every system by 50%, resulting in a similar CO2 emissions reduction while maintaining very high required internal parameters.
3. Results and Discussion
3.1. Test Results of the Capacity of Groundwater Deposits
The tests were performed in Warsaw/Targówek [18] from 1 March 2018, 4.11 PM, to 4 March 2018, 4.28 PM. The results are from the building’s BMS, where at the external temperature of –11.3 °C the energy stored in groundwater, via a glycol-based system, heats the cold exterior air to + 6.9 °C (Figure 4).
The stability of this test confirms the immense capacity of the ground FCH heat exchanger.
Borehole capacity on the basis of the temperature difference calculated using a simplified method is as follows:
- V—volume flow rate of air = ;
- ρ—air density = ;
- Cp—specific heat of air = 1.005;
- ΔT—difference in the air temperatures upstream and downstream of the heater .
3.2. Resulting Indoor Conditions
Indoor air calculation parameters:
The values of indoor temperature and humidity calculated for air-conditioned rooms comply with the Polish standards and with the investor’s guidelines. Table 1 shows the design indoor parameters for all areas.
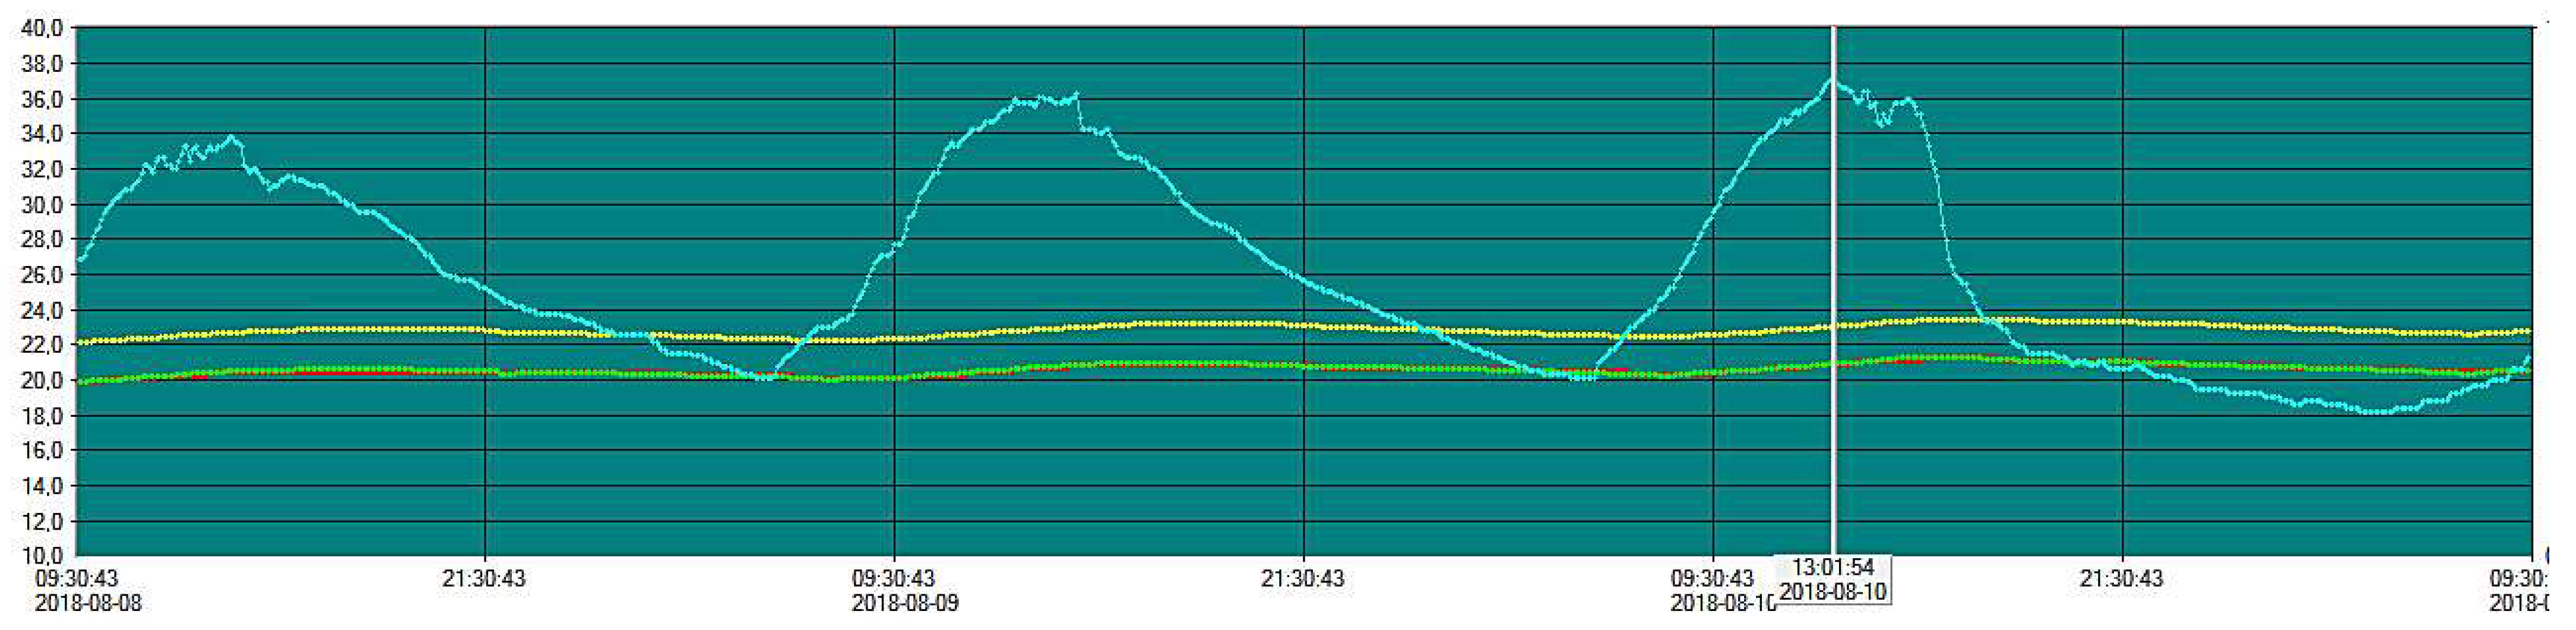
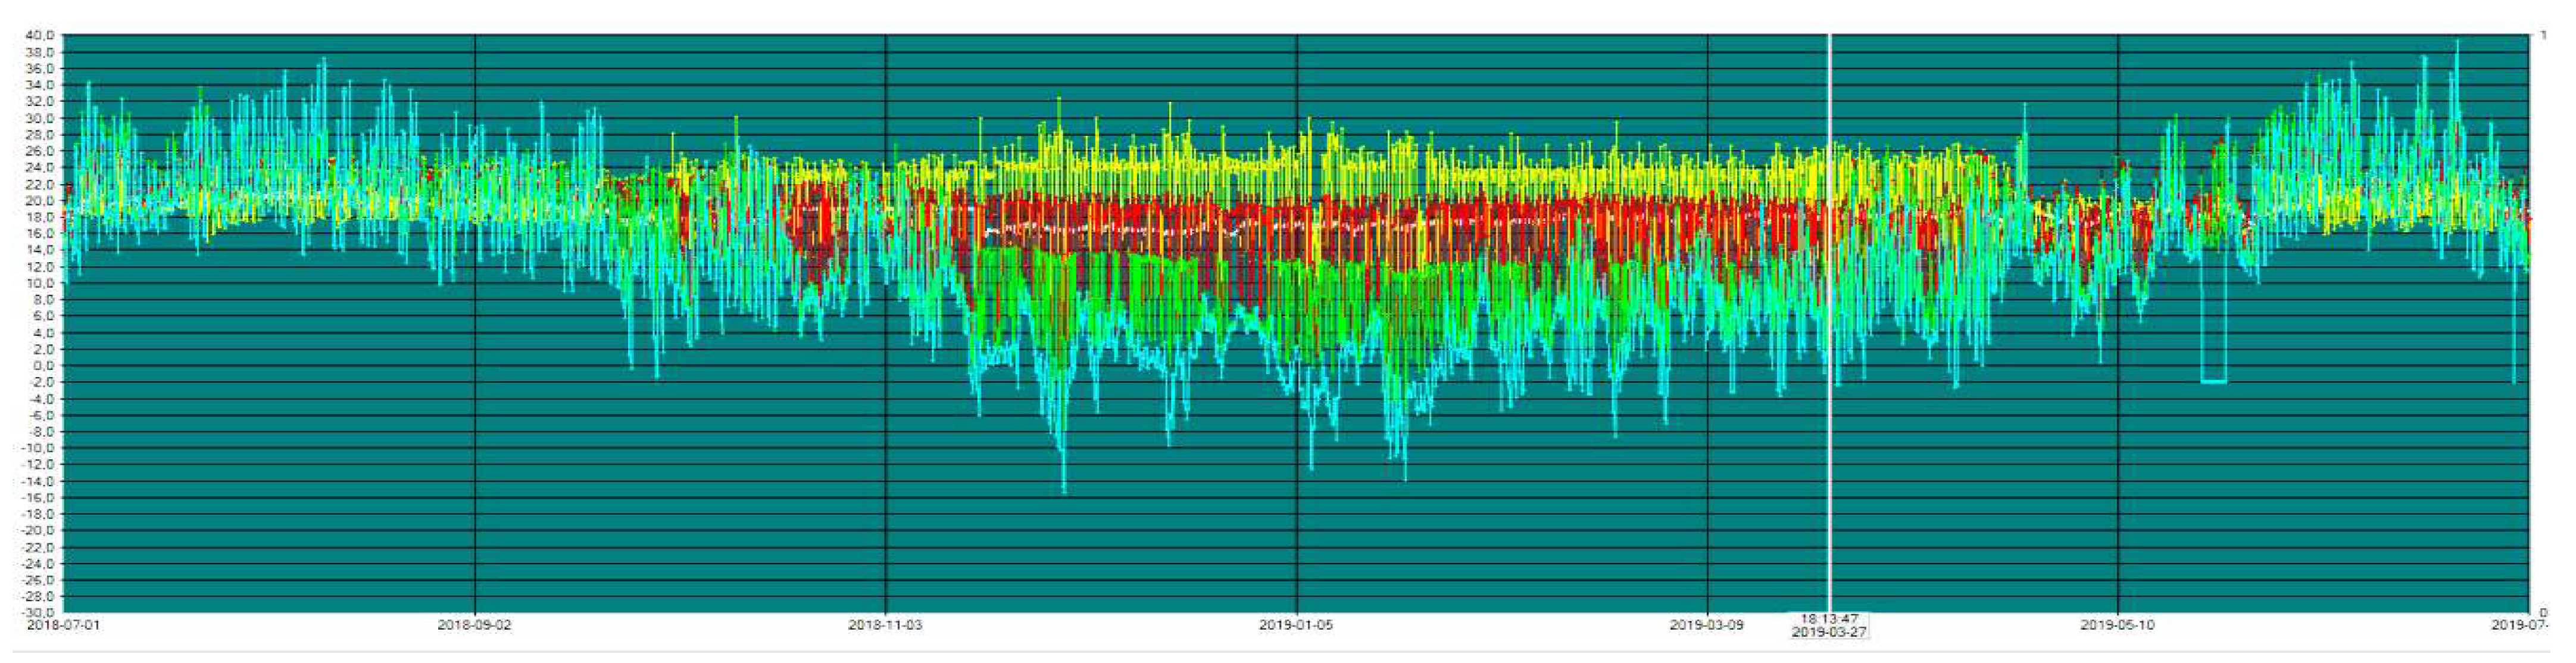
The results presented in Figure 6 demonstrate the stability of HVAC system parameters throughout the years 2018 and 2019, when the room temperature (white) of +18.5 °C was achieved. In winter, with the outdoor temperature of −16.0 °C (blue), it was up to 22.7 °C. The results presented in Figure 6 demonstrate the stability of HVAC system parameters throughout the years 2018 and 2019, when the room temperature (white) of +18.5 °C was achieved. in winter, with the outdoor temperature of −16.0 °C (blue). And it was up to 22.7 °C in summer, with the outdoor temperature of +38.0 °C.This example demonstrates the achievement of the appropriate indoor conditions with an environmentally friendly system based on sourcing heating and cooling energy from groundwater while minimizing CO2 emissions.
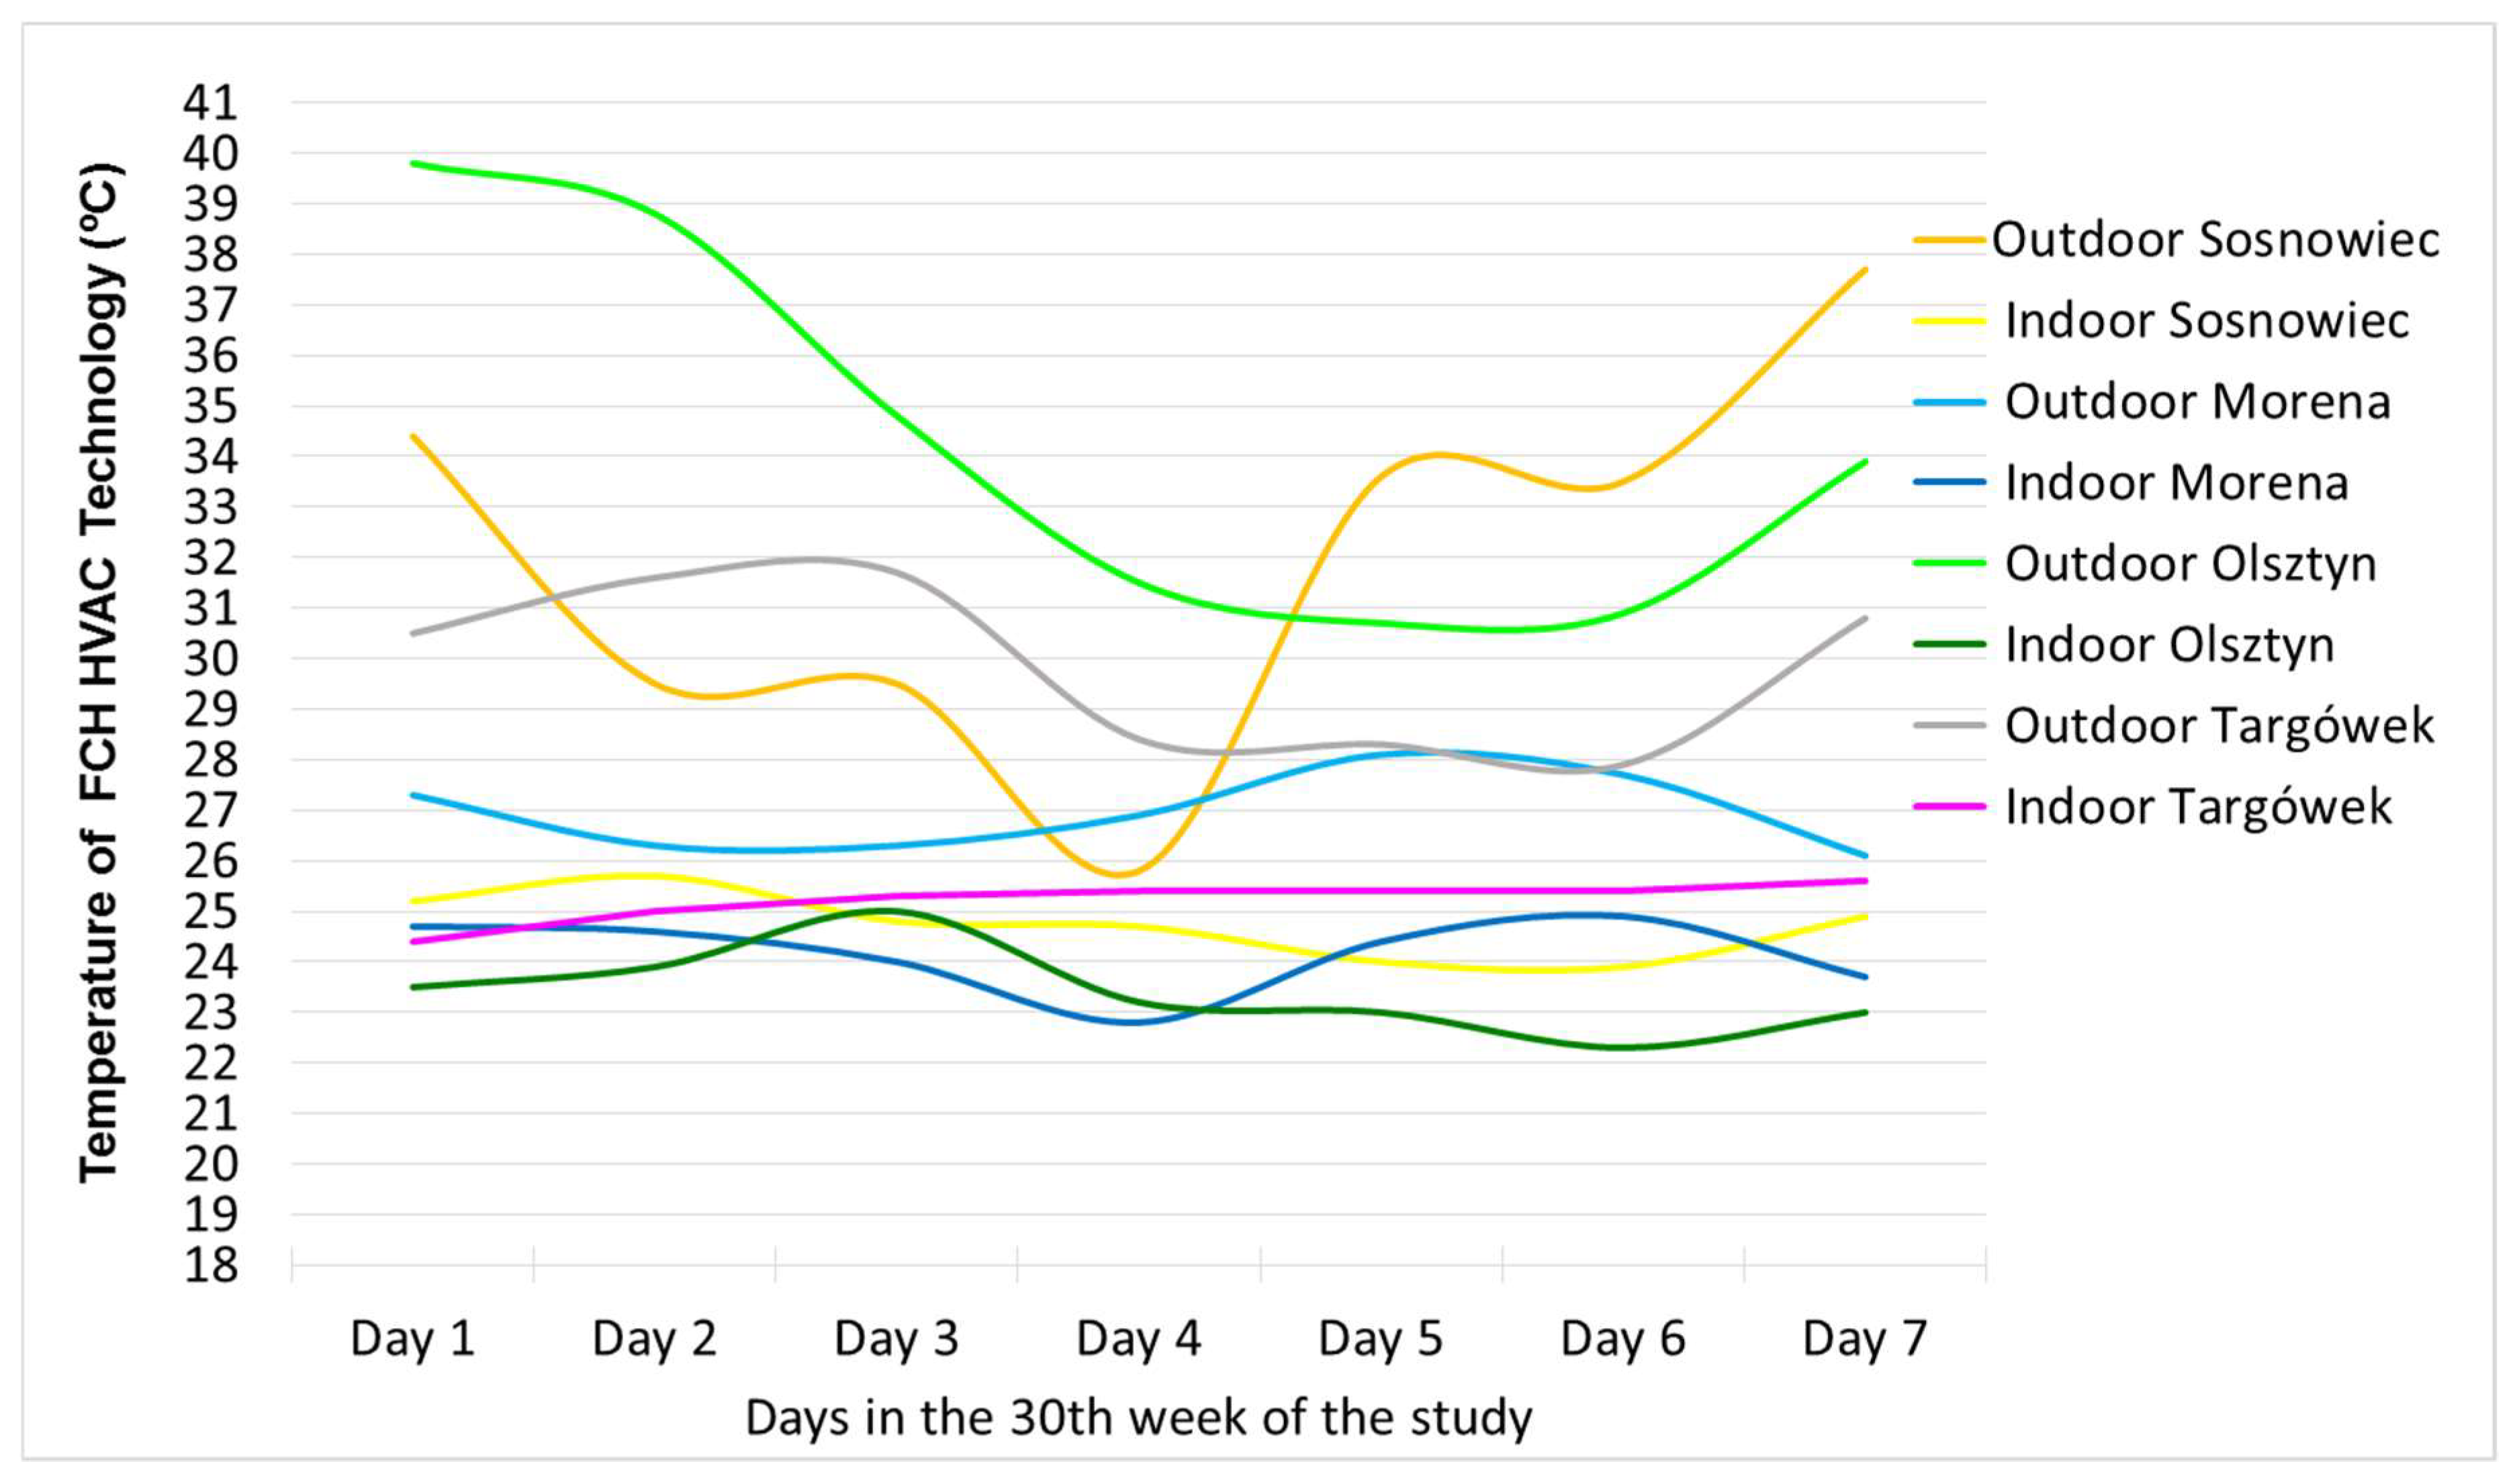
Figure 7 presents an example results outdoor and indoor temperature of the buildings equipped with the FCH technology over Poland.
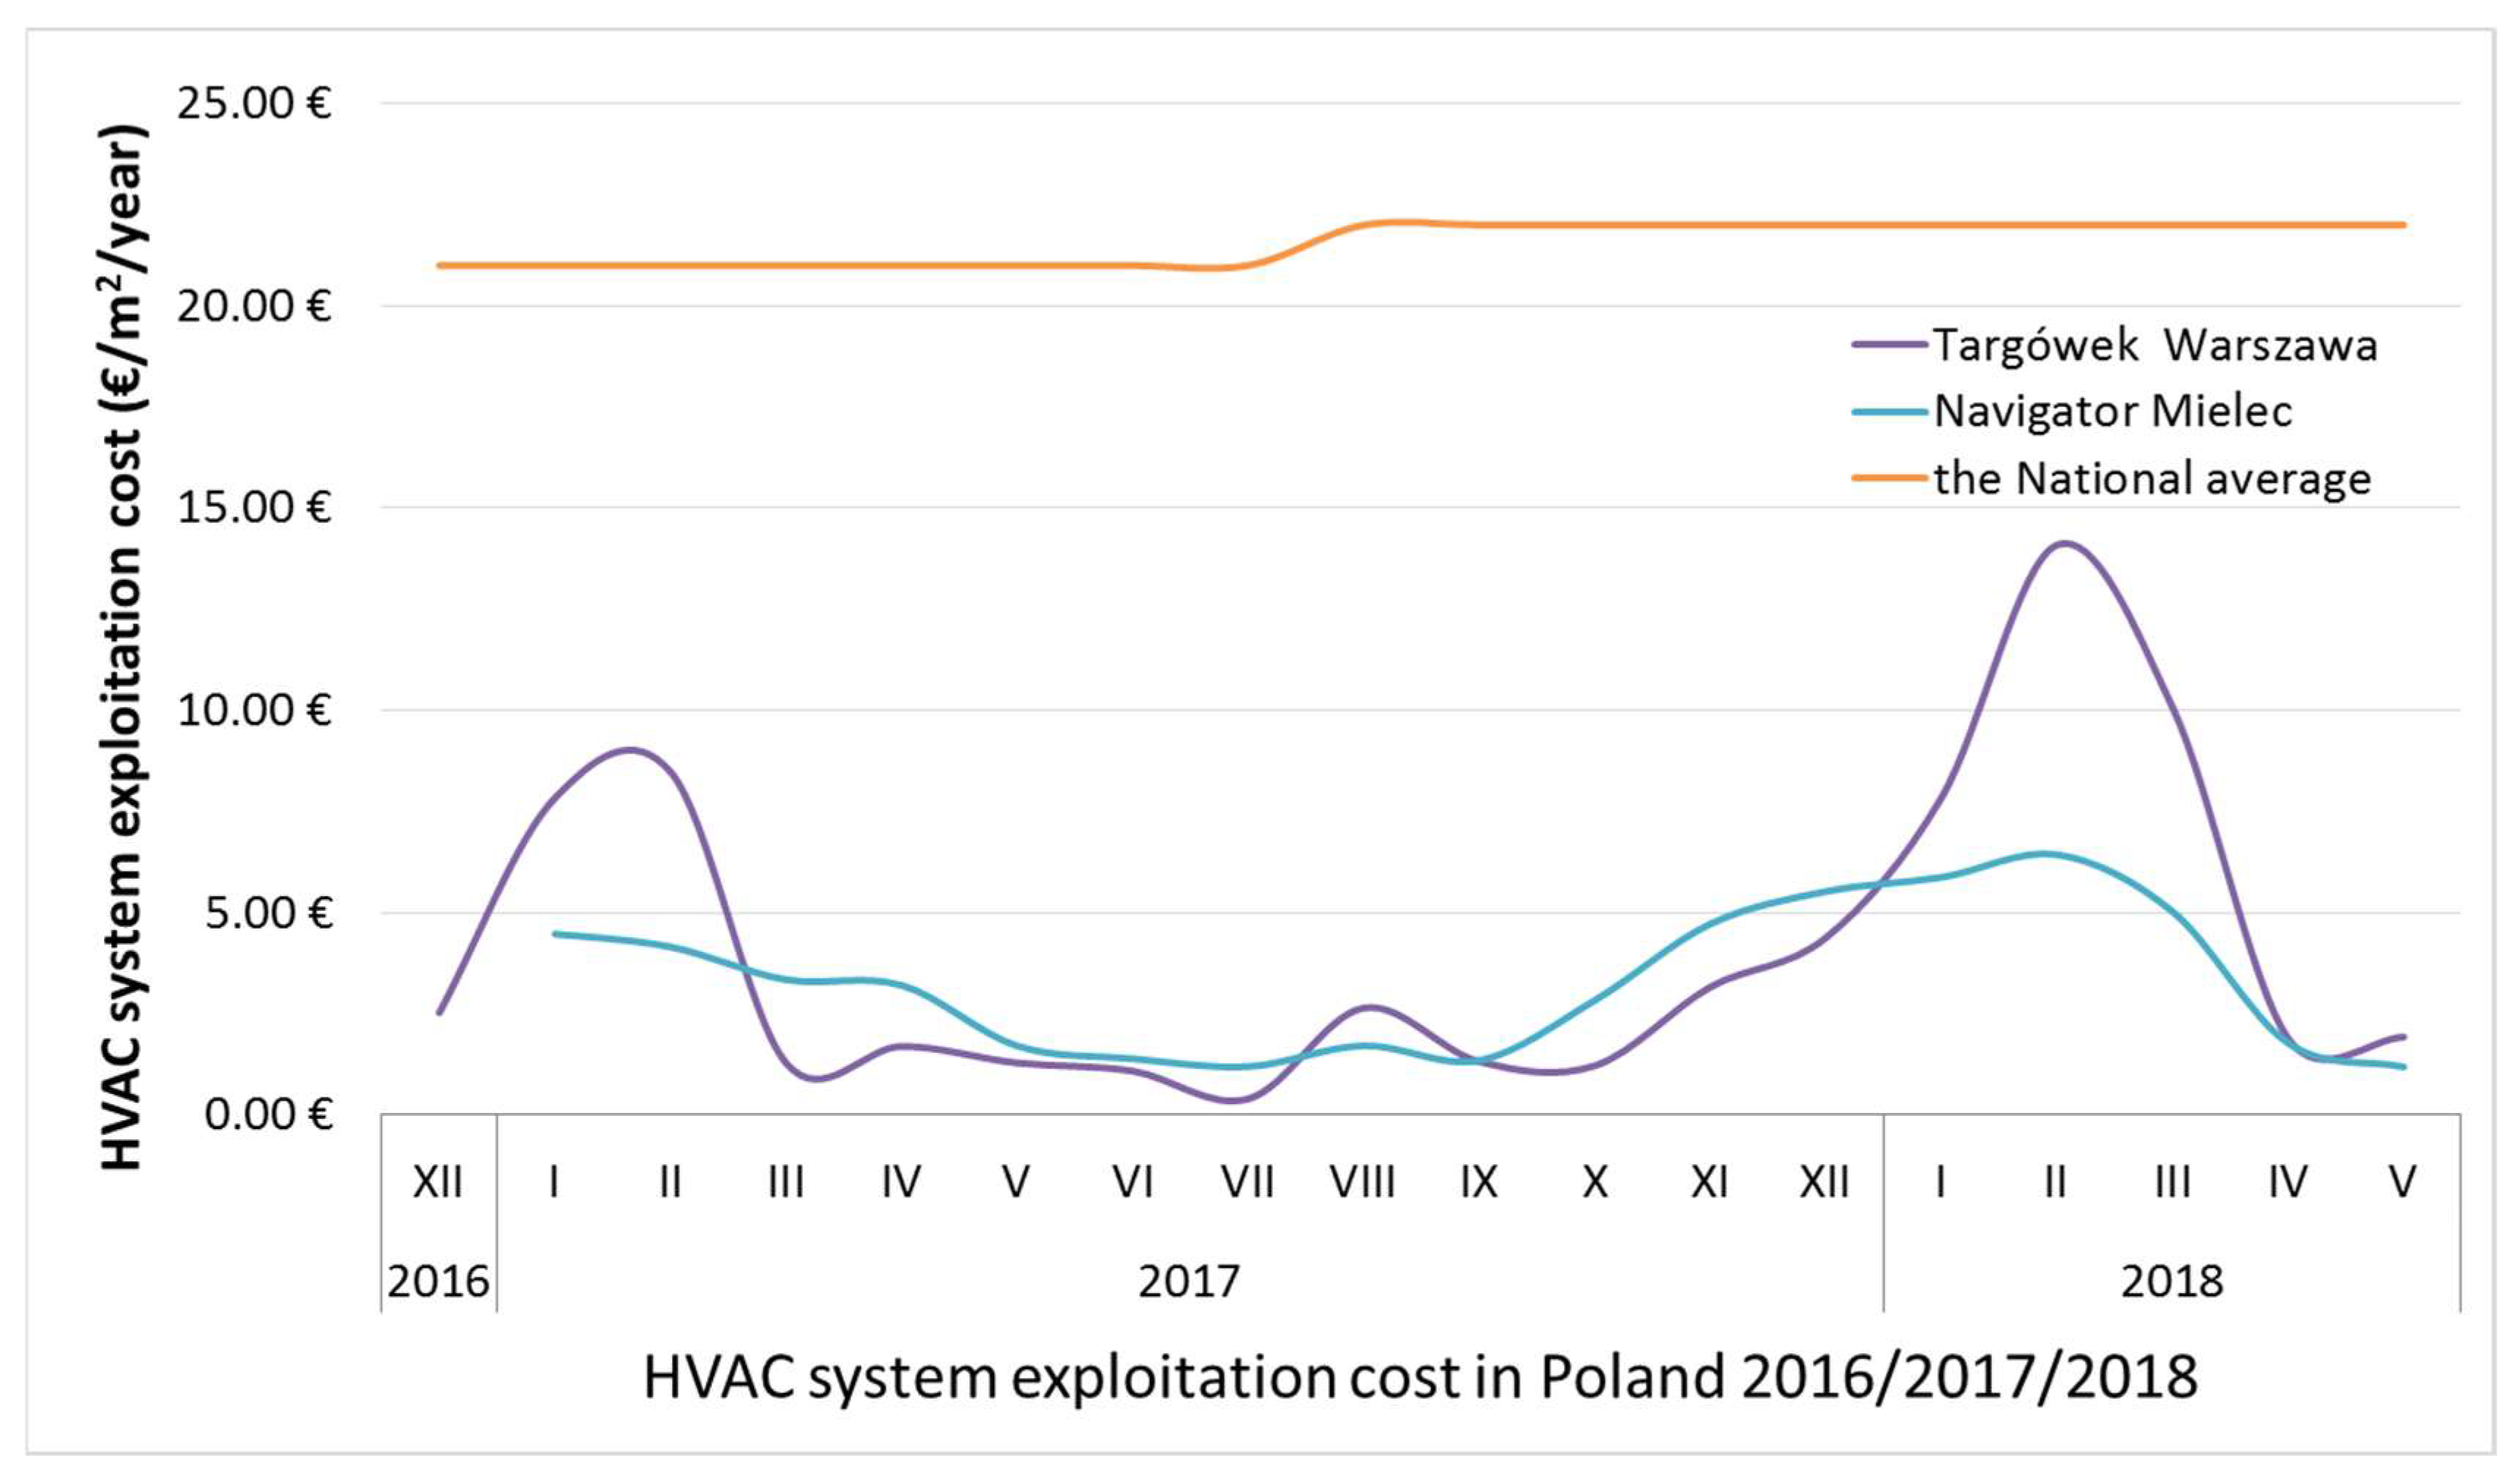
Figure 8 presents an example of final energy (FE) consumption in the period from December 2016 to July 2018 in a comparison of a system based on district heating and an alternative system based on electrical energy. The operating costs are very low—at a level of EUR 3.83 to 3.07/m2/year, with traditional HVAC system costs being EUR 22/m2/year. These results cannot be achieved without the said stores of energy deposited in groundwater. The analysis of only this result leads to the following conclusion—if the world turns to the energy available in groundwater, it can reduce CO2 emissions from HVAC by as much as 80%.
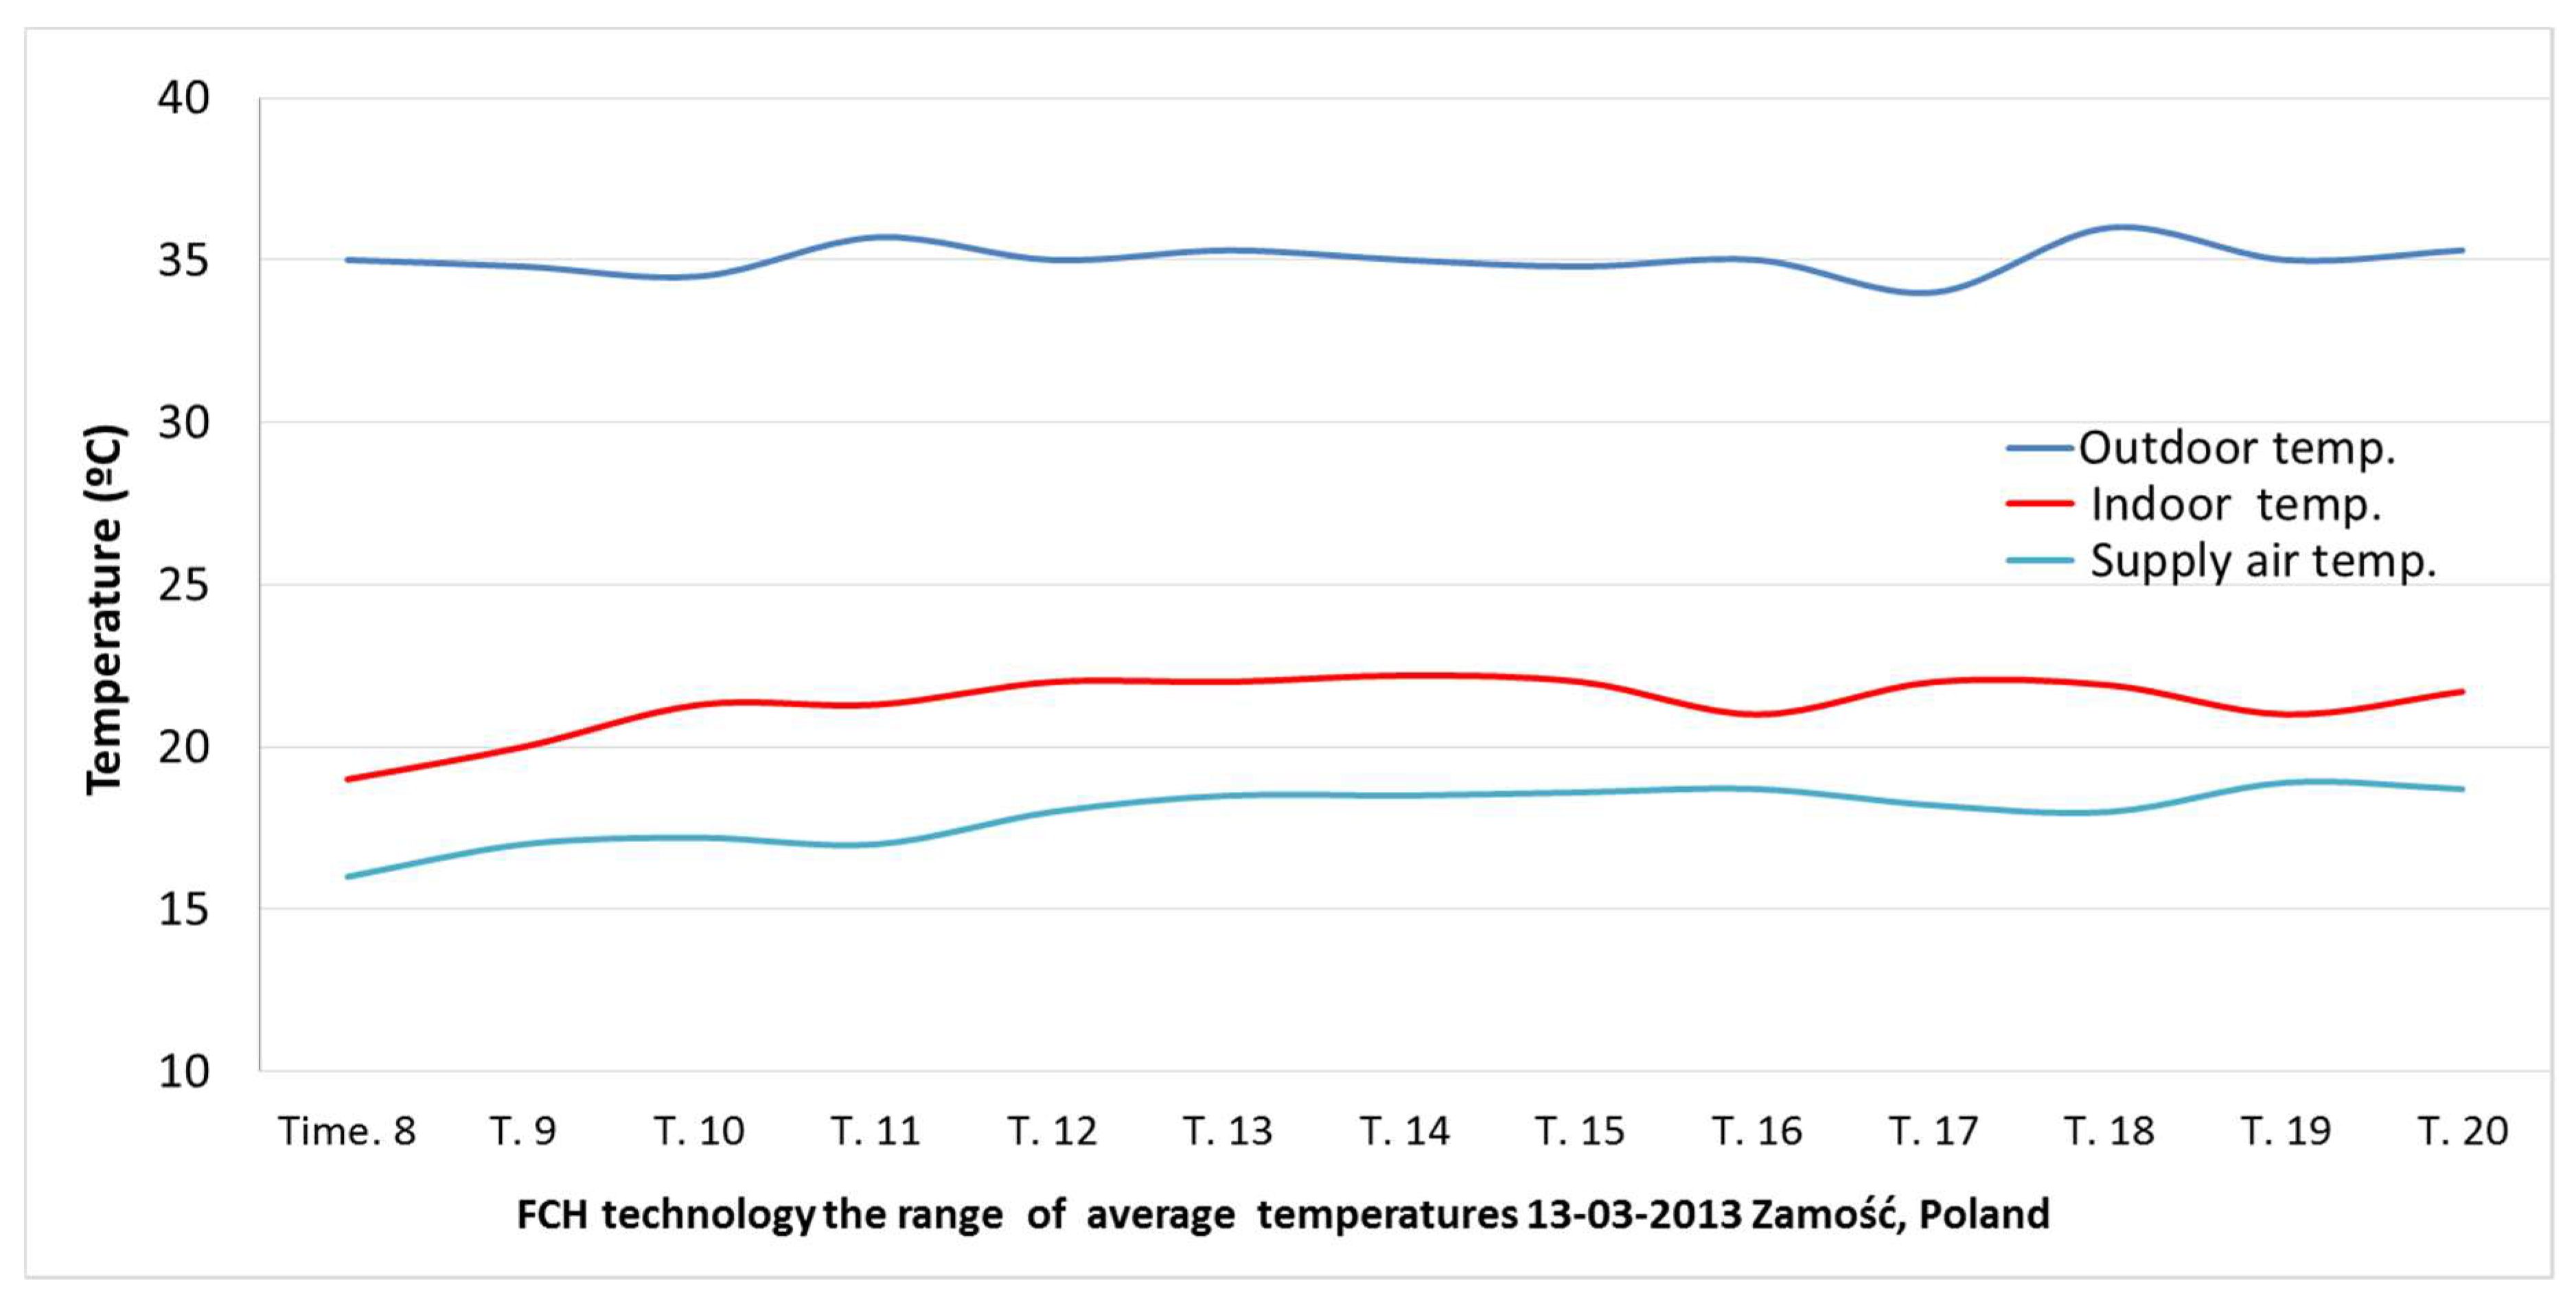
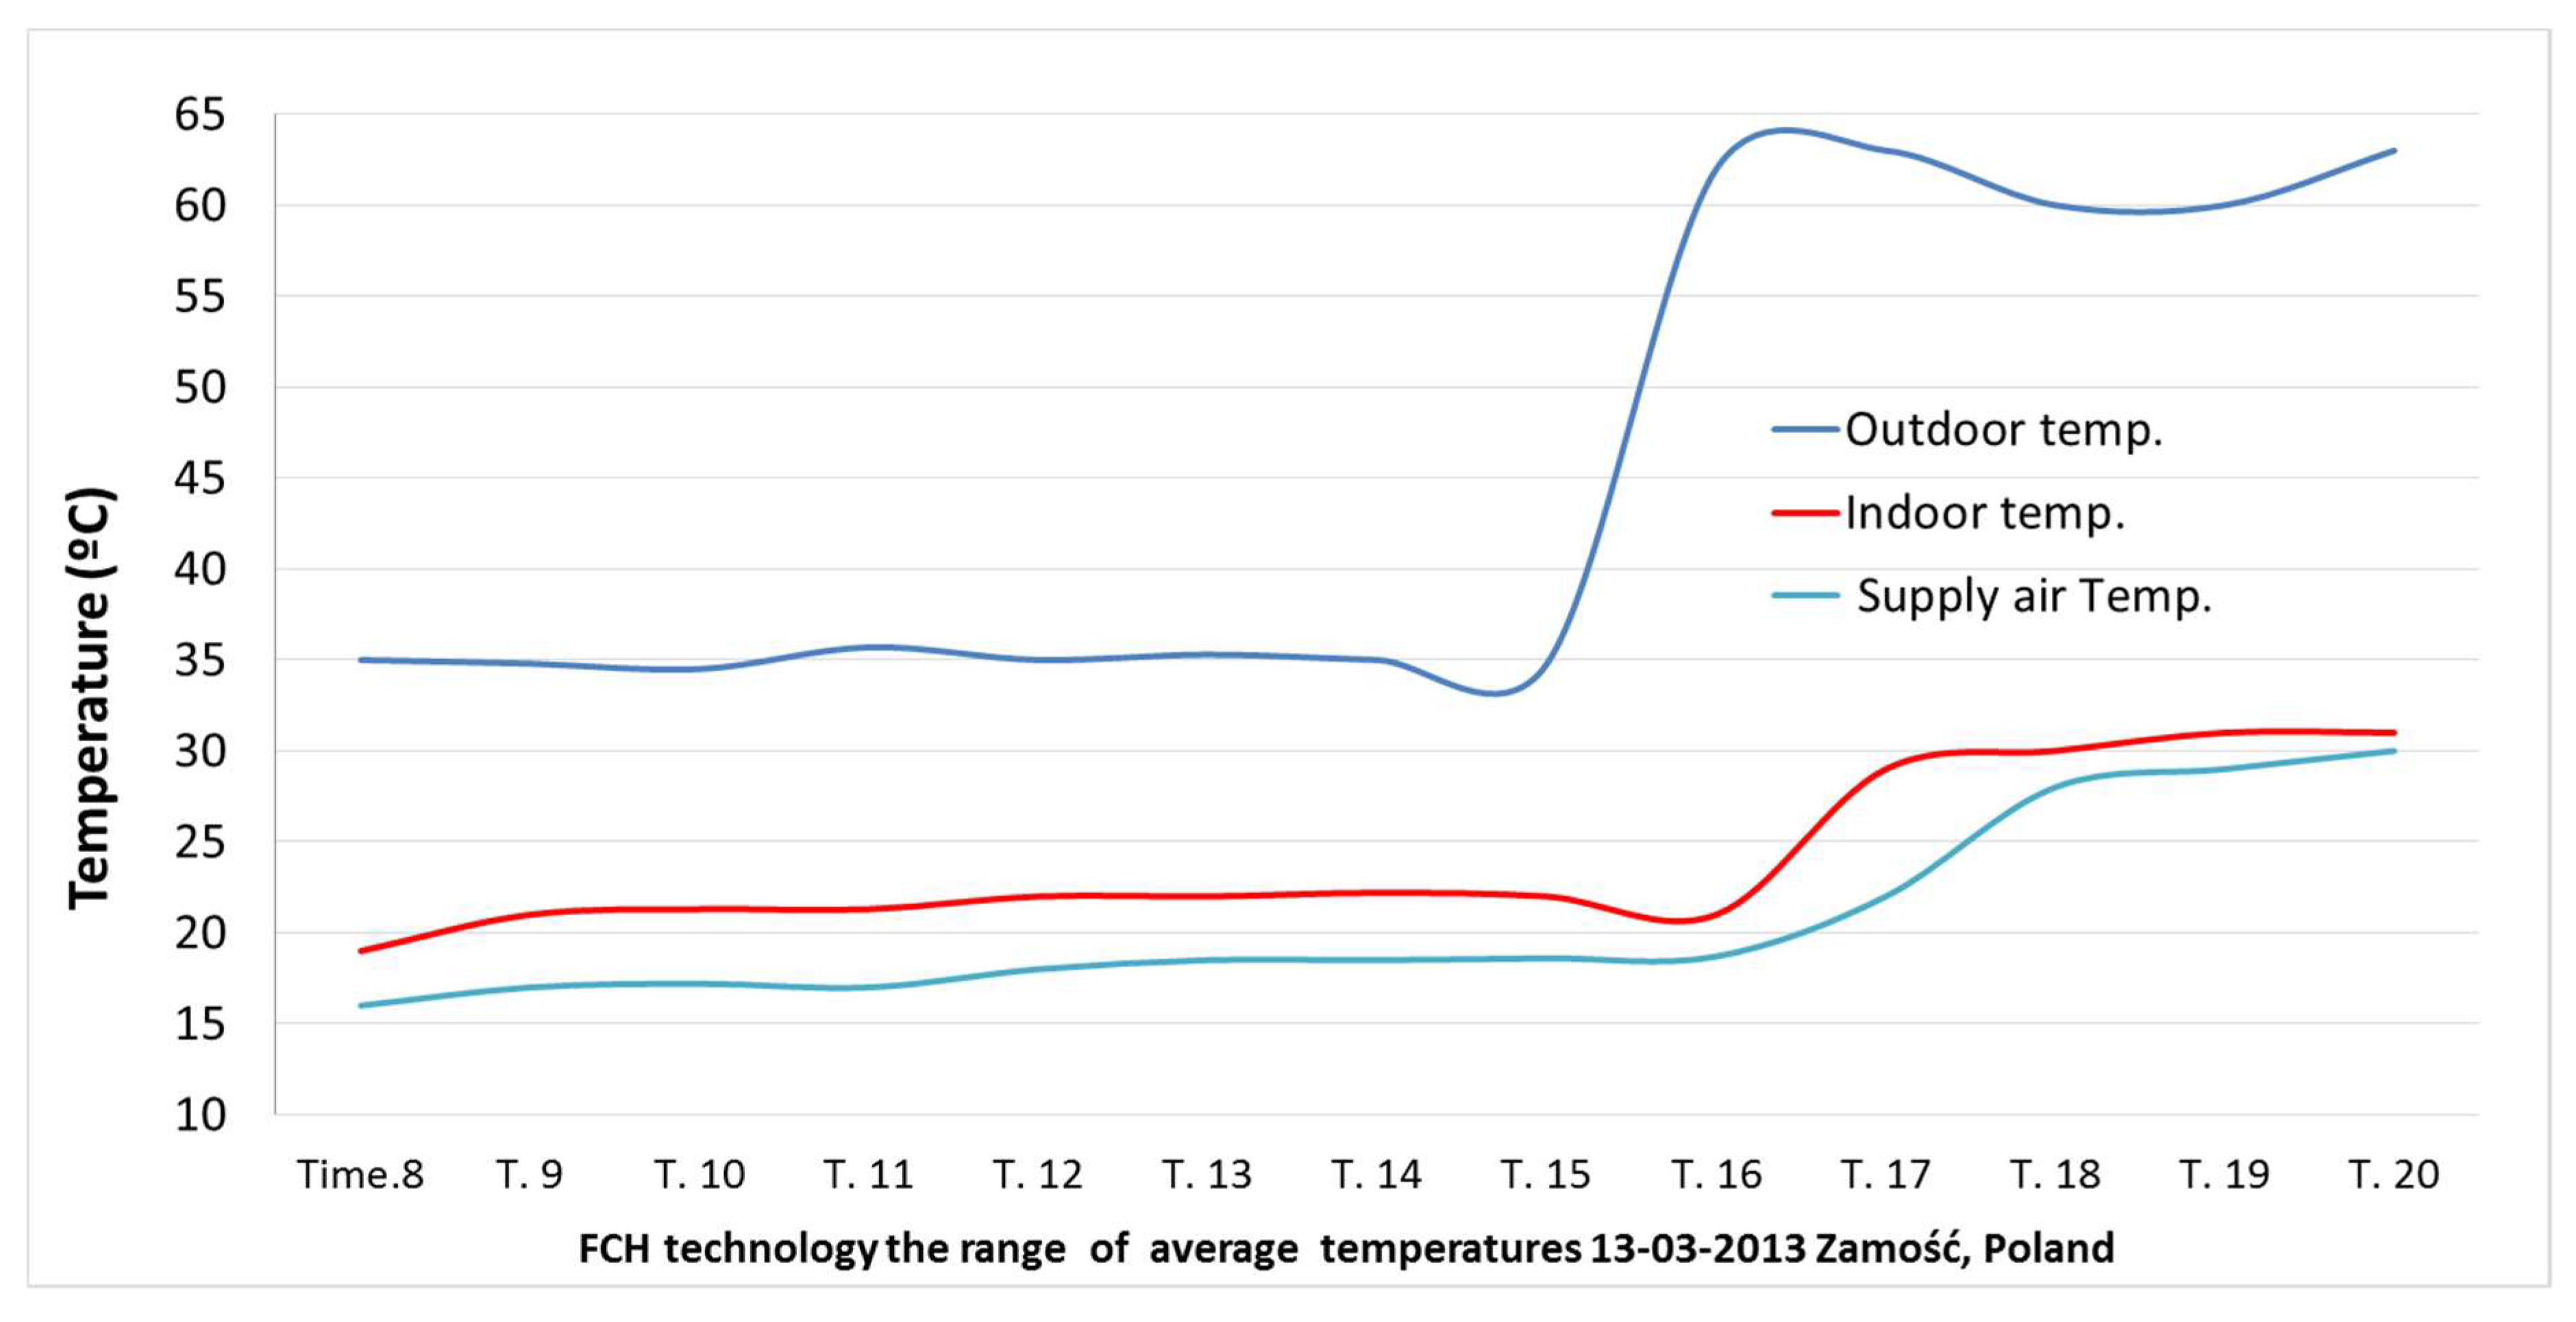
Figure 9 and Figure 10 present the results of tests of the FCH system in a Zamość shopping center, 15,000 m2; the tests were performed on 13 March 2013 at basic parameters, without CFC support, only FCH from groundwater at Tz = 36 °C, Tn = 18.0 °C and Tz = 60 °C Tn = 29.0 °C; the results correspond to the project assumptions, and Figure 10 provides additional information that the technological power at Tz = 60 °C may be multiple times higher than that for HVAC systems.
3.3. Application of Environmentally Friendly Low-Emission Technologies for Modernising the Existing Worn-Out Systems
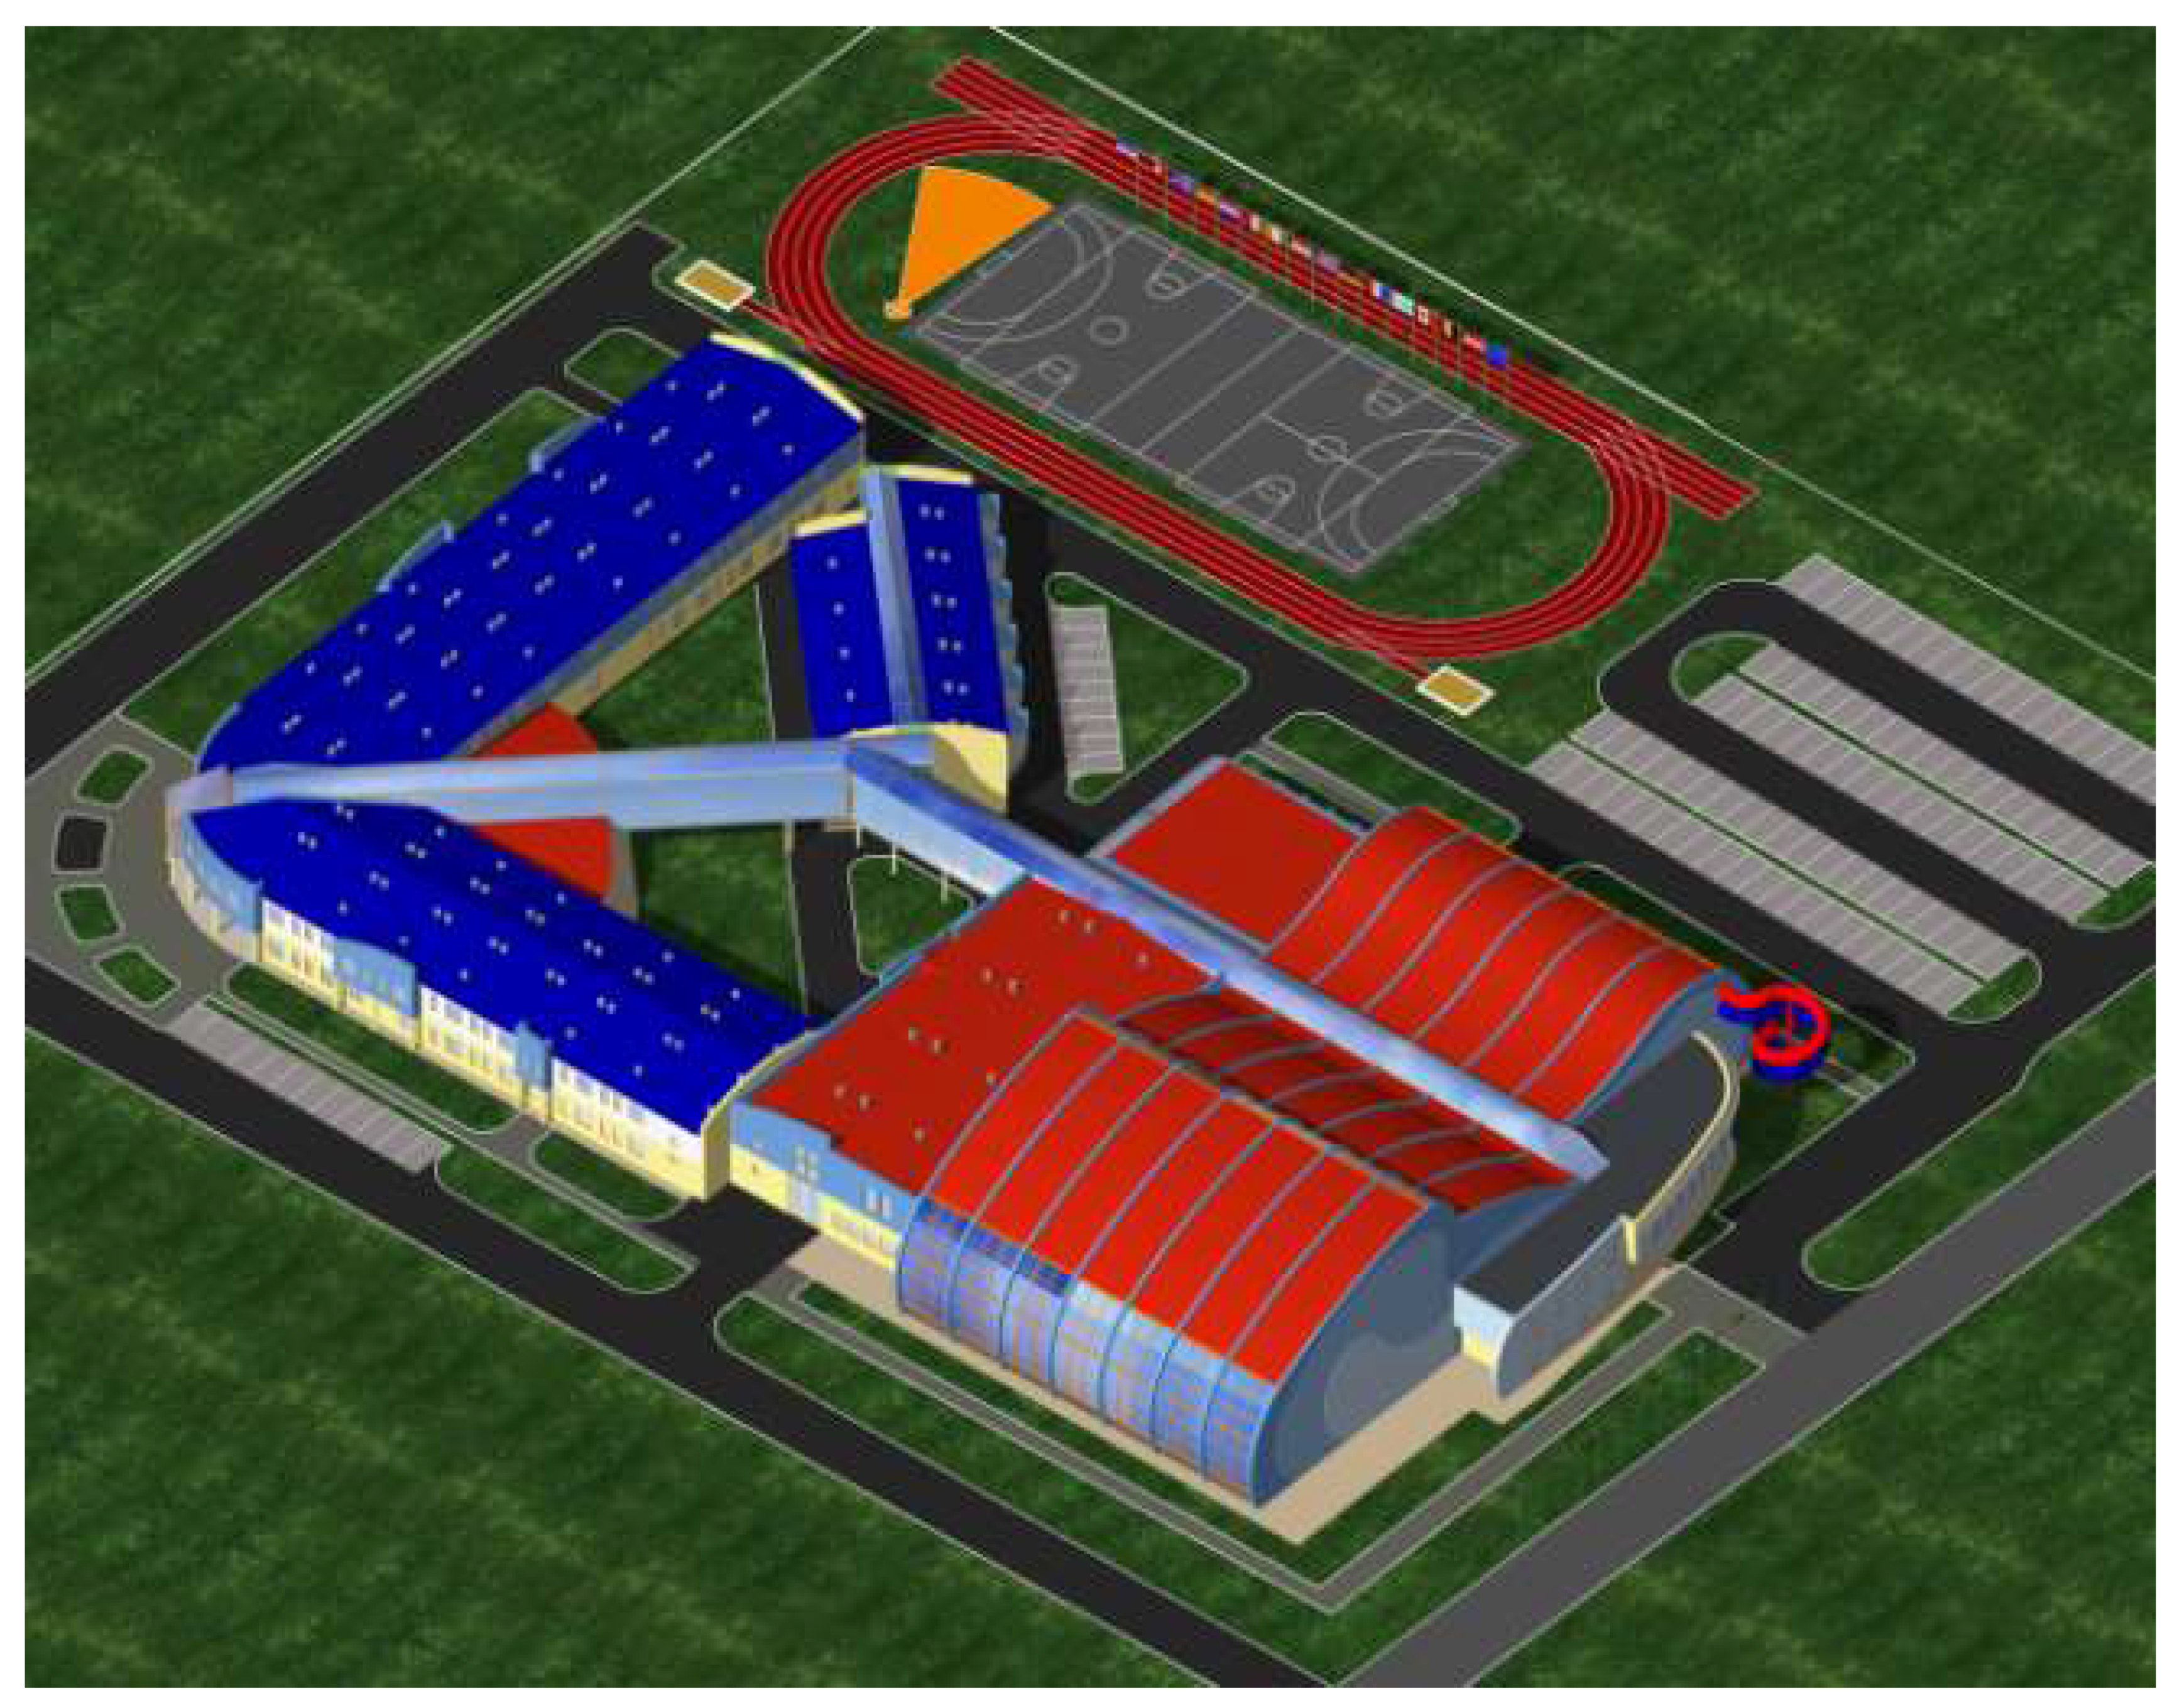
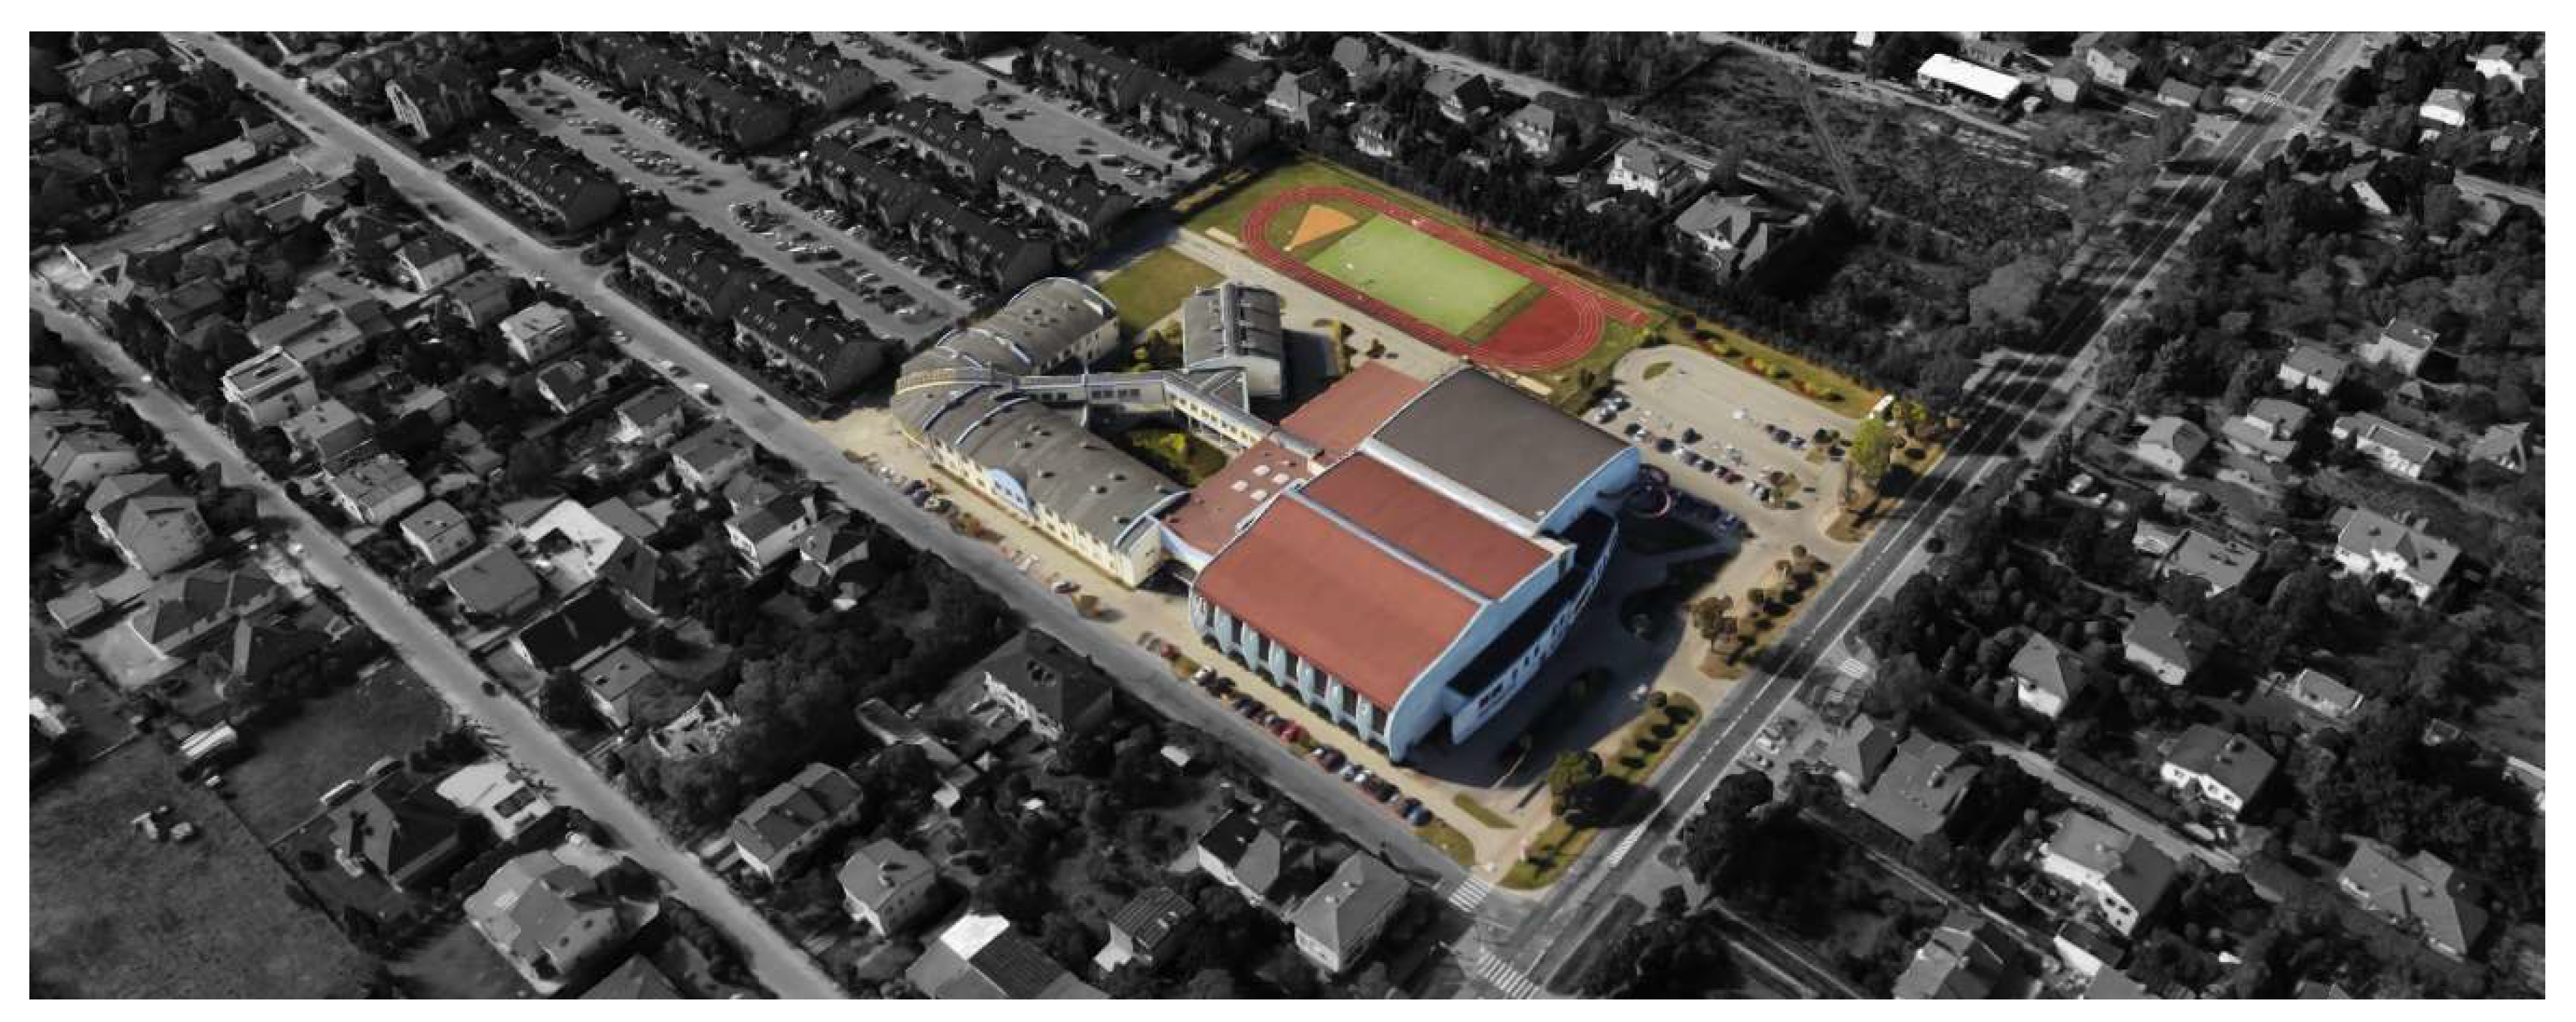
This paper presents the concept of green FCH systems to be introduced in the course of modernizing the existing systems which have been used for 20 years at the Integrated Didactic and Sports Center in Łomianki near Warsaw [29] (chief designer—Jan Wrana) (Figure 11 and Figure 12).
The land plot designated for an investment project is located at the intersection of the main street of Łomianki, Warszawska Street, with Staszica Street adjoining the said plot. The area designated for the project was not developed. The layout of the land along the diameter of the land plot demonstrated a difference in ordinates not exceeding 1.0 m (flat terrain). The plot’s orientation, land form and service infrastructure of the adjoining streets all had an impact on the suggested functional and spatial layout. The 3D view of the complex is shown in Figure 12.
In line with the project implementation stages, the project team proposed a layout of the center which ensured the handover for use of completed buildings (with complete systems, finished and furnished). The “backbone” of the center’s layout is a glassed-in corridor connecting all the buildings and allowing their combination using any function under a single roof. The center was designed with separated educational and sports and leisure functions. The center has separate entrances (a) for the full program of use by young people with an entrance to the educational section—a middle school and a secondary school with a lunchroom and dormitory for young people living far from the center (entrance located deep within the plot, on the side of Staszica Street, with interior access to the sports section)—and (b) publicly available section for all residents (sports: a multifunctional sports and entertainment hall for 1200 spectators and an indoor swimming pool with a jacuzzi complex (both buildings covered by a structure made of beams of glued timber (from the level of the swimming pool roof, a water tube slide with an outlet basin at the first-floor level, i.e., a 25 × 12.5 m swimming basin with stands for 500 spectators and an auditorium featuring a professional stage and seats for 500 people).
The program was implemented in three stages: (a) land area, 23,738.00 m2, (b) footprint area, 8827.50 m2, (c) usable floor area, 16,205.21 m2.
- Stage I
- Middle school and lunchroom building for 650 children.
- Technological building (for the center).
- Stage II
- Indoor sports and leisure swimming pool with stands for 500 spectators and a basin of 25 × 12.5 m, 1.2–1.8 m deep, with a wading pool and additional attractions, such as slides, geysers, water umbrellas, jacuzzi and saunas.
- Multifunctional sports and entertainment hall with a playing field for team games, measuring 40.0 × 20 m, and stands for 1200 spectators.
- Auditorium with a professional stage and folding/telescopic stands for 550 people.
- Dormitory for 40 beds.
- Stage III
- Leisure and sports areas: athletics stadium with 200 m tartan running tracks, jumping and throwing areas, training fields (ice rink in winter).
- Public car park with 140 spaces.
The Center is an attractive venue for educating children and young people from the first years of primary school until the end of secondary school leading up to university studies. An attractive education center with its own sports and leisure facilities is currently awaiting the extension of its educational area and the modernization and replacement of the existing worn-out installation equipment with green low-emission systems and technologies.
Integrated Center of Sports and Recreation in Łomianki near Warsaw: area, 23,738.00 m2: middle school/currently primary school and secondary school building, 6736.06 m2; corridor and lunchroom, 1318.22 m2; hotel/dormitory, 1120.17 m2; auditorium, 1074.20 m2; sports hall area, 3196.00 m2; indoor swimming pool, 2760.56 m2; school stadium and car park, 7860.54 m2.
The concept involves the construction of the following:
For the middle school and secondary school with a usable floor area of 5725.65 m2 and an assumed V of 45,000 m3/h, four FCH air handling units, each 12,000 m3/h on average, with a demand for heat and cooling from the FCH system of 400 kW. Energy will be sourced from 48 boreholes and FCH units up to 30 m. Location of boreholes—green zones near the connecting passage.
For the technological center, hotel, auditorium with a usable floor area of 2985.70 m2 and an assumed V of 20,000 m3/h—two FCH air handling units, each 10,000 m3/h on average, with a demand for heat and cooling from the FCH system of 200 kW. Energy will be sourced from 24 boreholes and FCH units up to 30 m. Location of boreholes—green zones.
For the sports hall with a usable floor area of 2716.60 m2 and an assumed V of 20,000 m3/h—two FCH air handling units, each 10,000 m3/h on average, with a demand for heat and cooling from the FCH system of 200 kW. Energy will be sourced from 24 boreholes and FCH units up to 30 m. Location of boreholes—green zones.
For the swimming pool with a usable floor area of 2346.48 m2 and an assumed V of 25,000 m3/h—two FCH air handling units, each 13,000 m3/h on average, with a demand for heat and cooling from the FCH system of 200 kW. Energy will be sourced from 35 boreholes and FCH units up to 30 m. Location of boreholes—green zones.
Total usable floor area—16,000.00 m2, amount of ventilation air (V)—110,000.00 m3/h, FCH system power—1000 kW, number of boreholes up to 30 m depth—131. Assumed energy consumption reduction in relation to HVAC—up to 50%, reduced heat energy consumption—up to 60%, maintaining the operating costs of EUR 4–5/m2/year at 2021 prices, with current costs at EUR 22/m2/year. According to Figure 8, the difference in operating costs will be over 400%. The expected CO2 emissions reduction will reach a similar level, and the stores of energy accumulated under the buildings will cover 70% of energy needs. At the stage of implementing modernization work on the facility, it is advisable to consider additionally equipping the whole project with photovoltaic cells, which will further reduce operating costs, along with CO2 emissions cuts.
4. Conclusions
By presenting hidden energy stores and the green FCH technology based on energy sourced from groundwater, the authors provide a new way of handling CO2 emissions, reducing capital expenditures, operating costs and the carbon footprint. This method will allow us to achieve real CO2 utilization with minimum PE consumption. The stores of the presented energy, which is accumulated in groundwater, are not harmful to the ozone layer and naturally reduce CO2 emissions without any additional carbon footprint and provide a new solution, which will allow us to cut emissions by 10–15%. Naturally, we should be aware that the conversion of heating systems based on coal to climate-neutral systems requires not only financial investment and radical changes in thinking about our natural environment, but also involvement of all institutions and organizations, mainly those dealing with environmental protection, scientists, local governments, industry and other HVAC system users.
It is worth looking at the charts presented in Figure 8 and Figure 9 presenting the work parameters under extreme conditions (Tz—36 °C and 60 °C); this is very interesting in the context of any building, including industrial buildings, where delta T is over 30 °C. In addition to the results described above, the authors of this article presented the results of installations from all over Poland (Figure 7), from Gdansk through Olsztyn, from Warsaw to Mielec and Sosnowiec, which confirm the significant potential of energy storage as well as very low operating costs (Figure 8). The electricity consumption of such solutions increases, but only by 20% at the parameters presented (Figure 8), which can now be replaced by photovoltaic installations, avoiding costly investments and networks and reducing distribution losses. A total of seven locations with a total area of more than 90,000 m2 were surveyed, providing about 7 MV of FCH green energy to HVAC installations from drilled wells with an installation length of more than 100 km in the completed PPT. The study confirms the real possibility of reducing investment costs and carbon consumption in areas covered by the FCH technology by up to 30%, and this result is also a reduction in CO2 in these installations by more than 70%.
The presented solutions and results, paired with the current CO2 emissions situation, open extensive avenues for research and are an invitation by the authors to other scientists and universities in Poland and around the world. The potential of this energy, as already demonstrated in another paper, is so enormous that every research team and university will have enough material to work on, regardless of geographical location. The presented professional results of research, as well as the actual energy consumption reduction demonstrated, display prime examples of environmentally friendly solutions and confirm the huge potential of groundwater stores, which will allow us to effectively utilize CO2 emissions in any country.
Author Contributions
Conceptualization, J.W.; Data curation, W.S.; Formal analysis, P.G.; Funding acquisition, J.W. and W.S.; Investigation, W.S. and P.G.; Methodology, W.S. and P.G.; Project administration, J.W.; Resources, J.W. and W.S.; Supervision, J.W. and P.G.; Writing—original draft preparation, J.W., W.S. and P.G.; Writing—review and editing, W.S. All authors have read and agreed to the published version of the manuscript.
Funding
This research received no external funding.
Institutional Review Board Statement
Not applicable.
Informed Consent Statement
Not applicable.
Data Availability Statement
Not applicable.
Conflicts of Interest
The authors declare no conflict of interest.
References
- Bundschuh, J.; Kaczmarczyk, M.; Ghaffour, N.; Tomaszewska, B. State-of-the-Art of Renewable Energy Sources Used in Water Desalination: Present and Future Prospects. Desalination 2021, 508, 115035. [Google Scholar] [CrossRef]
- Ciesielska-Maciągowska, D.; Klimczak, D.; Skrzek-Lubasińska, M. Central and Eastern European CO2 Market—Challenges of Emissions Trading for Energy Companies. Energies 2021, 14, 1051. [Google Scholar] [CrossRef]
- Mandaroux, R.; Dong, C.; Li, G. A European Emissions Trading System Powered by Distributed Ledger Technology: An Evaluation Framework. Sustainability 2021, 13, 2106. [Google Scholar] [CrossRef]
- Olkiewicz, M.; Olkiewicz, A.; Wolniak, R.; Wyszomirski, A. Effects of Pro-Ecological Investments on an Example of the Heating Industry—Case Study. Energies 2021, 14, 5959. [Google Scholar] [CrossRef]
- Redukcja Emisji Gazów Cieplarnianych: Cele i Działania UE|Aktualności|Parlament Europejski. Available online: https://www.europarl.europa.eu/news/pl/headlines/society/20180305STO99003/redukcja-emisji-gazow-cieplarnianych-cele-i-dzialania-ue (accessed on 19 May 2022).
- PBL Trends in Global CO2 and Total Greenhouse Gas Emissions: 2017 Report. Available online: https://www.pbl.nl/en/publications/trends-in-global-co2-and-total-greenhouse-gas-emissions-2017-report (accessed on 19 May 2022).
- Bothner, F. Personal Carbon Trading—Lost in the Policy Primeval Soup? Sustainability 2021, 13, 4592. [Google Scholar] [CrossRef]
- Thisted, E.V.; Thisted, R.V. The Diffusion of Carbon Taxes and Emission Trading Schemes: The Emerging Norm of Carbon Pricing. Environ. Politics 2020, 29, 804–824. [Google Scholar] [CrossRef]
- Cramton, P.; Kerr, S. Tradeable Carbon Permit Auctions: How and Why to Auction Not Grandfather. Energy Policy 2002, 30, 333–345. [Google Scholar] [CrossRef]
- Parker, L. Carbon Tax and Greenhouse Gas Control: Options and Considerations for Congress; Congressional Research Service: Washington, DC, USA, 2009. [Google Scholar]
- Valančius, K.; Grinevičiūtė, M.; Streckienė, G. Heating and Cooling Primary Energy Demand and CO2 Emissions: Lithuanian A+ Buildings and/in Different European Locations. Buildings 2022, 12, 570. [Google Scholar] [CrossRef]
- Zhang, Y.; Wei, Z.; Zhang, M. Free Cooling Technologies for Data Centers: Energy Saving Mechanism and Applications. Energy Procedia 2017, 143, 410–415. [Google Scholar] [CrossRef]
- Gajewski, A.; Gładyszewska-Fiedoruk, K.; Krawczyk, D.A. Carbon Dioxide Emissions during Air, Ground, or Groundwater Heat Pump Performance in Białystok. Sustainability 2019, 11, 5087. [Google Scholar] [CrossRef] [Green Version]
- Roy, S.; Lam, Y.F.; Hossain, M.U.; Chan, J.C.L. Comprehensive Evaluation of Electricity Generation and Emission Reduction Potential in the Power Sector Using Renewable Alternatives in Vietnam. Renew. Sustain. Energy Rev. 2022, 157, 112009. [Google Scholar] [CrossRef]
- Available online: https://wysokienapiecie.pl/ (accessed on 19 May 2022).
- PBL Trends in Global CO2 and Total Greenhouse Gas Emissions: 2020 Report. Available online: https://www.pbl.nl/en/publications/trends-in-global-co2-and-total-greenhouse-gas-emissions-2020-report (accessed on 21 June 2022).
- Kumar, M. Social, Economic, and Environmental Impacts of Renewable Energy Resources; IntechOpen: London, UK, 2020; ISBN 978-1-78984-591-4. [Google Scholar]
- Wrana, J.; Struzik, W. Study Results and Obtaining High Ventilation Air Quality in Architecture for an Old Shopping Centre Public Utility Building with Modernized EL. Heating in Warsaw, District, Poland. IOP Conf. Ser. Mater. Sci. Eng. 2021, 1203, 032140. [Google Scholar] [CrossRef]
- Wrana, J.; Struzik, W. Study Results and Achieving High Ventilation Air Quality in Architecture for a Public Utility Building—Shopping Centre in Mielec, Poland. IOP Conf. Ser. Mater. Sci. Eng. 2021, 1203, 032139. [Google Scholar] [CrossRef]
- Wrana, J.; Struzik, W. Research Aimed at Obtaining High Quality of Air in Architecture. Example—“WICA” Eastern Innovation Center of Architecture. piF 2019, 2019, 121–138. [Google Scholar] [CrossRef]
- Wrana, J.; Wojciech, S. Research Aimed at Obtaining High Quality of Air in Architecture and Urban Planning. Example—The Potocki Palace and Park Complex in Radzyń Podlaski—Restoration. piF 2019, 2019, 341–358. [Google Scholar] [CrossRef]
- Wrana, J. Value of the Architecture in the Nodal Place of the City. Palace in Radzyń Podlaski as an Integrating Monument. Bud. I Archit. 2018, 17, 039–050. [Google Scholar] [CrossRef]
- Struzik, W. PAT—P.398322. Available online: https://ewyszukiwarka.pue.uprp.gov.pl/search/pwp-details/P.398322?lng=pl (accessed on 23 May 2022).
- Struzik, W. PAT—P.415163. Available online: https://ewyszukiwarka.pue.uprp.gov.pl/search/pwp-details/P.415163?lng=pl (accessed on 23 May 2022).
- Struzik, W. PAT—P.414730. Available online: https://ewyszukiwarka.pue.uprp.gov.pl/search/pwp-details/P.414730?lng=pl (accessed on 23 May 2022).
- Struzik, W. PAT—P.406309. Available online: https://ewyszukiwarka.pue.uprp.gov.pl/search/pwp-details/P.406309?lng=pl (accessed on 23 May 2022).
- Struzik, W. PE—EP16460076. Available online: https://ewyszukiwarka.pue.uprp.gov.pl/search/pwp-details/EP16460076?lng=pl (accessed on 23 May 2022).
- Buffa, S.; Cozzini, M.; D’Antoni, M.; Baratieri, M.; Fedrizzi, R. 5th Generation District Heating and Cooling Systems: A Review of Existing Cases in Europe. Renew. Sustain. Energy Rev. 2019, 104, 504–522. [Google Scholar] [CrossRef]
- Integration Didactic and Sports Centre. Available online: https://www.lomianki.pl/pl/dla-mieszkancow/sport-i-rekreacja/icds/7244,Integracyjne-Centrum-Dydaktyczno-Sportowe.html (accessed on 24 May 2022).
- Google Maps. Available online: https://www.google.com/maps/place/Integracyjne+Centrum+Dydaktyczno+-+Sportowe/@52.3444503,20.8783308,220a,35y,258.06h,48.37t/data=!3m1!1e3!4m5!3m4!1s0x471eb636d224b403:0x65550f603188cba4!8m2!3d52.3444361!4d20.875054 (accessed on 24 May 2022).
Figure 1.
Energy consumption (TWh) in buildings located in the EU for cooling purposes (1990–2020) [15].
Figure 1.
Energy consumption (TWh) in buildings located in the EU for cooling purposes (1990–2020) [15].

Figure 2.
A view of the FCH HVAC technology in the area below the ground level, in which the energy obtained from groundwater is transferred to the FCH system.
Figure 2.
A view of the FCH HVAC technology in the area below the ground level, in which the energy obtained from groundwater is transferred to the FCH system.

Figure 3.
Groundwater temperatures chart at a depth of about 10 m.

Figure 4.
Results of air handling unit operation over 3 days of 2018, FCH HVAC BMS, presenting the scale of recovery (shown in green) of groundwater energy in a period of low temperatures. Color blue—outdoore temperature, color green—temperature from the heaters, color red—indoore temperature.
Figure 4.
Results of air handling unit operation over 3 days of 2018, FCH HVAC BMS, presenting the scale of recovery (shown in green) of groundwater energy in a period of low temperatures. Color blue—outdoore temperature, color green—temperature from the heaters, color red—indoore temperature.

Figure 5.
Example of indoor parameters: summer 8–10 August 2018; indoor temperature, +23.0 °C (line yellow); outdoor temperature, 37.0 °C (line blue). Yellow line indicates high stability of indoor temperature.
Figure 5.
Example of indoor parameters: summer 8–10 August 2018; indoor temperature, +23.0 °C (line yellow); outdoor temperature, 37.0 °C (line blue). Yellow line indicates high stability of indoor temperature.

Figure 6.
Example of indoor parameters: winter–summer, 1 July 2018 to 1 July 2019; indoor temperature, +18.5 °C; outdoor temperature, −16.0 °C. Line blue—outdoore temperature, green—supply temperature on the heaters, red—supply temperature after the heat exchangers, yellow—supply air temperature, white—indoore temperature.

Figure 7.
Example of outdoor and indoor parameters: summer, 25 July 2016–31 July 2016. Outdoor and indoor temperature of the buildings equipped with the FCH technology in Poland in such cities as Gdańsk–Morena, Olsztyn, Warsaw/Targówek and Sosnowiec.
Figure 7.
Example of outdoor and indoor parameters: summer, 25 July 2016–31 July 2016. Outdoor and indoor temperature of the buildings equipped with the FCH technology in Poland in such cities as Gdańsk–Morena, Olsztyn, Warsaw/Targówek and Sosnowiec.

Figure 8.
Final energy (FE) consumption result in the period from December 2016 to July 2018 (system exploitation cost, €/m2/year). A comparison of a system based on district heating and an alternative system based on electrical energy.
Figure 8.
Final energy (FE) consumption result in the period from December 2016 to July 2018 (system exploitation cost, €/m2/year). A comparison of a system based on district heating and an alternative system based on electrical energy.

Figure 9.
Temperature chart at outdoor temperature Tz = 36 °C, FCH technology, the range of average temperatures (13 March 2013), Zamość, Poland.
Figure 9.
Temperature chart at outdoor temperature Tz = 36 °C, FCH technology, the range of average temperatures (13 March 2013), Zamość, Poland.

Figure 10.
Temperature chart at outdoor temperature Tz = 60 °C, FCH technology, the range of average temperatures (13 March 2013), Zamość, Poland.
Figure 10.
Temperature chart at outdoor temperature Tz = 60 °C, FCH technology, the range of average temperatures (13 March 2013), Zamość, Poland.

Figure 11.
A view of the Integrated Didactic and Sports Center in Łomianki near Warsaw.

Figure 12.
Three-dimensional view of the Integrated Didactic and Sports Center in Łomianki based on google.maps [30].
Figure 12.
Three-dimensional view of the Integrated Didactic and Sports Center in Łomianki based on google.maps [30].


Table 1.
Indoor air calculation parameters.
| Indoor Area Temperatures | Summer (°C) | Winter (°C) | Humidity (%) |
|---|---|---|---|
| Air-conditioned areas | 26 °C ± 2 °C | 20 °C ± 2 °C | Resulting value |
| Arcade areas, eating area | 26 °C ± 2 °C | 20 °C ± 2 °C | Resulting value |
| Staff room | Resulting value | 20 °C ± 2 °C | Resulting value |
| Toilets | Resulting value | 20 °C ± 2 °C | Resulting value |
| Changing rooms | Resulting value | 20 °C ± 2 °C | Resulting value |
| Technical premises | As per the guidelines | As per the guidelines | Resulting value |
Publisher’s Note: MDPI stays neutral with regard to jurisdictional claims in published maps and institutional affiliations. |
© 2022 by the authors. Licensee MDPI, Basel, Switzerland. This article is an open access article distributed under the terms and conditions of the Creative Commons Attribution (CC BY) license (https://creativecommons.org/licenses/by/4.0/).
Share and Cite
MDPI and ACS Style
Wrana, J.; Struzik, W.; Gleń, P. Natural Energy Stored in Groundwater Deposits as a New Way of Obtaining Green Energy for Urban Planners, Architects and Environmentalists. Energies 2022, 15, 4716. https://doi.org/10.3390/en15134716
AMA Style
Wrana J, Struzik W, Gleń P. Natural Energy Stored in Groundwater Deposits as a New Way of Obtaining Green Energy for Urban Planners, Architects and Environmentalists. Energies. 2022; 15(13):4716. https://doi.org/10.3390/en15134716
Chicago/Turabian StyleWrana, Jan, Wojciech Struzik, and Piotr Gleń. 2022. "Natural Energy Stored in Groundwater Deposits as a New Way of Obtaining Green Energy for Urban Planners, Architects and Environmentalists" Energies 15, no. 13: 4716. https://doi.org/10.3390/en15134716
Note that from the first issue of 2016, this journal uses article numbers instead of page numbers. See further details here.