
Power Quality and Electromagnetic Compatibility Aspects at Personal Computers

1
Faculty of Automation, Computer Science and Electronics, University of Craiova (UCV), 200440 Craiova, Romania
2
Faculty of Electrical Engineering, University of Craiova (UCV), 200440 Craiova, Romania
*
Author to whom correspondence should be addressed.
Energies 2022, 15(13), 4661; https://doi.org/10.3390/en15134661
Submission received: 27 May 2022
/
Revised: 19 June 2022
/
Accepted: 22 June 2022
/
Published: 25 June 2022
(This article belongs to the Special Issue New Frontiers in Electrical Power Systems Quality)
Abstract
:In this article, issues related to electromagnetic compatibility and energy/power quality for a laptop are addressed. Power quality problems are outlined. Testing frameworks (developed by authors) are presented and discussed for a laptop when two different sampling frequencies are used: 80 kHz and 19.2 kHz. Waveforms corresponding to the voltage across the laptop’s terminals and current absorbed by it were acquired. Recordings and numerical processing, based on original software using Fast Fourier Transform, are discussed, and the analysis of waveforms in both cases is performed. Various power quality indices were calculated. Theoretical and practical aspects related to the determination of power quantities, power flows, and power factor are presented. Some conclusions concerning different ranges of frequencies are presented, along with some considerations for power quality problems. Tests for conducted emissions (single phase and neutral wire respectively) and for the radiated emissions (for horizontal and vertical polarizations) are presented. Comparisons to the emission standards were made. The immunity behavior for a laptop is discussed according to immunity standards. It is shown that new measures (e.g., active filters) are necessary for network protection when connecting a laptop to the network. Some considerations, based on the authors’ observations concerning new standards for power quality and electromagnetic compatibility, are outlined.
1. Introduction
Often the designers and manufacturers of electrical equipment do not consider all the problems related to practical utilization. When certain constraints due to limitations arising in engineering standards, developed by IEC or other entities (CISPR, EN, IEEE), are not respected, issues can appear during the operation of the equipment (or of other equipment from its vicinity). The power grid supplying the equipment might be affected as well.
Although some standards (e.g., IEC standards) consider that some electromagnetic (EM) quantities should not exceed certain limits as a condition for a reliable operation of different types of equipment, the mismatch between some of these standards can create technical problems, either concerning the equipment or the supply network. Checking the compliance with the standards for the whole frequency range in the engineering practice should be a major concern for all designers and manufacturers of electric equipment. The users of electric equipment should be aware when certain standard limits are exceeded and consider carefully the negative consequences over the power grid or person using it.
Usually verification from the Electromagnetic Compatibility (EMC) perspective needs to be made simultaneously with verification from the power quality (PQ) perspective. The frequency ranges covered by the existing EMC Standards are (150 kHz–30 MHz) for conducted emissions, respectively (30 MHz–1 GHz), for the radiated emissions. The upper limits are established depending on the type of equipment or its classification.
The literature proposes many multifunction instruments in order to deal with different PQ disturbances [1]. However, the traditional way to perform the remote PQ monitoring is to rely on the terminal instruments with high processing power [1,2]. Many papers deal with modalities to classify the standardization techniques related to PQ by using various techniques based on different transformations (Fourier, Hilbert, Wavelet etc.) [3,4,5,6,7]. The determination of quantities for non-sinusoidal regimes starting from the determination of harmonics and/or inter-harmonics has been the subject of significant debates in the technical specialty literature and offered in a partial or total manner solutions for their identification [8,9]. Some of these solutions consider the direct measurement of (inter)harmonics. To estimate the dynamic characteristics of harmonics and inter-harmonics, a two-stage solution mechanism based on the adaptive linear neural network is developed [1,10]. The decomposition algorithms are mainly based on the Discrete Fourier Transform (DFT) or Fast Fourier Transform (FFT) [1,9]. Decomposition algorithms considering high order harmonics (corresponding to frequencies up to 50 kHz) were conceived and studies on errors related to them were made. These frequencies (higher than 2 kHz in EN 50160 standard or 3 kHz in IEEE 519-2014 Standard) do not represent interest for PQ problems yet.
The verification from the PQ perspective refers to the limits of some parameters (“quality indices”) to be obeyed for the (0–2) kHz range (the European norms from the EN 50160 Standard [11]) or respectively for the range (0–3) kHz (norms from the IEEE Standards 519-2014 [12]). Most of the times, for these situations, only the upper limits of the total harmonic distortion of the currents (THDI) are considered [13]. No limits are mentioned with respect to powers or to power flows, which should be correlated to power factors.
However, the current quality standards do not take into account the range (2(3) kHz–9 kHz). It is approached only partially by IEC 61000-4-7, Standard, Revision 2.1, October 2009. The range (2(3)–150) kHz is in the same situation. The lack of specific standards for these ranges can be explained by (a) the reduced possibility to perform accurate measuring for them; and (b) not enough accurate results yielded by the harmonic decompositions using the actual transforms, in order to diminish the number of superior harmonics.
The fulfillment of the conditions concerning the EMC Standards is not always accompanied by a fulfillment of conditions from the PQ Standards. Checking the conformity with the standards (e.g., IEC Standards) is required most of the time. For the EMC Standards, conditions must be obeyed both for emissions and respectively for EM susceptibility. Usually compliance verifications, both for conducted emissions and radiated emissions, are also required [14]. Each electrical or electronic component must be checked for equipment incorporating electrical and electronic components (e.g., personal computers or portable computers (laptops)). In the end, a test of the whole equipment must be done. If the final tests are passed, there is no need for checking each component separately. In order to ensure a safe operation of the analyzed equipment, it is necessary to extend the frequency range up to 150 kHz, and to check for the conformity with the recently issued PQ/EMC Standards. (There are no standards yet for the range (2 (3)–150) kHz, and there is no mention relative to the limit between issues related to power/PQ and EMC in terms of frequency [15].)
2. Some Considerations Concerning Power Quality
In order to be able to validate the Equipment Under Test (EUT), represented by a portable computer, its behavior related to the power grid was analyzed. The EUT was in this case a portable computer—Laptop, Quad Core, with each processor operating at a frequency around 2.53 GHz.
At a first glance, one may be tempted to neglect the influence of a single laptop over the supplying network. But as long as it can send damaging energy through the mains and similar phenomena can occur jointly, special protective measures should be considered [16]. Today, as this sort of equipment is widely used, unless measures to reduce the non-sinusoidal regimes induced by them are taken, the local or medium voltage networks might be affected.
In general, the personal computers (PCs) use Switched Mode Power Supplies (SMPS) [17]. The main advantages of SMPS are: (a) reduced size and weight; (b) efficient operation by means of proper regularization and control of the d.c. required by the load; (c) elimination of the step-down voltage transformer toward the power supply in order to control the supplying voltage. The SMPS may tolerate variations of the voltage supply from the supplying network.
The main drawback of SMPS consists in the significant distortion of the current absorbed from the supplying network. Efforts were made recently in order to improve the PCs supply [17,18]. Some studies were focused on the correction of power factor for cases like this [19].
Induced non-sinusoidal regimes can result in injection of current harmonics into the supplying network. Reversed power flows (from the tested equipment toward network), associated to high order harmonics, might be noticed. The overall operation of the entire power grid can be jeopardized [18].
In this context, it became important to monitor a laptop when supplied from a power grid [16]. The analysis was made during its “idle running” operation, as well as when it was running different programs, by using commercial or original software programs.
During the beginning of the use of personal computers and laptops, as there was a small number of such equipment, no special attention was paid to protective measures of the networks used to supply them. With the widespread use of these types of equipment, new technical problems were noticed, due to the multiplication effect of a number of new, unpleasant phenomena, such as the appearance of more severe non-sinusoidal regimes in networks. Today, most of us use such equipment, usually with an INTERNET connection. In schools or universities, pupils and students tend to simultaneously run programs on a significant number of machines (sometimes thousands), and this results in many new technical issues related to the need for new supplying networks or to the quality of electric power [16].
Data used by the analysis focused on power quality problems were acquired by dedicated data acquisition systems (DAS—Figure 1). They represented input data to original dedicated software, relying on Fast Fourier Transform (FFT). Harmonic decompositions considering a maximum harmonic order of 80 were made, yielding currents, voltages, and powers spectra [20].
The MATLAB function fft() could not be used in its genuine form, because for frequencies higher than 2 kHz it yielded unacceptable errors. For this reason, preliminary tests on artificial signals were made to get the optimum number of computation points, obtained through spline interpolations, which is correlated with the data acquisition system sampling frequency. Then, symmetrization of half-periods belonging to the same decomposed periods had to be performed, because the application of Fast Fourier Transform relies on this condition and generates errors when it is not accomplished.
The authors consider for future work the decompositions relying on wavelet transforms. Such decompositions do not impose symmetry between half-periods and provide both time and frequency information.
The frequency range (2–150) kHz is not considered by the existing standards neither from the PQ, nor from the EMC points of view. The IEC 61000-4-7 Standard [21] specifies the instrumentation to be used for measuring spectral components in the frequency range up to 9 kHz, considering power supply systems with fundamental frequency of 50 Hz and 60 Hz. For practical considerations, this standard approaches in an individual manner the harmonics, inter-harmonics, and other harmonic components within the range (2–9) kHz [19].
Yet this standard does not mention any limits to be considered when analyzing the tests results.
Because we were interested in analyzing this range, we have extended the analyzed frequency range up to a sampling frequency of 80 kHz. This could be achieved only if data were acquired from a single channel by using a DAS, which was specifically designed and manufactured for the applications studied in this paper—Figure 1 [16,22]. The measurement set-up was designed to allow the testing of one or more connected laptops on the phases of a three-phase system (Figure 1a,b). The studied three-phase consumer is supplied with phase a.c. voltages of 220 V and line a.c. voltages of 380 V, by means of a down-step voltage transformer 220/110 V a.c. (Figure 1b) [22,23]. The transformers were designed and manufactured special for these applications in toroidal forms (they are linear transformers without ferromagnetic core and consequently without saturation). Consumers’ behavior during the supplying with (110–220) V a.c. presented interest for authors. Laptops fall into this category as long as their supplying voltages are within this range of values whilst accepting 2 operational frequencies (50/60 Hz) [22]. In this paper, only one phase of the three-phase system was used (Figure 1b).
The original DAS, along with its supplying sources, sensors for currents and connectors toward laptop(s) can be seen in Figure 1a [16].
Considering the recent achievements made by electronics and dedicated software for DASs, one can expect an availability of sampling frequencies of at least 300 kHz, corresponding to test frequencies of 150 kHz, and this is a value within the range of conducted emissions from the EMC point of view.
Below we will present conclusions drawn from the recording and numerical processing of test data. We considered two sampling frequencies and based our results on two different data acquisition systems, designed and used for the applications approached in this paper: 80 kHz and 19.2 kHz, respectively. By using these systems, the analyzed frequency ranges are extended over the upper limits of 2(3) kHz mentioned by the standards EN 50160 and IEEE 519-2014. The new limits are higher than those considered by the actual standards for PQ related applications. In the light of the Nyquist criterion, the upper limit of 80 kHz allows for a maximum harmonic order available for the Fourier decomposition equal to 800 while the limit of 19.2 kHz allows for a maximum harmonic order equal to 192 (which is considered to be the lower limit by CISPR standard for electromagnetic interferences—EMI).
2.1. Recordings, Numerical Processing, and Analysis of Waveforms Acquired with a Sampling Frequency of 80 kHz
The available per-channel sampling frequency of 80 kHz used to acquire electric signals (voltages, currents) made possible the analysis of signals up to a maximum frequency of 40 kHz.
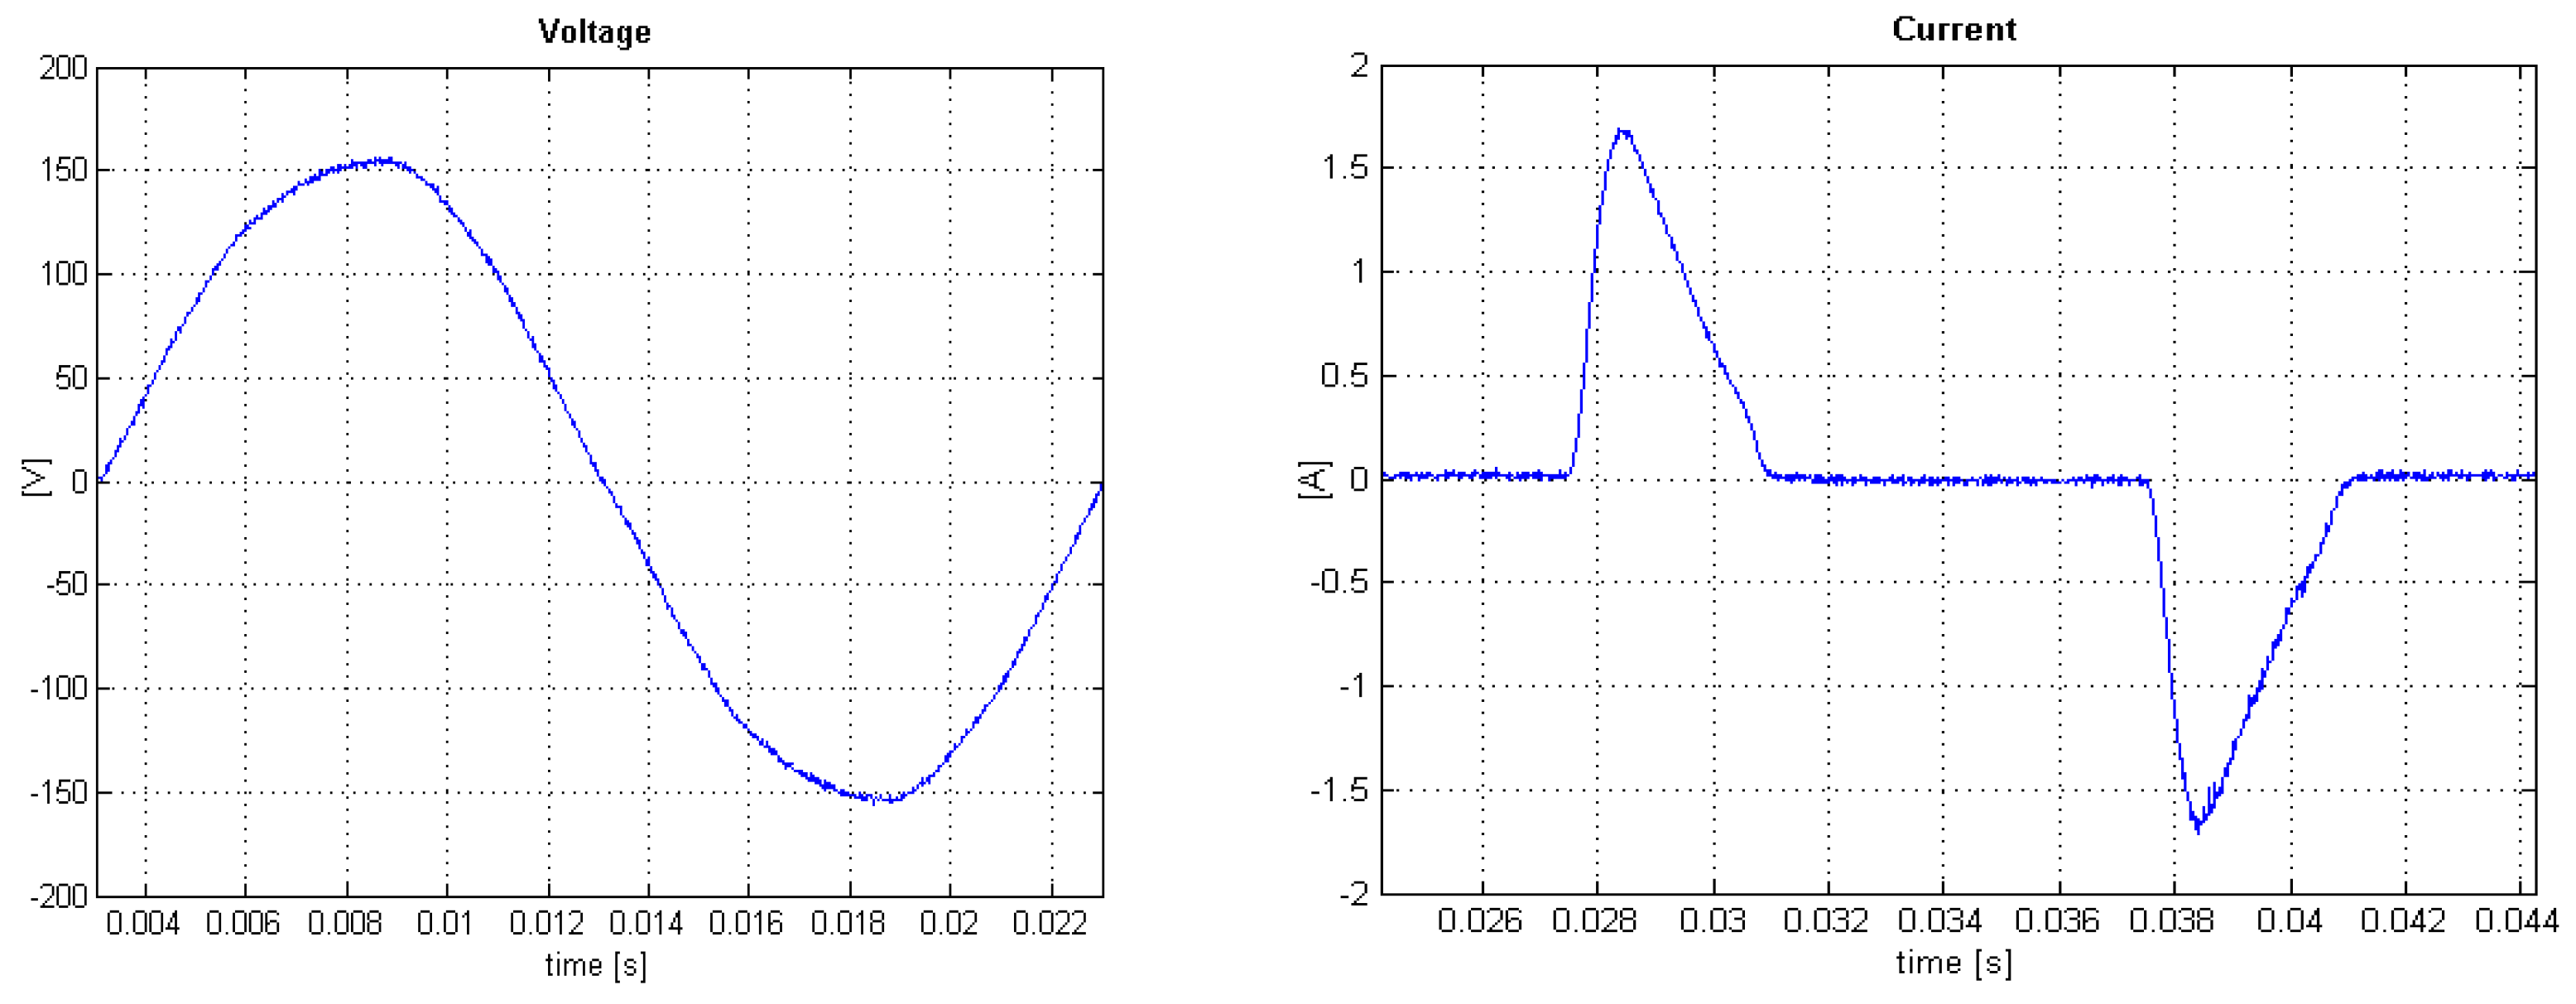
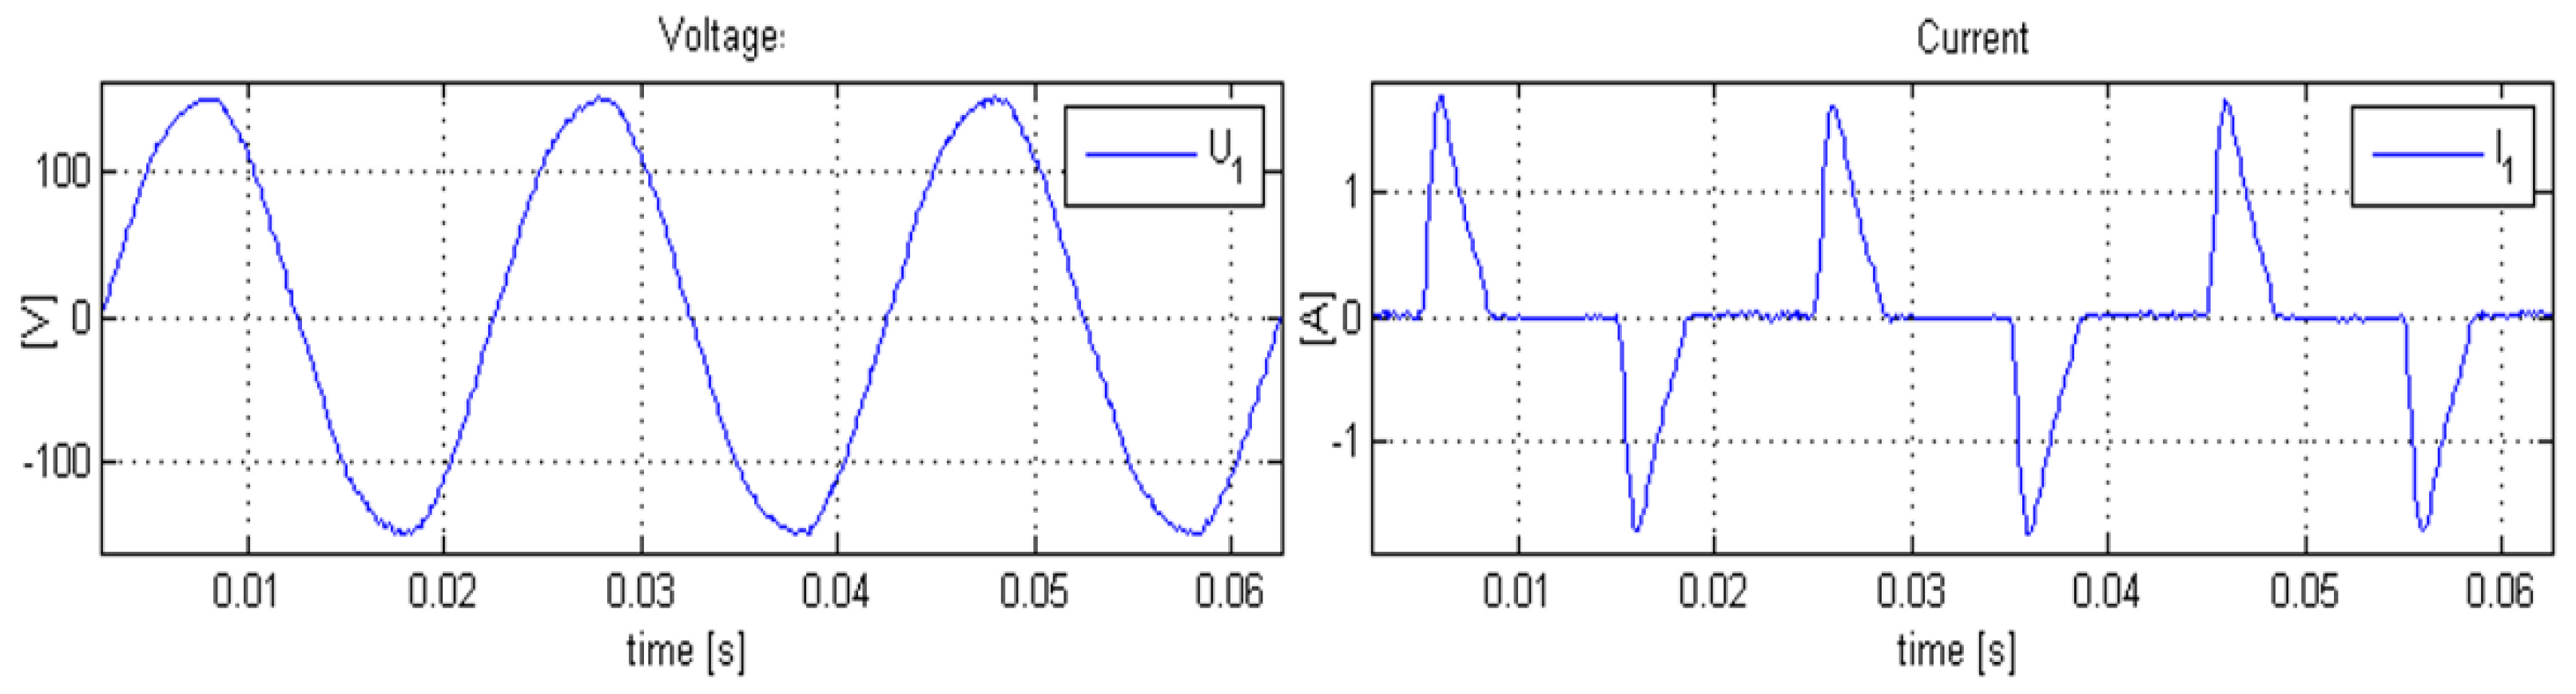
Figure 2 depicts the waveforms for voltage and current corresponding to the sampling frequency of 80 kHz acquired and recorded by us for a single period. Figure 3 presents the waveforms for voltage and current corresponding to the sampling frequency of 80 kHz acquired and recorded by us for three periods of variation of electric signals [16].
The waveforms reveal the presence of small deviations corresponding to high frequencies. A harmonic decomposition of the waveforms depicted by Figure 2 was performed.
The frequency range was divided in three sub-ranges:
- (a)
- the sub-range (0–2) kHz corresponds to a harmonic analysis related to power quality (e.g., according to the European standard EN 50160)—Figure 4. The harmonic analysis uses FFT up to the harmonic order 40;
- (b)
- the sub-range (2–9) kHz corresponds to the decomposition in Fourier series for harmonic orders belonging to the range (40–180). This analysis is also related to the fact that the harmonic analysis of signals from both channels (voltage and current) can be accomplished based on data acquisition up to a frequency of 9 kHz—Figure 5. It is worth mentioning that some standards from the EMC domain starts from 9 kHz (e.g., CISPR standards);
- (c)
- the sub-range (9–40) kHz corresponds to the decomposition in Fourier series for harmonic orders in the range (180–800). Our original algorithm allows for a harmonic decomposition for orders higher than 1000 (which corresponds to a frequency of 50 kHz). Given the sampling frequency of 80 kHz, our analysis could be made up to the frequency of 40 kHz—Figure 6 (based on Nyquist criterion).
The magnitudes of harmonics for frequencies within the ranges (2–9) kHz and (9–40) kHz are small. Therefore, imposing a minimum threshold for their magnitude as a condition for their consideration (e.g.,—as in the case of PQ problems—Figure 4) should result in their neglect. Despite the questionable accuracy in evaluating them, our analysis revealed harmonic currents with magnitudes of x µA or even x mA (as in Figure 5 and Figure 6). These currents can interfere with other currents of common or differential mode and EMIs might be generated. As the load is highly variable, these currents are submitted to significant variations too, and therefore a deeper analysis concerning them should be made.
2.2. Recordings, Numerical Processing, and Analysis of Waveforms Acquired with a Sampling Frequency of 19.2 kHz
We consider for this case electrical signals (voltages and currents) acquired at a rate of 384 samples per period by a dedicated DAS designed and manufactured for these applications. The acquired data were used as inputs for our original dedicated software, relying on FFT. Harmonic decompositions considering a maximum harmonic order of 80 were made, yielding currents, voltages, and powers spectra. In this case, the maximum harmonic order available for analysis was equal to 192 (corresponding to an upper limit of 9.6 kHz in the European supplying system).
FFT decompositions of the acquired electrical signals were used for powers computations, based on the theoretical support from [12,24].
The harmonic decompositions of the voltage and current allowed for the determination of their root mean square (RMS), the RMS corresponding to 50 Hz or to harmonics, as well as some PQ factors: the total harmonic distortions for both current and voltage and the peak factor [12,24,25].
The power calculation was done as follows [16]:
- -
- active power:
- -
- reactive power:
- -
- distorting power:
- -
- apparent power:
where:
- -
- the superscripts denote the harmonic order (0 for the frequency of 50 Hz);
- -
- denote the RMS values of the “n”-th harmonic order (U for voltage and I for current);
- -
- denotes the phase shift (voltage versus current) for the “n”-th harmonic order [16].
Because the highest harmonic distortion was recorded when the laptop (EUT from the EMC point of view) was running, this was the regime analyzed below.
Figure 7 is dedicated to plots of the acquired voltage drop across the terminals of EUT (left) and network current absorbed by it from the network (right)—at the sampling frequency of 19.2 kHz. These data were processed with FFT [1].
The harmonic spectra of the acquired signals, containing harmonic weights exceeding 1% from the component oscillating at 50 Hz, up to the maximum harmonic order equal to 31, are depicted in Figure 8.
The harmonic magnitudes and phase shifts of the acquired signals computed with FFT allowed us to determine some electrical parameters and quality indices [12,16,24]. They are gathered by Table 2 considering the PQ point of view.
The supplying voltage was a little bit higher for the case 2.1. analyzed in the Section 2.1. (RMSV = 109.59 V in the case 2.1.—Table 1, and RMSV = 107.316 V for the case 2.2. from Table 2). The difference can be explained considering the variations of the supplying voltage for the same fundamental frequency (50 Hz). On the other hand, the absorbed current for the case 2.1. was a little bit smaller if one considers the RMS values of the absorbed currents for both analyzed cases (RMSI = 0.605 A for the case 2.1. and RMSI = 0.627 A for the case 2.2.—analyzed in the Section 2.2). Still, the total harmonic distortion of the absorbed current was almost the same.
The electric powers associated with the waveforms from both cases (2.1. and 2.2. respectively) were also calculated. Their values were found to be very close, even if different values for voltages and absorbed currents were involved.
Based on Equations (1)–(4), for the case 2.2. the calculated powers [16] and power factor are gathered by Table 3.
The (re)active powers for harmonic weights exceeding 1% from the component oscillating at 50 Hz, up to the maximum harmonic of 31, are represented in Figure 9.
The values of ITHD yielded by the FFT analysis were found to overcome the upper limit of 8%, mentioned for the studied equipment in both IEEE 519-2014 Standard [12] and EN 50160 standards.
These significantly higher values, together with the diagrams in Figure 9 showing the reversed power flows and the unacceptably low values of the total power factor, represent strong arguments for taking measures to improve the PQ.
The results of this analysis allow us to conclude that it is compulsory to take measures in order to protect the network that supplied the laptop.
3. Some Considerations Concerning Electromagnetic Compatibility
3.1. Considerations on Conducted Emissions for a Portable Compatible Equipment
In practice the conducted emissions (CEs) exist in most of the electronic products and affect the electromagnetic environment. The compliance with the EMI requirements is critical to the product success on the market [26,27]. The CEs affect the neighboring equipment through power or signal lines.
“Conducted emission regulations are intended to control the radiation from the public a.c. power distribution system, which results from noise currents conducted back onto the power line” [14,26]. Usually, these currents are too small to cause EMI directly with other products connected to the same power line, but they can cause power line radiations, being able to make it a source of EMI [14,26].
The analysis presented in the Section 2.1 revealed the presence of some interference currents that are not taken into account by the actual standards—for the range (2(3)–40) kHz.
New individual standards need to be developed for them considering the PQ and EMC points of view, along with a common component in standards for frequency ranges close to 150 kHz.
Conducted emissions for a frequency range of (0.15–30) MHz were determined according to the standards in force.
3.1.1. Test Configuration
In order to test the CEs due to the portable equipment, represented by a laptop, the testing procedure was applied, with the measuring receiver in compliance with testing Standard CISPR 16-2-1 [28], imposing a frequency range of (0.15–30) MHz, with the following requirements:
- (a)
- measurements with detectors of quasi—peak (QP) values (local maximums) and of average values (AV);
- (b)
- bandwidth used by the measuring receiver: 9 kHz;
- (c)
- time elapsed between 2 consecutive measurements (time step-(TS)): 0.5 ms.
The standard CISPR 16-2-1 [28] was used for test setup measurements. The compliance of the measured CEs considers 2 types of upper limits: for QP and AV values, respectively.
The test instruments used for measuring the CEs were a Line Impedance Stabilization Network (LISN)—Figure 10, a receiver used for the measuring of EMIs, and specialized software—type EMC32 [29].
The CEs yielded by laptop through the power mains cable were detected using LISN and were fed to the EMI receiver [29]. When testing a device for compliance with the FCC and CISPR 22 regulatory limits, a LISN must be inserted between the AC power cord of the EUT and the commercial power outlet [29,30]. Due to the difference (FCC vs. CISPR 22) relative to the regulated frequency ranges, even if the LISNs for both of them have similar layouts, different values are mentioned for their components [31,32].
3.1.2. Measurement Detectors
CISPR 22 requires the measurement of common mode voltages for cables used in IT in order to determine the levels of CEs and the obeying of limits imposed to them while considering the frequency range (0.15–30) MHz [29]. Table 4 gathers the limits for CEs specified in this standard [29].
The following equipment has been used for tests [29]:
- -
- a PC running a program dedicated to CEs (the program EMC32);
- -
- a LISN, type NNB 51;
- -
- an ESCI3 EMI measuring receiver Rohde & Schwarz (referred below as R&S ESCI3).
R&S ESCI3 is a standard EMI measuring receiver that can be used within the range 9 kHz–3 GHz for EMC measurements, according to commercial standards [29].
The above-mentioned standards attempt to standardize the products’ EMC performance, relative to radio interference for electrical equipment. The levels of CEs are measured as voltages at the LISN output [29].
The role of this voltage is to stop the EMIs entering in the EUT from the power grid and to propagate a high frequency current drawn by the EUT through a 50 Ω impedance [29,31]. EN 55022 (or CISPR 22 [29]) standard is normally applied for measuring CEs from the IT products.
The standards requirements are common for all IT equipment [29].
3.1.3. Measurement Results
EUT’s phase and neutral power cables were submitted to tests [31,32]. The measurements were performed in a laboratory from a research institute outside of the university, in an accredited laboratory. An EUT is considered as “passing a test” when the measured levels of CEs are lower than the limits imposed by standard.
In the resulting graphs, the points for the AVs are on the waveform with lower values (black), and the quasi-peak values are on the waveform with high values (blue) (Figure 12 and Figure 13).
The values obtained through tests for the QPs and AVs were compared with those mentioned in the standard CISPR 16-2-1 [28], and it was found that they did not exceed the allowed limits. One could conclude that the protective measures taken by the portable equipment producers and those associated to filters placed on the supplying cables were appropriate.
3.2. Considerations on Radiated Emissions for a Portable Compatible Equipment
The measurements accomplished in order to determine the radiated emissions (RE) of an EUT have in view the evaluation of conformity with the limits imposed by the standard of product associated to the EUT (a laptop in this case).
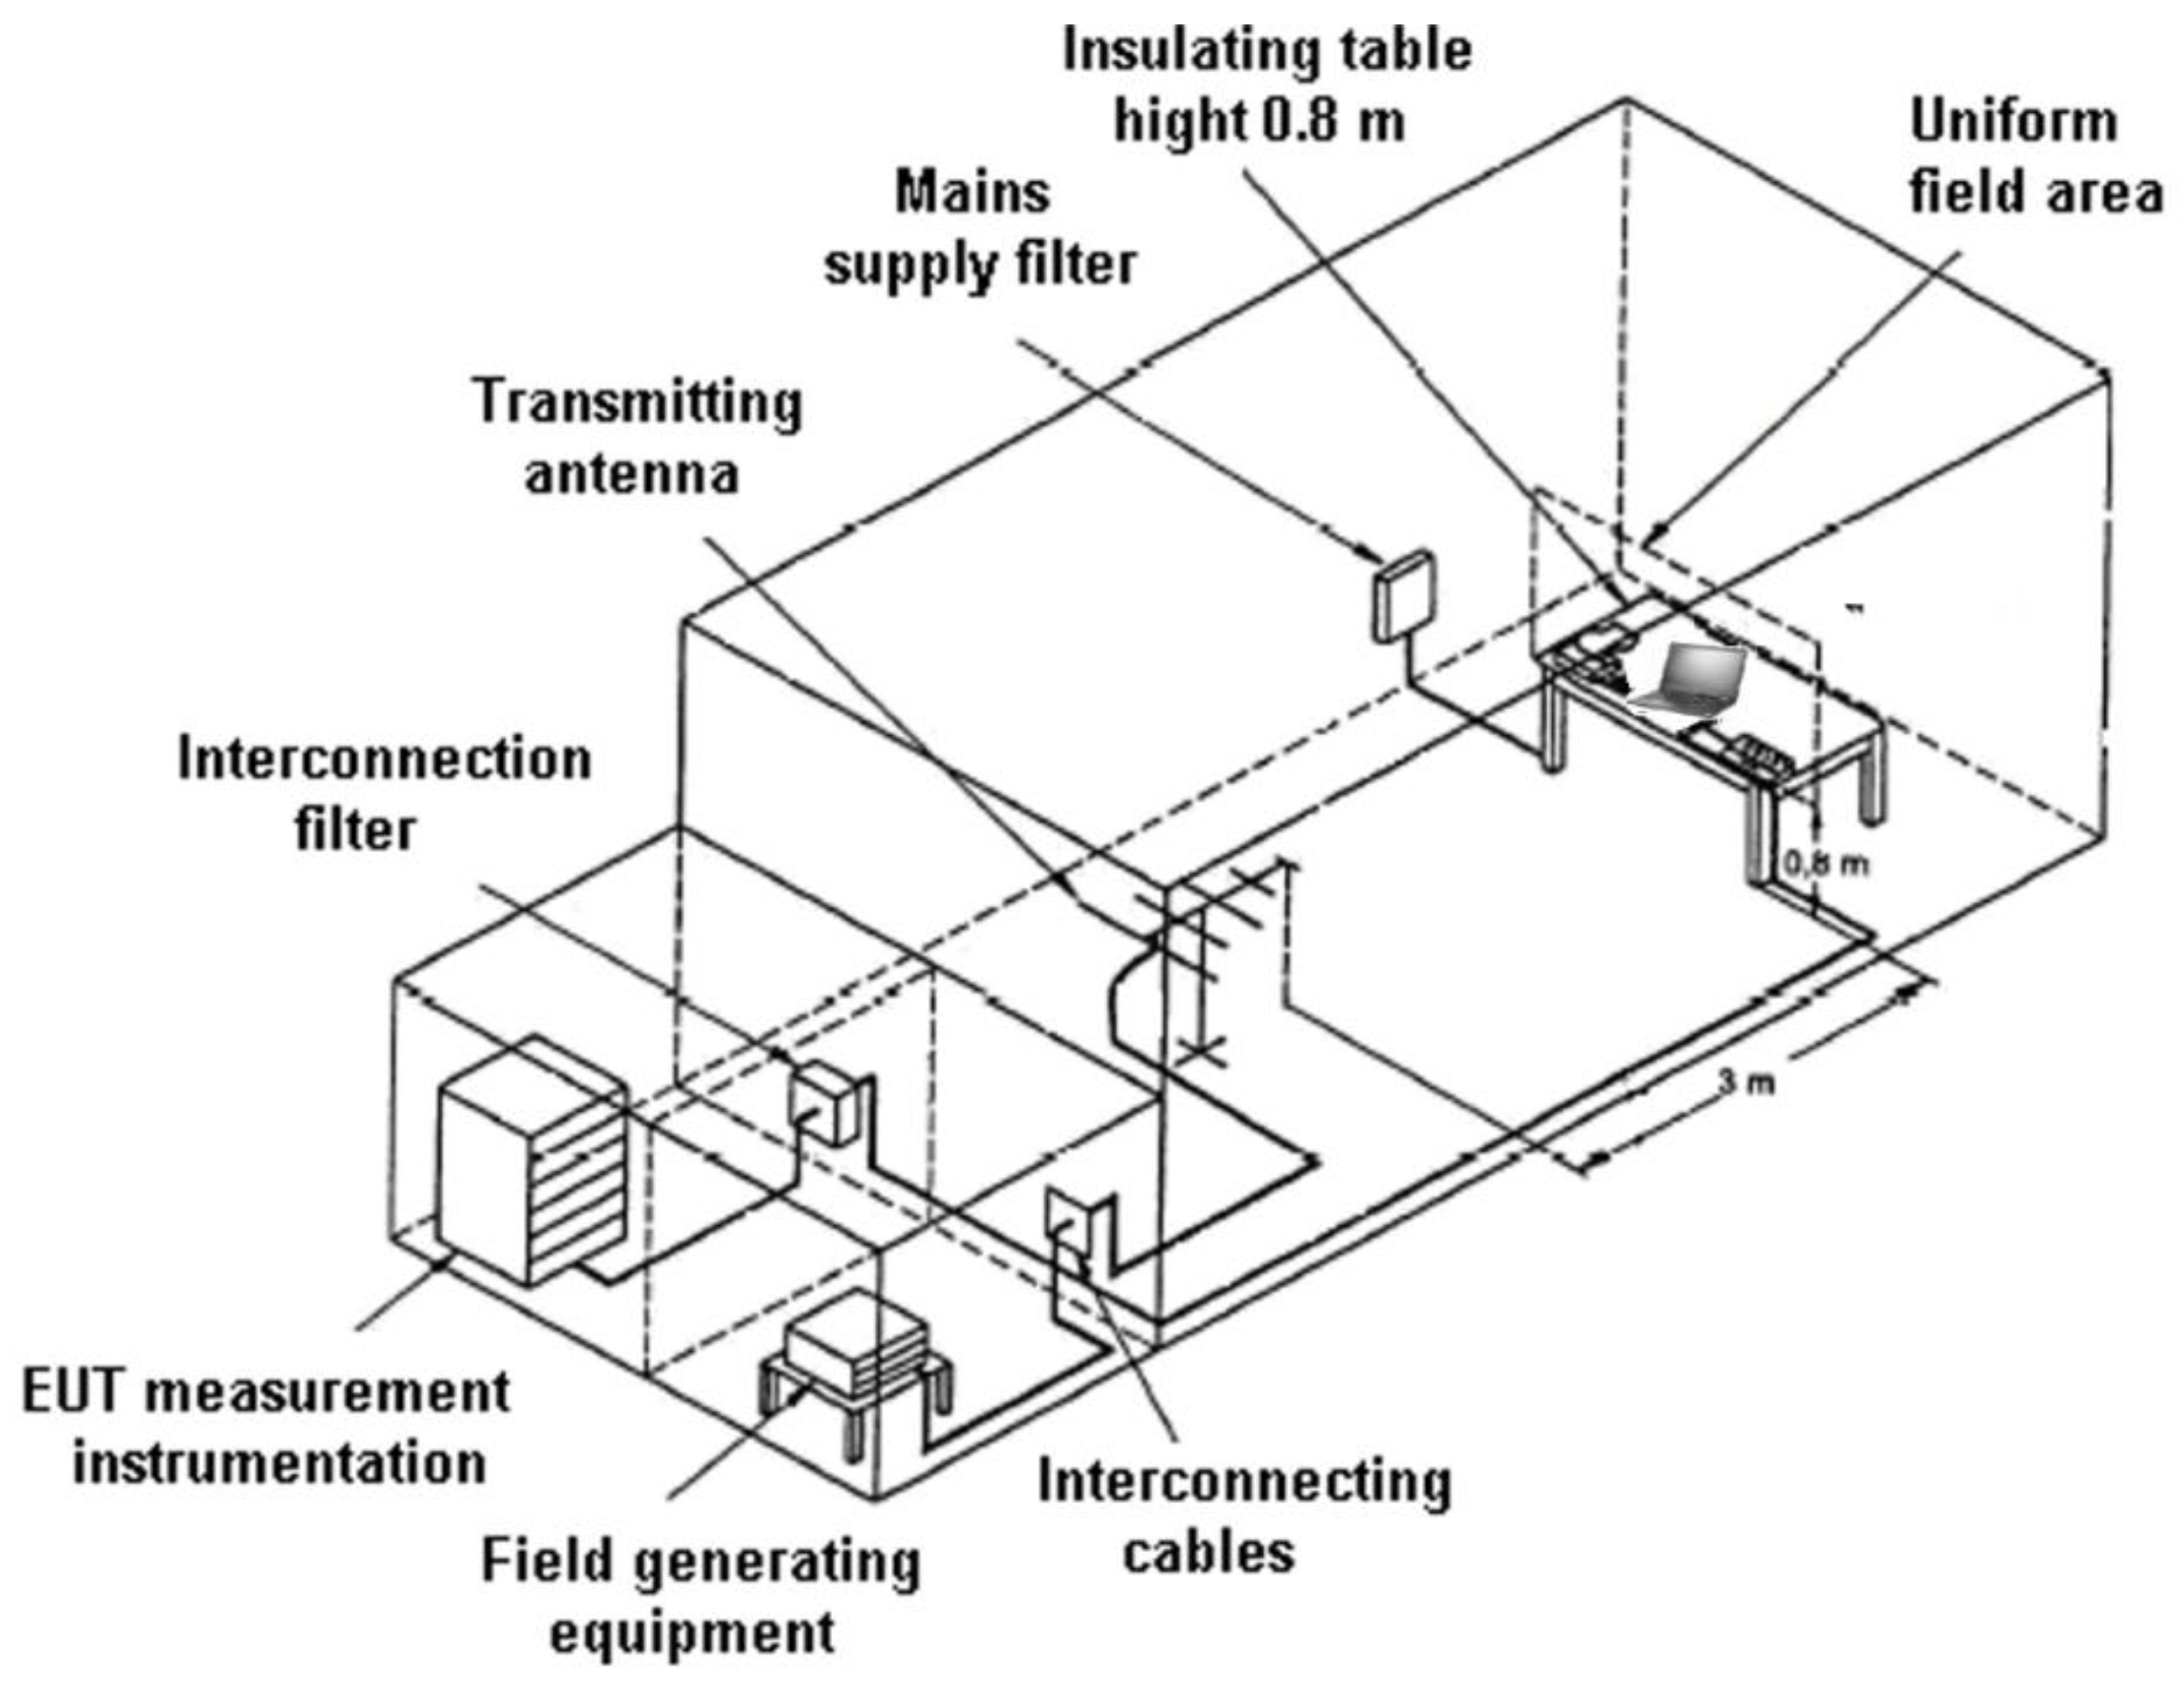
The measurements concerning the REs were done in a Semi-Anechoic Chamber (SAC), at a distance of 3 m, as mentioned in the Standard IEC 61000-4-3 [33].
The measurements were performed in a laboratory from a research institute outside of the university, in an accredited laboratory. The CISPR 22 Standard and the European norm EN 55022 mention the limits for REs [34].
According to the CISPR 22 Standard [29], the disturbance limits for REs allowed for this type of equipment are gathered by Table 5.
The measurements accomplished in order to determine the REs of EUT had in view the evaluation of conformity with the limits imposed by the standard of product associated to the EUT (laptop in this case).
- (i)
- Test procedure of radiated emissions
The test performed for checking the compliance with the product standards have been realized in SAC. The site configuration for performing the experimental testing was realized according to CISPR 16-2-1 Standard [28]. The tests were made following the procedure imposed by CISPR 22 [29]. The dedicated software EMC 32 was used in order to evaluate the emissions radiated by laptop.
The main components used to measure the REs were: a R&S ESCI3 measuring receiver, a hybrid antenna (logarithm periodical) type HL 1000, an emission antenna type EMCO 2090, and a semi-anechoic chamber. The R&S ESCI3 measuring receiver is compliant with the latest version of CISPR 16-1-1 Standard [34].
- (ii)
- Test conditions for radiated emissions
The tests concerning the REs were made for both horizontal and vertical polarizations considering the following test parameters for the R&S ESCI3 measuring receiver [35]:
- Test range: (0.03…1) GHz;
- Band width: 120 kHz;
- Frequency step: 60 kHz;
- Test time/frequency step: 1 s (for QP values).
- (iii)
- Tests Results Concerning the Radiated EM Emissions
- (a)
- Radiated Emissions in Horizontal Polarization
- (b)
- Radiated Emissions in Vertical Polarization
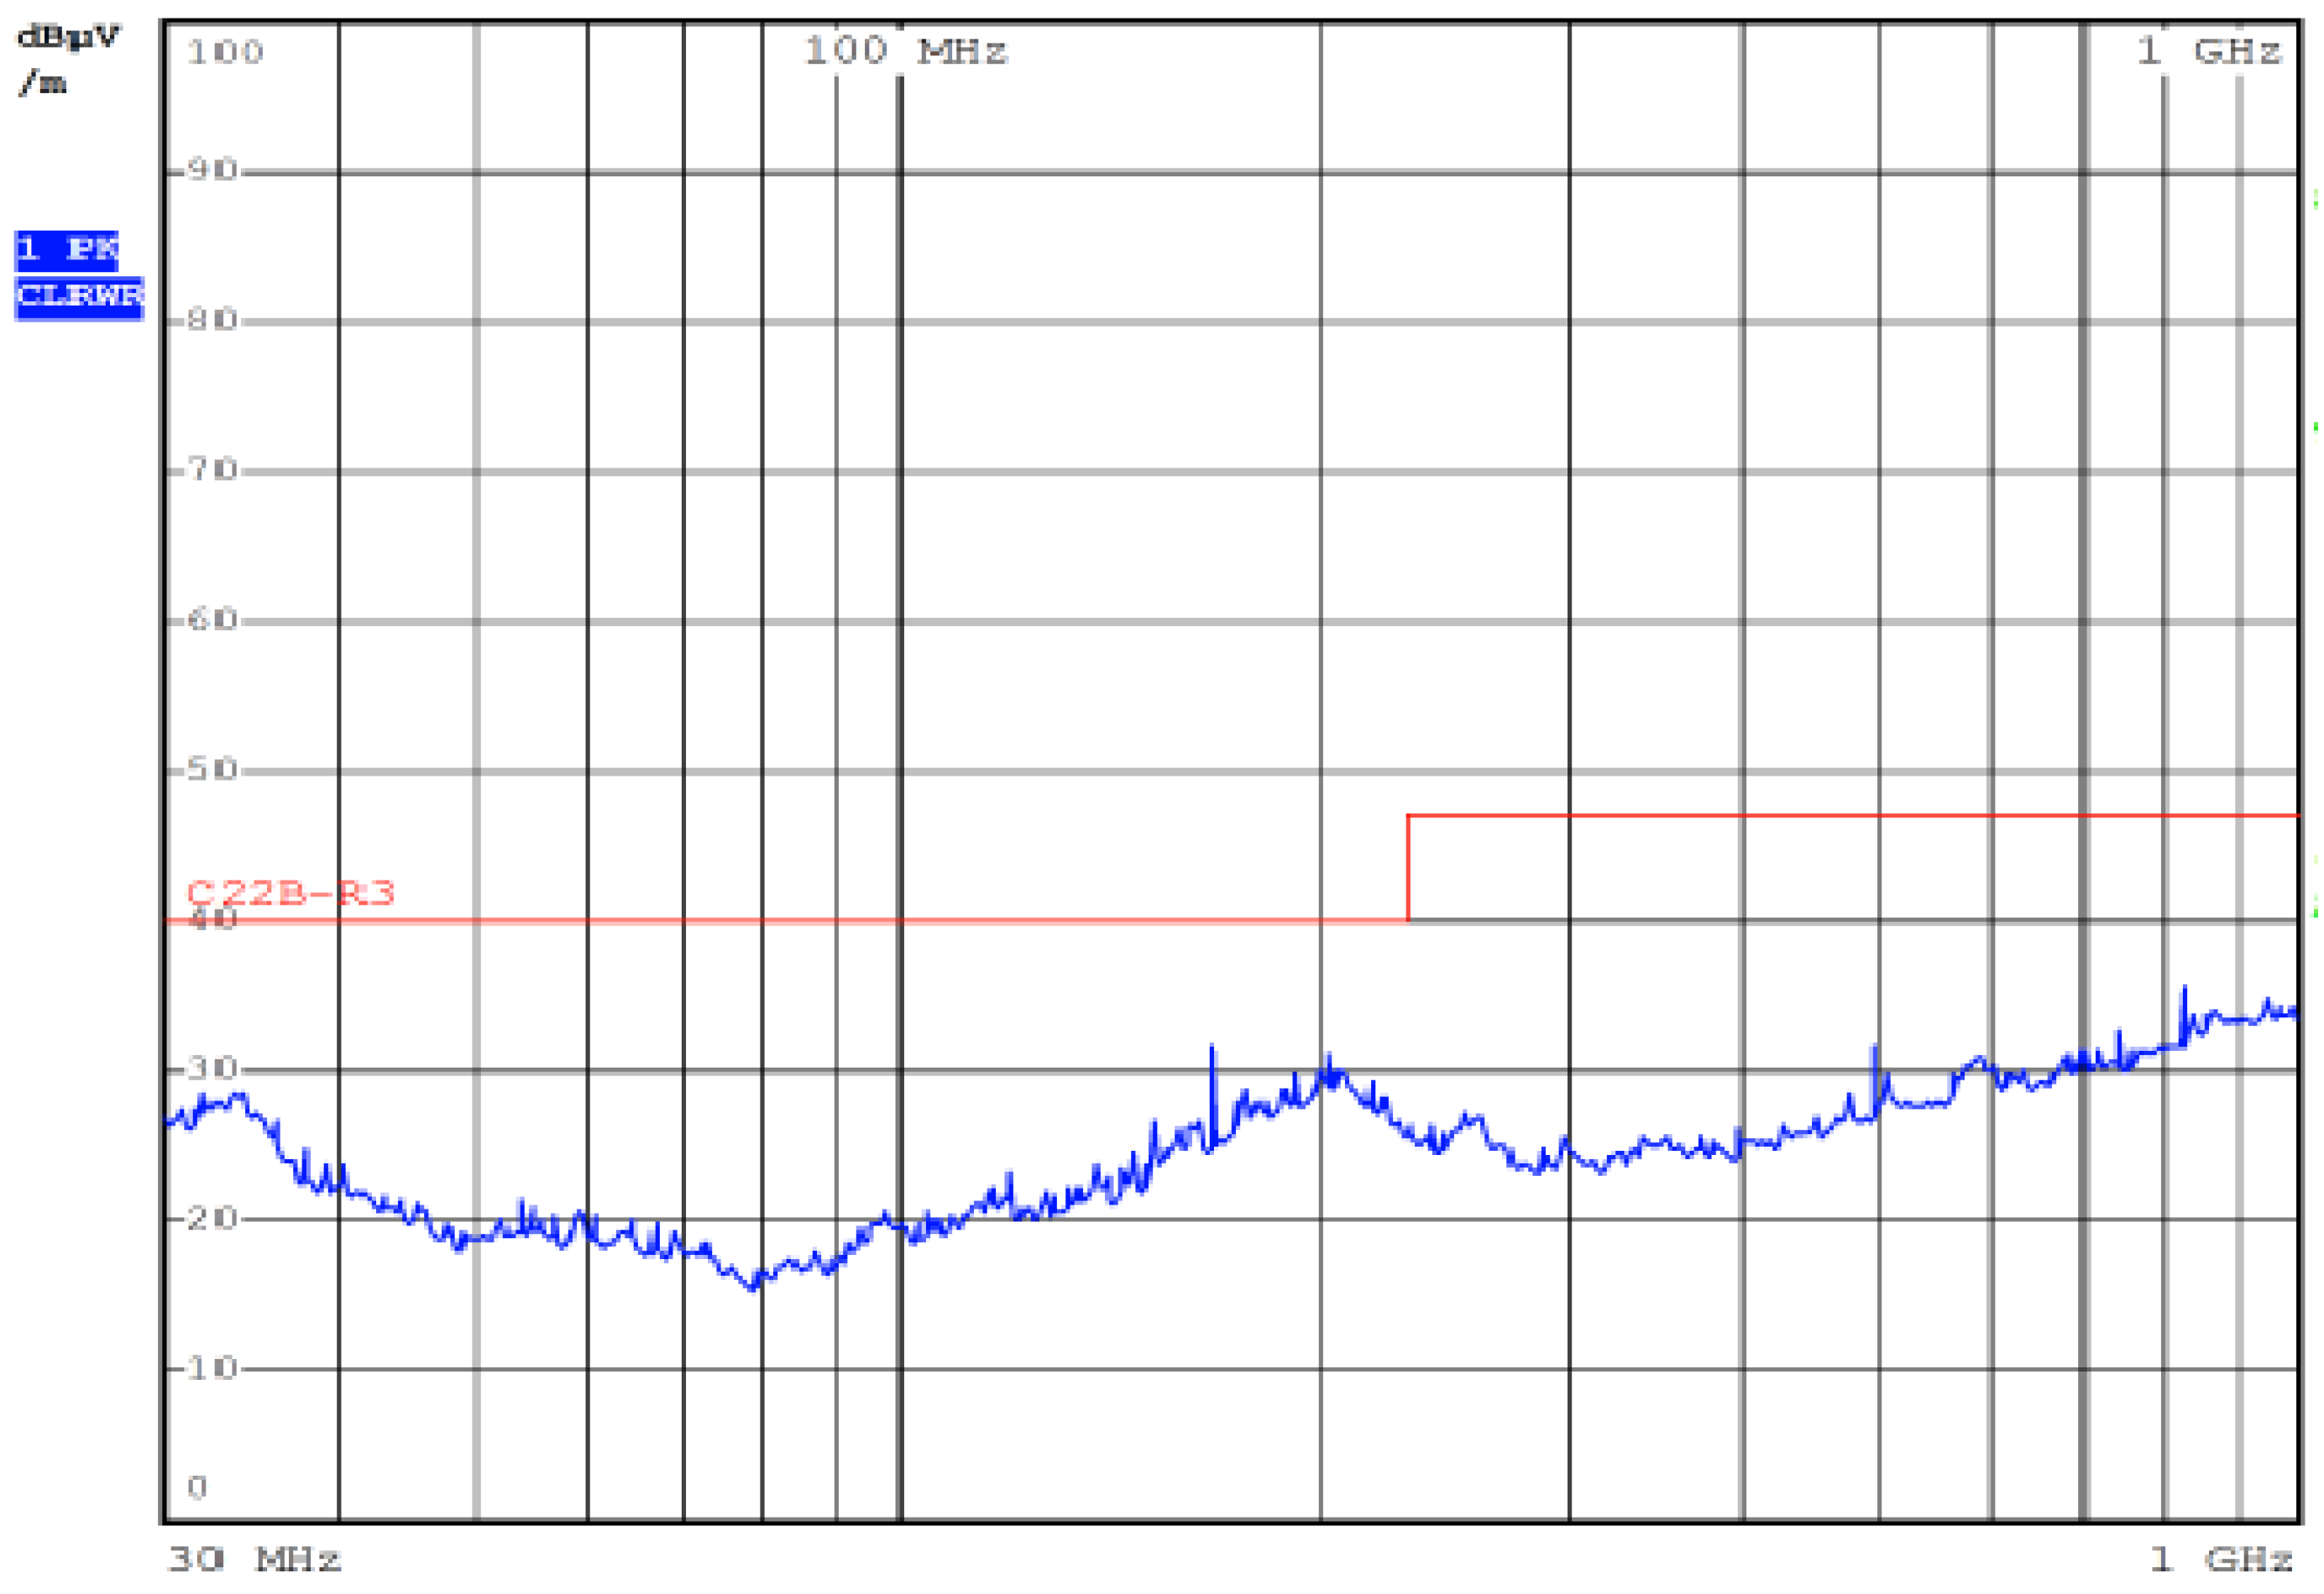
The analysis of the QP values reveals that none of them exceeds the maximum allowed limit of 40 dB(μV/m) for the range (30–230) MHz and 47 dB(μV/m) for the range (230–1000) MHz [29]. The two frequency ranges considered are related to the Standard used—CISPR 22—which has different values for radiated emissions, both for horizontal and vertical polarization, for the frequency ranges mentioned above.
3.3. Testing the Immunity of a Laptop
GTEM cells can be used to perform tests over a certain EUT in order to evaluate its immunity to an incidental electromagnetic field [36].
A list with characteristics of GTEM cells that make them a good choice for this type of tests includes: (a) very well-defined field configurations that can be generated inside them, such as to comply with the standard IEC/EN 61000-4-20 [29,36]; (b) no additional antennas and consequently no GTEM cell internal cables being required, which means that the tests’ reproducibility is high; and (c) ease of use [36].
The tests were made with the following equipment [36]:
- -
- GTEM Cell, type 750 (maximum size of EUT: 0.62 × 0.62 × 0.49 m);
- -
- Signal Generator/Power Meter, type PMR 6006 (0.001–6) GHz;
- -
- Field sensors; Connectors (Cable RF type CHA 9511);
- -
- Bi-directional Coupler (0.08–1) GHz;
- -
- CBA 1G-150 Power Amplifier, type CBA 9479;
- -
- Spectrum Analyzer, type Tektronix RSA 3308A.
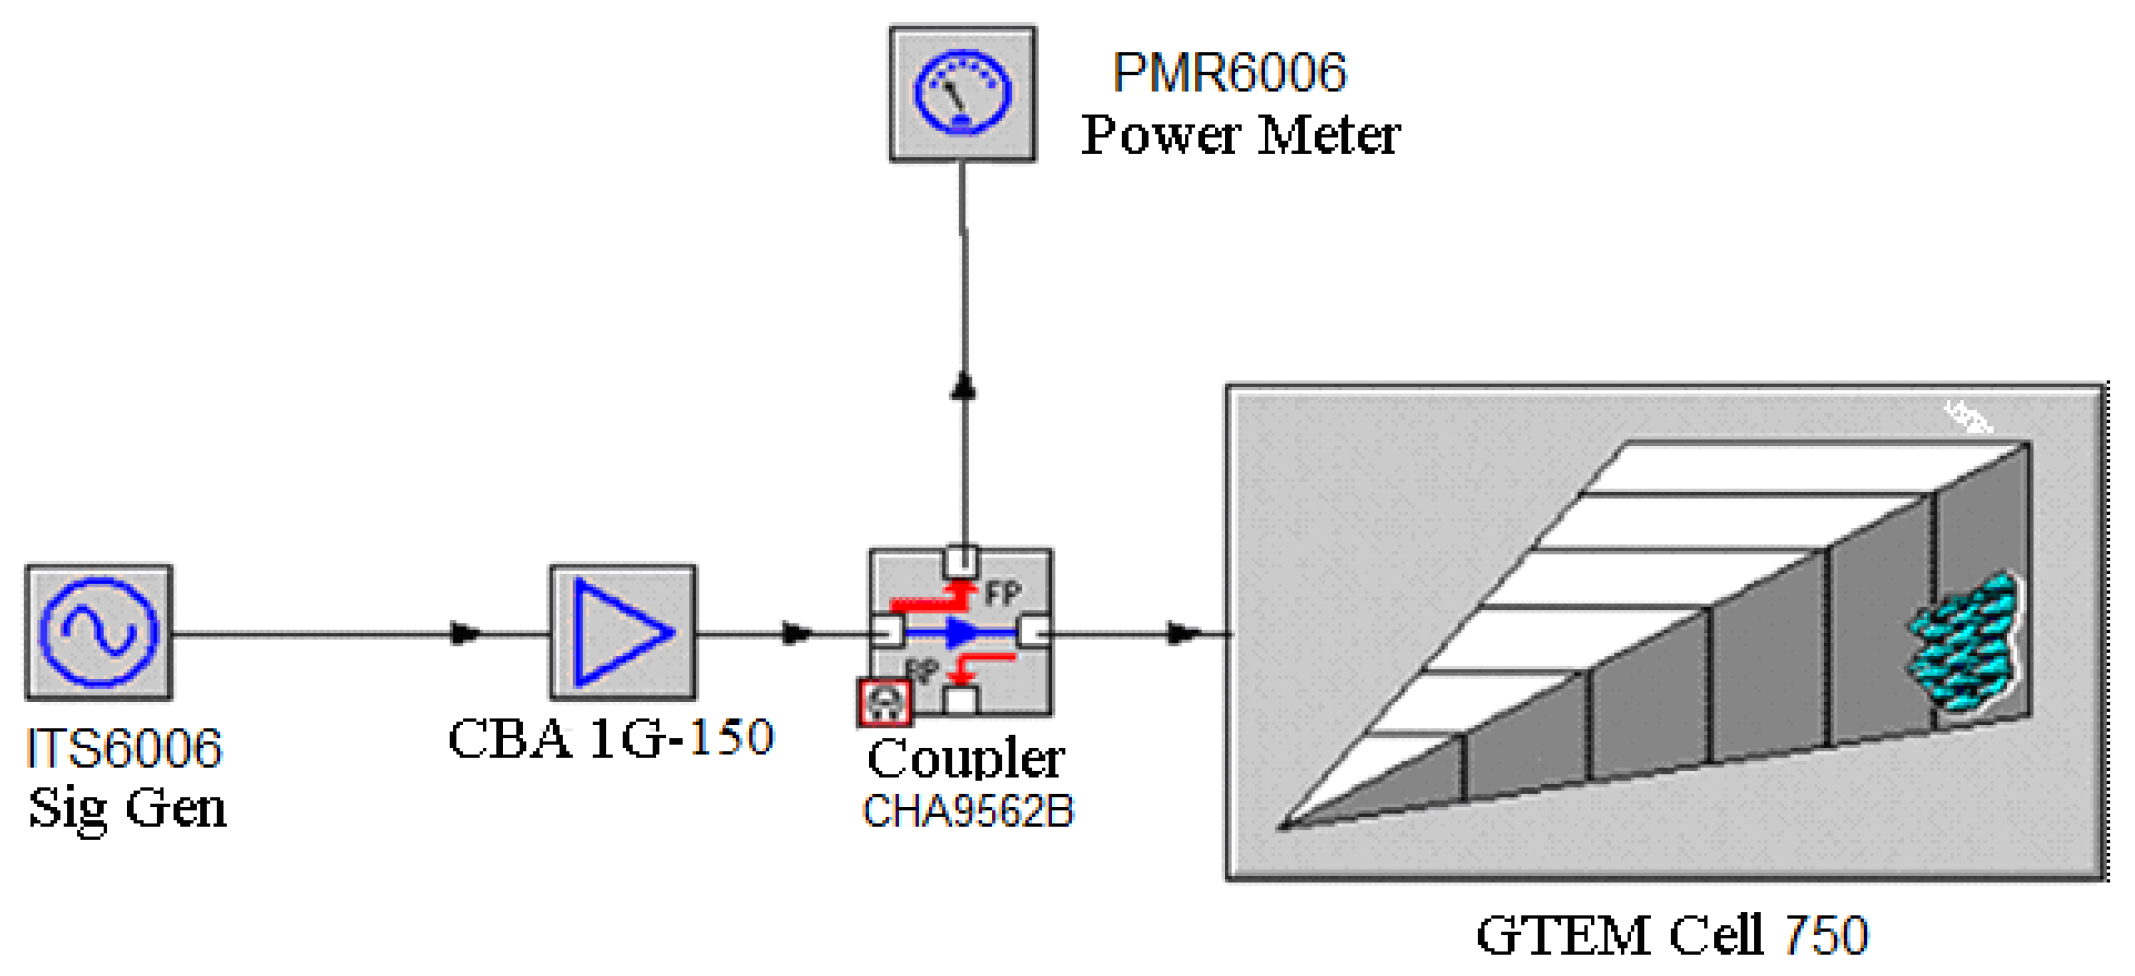
The laptop was submitted to immunity tests for an incident magnetic field of 30 V/m using the schema depicted in Figure 17 [36]. The tests were developed in our research laboratory at INCESA Research Institute from University of Craiova, Faculty of Electrical Engineering.
Figure 18 depicts the equipment used for measurement in the GTEM cell 750.
Figure 19 is dedicated to the calibration equipment used for the performing of immunity tests [36]. Field sensors were used during the calibration processes. As one can see in this schema, the GTEM cell’s feed was connected to the power delivery unit such as to get an input power that increases until the electric field strength in the cell equals the value required for each frequency used for tests.
For a laptop, appropriate standardized values for the operational parameters and frequency range associated to immunity tests [36] were used, as follows:
- Electric field strength 30 V/m;
- Sinusoidal signal with magnitude’s modulation 80%, with a frequency of 1 kHz;
- Operating frequency: (0.08–1) GHz.
The following standards were considered: IEC 61000-4-3 [33], IEC 61000-4-20 [37], IEC 61000-4-6 [38].
For the performed immunity tests, the Criterion A was considered. According to it, “EUT must be operational at the rated parameters during the test and afterward. No modification of the parameters is allowed during the test or afterward” [37,39].
Table 6 gathers the main results concerning the behavior of the laptop during the immunity tests. One could notice that the input power significantly changed for the range (150–230) MHz.
For the entire set of frequencies submitted to analysis there were no interruptions in the operation of the laptop. Therefore, one could conclude that criterion A was obeyed for the performed immunity tests.
4. Conclusions
A set of tests revealed that for the conducted emissions measurements, the analyzed laptop exhibited a proper operation (Figure 10 and Figure 11). Other tests were performed in order to check if the EUT obeys the radiated emission limits, in compliance with the standard IEC 61000-6-1. According to Figure 10 and Figure 11, the EUT passed the tests concerning radiated emissions for both types of polarization: horizontal and vertical. All the tests accomplished for other types of portable equipment in order to test the compliance with the standards in force for the conducted and radiated emissions proved that the limits imposed by the EMC standards were not exceeded [21,40,41].
From the point of view of the emissions radiated by the analyzed EUT, one can conclude that the EUT operation does not affect the operation of other equipment from its vicinity. The electromagnetic immunity tests have also been passed (as explained in the Section 3.3).
Although from the conducted and radiated emissions’ point of view the conditions imposed by the CISPR22 are obeyed, one considered that the categorization of the analyzed EUT as an equipment that belongs to “Information technology equipment” is too general. We should reconsider this categorization because often the PC-s (and laptops) are connected to the INTERNET, and therefore the analysis from the conducted and radiated emissions’ point of view should consider the role played by the connection equipment (e.g., router) in the global picture. For the radiated emissions, the tests should be performed in an Open Test Site Area (OATS), where an INTERNET connection is available (router connected) in order to see more clearly the influence of these emissions and the way they influence each other. The influence of this equipment over people is not properly quantified, and the limits of CISPR 22 are not correct for this type of equipment. A reconsideration of this standard must be done considering this point of view [40,41].
Although this kind of analysis is only at the beginning, we believe that the limits for conducted and radiated emissions are too permissive and should be reconsidered. For example, Figure 10 and Figure 11 reveal that the conditions imposed by the standard CISPR22 for the conducted emissions are obeyed “at the limit” (especially for the quasi-peak values). If one considers jointly these last remarks with the content of Figure 5 and Figure 6, related to PQ problems, one can observe that it is compulsory to take some measures in a “per individual equipment” manner (e.g., for each laptop) in order to improve the PQ [21].
The use of switching sources SMPS presents many advantages, but even if improvements are made [33], it leads to some distorted harmonic currents absorbed by the supplying network. They may have unpleasant influences over the supplying network and over its fundamental frequency, respectively [42].
The joint analysis considering the very high current harmonic distortion (THDI = 71%), the powers, and the power factor reveals a reversed power flow in the analyzed case (the power factor revealed a capacitive character of the laptop). A beneficial effect of the laptop over the network could be recorded for a power flow from laptop toward the supplying network (the network power factor should be improved). Unfortunately, the power flows are carried both by the fundamental harmonic and by the higher harmonics, causing a worsening of the supplying network situation (the harmonic currents may affect other consumers from the surrounding area). The PQ Standards are not met (e.g., IEEE 519-2014 Standard [12]-see Section 2). For a portable computer, further steps must be taken in order to diminish the current harmonics and the high harmonic powers.
The analysis of presented tests results emphasizes the need for measures to protect the network used to supply the laptop. One has to design and realize filters that should be placed on the laptop supplying cable in order to reduce the current harmonics introduced by the laptop in the network. The existing filters, placed on the supplying cables, do not solve the PQ related problems for the frequency range (0–2(3)) kHz.
Another conclusion is related to the current harmonics for frequencies within the range (2–40) kHz. The capacitive character of the load will result in currents of common and/or differential mode, which might affect the electronic circuits [40]. The diminishing of these currents is compulsory. The analysis accomplished for frequencies higher than those considered for PQ analysis proves that one has to perform detailed studies to address problems related to harmonics and to develop some individual standards or some standards common for PQ and EMC considering the frequency range (2(3)–150) kHz. These should also be correlated to analysis of harmonics for frequencies higher than 2(3) kHz. Modern methods for analysis in time-frequency domains (e.g., using wavelets) should be employed as well, as long as their domain of applicability is wider than that of traditional Fourier analysis and can offer additional information [22].
As a conclusion, in order to address both ranges (0–2(3)) kHz and (2(3)–150) kHz respectively), new standards must be developed, while using correct experimental tests and harmonic analysis.
Author Contributions
Conceptualization, I.-D.N. and P.-M.N.; methodology, I.-D.N.; software, I.-D.N.; validation, I.-D.N. and P.-M.N.; formal analysis, P.-M.N.; investigation, P.-M.N.; data curation, I.-D.N.; writing—P.-M.N.; writing—review and editing, I.-D.N. All authors have read and agreed to the published version of the manuscript.
Funding
This research received no external funding.
Data Availability Statement
Not applicable.
Conflicts of Interest
The authors declare no conflict of interest.
References
- Chen, C.-I. Design of measurement system based on signal reconstruction for analysis and protection of distributed generations. IEEE Trans. Ind. Electron. 2013, 60, 1652–1658. [Google Scholar] [CrossRef]
- Benzi, T.; Anglani, N.; Bassi, E.; Frosini, L. Electricity smart meters interfacing the households. IEEE Trans. Ind. Electron. 2011, 58, 4487–4494. [Google Scholar] [CrossRef]
- Shukla, S.; Mishra, S.; Singh, B. Power quality event classification under noisy conditions using EMD-based de-noising techniques. IEEE Trans. Ind. Inform. 2014, 10, 1044–1054. [Google Scholar] [CrossRef]
- Nagy, I.; Járdán, R.K. Power quality conditioning based on space vector transformation. In Proceedings of the IEEE International Symposium on Industrial Electronics, ISIE 2005, Dubrovnik, Croatia, 20–23 June 2005; pp. 789–794. [Google Scholar]
- Rahimi-Eichi, H.; Baronti, F.; Chow, M.-Y. Online adaptive parameter identification and state-of-charge co-estimation for lithium-polymer battery cells. IEEE Trans. Ind. Electron. 2014, 61, 2053–2061. [Google Scholar] [CrossRef]
- Bialasiewicz, J.; Gonzalez, D.; Balcells, J.; Gago, J. Wavelet-based approach to evaluation of signal integrity. IEEE Trans. Ind. Electron. 2013, 60, 4590–4598. [Google Scholar] [CrossRef] [Green Version]
- Nicolae, I.D.; Nicolae, P.M. Performances evaluation of a class of original discrete wavelet transform based hybrid algorithms. In Proceedings of the 15th International Conference on Harmonics and Quality of Power (ICHQP), Hong Kong, China, 17–20 June 2012; pp. 727–732. [Google Scholar] [CrossRef]
- Lin, H.C. Power harmonics and inter-harmonics measurement using recursive group-harmonic power minimizing algorithm. IEEE Trans. Ind. Electron. 2012, 59, 1184–1193. [Google Scholar] [CrossRef]
- Chen, C.-I.; Chang, C.W. Virtual instrumentation and educational platform for time-varying harmonic and inter-harmonic detection. IEEE Trans. Ind. Electron. 2010, 57, 3334–3342. [Google Scholar] [CrossRef]
- Chang, C.W.; Chen, C.-I.; Liang, Q.-W. A two-stage ADALINE for harmonics and inter-harmonics measurement. IEEE Trans. Ind. Electron. 2009, 56, 2220–2228. [Google Scholar] [CrossRef]
- *** EN 50160 Std; Voltage Characteristics in Public Distribution Systems. IET: London, UK, 2004.
- *** IEEE 519-2014 Std; IEEE Recommended Practices and Requirements for Harmonic Control in Electrical Power Systems. IEEE: New York, NY, USA, 2014.
- Hu, K.W.; Liaw, C.M. On an auxiliary power unit with emergency AC power output and its robust controls. IEEE Trans. Ind. Electron. 2013, 60, 4387–4402. [Google Scholar] [CrossRef]
- Ott, H. Electromagnetic Compatibility Engineering; Wiley: Hoboken, NJ, USA, 2009. [Google Scholar]
- Nicolae, P.M. “Workshop—WED-PM-5 EMC for Home Appliances, Including Power Converters Applications”—About measurement in circuits with power electronic converters at low frequency. In Proceedings of the 2018 IEEE Symposium on Electromagnetic Compatibility, Signal Integrity and Power Integrity (EMC, SI & PI), Long Beach, CA, USA, 30 July 2018–3 August 2018; pp. 1–55. [Google Scholar]
- Nicolae, P.M.; Popa, L.D.; Nicolae, M.S.; Nicolae, I.D. Behavior of fast variable loads at the connection to the power supplying source. In Proceedings of the 2015 IEEE International Symposium on Electromagnetic Compatibility (EMC), Dresden, Germany, 16–22 August 2015; pp. 1–6. [Google Scholar] [CrossRef]
- Singh, S.; Singh, B.; Bhuvaneswari, G. Improved power quality SMPS for computers using bridgeless PFC converter at front end. IEEE Trans. Ind. Appl. 2015, 51, 721–732. [Google Scholar] [CrossRef]
- Hasan, K. Rotating-sliding-line-based sliding-mode control for single phase UPS inverters. IEEE Trans. Ind. Electron. 2011, 59, 3719–3726. [Google Scholar] [CrossRef]
- Singh, B.; Singh, S.; Chandra, A.; Al-Haddad, K. Comprehensive study of single-phase ac-dc power factor corrected converters with high frequency isolation. IEEE Trans. Ind. Inform. 2011, 7, 540–556. [Google Scholar] [CrossRef]
- Nicolae, P.M.; Vladut, G.; Mandache, L. New strategies for waveforms analysis using FFT. In Proceedings of the IEEE International Conference on Automation, Quality and Testing, Robotics—AQTR, Cluj-Napoca, Romania, 24–26 May 2008; Volume 1, pp. 212–217. [Google Scholar] [CrossRef]
- *** IEC 61000-4-7; Standard, (Revision 2.1, October 2009), Electromagnetic Compatibility (EMC)—Part 4-7: Testing and Measurement Techniques—General Guide on Harmonics and Inter-Harmonics Measurements and Instrumentation, for Power supply Systems and Equipment Connected Thereto. IEC: Geneva, Switzerland, 2002.
- Nicolae, I.D.; Nicolae, P.M. DWT Analysis of High Order Harmonics Influence over Distorted Regimes with Fast Variable Loads. In Proceedings of the 2015 IEEE Int. Symp. on Electromagnetic Compatibility (EMC), Dresden, Germany, 16–22 August 2015; pp. 1–6. [Google Scholar] [CrossRef]
- Nicolae, I.D. Workshop WED-PM-5 Behavior of a Collection of Computers with Respect to the Three-Phase Supplying Network. In Proceedings of the 2018 IEEE Symposium on Electromagnetic Compatibility, Signal Integrity and Power Integrity (EMC, SI & PI), Long Beach, CA, USA, 30 July 2018–3 August 2018. [Google Scholar]
- Tugulea, A. Criteria for the Definitions of the Electric Power Quality and its Measurement Systems. ETEP 1996, 6, 357–363. [Google Scholar] [CrossRef]
- *** IEC 61000-4-30; First edition 2003-02, Electromagnetic Compatibility (EMC)—Part 4–30: Testing and Measurement Techniques—Power Quality Measurement Methods. IEC: Geneva, Switzerland, 2003.
- Paul, C.R. Introduction on Electromagnetic Compatibility, 2nd ed.; Wiley: New York, NY, USA, 2006. [Google Scholar]
- Lu, Y.Y.; Chen, Z.H.; Yeh, C.H.; Huang Huang, H.C. Measurements and Improvements of Conducted Electromagnetic Interference Emission Caused by the Switching Circuit. In Proceedings of the First International Conference on Innovative Computing Information and Control—vol. I (ICICIC 06), Beijing, China, 30 August–1 September 2006; pp. 1–5. [Google Scholar] [CrossRef]
- *** CISPR 16-2-1; Specification for Radio Disturbance and Immunity Measuring Apparatus and Methods—Part 2-1: Methods of Measurement of Disturbances and Immunity-Conducted Disturbance Measurements. IEC: Geneva, Switzerland, 2014.
- *** CISPR 22 Edition 6.0; Information Technology Equipment—Radio Disturbance Characteristics—Limits and Methods of Measurement. IEC: Geneva, Switzerland, 10 April 2006.
- Sanchez, A.M.; Pignari, S.A.; Regue, J.R.; Ribo, M. Device Modeling for Nonstationary Conducted Emissions Based on Frequency- and Time-Domain Measurements. IEEE Trans. Electromagn. Compat. 2012, 54, 738–746. [Google Scholar] [CrossRef]
- Nicolae, P.M.; Stoica, C.M.; Mihai, G. Practical Considerations Concerning Conducted Electromagnetic Interferences for a PC. Ann. Univ. Craiova Electr. Eng. Ser. 2014, 1, 134–139. [Google Scholar]
- Bucci, G.; Fiorucci, E.; Landi, C.; Bucci, N. A Digital Measurement Station for the Precompliance Testing of Conducted Emissions of Power Electronic Devices. In Proceedings of the IEEE Industrial Symposium on Industrial Electronics, ISIE, Anchorage, AK, USA, 1–3 June 2002; Volume 2, pp. 554–559. [Google Scholar] [CrossRef]
- *** IEC EN 61000-4-3; Electromagnetic Compatibility (EMC)–Part 4-3: Testing and Measurement Techniques—Radiated, Radio-Frequency Electromagnetic Field Immunity Test, Edition 4.0. IEC: Geneva, Switzerland, 2020.
- Dina, L.A.; Nicolae, P.M.; Smarandescu, I.D.; Voicu, V. Considerations on Radiated Emission Measurements for a Laptop in a Semi-Anechoic Chamber. In Proceedings of the 2017 International Conference on Electromechanical and Power Systems (SIELMEN), Iasi, Romania, 13–15 October 2017; pp. 202–207. [Google Scholar] [CrossRef]
- Nicolae, P.M.; Nicolae, I.D.; Mihai, G.; Patru, I. Reducing emissions from an AC-DC-AC converter to improve Power Delivery Network behavior. In Proceedings of the International Symposium on Electromagnetic Compatibility (EMC), Denver, CO, USA, 4–8 August 2014; pp. 138–143. [Google Scholar] [CrossRef]
- Nicolae, P.M.; Nicolae, I.D.; Stanescu, D.G. Using GTEM Cells for Immunity Tests on Electronic Boards with Microcontroller. In Proceedings of the IEEE Electromagnetic Compatibility Symposium—ISEMC, Pittsburgh, PA, USA, 6–10 August 2012; Volume 1, pp. 44–49. [Google Scholar] [CrossRef]
- *** IEC 61000-4-20; Testing and Measurement Techniques—Emission and Immunity Testing in Transverse Electromagnetic (TEM) Waveguides, Edition 1.1. IEC: Geneva, Switzerland, 2007.
- *** IEC EN 61000-4-6; Electromagnetic Compatibility (EMC)—Part 4-6: Testing and Measurement Techniques—Immunity to Conducted Disturbances, Induced by Radio-Frequency Fields. IEC: Geneva, Switzerland, 2013.
- Bozec, D.; McCormack, L.; Marvin, A.C.; Nothofer, A.; Alexander, M. A good practice guide for the use of GTEM cells in EMC measurements according to IEC 61000-4-20. In Proceedings of the IEEE Electromagnetic Compatibility Symposium—ISEMC, Nanjing, China, 1–4 November 2004; pp. 660–665. [Google Scholar] [CrossRef]
- IEC 61000-3-2:2005+A1:2008+A2:2009; Electromagnetic Compatibility (EMC)—Part 3-2: Limits—“Limits for Harmonic Current Emissions (Equipment input Current less than 16 A per Phase)”. IEC: Geneva, Switzerland, 2018.
- Nicolae, P.M.; Stoica, C.M.; Mihai, G. Conducted Emission Measurements for a Laptop. In Proceedings of the 2014 International Conference on Applied and Theoretical Electricity (ICATE), Craiova, Romania, 23–25 October 2014; pp. 1–5. [Google Scholar] [CrossRef]
- Rawa, M.J.H.; Thomas, D.W.P.; Sumner, M.; Chin, J.X. Source voltage, frequency and impedance variation effects on the harmonics generated from a personal computer. In Proceedings of the 6th IET International Conference on Power Electronics, Machines and Drives (PEMD 2012), Bristol, UK, 27–29 March 2012; pp. 1–6. [Google Scholar] [CrossRef]
Figure 1.
The set-up for measurement: (a) left—DAS with sensors for current; middle—DAS supplying sources; right—connectors toward laptop(s) (right) [22]; (b) Partial representation of the test setup with single/three-phase consumers connected to the secondary winding of transformers specially manufactured for these applications in toroidal forms.

Figure 2.
A period (20 ms) acquired at a sampling frequency of 80 kHz: (left)–voltage; (right)—current.
Figure 2.
A period (20 ms) acquired at a sampling frequency of 80 kHz: (left)–voltage; (right)—current.

Figure 3.
Three period (60 ms) acquired at a sampling frequency of 80 kHz: (top)—voltage; (bottom)—current [16].
Figure 3.
Three period (60 ms) acquired at a sampling frequency of 80 kHz: (top)—voltage; (bottom)—current [16].

Figure 4.
Harmonic decompositions of current in the range (0–2) kHz.

Figure 5.
Harmonic decompositions of voltage and current in the range (2–9) kHz: (top)—volage; (down)—current.
Figure 5.
Harmonic decompositions of voltage and current in the range (2–9) kHz: (top)—volage; (down)—current.

Figure 6.
Harmonic decompositions of voltages and currents within the range (9–40) kHz: (top)—voltage; (down)—current.
Figure 6.
Harmonic decompositions of voltages and currents within the range (9–40) kHz: (top)—voltage; (down)—current.


Figure 7.
Waveforms acquired with a sampling frequency of 19.2 kHz. (Left)—voltage drop across terminals, (right)—currents absorbed by EUT [16].
Figure 7.
Waveforms acquired with a sampling frequency of 19.2 kHz. (Left)—voltage drop across terminals, (right)—currents absorbed by EUT [16].

Figure 8.
Harmonic spectra of the acquired signals, containing harmonic weights exceeding 1% from the component oscillating at 50 Hz, up to the maximum harmonic of 31.
Figure 8.
Harmonic spectra of the acquired signals, containing harmonic weights exceeding 1% from the component oscillating at 50 Hz, up to the maximum harmonic of 31.

Figure 9.
Weights of active powers (top) and reactive powers (bottom) for harmonic weights exceeding 1% from the component oscillating at 50 Hz, up to the maximum harmonic of 31.
Figure 9.
Weights of active powers (top) and reactive powers (bottom) for harmonic weights exceeding 1% from the component oscillating at 50 Hz, up to the maximum harmonic of 31.

Figure 10.
Schematic of LISN for tests in the frequency range (0.15–30) MHz [29].
Figure 10.
Schematic of LISN for tests in the frequency range (0.15–30) MHz [29].

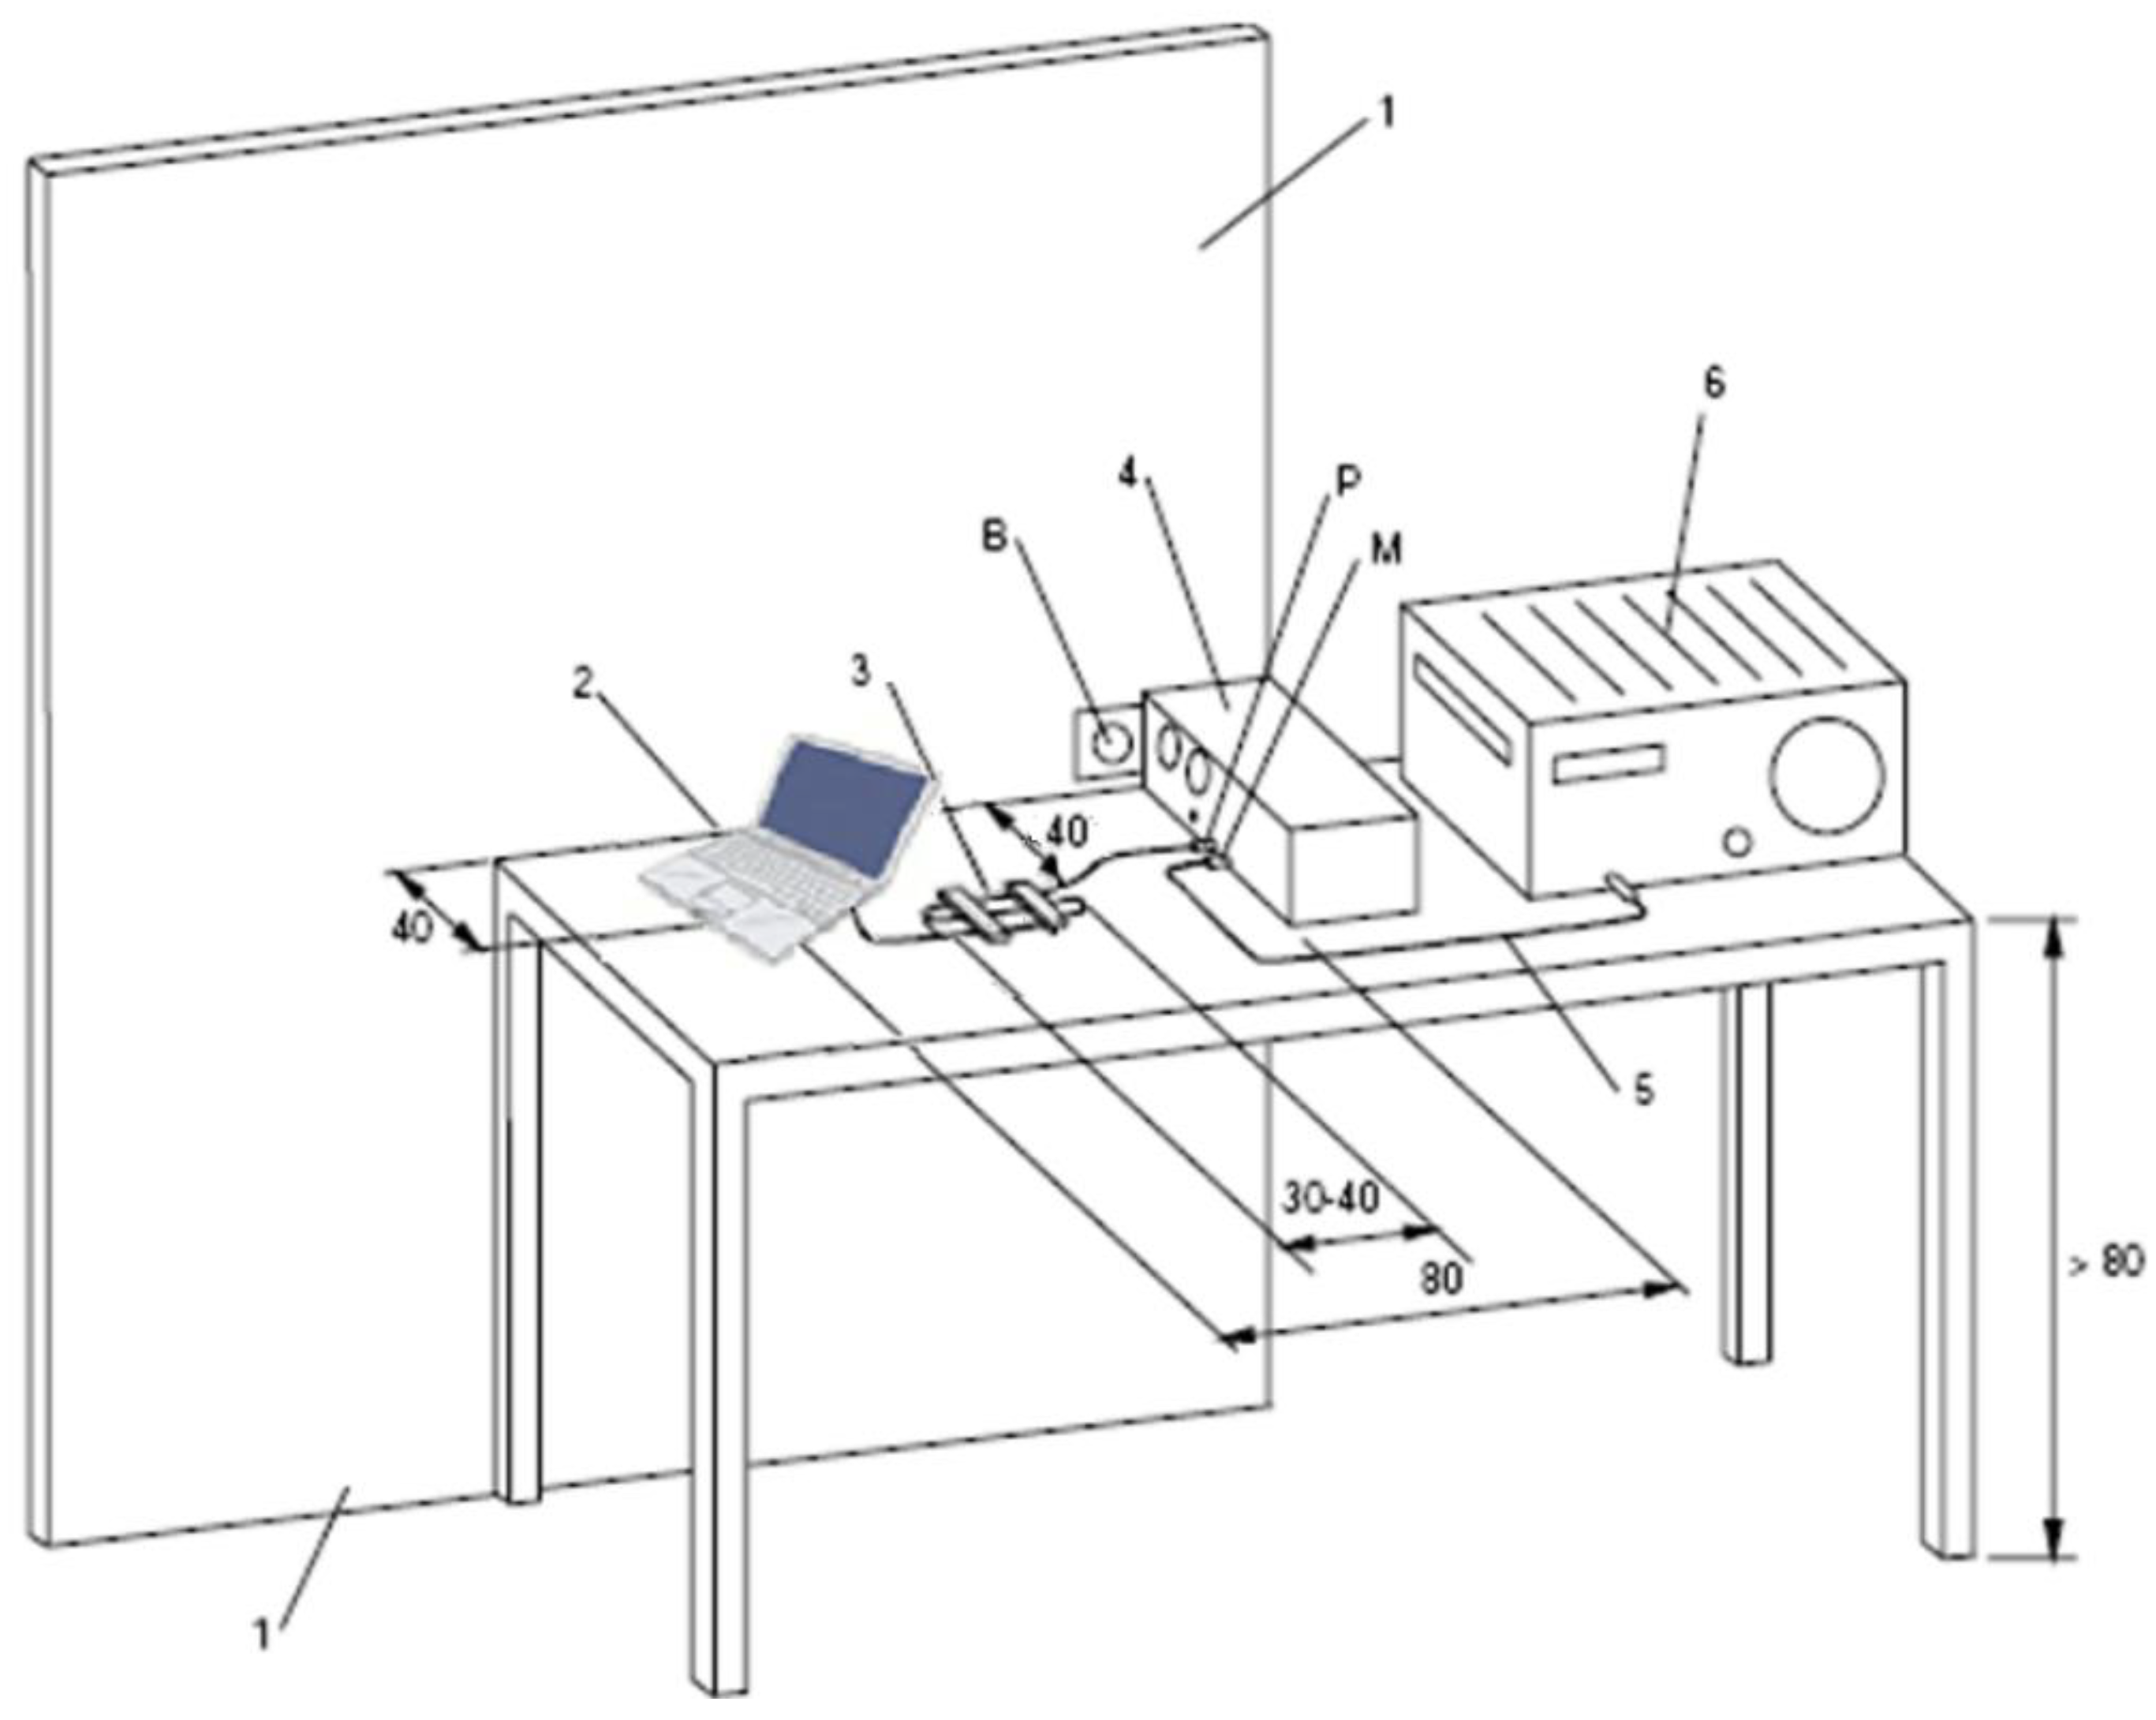
Figure 11.
The setup for the conducted emission measurement: 1—Metallic wall 2 m × 2 m; 2—EUT (laptop); 3—Excess power cord (10 m); 4—LISN; 5—Coaxial cable; 6—Measuring receiver; B—Reference ground connection; M—Measuring receiver input; P—Power to EUT [29].
Figure 11.
The setup for the conducted emission measurement: 1—Metallic wall 2 m × 2 m; 2—EUT (laptop); 3—Excess power cord (10 m); 4—LISN; 5—Coaxial cable; 6—Measuring receiver; B—Reference ground connection; M—Measuring receiver input; P—Power to EUT [29].

Figure 12.
Conducted Emission for EUT—Phase: average values—black waveform, quasi-peak values—blue waveform.
Figure 12.
Conducted Emission for EUT—Phase: average values—black waveform, quasi-peak values—blue waveform.

Figure 13.
Conducted Emission for EUT—Null wire: average values—black waveform, quasi-peak values—blue waveform.
Figure 13.
Conducted Emission for EUT—Null wire: average values—black waveform, quasi-peak values—blue waveform.

Figure 14.
The principle of a setup used to measure radiated emissions at 3 m in Semi-Anechoic Chamber [34].
Figure 14.
The principle of a setup used to measure radiated emissions at 3 m in Semi-Anechoic Chamber [34].

Figure 15.
Radiated emissions in horizontal polarization for a laptop.

Figure 16.
Radiated emissions in vertical polarization for a laptop.

Figure 17.
Configuration of equipment used for immunity tests.

Figure 18.
Schematic with the equipment used for measurement in GTEM cell 750 [36].
Figure 18.
Schematic with the equipment used for measurement in GTEM cell 750 [36].

Figure 19.
Calibration equipment used to perform immunity tests [32].
Figure 19.
Calibration equipment used to perform immunity tests [32].


Table 1.
Power quality parameters and indices for the recorded electric quantities for case 2.1.
| Parameter | Units | Value |
|---|---|---|
| Total RMS voltage—RMSV | V | 109.59 |
| Voltage RMS on fundamental harmonic—RMSV1 | V | 109.55 |
| Voltage distorting residue—U1d | V | 2.77 |
| Voltage Total Harmonic Distortion—VTHD | % | 2.53 |
| Total RMS absorbed current—RMSI | A | 0.605 |
| Current RMS on fundamental harmonic—RMSI1 | A | 0.425 |
| Current distorting residue—I1d | A | 0.429 |
| Current Total Harmonic Distortion—ITHD | % | 71.09 |
Table 2.
Power quality parameters and indices for the recorded electric quantities for case 2.2.
| Parameter | Units | Value |
|---|---|---|
| Total RMS voltage—RMSV | V | 107.32 |
| Voltage RMS on fundamental harmonic—RMSV1 | V | 107.28 |
| Voltage Total Harmonic Distortion—VTHD | % | 2.52 |
| Total RMS absorbed current—RMSI | A | 0.627 |
| Current RMS on 50 Hz-RMSI1 | A | 0.437 |
| Current Total Harmonic Distortion—ITHD | % | 71.36 |
| The Peak values for voltage—Vpeak | V | 151.58 |
| The Peak coefficients for voltage—Kpeak(V) | - | 0.413 |
| The Peak values for current—Ipeak | A | 1.767 |
| The Peak coefficients for current—Kpeak(I) | - | 2.816 |
Table 3.
Powers and power factor for case 2.2.
| Parameter | Units | Value |
|---|---|---|
| The active power (absorbed)—P | W | 43.79 |
| The active power on fundamental harmonic (absorbed)—P1 | W | 44.62 |
| The total reactive power—Q | VAr | −16.17 |
| The reactive power on fundamental harmonic—Q1 | VAr | −16.33 |
| The distorting power—D | VAd | 51.65 |
| The total apparent power—S | VA | 70.18 |
| The apparent power on fundamental harmonic—S1 | VA | 47.74 |
| Power factor—PF | - | 0.644 |
| The phase shift (voltage vs. current) for 50 Hz | degrees | −20.88 |
Table 4.
Limits of disturbance voltages at the supply terminals for equipment in class B [29].
Table 4.
Limits of disturbance voltages at the supply terminals for equipment in class B [29].
| Limits | [dB(μV/m)] | |
|---|---|---|
| Frequency Range [MHz] | Quasi-Peak | Average |
| 0.15 to 0.50 | 66 to 56 | 56 to 46 |
| 0.50 to 5 | 56 | 46 |
| 5 to 30 | 60 | 50 |
Table 5.
Limits allowed for radiated emissions by CISPR 22 (EN 55022).
| Frequency Range [MHz] | Quasi-Peak Value [dB(µV/m)] |
|---|---|
| 30–230 | 40 |
| 230–1000 | 47 |
Table 6.
Results of immunity tests (sample measurements).
| Frequency (MHz) | Generator Output (dBm) | Input Power (W) | Estimated Stress (V/m) |
|---|---|---|---|
| 80 | −5.51 | 0.28 | 30.2 |
| 150 | 1.14 | 1.3 | 30.34 |
| 193 | 3.35 | 2.16 | 30.25 |
| 222 | −5.11 | 0.31 | 30.43 |
| 314 | −7.28 | 0.18 | 30.36 |
| 420 | −8.1 | 0.15 | 30.76 |
| 536 | −5.36 | 0.29 | 30.78 |
| 621 | −8.8 | 0.29 | 30.87 |
| 685 | −5.29 | 0.29 | 30.89 |
| 792 | −5.29 | 0.18 | 30.92 |
| 874 | 1.27 | 1.33 | 30.75 |
| 917 | −3.87 | 0.41 | 30.86 |
| 1000 | 1.42 | 1.38 | 30.95 |
Publisher’s Note: MDPI stays neutral with regard to jurisdictional claims in published maps and institutional affiliations. |
© 2022 by the authors. Licensee MDPI, Basel, Switzerland. This article is an open access article distributed under the terms and conditions of the Creative Commons Attribution (CC BY) license (https://creativecommons.org/licenses/by/4.0/).
Share and Cite
MDPI and ACS Style
Nicolae, I.-D.; Nicolae, P.-M. Power Quality and Electromagnetic Compatibility Aspects at Personal Computers. Energies 2022, 15, 4661. https://doi.org/10.3390/en15134661
AMA Style
Nicolae I-D, Nicolae P-M. Power Quality and Electromagnetic Compatibility Aspects at Personal Computers. Energies. 2022; 15(13):4661. https://doi.org/10.3390/en15134661
Chicago/Turabian StyleNicolae, Ileana-Diana, and Petre-Marian Nicolae. 2022. "Power Quality and Electromagnetic Compatibility Aspects at Personal Computers" Energies 15, no. 13: 4661. https://doi.org/10.3390/en15134661
Note that from the first issue of 2016, this journal uses article numbers instead of page numbers. See further details here.