Article

Mind the Gap—A Socio-Economic Analysis on Price Developments of Green Hydrogen, Synthetic Fuels, and Conventional Energy Carriers in Germany

by
Christian Schnuelle
*,
Timo Wassermann
and
Torben Stuehrmann
Resilient Energy Systems Department, University of Bremen, Enrique-Schmidt Straße 7, 28359 Bremen, Germany
*
Author to whom correspondence should be addressed.
Energies 2022, 15(10), 3541; https://doi.org/10.3390/en15103541
Submission received: 30 March 2022 / Revised: 9 May 2022 / Accepted: 9 May 2022 / Published: 12 May 2022

Abstract

:
In recent years, the development of energy prices in Germany has been frequently accompanied by criticism and warnings of socio-economic disruptions. Especially with respect to the electricity sector, the debate on increasing energy bills was strongly correlated with the energy system transition. However, whereas fossil fuels have rapidly increased in price recently, renewable substitutes such as green hydrogen and synthetic fuels also enter the markets at comparatively high prices. On the other hand, the present fossil fuel supply is still considered too low-priced by experts because societal greenhouse gas-induced environmental impact costs are not yet compensated. In this study, we investigate the development of the price gap between conventional energy carriers and their renewable substitutes until 2050 as well as a suitable benchmark price, incorporating the societal costs of specific energy carriers. The calculated benchmark prices for natural gas (6.3 ct kWh−1), petrol (9.9 ct kWh−1), and grey hydrogen from steam methane reformation (12 ct kWh−1) are nearly 300% above the actual prices for industry customers in 2020, but below the price peaks of early 2022. In addition, the price gap between conventional fuels and green hydrogen will be completely closed before 2050 for all investigated energy carriers. Furthermore, prognosed future price developments can be considered rather moderate compared to historic and especially to the recent price dynamics in real terms. A gradual implementation of green hydrogen and synthetic fuels next to increasing CO2 prices, however, may temporarily lead to further increasing expenses for energy, but can achieve lower price levels comparable to those of 2020 in the long term.

1. Introduction

On the way to a de-fossilized energy system, the German net electricity production from renewable energy sources already reached 50.3% in 2020 [1]. In contrast, the share of renewable energies in other energy intensive sectors such as transport, heating, and industry remains still low and requires a significant increase according to (inter)national climate protection targets [2]. Besides a direct electrification of applications, green hydrogen from water electrolysis and synthetic fuels from Power-to-Fuel (PtF) processes are considered as important renewable energy carriers in these sectors. Scenarios indicate a national future green hydrogen and synthetic fuel consumption of 250–800 TWh [3]. To satisfy this high demand, large scale production capacities in Germany will be required, complemented by huge import volumes [4]. In line with this, the European Commission published “a hydrogen strategy for a climate-neutral Europe” in 2020, announcing a green hydrogen production target of up to 1 MtH2 a−1 until 2024 and above 10 MtH2 a−1 in 2030 within the European Union [5]. This strategy is accompanied by the coalition agreement of the German government, targeting an electrolysis capacity of 10 GWel until 2030 in Germany [6].
In Schnuelle et al., it was shown how a national production of green hydrogen and PtF products may enter the market in Germany [7]. With calculated production costs of up to 38.7 ct kWh−1 in 2020, these substitutes are considerably more expensive than conventional fuels such as natural gas and crude oil-based products. Other studies show comparable results [8,9,10]. As a consequence, a substitution of conventional energy carriers by the introduction of green hydrogen and synthetic fuels is suspected to cause rigorous energy price increases. However, a strong scandalization of (increasing) energy prices has already occurred in recent years [11,12,13]. The recent price jumps since the end of 2021 until today (March 2022) are further inflaming the debate on too-high costs for electricity, natural gas, and crude oil-based fuels.
Whereas the unexpected price developments for natural gas and crude oil already lead to an extraordinary high financial burden for private and commercial customers, the remaining price gap between conventional fuels and renewable substitutes may consequently cause even more intensified price debates. On the other hand, in light of current fossil energy price levels, renewable substitutes suddenly appear rather attractive in the public perception, which indicates a higher acceptance for their rapid rollout. Besides the effects of the current geopolitical tensions, conventional energy carrier prices are also expected to increase further over time. This is especially due to rising emission allowance prices within the European Union Emission Trading System (EU ETS) and newly implemented CO2 price mechanisms such as the German national Fuel Emissions Trading System (nETS). In this context, other studies analyzed when green hydrogen may reach economic competitiveness compared to fossil fuels under consideration of increasing fossil energy prices and decreasing green hydrogen production costs [14,15]. Aditiya and Aziz discuss the global socio-economic consequences of unstable mineral oil prices within the last few decades and analyze hydrogen integration potentials in the Asia-Pacific region for an enhanced energy price stability [16]. Bleischwitz et al. focused on a transition towards a European hydrogen economy from a socio-economic perspective and evaluated policy framework requirements for a successful implementation of hydrogen technologies in Europe [17]. Maack and Skulason investigated the acceptance of hydrogen applications for its large-scale integration into societal functions [18].
However, an implementation of green hydrogen and synthetic fuels will consequently enforce higher temporal energy price levels. By this means, socio-economic implications are of highest importance in light of potential economic burdens for customers on the one hand and prevention of climate change consequences on the other. Nevertheless, these aspects are usually out of scope in the literature. According to this research gap, two major questions are addressed in this work:
(1)
If conventional fuels increase in price and renewable energy carriers also feature high price levels in the future, what should be an adequate benchmark price for both types of energy supply?
(2)
To what extent do the recent as well as the expected future price developments lead to an intensified financial burden for customers?
Both questions independently address the dilemma of expectable energy price increases in the short- and medium-term. While energy price related debates are generally highly controversial within (German) society, adequate tradeoffs need to be identified to prevent enormous societal costs in the long-term, besides protecting the (national) economy from short-term energy price disruptions.
With regard to question (1), a focus is set on the environmental impact costs caused by greenhouse gas emissions. Because the production and combustion of any hydrocarbon energy carrier emits specific amounts of greenhouse gases, several studies have carried out a related monetary environmental impact assessment. Under consideration of potential environmental and societal damages as a consequence of climate change, the Federal Environment Agency (FEA) of Germany calculated environmental impact costs of 199 Euro tCO2eq−1 for the year 2020, which will gradually increase over time. Based on these findings, a suitable benchmark price representing the actual economic costs for natural gas, crude oil, petrol, and grey hydrogen from steam methane reformation (SMR) is examined in Section 2. Furthermore, the price developments of these fossil fuels, as well as for green hydrogen and synthetic fuels, are derived from 2020 until 2050 for private and commercial customers based on a literature review. The price gap between conventional fuels and their renewable substitutes is investigated with and without consideration of greenhouse gas-induced environmental impact costs.
For question (2), a detailed analysis of historic price developments over the past decades, going back to the 1950s, is carried out in Section 3. Projected price trends are compared to former price dynamics in both nominal and real prices. Especially in recent years, the above-mentioned debate on energy prices has continued to heat up. Within this debate, however, inflation effects seem to be widely neglected. Thus, we investigate whether price increases have also occurred in real terms by considering the annual consumer price index development. Furthermore, the expected future price developments until 2050 are set in relation to previous price growth rates as well as to historic inflation-adjusted energy price levels. The findings are finally compared to the evaluated price developments of Section 2, followed by conclusions in Section 4.

2. Price Projections and Consideration of Greenhouse Gas-Induced Environmental Impact Costs

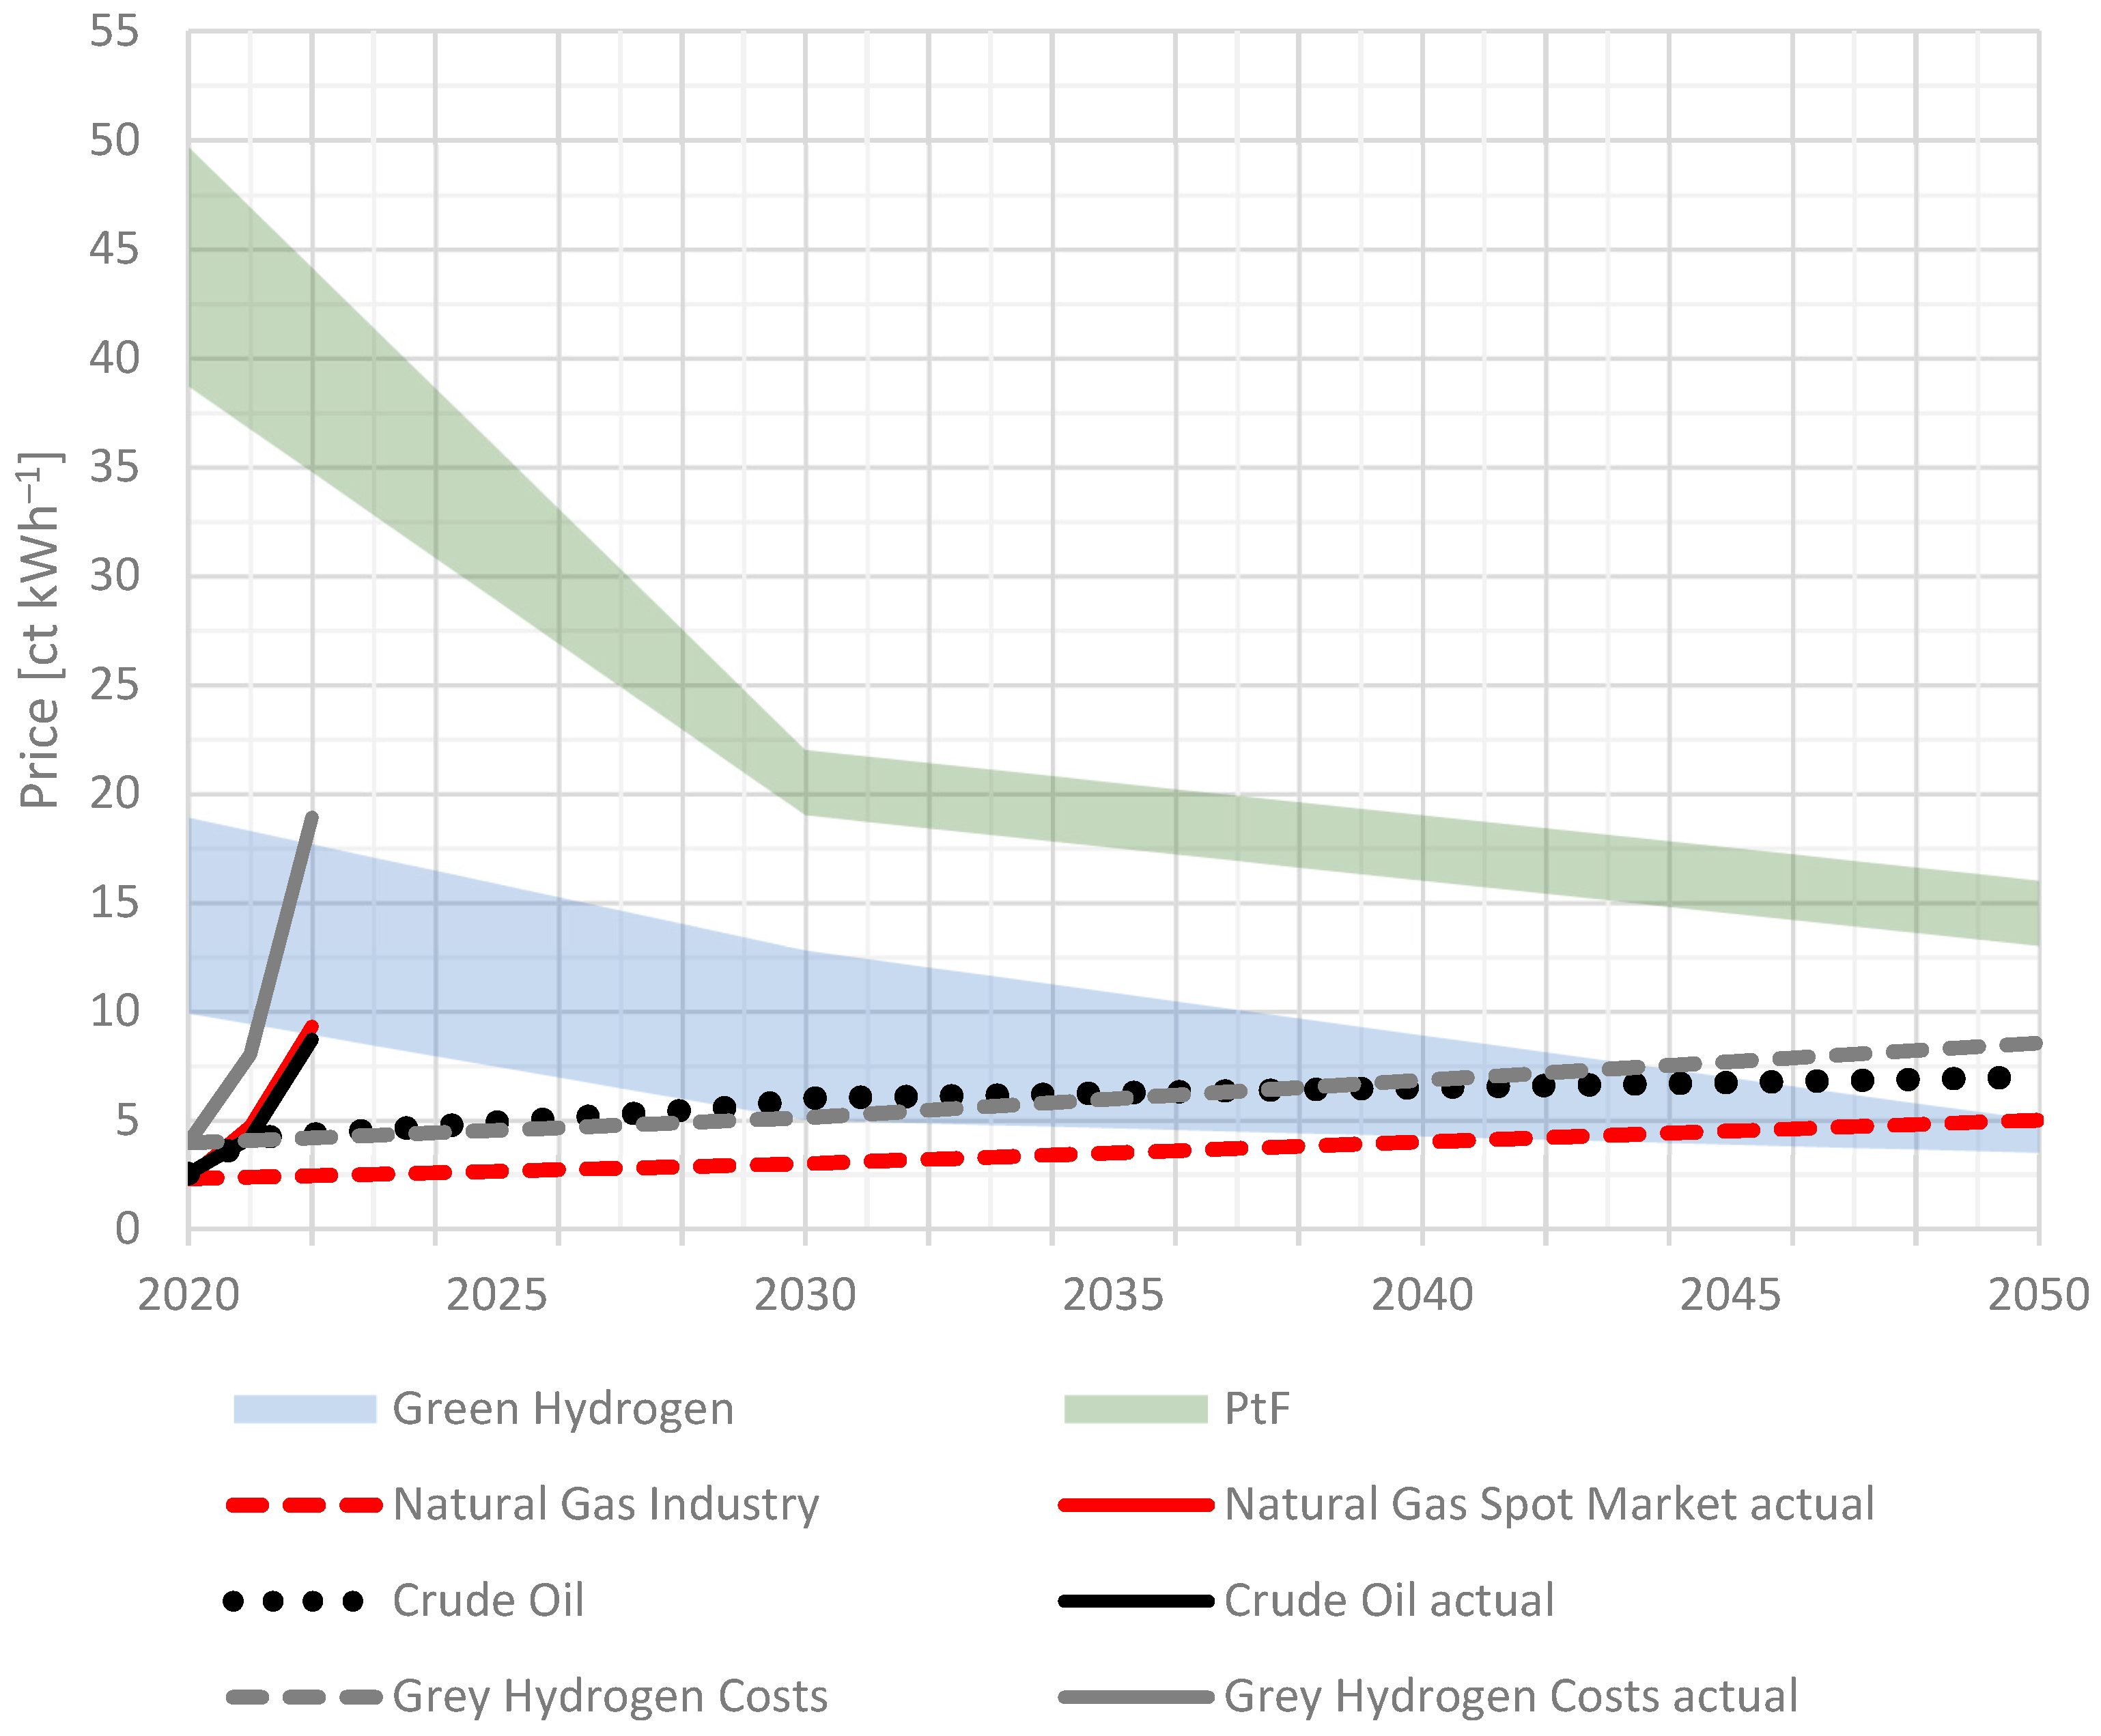
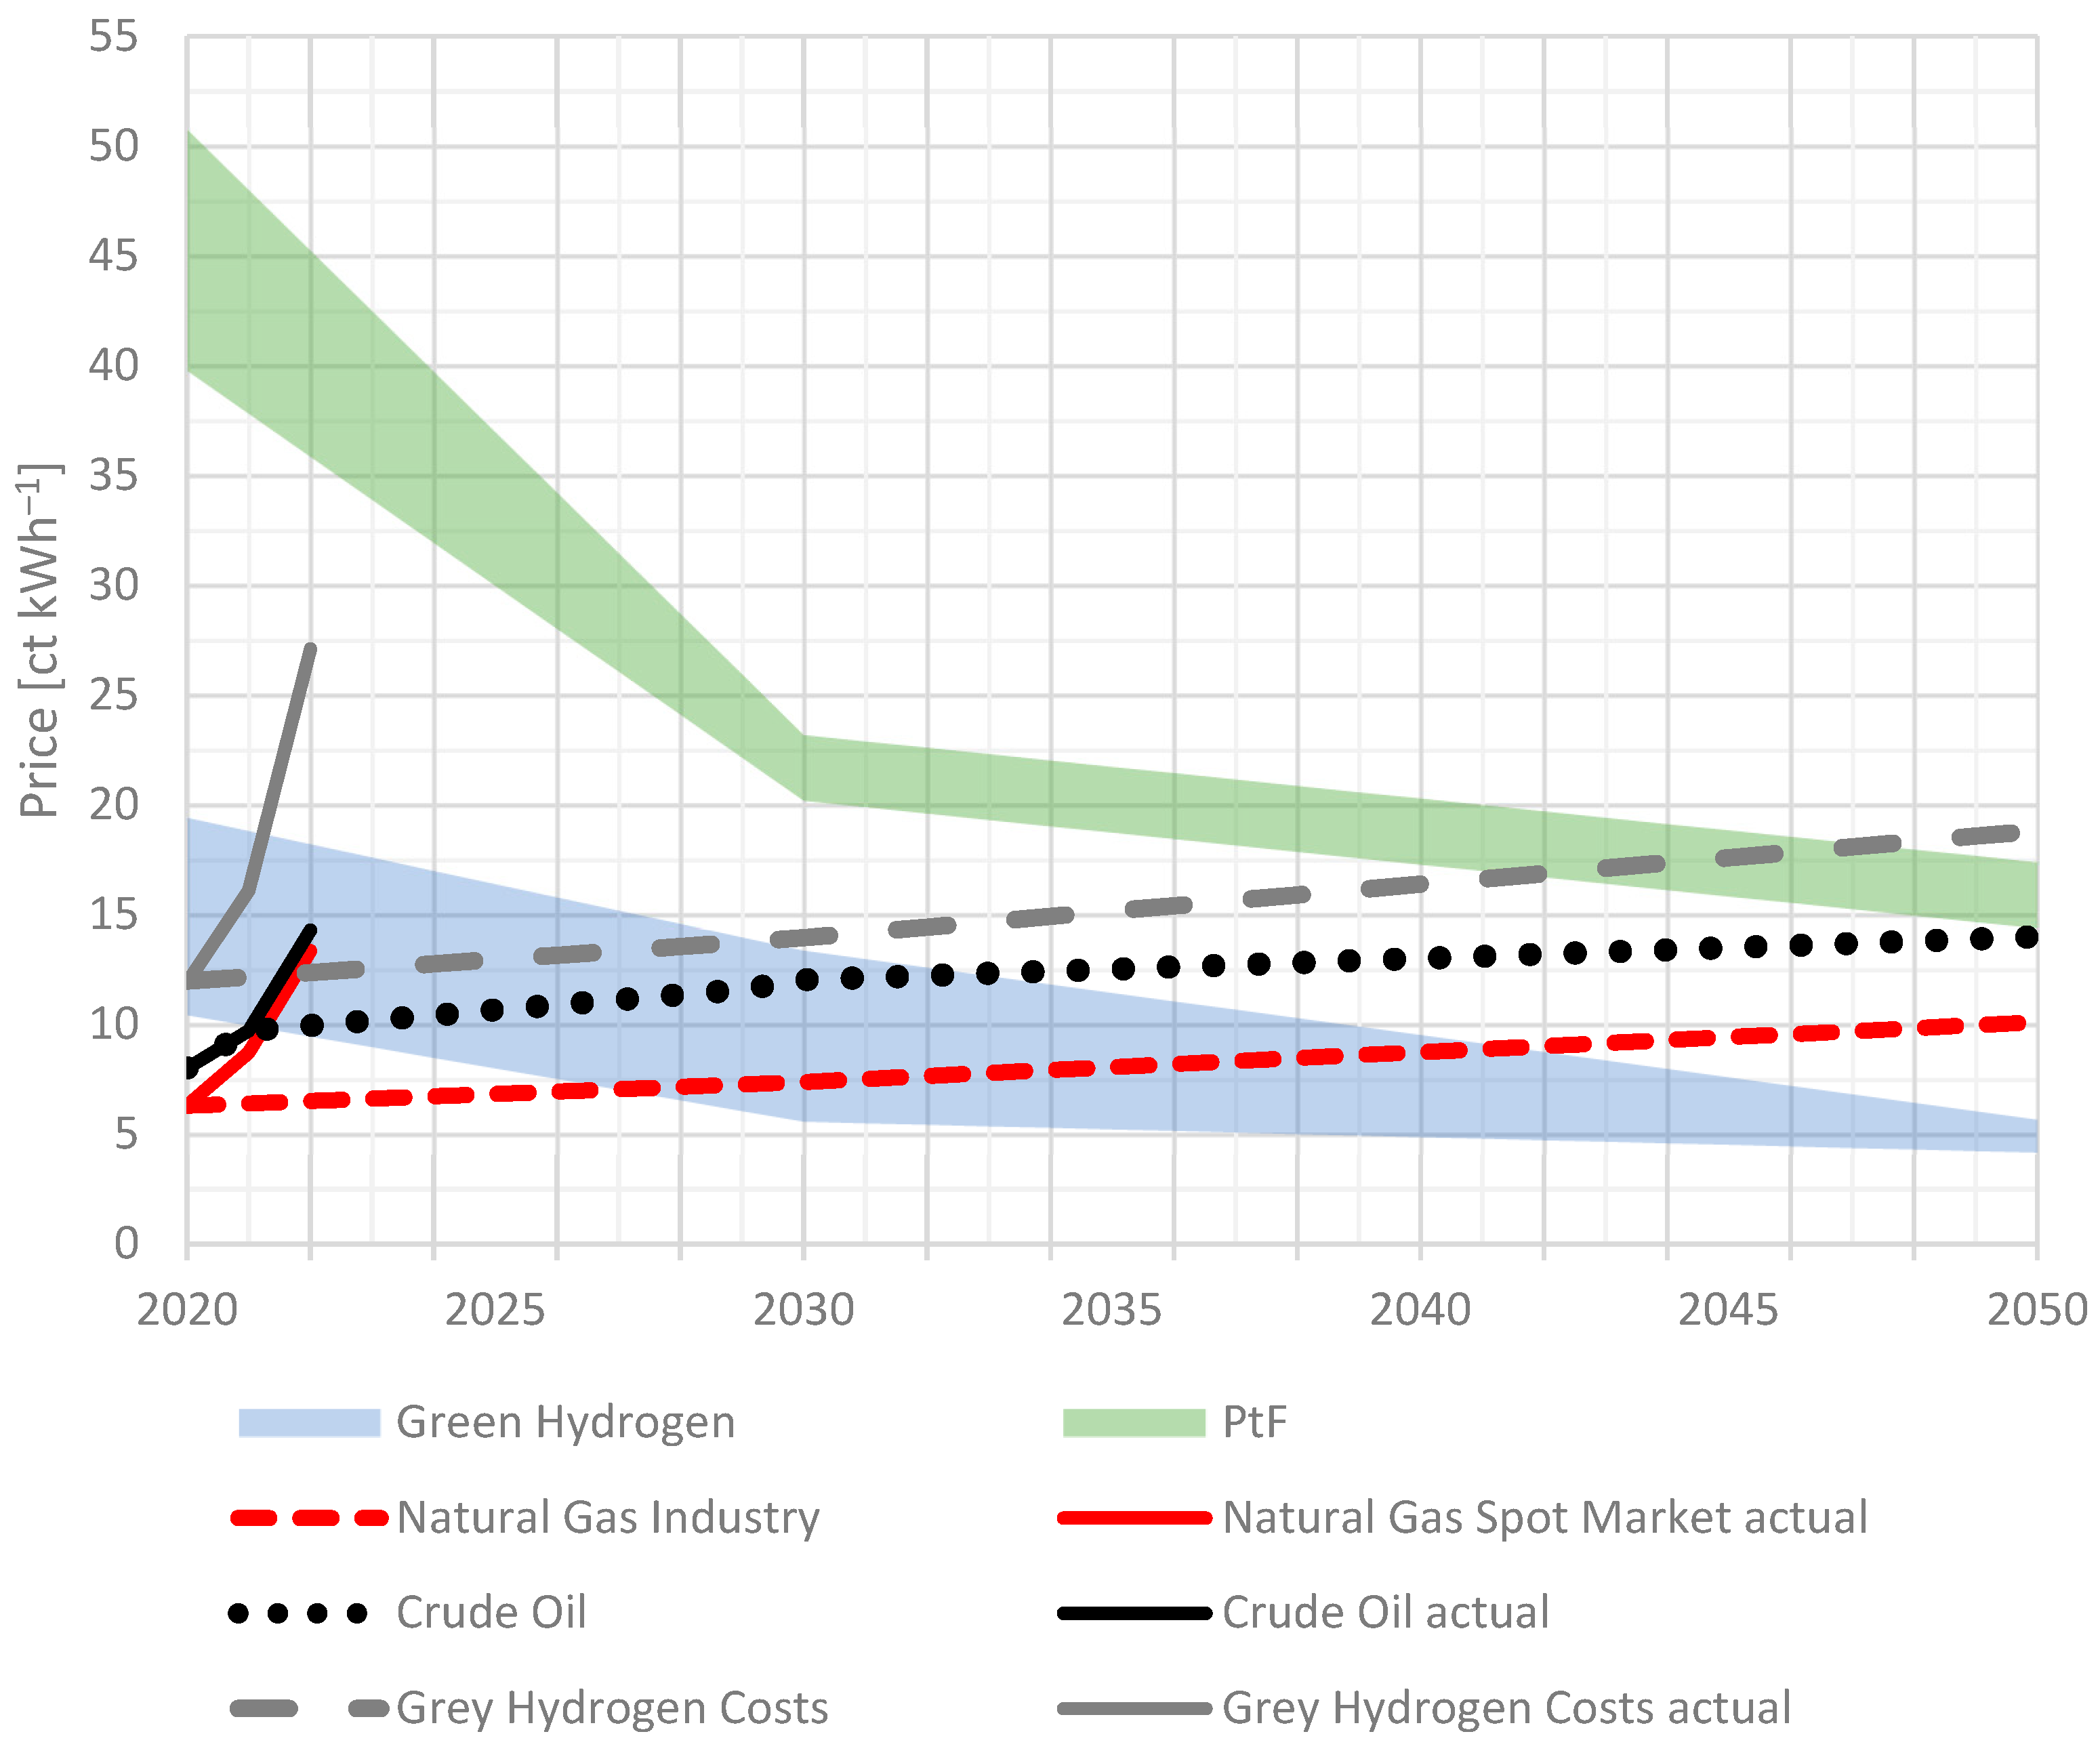
2.1. State-of-the-Art and Prospective Price Developments of Renewable and Conventional Energy Carriers in Germany

Techno-economic analyses on water electrolysis and PtF processes have been carried out by several international studies, such as [19,20,21,22,23]. In a recent study, hydrogen production costs of 25.7 ct kWh−1 for 2015 and 12.8 ct kWh−1 for 2029 were calculated. Production costs for liquid hydrocarbons from Fischer–Tropsch synthesis were calculated at 38.7 ct kWh−1 and 15.4 ct kWh−1, respectively, for the same time horizon [7]. However, a direct coupling to renewable energy facilities such as offshore windfarms was out of the scope of the study. In a further study, detailed green hydrogen production costs in northwest Germany in combination with several renewable electricity production patterns from photovoltaic (PV) and wind power were simulated [24]. Conservative electricity prices as high as the present legal renewable energy act (Erneuerbare Energien Gesetz, EEG) remuneration in Germany for modern onshore wind farms (9.3 ct kWh−1) and offshore wind farms (15.4 ct kWh−1), as well as 4.5 ct kWh−1 for old wind and PV farms, were considered. The simulation results revealed levelized costs of hydrogen of at least 13.1 ct kWh−1.
Other studies focused on current and future production costs with direct coupling to offshore wind energy in Germany while taking the actual levelized costs of electricity into account. Rudolph, Pfennig, et al. and Agora Verkehrswende state 19–22 ct kWh−1 in 2030 and 13–16 ct kWh−1 in 2050 for German synthetic fuel production with offshore wind energy [8,9,25]. Decker et al. state 9.9–18.9 ct kWh−1 and 39.3–49.7 ct kWh−1 for current offshore hydrogen and methanol production in Germany, respectively [10]. The International Energy Agency (IEA) forecasts green hydrogen production costs of 5–11 ct kWh−1 in 2030 at favorable production sites in Europe [26]. Agora Energiewende and Wuppertal Institut project hydrogen predict production costs of 12 ct kWh−1 in 2030 and 8.5 ct kWh−1 in Germany in 2050 [27]. The International Renewable Energy Agency (IRENA) investigated hydrogen production costs with direct wind or PV power supply. For average wind and PV locations production, costs range from 10.8–17.5 ct kWh−1 in 2020, 7.5–8.2 ct kWh−1 in 2030, and 3.3–5.0 ct kWh−1 in 2050 [28]. These literature-based price ranges for 2020, 2030, and 2050 are applied for further investigations in this study. The respective cost ranges are displayed and linearly interpolated in Figure 1, thus showing best- and worst-case assumptions over the considered time horizon.
In comparison to average conventional hydrogen production costs via SMR as well as to natural gas and crude oil customer prices, the renewable substitutes are only available at rather high production costs. In Europe, hydrogen from SMR production was typically available at costs of approximately 4–6 ct kWh−1 in the 2010s, strongly depending on the natural gas price, which accounts for nearly 70% of the total production costs [26]. The latter followed a declining trend for industrial customers in Germany from an intermediate peak of 3.9 ct kWh−1 in 2008 to 2.32 ct kWh−1 in 2020, excluding VAT. However, since the third quarter of 2021 a rapid multiplication of natural gas prices occurred, with peak spot market prices above 20 ct kWh−1 in March 2022 [29]. Natural gas prices for German private households ranged from 5.7–6.9 ct kWh−1 between 2012 and the beginning of 2021 and reached 6.2 ct kWh−1 by the end of 2020, including all taxes [30]. As a consequence of continual geopolitical instabilities, household prices for natural gas peaked above 16 ct kWh−1 at the beginning of 2022 [31]. Due to the tight correlation to natural gas prices, production costs of grey hydrogen increased drastically to 19 ct kWh−1 averagely in the first months of 2022 and peaked above 30.19 ct kWh−1 [32].
In light of current fossil energy price developments, former developed scenarios and price expectations appear to be rather unrealistic. However, because further price actions in correlation to geopolitical incidences are nearly unpredictable, in this investigation we adhere to the scenarios from the literature. As such, the IEA expects natural gas net prices of 3 ct kWh−1 for Europe by 2040 without consideration of increasing CO2 prices and taxes [33]. Hauser et al. simulated average cross border natural gas prices of up to 5 ct kWh−1 by 2050 [34].
Conventional liquid fuel prices strongly correlate with highly fluctuating crude oil import prices. For 2030 and 2050, Kemmler et al. expect crude oil prices of 6.0 ct kWh−1 and 6.9 ct kWh−1, respectively [35]. According to Agora Verkehrswende, the price for petrol, excluding taxes, reached 4.7 ct kWh−1 in 2020 and is expected to increase to 6.19 ct kWh−1 by 2030 and 7.63 ct kWh−1 by 2050 [8]. Actual petrol prices in March 2022, however, peaked above 11 ct kWh−1 in consequence of the war in Ukraine.
Figure 1. Expected production costs of green hydrogen and synthetic fuels up to 2050 compared to price projections for grey hydrogen, natural gas (prices for industry customers), and crude oil (dashed lines), without consideration of increasing CO2 emission costs. Prices for grey hydrogen, natural gas, and crude oil in solid lines represent the actual price developments. Linearly interpolated data based on [7,8,9,10,24,25,26,27,28,30,33,34,35,36,37].
Energies 15 03541 g001
According to Figure 1, current extreme prices for natural gas and crude oil drastically exceed scenario expectations for the upcoming decades and reach the lower production cost range of green hydrogen in 2022. Nevertheless, the scenario-based expectations for fossil energy carriers also show an increase in price over time compared to 2020. The renewable substitutes instead can achieve declining production costs due to technical improvements and economic upscaling effects among other factors. Investment costs of electrolyzers are expected to reach 200 Euro kW−1 once global capacities of 100 GW are realized [28]. Decreasing capital expenditures for electrolyzers and lower levelized costs of electricity from renewable energy sources are considered as key drivers for lower production costs of green hydrogen and synthetic fuels. In consequence and according to Figure 1, the scenario-based price gap of 5.9–14.9 ct kWh−1 between green hydrogen and grey hydrogen in 2020 could already shrink to −0.1–7.7 ct kWh−1 in 2030 and will be completely closed by 2050. The scenario-based price gap between green hydrogen and natural gas will shrink from 7.65–16.65 ct kWh−1 in 2020 to 2–9.8 ct kWh−1 in 2030 and could also be closed or even overcompensated by 2050. The production of synthetic fuels instead remains nearly 200% more expensive than the assumed prices for crude oil-based products, even in 2050. Nevertheless, production costs for synthetic fuels in 2050 may almost reach the crude oil prices of March 2022. Green hydrogen can already compete with the early 2022 fossil energy prices.

2.2. Consideration of Greenhouse Gas-Induced Environmental Impact Costs

In the above discussed price comparison, surcharges for CO2 emissions via specific regulative mechanisms are widely neglected. Besides the European Union Emission Trading System (EU ETS), several additional instruments in the form of carbon taxes and certificates have been discussed or are already implemented. In particular, the newly established German national fuel emission trading system (nEHS) is expected to lift fossil fuel prices in Germany over time. Scenarios expect CO2 emission prices up to 100 EurotCO2eq.−1 by 2050 [26,27]. Surprisingly, allowance certificates within the EU ETS already reached a temporary price of almost 100.00 Euro tCO2eq−1 in February 2022 [38].
In this work, we do not consider any specific legal CO2 certificate or tax systems, but rather greenhouse gas-induced environmental impact costs based on investigations of the German Federal Environment Agency (FEA) [39]. Under consideration of socio-economic burdens (e.g., higher expenses for healthcare, crop losses, infrastructure, and building damages) caused by extreme weather events that are related to climate change, the FEA investigated environmental impact costs of 199 Euro tCO2eq−1 for emissions caused in 2020. This value will increase over time up to 255 Euro tCO2eq−1 until 2050 and indicates that present energy prices are clearly too low.
Figure 2 displays the above-illustrated price ranges, including the additional environmental impact compensation costs of 0.0199–0.0255 ct gCO2eq−1. The assumed specific CO2 emission equivalents for the discussed energy carriers are listed in Table 1. The comparably low values for green hydrogen and synthetic fuels reflect an exclusive utilization of renewable electricity.
Under consideration of the environmental impact costs, a specific benchmark price for each discussed energy carrier can be defined (Table 1). These are calculated based on the 2020 prices for natural gas, grey hydrogen, crude oil, and petrol and on the specific CO2 emission equivalents shown in Table 1. The benchmark prices represent the actual economic costs of these energy carriers, including expenses for caused environmental and societal damages. Thus, at the latest when green hydrogen and synthetic fuels reach a price level below these benchmark prices, they can be considered beneficial for the national economy. However, in comparison with the energy prices of recent years until the first half of 2021, these price levels are far above conventional energy prices. In contrast, the calculated benchmark prices are well below the energy peak prices of early 2022, which caused dramatic disruptions in the energy markets, economies, and societies concurrently.
Figure 2 shows a rigorously shrinking and partially even closed price gap between the renewable and fossil energy carriers already today for scenario-based data. While synthetic fuels remain more expensive than fossil fuels until 2050, the price range of green hydrogen partially overlaps with grey hydrogen and crude oil already in 2020. In 2030, the lower price range of green hydrogen is also below the natural gas price. In 2050, green hydrogen is by far the cheapest energy carrier. In comparison to the real price developments and consideration of environmental impact costs, natural gas and crude oil prices range within the production cost range of green hydrogen in 2022.
On the other hand, the average green hydrogen price in 2050 is 200% above the natural gas price in 2020, but cheaper than natural gas in early 2022 and comparable to prices around 2012 (cf. Section 3). Synthetic fuel production costs in 2050 remain up to more than three times higher than the production costs of petrol in 2020. However, the synthetic fuel production costs of 2050 reach a price level comparable to the consumer price of petrol in 2020 (cf. Section 3) and to crude oil prices in 2022.

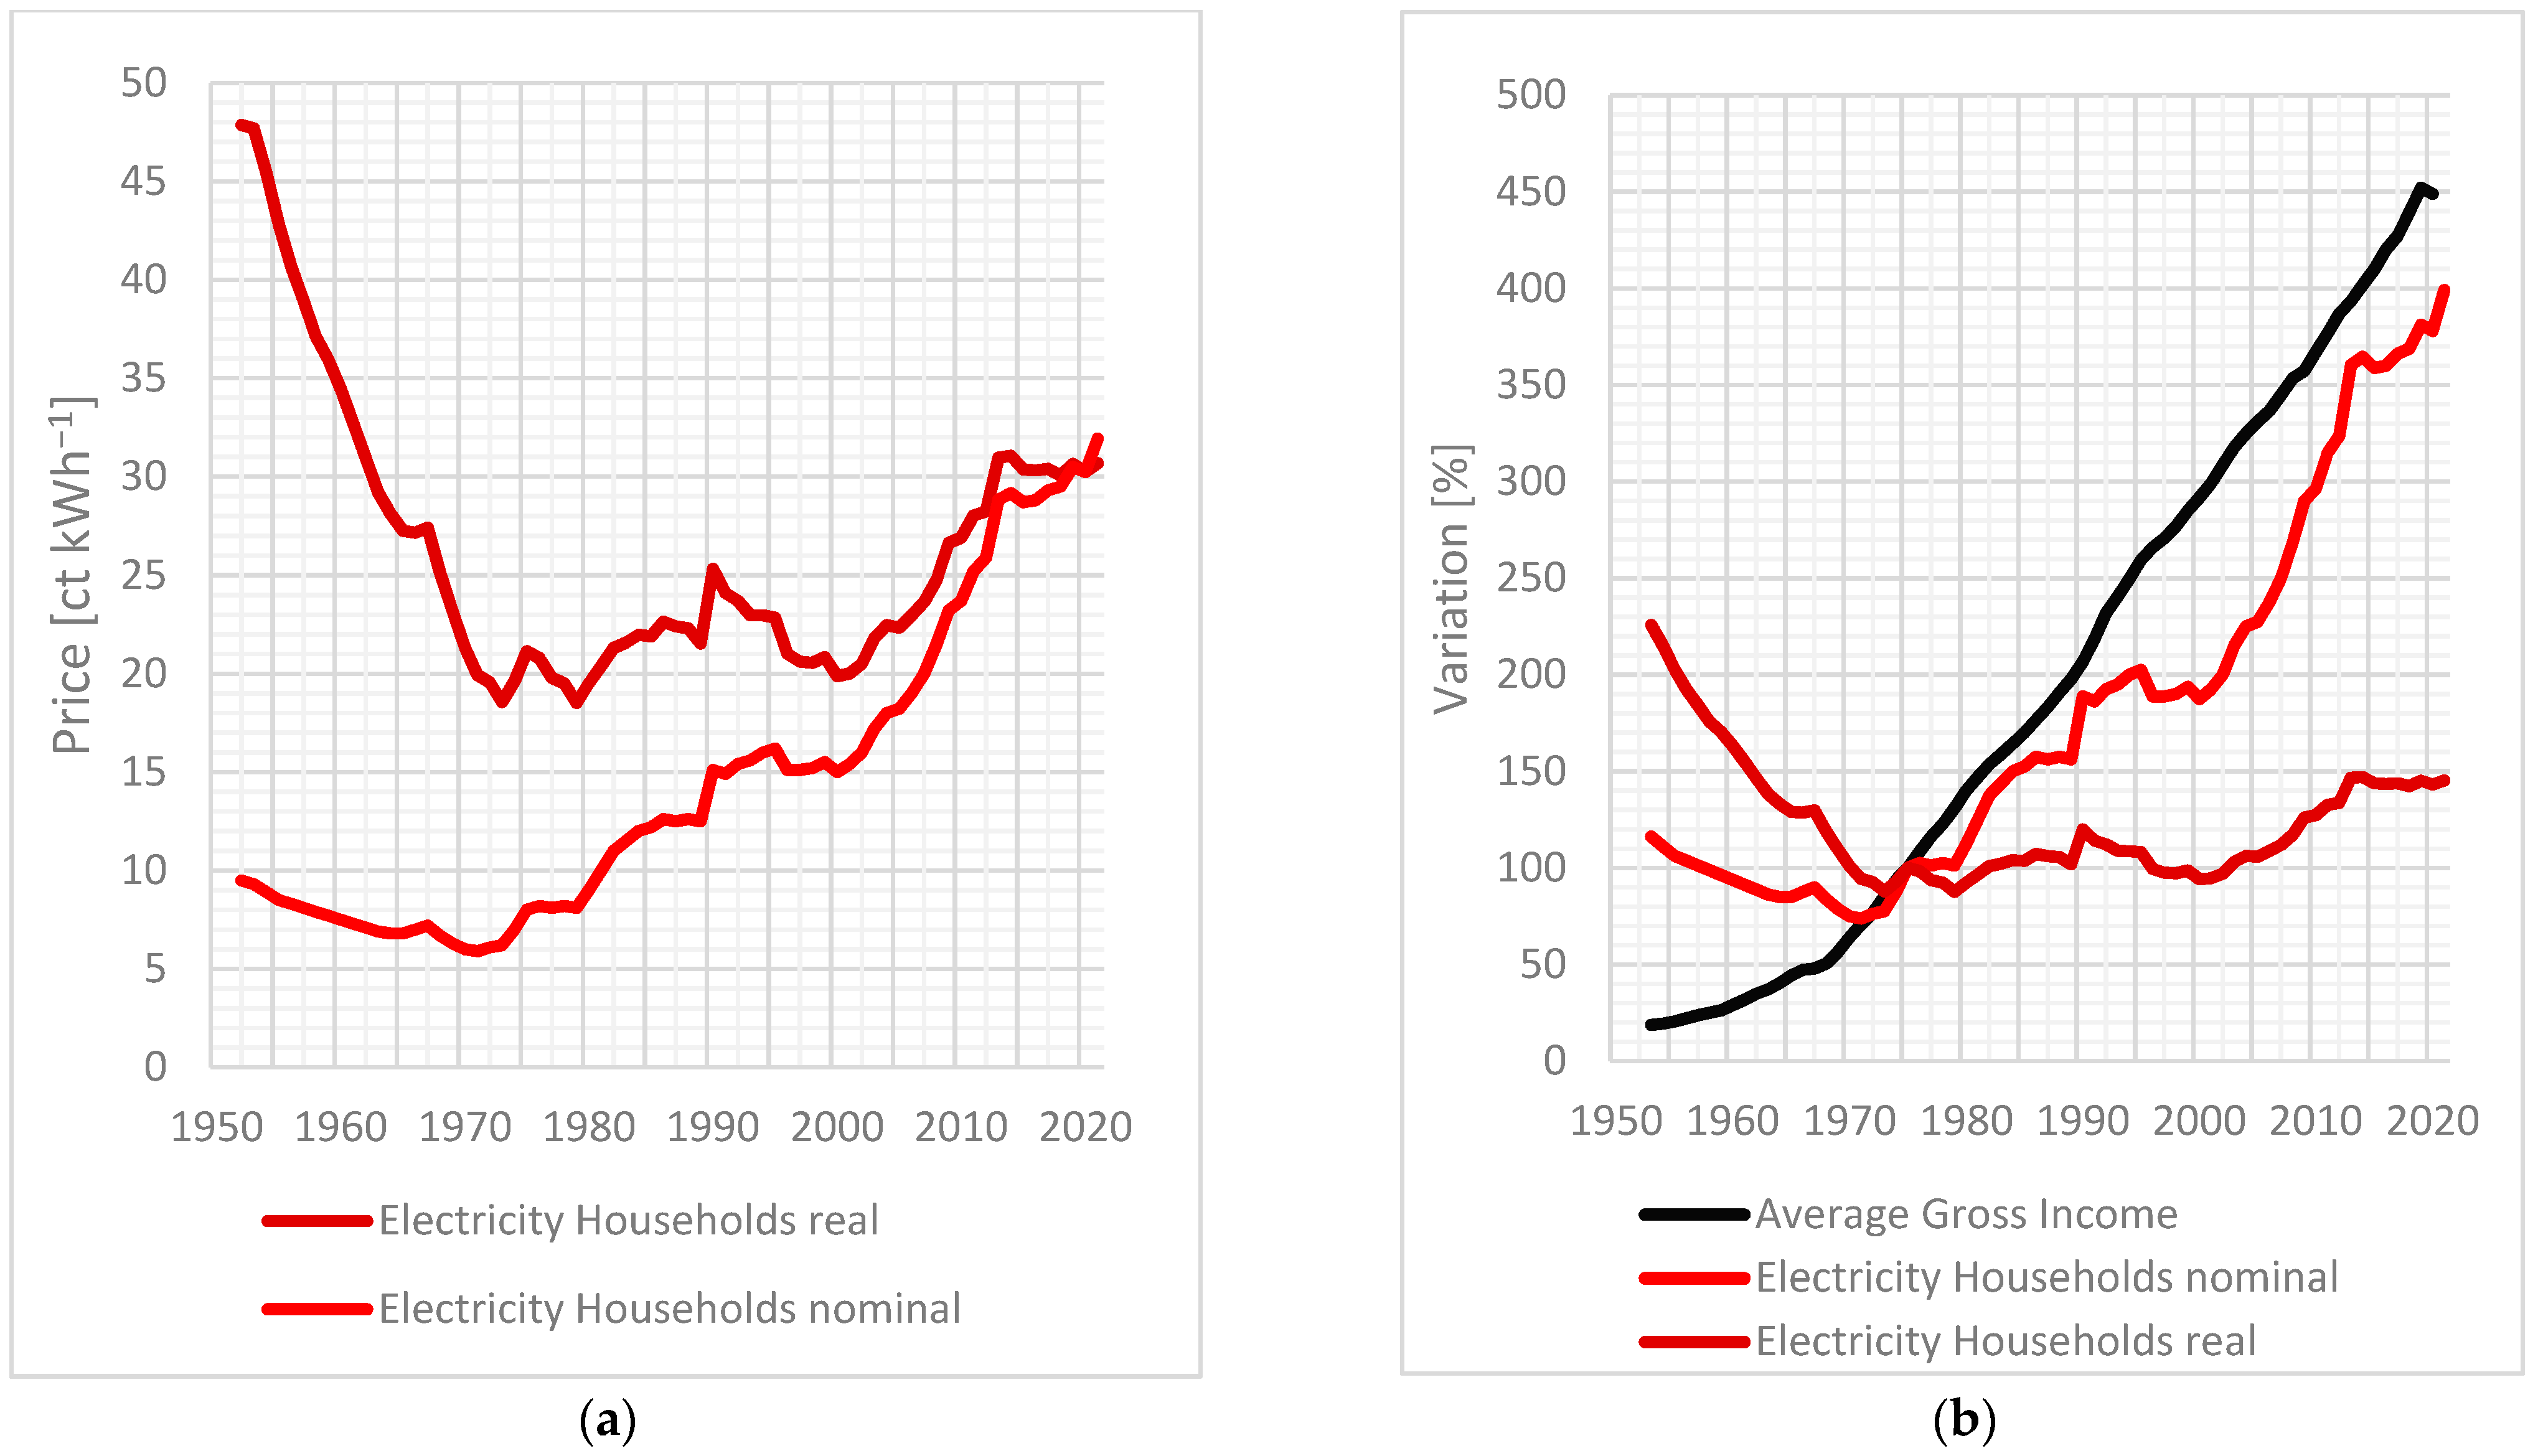
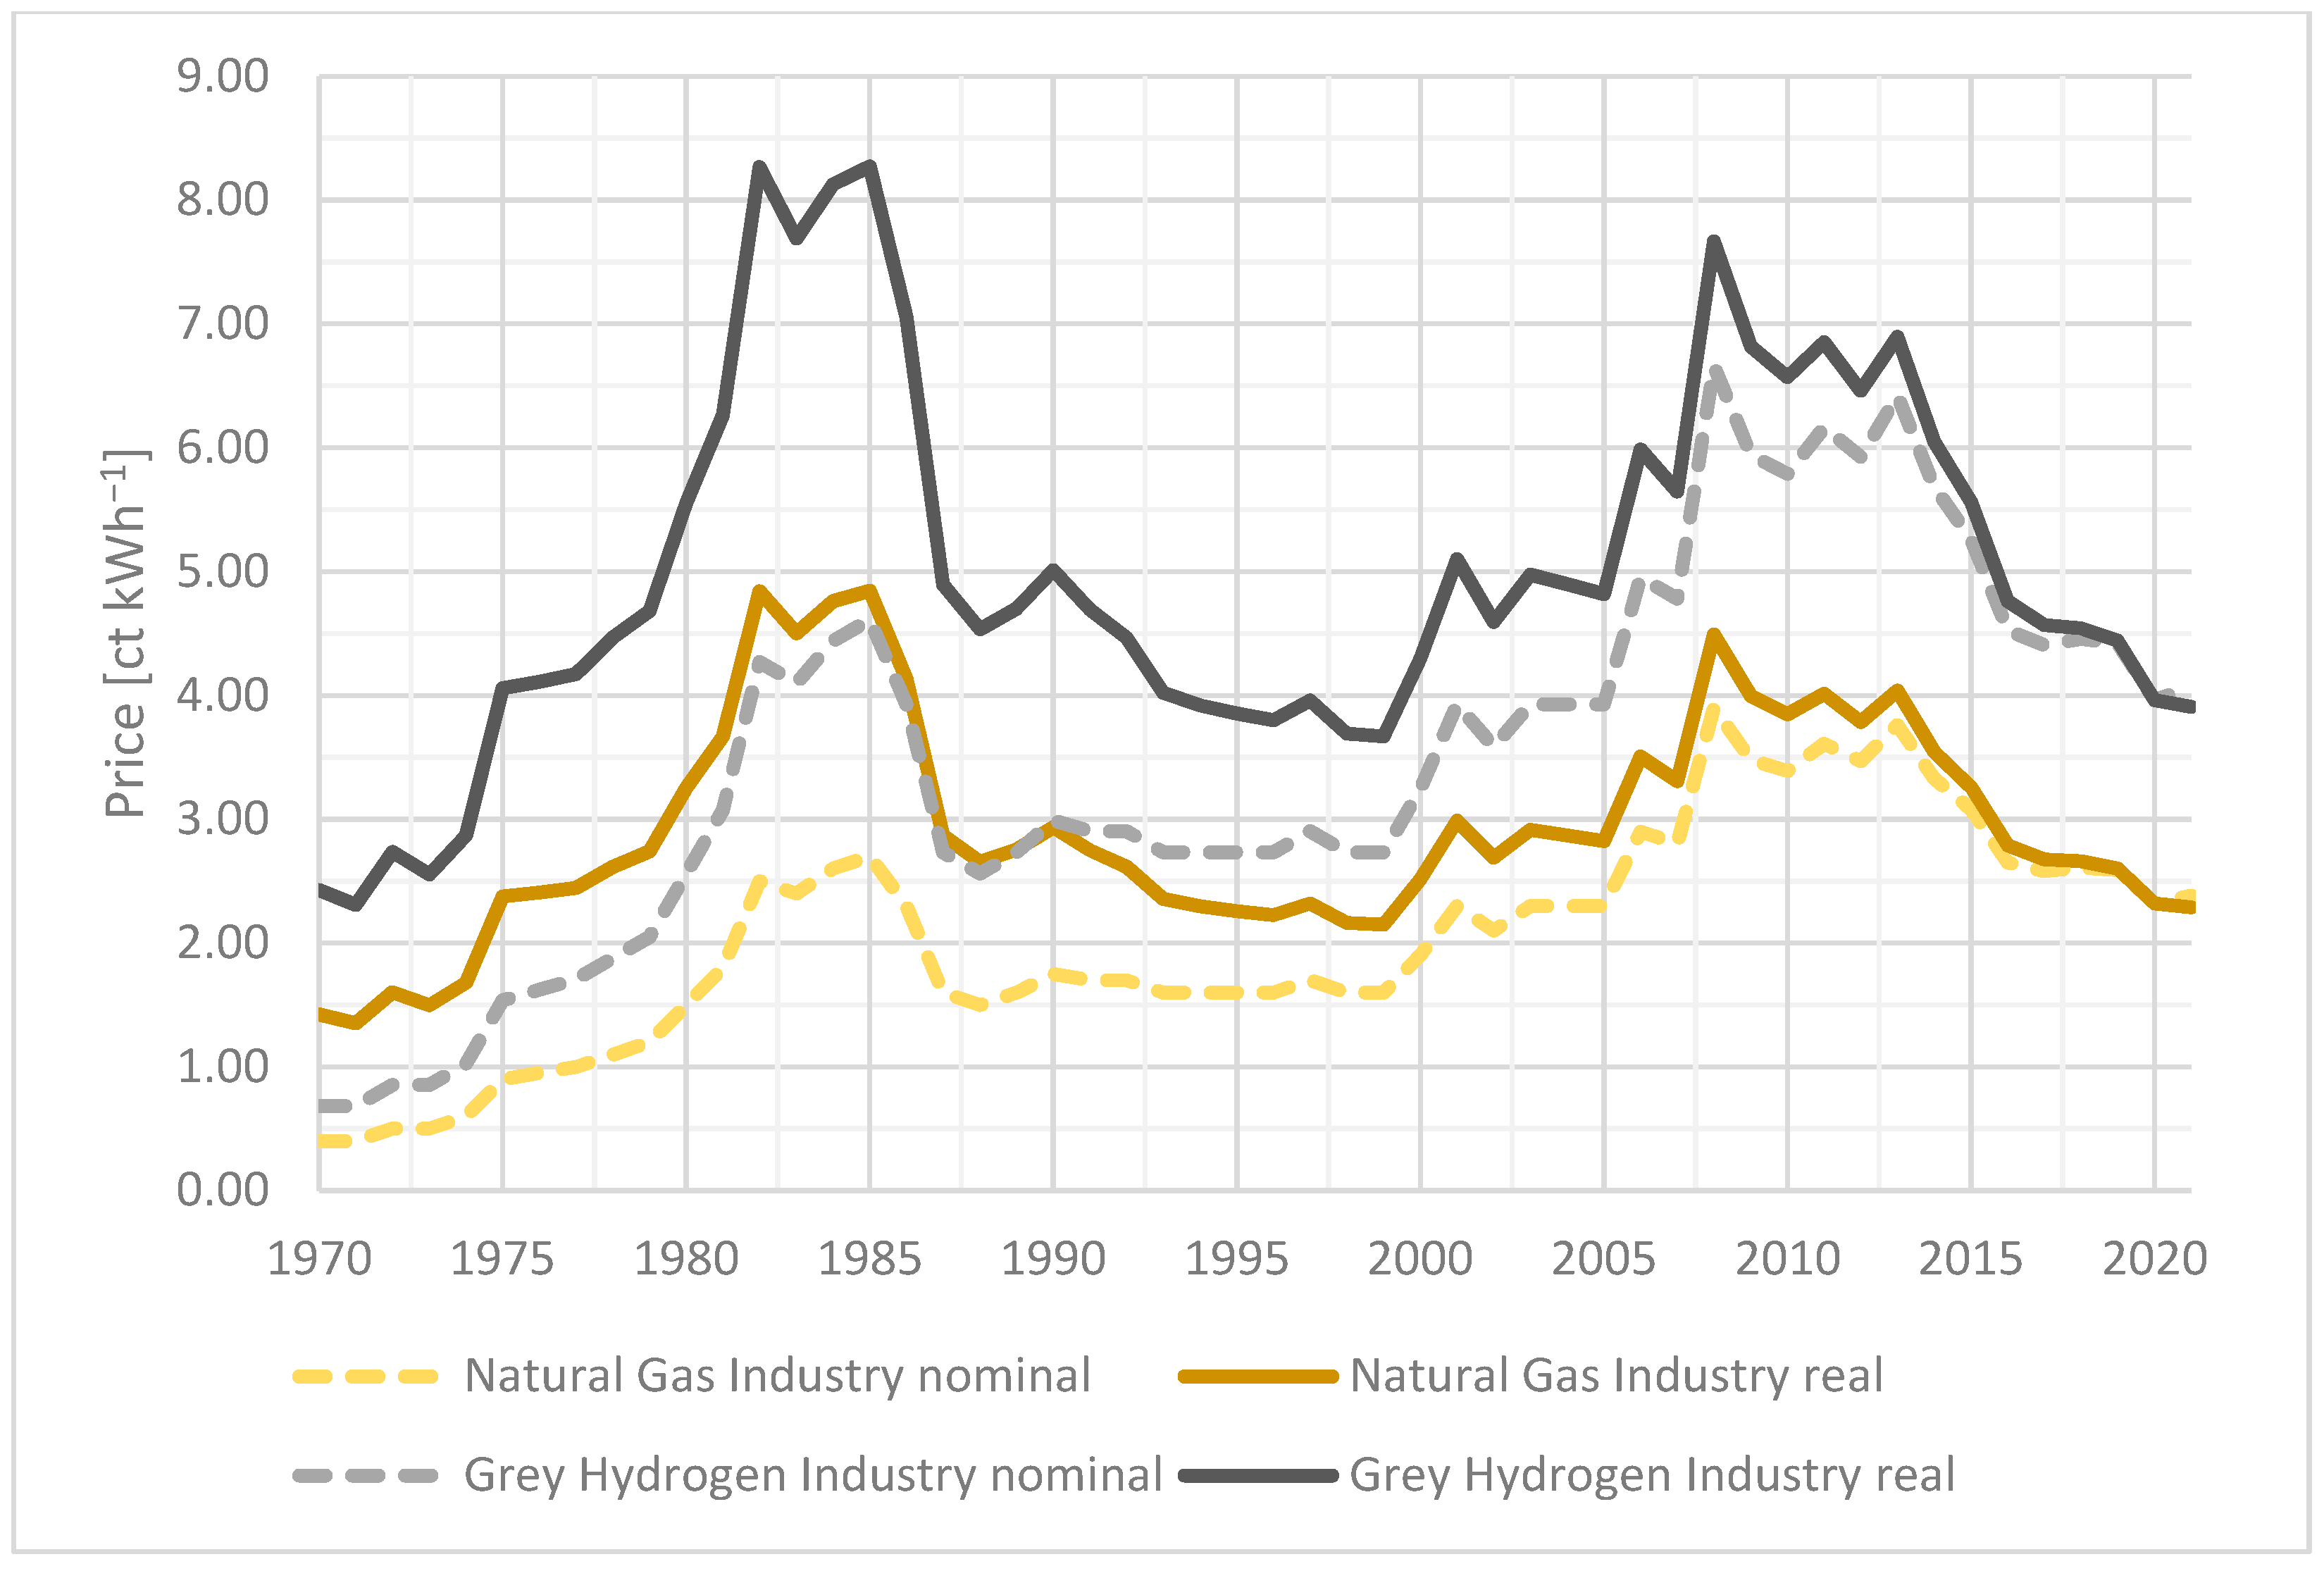
3. Discussion of Price Developments from a Socio-Economic Perspective

Commercial and private customers are apparently confronted with historically high energy prices as a consequence of steep cost increases for fossil energy carriers. Further developments are very hard to predict due to the strong correlation with ongoing geopolitical tensions. This circumstance heavily underpins that the former trust in a supply-secure and reasonably priced fossil-based energy system was rather dicey and urgent transformations are required to ensure both sustainable supply security as well as higher price stability.
Apart from these recent developments, customers also face increasing energy prices according to the findings in Section 2.1 and Section 2.2 in comparison with the energy price levels of the last decade. Furthermore, in light of socio-economic long-term costs, the defined benchmark prices indicate that the overall price level of conventionally supplied energy was significantly too low. Even though these results seem to be neither surprising nor avoidable in the context of a sustainability-orientated energy system transition, the question about how societies can handle these monetary challenges is widely open and apparently of paramount importance today. On the one hand, business companies fear (international) economic competitiveness and a loss of their business models. On the other hand, households with low incomes suffer from higher energy costs and struggle with unaffordable energy bills. The current situation shows that both issues need to be addressed with urgent care in energy-related political decisions.
In the context of rising energy prices, however, it is noteworthy that strong fluctuations also occurred in many previous decades, e.g., crude oil price peaks in 1980, 2008, and 2012. A look at historic price charts of natural gas, petrol, and electricity for private households indicates overall increasing nominal prices during previous decades (cf. Figure 3a,b). Public discussions on these developments usually intensified in times of high price growth rates. However, in the context of the German energy system transition, debates on price dynamics have previously flared up before the steep price increases that started in late 2021. Within these scandalizing debates, a special focus was put on the development of the electricity price for end consumers [42,43,44,45,46].
A strong scandalization of the steady nominal price increase of electricity since the early 2000s occurred, and critique was mainly correlated to the subsidization of conventional power plants by wind and photovoltaic energy. In fact, after a long period of stable prices in the 1990s, the average price growth rate from 2001 to 2010 was extraordinarily high at 5.4% a−1. From 2011 to 2020, prices were still increasing, but at a rather moderate average growth rate of 2.5% a−1. Looking at these developments in the context of monetary dynamics, electricity prices have hardly increased at all in recent years. Whereas the inflation rate between 2013 and 2019 averaged 0.98% a−1, the electricity price grew by only 0.82% a−1 in the same period. Thus, compared to the average consumer price basket, the electricity price increased below-average during that time and shows a slightly decreasing chart between 2013 to 2020 in real terms, followed by a slight increase in the first half of 2021 (cf. Figure 4). This indicates a rather emotionally driven debate on the development of electricity prices instead of an objective discussion during that period.
Looking at the electricity price trends further back, it can be seen that the price level of 2020 in real Euro2020 is well below that of the 1950s (Figure 4a). Figure 4b shows the development in comparison to the average gross income of German employees. Normalized to 1975, the average gross income increased by 450%, whereas electricity in Euro2020 increased by 150%. However, the electricity price can still be considered critical for households with low incomes because the growth rate of the average gross income is mainly driven by the fraction with very high incomes. Thus, despite the moderate real term price development, political action is required if low-income households are overburdened by electricity prices. The current situation, with both comparably high costs for electricity as well as for heating and mobility, displays the requirement for a financial relief. Nevertheless, it is noteworthy that the recent price dynamics are correlated to fossil energy carriers only, whereas energy from renewable sources is available at stable prices.
Historic price developments of natural gas for private households as well as for industry customers have revealed strong fluctuations since 1970 according to Figure 3a and Figure 5 as they are correlated to the fluctuating crude oil price trends. From 1971 to 1980, industry prices grew by an extraordinary 27.5% a−1 on average as a result of the oil price crisis, followed by a slight average decline of −0.27% a−1 from 1981 to 1990. In the 2000s, a high averaged growth rate of 4.7% a−1 from 2001 to 2010 was followed by an average decline of −3.6% a−1 from 2011 to 2020.
Due to the correlation with the natural gas price, production costs of grey hydrogen followed a comparable pattern. With expected natural gas prices of up to 5 ct kWh−1 in 2050, the production costs of grey hydrogen will reach a price level >8 ct kWh−1, which is comparable to its real production costs in the early 1980s. Grey hydrogen prices in March 2022 instead rose to an extraordinary 32.2 ct kWh−1 and thus clearly exceed the above stated green hydrogen production cost ranges via water electrolysis.
Nevertheless, the projected future natural gas prices come with average growth rates from 2.5–3.3% a−1 until 2050 (cf. Section 2.1). These are higher than the targeted inflation rate of 2% a−1 according to the fiscal policy strategy of the European Central Bank (ECB), but lower than the average price growth rates of the 1970s and 2000s [52]. Thus, even though the expected price developments can be considered moderate compared to earlier decades, the steadily increasing price trend urges a switch to renewable energy sources such as green hydrogen.
Regarding the development of crude oil products such as petrol since 1970, strong price fluctuations in both directions appeared occasionally, but followed an overall increasing trend. Price peaks were usually caused by international crises. While the average petrol customer price in the year 2000 was around 101 ct l−1, it reached an all-time high in 2012 with 165 ct l−1 and declined again to 129 ct l−1 in 2020 (all including taxes) (cf. Figure 3b). In real terms, petrol prices peaked during the period 2011–2013 with 171–180 ct2020/l−1 (including taxes). Crude oil reached an all-time high in 2012 with 6.7 ct kWh−1 (7.3 ct2020 kWh−1) and fell to 2.55 ct kWh−1 in 2020, followed by a new all-time high in 2022 with 8.7 ct kWh−1. Price projections until 2050 show a maximum price of <7 ct kWh−1, meaning nearly a triplication compared to 2020, but hardly any difference compared to 2012.
Looking at the expected price developments for green hydrogen and synthetic fuels, it was revealed in Section 2.1 that green hydrogen will reach comparable production costs to former natural gas prices by 2050. The defined benchmark prices in Section 2.2 for natural gas could be undercut by green hydrogen by the end of the 2020s, and those for crude oil products and grey hydrogen in the best-case assumptions already in 2020. Synthetic fuels remain clearly more expensive than crude oil price projections until 2050 but could reach production costs that are comparable to crude oil price peaks in 2022 and to consumer prices of petrol in 2020.
Actual prices for natural gas and crude oil-based products of late 2021 and early 2022 clearly overshoot short-term green hydrogen production costs. Hence, socio-economic disruptions are currently caused by the conventional energy supply system, with heavy consequences for the overall (global) economy. Commerce and industries as well as private households are confronted with partially unaffordable energy prices, leading to self-reinforcing effects for global supply chains, a decline in purchasing power, and consequentially to high inflation rates [53]. Instead, a gradual implementation of the renewable substitutes is unlikely to cause such sudden price surges and economic constraints; as for the application of green hydrogen, a gradual incorporation into industrial processes is planned to stepwise substitute grey hydrogen and hydrocarbon-based fuels. In the mobility sector, hydrogen fueling stations usually deliver a mix with increasing shares of green hydrogen. Synthetic fuels can be implemented as drop-in fuels, e.g., in the aviation sector, with increasing shares over time. Thus, even under the assumption of decreasing energy prices back to early 2021 levels, the (intermediate) higher expenses for the renewable substitutes should not cause heavy price surges for customers. In addition, to support both a straightforward implementation of renewable energies in all sectors as well as moderate energy prices, strong financial incentives via subsidization mechanisms should be applied anyway.

4. Conclusions

It was shown that, contrary to what is often portrayed in energy price debates, there have hardly been any drastic price increases for electricity, natural gas, or crude oil-based fuels in recent years prior to the energy crisis beginning in the second half of 2021. Moreover, all discussed products were significantly more expensive in earlier periods. Especially under consideration of the developments of gross incomes and the consumer price index, there can be no evidence-based talk of an excessive financial burden from energy prices for the average customer until the first half of 2021.
Instead of energy being too expensive, in a holistic view the problem is the generally too-low overall energy price level in comparison to the determined benchmark prices, entailing high downstream costs in the long-term. In addition, the recent extremely high energy price levels show that the fossil-based energy supply is rather fragile in times of geopolitical crises and can cause recessions for whole economies as a consequence of sudden unpredictable price surges. The implementation of renewable substitutes such as green hydrogen and synthetic fuels alongside expanding efficiency measures and an increased direct electrification, as well as high renewable power generation capacities, can enable both lower long-term downstream costs as well as better price stabilities.
In Schnuelle et al., it was stated that a large-scale implementation of green hydrogen and synthetic fuels in Germany may cause additional national energy costs of 10–100 billion Euro a−1 compared to an ongoing fossil fuel supply at constant price conditions at 2020 price levels [54]. However, by applying the above-discussed environmental impact costs to the overall German greenhouse gas emissions of 2019, a hypothetic bill as high as 156 billion Euro arises and thus causes considerably higher annual expenses for the German economy.
The calculated benchmark prices are well above historic price peaks, but lower than the recent price peaks in the first quarter of 2022, which caused high financial burdens for private and commercial customers. Because the renewable substitutes also come at comparably high prices in the short-term, policy makers need to consider how to financially relieve customers and concurrently promote a rapid implementation. In this context, policy measures should focus on the promotion of energy savings in the form of sufficiency and efficiency measures as well as an adaption to more climate-friendly behavior patterns, e.g., motivation to use public transport instead of own cars. This could be realized via a carbon tax system, as already implemented in Canada and Switzerland, and proposed by Bach et al., which provide an indirect fixed refund per capita in the form of a ‘climate bonus’ [55]. Typical further instruments can be financial compensations at least for low incomes or prohibitive tariffs for commodities that are produced in a fossil energy-based supply chain. In the medium and long-term, such efforts will pay off as green hydrogen is expected to become the cheapest fuel of those considered in this study over time, with a steep cost degression of approximately 32% from 2022 till 2030.

Author Contributions

Conceptualization, C.S., T.W. and T.S.; methodology, C.S.; validation, T.W. and T.S.; formal analysis, C.S.; investigation, C.S.; resources, C.S. and T.W.; data curation, C.S. and T.W.; writing—original draft preparation, C.S.; writing—review and editing, T.W. and T.S.; visualization, C.S.; supervision, C.S.; project administration, C.S. and T.W.; funding acquisition, C.S., T.W. and T.S. All authors have read and agreed to the published version of the manuscript.

Funding

This research was funded by the German Federal Ministry for Economic Affairs and Climate Action within the KEROSyN100 project (funding code 03EIV051A) and the Federal State of Bremen and the European Union within the H2B project (funding code AUF0013A).

Institutional Review Board Statement

Not applicable.

Informed Consent Statement

Not applicable.

Data Availability Statement

Not applicable.

Conflicts of Interest

The authors declare no conflict of interest. The funders had no role in the design of the study; in the collection, analyses, or interpretation of data; in the writing of the manuscript; or in the decision to publish the results.

References

  1. Fraunhofer ISE. Jährlicher Anteil erneuerbarer Energien an der Stromerzeugung in Deutschland, Energy Charts. 2021. Available online: https://energy-charts.info/charts/renewable_share/chart.htm?l=de&c=DE&interval=year (accessed on 11 October 2021).
  2. Umweltbundesamt. Zeitreihen zur Entwicklung der Erneuerbaren Energien in Deutschland, Dessau-Roßlau. 2021. Available online: https://www.umweltbundesamt.de/themen/klima-energie/erneuerbare-energien/erneuerbare-energien-in-zahlen#uberblick (accessed on 11 October 2021).
  3. Ueckerdt, F.; Pfluger, B.; Odenweller, A.; Günther, C.; Knodt, M. Durchstarten trotz Unsicherheiten: Eckpunkte einer Anpassungsfähigen Wasserstoffstrategie; Ariadne-Kurzdossier: Potsdam, Germany, 2021. [Google Scholar]
  4. Wuppertal Institut. Verkehrswende für Deutschland: Der Weg zu CO2-Freier Mobilität bis 2035; Greenpeace: Hamburg, Germany, 2017. [Google Scholar]
  5. European Commission. Communication from the Commission to the European Parliament, the Council, the European Economic and Social Committee and the Committee of the Regions-A hydrogen Strategy for a Climate-Neutral Europe, Brussels. 2020. Available online: https://ec.europa.eu/energy/sites/ener/files/hydrogen_strategy.pdf (accessed on 20 April 2022).
  6. Sozialdemokratische Partei Deutschlands (SPD), Bündnis 90/Die Grünen, Freie Demokratische Partei (FDP). Mehr Fortschritt wagen-Bündnis für Freiheit, Gerechtigkeit und Nachhaltigkeit. Koalitionsvertrag 2021–2025, Berlin. 2021. Available online: https://www.spd.de/fileadmin/Dokumente/Koalitionsvertrag/Koalitionsvertrag_2021-2025.pdf (accessed on 20 April 2022).
  7. Schnuelle, C.; Kisjes, K.; Stuehrmann, T.; Thier, P.; Nikolic, I.; von Gleich, A.; Goessling-Reisemann, S. From Niche to Market—An Agent-Based Modeling Approach for the Economic Uptake of Electro-Fuels (Power-to-Fuel) in the German Energy System. Energies 2020, 13, 5522. [Google Scholar] [CrossRef]
  8. Energiewende, A.; Verkehrswende, A.; Frontier Economics Ltd. Die Zukünftigen Kosten Strombasierter Synthetischer Brennstoffe. 2018. Available online: https://www.agora-energiewende.de/fileadmin/Projekte/2017/SynKost_2050/Agora_SynCost-Studie_WEB.pdf (accessed on 18 November 2021).
  9. Rudolph, F. Der Beitrag von synthetischen Kraftstoffen zur Verkehrswende: Optionen und Prioritäten. 2019. Available online: https://www.greenpeace.de/publikationen/kurzstudie_kraftstoffe_verkehrswende.pdf (accessed on 18 November 2021).
  10. Decker, M.; Schorn, F.; Can, R.; Peters, R.; Stolten, D. Off-grid power-to-fuel systems for a market launch scenario—A techno-economic assessment. Appl. Energy 2019, 250, 1099–1109. [Google Scholar] [CrossRef]
  11. Verband der Chemischen Industrie. Energiepreise Explodieren. 2021. Available online: https://www.vci.de/themen/energie-klima/energiepolitik/strom-und-erdgas-werden-immer-teurer-energiepreise-explodieren.jsp (accessed on 19 November 2021).
  12. Bockenheimer, J.C. Energiepreise Explodieren! Regierung Lässt uns mit TEUER-SCHOCK Allein, Bild Zeitung. 2021. Available online: https://www.bild.de/geld/wirtschaft/wirtschaft/energiepreise-explodieren-regierung-laesst-uns-mit-teuer-schock-allein-78059692.bild.html (accessed on 19 November 2021).
  13. Müller, K. Wer soll das noch Bezahlen? Beim Heizen droht uns der Teuerste Winter aller Zeiten. Focus Online. 2021. Available online: https://www.focus.de/finanzen/news/verrueckte-energiepreise-wer-soll-das-noch-bezahlen-beim-heizen-droht-uns-der-teuerste-winter-aller-zeiten_id_24306345.html (accessed on 20 November 2021).
  14. Agora Energiewende and Guidehouse. Making Renewable Hydrogen Cost-Competitive: Policy Instruments for Supporting Green H2. 2021. Available online: https://static.agora-energiewende.de/fileadmin/Projekte/2020/2020_11_EU_H2-Instruments/A-EW_223_H2-Instruments_WEB.pdf (accessed on 15 March 2022).
  15. Dovan, D.J.; Dolanc, G. Can Green Hydrogen Production Be Economically Viable under Current Market Conditions. Energies 2020, 13, 6599. [Google Scholar] [CrossRef]
  16. Aditiya, H.; Aziz, M. Prospect of hydrogen energy in Asia-Pacific: A perspective review on techno-socio-economy nexus. Int. J. Hydrogen Energy 2021, 46, 35027–35056. [Google Scholar] [CrossRef]
  17. Bleischwitz, R.; Bader, N.; Trümper, S. The socio-economic transition towards a hydrogen economy. Energy Policy 2010, 38, 5297–5300. [Google Scholar] [CrossRef]
  18. Maack, M.; Skulason, J. Implementing the Hydrogen Economy. J. Clean. Prod. 2006, 14, 52–64. [Google Scholar] [CrossRef]
  19. König, D.H.; Freiberg, M.; Dietrich, R.-U.; Wörner, A. Techno-economic study of the storage of fluctuating renewable energy in liquid hydrocarbons. Fuel 2015, 159, 289–297. [Google Scholar] [CrossRef] [Green Version]
  20. Dieterich, V.; Buttler, A.; Hanel, A.; Spliethoff, H.; Fendt, S. Power-to-liquid via synthesis of methanol, DME or Fischer–Tropsch-fuels: A review. Energy Environ. Sci. 2020, 13, 3207–3252. [Google Scholar] [CrossRef]
  21. Brynolf, S.; Taljegard, M.; Grahn, M.; Hansson, J. Electrofuels for the transport sector: A review of production costs. Renew. Sustain. Energy Rev. 2018, 81, 1887–1905. [Google Scholar] [CrossRef]
  22. Tenhumberg, N.; Büker, K. Ecological and Economic Evaluation of Hydrogen Production by Different Water Electrolysis Technologies. Chem. Ing. Tech. 2020, 92, 1586–1595. [Google Scholar] [CrossRef]
  23. Weimann, L.; Gabrielli, P.; Boldrini, A.; Kramer, G.J.; Gazzani, M. Optimal hydrogen production in a wind-dominated zero-emission energy system. Adv. Appl. Energy. 2021, 3, 100032. [Google Scholar] [CrossRef]
  24. Schnuelle, C.; Wassermann, T.; Fuhrlaender, D.; Zondervan, E. Dynamic Hydrogen Production from PV & Wind Direct Electricity Supply—Modeling and Techno-Economic Assessment. Int. J. Hydrogen Energy 2020, 45, 29938–29952. [Google Scholar] [CrossRef]
  25. Pfennig, M.; Gerhardt, N.; Pape, C.; Böttger, D. Mittel- und Langfristige Potentiale von PTL- und H2-Importen aus Internationalen EE-Vorzugsregionen-Teilbericht, Kassel; Fraunhofer IWES: Hamburg, Germany, 2017. [Google Scholar]
  26. International Energy Agency. The Future of Hydrogen-Seizing Today’s Opportunities. 2019. Available online: https://iea.blob.core.windows.net/assets/9e3a3493-b9a6-4b7d-b499-7ca48e357561/The_Future_of_Hydrogen.pdf (accessed on 18 December 2021).
  27. Joas, F.; Witecka, W.; Lenck, T.; Peter, F.; Seiler, F.; Samadi, S.; Schneider, C.; Holtz, G.; Kobiela, G.; Lechtenböhmer, S.; et al. Klimaneutrale Industrie: Schlüsseltechnologien und Politikoptionen für Stahl, Chemie und Zement; Agora Energiewende: Berlin, Germany, 2020. [Google Scholar]
  28. IRENA. Hydrogen: A Renewable Energy Perspective; International Renewable Energy Agency: Abu Dhabi, United Arab Emirates, 2019; ISBN 978-92-9260-151-5. [Google Scholar]
  29. EEX Group. EEX Natural Gas Reference Prices. 2022. Available online: https://www.eex.com/fileadmin/EEX/Downloads/Trading/Indices/20220404_EEX_Gas_Reference_Price_EGIX.pdf (accessed on 20 April 2022).
  30. Destatis. Daten zur Energiepreisentwicklung-Lange Reihen von Januar 2005 bis Mai 2021; Destatis: Wiesbaden, Germany, 2021. [Google Scholar]
  31. Verivox. Die Gaspreisentwicklung für bundesdeutsche Haushalte. 2022. Available online: https://www.verivox.de/gas/verbraucherpreisindex/ (accessed on 26 March 2022).
  32. e-Bridge. Kompetenz in Energie, Wasserstoff-Preisindex (Hydex). 2022. Available online: https://www.e-bridge.de/#hydexmodal (accessed on 26 March 2022).
  33. International Energy Agency. World Energy Outlook 2019; International Energy Agency: Paris, France, 2019; Available online: https://www.iea.org/reports/world-energy-outlook-2019 (accessed on 20 March 2022).
  34. Hauser, P.; Heinrichs, H.U.; Gillessen, B.; Müller, T. Implications of diversification strategies in the European natural gas market for the German energy system. Energy 2018, 151, 442–454. [Google Scholar] [CrossRef]
  35. Kemmler, A.; Kirchner, A.; der Maur, A.A.; Ess, F.; Kreidelmeyer, S. Energiewirtschaftliche Projektionen und Folgeabschätzungen 2030/2050. 2020. Available online: https://www.bmwi.de/Redaktion/DE/Publikationen/Wirtschaft/klimagutachten.html (accessed on 15 February 2022).
  36. Ökoinstitut e.V. Rahmendaten für das Impact Assessment der Ziele im Klimaschutzplan 2050. 2017. Available online: https://www.oeko.de/fileadmin/oekodoc/Folgenabschaetzung-Klimaschutzplan-2050-Endbericht.pdf (accessed on 16 February 2022).
  37. European Union. Recommended Parameters for Reporting on GHG Projections in 2017; European Union: Brussels, Belgium, 2016. [Google Scholar]
  38. Trading Economics. EU Carbon Permits. 2022. Available online: https://tradingeconomics.com/commodity/carbon (accessed on 11 April 2022).
  39. Matthey, B.; Bünger, A. Methodenkonvention 3.1 zur Ermittlung von Umweltkosten; Umweltbundesamt: Dessau-Roßlau, Germany, 2020. [Google Scholar]
  40. Greenpeace Energy EG. Blauer Wasserstoff-Lösung oder Problem der Energiewende? Hamburg, Germany. 2020. Available online: https://green-planet-energy.de/fileadmin/user_upload/broschuere-wasserstoff.pdf (accessed on 15 November 2021).
  41. Agora Verkehrswende. Klimabilanz von strombasierten Antrieben und Kraftstoffen. 2019. Available online: https://www.agora-verkehrswende.de/fileadmin/Projekte/2019/Klimabilanz_Batteriefahrzeugen/32_Klimabilanz_strombasierten_Antrieben_Kraftstoffen_WEB.pdf (accessed on 15 November 2021).
  42. Hauser, J. Der Strompreis steigt und steigt, Frankfurter Allg. Zeitung. 2021. Available online: https://www.faz.net/aktuell/wirtschaft/der-strompreis-steigt-groessere-huerden-fuer-den-klimaschutz-17575274.html (accessed on 19 December 2021).
  43. Jahberg, H. Warum steigt der Strompreis ständig? Der Tagesspiegel. 2021. Available online: https://www.tagesspiegel.de/themen/strom/strompreis-warum-steigt-der-strompreis-staendig/8413202.html (accessed on 19 December 2021).
  44. Schultz, S. Deutsche Zahlen Global Fast die Höchsten Strompreise, Spiegel Online. 2021. Available online: https://www.spiegel.de/wirtschaft/service/strompreis-deutsche-zahlen-weltweit-fast-die-hoechsten-preise-a-efd023db-3036-4f02-9948-ed6ae5c5bdfe (accessed on 19 December 2021).
  45. Wetzel, D. Die Deutschen Zahlen Jetzt die Mit Abstand Höchsten Strompreise der Welt, Welt. 2021. Available online: https://www.welt.de/wirtschaft/plus224386200/Energiewende-Deutsche-zahlen-die-weltweit-hoechsten-Strompreise.html (accessed on 18 December 2021).
  46. Göpfert, A. Deutsche Zahlen Immer Mehr für Strom, Tagesschau. 2021. Available online: https://www.tagesschau.de/wirtschaft/verbraucher/strompreise-deutschland-vergleich-rekordhoch-eeg-101.html (accessed on 21 December 2021).
  47. Rahlf, T. Deutschland in Daten-Zeitreihen zur historischen Statistik; Bundeszentrale für Politische Bildung: Bonn, Germany, 2015. [Google Scholar]
  48. Energieagentur NRW. Energiepreise-Entwicklung in Deutschland; Bundesministerium für Wirtschaft und Energie: Berlin, Germany, 2021. [Google Scholar]
  49. Destatis. Verbraucherpreisindizes für Deutschland-Lange Reihen ab 1948. 2021. Available online: https://www.destatis.de/DE/Themen/Wirtschaft/Preise/Verbraucherpreisindex/Publikationen/Downloads-Verbraucherpreise/verbraucherpreisindex-lange-reihen-pdf-5611103.pdf?__blob=publicationFile (accessed on 14 February 2022).
  50. Emele, L. Entwicklung der Strompreise im Verhältnis zur Kaufkraft und Abhängigkeit der Strompreise von den Primärenergiekosten im Untersuchungszeitraum 1950 bis heute. 2009. Available online: https://www.lukas-emele.de/cms/wp-content/uploads/2009/05/Projekt1.pdf (accessed on 28 October 2021).
  51. Destatis. Verdienste und Verdienstunterschiede-durchschnittliche Bruttomonatsverdienste, Zeitreihe. 2021. Available online: https://www.destatis.de/DE/Themen/Arbeit/Verdienste/Verdienste-Verdienstunterschiede/_inhalt.html (accessed on 14 January 2022).
  52. Europäische Zentralbank. EZB-Rat Verabschiedet Neue Geldpolitische Strategie, Pressemitteilung. 2021. Available online: https://www.ecb.europa.eu/press/pr/date/2021/html/ecb.pr210708~dc78cc4b0d.de.html (accessed on 9 January 2021).
  53. Bundesministerium für Wirtschaft und Klimaschutz, Fossile Inflation–Treibt die Energiewende Aktuell Wirklich die Preise? Nein, Sagen Fachleute und Sehen in Ihr vor Allem einen Teil der Lösung, Schlaglichter April 2022, Berlin. Available online: https://www.bmwk.de/Redaktion/DE/Infografiken/Schlaglichter/2022/04/04-im-fokus-download.pdf?__blob=publicationFile&v=4 (accessed on 28 April 2022).
  54. Schnuelle, C.; Thoeming, J.; Wassermann, T.; Thier, P.; von Gleich, A.; Goessling-Reisemann, S. Socio-technical-economic assessment of power-to-X: Potentials and limitations for an integration into the German energy system. Energy Res. Soc. Sci. 2019, 51, 187–197. [Google Scholar] [CrossRef]
  55. Bach, S.; Isaak, N.; Kemfert, C.; Kunert, U.; Schill, W.-P.; Wägner, N.; Zaklan, A. Für eine sozialverträgliche CO2-Bepreisung, Deutsches Institut für Wirtschaftsforschung (DIW). 2019. Available online: https://www.diw.de/documents/publikationen/73/diw_01.c.635193.de/diwkompakt_2019-138.pdf (accessed on 24 April 2022).
Figure 2. Expected production costs of green hydrogen and synthetic fuels up to 2050 compared to price projections for grey hydrogen, natural gas (prices for industry customers), and crude oil (dashed lines) with consideration of individual environmental impact costs based on [39]. Prices for grey hydrogen, natural gas, and crude oil in solid lines represent the actual price developments including specific environmental impact costs. Linearly interpolated data based on [7,8,9,10,24,25,26,27,28,30,33,34,35,36,37].
Energies 15 03541 g002
Figure 3. Development of nominal end customer prices: (a) Nominal price developments of electricity and natural gas for private households in Germany from 1950 until the second quarter of 2021 (natural gas from 1970 due to lack of data for previous decades). Data based on [47,48,49,50]. (b) Nominal price developments of petrol for private customers in Germany from 1950 to 2020. Data based on [47].
Energies 15 03541 g003
Figure 4. Nominal and real electricity prices for private end consumers and development of average gross incomes: (a) Development of nominal and real German end consumer electricity prices until the end of the second quarter 2021. Calculation of real prices in Euro2020 according to the consumer price index [47,49,50]. (b) Comparison of the average gross income to nominal and real (Euro2020) electricity prices in percent and normalized to 1975 = 100% [51].
Energies 15 03541 g004
Figure 5. Development of nominal and real (ct2020) natural gas and grey hydrogen prices for industry customers from 1970 to 2020 [48,49]. Prices for grey hydrogen are based on own calculations.
Energies 15 03541 g005
Table 1. Specific CO2 equivalents of all considered energy carriers and calculated benchmark prices for conventional fuels. CO2eq. values for green hydrogen and synthetic fuels apply for a production via water electrolysis with renewable input electricity. Values for grey hydrogen apply for a production via steam methane reformation (SMR). Values for specific CO2 equivalents derived from [40,41].
Energy CarrierSpecific CO2 Equivalents
g kWh−1
Benchmark Price
ct2020 kWh−1
Price in 2020
ct2020 kWh−1
Grey hydrogen403124
Green hydrogen26--
Natural gas2006.32.34
Petrol2759.94.7
Synthetic fuels54--
Publisher’s Note: MDPI stays neutral with regard to jurisdictional claims in published maps and institutional affiliations.

