
Possibilities for Deep Renovation in Multi-Apartment Buildings in Different Economic Conditions in Europe
by
 , , and
Davor Končalović
1, 
Jelena Nikolic
1,
Vladimir Vukasinovic
1,
Dušan Gordić
1 and
Dubravka Živković
2,* 1
Faculty of Engineering, University of Kragujevac, Sestre Janjić 6, 34000 Kragujevac, Serbia
2
Institute for Information Technologies, University of Kragujevac, Jovana Cvijića bb, 34000 Kragujevac, Serbia
*
Author to whom correspondence should be addressed.
Energies 2022, 15(8), 2788; https://doi.org/10.3390/en15082788
Submission received: 18 March 2022
/
Revised: 6 April 2022
/
Accepted: 9 April 2022
/
Published: 11 April 2022
Abstract
:This paper analyzes the potential for deep renovation of an apartment building to the level of a passive house in different contexts in the continental part of Europe. The examined variables include different local climatic conditions, levels of economic development, and levels of market development (energy prices, energy footprint, labor prices, etc.) as well as different energy efficiency retrofit scenarios in four different countries. The adequate methodology was developed here in order to obtain an optimal solution for deep renovation in each context. The proposed methodology was based on the interaction of energy simulation and mathematical optimization. In this model, the energy performances of a building are determined with the EnergyPlus package and the optimal solution was obtained by using a mixed-integer non-linear programming model. The results demonstrate that the optimal solution for each analyzed location cannot provide cost-effectiveness over the lifetime of a building, so the introduction of additional subsidies or incentives, such as carbon taxes and upfront subsidies, is necessary.
1. Introduction
The building stock in the European Union (EU) consumes approximately 40% of the primary energy and produces 36% of the EU’s greenhouse emissions. The trend has changed a little over the years (in 1990, buildings consumed 36% of the primary energy) [1].
New buildings account for a little over 1% per year of the building stock; thus, it is a major challenge to move the existing building stock towards lower energy consumption. As renovations are not common (a 30- to 50-year renovation cycle is typical), it is essential to make the most of every possible opportunity for building refurbishment.
As energy efficiency and energy savings play important roles in the reduction of greenhouse gas (GHG) emissions [2], the carbon footprint of the building sector can be reduced by the concept of deep renovation (DR). DR is the term for a renovation aiming at high energy performance of the existing buildings, through the improvement of energy efficiency, predominantly via buildings’ envelope.
In addition, DR provides an opportunity for financial, social, and environmental benefits.
DR could be accomplished with several approaches, such as Nearly Zero Energy Buildings (nZEB) and Passive House (PH) standards. The nZEB standard demands buildings with slight energy demands that can be covered by renewable energy sources (RES) produced either on-site or nearby. The nZEB standards vary from country to country. Requirements for the heat loss of the building envelope vary depending on requirements on indoor air quality and energy performance in a specific country, climate, accessibility of renewable energy, and building typology [3].
On the other hand, the PH standard implies a very low consumption of energy, regardless of the climate or other local conditions. There are several reasons for choosing the PH standard to be analyzed and recommended for deep renovation—energy demand can be considerably decreased, and air-tightness and indoor comfort increased [4].
According to [5], investing in deep renovation that takes account of the measures to increase indoor air quality and energy efficiency is recognized as the most favorable. Furthermore, setting up appropriate ventilation system seems to be a key matter in renovation and using a ventilation system with heat recovery in regions with a cold climate is the most important solution to achieve the energy saving targets of the EU.
One of the approaches that could be used for such integrated renovation might be the PH renovation standard, EnerPHit, with its strict requirements for buildings’ opaque envelope, windows, and mechanical ventilation system with heat recovery. The recent research demonstrates that the building fulfilling the requirements of the PH renovation certification EnerPHit can be an excellent example of how substantial reductions in energy use can be accomplished. Results before and after renovation demonstrate that the consumption of energy for heating has been decreased by more than 50%, while the indoor temperature has increased from 21.7 °C to 23.3 °C [6].
Numerous barriers, many of which are not necessarily technological, delay the implementation of renovation programs and DR in general. Therefore, DR projects are not mainstream, not even in the EU.
Some obstacles for DR that have been detected during the implementation of the EU projects include [7,8,9,10]:
- High initial investment costs;
- Insecurity about energy performance after renovation and financial savings;
- Presently low and, in the long run, fluctuating prices of energy;
- Other priorities of proprietors and residents;
- Group involvement of proprietors in the decision-making processes;
- Inadequate technical skills of a suppliers and insufficient knowledge of proprietors;
- Low purchasing power in some European countries;
- Lack of know-how and successfully implemented projects.
The combination of the prices of energy, equipment, and labor, with climatic and other conditions, including even the perceptions about the future, impact investments in energy efficiency. Yet, the deeper a renovation is, the lower the chances are for reasonable financial payback time. Striving toward the implementation of the strict requirements imposed by any of the high-performance standards usually does not result in attractive financial indicators for DR projects.
The cost-effectiveness of a building envelope insulation on a 50-year-old building in Sweden (total heating area of 1430 m2) was analyzed by Bonakdar et al. [11]. Through the Net Present Value (NPV) analysis, the authors observed the scenarios with different discount rates and changes in energy prices. The results demonstrate that energy savings, discount rates, and a number of years adopted for the lifespan of a renovated building have the main impact on the cost-effectiveness of such projects.
G. Semprini et al. point out that high initial costs are a high-risk factor in making decisions about a detailed reconstruction of a building [12]. The paper examines energy consumption in several types of buildings with high energy consumption. In addition to the analysis of the characteristics of their envelope, it demonstrates that the payback period for the nZEB scenario (envelope insulation, installation of photo-voltaic (PV) panels, and the reconstruction of heating systems) exceeds 90 years. The long payback period should encourage researchers to find new strategies and approaches that will increase the chances to make DR cost-effective.
A long payback period for the renovation of existent buildings is also reported in a paper analyzing energy consumption in residential buildings in Poland [13]. The paper presents the energy savings achieved by the insulation of the buildings’ envelope and the hydraulic balancing of the heating systems. It concludes that the repayment period varies from 3 to 105 years, depending on the level of renovation.
E. Iturriaga et al. applied the Mixed-Integer Linear Programming model to reduce the energy needs of one building in Spain that aims to meet the nZEB standard [14]. It is demonstrated that the implementation of nZEB with the current market conditions could be profitable in 60 years.
The repayment period for different scenarios in case of renovating large complexes of residential buildings was analyzed in Italy [15]. The determined payback period varies depending on the characteristics of buildings and often exceeds 30 years. Based on the obtained results, it is noted here that the implementation of measures that will reduce the environmental footprint is possible with macroeconomic incentives such as interest rate reductions, direct support, guaranteed and favorable loans, and the inclusion of CO2 tax in energy costs.
The importance of imposing the measures for encouraging the complete renovation of existent buildings was confirmed in the paper that applied the SWOT analysis to determine the possibilities for renovating buildings in Sweden and Denmark [16]. The analysis was conducted through a detailed literature review focusing on diverse political (resolutions, fees, and bureaucratic procedures), economic (availability of loans and subsidies), social, and technological factors. The results demonstrate that the main initiatives for DR are various financial incentives (tax reduction and compensation for reducing CO2 emissions), and free expert advice on energy-saving measures. In addition, the paper emphasizes the importance of high carbon taxes and the reduction of taxes on labor costs. Both the lack of commitment of policymakers and the evasion of initiative in energy and environmental matters have a deep influence on the development and implantation strategies. All these factors lead to a small number of effectively realized projects and insufficient training of professionals (designers, engineers, etc.) who should be the leaders in a project implementation. Furthermore, the market forces are moving skilled workforce from Eastern Europe to Western Europe, jeopardizing the capacity for building in this part of Europe, and undermining the only comparative advantage of this part of Europe—relatively cheap labor.
Based on all that has been presented above, it can be concluded that the financial indicators of DR projects are the result of local climatic conditions, economy levels, and market development levels. In this regard, the aim of this paper is to examine the possibilities for deep renovation in multi-apartment buildings in different economic conditions in Europe.
Objectivity is achieved:
- 9.
- By examining the above criteria in the case of the same building, in all analyzed European countries; and
- 10.
- By applying the PH standard, in order to avoid the country-specific definitions of nZEB.
2. Materials and Methods
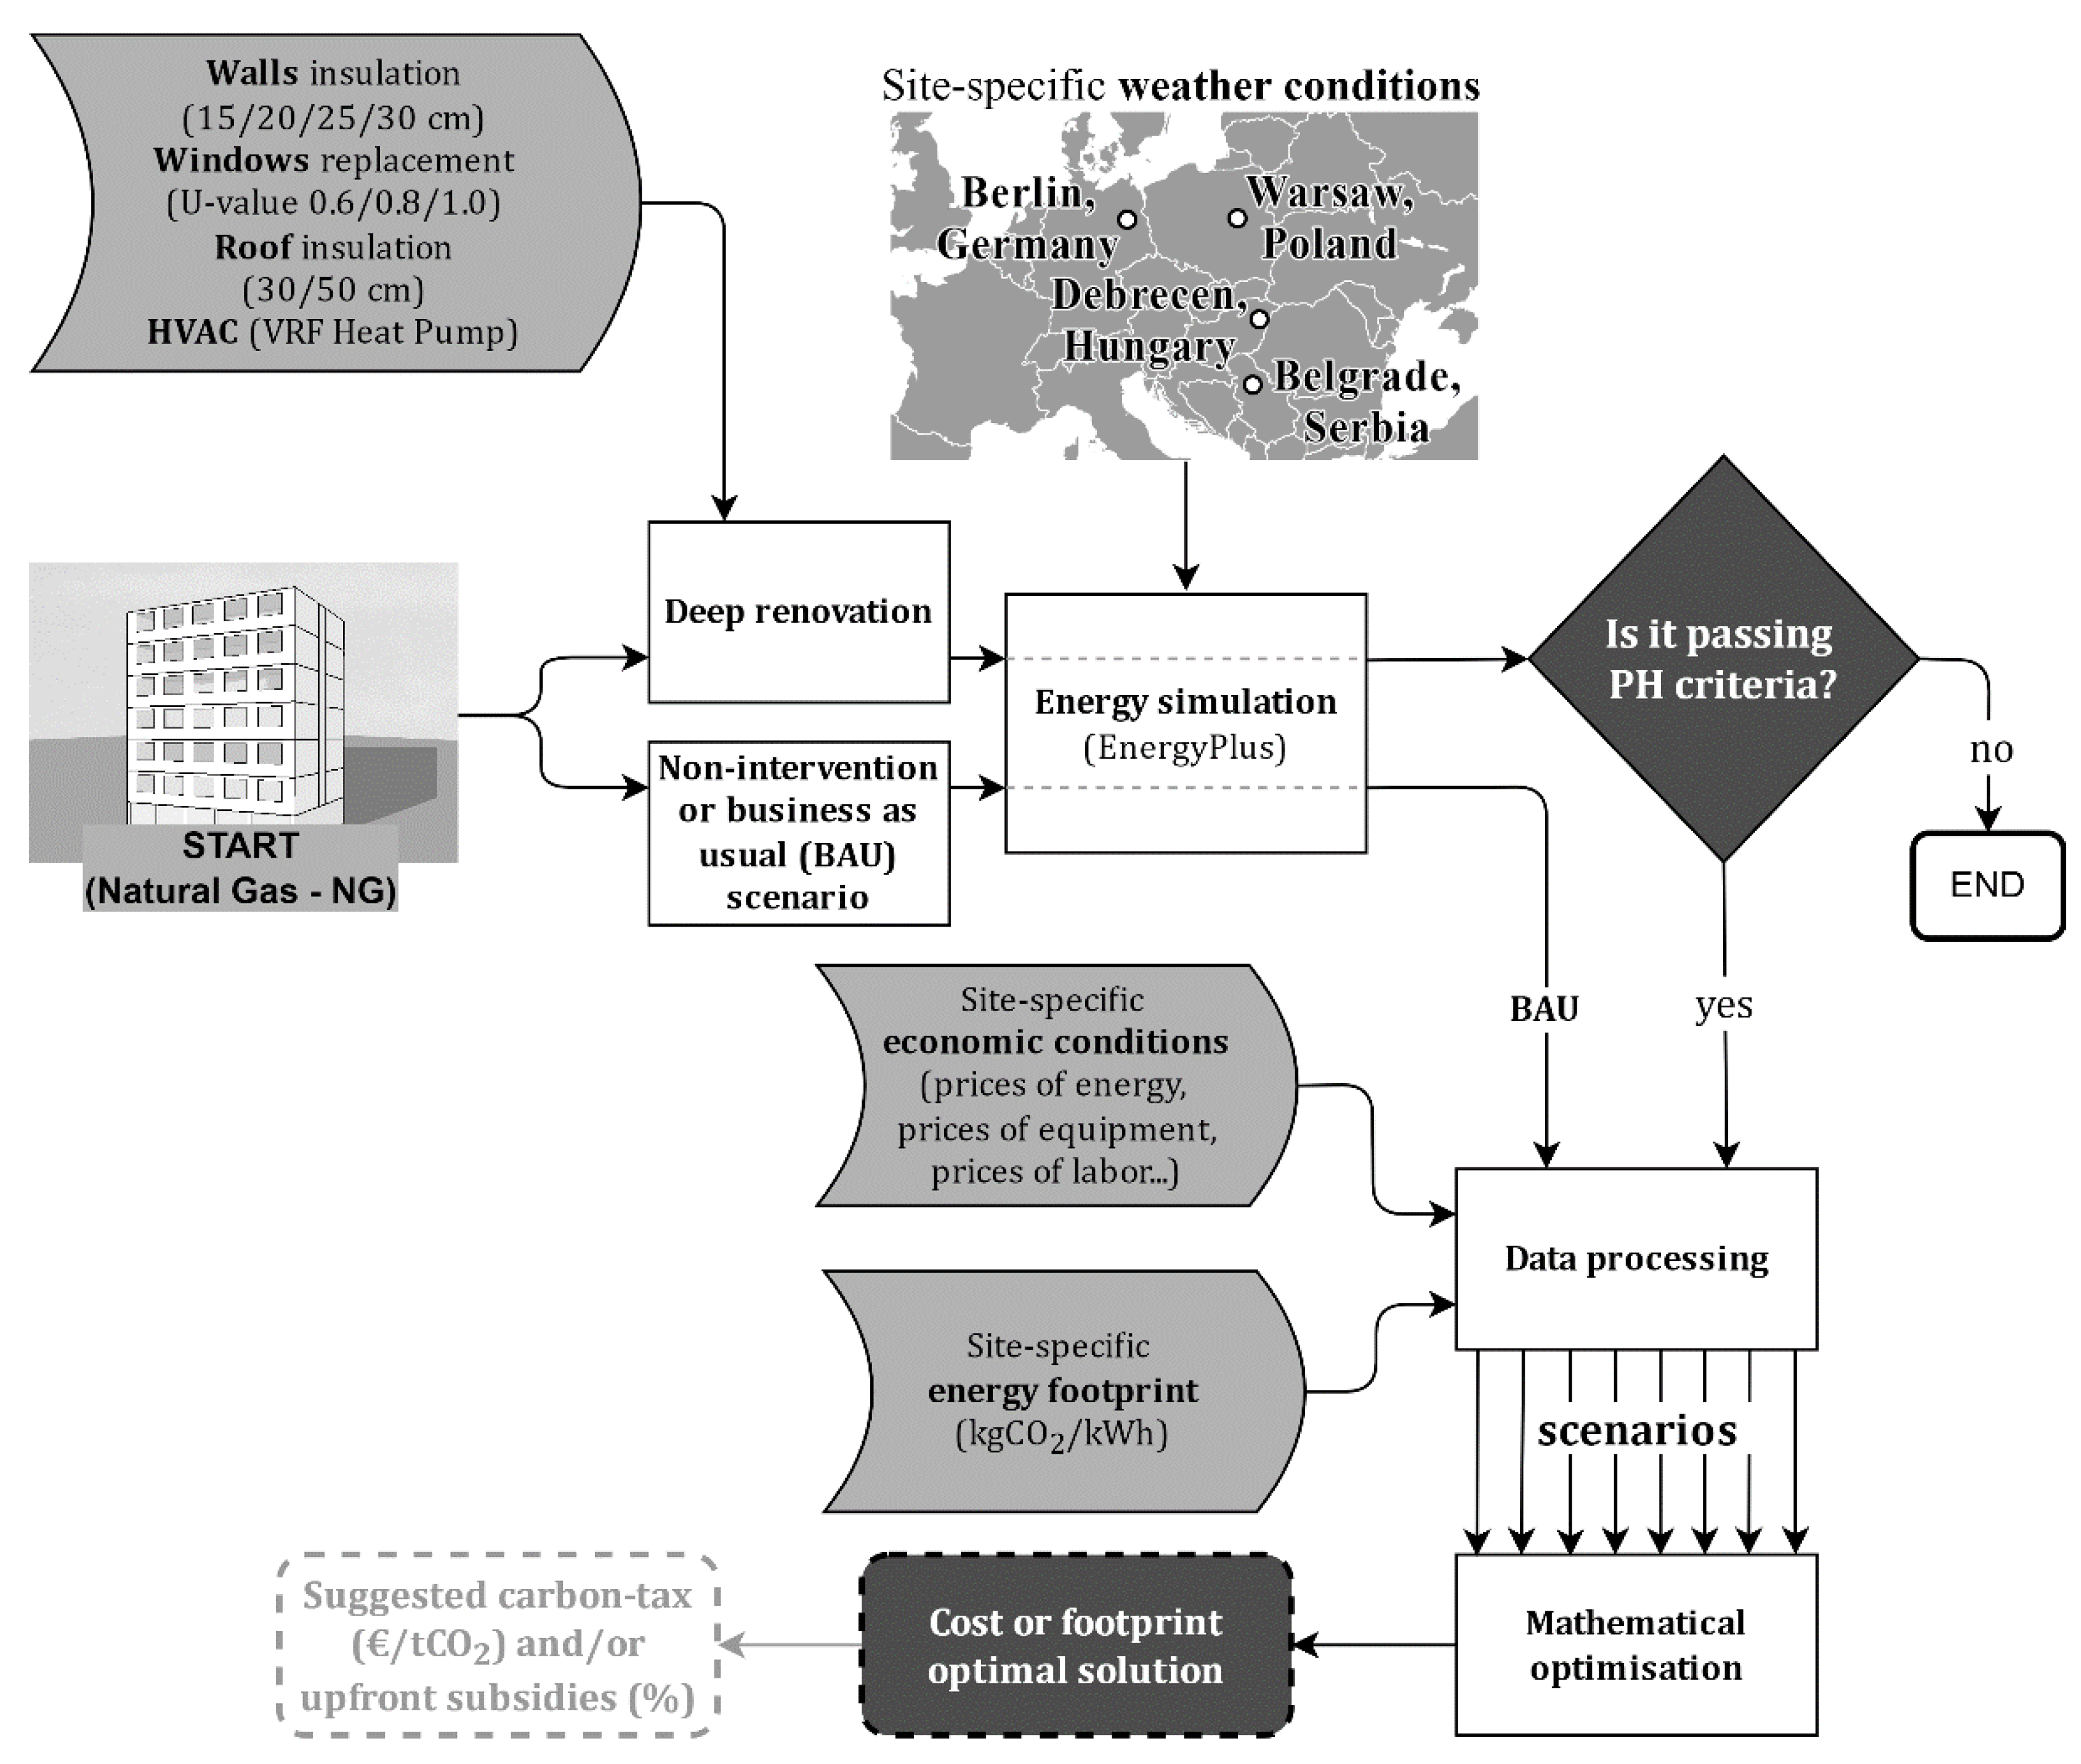
The complete methodology used in this analysis is shown in a flow diagram in Figure 1.
The proposed methodology is based on the interaction of energy simulation and mathematical optimization.
For buildings subjected to major renovation and identifying the most appropriate measures for reducing energy consumption and improving indoor thermal comfort, building simulation tools have become crucial in the assessment of energy needs and thermal comfort [17].
An increased demand for an energy model capable of grasping the building dynamic behavior that is the result of various factors influencing the model, such as envelope characteristics, weather conditions, control management, and type of use, led to the development of many computer programs suitable for analyzing the dynamic behavior and performance of buildings and their systems [18].
In terms of modeling capabilities and model accuracy, among the most elaborate building energy simulations tools available, TRNSYS [19], EnergyPlus [20], IDA [21], and Modelica [22] have nowadays become the most widespread [17,18].
EnergyPlus is the acclaimed building energy modeling software, developed by the United States (US) Department of Energy. It is a building energy modeling program based on a modular structure; it models HVAC systems and other energy flows. EnergyPlus has been commonly used in analyses estimating building energy performance, as it is capable of calculating outdoor and indoor parameters [23].
The methodology proposed in this paper is based on building a dynamic simulation model in EnergyPlus. The energy model calculates the annual energy demand for representative buildings in different regions. Hence, to validate the accuracy of the proposed model, in this study, the energy simulation results for heating consumptions per unit of area for every scenario/country are compared to the published values available in the web tool, Tabula [24]. We compared the difference between the simulated energy demand and published energy demand, and the results were in the range from −7% to +3.5%.
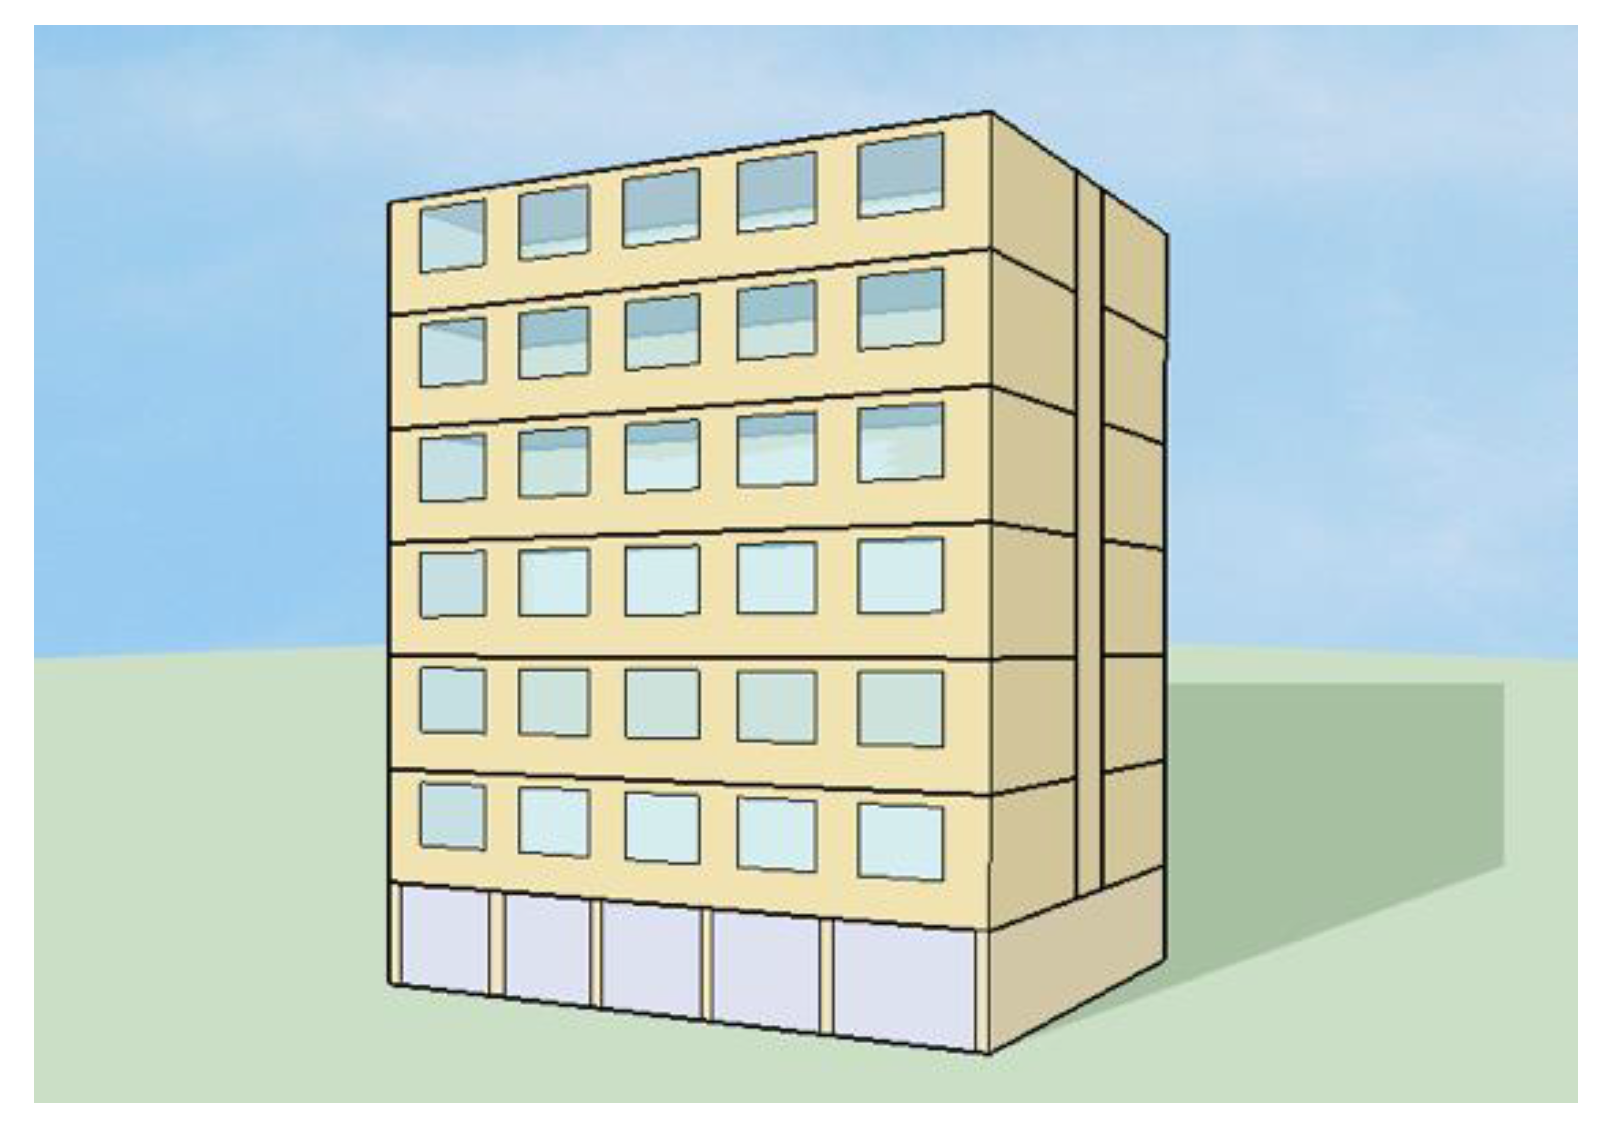
The reference building model represents an average building shape and geometry used across Europe in a specific construction period. The materials for the construction and their thicknesses are also prevalent for the same construction period. The model of the multi-apartment building that can be suitable for different countries is selected from [18] and is labeled as “residential building–old (ID 3)” (Figure 2). The same or very similar building can be found in different European countries in the Tabula web tool [24]. According to the Tabula concept (web tool developed within the framework of the Intelligent Energy Europe projects TABULA and EPISCOPE) a national residential building stock in Europe is divided in size and age classes. To inspect and compare the complex European building stock models, the concept of “synthetical average buildings” has been applied [25]. The buildings have been described in detail in national typology brochures published separately for each country [26].
The used reference building is a 6-story building with a net useful area of 1118 m2 and a gross floor area of 1282 m2. The building construction corresponds to the time period ranging from 1970 to 1987.
It should be noted that the form factor (i.e., the ratio between the useful area and the volume of the building) is favorable for this building, suggesting that the investment in energy efficiency will be more profitable than in similar buildings from the period. This can fit the definition for the example (reference) building given by [27], which is based on the experts’ assumptions about the most probable building model.
The analysis was limited to the four countries set as the focus of the research. Representative cities of the four countries have comparable climatic circumstances and these countries are classified in the same group of low-performers in terms of energy efficiency (energy intensity is 14.9% higher than the EU average) and ecology (the value of ecology indicators is 13% higher than the EU average) [28]. Hence, the adopted building is “moved” through different locations so that we can observe the conditions in Europe comprehensively. Four cities are selected:
- 11.
- Berlin, Germany;
- 12.
- Warsaw, Poland;
- 13.
- Debrecen, Hungary;
- 14.
- Belgrade, Serbia.
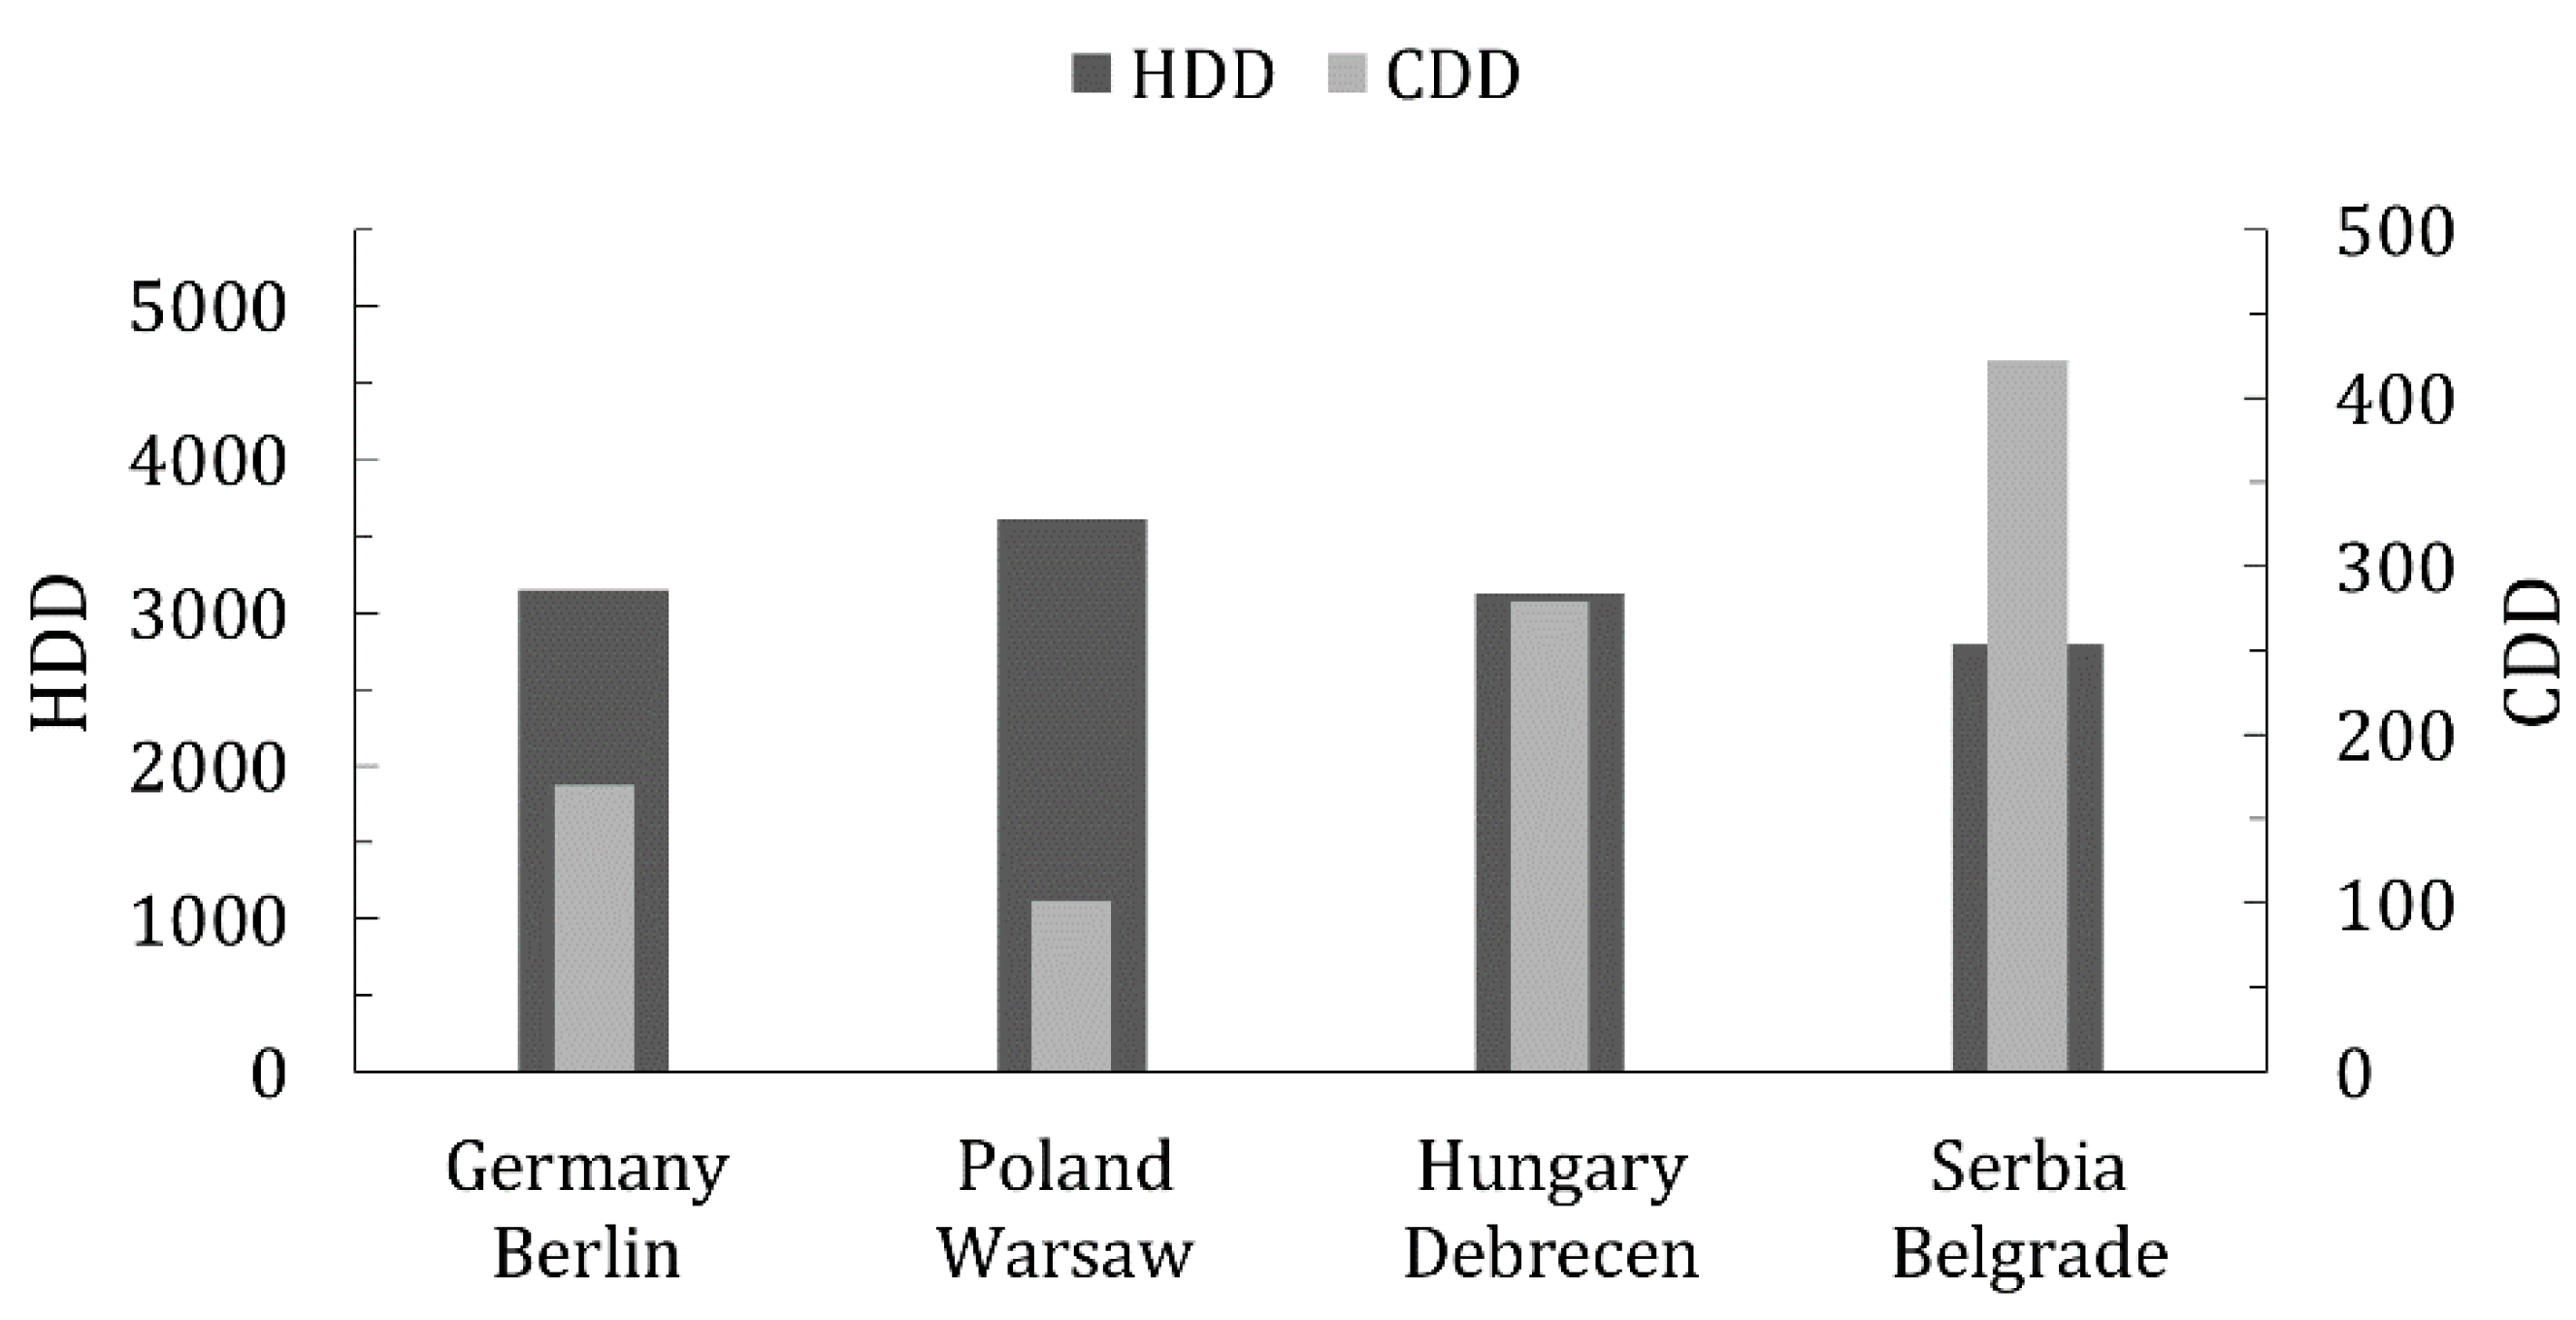
The climate is diverse in the given cities, as shown in Figure 3. Thus, the building’s heating or cooling load in the observed countries is equally diverse. The weather data were used from EnergyPlus’s built in feature-reading in the weather data from the file. EnergyPlus weather data [29] is accessible for more than 1042 locations in the US, and more than 1071 locations in 100 other countries around the world. The values for HDD (heating demand days) and CDD (cooling demand days) are also retrieved from the EnergyPlus weather file stat.
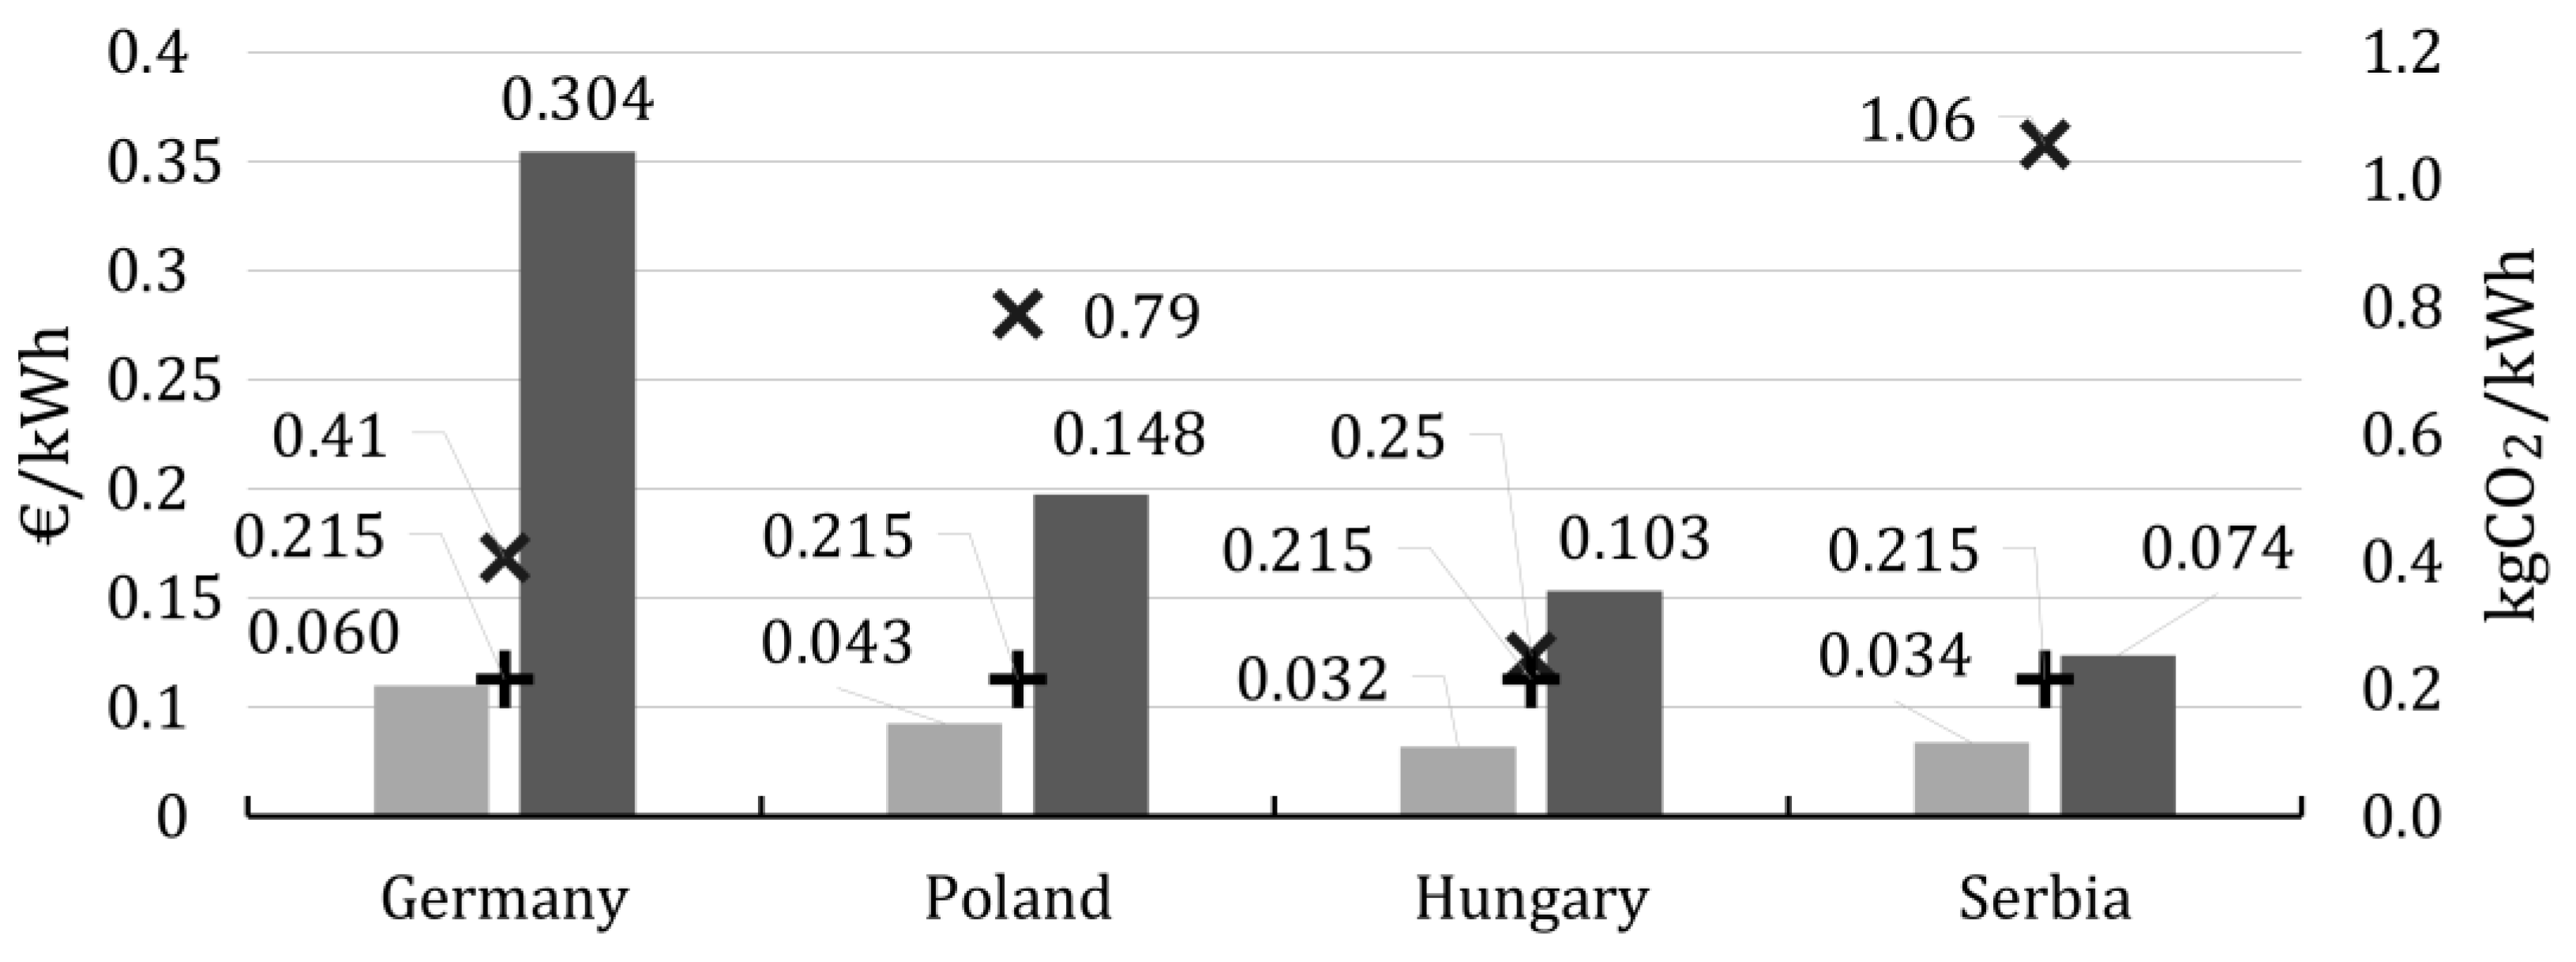
The diversity of economic conditions and circumstances that prevail in the energy sector are partly demonstrated by Figure 4: the price of electricity is obtained from [30]; the price of natural gas from [31]; and the footprint-related data for electricity from [32]. The columns on the diagram show energy prices (natural gas and electricity) and these values can be read on the left axis. Scattered markers show the values of CO2 emissions per unit of energy produced and can be read on the right axis.
As shown in Figure 4, the observed locations are characterized by a wide range of prices of energy and footprint-related indicators. For example, the price of electricity in Germany is more than fourfold higher than in Serbia, while the CO2 emissions per produced kWh of electricity in Hungary are a few times lower than in the predominantly coal-powered electricity used in Poland or Serbia (Figure 4).
In order to establish the “business as usual” (BAU) scenario, the next step in the proposed methodology involves the EnergyPlus modeling of the selected multi-apartment building at all mentioned locations across Europe. For this purpose, EnergyPlus Weather Data files for each city are used. The heating sources for the building are the natural gas-fired boiler (later in the text indexed as NG). The considered BAU scenarios do not include the usage of a cooling system, although in reality similar buildings could be equipped with ductless air source heat pumps (at least in southern countries—Hungary and Serbia). As noted in [33], building owners do not always report changes to their heating systems, so there is no easy way to check the actual situation in some entities of the building stock.
After the BAU scenarios are established, the different energy-efficiency retrofit scenarios for each building are analyzed to check if they meet the requirements of a Passive House EnerPHit criteria-level Classic [34]. The energy efficiency retrofit scenarios consider the replacement of a heating source, i.e., the application of a Variable Refrigerant Flow (VRF) heat pump and a heat recovery-equipped mechanical ventilation, as well as the improvements in the thermal envelope. Regarding the internal conditions, the heating and cooling setpoint temperature in the building was 21 °C and 26 °C, respectively, and for indoor air, the parameter used was the autosized mechanical ventilation with heat recovery as provided by EnergyPlus. To achieve the Passive House standard for refurbishment, the following thermal envelope-improving scenarios are considered:
- 15.
- In order to comply with prescribed U-values for exterior insulation (0.12, 0.15, and 0.3 W·m−2·K−1 for cold, cool, and warm temperate climate zones, respectively [34]), the installation of mineral wool with variable thicknesses (15, 20, 25, or 30 cm) and the associated finishing facade materials were analyzed. For those variable thicknesses, the calculated U-value is ranging from 0.21 to 0.11 W·m−2·K−1;
- 16.
- In order to achieve U-values for the roof of 0.12 or 0.07 W·m−2·K−1, the installation of mineral wool thickness of either 30 or 50 cm was analyzed;
- 17.
- For the windows prescribed, the overall U-values vary from 0.65 to 1.20 (depending on the climate zone [34]), hence the installation of new windows with U-values of 0.6, 0.8, and 1 W·m−2·K−1 were analyzed.
The proposed mineral wool for the insulation has the following characteristics: thermal conductivity = 0.037 W/mK, density = 160 kg/m3, and specific heat = 840 J/kgK. The insulation of the basement walls is excluded. A special method of marking the scenarios is established so that the results can be presented systematically. The first number indicates the thickness of the wall insulation in cm, the second refers to the window U-value (W·m−2·K−1), and the third represents the thickness of the roof insulation. For example, 15-0.8-50 marks the scenario in which the wall insulation is 15 cm-thick mineral wool, the U-value of the windows is 0.8 W·m−2·K−1, and the roof insulation is 50 cm-thick mineral wool.
The infiltration coefficient before the renovation (0.6 h−1) is adopted for “poor sealing–moderately sheltered position” from [35]. The infiltration coefficient after the renovation is adopted from the Passive House Institute recommendations.
The BAU scenario and scenarios that meet the Passive House requirements are further processed in the developed Mixed Integer Non-Linear Programming (MINLP) model. The model involves local specific conditions (prices and footprint of energy, prices of equipment, labor, etc.). The estimated lifespan of the building (50 years) is later used for the analysis of the environmental footprint [36].
The various other costs are adopted from different sources: the cost of labor from [37]; the prices of the building material and the prices of heating, ventilation, and air conditioning (HVAC) equipment adopted from the relevant websites in their respective home countries. The reconstruction costs of an existent building built in the 1970s in Sweden [38] were analyzed, including the insulation of the thermal envelope, the replacement of windows, and the installation of an efficient HVAC system. Depending on the thickness of the insulation material, the prices of the envelope insulation range from 329 to 512 €/m2, the replacement of windows ranges from 478 to 1078 €/m2, while the installation of an efficient ventilation heat recovery (VHR) system is estimated at 129,000–162,100 €. The adopted prices for the construction insulation material vary depending on their characteristics and thickness, e.g., in [11] the installation of mineral wool on the external walls of the building (45–510 mm) is 146–594 €/m2, while the estimated value of roof insulation is 9–53 €/m2. The cost of window replacement/upgrade varies depending on the U-value, and for the most efficient ones (U = 0.6 W/m2K) the price is 1036 €/m2.
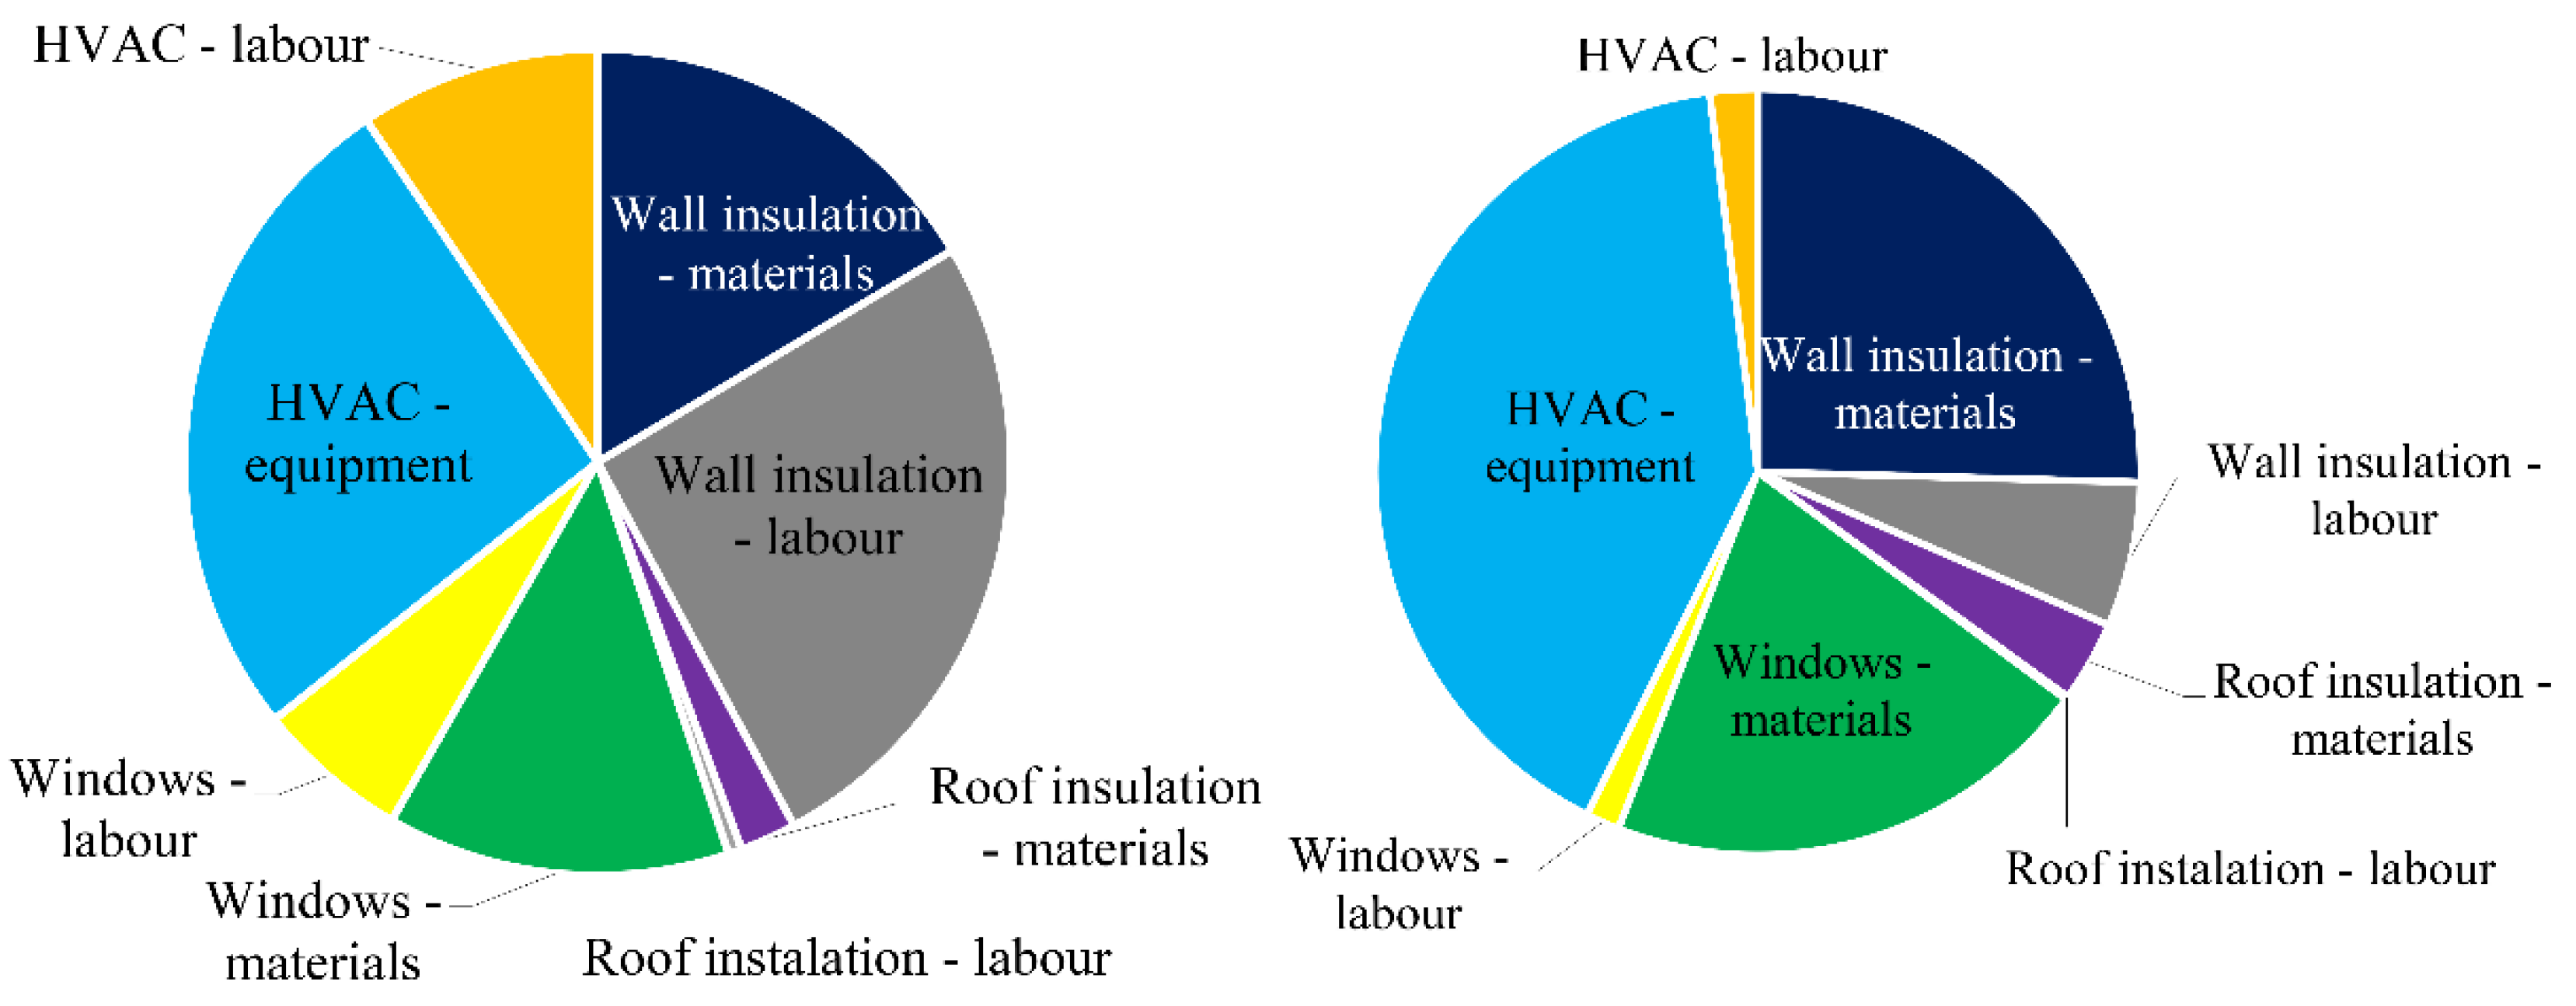
The ratio of those costs changes the structure of the overall investment, as shown in Figure 5.
After the various costs and other data are systematized, a relatively large number of scenarios becomes available (96 in total). To decide on the optimal configuration of DR, the MINLP model is developed as the next step of the proposed methodology. The goal is to find the optimal solutions for each site and each scenario through the maximization of Net Present Values (NPV). NPV represents the main economic output of the chosen investment strategy. For that selected optimal solution, the adequate carbon tax or subsidy model is also proposed. The consideration or the adoption of the proposed incentives can make DR a cost-effective measure.
MINLP model.
The results of the objective function should enable the selection of the optimal configuration (wall insulation–windows–roof insulation). The decisional variable that could be obtained from the objective function is:
- eeli,j,k [kWh/year]—Variable that represents the annual electricity consumption of a building with i wall insulation, j windows, and k roof insulation.
- engi,j,k [kWh/year]—Variable that represents the annual natural gas consumption of a building with i wall insulation, j windows, and k roof insulation.
- βi,j,k [-]—Binary variable. β = 1 if a i, j, k configuration is applied.
The Net Present Value, as the objective function, can be calculated with the following Equation (1):
where:
- ECS [€]—annual savings in energy costs,
- d [%]—a discount rate (for long term household energy efficiency investments; for all observed scenarios the discount rate is adopted as 3.5% [39]),
- lc [year]—a project lifecycle,
- Inv [€]—investment costs.
Annual savings is the difference between energy costs before and after the renovation (Equation (2)):
where:
- CEb [€]—annual energy costs before the renovation,
- CEa [€]—annual energy costs after the renovation.
The energy costs can be calculated as (Equations (3) and (4)):
where:
- feb [kWh]—a final energy consumption before the renovation;
- cdh [€/kWh]—costs of heating energy before the renovation;
- eeli,j,k [kWh]—electricity consumption after the renovation;
- cel [€/kWh]—costs of electricity;
- engi,j,k [kWh]—natural gas consumption after the renovation;
- cng [€/kWh]—costs of natural gas.
Investment costs, Inv, represent the sum of all the costs associated with the installation of HVAC equipment Chp [€], wall Cwall [€], and roof Croof [€] insulation, as well as the installation of windows Cww [€].
The investment costs are calculated with the Equation (5):
The costs for the heat pump equipment and their installation are determined with Equation (6):
where:
- hpp [€]—costs of p heat pump technology;
- ihp [€]—costs of heat pump installation (depends on unit labor costs in different countries).
The costs for the wall insulations are calculated with the following Equation (7):
where:
- ciwi [€/m2]—costs of wall insulation material I;
- Awall [m2]—a wall area;
- iwall [€]—wall insulation installation labor costs (depend on unit labor costs in countries).
The costs for the roof insulations are obtained with Equation (8):
where:
- cirk [€/m2]—costs of roof insulation material k;
- Aroof [m2]—a roof area;
- iroof [€]—roof insulation installation labor costs (depend on unit labor costs in some countries).
The costs for the windows are calculated with the following Equation (9):
where:
- cwj [€/m2]—costs of windows with thermal transmittance j;
- Aw [m2]—a windows area;
- iw [€]—installation of window labor costs (depending on unit labor costs in the countries).
Constraints.
As only one configuration (wall insulation–windows–roof insulation) can be applied to the building, a constraint is described by the Equation (10):
Moreover, according to the Passive House standard, the final energy consumption should not exceed femx = 15 kWh/m2 of a net living space. This constraint can be presented with Equation (11):
where:
- Anet [m2]—a net living space.
3. Results and Discussion
3.1. Results of Energy plus Modeling
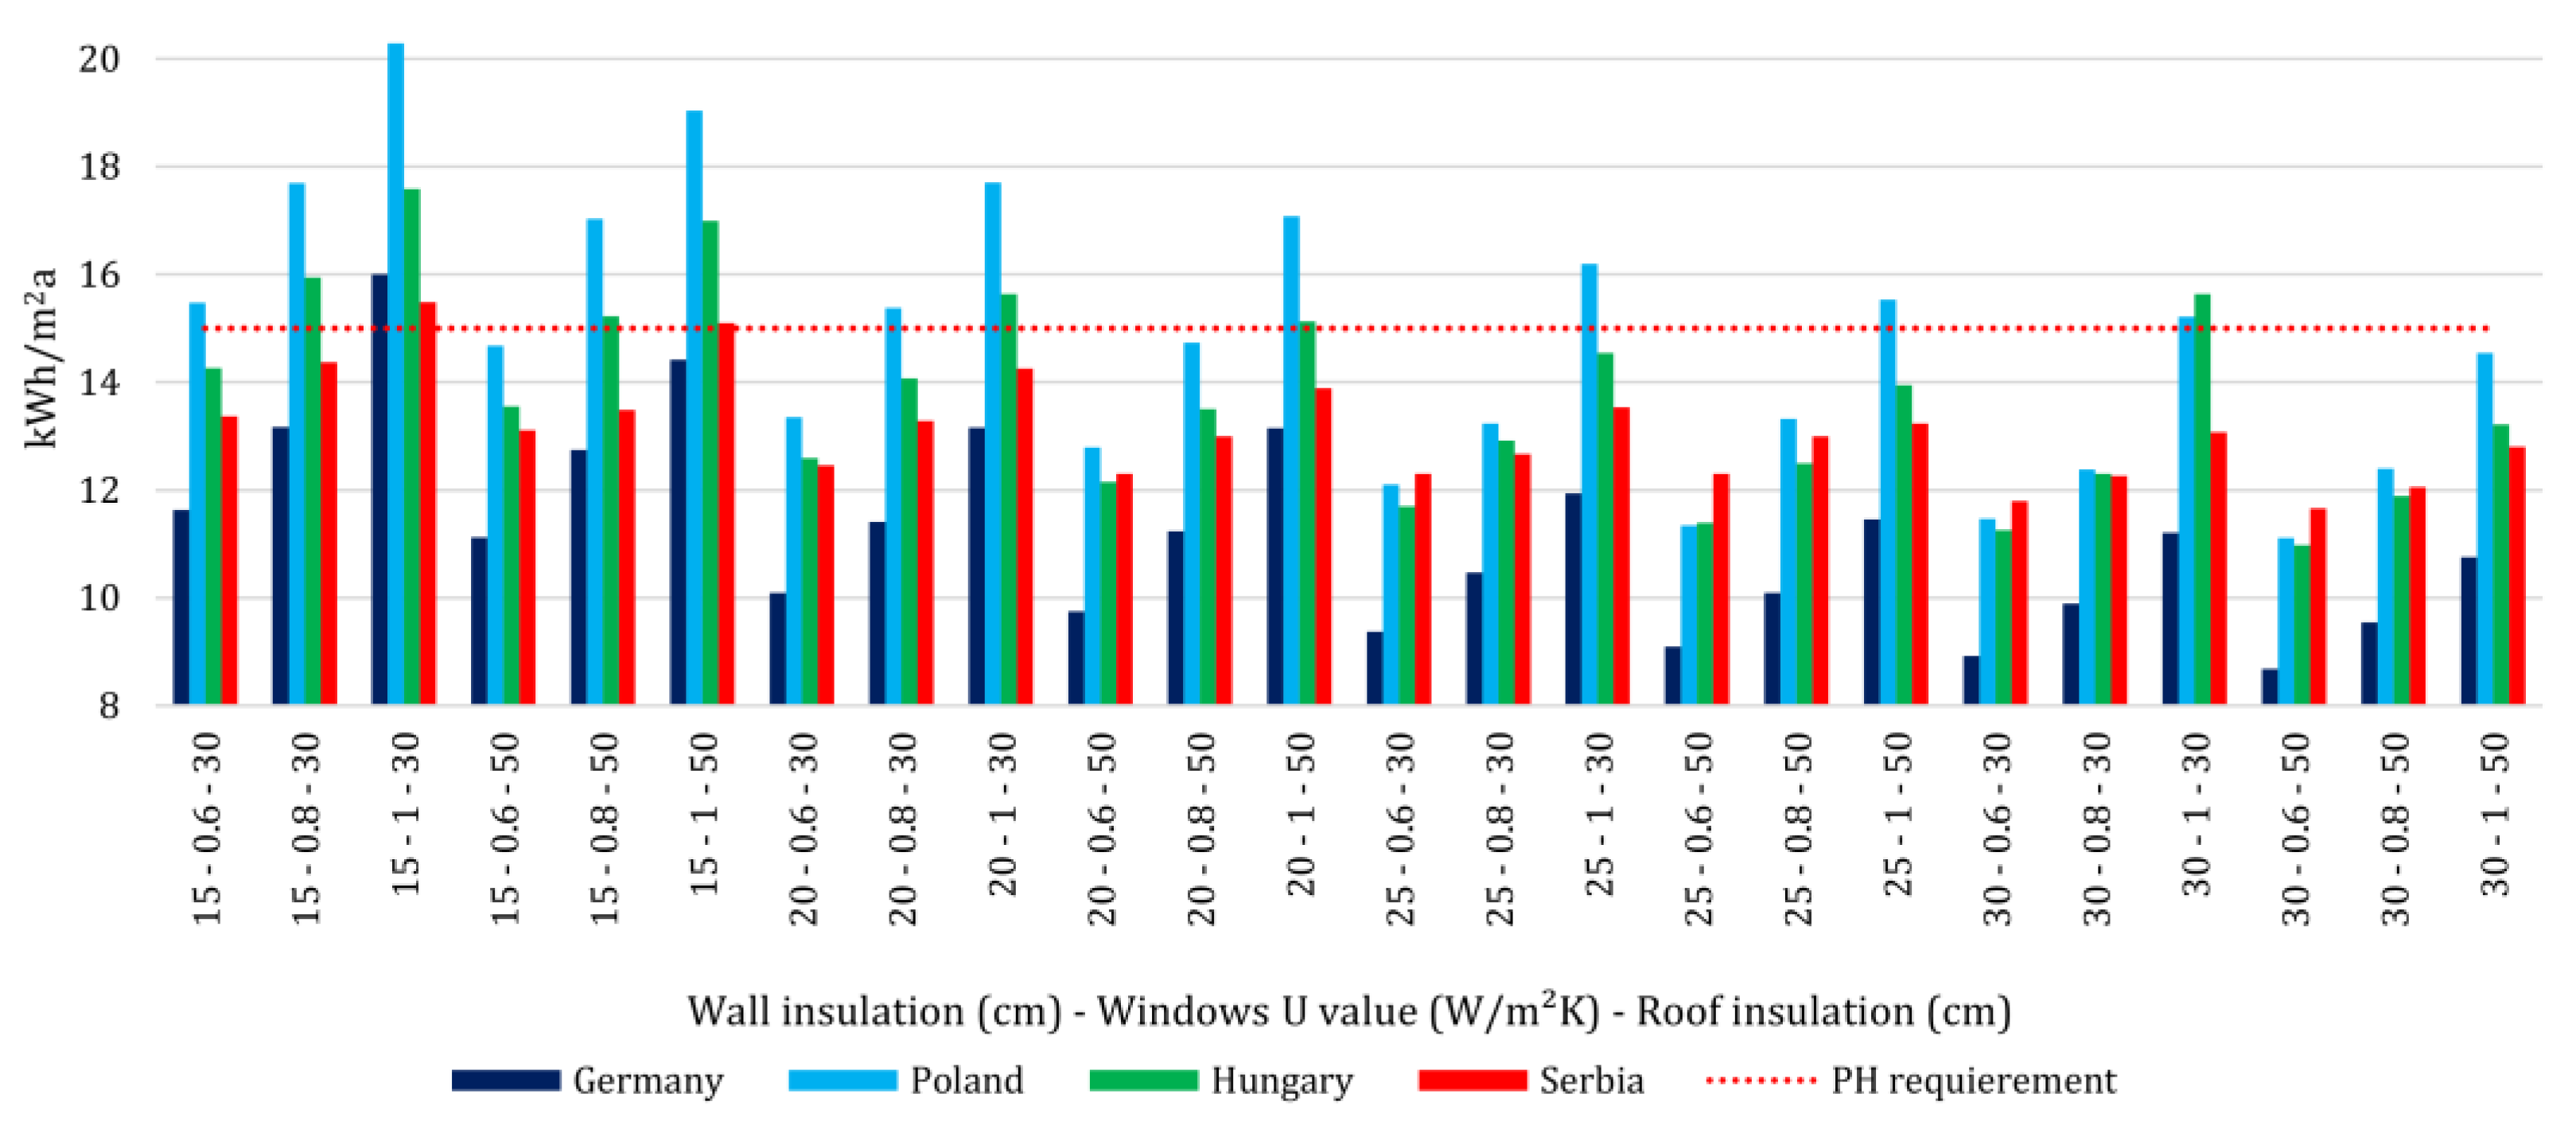
The annual heat energy consumption for BAU scenarios determined by the EnergyPlus simulation is: Germany—103.7, Poland—121.52, Hungary—88.49, and Serbia—83.93 kWh/m2a. After all proposed scenarios are modeled, 75 of them (78.1%) pass a Passive House EnerPHit criteria—level Classic (Figure 6).
3.2. Results of MINLP Optimisation
The long-term investments should be examined via an NPV analysis. The results of the MINLP analysis (four optimal scenarios) are as represented below:
- 18.
- For Germany: 20-0.6-30;
- 19.
- For Poland: 20-0.6-30;
- 20.
- For Hungary: 20-0.6-30;
- 21.
- and for Serbia: 15-0.8-30.
The results can be interpreted as follows:
- 22.
- The optimization model proposes the same optimal scenario for the countries of Central Europe. The shared feature for all those scenarios is the installment of the windows that have the best offered characteristics, which are also the most expensive ones. This further suggests that these scenarios, including the windows, with even higher performances should be explored in the future;
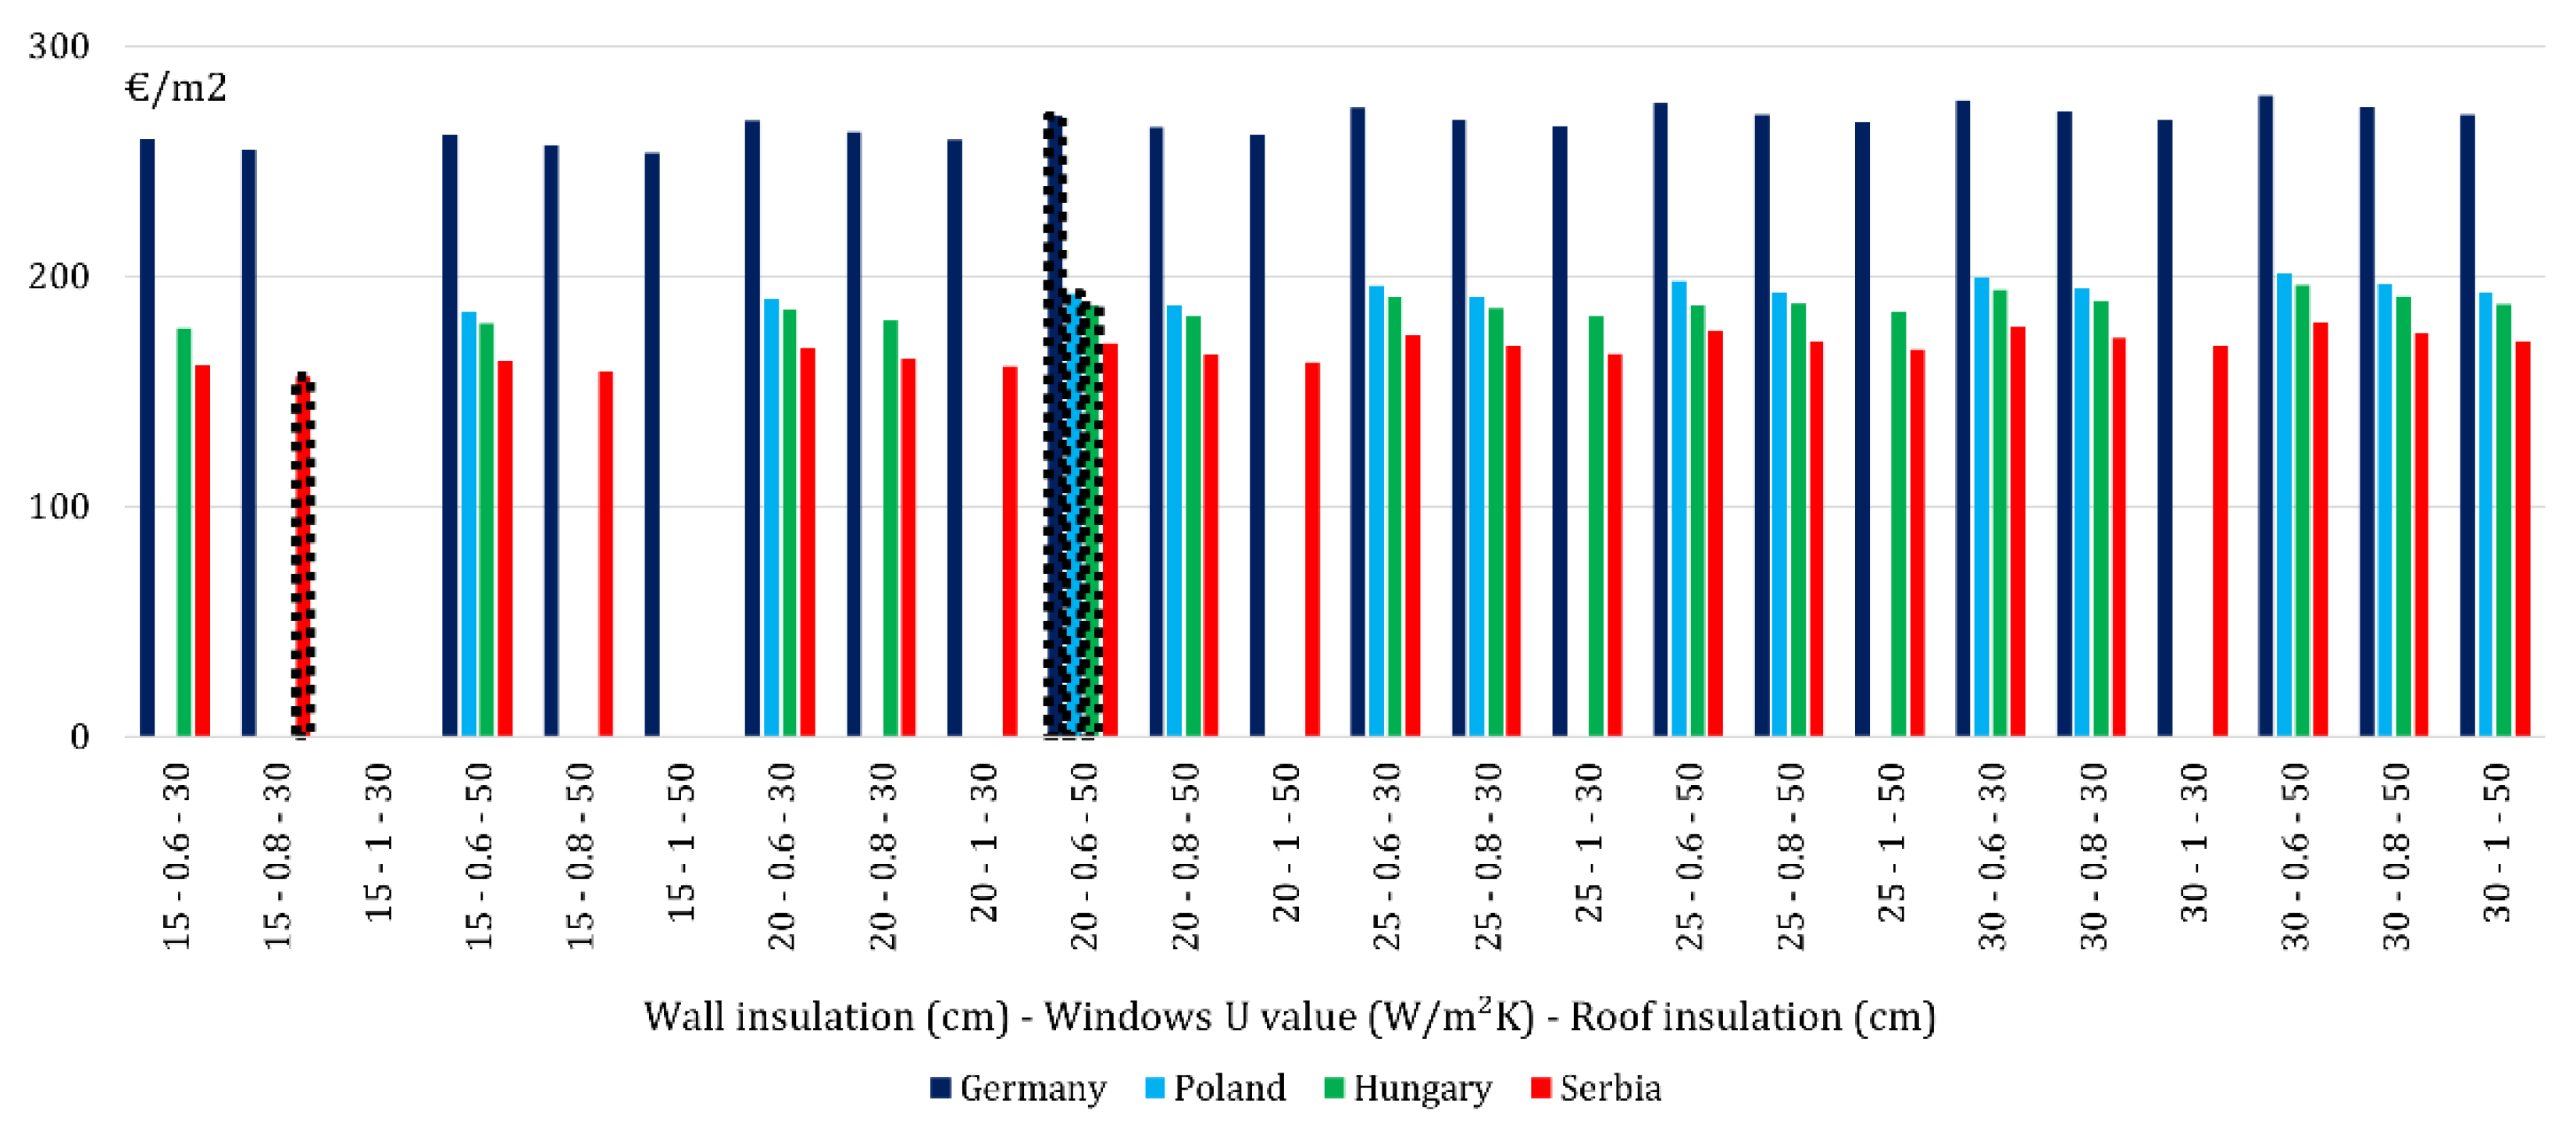
- 23.
- Serbia is the only country where the highest performance windows are not recommended. Furthermore, for this country, the lowest costs of DR, i.e., the highest U-values, are suggested (Figure 7). This can be contributed to the low price of energy and low economic-related indicators.
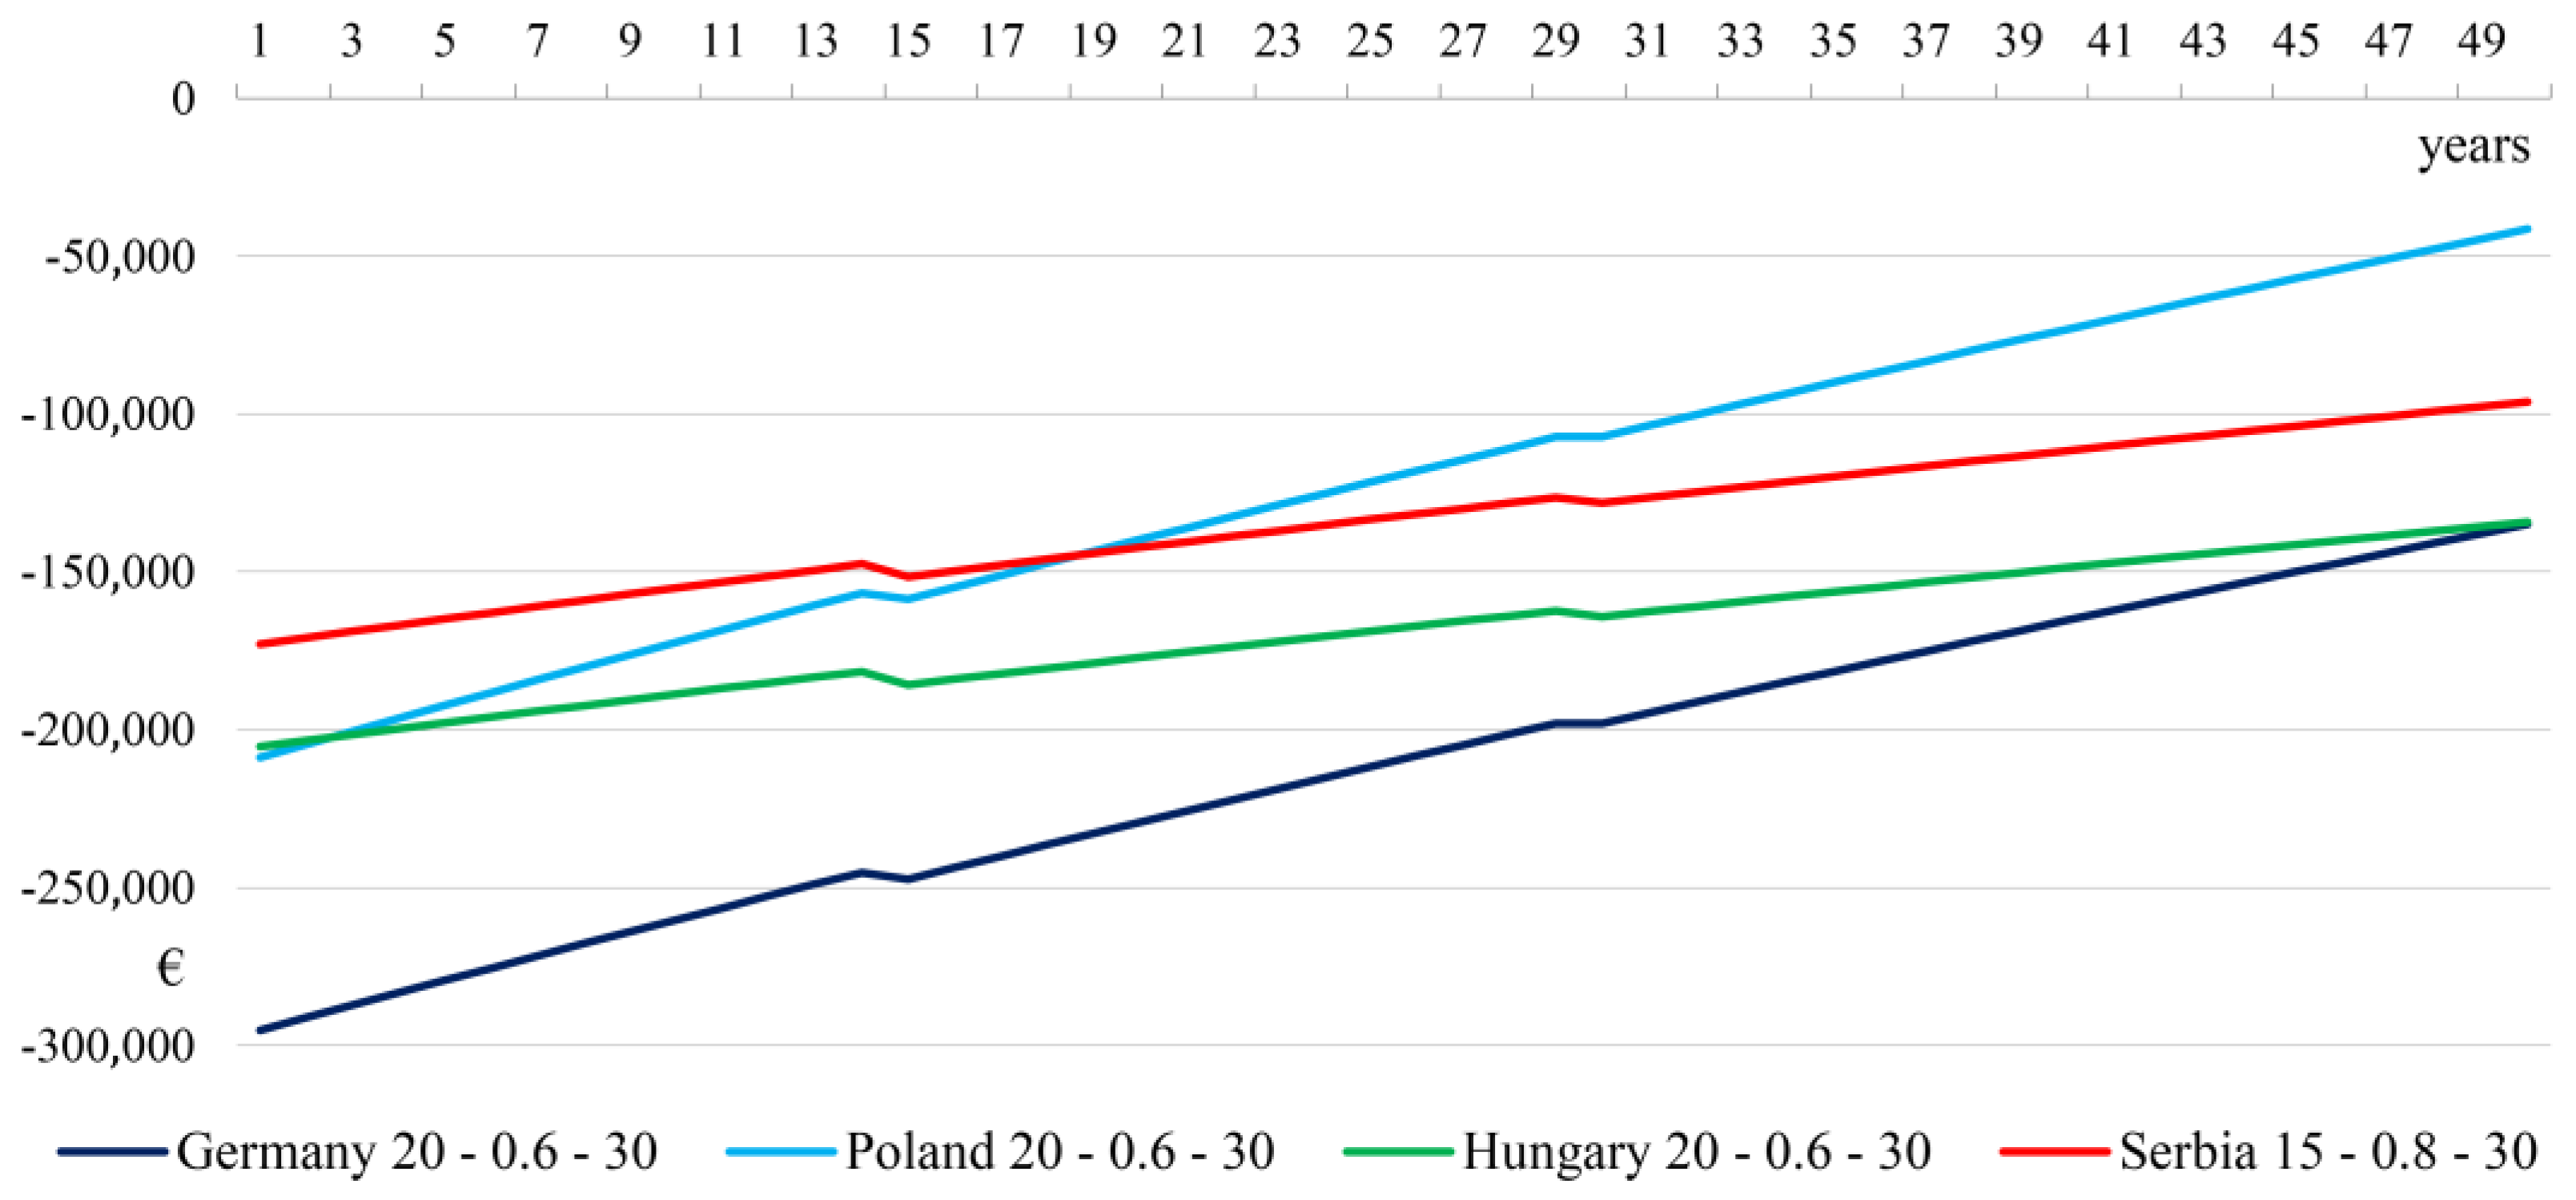
What all scenarios have in common is the lack of cost-effectiveness, as all the optimal solutions require some forms of incentives (Figure 8).
In the following section, two ways to encourage the DR cost-effectiveness are explored: carbon tax and upfront subsidies. The carbon tax was or should be introduced as a method for reducing the emissions of CO2 and other greenhouse gases. CO2 taxation is also likely to have long-term effects, especially if the rate reaches higher levels; therefore, this can be expected to lead to more renovations in the future [40].
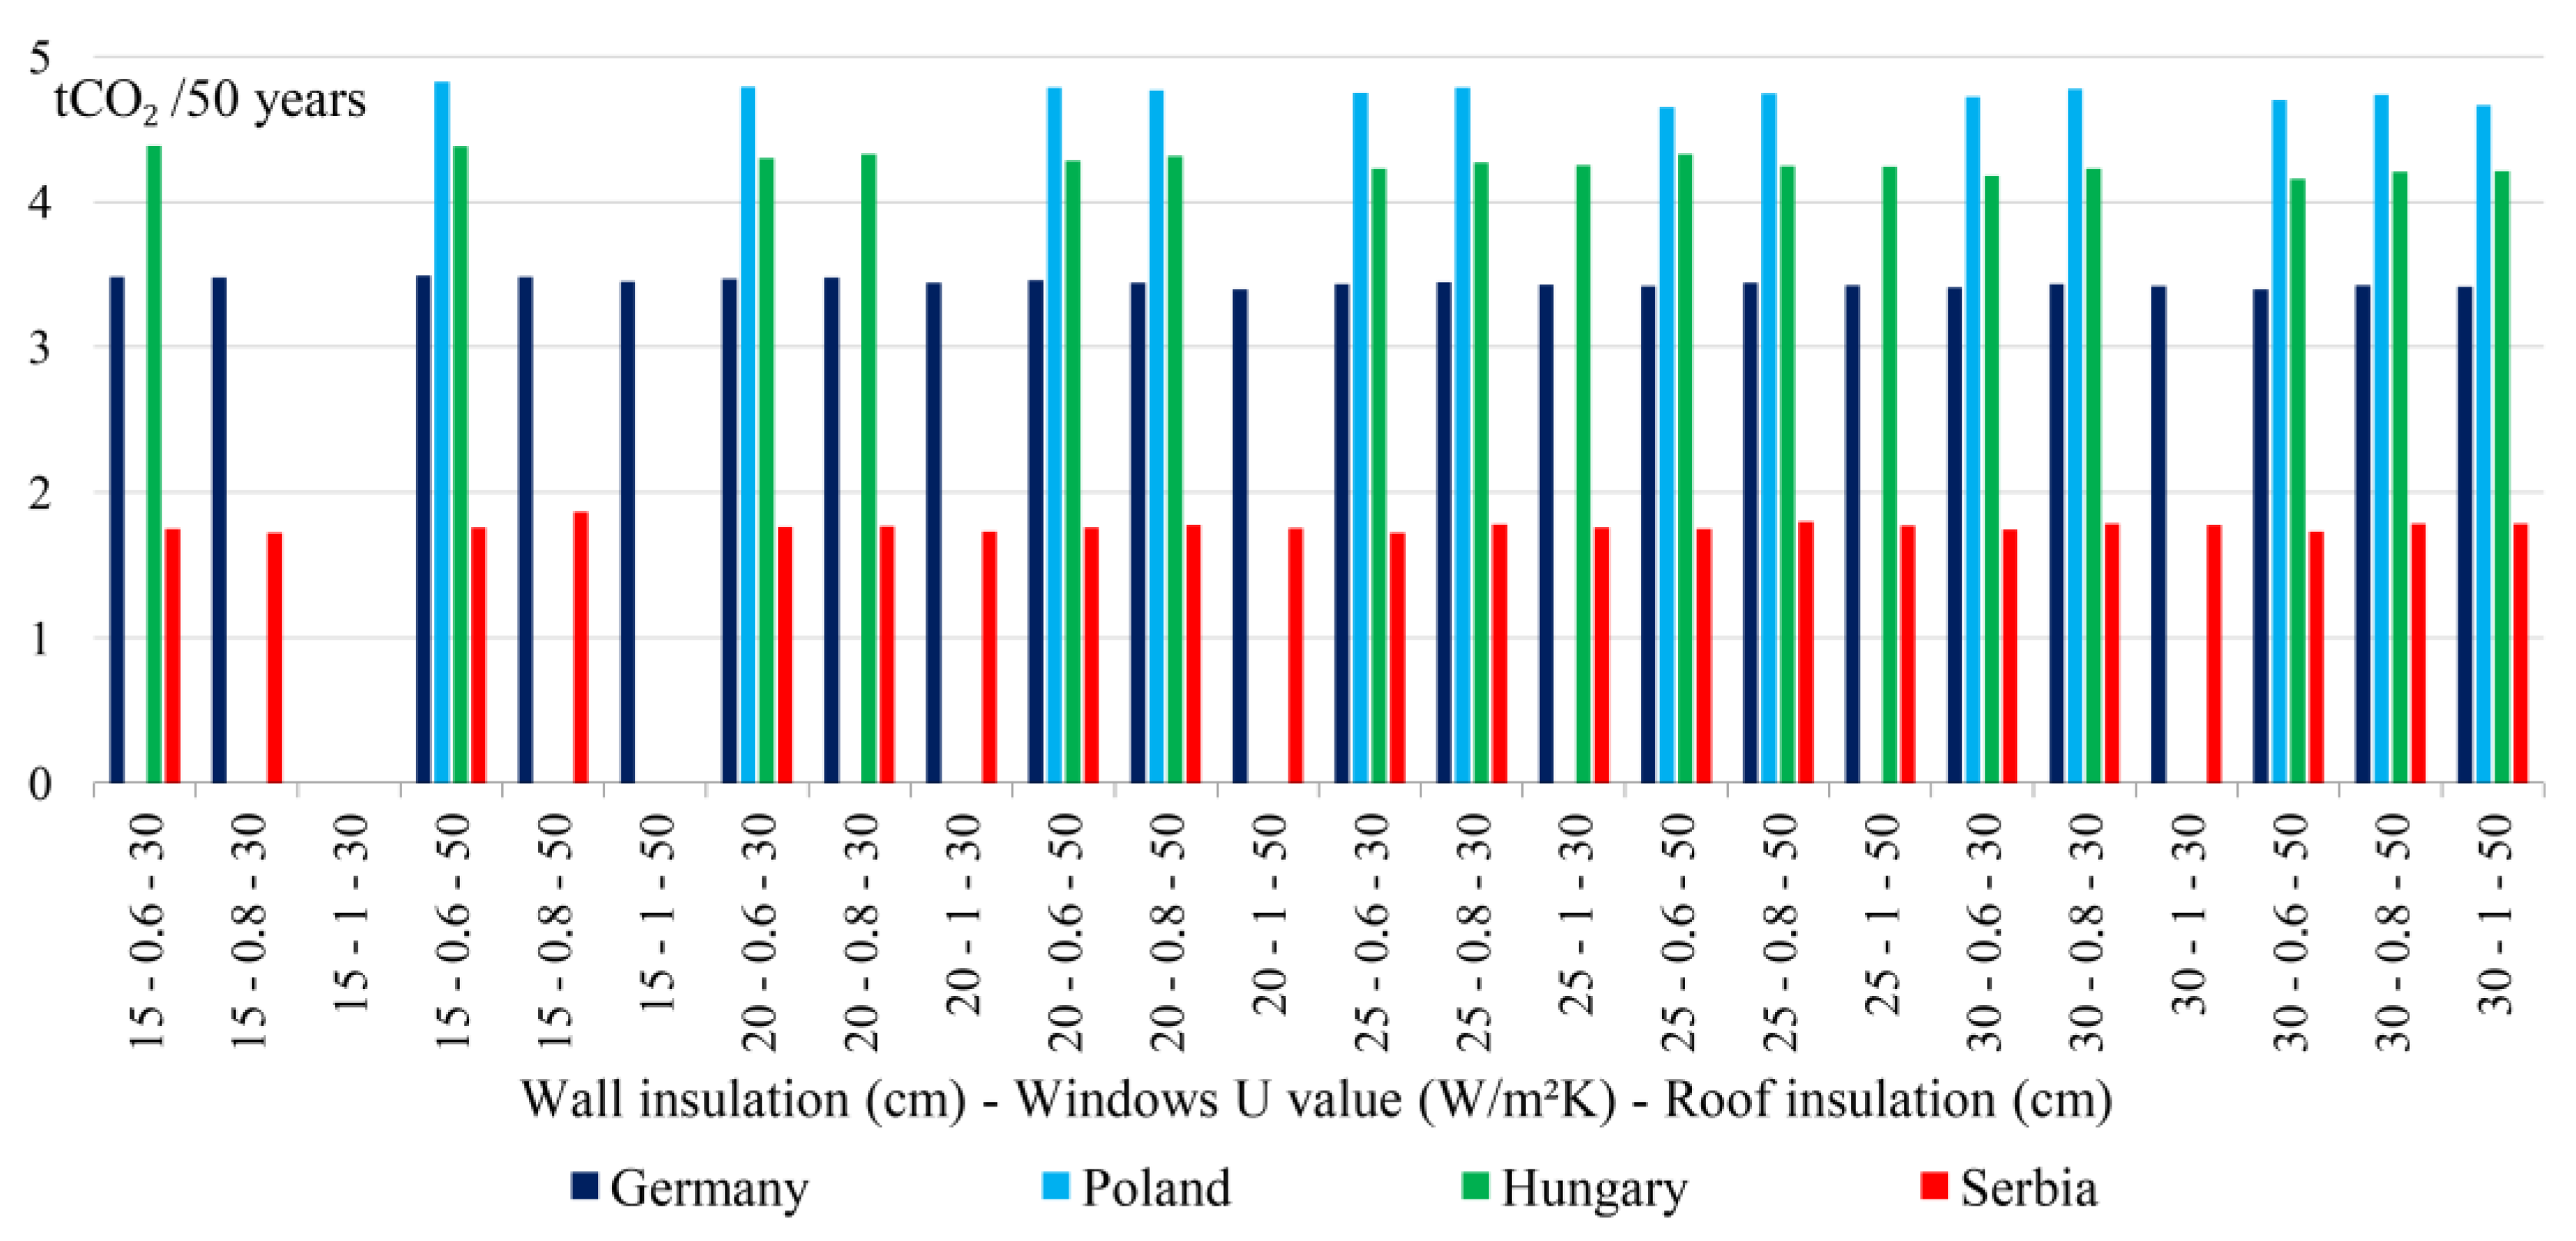
The tCO2 saved per the PH compliant buildings’ lifetime (50 years) per 1000€ invested is shown in Figure 9. The data presented here are used to propose an adequate carbon tax for each optimal scenario.
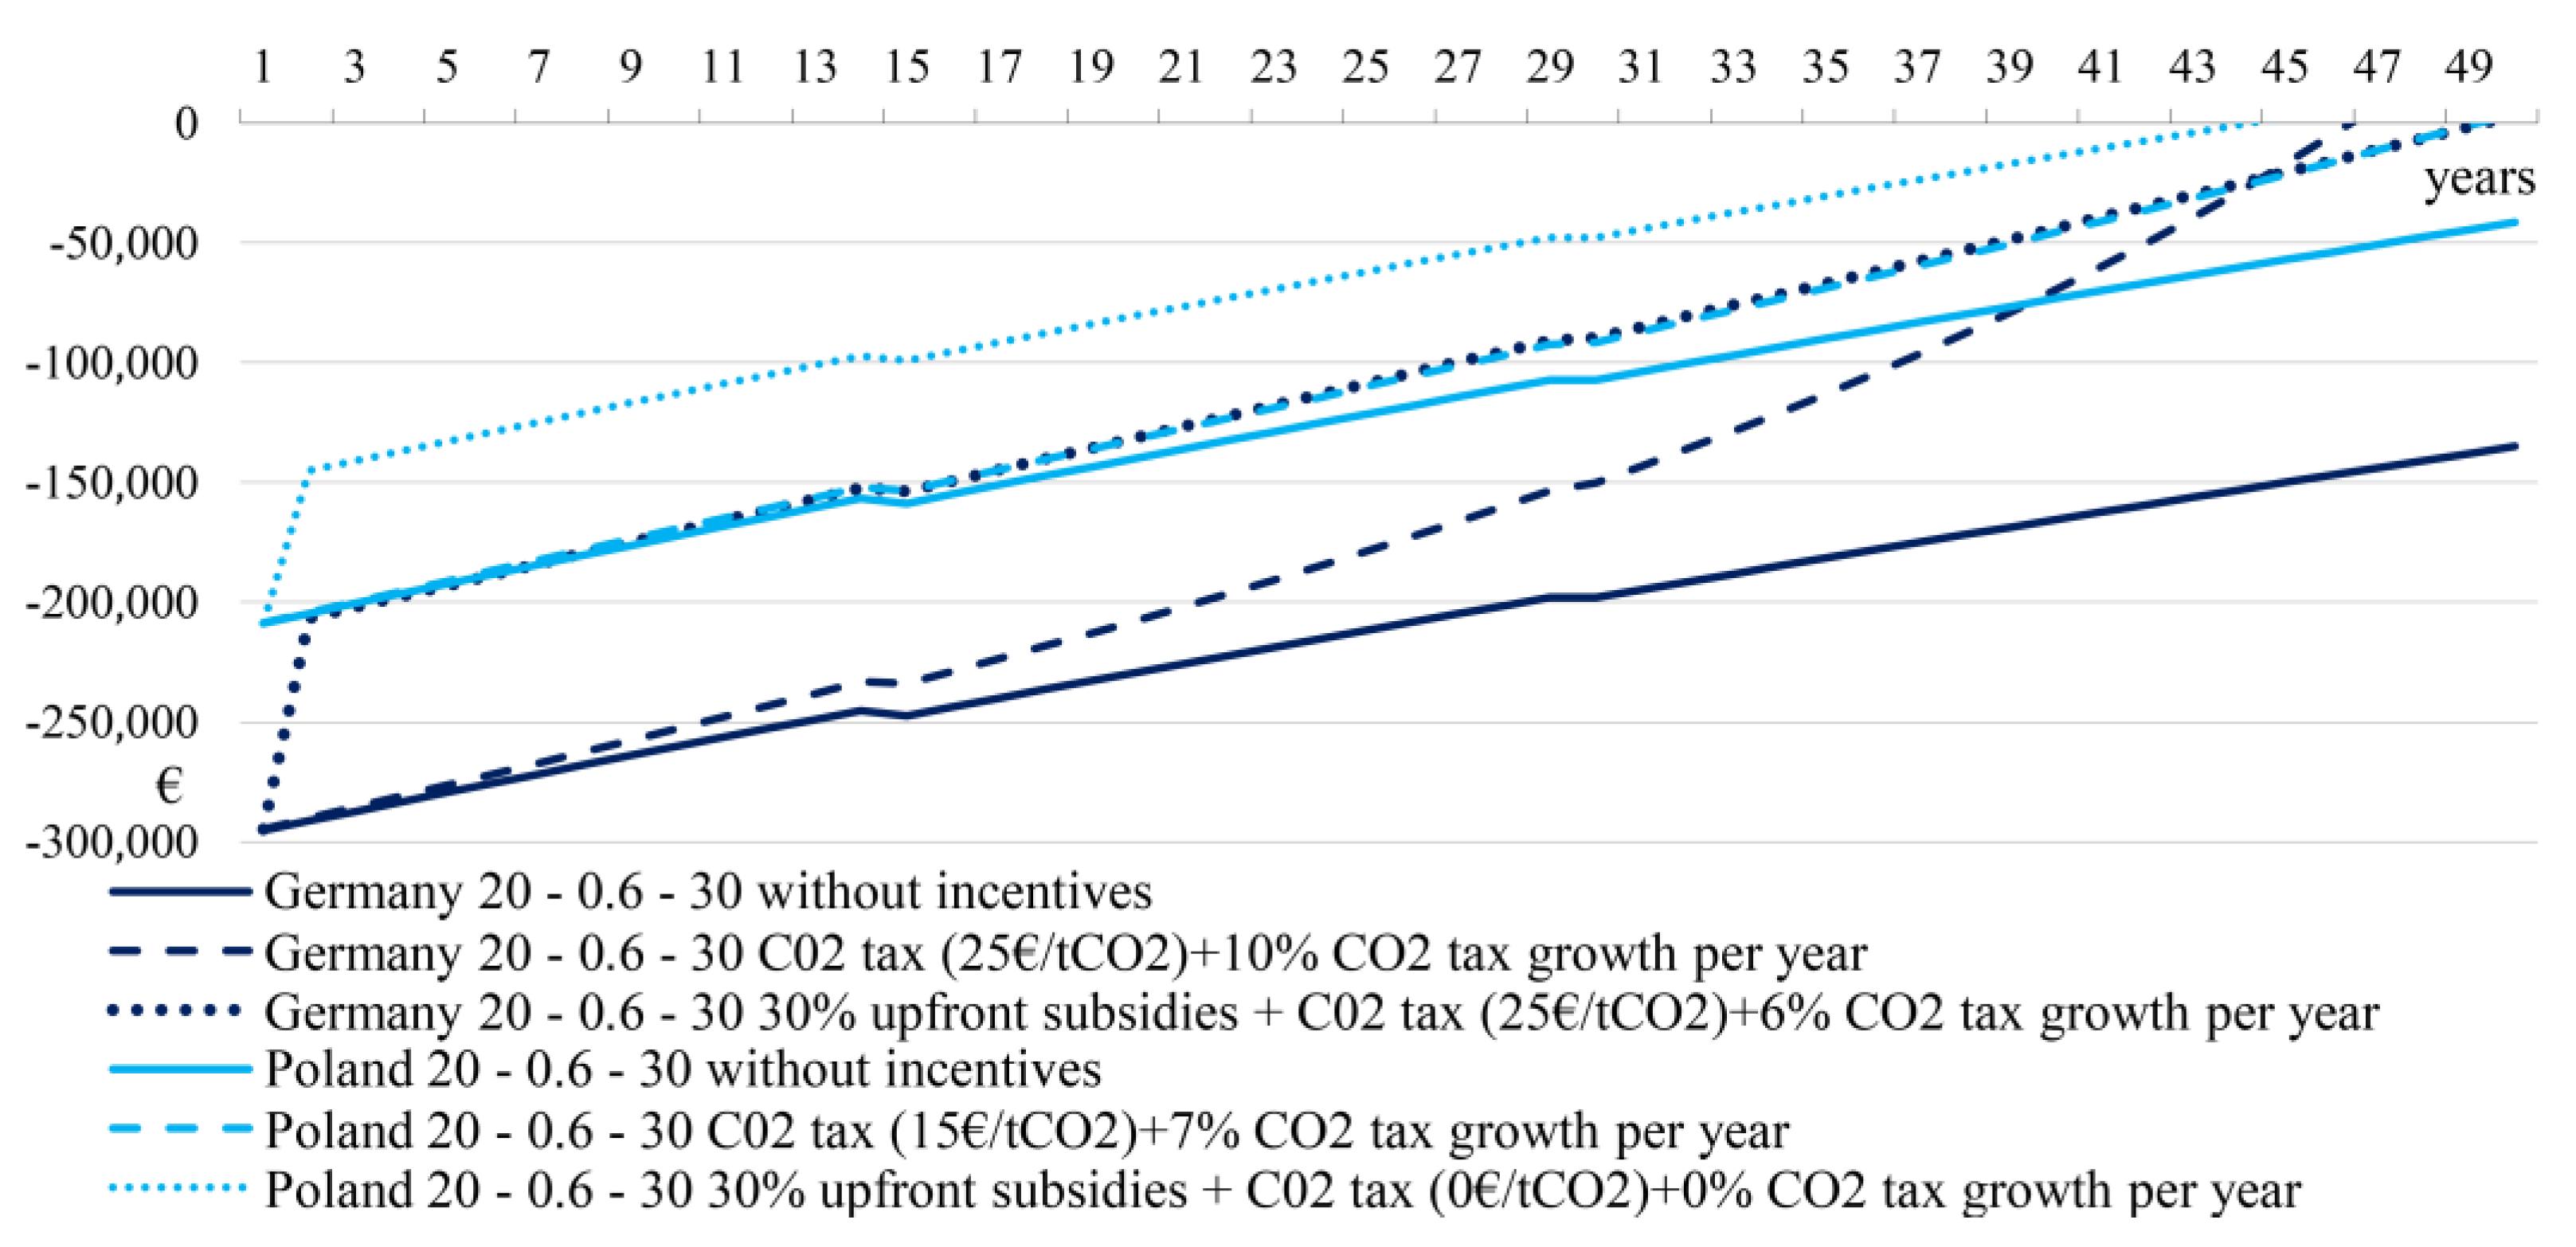
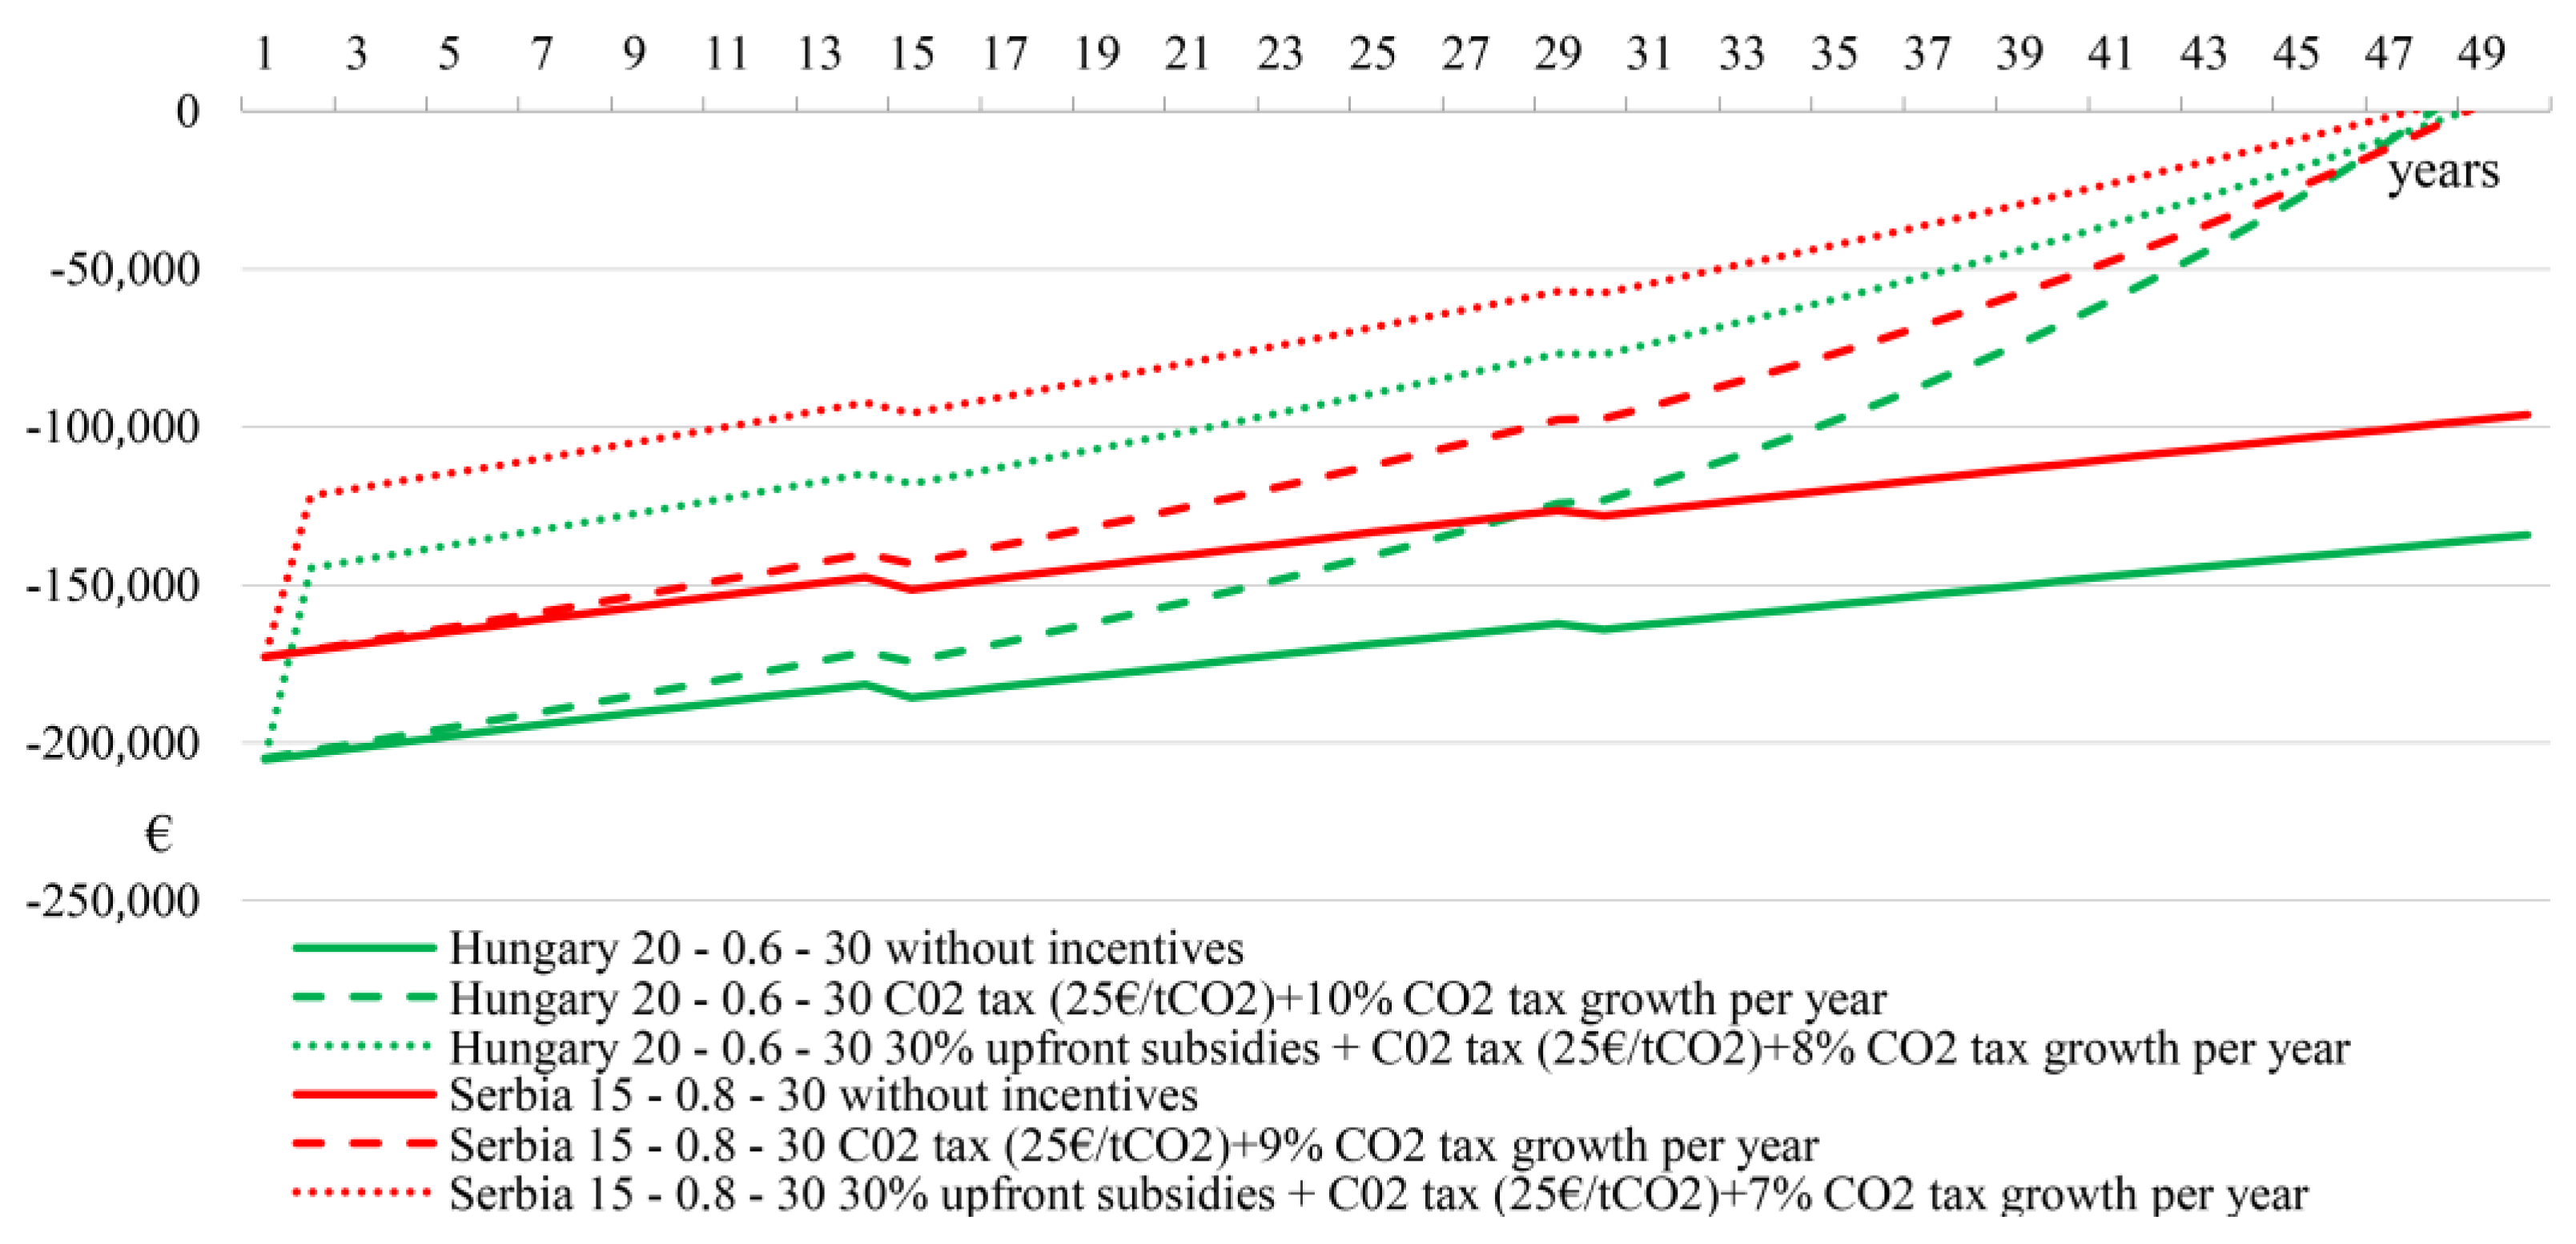
To understand which incentives are to be implemented and to what amount they could improve the cost-effectiveness of DR, we analyze here the carbon tax, upfront subsidy, and the combination of both, which can provide a positive NPV over the building’s lifetime (50 years). The results for Germany and Poland are shown in Figure 10, and for Hungary and Serbia are shown in Figure 11. The following values push optimal scenarios toward cost-effectiveness:
- 24.
- For Germany, the starting CO2 tax should amount to 25 €/tCO2 and the tax should rise 10% annually or a 30% upfront subsidy combined with a CO2 tax should amount to 25 €/tCO2 and should rise by 6% annually;
- 25.
- For Poland, the starting CO2 tax should amount to 15 €/tCO2 and the tax should rise 7% per year or a 30% upfront subsidy when the CO2 tax will not be necessary to achieve cost-effectiveness in Poland’s optimal scenario;
- 26.
- For Hungary, the starting CO2 tax should amount to 25 €/tCO2 and the tax should rise 10% annually or a 30% upfront subsidy combined with a CO2 tax that should amount to 25 €/tCO2 and should rise by 8% annually;
- 27.
- For Serbia, the starting CO2 tax should amount to 25 €/tCO2 and the tax should rise 9% per year or a 30% upfront subsidy combined with a CO2 tax that should amount to 25 €/tCO2 and should rise by 8% per year.
To maintain the objectivity, the starting carbon tax is proposed to be 25 €/tCO2 (15 €/tCO2 in the case of Poland, as 25 €/tCO2 was not necessary for the scenario to be cost effective), and the growth of the carbon tax in the observed future scenarios is limited to 250 €/tCO2. Moreover, it is assumed that electricity will be decarbonized in all observed countries by 2040.
Figure 10 and Figure 11 demonstrate that under observed conditions (d = 3.5%, with the annual energy price rise of 3%), some forms of taxing/subsidies have to be included for the optimal scenarios in all countries in order to achieve the cost-effectiveness of DR. Moreoever, in all countries, the cost-effectiveness will be achieved with a reasonable combination of carbon taxing and upfront subsidies OR with carbon taxing only if the tax starts at 25 €/tCO2 and rises at a pace that is (in all observed scenarios) slower than 10% per year.
The following conclusions can be drawn from the performed analysis:
- 28.
- The DR will not be cost-effective without the intervention of subsidies, under the expected future rise of energy prices in all observed scenarios. This conclusion is similar to the findings in [28], where it is proposed that policy innovation is necessary in order to fasten the pace of building renovations. These include the engagement of the public, and the introduction of incentives and/or tax brakes, new evaluation methods, application procedures, and innovative ways to fund renovation projects;
- 29.
- Carbon taxing, only as a measure to push projects toward cost-effectiveness, can be effective in all scenarios if the tax starts at 25 €/tCO2, and then rises at a steady pace that is (in all observed scenarios) slower than 10% per year;
- 30.
- As the DR is a labor-intensive endeavor, the different labor costs could have an enormous impact on the total costs, thus crucially impacting NPV and even overcoming some other influential factors that are considered important in such cases (e.g., the price of energy);
- 31.
- The combination of lower-than-average labor price, low price of energy, and high environmental footprint of energy could enable countries such as Poland and Serbia to secure the benefits from the carbon tax in the observed cases, even with a low carbon tax. These countries could keep the pace surprisingly well with more developed countries, but only in certain scenarios, i.e., when a replaced source of heating energy is relatively expensive. Moreover, a hidden threat in the form of a free market could undermine the only mentioned subtle comparative advantage of the Eastern European countries. Namely, the market forces attract a skilled workforce to Western Europe, jeopardizing the possibility of Eastern Europe to develop sustainably.
4. Conclusions
The feasibility of DR depends on the full range of local conditions and, as shown above, it is highly debatable in the observed scenarios throughout Europe. The feasibility is prone to the influence of the local climate conditions, the type and the price of energy in the initial scenario, and its future rise. In addition, other costs also affect the feasibility—the cost of labor, equipment, materials, the price of the carbon tax and its future rise, discount rates, etc. A major turning point toward feasibility could be observed if the state-provided stimulus/subsidy are introduced.
The general conclusion is that Western or Central Europe as a home to the Passive House have multiple advantages when it comes to the implementation of this or other rigorous housing standards; the most important is the high price of energy and climate conditions. Therefore, it is no accident that the DR is not common practice in Eastern or Southeast Europe. Yet, as Figure 10 and Figure 11 present, countries from less developed parts of Europe could utilize their strong points while conducting a much-needed transition of their building stock; in the first place, the lower price of labor that results in lower upfront costs. For this reason, Eastern European locations are better at responding to the carbon tax or upfront subsidies, i.e., with lower incentives similar results can be achieved as in more economically developed European countries.
Author Contributions
Conceptualization, D.K., J.N. and D.Ž.; methodology, D.K.; data collection, J.N.; validation, D.K., V.V. and D.Ž.; result analysis, D.K., J.N., V.V., D.G. and D.Ž.; investigation, D.K. and D.Ž.; writing—original draft preparation, D.K., J.N. and D.Ž.; writing—review and editing, D.K., J.N., V.V. and D.Ž.; visualization, D.K.; supervision, D.G. All authors have read and agreed to the published version of the manuscript.
Funding
This research received no external funding.
Acknowledgments
Authors acknowledge the Ministry of Education, Science and Technological Development of the Republic of Serbia for the support through Contracts No. 451-03-9/2021-14/200378 and 451-03-9/2021-14/200107.
Conflicts of Interest
The authors declare no conflict of interest.
References
- Eurostat Smarter, Greener, More Inclusive? Indicators to Support the Europe 2020 Strategy; EUROSTAT: Luxembourg, Germany, 2016; ISBN 9789279591471.
- Ohlsson, K.E.A.; Olofsson, T. Benchmarking the practice of validation and uncertainty analysis of building energy models. Renew. Sustain. Energy Rev. 2021, 142, 110842. [Google Scholar] [CrossRef]
- Kalamees, T.; Lupíšek, A.; Sojková, K.; Mørck, O.C.; Borodinecs, A.; Almeida, M.; Rovers, R.; Op’Tveld, P.; Kuusk, K.; Silva, S. What Kind of Heat Loss Requirements NZEB and Deep Renovation Sets for Building Envelope? In Proceedings of the CESB 2016—Central Europe towards Sustainable Building 2016: Innovations for Sustainable Future, Prague, Czech Republic, 22–24 June 2016; pp. 137–144. [Google Scholar]
- Amoruso, F.M.; Sonn, M.; Schuetze, T. Carbon-neutral building renovation potential with passive house-certified components: Applications for an exemplary apartment building in the Republic of Korea. Build. Environ. 2022, 215, 108986. [Google Scholar] [CrossRef]
- Mikola, A.; Hamburg, A.; Kuusk, K.; Kalamees, T.; Voll, H.; Kurnitski, J. The impact of the technical requirements of the renovation grant on the ventilation and indoor air quality in apartment buildings. Build. Environ. 2022, 210, 108698. [Google Scholar] [CrossRef]
- Rose, J.; Kragh, J.; Nielsen, K.F. Passive house renovation of a block of flats—Measured performance and energy signature analysis. Energy Build. 2022, 256, 111679. [Google Scholar] [CrossRef]
- Femenías, P.; Mjörnell, K.; Thuvander, L. Rethinking Deep Renovation: The Perspective of Rental Housing in Sweden. J. Clean. Prod. 2018, 195, 1457–1467. [Google Scholar] [CrossRef]
- Dotzler, C.; Botzler, S.; Kierdorf, D.; Lang, W. Methods for Optimising Energy Efficiency and Renovation Processes of Complex Public Properties. Energy Build. 2018, 164, 254–265. [Google Scholar] [CrossRef]
- Krizmane, M.; Borodinecs, A.; Dzelzitis, E. Enabling the Landscape for Deep Green Renovations. Energy Procedia 2016, 96, 404–412. [Google Scholar] [CrossRef] [Green Version]
- Jradi, M.; Veje, C.; Jørgensen, B.N. Deep Energy Renovation of the Mærsk Office Building in Denmark Using a Holistic Design Approach. Energy Build. 2017, 151, 306–319. [Google Scholar] [CrossRef]
- Bonakdar, F.; Dodoo, A.; Gustavsson, L. Cost-Optimum Analysis of Building Fabric Renovation in a Swedish Multi-Story Residential Building. Energy Build. 2014, 84, 662–673. [Google Scholar] [CrossRef]
- Semprini, G.; Gulli, R.; Ferrante, A. Deep Regeneration vs Shallow Renovation to Achieve Nearly Zero Energy in Existing Buildings: Energy Saving and Economic Impact of Design Solutions in the Housing Stock of Bologna. Energy Build. 2017, 156, 327–342. [Google Scholar] [CrossRef]
- Cholewa, T.; Balaras, C.A.; Nižetić, S.; Siuta-Olcha, A. On Calculated and Actual Energy Savings from Thermal Building Renovations—Long Term Field Evaluation of Multifamily Buildings. Energy Build. 2020, 223, 110145. [Google Scholar] [CrossRef]
- Iturriaga, E.; Aldasoro, U.; Terés-Zubiaga, J.; Campos-Celador, A. Optimal Renovation of Buildings towards the Nearly Zero Energy Building Standard. Energy 2018, 160, 1101–1114. [Google Scholar] [CrossRef]
- Guardigli, L.; Bragadin, M.A.; Della Fornace, F.; Mazzoli, C.; Prati, D. Energy Retrofit Alternatives and Cost-Optimal Analysis for Large Public Housing Stocks. Energy Build. 2018, 166, 48–59. [Google Scholar] [CrossRef]
- Mainali, B.; Mahapatra, K.; Pardalis, G. Strategies for Deep Renovation Market of Detached Houses. Renew. Sustain. Energy Rev. 2021, 138, 110659. [Google Scholar] [CrossRef]
- Mazzeo, D.; Matera, N.; Cornaro, C.; Oliveti, G.; Romagnoni, P.; De Santoli, L. EnergyPlus, IDA ICE and TRNSYS predictive simulation accuracy for building thermal behaviour evaluation by using an experimental campaign in solar test boxes with and without a PCM module. Energy Build. 2020, 212, 109812. [Google Scholar] [CrossRef]
- Zakula, T.; Bagaric, M.; Ferdelji, N.; Milovanovic, B.; Mudrinic, S.; Ritosa, K. Comparison of Dynamic Simulations and the ISO 52016 Standard for the Assessment of Building Energy Performance. Appl. Energy 2019, 254, 113553. [Google Scholar] [CrossRef]
- Solar Energy Lab., University of Wisconsi. TRNSYS 18: A Transient System Simulation Program. Available online: http://www.trnsys.com/ (accessed on 17 March 2022).
- Building Technologies Office of U.S. Department of Energy’s (DOE). EnergyPlus Version 9.6. Available online: https://energyplus.net/ (accessed on 17 March 2022).
- Equa Simulation, A.B. IDA Indoor Climate And Energy 4.8. Available online: https://www.equa.se/en/ (accessed on 17 March 2022).
- Modelica Association, Modelica®—A Unified Object-Oriented Language for Systems Modeling, Language Specification, Version 3.4. Available online: https://www.modelica.org/ (accessed on 17 March 2022).
- Boyano, A.; Hernandez, P.; Wolf, O. Energy demands and potential savings in European office buildings: Case studies based on EnergyPlus simulations. Energy Build. 2013, 65, 19–28. [Google Scholar] [CrossRef]
- TABULA Building Typologies—Country Pages. Available online: https://episcope.eu/building-typology/country/ (accessed on 17 March 2022).
- Loga, T.; Stein, B.; Diefenbach, N. TABULA building typologies in 20 European countries—Makingenergy-related features of residential building stocks comparable. Energy Build. 2016, 132, 4–12. [Google Scholar] [CrossRef]
- Van Oorschot, J.A.W. Housing Typology Assessment MORE-CONNECT WP3.1. Eur. Rep. 2016, 7, 1–116. [Google Scholar]
- Corgnati, S.P.; Fabrizio, E.; Filippi, M.; Monetti, V.; Dalbem, R.; Grala da Cunha, E.; Vicente, R.; Figueiredo, A.A.; Oliveira, R.; da Silva, A.C.S.B.; et al. Reference Buildings for Cost Optimal Analysis: Method of Definition and Application. Appl. Energy 2013, 240, 110871. [Google Scholar] [CrossRef]
- Remeikienė, R.; Gasparėnienė, L.; Fedajev, A.; Szarucki, M.; Đekić, M.; Razumienė, J. Evaluation of Sustainable Energy Development Progress in EU Member States in the Context of Building Renovation. Energies 2021, 14, 4209. [Google Scholar] [CrossRef]
- Building Technologies Office of U.S. Department of Energy’s (DOE) Weather Data by Region. Available online: https://energyplus.net/weather-region/europe_wmo_region_6 (accessed on 17 March 2022).
- EUROSTAT Electricity Price Statistics. Available online: https://ec.europa.eu/eurostat/statistics-explained/index.php/Electricity_price_statistics (accessed on 17 March 2022).
- EUROSTAT Natural Gas Price Statistics. Available online: https://ec.europa.eu/eurostat/statistics-explained/index.php/Energy_price_statistics#:~:text=Theaveragepriceinthe,wasEUR0.0656perkWh (accessed on 17 March 2022).
- EEA CO2 Intensity of Electricity Generation. Available online: https://www.eea.europa.eu/data-and-maps/data/co2-intensity-of-electricity-generation (accessed on 17 March 2022).
- Hirvonen, J.; Jokisalo, J.; Kosonen, R. The Effect of Deep Energy Retrofit on the Hourly Power Demand of Finnish Detached Houses. Energies 2020, 13, 1773. [Google Scholar] [CrossRef] [Green Version]
- Institute, P.H. Criteria for the Passive House, EnerPHit and PHI Low Energy Building Standard; Passive House Institute: Darmstadt, Germany, 2016; pp. 1–27. [Google Scholar]
- Rulebook on Energy Efficiency of Buildings; RS Official Gazette: Belgrade, Serbia, 2011. (In Serbian)
- Asdrubali, F.; Ballarini, I.; Corrado, V.; Evangelisti, L.; Grazieschi, G.; Guattari, C. Energy and Environmental Payback Times for an NZEB Retrofit. Build. Environ. 2019, 147, 461–472. [Google Scholar] [CrossRef]
- EUROSTAT Hourly Labour Costs. Available online: https://ec.europa.eu/eurostat/statistics-explained/index.php/Hourly_labour_costs (accessed on 17 March 2022).
- Dodoo, A.; Gustavsson, L.; Tettey, U.Y.A. Final Energy Savings and Cost-Effectiveness of Deep Energy Renovation of a Multi-Storey Residential Building. Energy 2017, 135, 563–576. [Google Scholar] [CrossRef]
- Steinbach, J.; Staniaszek, D. Discount Rates in Energy System Analysis; Fraunhofer ISI, Building Performance Institute Europe (BPIE): Karlsruhe, Germany, 2015; Volume 6, pp. 1–20. [Google Scholar]
- Ott, L.; Weber, S. How effective is carbon taxation on residential heating demand? A household-level analysis. Energy Policy 2022, 160, 112698. [Google Scholar] [CrossRef]
Figure 1.
Flow diagram of the proposed optimization methodology.

Figure 2.
Multi-apartment building adopted from [18].
Figure 2.
Multi-apartment building adopted from [18].

Figure 3.
Used values for residential heating degree days (HDD) and cooling degree days (CDD) for observed locations.
Figure 3.
Used values for residential heating degree days (HDD) and cooling degree days (CDD) for observed locations.

Figure 4.
Prices of different types of energy (left axis) and the footprint of energy (right axis).

Figure 5.
The structure of the costs for DR for two countries with the most extreme differences in the cost of manpower—Germany (left) and Serbia (right) for 30-0.6-50 case.
Figure 5.
The structure of the costs for DR for two countries with the most extreme differences in the cost of manpower—Germany (left) and Serbia (right) for 30-0.6-50 case.

Figure 6.
Energy consumption per m2 of net living space.

Figure 7.
Investment costs per net living space for each country (black-dotted line—optimal solutions).
Figure 7.
Investment costs per net living space for each country (black-dotted line—optimal solutions).

Figure 8.
Results of NPV analysis for optimal scenarios without incentives (d = 3.5%, energy price rise 2% per year).
Figure 8.
Results of NPV analysis for optimal scenarios without incentives (d = 3.5%, energy price rise 2% per year).

Figure 9.
tCO2 saved per PH compliant buildings’ lifetime (50 years) per 1000€ invested.

Figure 10.
The combination of the incentives that could result in an NPV cost-effective period of 50 years (d = 3.5%, energy price rise 3% per year) for the optimal NG scenarios for Germany and Poland.
Figure 10.
The combination of the incentives that could result in an NPV cost-effective period of 50 years (d = 3.5%, energy price rise 3% per year) for the optimal NG scenarios for Germany and Poland.

Figure 11.
The combination of the incentives that could result in an NPV cost-effective period of 50 years (d = 3.5%, energy price rise 3% per year) for the optimal NG scenarios for Hungary and Serbia.
Figure 11.
The combination of the incentives that could result in an NPV cost-effective period of 50 years (d = 3.5%, energy price rise 3% per year) for the optimal NG scenarios for Hungary and Serbia.

Publisher’s Note: MDPI stays neutral with regard to jurisdictional claims in published maps and institutional affiliations. |
© 2022 by the authors. Licensee MDPI, Basel, Switzerland. This article is an open access article distributed under the terms and conditions of the Creative Commons Attribution (CC BY) license (https://creativecommons.org/licenses/by/4.0/).
Share and Cite
MDPI and ACS Style
Končalović, D.; Nikolic, J.; Vukasinovic, V.; Gordić, D.; Živković, D. Possibilities for Deep Renovation in Multi-Apartment Buildings in Different Economic Conditions in Europe. Energies 2022, 15, 2788. https://doi.org/10.3390/en15082788
AMA Style
Končalović D, Nikolic J, Vukasinovic V, Gordić D, Živković D. Possibilities for Deep Renovation in Multi-Apartment Buildings in Different Economic Conditions in Europe. Energies. 2022; 15(8):2788. https://doi.org/10.3390/en15082788
Chicago/Turabian StyleKončalović, Davor, Jelena Nikolic, Vladimir Vukasinovic, Dušan Gordić, and Dubravka Živković. 2022. "Possibilities for Deep Renovation in Multi-Apartment Buildings in Different Economic Conditions in Europe" Energies 15, no. 8: 2788. https://doi.org/10.3390/en15082788
Note that from the first issue of 2016, this journal uses article numbers instead of page numbers. See further details here.