1. Introduction
Companies operating in today’s business reality must deal with high pressure resulting from frequent technological changes, emerging disruptive changes, and the necessity to improve the products and services they offer to meet, on the one hand, customer needs and on the other, the requirements and policies of regulators [
1]. Adapting to rapidly and significantly changing conditions requires strategic thinking, which includes recognizing megatrends, which are defined as major social, economic, political, and technological changes that form slowly and affect people over an extended period [
2]. In the literature, the term entrepreneurial orientation is used to describe a company’s approach to strategy creation and implementation that manifests itself in specific actions that are inherently entrepreneurial [
3]. This article describes the activities and results of the first phase of the development project of a new product that can be considered a manifestation of such an orientation. The project aims to develop an industrial fan with a unique design, characterised by a reduced level of noise emission and increased energy efficiency. The initiation and implementation of the project in question are tied to three aspects described as elements of entrepreneurial orientation, namely innovation, risk taking, and proactivity [
4].
The first element refers to creativity, the tendency to experiment as well as tolerance and desire to promote innovative ideas [
5]. The basic assumption of the project itself and its activities is the belief that innovative design changes can be made. Moreover, these changes are expected to lead to the creation of a product that will be more energy efficient. The process of its development is based on advanced methods, including the use of artificial neural networks and numerical modelling to optimise fan parameters. The second element, i.e., risk taking, refers to activities that involve uncertainty about the final outcome but whose success involves significant benefits [
6]. The described project has just such characteristics. The last element of entrepreneurial orientation, also representing an aspect of project activities, is proactivity, which refers to taking the initiative to gain a competitive advantage [
7]. The level of fan parameters assumed in this project will be very competitive globally.
The article consists of the following parts. The first part describes the types of fans. In addition, it discusses the currently prevailing approach to their design, which results in frequent oversizing of the equipment and, at the same time, provides the opportunity for significant optimisations if an innovative approach is taken at the stage of finding solutions. The next part of the article describes the assumptions and the course of activities performed at the first stage of the innovative research and development project in question. The next element of the article is a description of the process of creating a mathematical model containing significant parameters that affect the efficiency of a fan in a given ventilation system. A summary and conclusions are shown in the final part of the article.
Types of Fans, Prevailing Design Approach
Fans find a wide range of applications in virtually all areas of human life and are intended for use in a variety of specific locations. They can be classified in a number of ways, e.g., by the installation method (discharge, suction and combination of both), design features, pressure value (low-pressure, high-pressure), number of rotors (single-rotor and multi-rotor), application (transport, smoke extract, explosion-proof) and installation site (mine, sea). Depending on the installation site, it is possible to distinguish e.g., wall, ceiling, or roof fans. Other examples of fan applications include:
ventilation equipment (room ventilation), foundries, power plants, mines, cinemas, lecture halls, etc.;
motor and electricity generator cooling;
internal combustion engine cooling;
fan cooling towers;
air condensers in cooling systems;
draft and blast fans,
electronic systems for cooling components and many other applications [
8,
9,
10].
Fans, as a device, are an often underestimated but very important component of larger industrial systems due to the noise they generate, but above all, in terms of electricity consumption. Nearly 80% of the electricity generated is consumed by electric motors, of which about 15% is used by the motors that drive the fans [
11]. Fans installed in the U.S. industrial sector consume about 11% of the electricity of all industrial motor drives [
12]. On the other hand, in India, ceiling fans alone consume about 9% of all electricity produced [
13]. Improving fan efficiency is an essential step towards reducing energy consumption globally. Fans should always be considered as a whole, in combination with the ventilation system, i.e., elements such as: inlet (inlet nozzles, inlet boxes, vane diffusers, filters), outlet (guide wheels, exhaust manifold, silencers), drive (direct, belt, gear) with control and regulation system, heat exchangers, partitions, and proper equipment.
Economic operation and maintenance of a ventilation system require the right approach, not only an analysis of the needs of individual equipment components but also the system as a whole. The system approach makes it possible to analyse not only the inlet to and outlet from the system but also how they interact with each other. Ventilation system designers often focus on the direct requirements for individual elements, neglecting the system as a whole, which affects its individual components. This includes the specification of current operating conditions and parameters, the temporary status of the machine, the collection and analysis of operational data, the development of load cycles, the evaluation of energy consumption in relation to operating conditions, or the continuous monitoring and ongoing optimisation of the system. To ensure adequate reliability of fan operation, system installers design fan systems conservatively and tend to compensate for uncertainties in the design of the process by increasing fan efficiency and pressure [
14]. Unfortunately, oversizing fan systems increases their operating costs while reducing the reliability of the fan itself. Due to service requirements, these fans do not work at the best operating points. In extreme cases, they may operate unstably, generating excess flow energy, which results in high levels of air flow noise and increased fan and system load.
While reviewing existing fan solutions and ongoing fan research, one can identify several areas for improvement of gas transport processes using flow fans. These include improving the energy efficiency of the fan itself as a device, together with the drive, introducing measures to reduce the noise generated, and improving gas transport efficiency within the ventilation system. The most significant opportunities lie in providing solutions for the ventilation system, selecting the right fan for it, and then in the fan itself, its drive system, and the adjustment method. All the mentioned measures are interrelated and directly influence each other.
Choosing a fan is a complex process that starts with knowing the basic operating requirements of the system and the operating conditions, such as airflow rate, temperature, pressure, airflow properties, and ventilation system structure. The variability of these factors and other considerations, such as cost, efficiency, service life, maintenance, speed, type of material, spatial limitations, drive systems, temperature, and range of operating conditions makes fan selection very complicated. However, factors that bring reduction of energy consumption when modernising or expanding a system can be very helpful in the process of fan selection. Often a given type of fan is chosen for non-technical reasons, such as price, delivery conditions, availability, designer, operator, or familiarity with the fan model. As a result, the noise level, energy costs, maintenance requirements, system reliability, or fan efficiency can be worse than expected. Fans are usually selected from a range of models and sizes rather than designed specifically for a particular application. Fan selection is based on calculating the requirements for gas flow and pressure in the ventilation system. Unfortunately, there is a high level of uncertainty associated with predicting gas flow resistance in the system. This uncertainty, combined with the effects of contamination and anticipated changes in system resistance, forces the introduction of efficiency and pressure reserves beyond the potentially nominal state. The problems and costs associated with poor fan choice can be eliminated in the future through the adequate collection of data that will constitute feedback from the operation [
15].
By determining the relationship between the practical conditions and the characteristics of the fans and the ventilation system themselves, and by knowing the significance of the influence of individual system components, we can substantially influence the process of designing and selecting a fan. For this reason, before starting research work on the design of a high-efficiency and thus low-noise fan, it is necessary to have a mathematical model of its operation within the system, verified numerically and experimentally in actual operating conditions.
In the subject literature, the authors have not found comprehensive solutions for a remote, fully autonomous system for measuring the operational parameters of fans. There are attempts to build a digital model of interconnected ventilation networks and the possibility of using the development of a ventilation network for prospective calculations [
16]. It is possible to encounter control and diagnostic systems that provide only current control of fan station parameters and signalling of emergency conditions [
17,
18]. It is also possible to find a system for monitoring the operation of master ventilation mining fans, including control systems for fan drives and dampers, and a fan operation supervision system, whose task is to monitor and visualise the operation of the fans [
19]. There are also analytical methods for creating a system for optimal control of the operation of a simple ventilation system that uses measurement data [
20]. For fans, there also exists a diagnostic system that prevents failures by using vibration measurement and a predictive model that uses neural networks. However, this only applies to protection against failures [
21].
As part of building a remote system for measuring the operational parameters of fans in actual conditions, a selection of points and parameters measured at selected locations was made to collect mass data. This selection was intended to ensure adequate repeatability and relevance of the measurements. The selection of data was made in the form of a time series (daily characteristics with a sampling frequency of 1 Hz) for future algorithm training, sample description, and selection and extraction of attributes. A mathematical model was then created using linear regression and neural networks to evaluate the condition of a given fan in a specific installation configuration on the basis of selected measurement parameters.
The innovativeness of the current approach lies in its comprehensiveness. Installing a number of sensors determined the fans’ characteristics and began identifying significant parameters. Based on this data, models were built that will be further used in the fan design process. They are likely to be an efficient tool for generating and verifying ideas for the modernization of fans and fan systems after further development. As was previously highlighted, the authors did not find such comprehensive solutions in the literature. There are only solutions with limited functionality that include, e.g., diagnostic systems to prevent breakdowns and signal emergency states. It might be possible to maintain satisfactory model accuracy while reducing the number of measuring devices (suction or discharge pressure, current consumption, rotational speed, and flow). In particular, eliminating the need to measure flow, the sensors of which are most expensive, would be beneficial. We believe that there is a novelty in the approach described in the present paper.
2. Description of the Conducted Research
As part of the project activities, a selection of centrifugal fans operating in actual conditions produced by Nyborg–Mawent was made. The selection was guided by several criteria, including fan type, fan operating conditions, and the availability of local internet infrastructure. One of the main criteria was the strategic importance of a given fan in the Nyborg–Mawent offer. This is because it was crucial to concentrate the works and research on those fans that are purchased and installed most frequently. Their potential modification and increased efficiency would be the most beneficial to the manufacturer, its customers, and the wider environment. For the measurements, representative centrifugal fan designs were selected from among Nyborg–Mawent’s ZWP, ZWWOax, ZWPSe, and WPSS types working in actual operating conditions to analyse their operational parameters at the installation site in comparison to the design assumptions.
In the course of site inspections and installation, the team encountered a problem with power, which had to be supplied to the measurement set. For some fans, this was difficult due to the distance between the fan and the power source. This problem was successfully solved by designing an original, innovative device that enables obtaining power directly from the inverter of a fan. The experiments performed in laboratory conditions made it possible to create a unique power supply solution, thanks to which electrical energy with the right parameters can be supplied with sufficiently good accuracy to all measurement sensors. It is currently the subject of a patent clearance study.
Further activities included defining the essential measurement equipment, namely sensors of pressure, temperature, flow, humidity, electrical, and electronic components to take remote mass measurements. This was necessary to perform the measurements correctly, i.e., to precisely determine the physical quantities measured and the method of measuring them. To this end, a technical specification was developed for each of the measurement elements according to the assumed requirements of the dataset.
The selection, arrangement, and installation of temperature, pressure, current consumption, rotational speed, humidity, and flow velocity sensors were planned and made in accordance with the EN-ISO-5802: 2008E-1 standard. (Industrial fans–performance testing in situ) [
22]. It was similar for each measured fan; however, it was conditioned by the assembly possibilities.
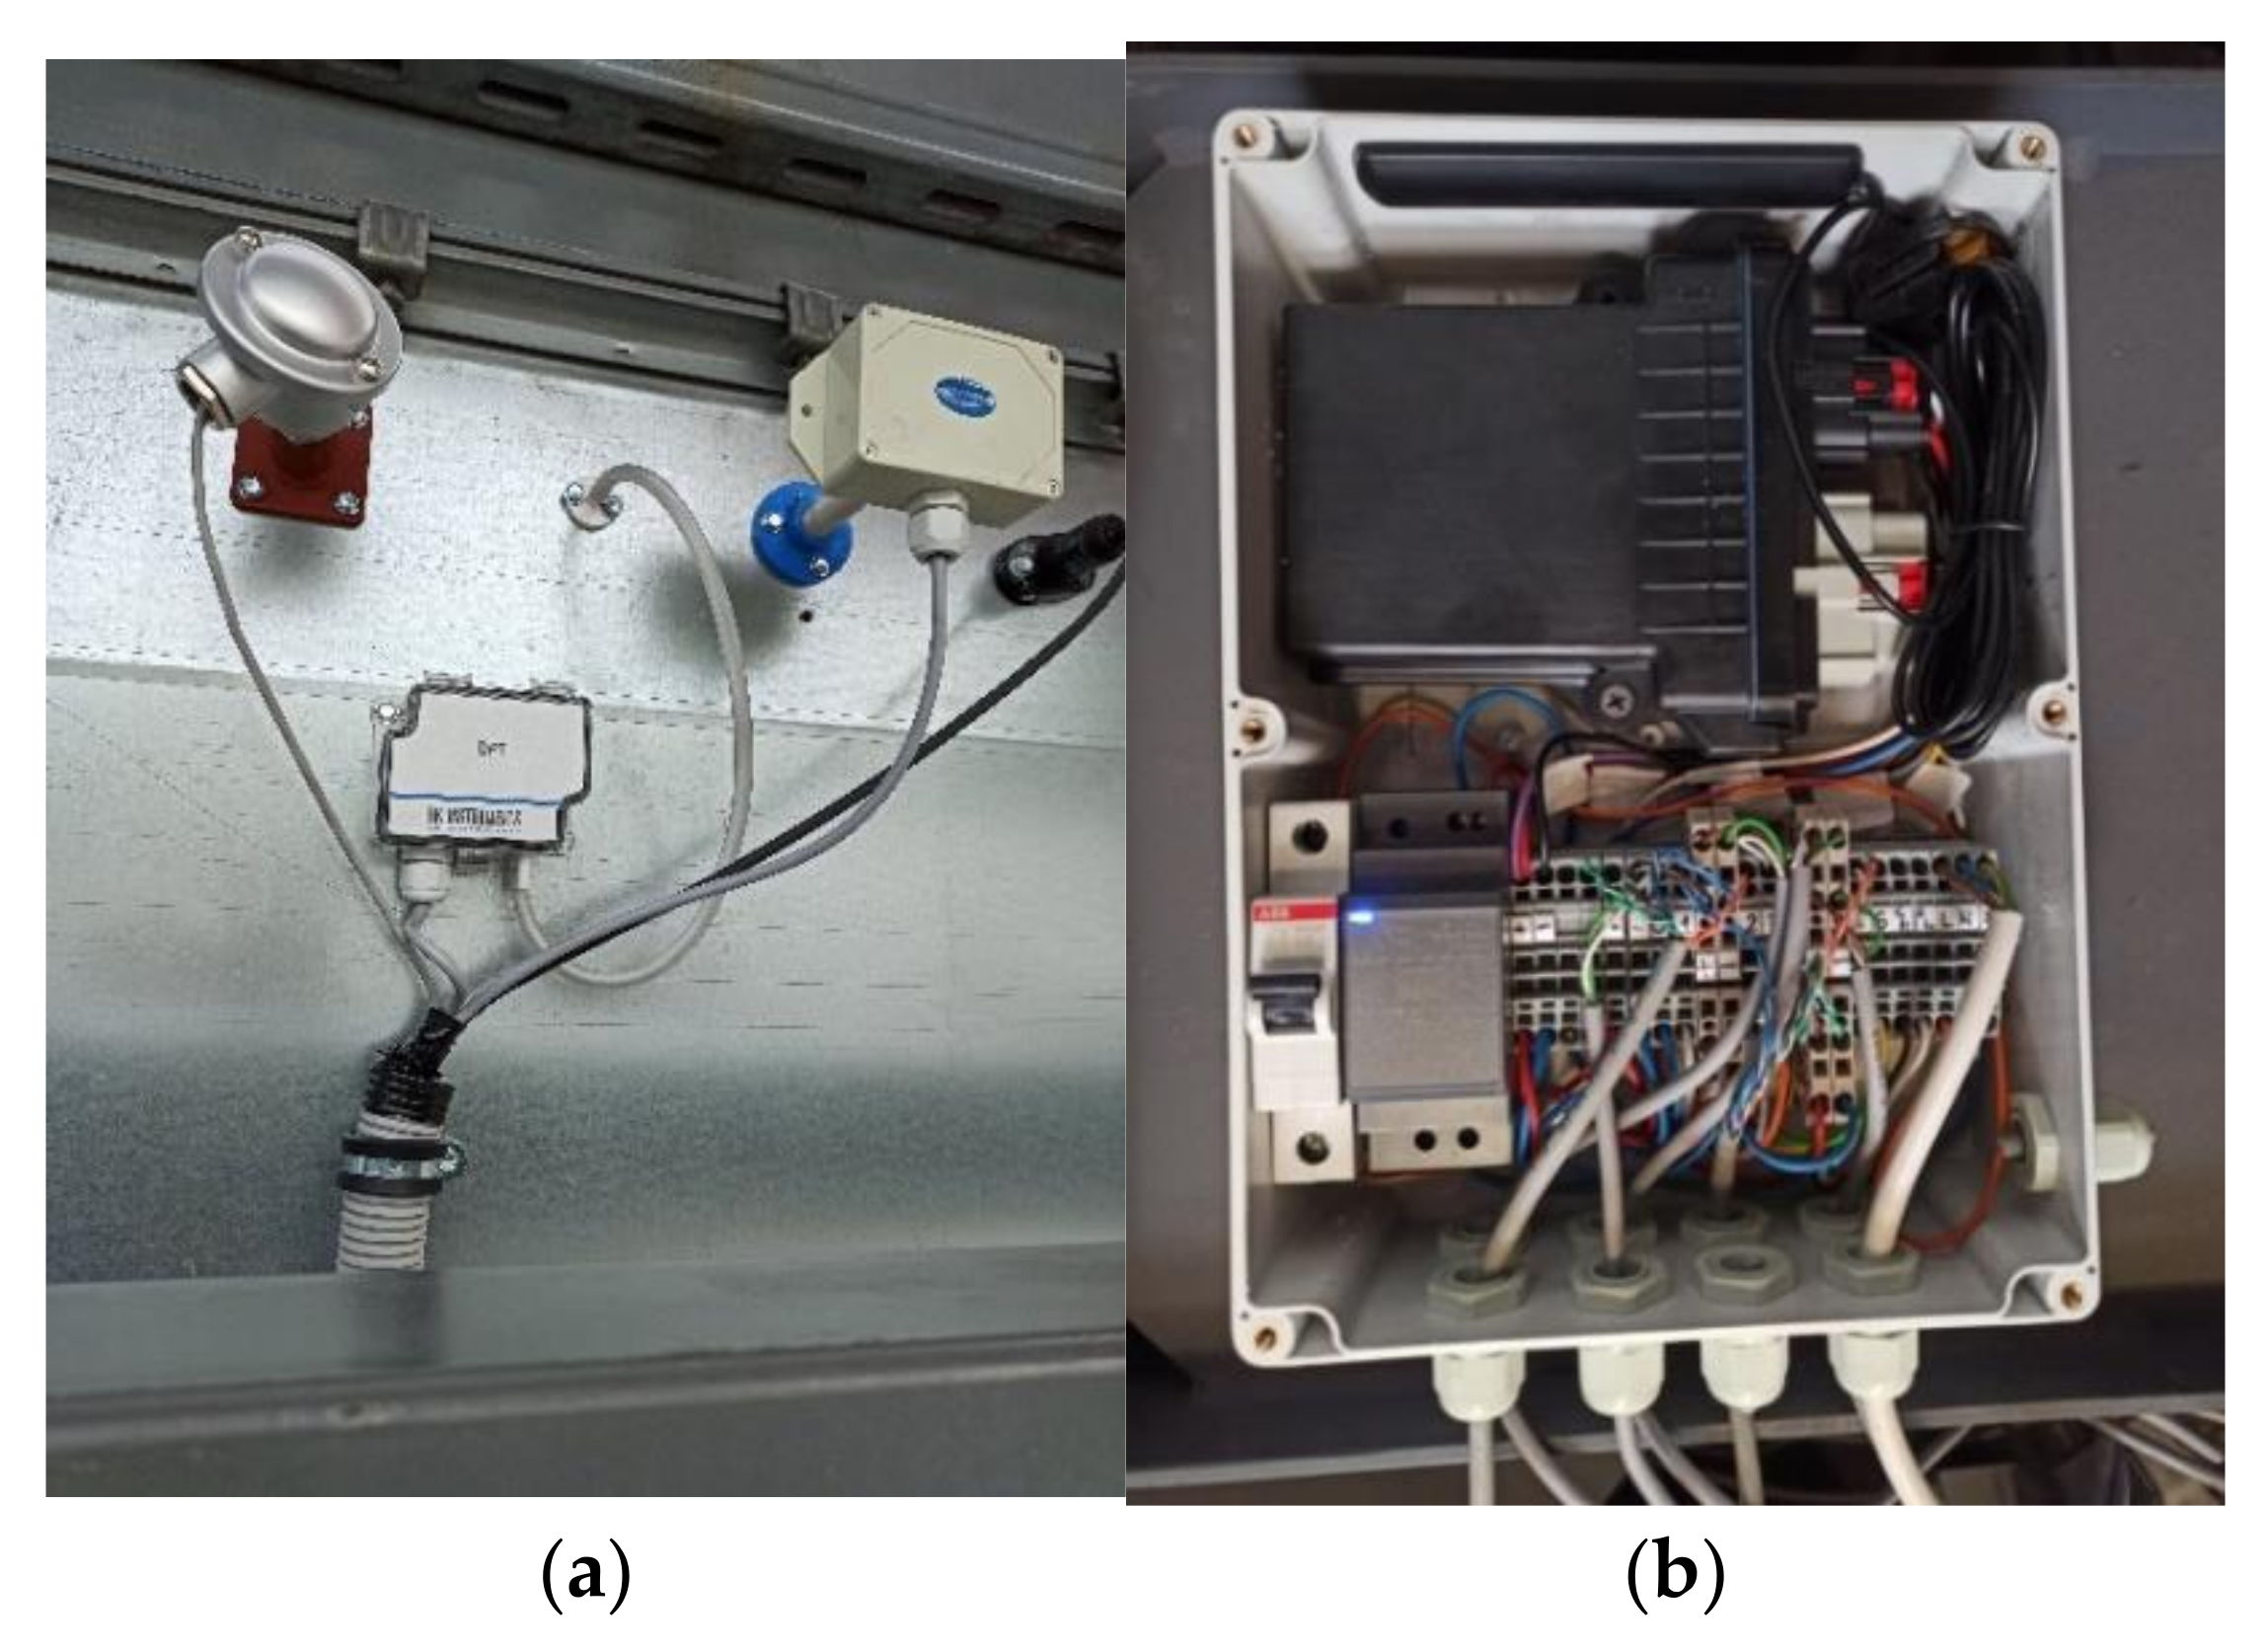
Due to the various operating conditions of the fans in the ventilation systems (weather conditions, high dust concentration, vibrations, lack of local internet infrastructure), the equipment used required an individual approach. For this purpose, technical solutions were developed for this equipment that allowed the collection of measurements of current operating parameters, their acquisition, and subsequent transmission to the server (
Figure 1). The measuring equipment, installed on selected devices with different power, purpose, operating at low or high temperatures (around 200 °C), was verified for correct operation [
23].
Thanks to this solution, data could be collected from enough fans and, in subsequent stages, used to construct mathematical models. The sensor data previously uploaded to the server was verified, i.e., its accuracy was analysed by comparing the current operating points against the characteristics of the respective fan types [
24]. The following is the methodology for converting the data from measurement sensors (formulae 1 to 13), which is verified, archived, and collected on the server [
9].
Absolute pressure:
where:
Pb–atmospheric pressure (Pa),
p1–suction gauge pressure (‘−’ sign) (Pa),
p2–discharge gauge pressure (‘+’ sign) (Pa).
Pst–static absolute pressure of the mixture (Pa),
T–absolute temperature of the mixture (K),
R–gas constant of the mixture (kJ/kgK) determined using an empirical formula:
where
x is the moisture content calculated according to the formula:
and where:
ϕ—measured relative humidity (−),
PS—water vapour saturation pressure for a given temperature (Pa),
Pst—static absolute pressure of the mixture (Pa).
Volumetric efficiency:
where:
A–cross-sectional area of the suction or discharge pipeline (m2),
w–measured average medium velocity in the suction or pressure pipeline (m/s).
V–volumetric efficiency (m3/s),
ρ–medium density (kg/m3).
Static pressure increase:
where:
P1–absolute pressure in the suction pipeline (Pa),
P2–absolute pressure in the discharge pipeline (Pa).
Dynamic pressure increase:
where:
Pd1–dynamic pressure in the suction pipeline (Pa),
Pd2–dynamic pressure in the discharge pipeline (Pa),
w1–average gas velocity in the suction pipeline (m/s),
w2–average gas velocity in the discharge pipeline (m/s),
ρ1–gas density in the suction pipeline (kg/m3),
ρ2–gas density in the discharge pipeline (kg/m3).
V–volumetric efficiency (m3/s),
ΔPC–total pressure increase (Pa).
Nu–effective power (W),
Nel–electrical power input (W), determined using the formula:
where:
I–measured current intensity value (A),
cos(φ)–for modern asynchronous motors can be estimated at ~0.85,
U–current voltage (V) determined based on rotational frequency (f) from the relationship:
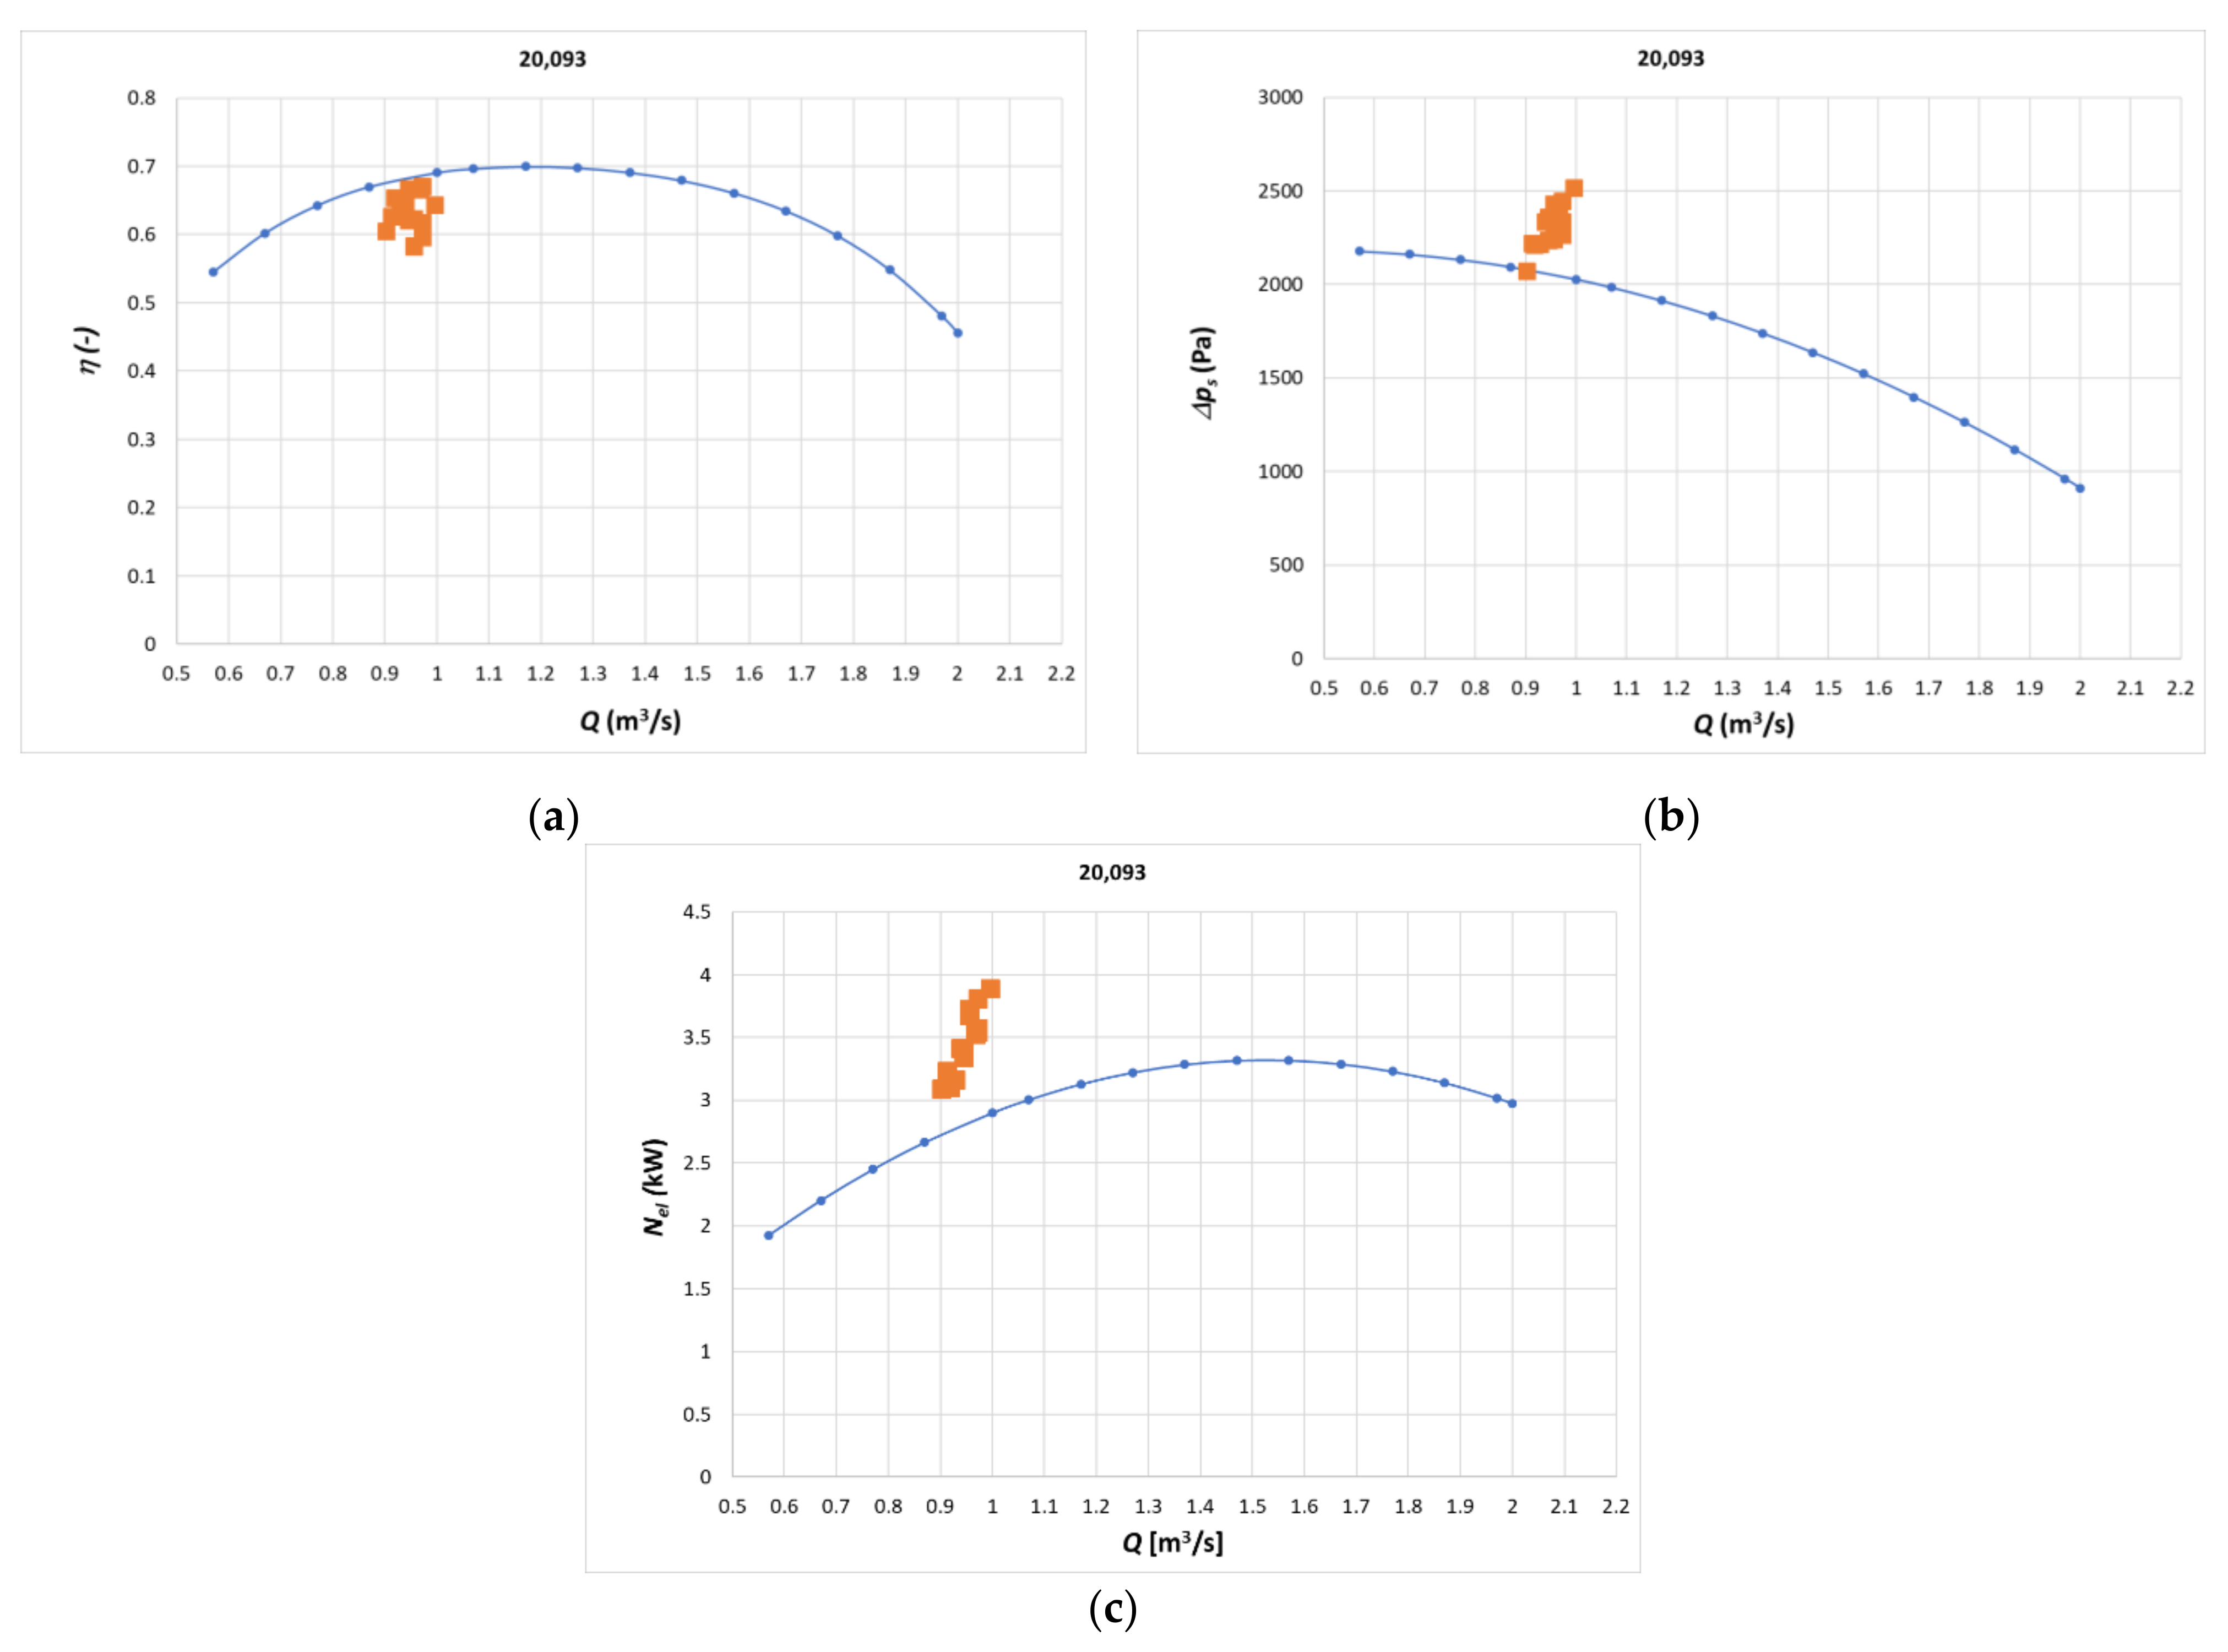
The calculated and analysed data is compared to the current operating points against the characteristics of the respective fan types. This was followed by continuous measurements, ongoing analysis of the collected data, and selection of data for use in the process of modelling and model verification. Several measurement points collected between June and November 2021 determined using the above calculation methodology are presented below against the background of the characteristics of an exemplary 20,093 fan (
Figure 2). The sample measurement results presented against the characteristic of the fan clearly show that in this case, the fan was selected with a large oversizing of the efficiency. The operating points deviate significantly from the optimal efficiency value. Such measurements and the constructed model will make it possible to verify the process of selecting a machine for a given ventilation system, among other things.
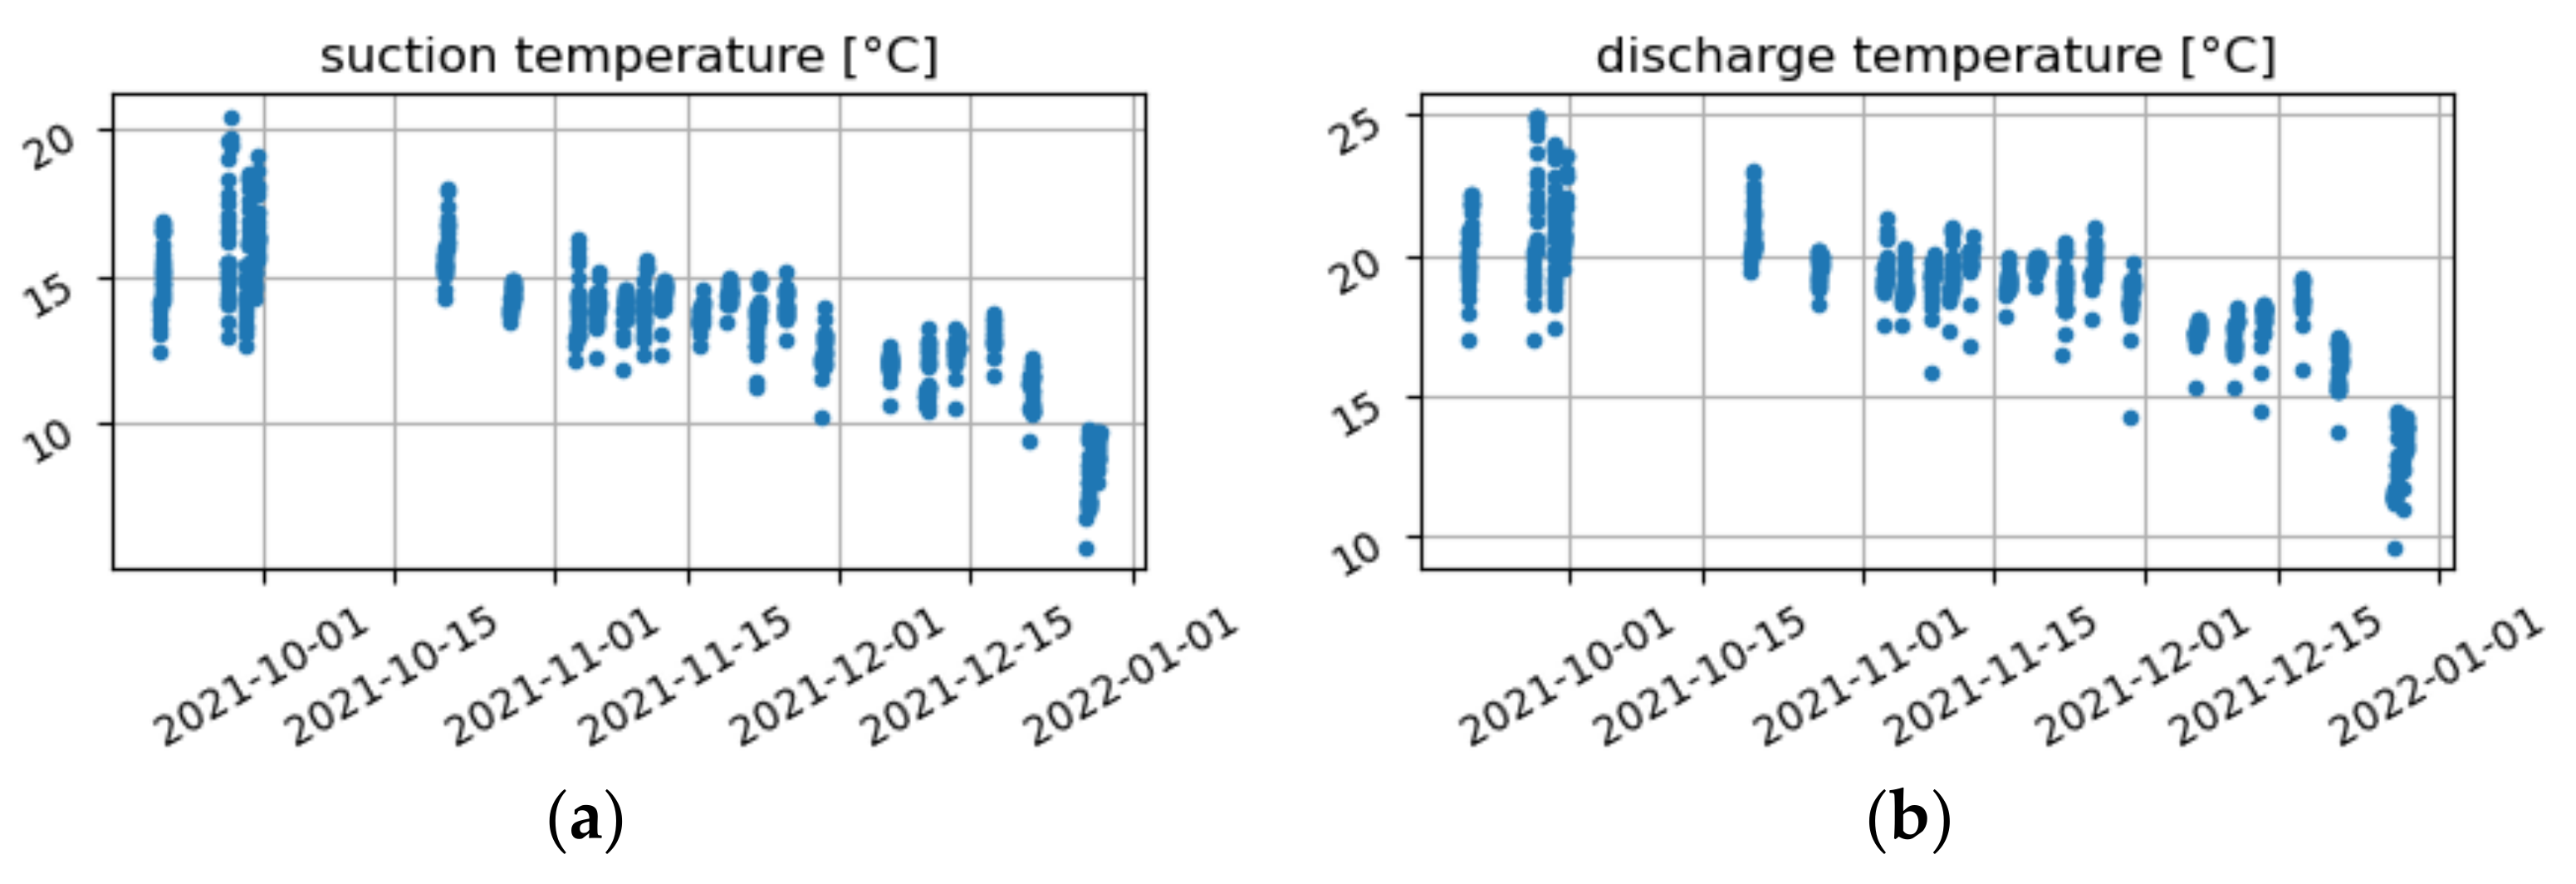
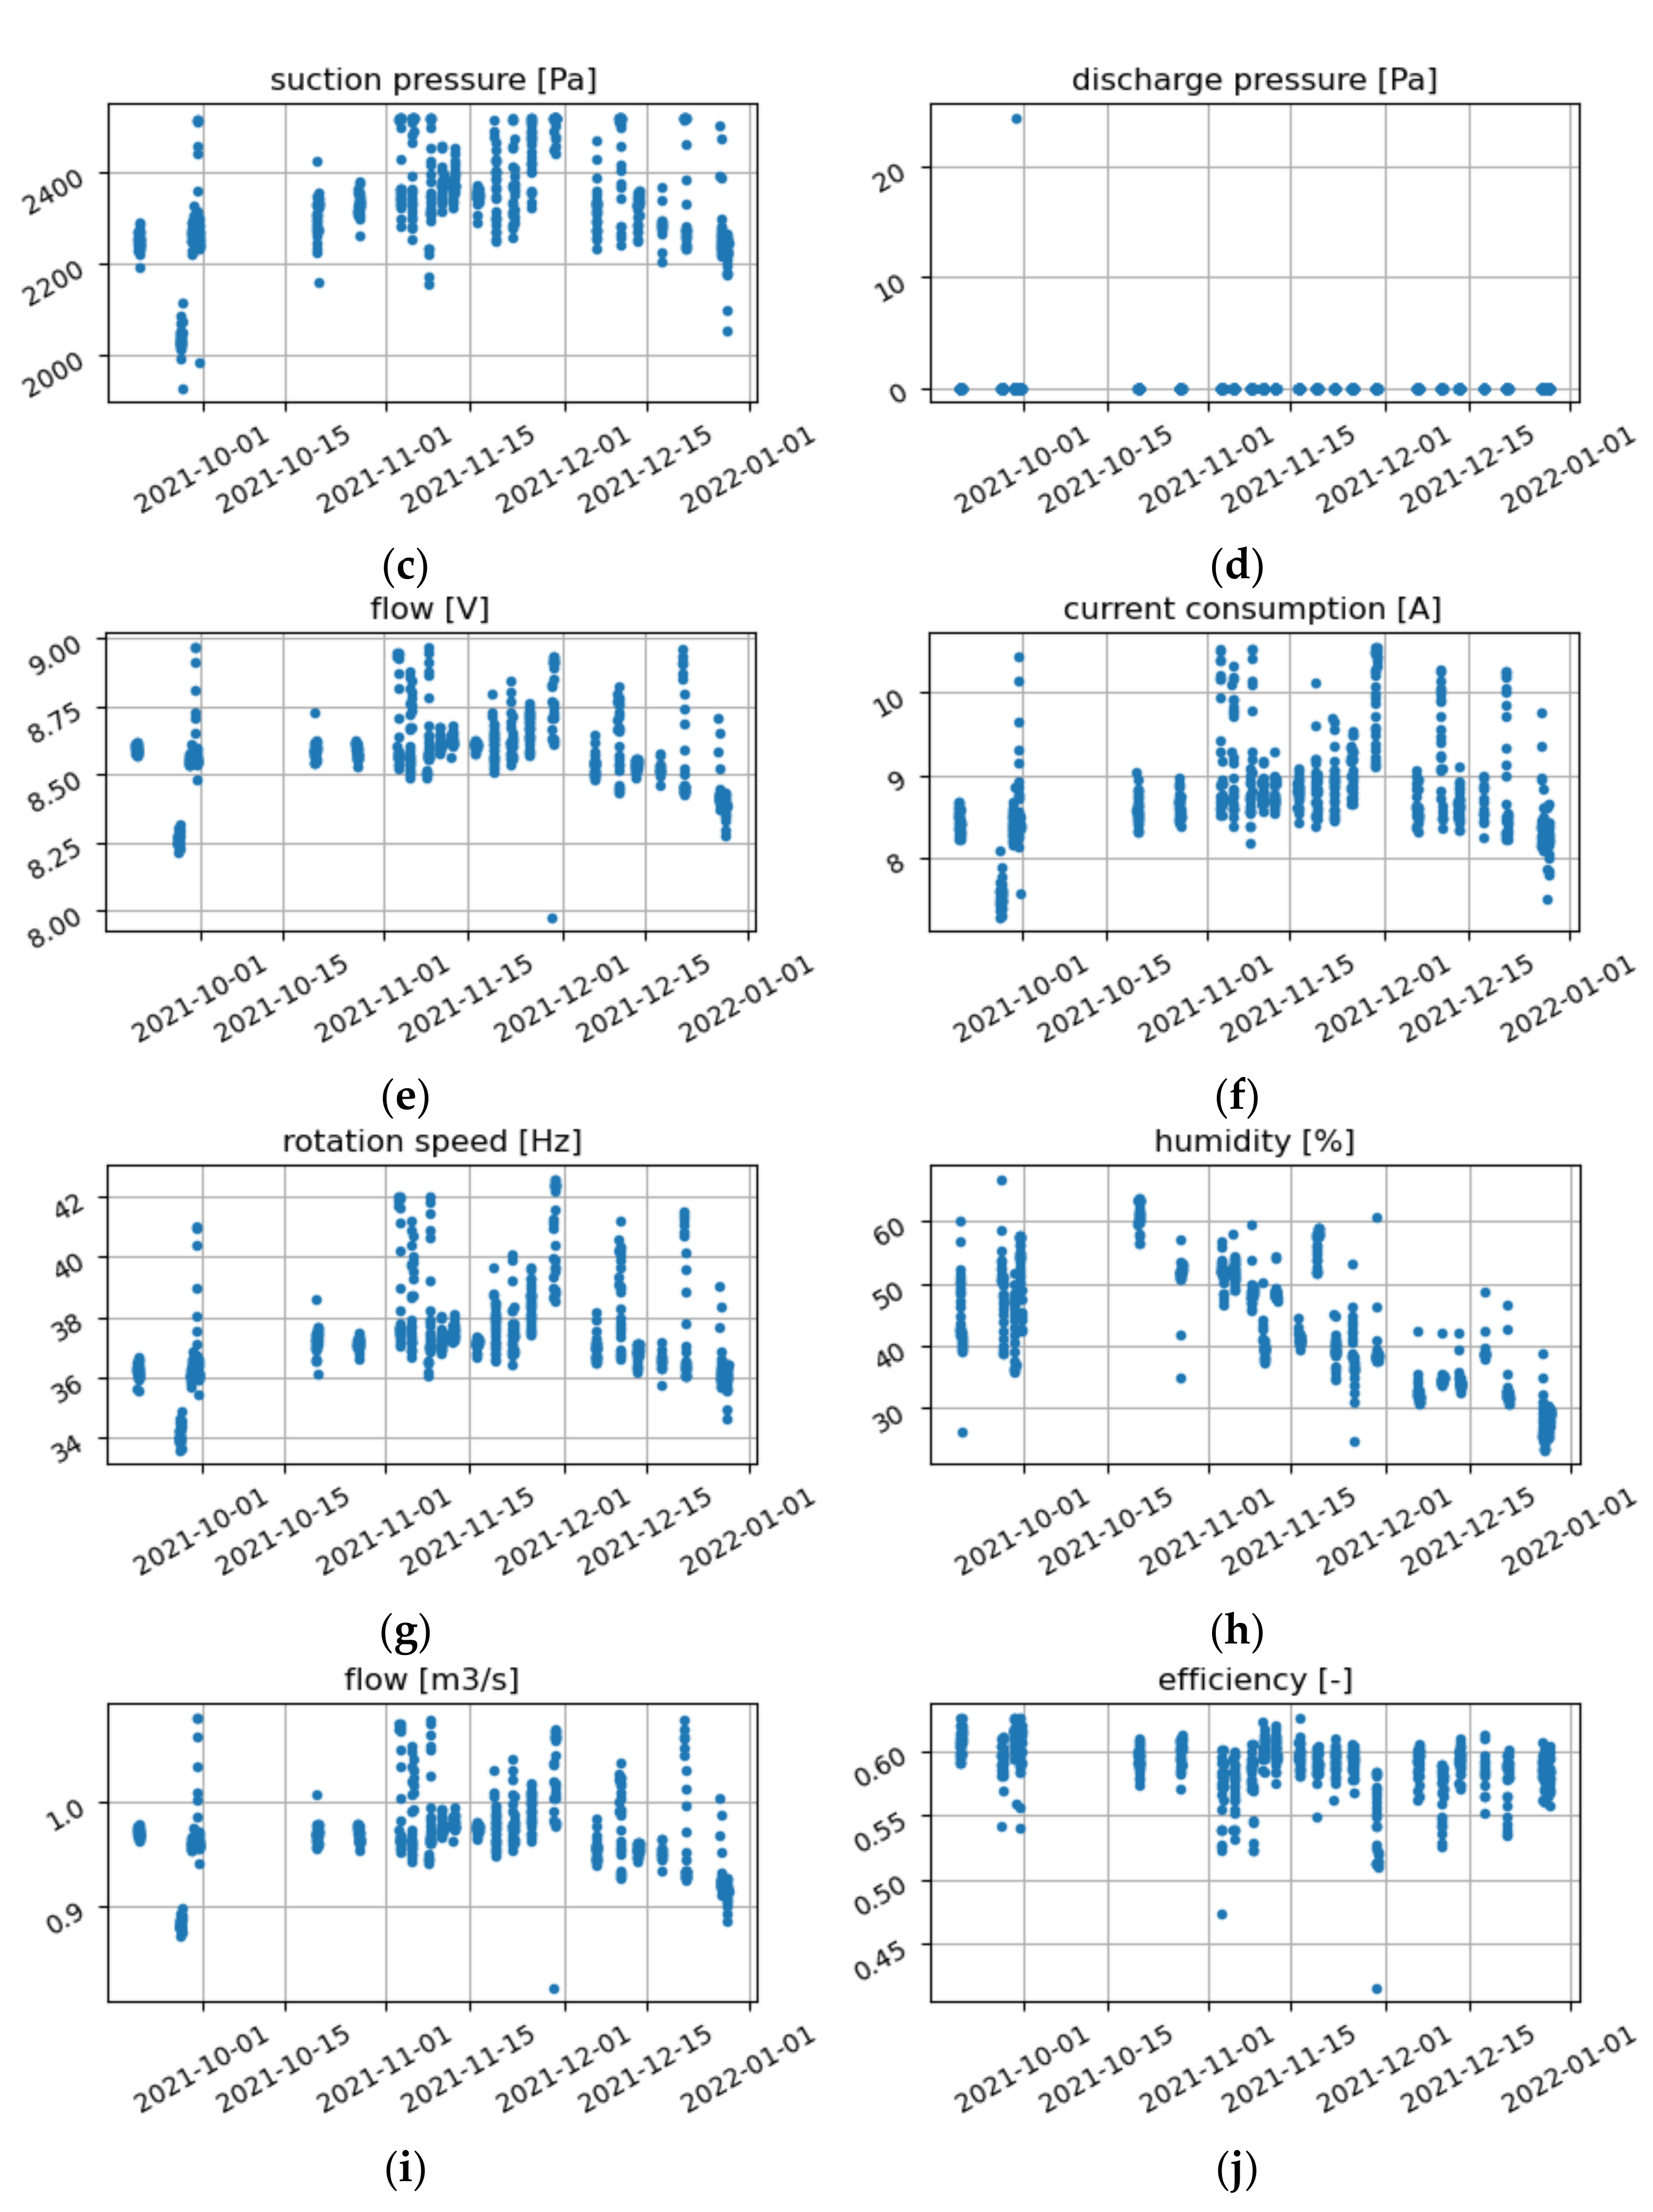
For the purpose of further research analyses, the measurement data is filtered and cleaned of distortions and thus prepared for inclusion in a future mathematical model.
Figure 3 shows examples of measurement points from selected days used for data analysis. The collected measurement data made it possible to select sets to train and verify the model predicting the process of changes in characteristics of the fan and the system in time and to assess the significance of the influence of various design parameters of the fan and the system. The data collected allowed verification of the models built and clarification of the variables required to assess the relevance of those models during long-term operation.
Before the stage of creating the mathematical model, a correlation analysis was performed between the individual measured parameters and the fan efficiency. Pearson’s correlation for
p < 0.05 was considered significant [
25]. Pearson’s correlation coefficients (r) and their values at the 95% confidence interval are presented in
Table 1. “r” takes values from −1 to 1, where 1 means total positive correlation, 0 means no correlation, and −1 means total negative correlation (the larger the x, the smaller the y). These are correlations that consider the relationships between a single parameter and efficiency without taking into account the interdependencies between parameters, so this stage should be considered a preliminary exploration of the relationships.
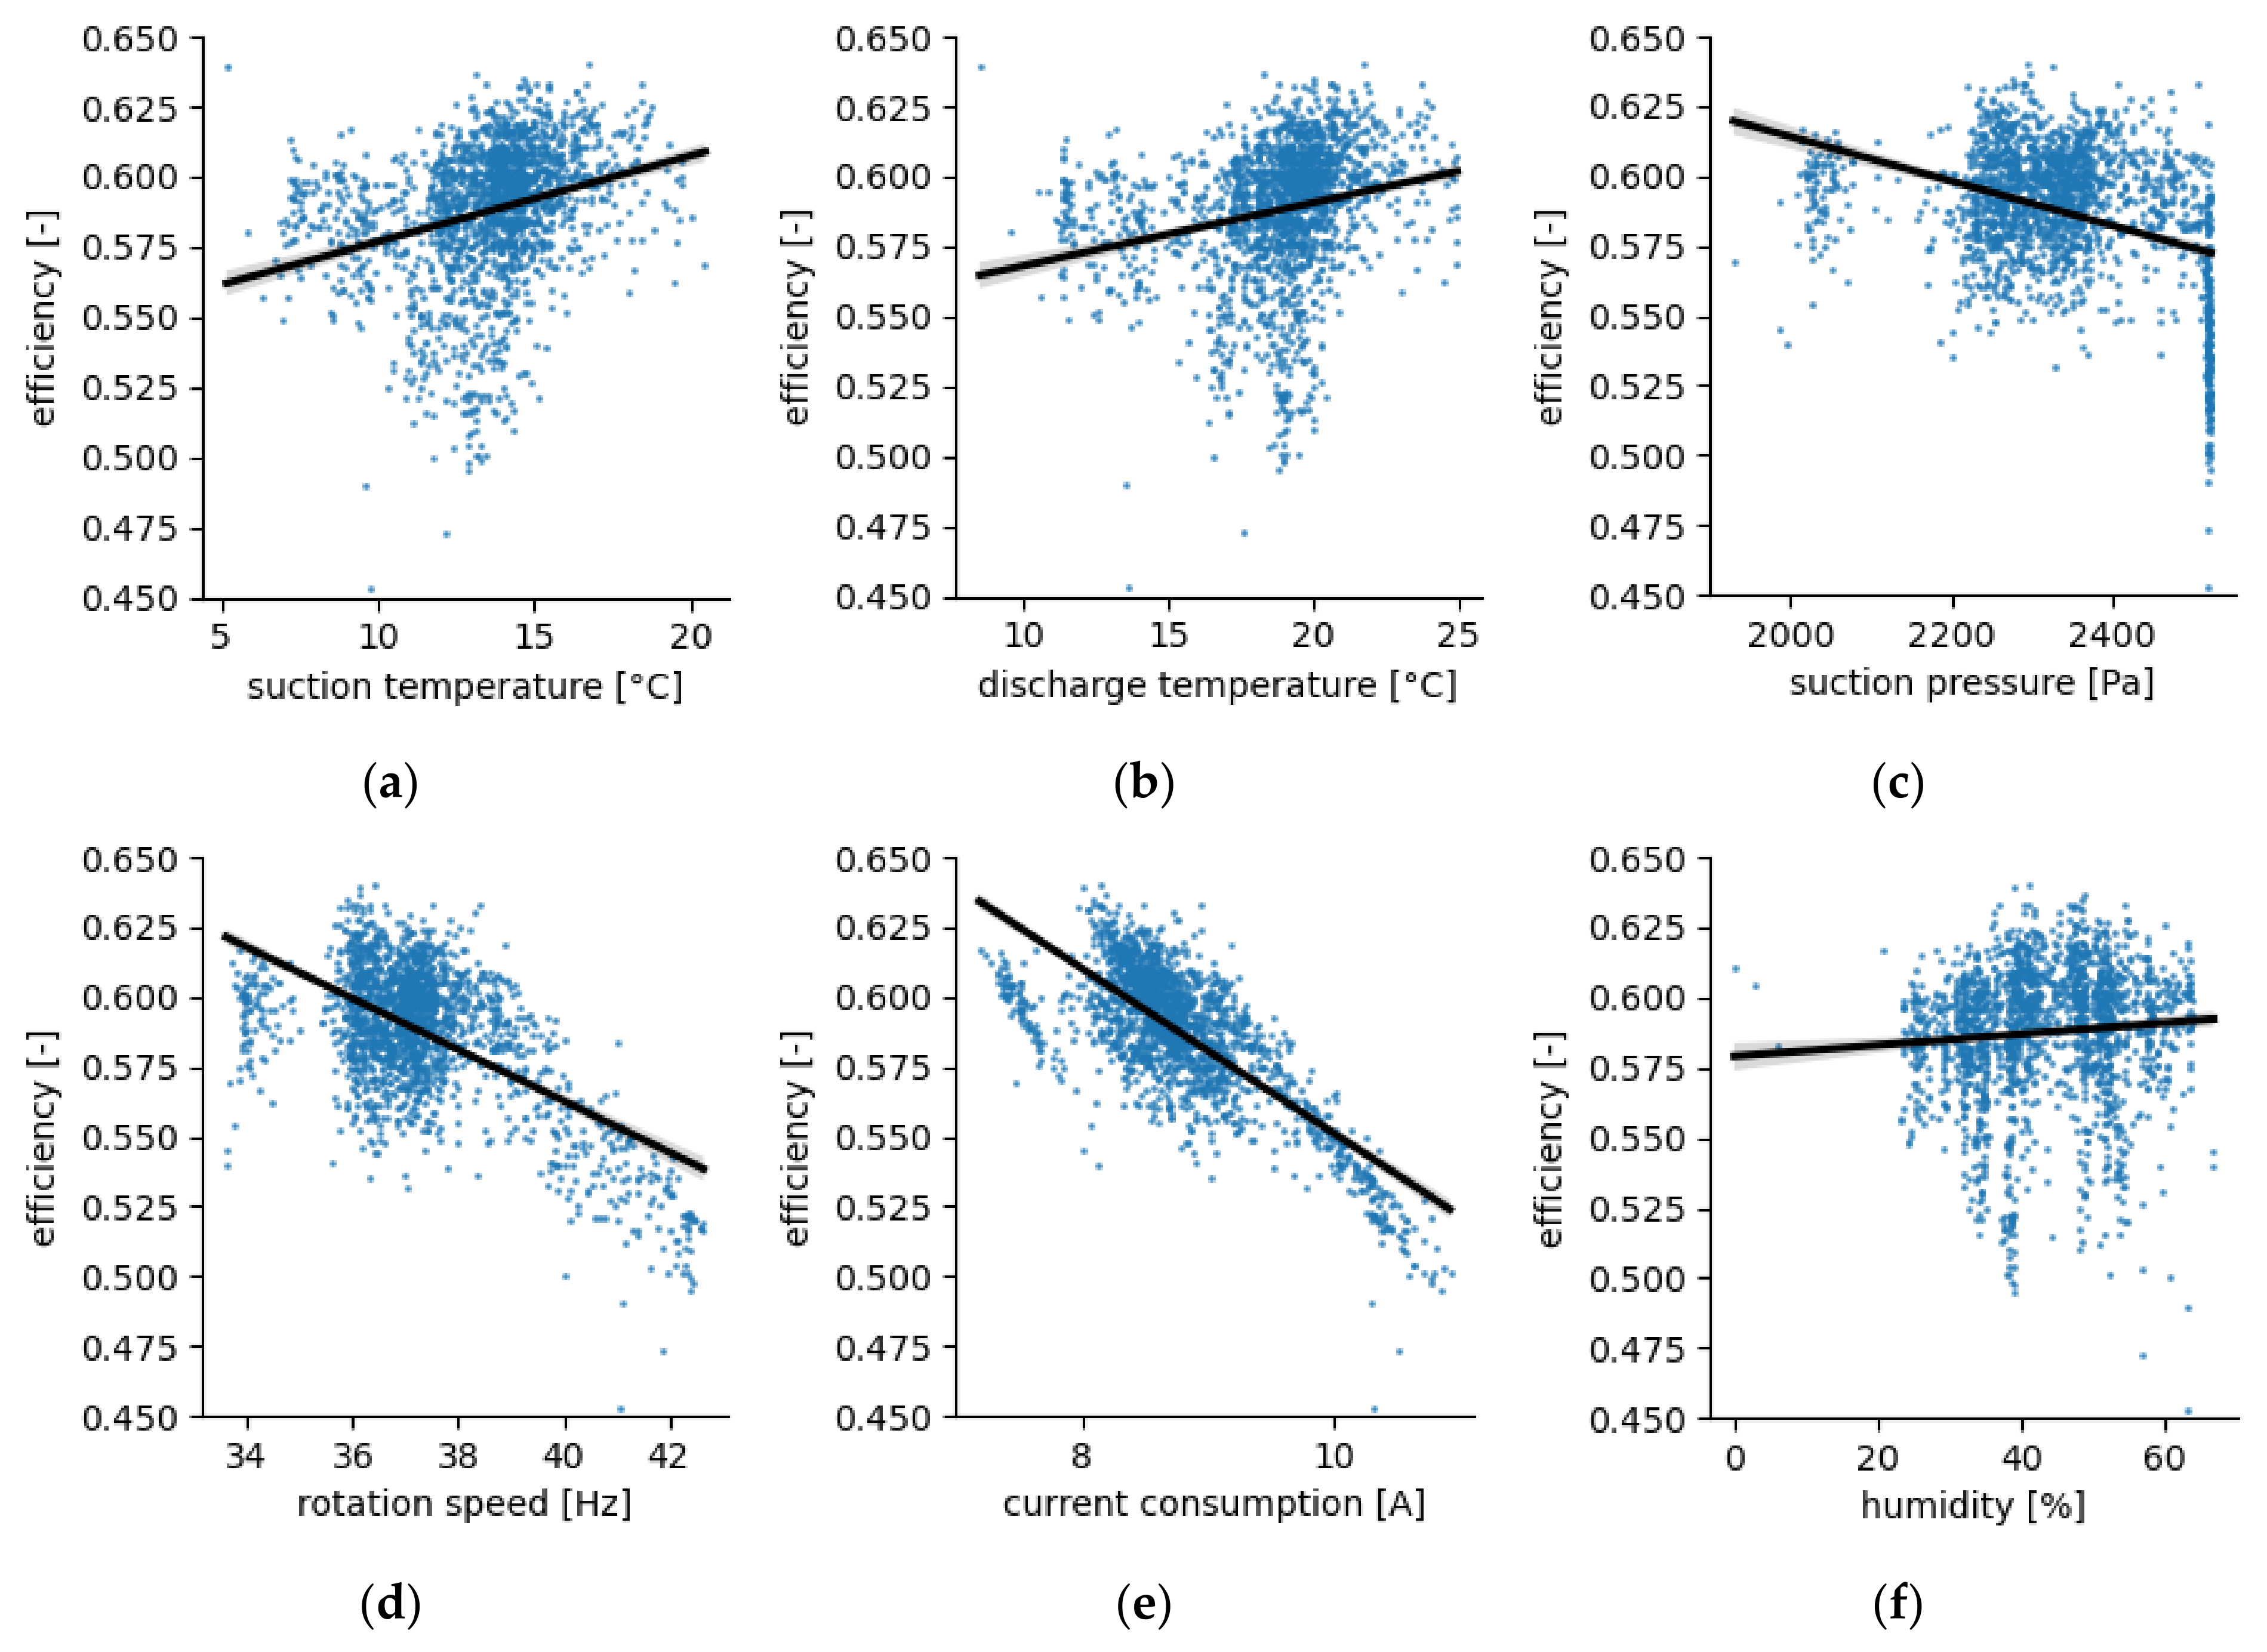
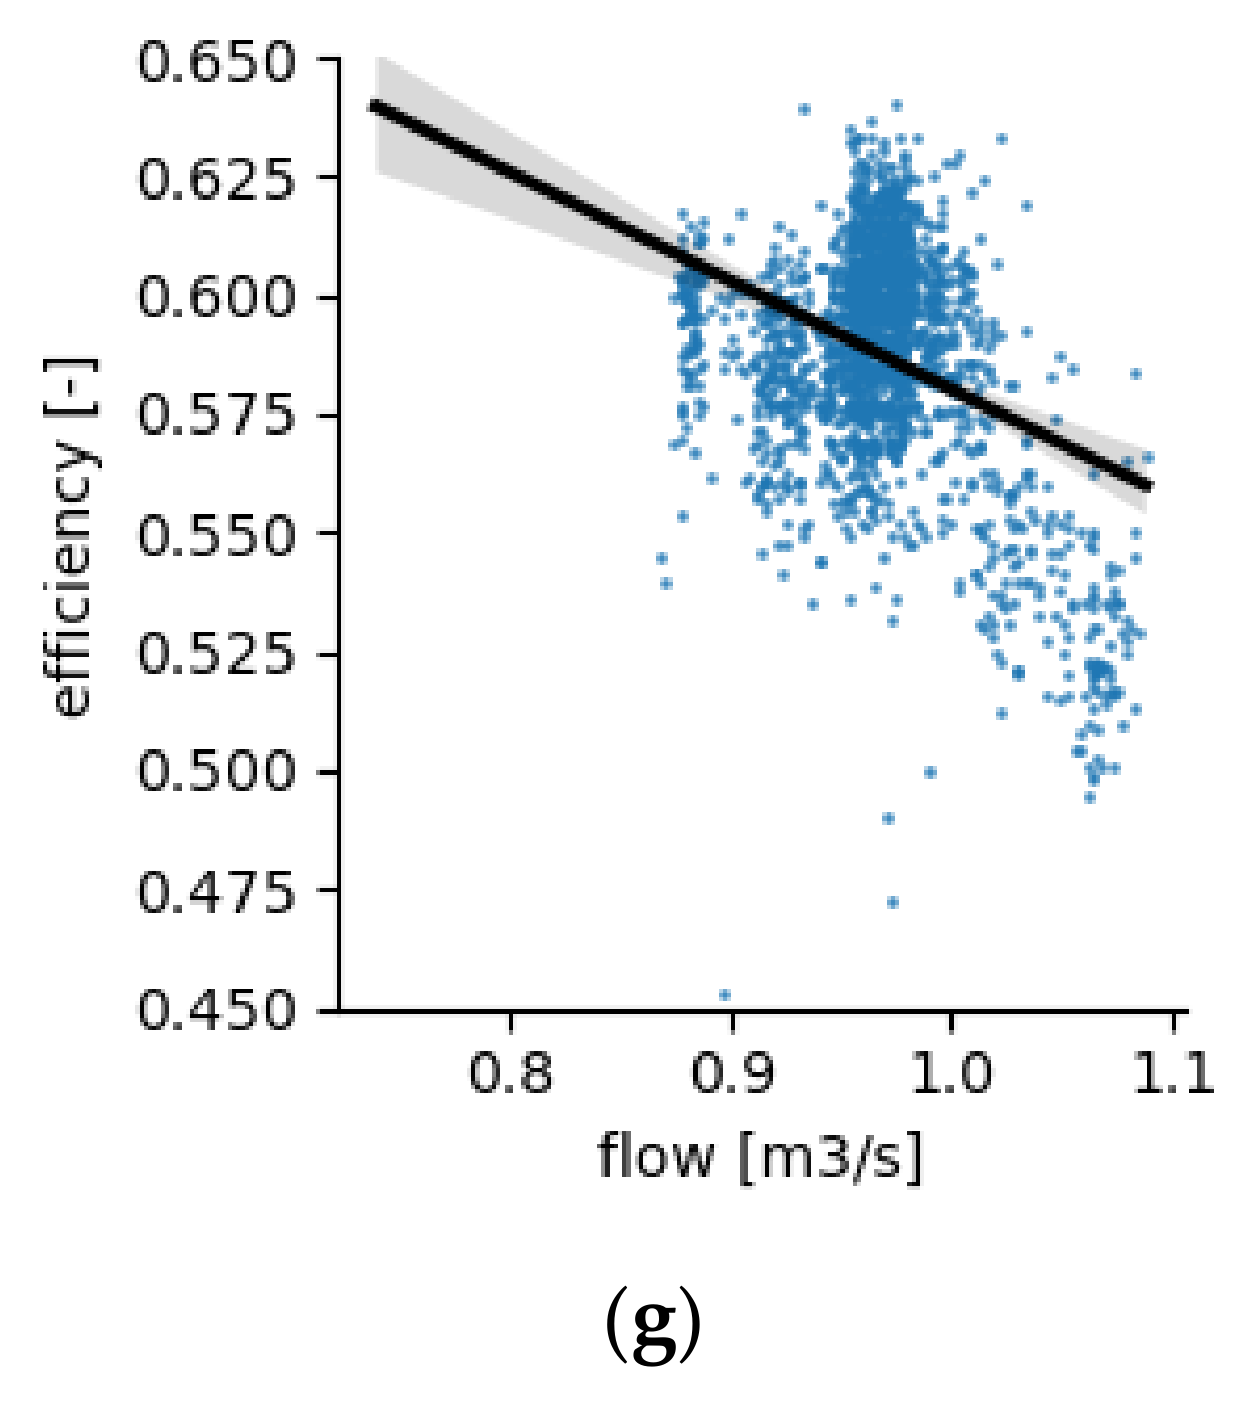
Correlation analysis indicated that all seven parameters were significantly correlated with efficiency (
p < 0.001). However, for humidity and gas temperatures in the suction and discharge ducts, the correlations are very weak: r = 0.077, 0.272 and 0.220, respectively (all below 0.30). Correlations are also noticeable in the graphs of parameter—efficiency (
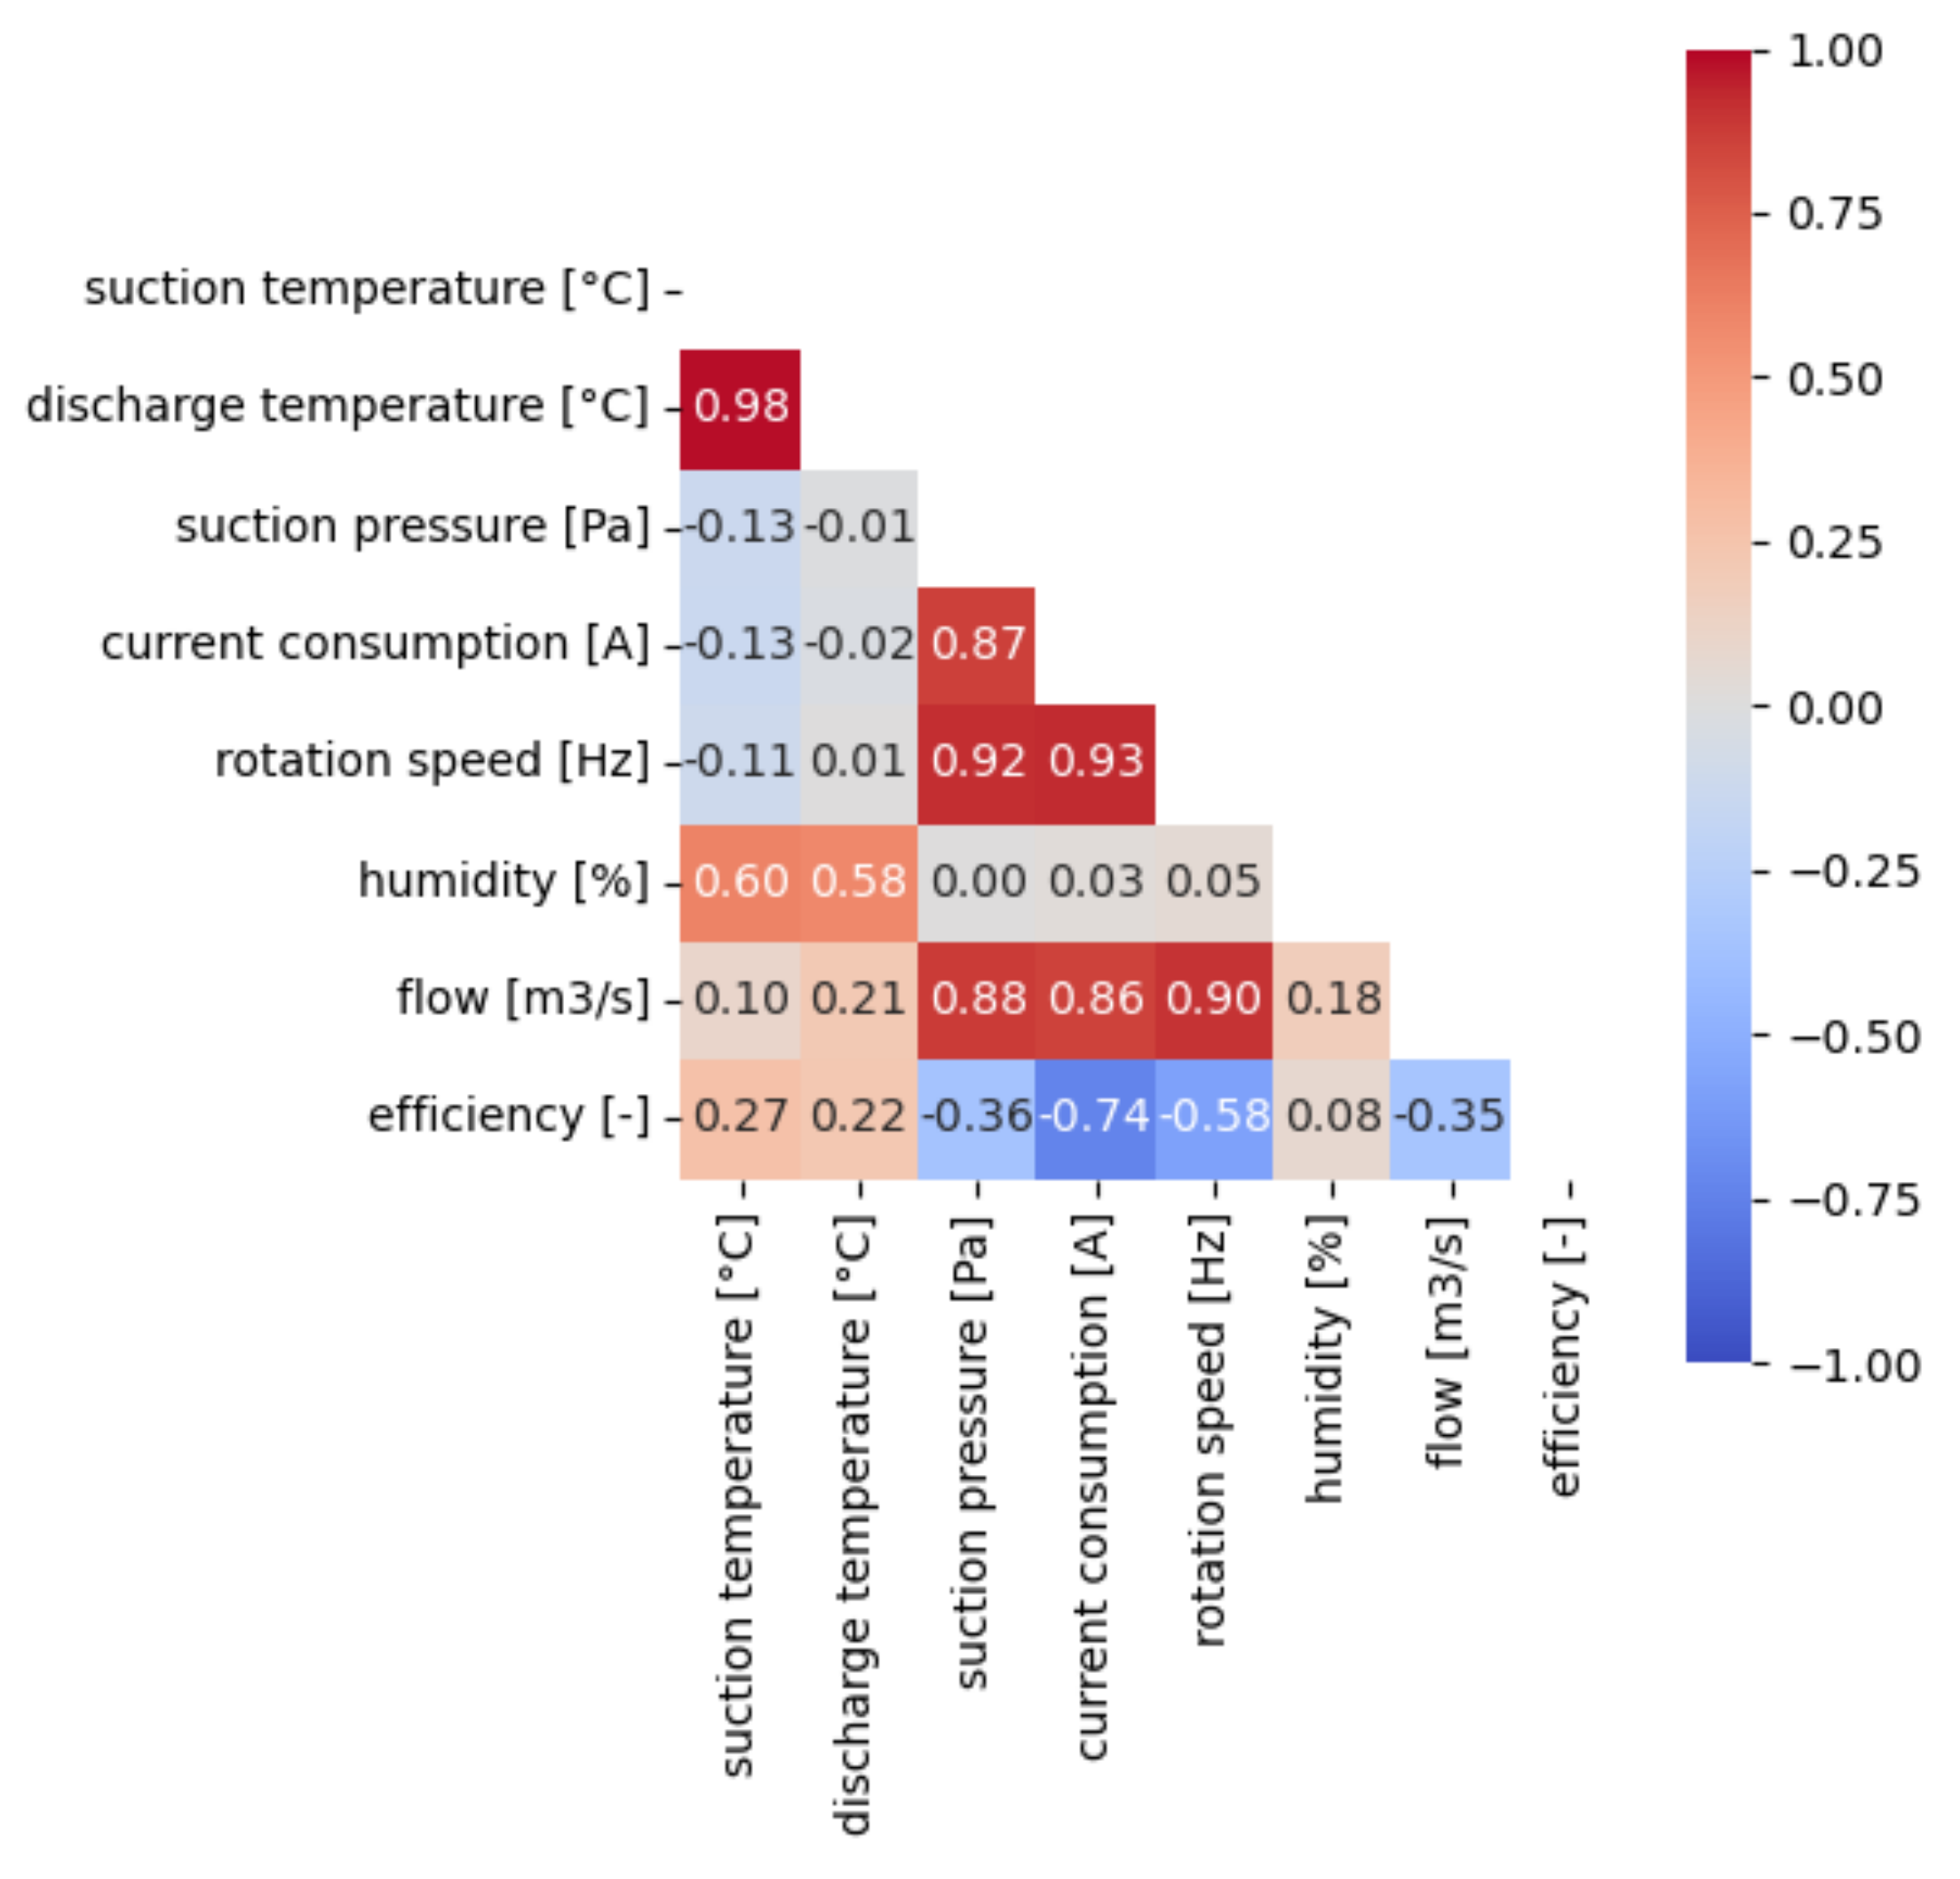
Figure 4). Correlations between measured parameters and efficiency were also analysed (
Figure 5), and a very strong correlation was observed between the temperature of the mixture in the suction duct and the temperature of the mixture in the discharge duct (r = 0.98). In addition, flow velocity is highly correlated with current consumption (r = 0.86), fan rotational speed (r = 0.90), and suction duct pressure (r = 0.88). Such high correlations suggest that these four parameters can be replaced by one/two parameters in a mathematical model without any apparent decrease in model accuracy.
One of the models considered was a mathematical model based on linear regression [
26], which can be defined with the formula:
where
n is the number of input parameters,
x is the input parameter, and
y is the fan efficiency. The linear regression model finds statistically significant parameters related to efficiency. The model considers the influence of all parameters simultaneously, making it better than the analysis of individual correlations presented in the previous section [
27].
Based on the actual measurement data, the linear regression model was developed. It is presented in
Table 2.
Based on the mathematical model developed above, it was shown that the temperature of the mixture measured in the suction duct and in the discharge duct, as well as the mixture humidity, had no effect on the fan efficiency (not statistically significant, p > 0.05).
Linear regression models predict the target quantity based on linear relationships between the target quantity and one or more predictors. In some cases, statistical modelling techniques provide suitable models very quickly. Even for problems where more flexible machine learning techniques (such as neural networks) may give much better results, some statistical models can be used as basic predictive models to evaluate the performance of more advanced techniques. In this case, modelling from the field of machine learning was also applied to the analyses. Artificial neural networks have many applications:
data analysis–allows, for example, the filtering of signals;
feature extraction–enables the reduction of data size (compression);
approximation–based on information about the points, the artificial neural network learns the shape of the function (prediction);
optimisation;
control systems–based on the given patterns of responses to specific stimuli, the neural network can automatically interpret the situation and respond to it.
In practice, one can find many applications of neural networks, and below are a few selected from the bibliographic review,
- −
in predicting fans failures [
21],
- −
in forecasting energy consumption [
28],
- −
for the assessment of fuel consumption in an internal combustion engine [
29],
- −
in the assessment of the dynamic condition of turbine stages [
30],
- −
in the analysis of aircraft engines operation [
31],
- −
to evaluate the operation of gas turbines [
32].
A machine learning approach to training and testing the model was used to confirm the relevant parameters determined above. This approach involves splitting the data into training data, which is used to calculate the coefficients ‘a’ and ‘b’ in the model, and test data, which allows the model to be tested for error between the predicted values and the actual values in the test set. The basis of this approach is that the model is verified for predictive accuracy for data that was not used to calculate (‘train’/‘teach’) the model. Therefore, the model is trained on training data and verified on test data.
A single split of the training/test data in a ratio of, e.g., 80%/20%, does not guarantee a reliable evaluation of the model; hence, 10-fold cross-validation was used in the conducted analysis. It consists of a 10-fold data split (90/10% ratio). The accuracy of the model is verified 10 times, each time using a different 10% of the parts as a test set (the rest being training data). The mean prediction error (RMSE–root mean square error) was calculated from 10 iterations.
Calculations were carried out for three sets of input parameters:
Seven parameters: suction temperature (°C), discharge temperature (°C), suction pressure (Pa), current draw (A), rotational speed (Hz), humidity (%), flow (m3/s);
Four parameters: suction pressure (Pa), current consumption (A), speed (Hz), flow (m3/s);
Three parameters: suction pressure (Pa), current consumption (A), rotational speed (Hz).
The significance of the parameters was determined by their effect on the accuracy of the mathematical model. If a mathematical model based on a smaller number of input parameters achieves similar accuracy, i.e., there is no statistically significant difference at the 95% confidence level, this means that the omitted input parameters are insignificant for the model. Differences between the models in terms of accuracy were compared using the Mann–Whitney U Test, assuming a significance level of
p < 0.05 [
33].
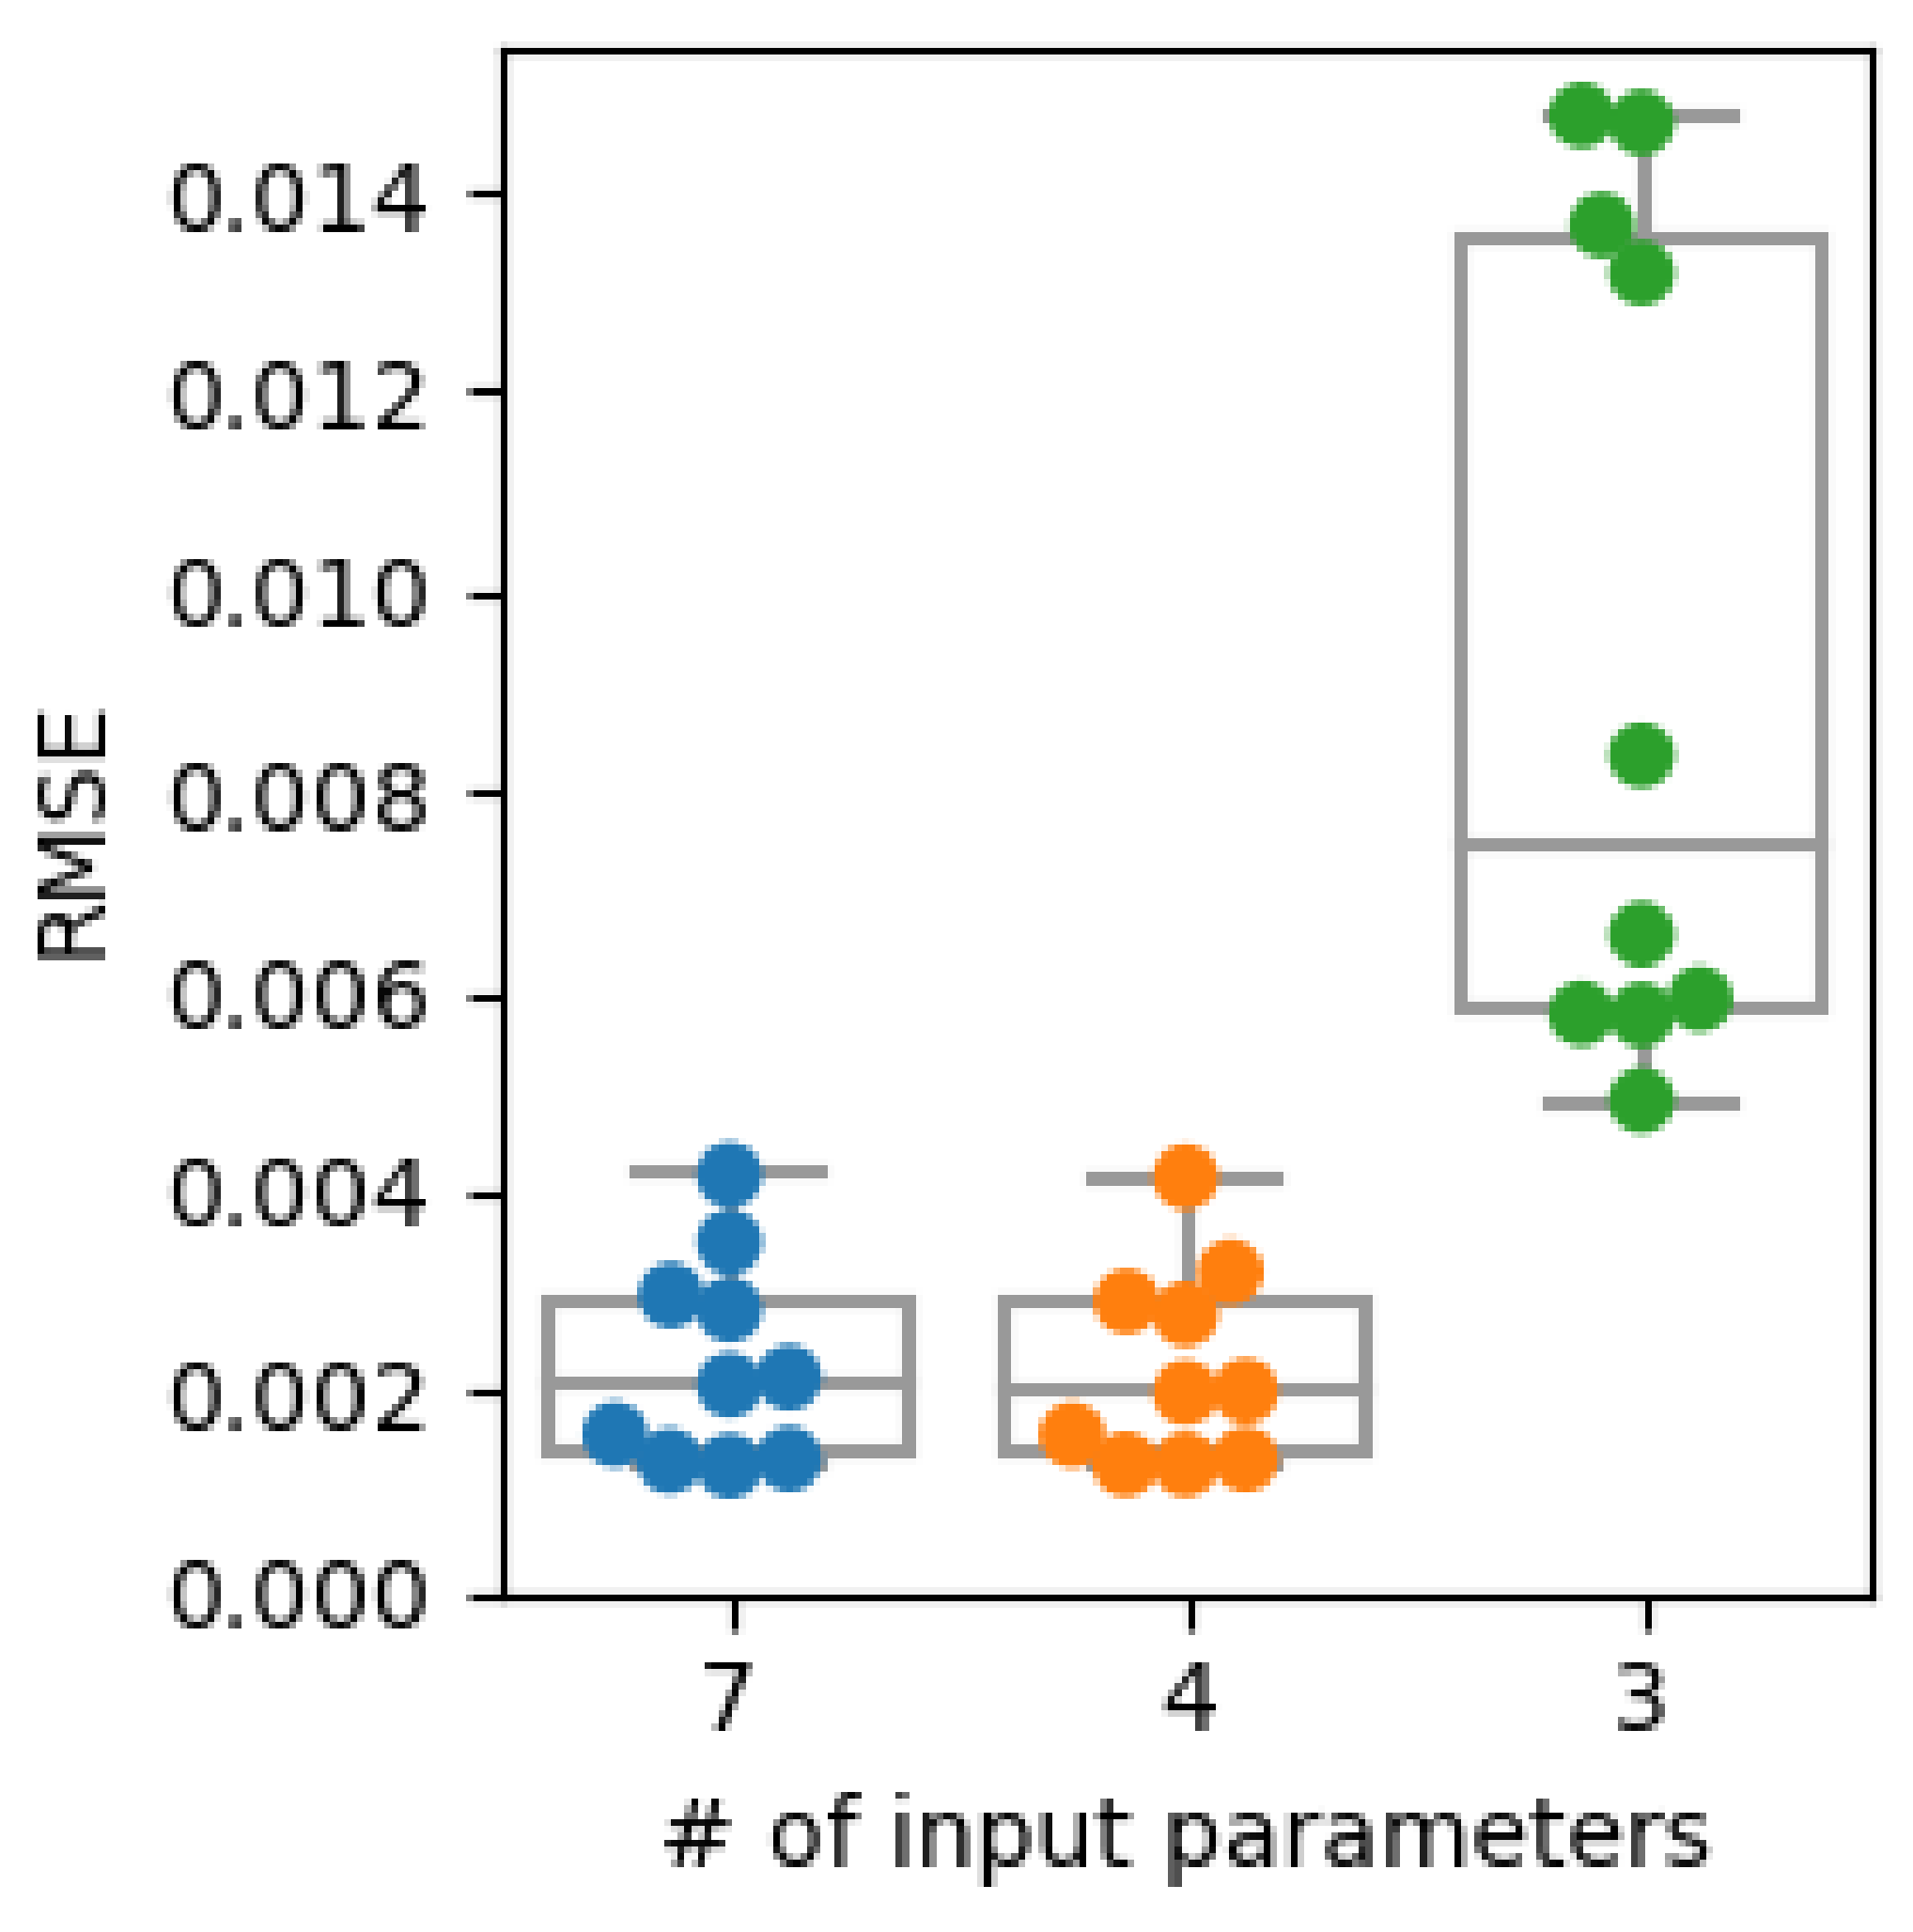
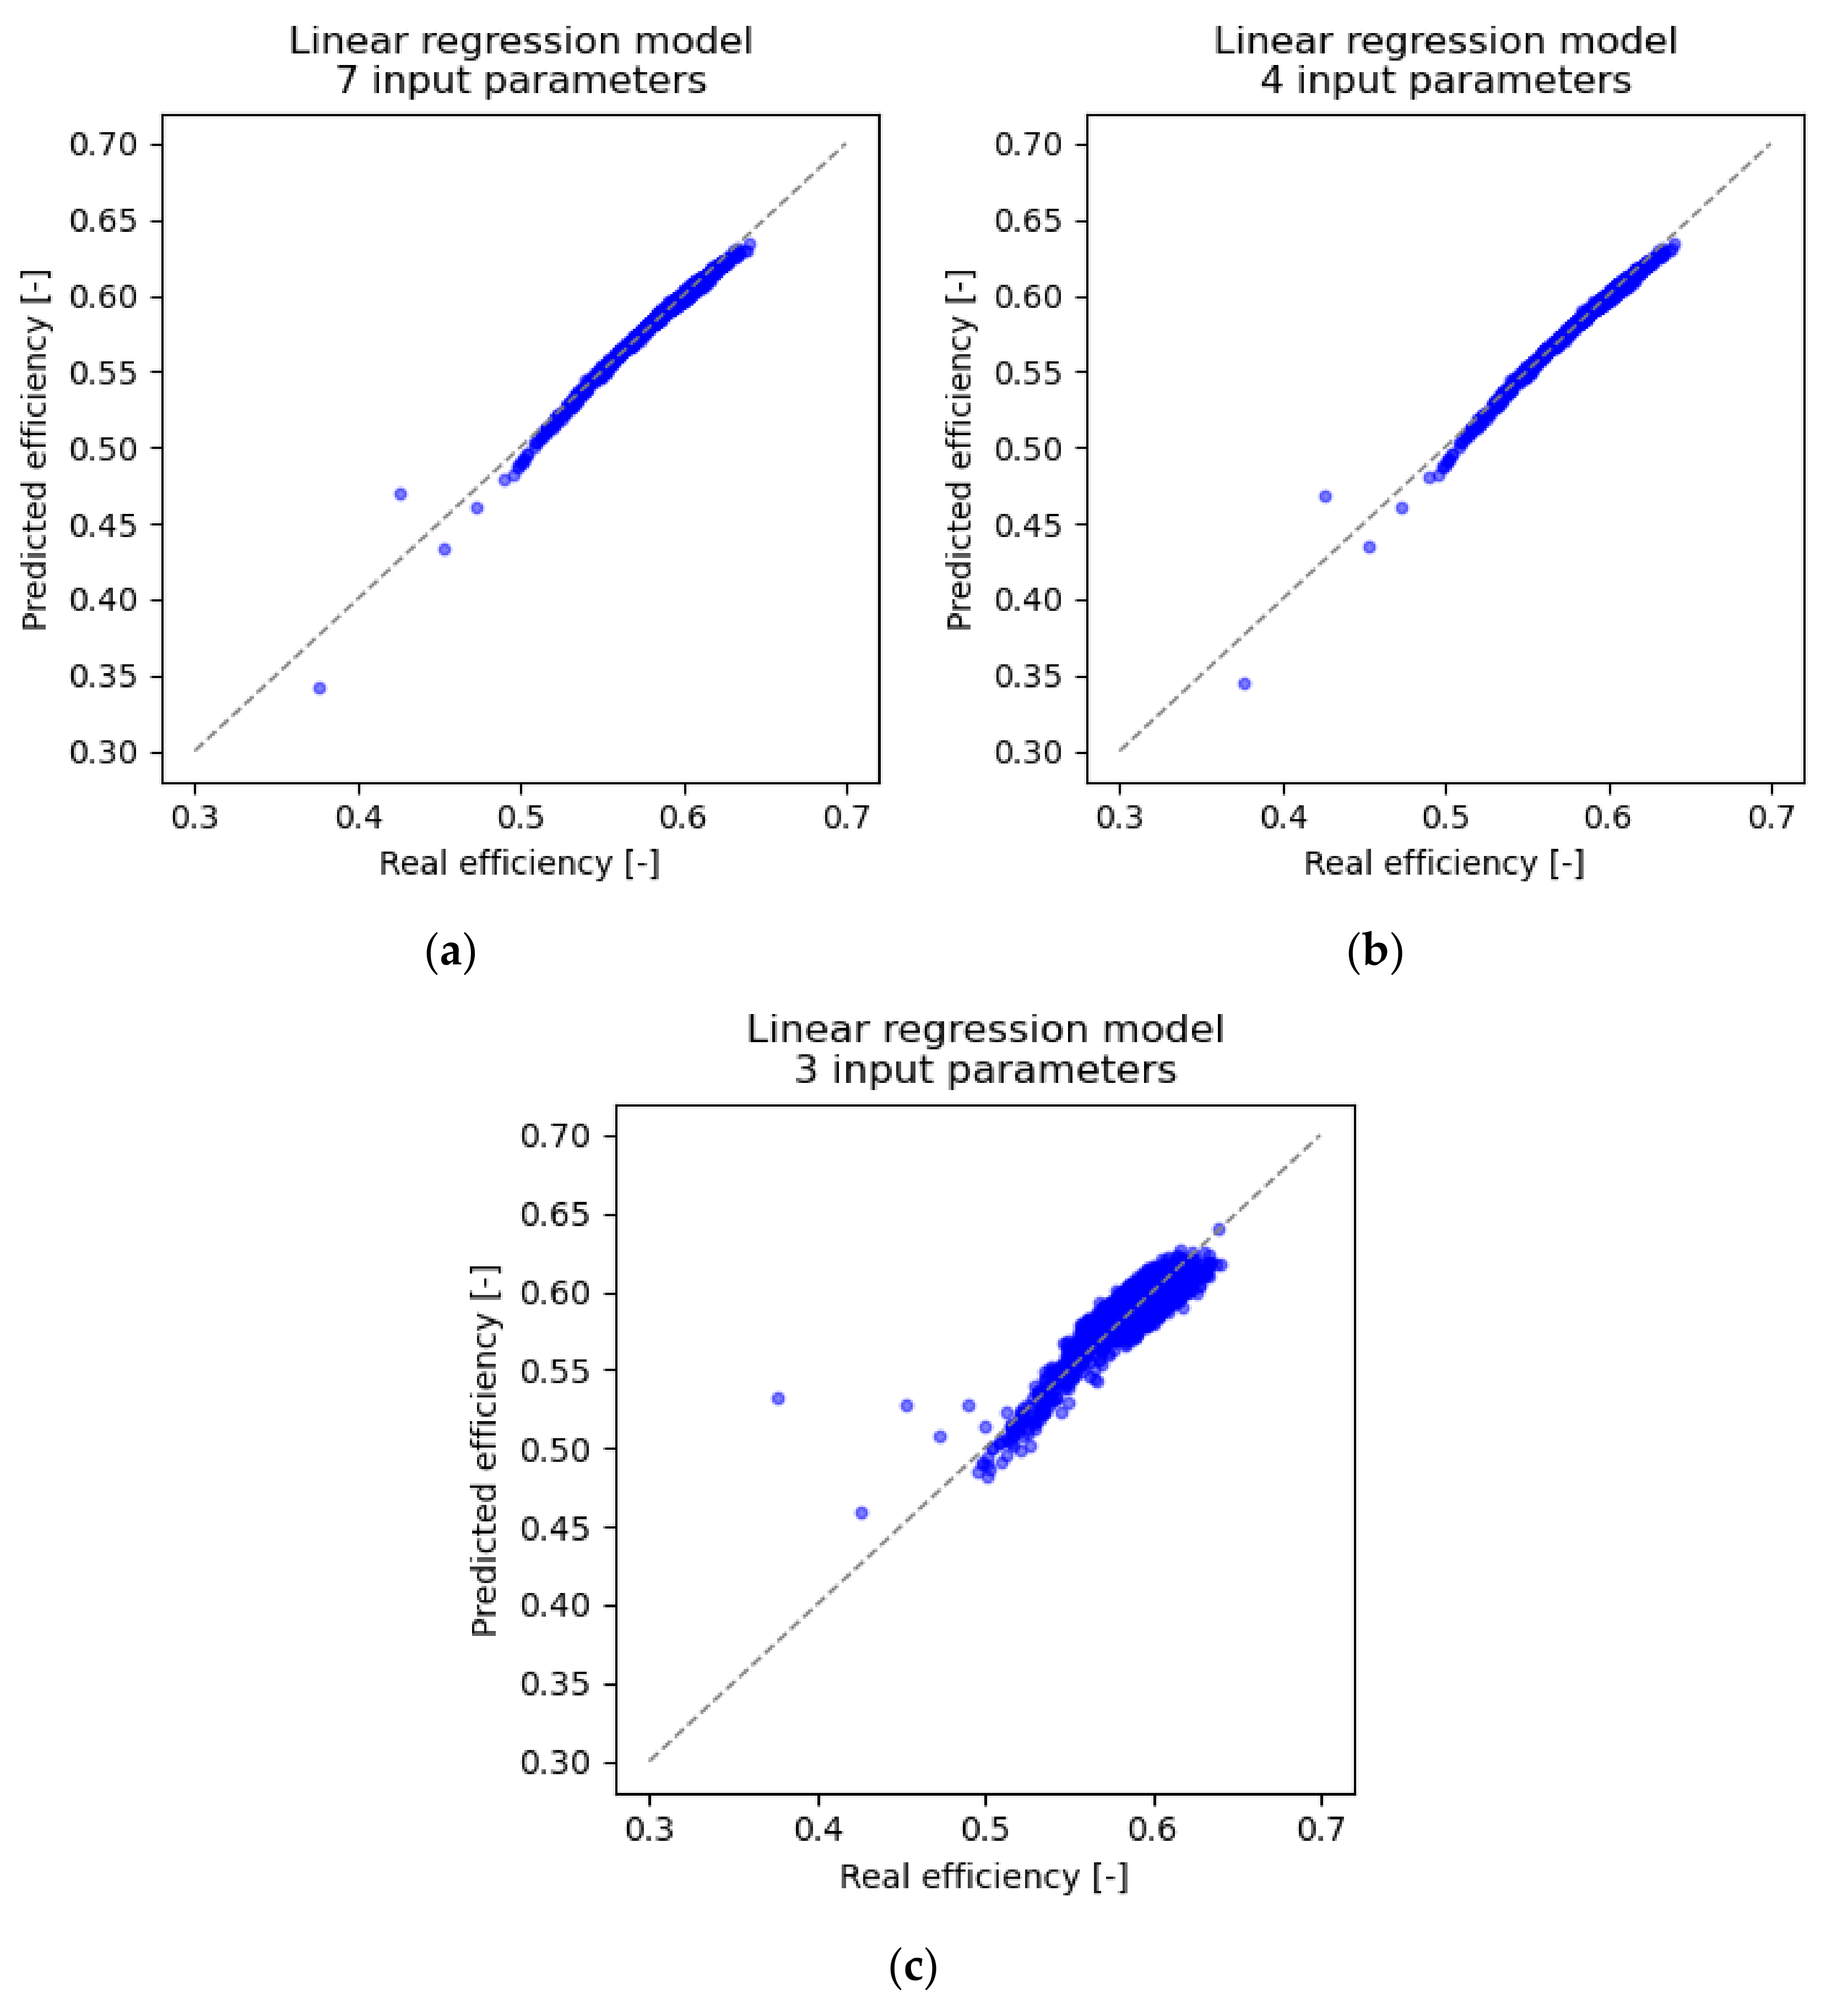
Table 3 and
Figure 6 show the model’s prediction error. There is no significant difference (
p > 0.05) between the error value for the model with seven parameters and for that with four parameters.
Figure 7 shows, in detail, the predicted values depending on the measured ones.
A model including all measured parameters achieves the same accuracy as a model based on the following four parameters: suction pressure (Pa), current draw (A), rotational speed (Hz), and flow (m3/s). Failure to include flow velocity in the input parameters results in a significant reduction in model accuracy.
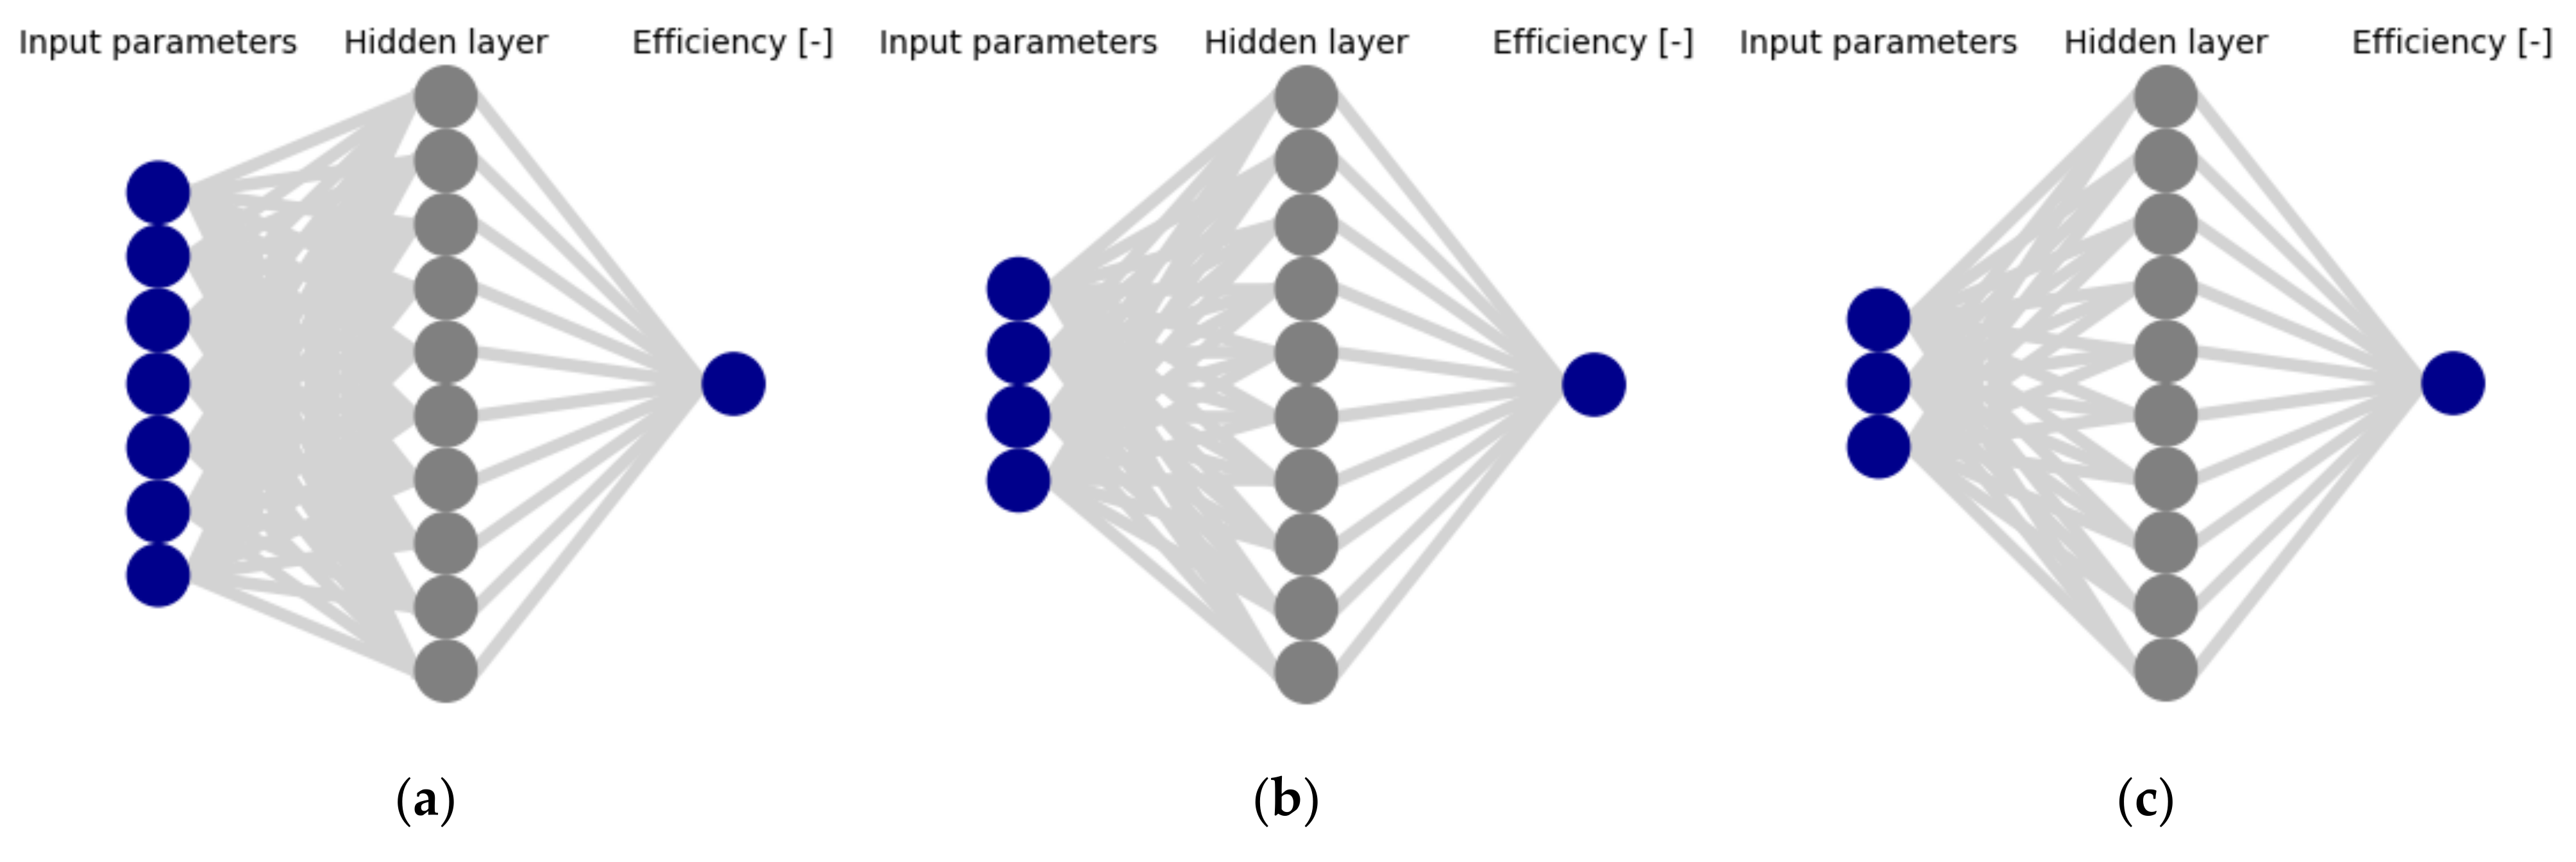
A mathematical model based on an artificial neural network was also developed to analyse the influence of the measured parameters on the fan efficiency, taking into account non-linear relationships and mutual dependencies between the parameters.
As for the linear regression-based model, calculations were performed for three sets of input parameters:
Seven parameters: suction temperature (°C), discharge temperature (°C), suction pressure (Pa), current draw (A), rotational speed (Hz), humidity (%), flow (m3/s);
Four parameters: suction pressure (Pa), current draw (A), rotational speed (Hz), flow (m3/s);
Three parameters: suction pressure (Pa), current draw (A), rotational speed (Hz).
Ten neurons were used in the hidden layer of the neural network.
Figure 8 shows the network architectures.
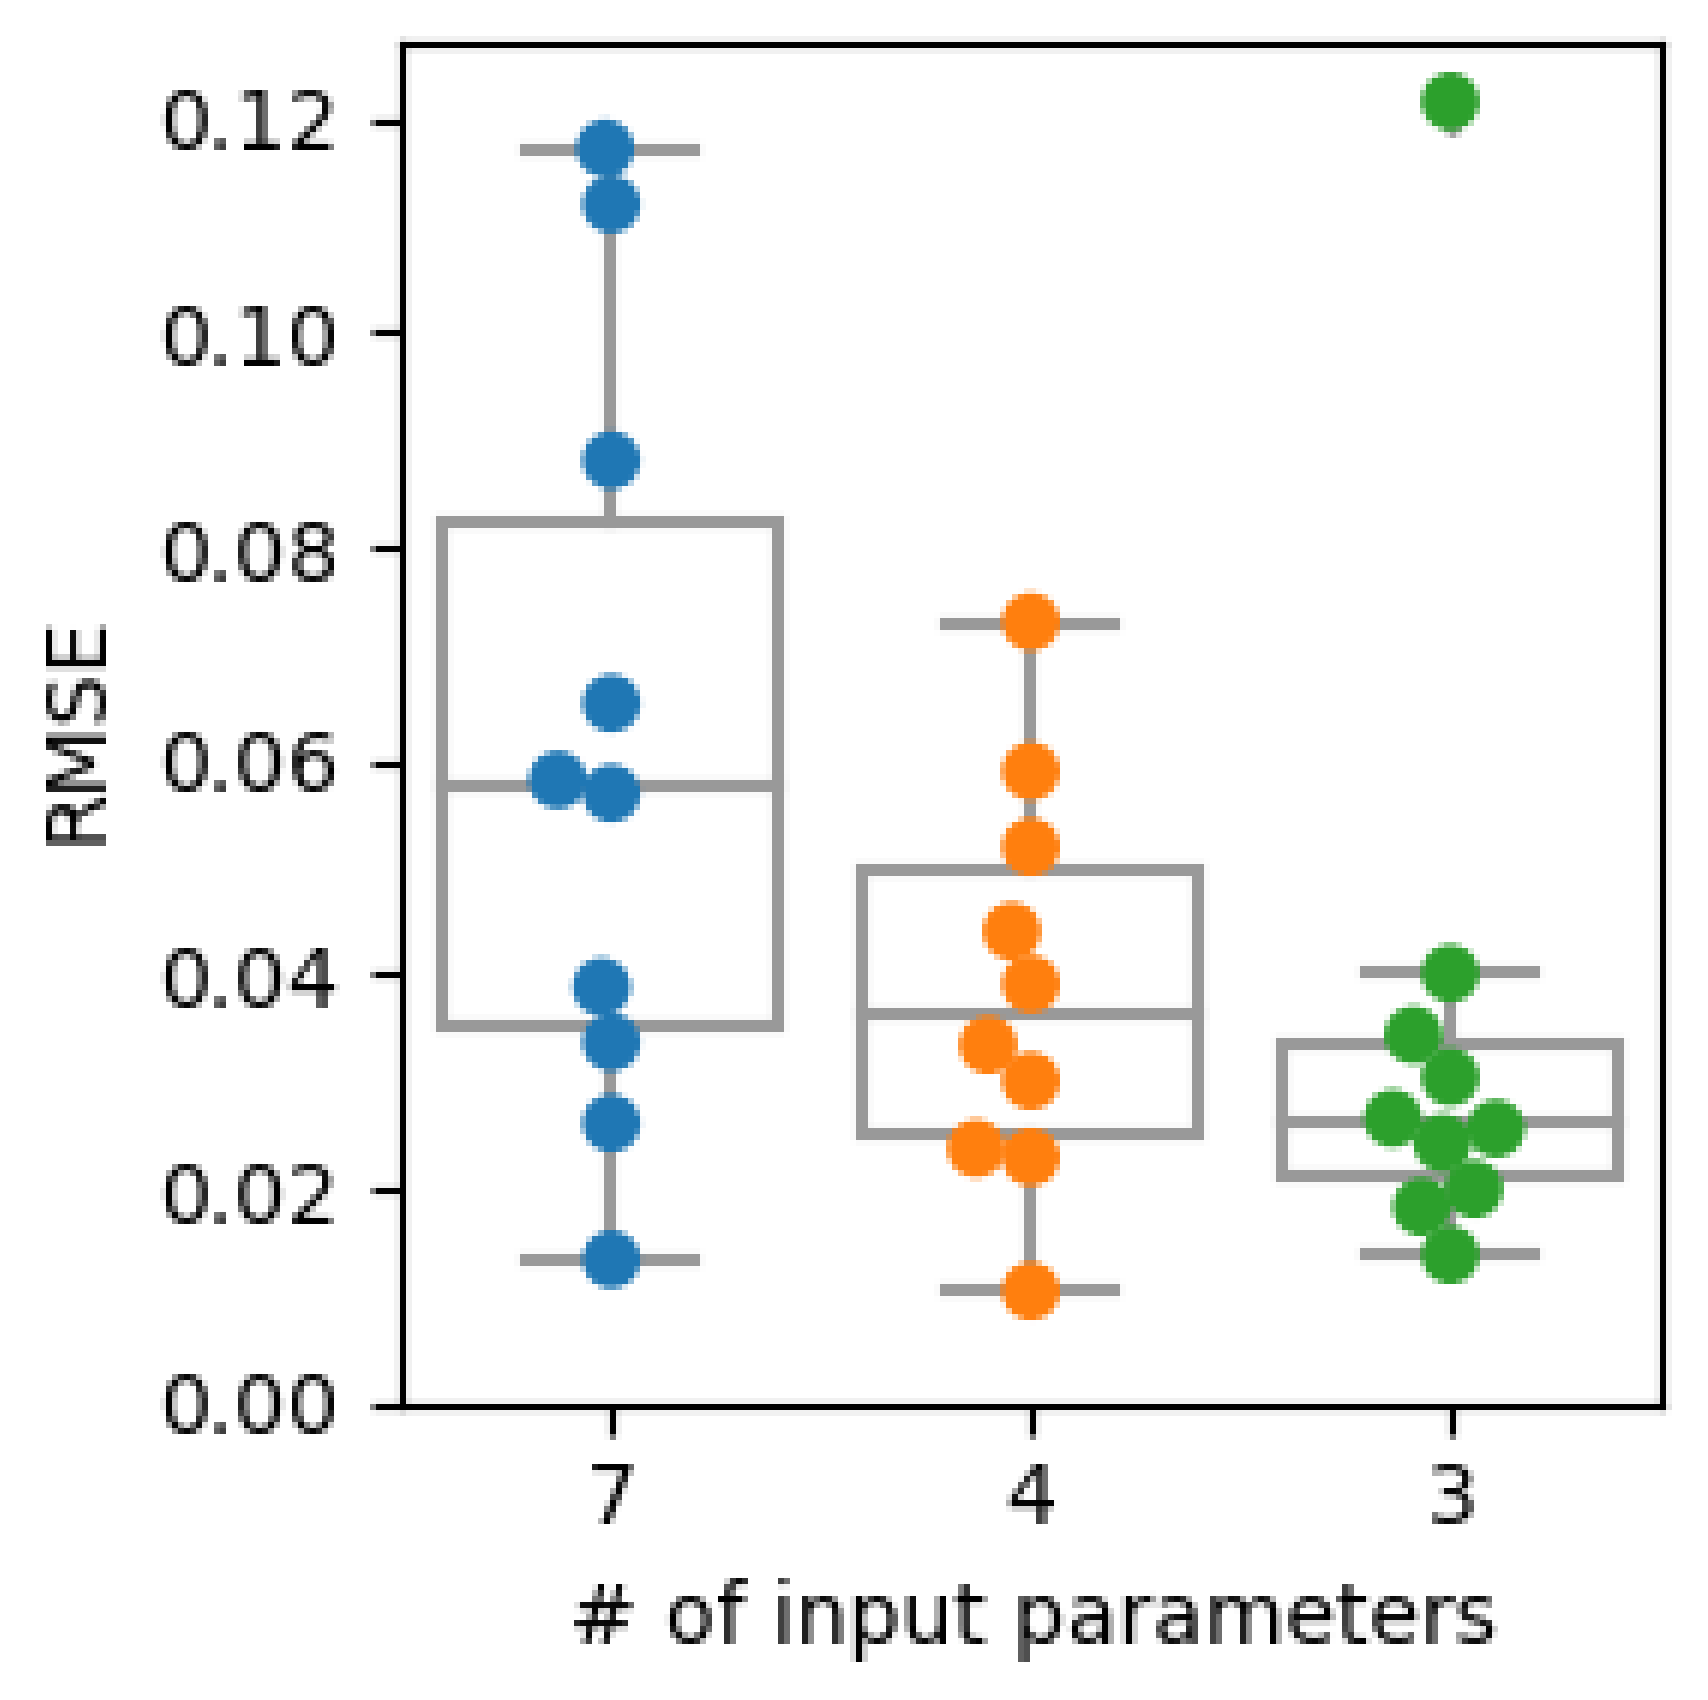
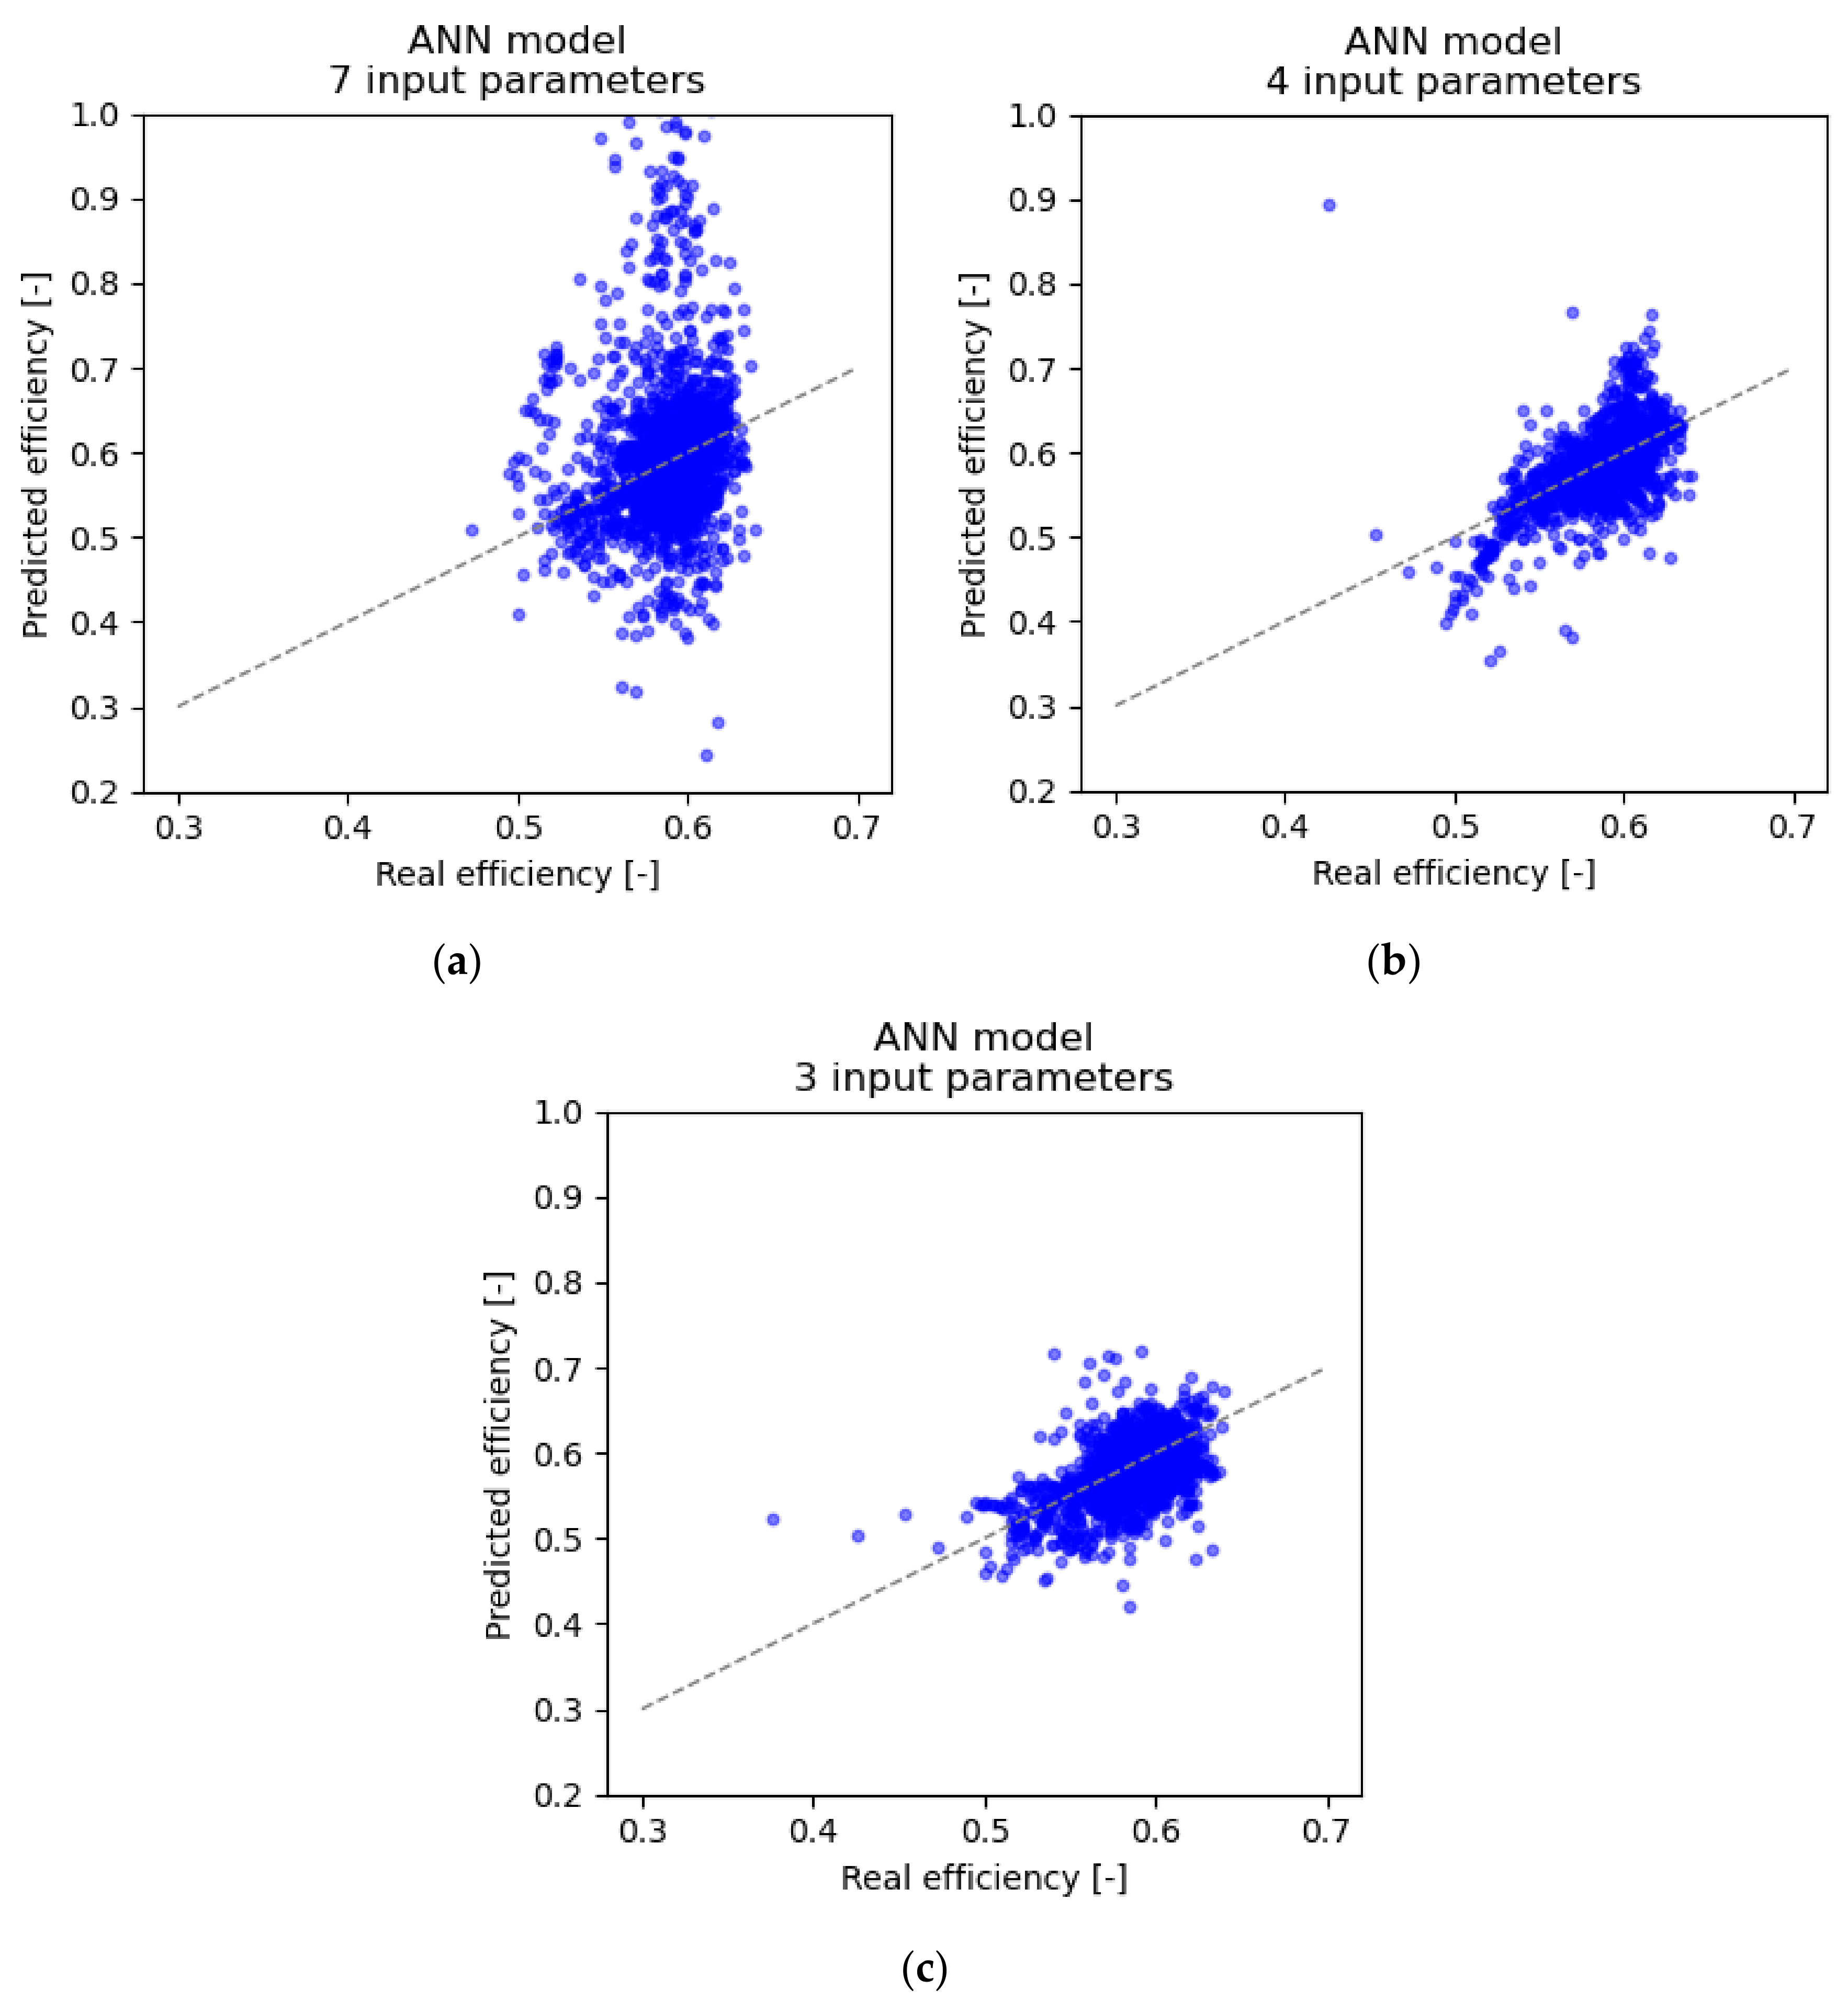
Table 3, as well as
Figure 9 and
Figure 10, show the prediction error.
Artificial neural network models had a prediction error that was an order of magnitude higher in 10-fold cross-validation. This is probably due to overfitting, as confirmed by the significantly smaller error (p < 0.01) for a smaller number of input parameters.
Based on the results presented, artificial neural network models were less accurate than linear regression, and conclusions regarding the significance of input parameters were based on linear regression models.
Based on the performed analyses and the obtained mathematical models reflecting the relationships between the parameters measured in actual conditions and fan efficiency, four statistically significant parameters related to efficiency were found:
The measured parameters, i.e., the temperature of the medium in the suction and discharge ducts and relative humidity, are not significantly correlated with the fan efficiency while operating at the existing facility. The aforementioned significance was based on a confidence interval of 95%.
The resulting model will be developed and expanded using measurement data obtained over a more extended period of operation. This will make it possible to determine a detailed course of action for further design and construction changes to the fans and the systems. Thus, the model will be used in the design process as the most beneficial tool for generating and verifying retrofit concepts for the systems and the fans themselves. The main objectives of the proposed system for collecting and analysing data and predicting future operating states are as follows:
determining the current operating conditions and parameters,
determining the current and future status of process production,
collecting and analysing operational data and developing load cycles,
evaluating alternative system designs and areas for improvement,
determining the most technically and economically advantageous options, considering all the subsystems,
implementing the best system design variant,
evaluating energy consumption in relation to operating conditions,
continuous monitoring and ongoing optimisation of the system,
continuing to operate and maintain the system for maximum efficiency.


 ,
, 


