
Analysis of the Financing Options for Pro-Ecological Projects


1
Department of Economics and Informatics, Silesian University of Technology, 44-100 Gliwice, Poland
2
Department of Management, Silesian University of Technology, 44-100 Gliwice, Poland
*
Author to whom correspondence should be addressed.
Energies 2022, 15(6), 2143; https://doi.org/10.3390/en15062143
Submission received: 8 November 2021
/
Revised: 30 January 2022
/
Accepted: 14 February 2022
/
Published: 15 March 2022
(This article belongs to the Special Issue Financing Renewable Energy in the Energy Market)
Abstract
:The implementation of pro-ecological projects, including those in the field of renewable energy sources, should bring the desired effects, not only environmental or social, but also economic and financial. Although the latter should not prejudge the implementation of such projects, investors, who are primarily enterprises, need information on whether financing the project from specific, available sources is effective and when the incurred financial expenses will pay off. The publication presents a model that reflects the procedure in the analysis of financing opportunities for pro-ecological projects, aimed at maximizing their financial effects, with a consideration of specific risk factors and limitations. The result of the application of this model is information that supports making rational decisions about the implementation of a specific pro-ecological project. The model was positively verified within a case study concerning the purchase and assembly of a photovoltaic installation by a medium-sized company in Poland.
1. Introduction
The implementation of pro-ecological projects, including usage of renewable energy sources, is now a very important element of the ecological policy of countries. In Poland, it is implemented by municipalities or budgetary units, but mainly by enterprises, due to the scope of legal regulations and the popularization of the idea of corporate social responsibility.
Regardless of the regulations adopted by a given state in the field of ecological policy, it is required that it be effective, i.e., bring the desired effects, not only environmental or social, but also economic and financial. The latter is given a lot of attention, because the implementation of pro-ecological projects is capital-intensive—it requires financing of high investment outlays. For this reason, regardless of whether they are public projects or implemented by enterprises, the most effective sources of financing are sought, i.e., that have the lowest costs.
Considerations regarding the cost of capital from various sources that can be used to finance projects (not only pro-ecological) have been presented in many publications [1,2,3,4,5,6]. It should be noted, however, that the subject of scientific discussions is mainly the method of calculating the cost of capital itself (e.g., coming from a specific source (CC), weighted average (WACC)) or determining the structure of this capital (using financial leverage). Meanwhile, from the point of view of entities interested in the implementation of pro-ecological projects, including mainly entrepreneurs, it is important to indicate synthetic guidelines that would assist in making calculations to obtain economic justification for the implementation of these projects, taking into account possible sources of financing. The basis for considerations in this respect should therefore be methods that enable the assessment of the economic and financial effects of pro-ecological projects. The procedure of these methods should include the analysis of the possibilities of financing projects, with particular emphasis on the cost of capital coming from various sources.
According to many scientific authorities, the method that best reflects the economic and financial effects of environmental policy is the cost–benefit analysis (CBA) [7,8,9,10,11,12,13,14,15,16]. CBA makes it possible to compare (in monetary units) all costs and benefits, not only of the investor, but also “external” incurred by various groups of stakeholders. Since it is considered a method of policy effectiveness assessment [17], the CBA is recommended, inter alia, by the European Union (EU), to evaluate “large” (Pursuant to Art. 100 of EU Regulation No. 1303/2013, a major project has a total eligible cost exceeding EUR 50,000,000.) projects that can be financed from multiple sources [10]. In the EU, they can come from the European Regional Development Fund and the Cohesion Fund, but also from many other sources, including private sector support, which have various costs. Therefore, the CBA can take this aspect into account and assess the related economic and financial effects. Therefore, it can be concluded that the results of the application of this method may constitute the basis for justifying the legitimacy of financing the project from specific sources. It should be noted, however, that carrying out project evaluation using this method is difficult, time-consuming, and costly, as it is most often carried out by teams of experts with specialized environmental, social and economic competences. The CBA procedure is complex, and its essence is the transition from the financial analysis of the project to the assessment of its economic effectiveness. This means, in the first place, the need to calculate the measures of the financial net present value (FNPV) and the financial return on capital (FRR), successively in relation to investments, domestic capital, and in the case of public–private partnerships also to private capital. The analysis of the possibilities of financing ecological projects aimed at the selection of sources that maximize economic and financial effects should therefore be carried out at this point. Subsequently, the obtained results should be corrected. In particular, fiscal, non-market, and externalities adjustments should be made in the calculations performed. Moreover, in line with international practice, further calculations should also take into account market price adjustments which should be converted into hidden prices reflecting social opportunity costs instead of the prices observed in the market. After adjustments are made, costs and benefits over time are discounted using a “social” discount rate that allows future benefits and costs to be assessed against current benefits and costs from a social perspective. On this basis, it is possible to calculate the economic result of the environmental project, measured with the economic net present value (ENPV), economic rate of return (ERR) and benefits and costs (B/C ratio) ratios. Finally, the CBA recommends conducting a sensitivity analysis and the risk of failure to achieve the planned economic effects.
Unfortunately, CBA appears to be rather complicated. The difficulty is in particular in the identification and estimation of external costs as well as valuation of environmental benefits. Moreover, despite the good theoretical foundations relating to hidden prices or the social discount rate, their determination has also been considered as complex for many years [18,19,20,21,22,23,24,25,26,27,28,29,30,31,32]. For these reasons, as well as for others, e.g., philosophical ones, the CBA is criticized. It is believed that it should not be used in environmental policy or call for amendments to it [12,17,20,33,34,35,36,37,38,39,40,41,42,43,44,45]. Considering the indicated factors, as well as the difficulty, time-consumption and cost-effectiveness of the CBA, it is hardly surprising that it is used almost exclusively by budgetary units. When deciding on the implementation of a pro-ecological project, enterprises more often take into account the results of its evaluation with the use of cost effectiveness analysis (CEA). The most precise measure of this efficiency is dynamic generation cost (DGC), reflecting the cost-effectiveness of achieving the ecological effect [46,47,48,49,50].
The CEA can be considered good and much easier to apply to the CBA, but it should be noted that it does not take into account how the project is financed. This is important for those entrepreneurs who consider various possibilities of financing pro-ecological projects—from their own and external sources, returnable and non-returnable, with various costs. These investors are interested in answering two basic questions:
- Is financing of the project from specific, available sources effective?;
- When will the financial expenses be reimbursed?
It should be emphasized at this point that these questions are of fundamental importance, because in many countries, the main share in the financing structure of pro-ecological projects are investors’ own funds, supplemented with funds obtained through external financing—own or outsourced. For example, this is the case in Poland, where in the last 15 years, the companies’ own sources were dominant in the structure of financing of outlays for the implementation of pro-ecological project [51]. Therefore, the need to answer these two questions is natural. It is also worth mentioning here that it is intensified by the still existing view that spending on pro-ecological projects creates a relative disadvantage for enterprises, especially if their economic and financial situation is compared to competing entities that are not “environmentally” responsible [52]. This view is based on the experience of many companies, especially in the case of “end-of-pipe” projects (pollution treatment), perceived as generating only expenses, and examples confirming the existence of such a phenomenon are presented in the literature on the subject [53,54,55,56]. Of course, the literature also describes examples confirming the beneficial impact of pro-ecological projects, especially “integrated technologies” (pollution prevention), on the economic and financial situation of enterprises [57,58]. This has an impact on raising awareness that the implementation of pro-ecological projects can be effective, because it is associated not only with incurring capital expenditures and costs, but also with the possibility of obtaining savings due to lower environmental fees or other charges, and in selected cases also generating revenues.
Taking into account the presented CBA and CEA methods, it can be assumed that in their basic form they do not constitute a properly selected tool that an entrepreneur can use to assess the legitimacy of financing a pro-ecological project from appropriate, available sources. In the case of the CBA, the procedure is very complicated, time-consuming and costly, whereas the CEA does not give a direct answer as to whether the use of specific sources of financing will provide a return on the invested capital and when it will occur. For this reason, it is worth presenting the third assessment method in the form of financial analysis (FA), which is interesting from the point of view of an investor such as an entrepreneur and can be used in the assessment of “smaller” pro-ecological projects “integrated technologies” (pollution prevention) and “end-of-pipe” (pollution treatment), which generate savings (and possibly income).
The procedure for the proceedings in FA is described in the literature on the subject, constituting the basis for the assessment of investment projects based on the calculations of, among others: financial net present value (FNPV), financial rate of return (FRR), financial discounted payback period (FDPP). In the procedure of this analysis, different financing possibilities and their costs can be taken into account. It is also possible to extend the FA with a sensitivity analysis that allows examining how the value of the effect, measured e.g., by the FNPV index, changes as a result of changes in certain risk factors [4,59,60,61,62]. It should be noted, however, that although the issue of FA is quite well recognized, in practice its use is not large—in Poland it results primarily from the formal conditions for obtaining funding, e.g., from public institutions, which include the National Fund for Environmental Protection and Water Management (Narodowy Fundusz Ochrony Środowiska i Gospodarki Wodnej—NFOŚiGW), Warsaw, Poland and Provincial Funds for Environmental Protection and Water Management (Wojewódzkie Fundusze Ochrony Środowiska i Gospodarki Wodnej—WFOŚiGW), providing support in the form of grants or preferential loans and credits. It should also be emphasized here that enterprises rather outsource this analysis to specialized entities, which is not cheap. They mainly argue that the existing scientific publications relating to FA either focus on a selected aspect of this analysis, or include confusing considerations, or are too extensive and lack coherent and synthetically developed guidelines that would assist entrepreneurs in making appropriate calculations. It can therefore be concluded that there is a gap in the existing scientific publications related to the lack of a model whose application solves the problem of selecting sources of financing for pro-ecological projects aimed at maximizing their financial effects. This publication fills this gap. The aim of the publication is in particular to present a model that reflects the procedure in the analysis of the financing options for pro-ecological projects, aimed at maximizing their financial effects, taking into account specific risk factors and limitations. The result of the application of this model are therefore information that may constitute the basis for making rational decisions about the implementation of a specific pro-ecological project. It was assumed that the description of the model and the necessary calculations should be accessible especially to entrepreneurs who are the main investor in environmental protection projects, including projects related to renewable energy sources The developed model of analysis of the financing options for pro-ecological projects constitutes a contribution to the scientific field being considered in a special issue of Energies “Financing Renewable Energy in the Energy Market”.
2. Materials and Methods
The research, the results of which are presented in the publication, was carried out in three stages.
Stage 1 aimed at presenting the possibilities of financing pro-ecological projects and included collecting data and information about these possibilities in Poland, from the literature on the subject, databases of the Central Statistical Office in Warsaw, Poland—Local Data Bank [51], Ministry of Climate and Environment, Warsaw, Poland [63], National Fund for Environment Protection and Water Management, Warsaw, Poland [64], and Environment Protection Bank, Warsaw, Poland [65]. A synthetic summary of the results of this stage of research is presented in point 3.1.
Stage 2 was oriented at developing a model, which required taking into account the data and information obtained in stage 1 of the research, as well as the use of the following elements:
- Capital cost analysis, including their assessment on the basis of CC, WACC methods;
- Financial analysis, focused on the assessment of the financial effects of the project on the basis of the FNPV, FRR, and FDPP methods;
- Analysis of the sensitivity of the project’s financial performance indicators to changes in specific risk factors;
- Analysis of the financial effectiveness of possible financing options for the project.
The result of this stage of research is the model that reflects the procedure in the analysis of financing opportunities for pro-ecological projects, aimed at maximizing their financial effects, taking into account specific risk factors and limitations. The model is presented in item 3.2.
Stage 3 included model verification, based on the case study, presented in item 3.3. This stage required the collection of data and information necessary to conduct an analysis of the financing options for a project from the field of renewable energy sources, the implementation of which was of interest to one of the companies. During this stage, its comments regarding the method of presenting the results of the calculations, which in its opinion constitute the basis for rational decision-making on the implementation of a project were considered. The result of this stage of research is confirmation of the effectiveness of the developed model.
3. Results
3.1. Financing Options for Pro-Ecological Projects
In Poland, but also in most countries around the world, there are many options for financing pro-ecological projects (Figure 1). In Poland, but also in other countries, among others in 38 OECD members of the Organization for Economic Cooperation and Development, Paris, France, the use of the presented sources depends on the current principle of environmental economization, which assumes that projects in the field of environmental protection should be implemented and financed primarily by entities generating pollution and contributing to the degradation of the ecosystem.
This is due to the basic rules constituting the core of Poland’s ecological policy, which include: “polluter pays”, “polluters pay” (when it is difficult to identify one perpetrator of external costs, financial responsibility for harmful activity is proportionate to the share in pollutant emissions), “user pays” (user of the device or the consumer of the good that pollutes the environment is charged with environmental protection costs), and “victim pays” (but voluntarily). These rules fall within the scope of the broadly understood principle of environmental economization, the essence of which consists in the use of the market mechanism to create pro-ecological behavior of entrepreneurs and other users of the environment and the implementation of the state’s ecological goals [68]. The application of the presented rules translates into the share of individual sources in financing pro-ecological projects in Poland (Figure 2).
Due to the rules constituting the core of ecological policy, the financing of pro-ecological projects in Poland is dominated by own funds, the average share of which in 2005–2020 was 54.17%, the lowest (41.62%) was in 2015, and the highest (63.94%) in 2017. Own funds may come from various sources; for example, in enterprises it may be financial surpluses (including retained earnings and depreciation write-offs), funds from rental or sale of property, depreciation write-offs, and (depending on the organizational and legal form) shares or contributions from new shareholders. The presented rules of ecological policy, especially “polluter pays” and “user pays”, do not mean a complete departure from external financial support of investors from public sources, although it is assumed that it should apply to exceptional cases, for example, when pro-ecological projects are particularly capital-intensive or economically ineffective.
Then, part of the expenses may be covered by the state budget and local governments as well as environmental funds (NFOŚiGW and WFOŚiGW), although the data show (Figure 2) that the share of sources in financing pro-ecological projects in Poland is not too high. This applies in particular to budget funds (in the form of subsidies and concessions, e.g., tax deductions), the average share of which in the period 2005–2020 was approx. 4.7%, the highest (10.23%) was recorded in 2011, and the lowest (2.23%) in 2014. The data show that in public sources, environmental funds are more important—NFOŚiGW and WFOŚiGW—whose average share in financing pro-ecological projects in Poland in the analysed 15 years was 15.9%, the highest (21.15%) was recorded in 2005, and the lowest (12.27%) in 2020. It is worth mentioning here that public environmental funds are created from revenues from fees for using the environment and introducing changes to it, as well as penalties for violating environmental protection requirements, extracting minerals without the required license or with gross violation of its conditions and with other receipts (e.g., for shipping and rafting as well as for the extraction of aggregate and sand from waters, from returnable receipts, from conducted financial operations, interest on loans and bank accounts, as well as obtained loans). The indicated receipts are the revenues of the NFOŚiGW and WFOŚiGW [66]. Co-financing of projects by environmental funds may, in specific cases, become state aid under the law. The Minister of the Environment, by way of a decision, determined the conditions for granting public aid for environmental protection and water management from the funds at the disposal of the National Fund for Environmental Protection and Water Management and the Regional Fund for Environmental Protection and Water Management, taking into account the need to ensure the transparency of granting such aid and compliance with the conditions of its admissibility set out in the guidelines of the European Commission [69].
The recipients of co-financing pro-ecological projects from public funds are entrepreneurs from the private and public sector, local governments (especially municipalities) and public finance sector entities. These funds support the implementation of pro-ecological projects by using:
- Non-returnable financing (subsidies, interest subsidies for bank loans, subsidies for repayment of loan instalments);
- Repayable financing (investment loans to maintain financial liquidity for projects co-financed from EU funds with a preferential interest rate);
- Equity financing (through equity entries into commercial law companies in cases requiring funds from the fund to achieve an environmental effect);
- Other instruments, including cancellation of chosen liabilities (loans for pro-ecological investments) or conversion of receivables into shares.
The aforementioned support instruments are used depending on the legal form of the aid beneficiary and the instrument’s impact on its financial situation [70].
An important source of financing for environmental projects are foreign funds. Their share in financing projects in Poland in the analyzed 15 years was quite significant. On average it was 19.54%, the highest (26.93%) was recorded in 2015, and the lowest (14.82%) in 2007. Foreign aid for environmental protection has been granted to Poland by the EU, including under the Infrastructure and Environment Operational Program (for the years 2014–2020) through the Cohesion Fund, the LIFE+ Financial Instrument (for the years 2007–2013), LIFE (for the years 2014–2020 and 2021–2027), as well as under the Norwegian Financial Mechanism and Financial Mechanism of the European Economic Area (for the years 2004–2009; 2009–2014; 2014–2021) [71].
The recipients of co-financing pro-ecological projects from foreign funds are enterprises, public administration, public services, health care institutions, social organizations and religious associations, science and education institutions, and natural persons. Restrictions may relate to competences and experience or the area of activity. Detailed information on this subject is specified in the documentation of individual funding competitions.
Another, less popular source of financing pro-ecological projects is credits (granted by banks, pursuant to banking law) and loans (granted by various institutions, such as credit unions, savings banks, other enterprises or private lenders, on the basis of the provisions of the Civil Code). The share of this source in financing pro-ecological projects in Poland in 2005–2020 was on average 8.99%, the highest (11.43%) was recorded in 2006, and the lowest (6.12%) in 2015. About 87% of this method of financing comes from preferential loans and the rest from commercial ones. Bank Ochrony Środowiska (BOŚ), Warsaw, Poland, cooperating with NFOŚiGW and WFOŚiGW, plays a dominant role in granting preferential bank loans for purposes related to environmental protection. Other banks may also grant such loans if they have signed an interest subsidy agreement with NFOŚiGW or WFOŚiGW. Otherwise, these banks may grant commercial loans.
The least popular in Poland, but possible ways of obtaining funds to finance pro-ecological projects, include issue of securities, e.g., corporate or municipal bonds or short-term debt securities, other market forms of financing, e.g., leasing institutions, defined as other sources (Figure 2). This group also includes (although rarely) funds from donations or sponsorship. (Sponsorship, as opposed to donation, is a bilateral agreement, on the basis of which both parties benefit from the implementation of the project). Other sources of capital did not spread in Poland, and their share in financing pro-ecological projects in 2005–2020 was on average 3.36%, the highest (4.42%) was recorded in 2015, and the lowest (1.32%) in 2012.
It should be remembered that obtaining capital costs money, regardless of which source it comes from. The cost of capital should be included in the model for analyzing the possibilities of financing environmental projects.
3.2. Model of the Analysis of the Financing Options for Pro-Ecological Projects
The developed model includes four stages, of which 1 and 2 are obligatory (Figure 3). Extending the scope of the analysis to stages 3 and 4 allows for obtaining additional information relating to the risk factors associated with the project and their impact on its financial results, as well as for the assessment of alternative financing options for the project.
Stage 1 includes an indication of the sources of financing for the project. Within its framework, three actions should be implemented: A1, A2, A3.
A1. This activity is focused on the analysis of the availability of equity and external capital that can be used to finance the project. It should start with potentially the cheapest sources, which include non-returnable foreign capital from donations and subsidies (in Poland, from the state budget, local governments, and from EU, Norwegian, and EEA foreign funds). One could also consider raising capital through donation or sponsorship.
Then, the availability of returnable external funds should be analyzed, especially preferential credits and loans (in Poland, from the environmental funds of NFOŚIGW, WFOŚIGW, and from BOŚ and commercial banks that signed an agreement with NFOŚIGW, WFOŚIGW). At the same time, it is worth analyzing the possibilities of obtaining capital from own, internal funds, because their cost may (but does not have to) be lower than preferential credits and loans. Finally, the analysis of the availability of capital should include other external outsourced sources and external own sources, the cost of which may be the highest.
In the analysis of the availability of capital that can be used to finance a pro-ecological project, one should take into account the organizational and legal form of the entity interested in implementing the project and other requirements, e.g., included in the documentation of competitions for project financing or in the conditions of banks. In the case of external funds, it should be noted that the financing conditions, even from the same source, may differ depending on the specifics of the project. For example, for micro and small enterprises and individuals, Bank Ochrony Środowiska (BOŚ) in Poland has different financing conditions for projects related to clean energy and water protection (Table 1). In addition, the conditions for obtaining external funds may differ depending on the economic and financial situation of the entrepreneur, as well as whether the planned project is characterized by financial efficiency (e.g., the lack of such efficiency may be the basis for co-financing from EU funds).
Therefore, the basis for the analysis of the availability of equity and foreign capital that can be used to finance a project should be reliable knowledge (data, information) about the possibilities of financing pro-ecological projects in a given country/region at a specific time. These possibilities in Poland until 2021 are synthetically presented in item 3.1. It should be noted here that the indicated possibilities are, in principle, consistent when it comes to programs for financing pro-ecological projects from EU funds in other countries that are its members. These possibilities also do not differ significantly when it comes to other sources, although data and information on the specific conditions of their acquisition and availability for a given country/region should be obtained. It is also worth remembering that a given country may offer other sources of financing for environmental projects (than in Figure 1).
B1. The result of the analysis of the availability of equity and external capital that can be used to finance the project should be their appropriate list with the conditions for their acquisition (Table 2). In terms of obtaining them, it is necessary to provide information on the amount of the capital that can be obtained and its possible interest rate, repayment period, and additional costs.
A2. This activity is aimed at calculating the cost of each available source of equity and borrowed capital, which is indicated in Table 2. These calculations should be carried out on the basis of the described solutions in this area [4,5,74].
The cost of equity (CCe) is measured in terms of its alternative involvement or cost of lost benefits (CClp). The point is that this capital may be allocated to the implementation of another project with a specific rate of return. Therefore, the investor wants to recover it from the pro-ecological project. If an entrepreneur interested in the implementation and financing of an ecological project does not have an alternative project, then the cost of internal equity should be the interest rate on investments with a zero level of risk, e.g., debt securities issued by the State Treasury, provided that it has a stable economic and financial situation. Their interest rate can be adjusted for a certain level of risk premium (RP) that may accompany a given environmental project. The cost of internal equity is therefore expressed by the formula:
The cost of external equity is calculated depending on the organizational and legal form of the enterprise interested in the implementation and financing of an environmental project.
In the case of companies owned by shareholders (partners), the cost of acquiring founding contributions (CCfc) is calculated as the cost of internal equity. If this capital comes from new shareholders, it can be adjusted for additional costs (AC) related to their acquisition, which, depending on the scale of the operation, vary from 1% to 2%. The cost of equity from initial contributions is therefore expressed by the formula:
In the case of joint stock companies, the cost of capital is related to the issue of shares. In the calculation of the cost of share capital (CCs), it is necessary to take into account the value of the annual dividend paid to share owners (AD), the market price of the share (P), and the expected constant rate of dividend growth (g), as well as additional costs related to the acquisition of new shareholders (AC), which depending on the scale of the operation, may range from 1% to 4%. The cost of capital from the issue of shares is therefore expressed by the formula:
The cost of debt capital depends on whether it is returnable or non-returnable.
Grants and subsidies are non-returnable external capital. The capital from these sources does not bear interest, and its cost may result, inter alia, from:
- Preparation of project documentation along with a precise plan for the use of this capital, in accordance with specific guidelines;
- Obtaining and using specific capital to finance the project—in the case of refinancing (this capital is returned after the project is completed);
- Current preparation of project implementation reports and delivery of invoices with appropriate forms confirming the actual involvement of works.
The costs incurred should be converted as a percentage of the obtained amount, which is the cost of capital.
In the case of a donation, the cost of capital results from the expenses incurred to sign the relevant contract, the cost of which is converted as a percentage into the amount obtained. In the case of sponsorship, it is similar, unless the concluded contract requires additional costs, which is rare.
Repayable external capital includes credits and loans, e.g., from ecological funds and banks, issues of debt securities (bonds, short-term debt securities), and leasing.
The capital cost of credits or loans (CCl) is based on the annual interest rate of the credit or loan (rl) and the income tax rate (T). Interest rate on credits and loans (rl), especially long-term one, is flexible. In Poland, it is based on the interest rate at which banks borrow money from each other, i.e., LIBOR (London Interbank Offer Rate) (the London InterBank Offered Rate is the reference rate at which four major banks make loans on the international market in London, UK: Bankers Trust, Bank of Tokyo, Tokyo, Japan, Barclays, London, UK, National Westminster, London, UK) or EURIBOR (Euro Interbank Offer Rate) (Euro Interbank Offered Rate is the reference rate at which banks in the Euro area, Switzerland, Norway and Iceland make loans on the international market) or (most often) WIBOR (Warsaw Interbank Offered Rate) (Warsaw Interbank Offered Rate is the reference interest rate on the Polish interbank market), which is increased by a margin (of a fund or a bank, which depends, among others, on the economic and financial situation of the shareholder). Thus, the cost of capital from credits or loans is expressed by the formula:
It should be noted that the interest rate on loans or borrowings is adjusted for tax write-offs (the interest reduces the tax base), and therefore this cost of capital is lower than the interest rate presented by the principal (if the entrepreneur pays taxes, it is the so-called tax shield effect). It should also be remembered that in the case of this capital, there may be other, additional costs, e.g., service charge, which should be included in the cost of capital.
The cost of capital from issuing bonds (CCbi) is based on the annual rate of return on the bond (rbi), determined by interest, discount, premium, and income tax rate (T). The mechanism of calculating the cost of capital from bond issues is similar to the cost of capital from credits or loans, and is expressed by the formula:
The cost of capital from issuing commercial papers (CCcp) depends on their market price (Pm)m) and nominal price (Pn)n), as well as the number of days for which they have been issued (d). This cost is expressed by the formula:
The cost of lease capital is calculated in the same way as for loans or credits, taking into account the interest rate on the lease and the benefits of the tax shield.
B2. As a result of the action A2, there should be a list of sources of capital that can be used to finance the project, along with information on the value of this capital and its cost, ordered according to the increasing cost of capital (Table 3).
A3. This activity covers the selection of the most favorable financing sources for the project and calculation of the weighted average cost of capital (WACC), based on the described solutions in this regard [52,53,58]. Knowing the amount of investment outlays on the project, the cheapest sources (with the lowest cost of capital), from among those indicated in Table 3, should be used to finance them to the maximum possible extent. After their selection, their share in the total capital financing the project should be indicated. Then the costs of the various sources of capital should be multiplied by their share. WACC is the sum of the costs of capital financing the project, weighted by their share in the capital structure, and is expressed by the formula:
where wi—share of the i-th source in total capital, CCi—cost of capital from the i-th source, n—number of capital sources.
B3. As a result of the action A3, there should be a list of selected sources of project financing, the value of capital from these sources (their sum should be equal to the value of investment outlays), the share of these sources in the financing structure and the cost of capital from these sources, as well as the weighted average cost of capital financing the project (Table 4).
Stage 2 includes an assessment of the economic effectiveness of the use of project financing sources. Within its framework, two actions should be implemented: A4, A5.
A4. It is an activity aimed at identifying the elements of net cash flow (NCF) that characterize a project over a certain period of time, which is called the calculation period. This period may be adopted arbitrarily, e.g., on the basis of the credit or loan repayment period, or on the basis of the time related to the preparation of the project (e.g., time for the preparation of documentation, obtaining funds, construction or purchase and installation of fixed assets related to the project), and also the time of its operation (e.g., the depreciation time of the main fixed assets related to the project). The calculation period does not correspond to the real life of the project, which may be longer.
NCFs reflect the difference between the stream of cash inflows (CIF) and the stream of cash outflows (COF) realized in the assumed calculation period (t = 1, ..., n). NCF therefore is expressed by the formula:
For the calculation of the NCF, first indicate operating revenues and expenses.
Revenues are proceeds that occur only in selected environmental projects where the by-product of the project implementation can be sold (e.g., wet-based flue gas desulphurization installations where gypsum is the by-product of operation, which is the subject of sale).
Operating costs are expenses incurred in connection with the functioning of the project (related to e.g., consumption of energy, fuel, materials, external services, or the depreciation of fixed assets). In the case of financing the project with repayable external capital (e.g., a preferential credit or a loan), the costs should include interest and commissions on this capital in order to obtain the tax shield effect.
The difference between revenues and costs is the gross financial result. If it is positive, i.e., it is profit, you should calculate the income tax, based on the appropriate rate (T), (e.g., 19% of profit). The gross financial result minus the tax amount is the net financial result. This result is the first one to consider when calculating NCFt.
Next, to calculate NCFt one must identify CIF. They may come from savings due to lower environmental fees (e.g., fines for violating environmental protection requirements) or from other reasons (e.g., reducing electricity consumption). In the case of financing the project with external capital (e.g., a preferential loan, donations, subsidy), the CIF should include the amount of money obtained from this source, granted in a specific unit of the calculation period. The CIF should also include an adjustment for the depreciation cost item.
Then indicate the COF, in the first instance related to investment outlays. Another element of COF will be the repayment of capital (in instalments) from external, returnable sources.
B4. The result of the action A4. should be a list of the NCFt t of the project in the calculation period (Table 5).
A5. This action is aimed at calculating the values of FNPV, FRR, and FPP, which are the basis for the assessment of the financial effects of the implementation of the pro-ecological project.
The financial net present value (FNPV) of the project enables its evaluation in monetary units, taking into account changes in the value of money over time, which is especially important for projects that operate over a longer time horizon and the effects of their implementation are spread over time. Most often, updating is done by using a discount rate that allows the future value of capital to be converted to its present value. FNPV is the sum of NCFt discounted for a specific point in time (Table 5). Discounting NCFt means multiplying them by the discount factor (at). It is expressed with the formula:
The discount factor is calculated according to the formula:
in which the financial discount rate (FDR) is determined on the basis of the WACC level (Table 4), but there may be situations when the FDR level is recommended (e.g., for projects financed from EU funds in 2014–2020, the recommended FDR level was 4–0.04% [10].
A financial rate of return (FRR) is a discount rate that gives a FNPV of zero:
FRR is determined using the method of successive approximations and linear interpolation, in accordance with the formula:
where: i1– discount rate at which FNPV > 0, i2—discount rate at which FNPV < 0, FNPV1—calculated based on i1, FNPV2—calculated based on i2.
The financial payback period (FPP) is the time after which the capital spent on investment expenditure will be returned. Its calculation requires the cumulative discounted net cash flow (NCFt × at). In the first year cumulative cNCF1 · a1 has the same value as NCF1 · a1, in the second year cNCF2 · a2 is the sum of cNCF1 · a1 and NCF2 · a2, and in the following years cNCFt, · at is the sum of cNCFt−1, · at and NCFt, · at. FPP is determined based on the formula:
in which: x—number of years in which the cumulative discounted net cash flow is negative, |cNCFt · at|—absolute value of the last negative cumulative, discounted net cash flow, cNCFt · at—value of the first positive cumulative, discounted net cash flow, 365—number of days in a year.
B5. As a result of the action A5, there should be an assessment of the financial effects of the project implementation (Table 6). To perform it, it is necessary to calculate NCFt, · at, and cNCFt, · at.
If the value calculated on their basis:
- FNPV (in monetary units, e.g., PLN, Euro) is positive, which means that the project is effective and brings financial surpluses that allow for the return of the capital financing the project and (additionally) bring financial benefits to the entrepreneur;
- FRR (in%) is higher than the applied discount rate (WACC), which means that the project is effective;
- The FPP is lower (or equal to) than the period required by the investor for the return on capital financing the project, which means that the project implementation is justified, and the capital spent on its financing will be returned in the adopted calculation period.
A positive assessment means justification for making a decision to finance an environmental project, and a negative one—no such justification.
Stage 3 includes an assessment of the sensitivity of the project’s financial effects to changes in risk factors. Within its framework, two actions should be implemented: A6, A7.
A6. It is identification of risk factors that may adversely affect the financial results of the project at this point, it is necessary to consider (e.g., during the discussion) whether there are risk factors related to the project, which, if they occur, may have a negative impact on its financial results. Factors that can be quantified should be indicated.
B6. As a result of the action A6, there should be a list of the most important risk factors and the extent of their possible changes (Table 7).
A7. This activity involves examining the impact of changes in the development of risk factors on the financial results of the project. This action requires examining the sensitivity of financial efficiency indicators, consisting in a deterministic simulation, as a result of which new values of these indicators are obtained, calculated taking into account the range of possible changes in one selected risk factor. In particular, a specific change [%] in the development of the selected factor is assumed from the value adopted in the baseline scenario, and then the FNPV, FRR, and FPP are calculated at the new value of this factor. Other factors remain at the level established in the baseline scenario.
B7. As a result of the action A7. there should be an assessment of the financial effects of the project implementation, taking into account changes in the selected risk factor, e.g., by ±20%, with a specific step, e.g., 5% (Table 8).
Stage 4 includes the analysis and evaluation of other possible financing options for the project. Within its framework, two actions should be implemented: A8, A9. The rationale for carrying out this analysis and assessment is that usually in the most favorable financing option (selected in stage 1), non-returnable foreign capital (grants, subsidies) can be obtained after the completion of the project construction. This means that these capitals must first be financed with other ones, which will later be returned. However, there may be a situation that (e.g., due to the exhaustion of funds in a given year) the project will not be co-financed. Although the application for co-financing is not rejected, it is waiting for a new opening of a given program, which may or may not take place.
A8. This action is aimed at identifying other options for financing the project than the one selected in stage 1, because it was considered the most advantageous (it had the lowest cost of capital). The information in Table 3 should be used here.
B8. As a result of the action A8. there should be a list of possible variants for project financing, the value of capital from these sources (their sum should be equal to the value of investment outlays), the share of these sources in the financing structure and the cost of capital from these sources, as well as the weighted average cost of capital financing the project (Table 9).
A9. This activity is aimed at calculating the FNPV, FRR, and FPP for the possible financing options of the project, in accordance with the instruction indicated in the activities A4 and A5.
B9. As a result of the action A9, there should be an assessment of the financial effects of the project, taking into account possible variants of its financing (Table 10).
Depending on the needs of the entrepreneur, the presented assessment of the financial effects of the project can be supplemented with an analysis of their sensitivity to changes in risk factors, which should be carried out as in stage 3.
3.3. Model Verification
The model was verified in case studies. The publication presents the results of one of them. As part of this study, an analysis of the financing options for a project related to renewable energy sources was carried out, the implementation of which was interesting to a medium-sized enterprise in Poland dealing with the processing of foamed plastics—primarily the processing of polyethylene foam and EVA foam, as well as raw materials such as polypropylene and synthetic rubbers such as EPDM, SBR, and CR—neoprene. The company has been operating for over 30 years and is a limited liability company established by three owners—partners. It has a large area and quite extensive technological infrastructure, including a production hall (with an area of 1200 m2) and warehouse (600 m2).
The company uses advanced machines for processing, which are characterized by high demand for electricity. On average, monthly—the company pays approx. PLN 12,000 for electricity, which corresponds to the power used at the level of 24,489.80 kWh. Thus, annually, it is an expenditure of PLN 144,000 (annual energy demand is 293,877.55 kWh). Therefore, the owners of the company were considering the implementation of an ecological project related to the purchase and assembly of a photovoltaic installation, which should enable independence from rising energy prices, and should also have a positive impact on the natural environment, placing the company in the group implementing the idea of corporate social responsibility.
The basis for the analysis of the financing possibilities for this project was obtaining market offers. Three offers were obtained, which were prepared on the basis of data on the place of installation and took into account the flat roof of the facility allowing the installation of solar panels, continuous sunlight (no shade), and location (due to the need to estimate the intensity of solar radiation in a given location). In addition, each offer includes the necessary power of the panels, which should ensure the production of the total electricity needed for the enterprise already at the level of 80% of their efficiency. Such an assumption was necessary because the photovoltaic installation does not always operate at full rated power. It is characterized by variability, which depends both on the current solar radiation and the temperature of the cells.
The obtained offers differ mainly in the amount of necessary investment outlays (Table 11). The most expensive offer includes photovoltaic panels with the highest power, and their number is the smallest (699 panels, occupying approx. 1207.31 m2 of area). The cheapest offer includes 928 panels covering an area of approx. 1551.17 m2, while the intermediate—773 panels, for which the development of 1302.51 m2 is needed.
Each offer included new, annual electricity bills of PLN 217 (Table 12). With the assumed constant electricity price equal to PLN 0.49 kWh [75] and energy production at the level of 80% of the full power of the installation, this means that the project implementation will bring annual savings of PLN 143,783.
As each of the offers generates the same savings and differs in investment expenditures, potential investors stated that the offer I (Table 13) would be selected for the analysis of the possibility of financing the project related to the purchase and installation of a photovoltaic installation, as it is characterized by the lowest investment expenditures.
3.4. Analysis of the Financing Options of the Project
3.4.1. Stage 1: Indication of Financing Sources for a Project
The analysis of the availability of equity and external capital that can be used to finance the project (offer I) allowed for the identification of three possible sources (Table 14).
The indicated sources of capital that can be used to finance the project have different costs (Table 15). As the partners themselves will prepare the necessary documentation and necessary reports, and will also provide the company’s equity (from retained profit deposited on a savings and settlement account with an interest rate of 0.00% per annum), which will be refinanced from the subsidy within 6 months at the latest, it was assumed that the subsidy has a zero cost of capital.
The cost of the capital from the loan is 3.24% per annum (because the interest reduces the gross financial result of the enterprise—the tax shield effect).
On the other hand, the cost of internal equity is the most expensive, because the partners have no capital other than the financial surplus, which they will allocate to finance the project, counting on its refinancing with a subsidy. For this reason, they decided that the remaining capital would be covered by additional cash contributions, the alternative investment of which in the modernization project in the enterprise would bring them a financial effect of 8.5%. Hence, the cost of this capital is 8.5%.
The value and cost of the project financing sources allowed to indicate the share of individual sources in the project financing structure and the weighted average cost of capital financing the project (Table 16).
3.4.2. Stage 2: Assessment of the Economic Effectiveness of the Use of Project Financing Sources
In order to present the NCFt characterizing the project, the calculation period was first determined, based on the depreciation of the fixed assets related to the project. Since the photovoltaic installation belongs to type 348 of the Classification of Fixed Assets—“Other turbine sets and generating sets”—its depreciation is 7% (in accordance with Annex 1 to the Act of 15 February 1992 on corporate income tax). On this basis, it was assumed that the calculation period covers 15 years (the time for the preparation of documentation and the purchase and installation of a photovoltaic installation was not included in the period, as 2 months were provided for this). Year 1 in the calculation period is 2021.
The project is generating no revenue. The costs (Table 17) result from the maintenance of the photovoltaic system, interest on the loan and depreciation of fixed assets (7%). As the gross financial result is negative (no tax), the net financial result is at the same level. Savings (Table 18) result from the reduction of the cost of electricity and were developed on the basis of price forecasts per kWh [75]. Equal instalments of loan principal repayment were assumed. The remaining NCFt elements were adopted in accordance with the instructions for stage 2. The capital expenditures take into account the need to replace the inverter in 2028.
The specific NCFt values allowed for the calculation of the FNPV, FRR, FPP indices, with the FDR rate at the WACC level (Table 19). It should be noted that the adopted project financing variant is characterized by high financial efficiency, FNPV is PLN 937 768.40, FRR is 43.37%, and FPP is 3 years and 279 days. This allows for a positive assessment, which means a rational justification for the decision to finance an environmental project.
To complete the assessment, the owners of the enterprise decided that they were interested in information that could be obtained during stages 3 and 4 of the developed model.
3.4.3. Stage 3: Assessment of the Sensitivity of the Project’s Financial Effects to Changes in Risk Factors
In the course of the discussion, it was found that the key risk factor that may affect the financial effects of the project is the decrease in energy production from the photovoltaic installation, e.g., due to weather conditions. The financial effects of the project have been calculated assuming that this production will amount to 80% of the total capacity of the installation. Although this is the most likely scenario, the owners of the company decided that it is also worth taking into account its other values. It was assumed that the subject of the research will be changes in energy production by ±20%, in 5% increments. In the event of a decrease in energy production, the company will have to buy the missing part at market prices; therefore, the costs will increase by the value of the purchased electricity.
Moreover, the price of 1 kWh of electricity was found to be the second important risk factor. In particular, investors’ concerns resulted from the plan prepared in Poland to sell energy from the photovoltaic installation to the energy system at wholesale prices and purchase the same volume of energy at retail prices. The consequence of the implementation of this plan will be a reduction in the price of 1 kWh of electricity from the photovoltaic installation. For this reason, it was assumed that the subject of the research would be changes in the adopted price of 1 kWh by ±20%, in 5% steps.
The third risk factor that was significant for the owners of the enterprise was the interest rate on the loan, due to the unstable situation in Poland and the announced increase in interest rates. For this reason, it was assumed that the subject of the research would be changes in the adopted loan interest rate by ±20%, with a 5% step.
The results of the sensitivity analysis of the project’s financial effects to changes in risk factors are presented in Table 20. A ±20% decrease or increase in any of the factors will not result in a loss of financial efficiency of the project.
3.4.4. Stage 4: Analysis and Evaluation of Other Possible Financing Options for the Project
The analysis was carried out due to the possibility of not obtaining a subsidy (refinancing the invested own funds), as well as not obtaining a bank loan (e.g., due to the economic and financial situation of the enterprise).
Two additional possible options of project financing were analysed (Table 21):
- Option 1: own funds, internal funds (50%), and a bank loan (50%), in case the subsidy is not obtained,
- Option 2: own funds (100%), in the event of failure to obtain a subsidy and a loan.
The assessment of the financial effectiveness of the project on the basis of the FNPV, FRR, FPP indicators for the possible financing options for the project is presented in Table 22.
The investors’ assessment of these ratios is positive because the project implementation under these financing conditions is also characterized by financial efficiency. However, investors expressed the need to check the impact of specific risk factors on the financial results of the project. The results of the sensitivity analysis are presented in Table 23.
The obtained results of the sensitivity of the FNPV, FRR, and FPP indicators to changes in specific risk factors in the second financing option are the least favorable. It should be noted that a decrease in energy production and its price may result in a loss of financial efficiency of the project and a lack of return on the own funds invested by the owners of the enterprise. However, the probability that the business owners will have to use this method of financing or that the indicated adverse changes in risk factors will occur has been estimated as small. This allowed for the decision to implement this project.
4. Discussion
After reading the considerations in the scope of the developed model, which reflects the procedure in the analysis of the possibilities of financing pro-ecological projects, aimed at maximizing their financial effects, taking into account specific risk factors and limitations, one can form the impression that the information resulting from the use of the model is the basic decision-making criterion for implementation of a specific pro-ecological project. The authors of the publication would like to emphasize that, of course, this was not their intention, as it is social and environmental criteria that should determine the implementation of pro-ecological projects. However, due to the significant capital intensity of these projects, the authors of the model believe that the information obtained in the course of its use by entrepreneurs may be an additional incentive to undertake such projects. Currently, when entrepreneurs operate in a competitive environment, it is important for them not only to implement the idea of corporate social responsibility, but most of all economically effective functioning and development in the future. Therefore, the awareness of the effects of undertaking a specific pro-ecological project is a priority for many of them, as it supports making rational decisions.
It should be noted that the developed model is an abstract representation of reality, which means that it is less complex and ignores certain phenomena. The most important of them is to rely on deterministic data, forecast for many years. This is a very large simplification, because the future is uncertain and it is difficult to assume that the input data adopted in the model will be at the same level. Of course, this uncertainty could be reduced by using various forecasting methods or by relying on probabilistic data, but according to the authors of the model, this would have a negative impact on its use in practice, because entrepreneurs expect a simple tool that they will be able to use without using the services of specialized external entities.
It can be argued whether the sensitivity analysis adopted in the model is an appropriate tool for examining the risk of failure to achieve financial effects. The doubt is that it assumes specific changes in the development of the selected risk factor from the value adopted in the baseline scenario, with the value of other risk factors unchanged. In fact, such a situation does not occur, as individual factors may change simultaneously, often remaining in mutual dependence. The authors are aware that to obtain a more reliable risk assessment, more precise methods could be used, including probabilistic method, based on project implementation scenarios and the probability of their occurrence, in which the risk measures are the expected value (e.g., μFNPV), standard deviation (e.g., δENPV), or the coefficient of variation (e.g., CVFNPV). This method can take into account the Monte Carlo simulation, which uses the probability density functions and the distribution function of random variables—risk factors [76,77,78]. However, the use of such an approach, according to the authors of the model, makes the appropriate calculations more difficult and time-consuming, which could discourage entrepreneurs from using the model.
Similarly, one can discuss the method of calculating the cost of equity adopted in the model. In the literature, it is often recommended to use the capital asset pricing model (CAPM) for this purpose, which assumes that part of the risk premium on the expected return on invested capital is a function of the market risk characterizing the securities (shares) in which capital is invested. This issue is widely described, also in the context of the method of calculating this cost and its individual elements [4,6,79,80]. One could therefore use this model, although it is criticized [81,82,83,84,85]. The adoption of simpler solutions for calculating the cost of equity in the model resulted not only from this criticism, but above all from the fact that the CAPM-based approach is more complicated and requires advanced calculations, which could adversely affect the use of the model in practice.
It can also be discussed whether the case study, in stage 2, rightly took into account the depreciation costs (and their correction) or the cost of interest on the loan, since the project does not generate sales revenues, and therefore its gross financial result is negative (no taxes). In such a situation, doubts may also be raised by the method of calculating the cost of capital from the loan, which takes into account the tax shield effect, although no taxes have been indicated. The justification for this procedure was the request of the owners of the enterprise, who applied the established cash flows of the project directly to the cash flows of the entire enterprise. The depreciation costs of the photovoltaic installation or the cost of interest on the loan actually reduced their tax base (gross financial result), and therefore they used the tax shield. Thus, such an application of the net cash flow of the project to the cash flow of the enterprise makes sense, as it allows to compare the financial performance of the enterprise in a situation where its owners decide to implement the project or not.
Within the framework of the discussion, it is worth asking whether the developed model, which has been positively verified on the example of a project related to the purchase and assembly of a photovoltaic installation, implemented by a company in Poland, is generalized and can be used globally? According to the authors of the publication, the presented model can be used regardless of the specifics of the project and the place where it is implemented. Certainly, as part of the procedure described in the model, it is necessary to take into consideration the related conditions, and in particular—the available sources of financing (for a given project, in a given country or its region) and their cost or the fiscal policy of the state.
It can be also discussed whether the developed model is a new approach to analyzing the possibilities of financing pro-ecological projects, including renewable energy? Taking into account the scientific achievements to date in this field, it can be said that it is. As indicated synthetically in the introduction, the existing procedures in this regard, and in particular the solutions and methods described in the CBA or CEA in their basic form, do not constitute a properly selected tool that an entrepreneur can use to assess the legitimacy of financing a pro-ecological project from appropriate, available sources. First of all, they do not answer the questions that are particularly important for entrepreneurs, such as: (1) Is financing of the project from specific, available sources effective?; and (2) When will the financial expenses pay off? It is possible to answer the indicated questions by using the developed model. In this model, solutions based mainly on FA were adopted, which were supplemented with the issues of the cost of capital financing the projects, the risk of failure to achieve the expected financial effects, as well as the assessment of alternative financing options for the project. According to the authors, these solutions have been logically and synthetically combined, making it possible to analyze the financing options for pro-ecological projects, aimed at maximizing their financial effects, taking into account specific risk factors and limitations. Such an approach and compilation of the indicated solutions into one model can be considered new and more adjusted to the needs of entrepreneurs financing pro-ecological projects than the previously published, most often partial results of considerations in this area.
5. Conclusions
Protection of the natural environment is a priority currently, and the implementation of pro-ecological projects including renewable energy is a necessity. As entrepreneurs bear the main burden of financing such projects, it is worth supporting them. The purpose of this publication is actually to provide such support. Due to the developed model of analyzing the possibilities of financing pro-ecological projects, entrepreneurs can obtain information that is interesting to them, which may help them decide on the implementation of projects. In the course of the procedure in accordance with the developed model, they can find out which of the possible methods (sources) of project financing are the most advantageous in terms of costs, what are the financial effects of the project, including whether and when they will be reimbursed for the money invested; if there risk factors that may result in the lack of the expected financial results; and, finally, whether other possible variants of project financing allow for a return on the invested capital. As mentioned, this information can be an additional stimulus to decide on the implementation of pro-ecological projects, because many of them, due to the generation of savings, and in particular cases even revenues, are characterized by financial efficiency. It should also be mentioned here that demonstrating the ineffectiveness of pro-ecological projects using this model may constitute the basis for applying for state aid, especially when the planned projects are capital-intensive and bring the expected pro-ecological effects.
Although, as mentioned in the discussion, the developed model reflects reality in a simplified way, it can be said that the solutions used in it meet the international requirements for this type of analysis. The model is generalized and takes into account various possibilities of financing projects, as well as the fact that they can generate savings, but also revenues (which among others relates renewable energy). Synthetic and logical combination of solutions—in the field of the analysis of the cost of capital, financial analysis, analysis of the impact of risk factors on financial effects or analysis of possible financing options—in one model, can be considered as new and more adjusted to the needs of entrepreneurs financing pro-environmental projects than previously published, most often partial results of considerations in this regard.
For the authors of the model, it was extremely important that it was written in as little scientific language as possible, and the calculations included in it were not complicated, because it is important from the point of view of applying the model in practice, without the need to use specialists’ help.
The procedure elaborated in the model was verified in several case studies. The publication presents the results of only one of them, which rereferred to a project in the field of renewable energy, related to the purchase and assembly of a photovoltaic installation by a medium-sized company. Its owners confirmed that the information obtained within the procedure included in the model allowed them to make a quick and rational decision to implement an environmental project, being aware of the risk of not achieving the expected financial results.
Author Contributions
Conceptualization, J.B. and K.W.; methodology, J.B., K.W. and. A.A.; data curation and analysis of the financing options, A.A.; developing a model, J.B. and K.W.; model verification, J.B. and K.W.; writing—original draft preparation, J.B., K.W. and. A.A.; writing—review and editing, J.B., K.W. and. A.A.; funding acquisition, K.W. All authors have read and agreed to the published version of the manuscript.
Funding
Financed from the sources of the Silesian University of Technology, Gliwice, Poland.
Institutional Review Board Statement
Not applicable.
Informed Consent Statement
Not applicable.
Data Availability Statement
Ministry of Climate and Environment https://www.gov.pl/web/klimat/fundusze-srodowiskowe; https://www.gov.pl/web/klimat/fundusze-krajowe; https://www.gov.pl/web/klimat/co-robimy-fundusze-europejskie (accessed on 6–8 October 2021). National Fund for Environment Protection and Water Management. https://www.nfosigw.gov.pl (accessed on 6–8 October 2021). Environment Protection Bank. https://www.bosbank.pl/ (accessed on 6–8 October 2021). Informacja o naborach wniosków w roku 2021—Narodowy Fundusz Ochrony Środowiska i Gospodarki Wodnej—Portal Gov.pl. https://www.gov.pl (accessed on 4–5 October 2021). Central Statistical Office—Local Data bank https://stat.gov.pl (accessed on 11 October 2021). EKOkredyt na fotowoltaikę|Bank Ochrony Środowiska; EKOpożyczka “Nasza woda”|Bank Ochrony Środowiska; Available online: https://www.bosbank.pl (accessed on 11 October 2021).
Conflicts of Interest
The authors declare no conflict of interest.
References
- Damodaran, A. Investment Valuation: Tools and Techniques for Determining the Value of Any Asset; Wiley Frontiers in Finance; John Wiley & Sons Inc.: New York, NY, USA, 2012. [Google Scholar]
- Grabowski, R.J.; Pratt, S.P. Cost of Capital: Applications and Examples; John Wiley & Sons Inc.: New York, NY, USA, 2008. [Google Scholar]
- Hope, C.A. Finding a Realistic Cost of Capital. Bank Amount. Financ. 2002, 1, 27–32. [Google Scholar]
- Michalak, A. Finansowanie Inwestycji; PWN: Warszawa, Poland, 2007. [Google Scholar]
- Michalak, A. Zarządzanie kapitałem i wycena kosztu kapitału w przedsiębiorstwach górniczych. In Zarządzanie W Przedsiębiorstwie Górniczym; Turek, M., Ed.; Wydawnictwo Politechniki Śląskiej: Gliwice, Poland, 2019. [Google Scholar]
- Ogier, T.; Rugman, J.; Spicer, L. The Real Cost of Capital: A Business Field Guide to Better Financial Decisions; Pearson Education: Glasgow, UK, 2004. [Google Scholar]
- Becla, A.; Czaja, S.; Zielińska, A. Analiza Kosztów-Korzyści w Wycenie Środowiska Naturalnego; Difin: Warszawa, Poland, 2012. [Google Scholar]
- Florio, M. Cost-Benefit Analysis and Incentives in Evaluation: The Structural Funds of the European Union; Edward Elgar Publishing: Cheltenham, UK, 2007. [Google Scholar]
- Florio, M. Cost-Benefit Analysis and the European Union Cohesion Fund: On the Social Cost of Capital and Labour. Reg. Stud. 2006, 40, 211–224. [Google Scholar] [CrossRef]
- Sartori, D.; Catalano, G.; Genco, M.; Pancotti, C.; Sirtori, E.; Vignetti, S.; Bo, C. Guide to cost-benefit analysis of investment projects. In Economic Appraisal Tool for Cohesion Policy 2014–2020; European Commission: Belgium, Brussels, 2014; Available online: https://ec.europa.eu/regional_policy/sources/docgener/studies/pdf/cba_guide.pdf (accessed on 8 October 2021).
- Guidelines for Preparing Economic Analyses, National Center for Environmental Economics Office of Policy U.S. Environmental Protection Agency. 2010. Available online: https://www.epa.gov/sites/default/files/2017-08/documents/ee-0568-50.pdf (accessed on 10 July 2021).
- Hansson, S.O. Philosophical Problems in Cost-Benefit Analysis. Econ. Philos. 2007, 23, 163–183. [Google Scholar] [CrossRef]
- Knoepfel, P. Environmental Policy Analyses. In Learning from the Past for the Future–25 Years of Research; Springer: Berlin/Heidelberg, Germany, 2007. [Google Scholar]
- Kornhauser, L. On Justifying Cost-Benefit Analysis. J. Leg. Stud. 2000, 29, 1037–1057. [Google Scholar] [CrossRef]
- Pearce, D.W.; Atkinson, G.; Mourato, S. Cost-Benefit Analysis and Environment: Recent Developments; OECD: Paris, France, 2006. [Google Scholar]
- Sunstein, C.R. Cognition and Cost-Benefit Analysis. J. Leg. Stud. 2000, 29, 1059–1103. [Google Scholar] [CrossRef] [Green Version]
- Weimer, D.L.; Vining, A.R. Policy Analysis: Concepts and Practice, 5th ed.; Longman Pub Group: New York, NY, USA, 2011. [Google Scholar]
- Boardman, A.E.; Moore, M.A.; Vining, A.R. The Social Discount Rate for Canada based on Future Growth in Consumption. Can. Public Policy 2010, 36, 325–343. [Google Scholar] [CrossRef]
- Evans, D. Social Discount Rates for the European Union. In Cost-Benefit Analysis and Incentives in Evaluation: The Structural Funds of the European Union; Florio, M., Ed.; Edward Elgar Publishing: Cheltenham, UK, 2007. [Google Scholar]
- Freeman, A.M. The Measurement of Environmental and Resource Values: Theory and Methods, 2nd ed.; Resources for the Future: Washington, DC, USA, 2003. [Google Scholar]
- Groom, B.; Hepburn, C.; Koundouri, P.; Pearce, D. Declining Discount Rates: The Long and the Short of It. Environ. Resour. Econ. 2005, 32, 445–493. [Google Scholar] [CrossRef]
- Groom, B.; Koundouri, P.; Panopoulou, E.; Pantelidis, T. Discounting the Distant Future: How Much Does Model Selection Affect the Certainty Equivalent Rate? J. Appl. Econom. 2007, 22, 641–656. [Google Scholar] [CrossRef] [Green Version]
- Harrison, M. Valuing the Future: The Social Discount Rate in Cost-Benefit Analysis–Productivity Commission Visiting Researcher Paper; Australian Government: Canberra, Australia, 2010. [Google Scholar]
- Hepburn, C. Use of discount rates in the estimation of the costs of inaction with respect to selected environmental concerns. In Working Party on National Environmental Policies; OECD: Paris, France, 2007. [Google Scholar]
- Londero, E.H. Shadow Prices for Project Appraisal: Theory and Practice; Edward Elgar Publishing: Cheltenham, UK; Northampton, MA, USA, 2003. [Google Scholar]
- Moore, M.A.; Boardman, A.E.; Vining, A.R.; Weimer, D.L.; Greenberg, D.H. Just Give Me a Number! Practical Values for the Social Discount Rate. J. Policy Anal. Manag. 2004, 23, 789–812. [Google Scholar] [CrossRef]
- Newell, R.G.; Pizer, W.A. Discounting the Distant Future: How Much Do Uncertain Rates Increase Valuations? J. Environ. Econ. Manag. 2003, 46, 52–71. [Google Scholar] [CrossRef] [Green Version]
- Potts, D. Semi-input-output methods of shadow price estimation: Are they still useful? In Current Issues in Project Analysis for Development; Weiss, J., Potts, D., Eds.; Edward Elgar Publishing: Cheltenham, UK; Northampton, MA, USA, 2012. [Google Scholar]
- Potts, D. Shadow wage rates in a changing world. In Current Issues in Project Analysis for Development; Weiss, J., Potts, D., Eds.; Edward Elgar Publishing: Cheltenham, UK; Northampton, MA, USA, 2012. [Google Scholar]
- Spackman, M. Social discount rates for the European Union: An overview. In Cost-Benefit Analysis and Incentives in Evaluation: The Structural Funds of the European Union; Florio, M., Ed.; Edward Elgar Publishing: Cheltenham, UK, 2007. [Google Scholar]
- Spackman, M. Time Discounting and the Cost of Capital in Government. Fisc. Stud. 2004, 25, 467–518. [Google Scholar] [CrossRef]
- Weitzman, M.L. Gamma Discounting. Am. Econ. Rev. 2001, 91, 260–271. [Google Scholar] [CrossRef]
- Ackerman, F.; Heinzerling, L. Pricing the Priceless: Cost-Benefit Analysis of Environmental Protection. Univ. Pa. Law Rev. 2002, 150, 1553. [Google Scholar] [CrossRef] [Green Version]
- Adler, M.; Posner, E. New Foundations of Cost Benefit Analysis. Regul. Gov. 2009, 3, 72–83. [Google Scholar] [CrossRef]
- Aldred, J. Consumer Valuation and Citizen Deliberation. Altern. Environ. Valuat. 2005, 4, 187. [Google Scholar]
- Aldred, J. Cost-Benefit Analysis, Incommensurability and Rough Equality. Environ. Values 2002, 11, 27–47. [Google Scholar] [CrossRef]
- Aldred, J. Incommensurability and Monetary Valuation. Land Econ. 2006, 82, 141–161. [Google Scholar] [CrossRef]
- Ben-Amitai, B.B. Incommensurability of Values Thesis and Its Failure as a Criticism of Utilitarianism. Can JL Jurisprud. 2006, 19, 357. [Google Scholar] [CrossRef]
- Frank, R.H. Why Is Cost-Benefit Analysis So Controversial. J. Leg. Stud. 2000, 29, 913. [Google Scholar] [CrossRef]
- Frank, R.H.; Sunstein, C.R. Cost-Benefit Analysis and Relative Position. Univ. Chic. Law Rev. 2001, 68, 323–374. [Google Scholar] [CrossRef]
- Hsu, S. On the Role of Cost-Benefit Analysis in Environmental Law. Environ. Law 2005, 35, 135–174. [Google Scholar]
- Richardson, H. The Stupidity of the Cost-Benefit Standard. J. Leg. Stud. 2000, 29, 971–1003. [Google Scholar] [CrossRef]
- Rose-Ackerman, S. Putting Cost-Benefit Analysis in Its Place: Rethinking Regulatory Review. Univ. Miami Law Rev. 2011, 65, 335–1287. [Google Scholar]
- Shapiro, S.A.; Scroeder, C.H. Beyond Conflict-Benefit Analysis: A Pragmatic Reorientation. Harv. Environ. Law Rev. 2008, 32, 433. [Google Scholar]
- Spash, C.L. Deliberative Monetary Valuation (DMV): Issues in Combining Economic and Political Processes to Value Environmental Change. Ecol. Econ. 2007, 63, 690–699. [Google Scholar] [CrossRef]
- Dyduch, J. Ocena efektywności kosztowej inwestycji proekologicznych, Zarządzanie finansami firm–teoria i praktyka. In Research Papers of Wrocław University of Economics; No. 271; Kopiński, A., Słoński, T., Ryszawska, B., Eds.; Wydawnictwo Uniwersytetu Ekonomicznego we Wrocławiu: Wrocław, Poland, 2012. [Google Scholar]
- Małecki, P.P. Efektywność kosztowa jako metoda oceny projektów inwestycyjnych w ochronie środowiska. In Zeszyty Naukowe Uniwersytetu Ekonomicznego w Krakowie; nr 860; Prace z Zakresu Polityki Przemysłowej i Ekologicznej: Kraków, Poland, 2011. [Google Scholar]
- Palme, U.; Lundin, M.; Tillman, A.M.; Molander, S. Sustainable development indicators for wastewater systems–researchers and indicator users in a co-operative case study. Resour. Conserv. Recycl. 2005, 43, 293–311. [Google Scholar] [CrossRef] [Green Version]
- Rączka, J. Analiza Efektywności Kosztowej w Oparciu o Wskaźnik Dynamicznego Kosztu Jednostkowego. Transform Advice Programme, Investment in Environmental Infrastructure in Poland, Warszawa. Available online: https://view.officeapps.live.com/op/view.aspx?src=http%3A%2F%2Fedukacja.beta.nfosigw.gov.pl%2Fgfx%2Fnfosigw%2Fuserfiles%2Ffiles%2Fsrodki_zagraniczne%2Farchiwum%2Fispa%2Fprzygotowanie_przedsiewziec%2Fanaliza_dgc.doc&wdOrigin=BROWSELINK (accessed on 13 July 2021).
- Widomski, M.K.; Iwanek, M.; Krukowski, I. Application of dynamic generation cost financial analysis method to designing of sanitary sanitation systems in rural settlements. Zesz. Nauk. Politech. Rzesz. Bud. Inżynieria Sr. 2001, 58, 345–354. [Google Scholar]
- Central Statistical Office–Local Data Bank. Available online: https://stat.gov.pl (accessed on 11 October 2021).
- Dyduch, J. Finansowe aspekty działalności przedsiębiorstw w zakresie ochrony środowiska. Studia Ekonomiczne. Zesz. Nauk. Uniw. Ekon. W Katowicach 2018, 363, 17–27. Available online: https://www.ue.katowice.pl/fileadmin/user_upload/wydawnictwo/SE_Artyku%C5%82y_361_380/SE_363/02.pdf (accessed on 12 October 2021).
- Alvarez, I.G. Impact of CO2 Emission Variation on Firm Performance. Bus. Strategy Environ. 2012, 21, 435–454. [Google Scholar] [CrossRef]
- Delmas, M.A.; Nairn-Birch, N.; Lim, J. Dynamics of Environmental and Financial Performance: The Case of Greenhouse Gas Emissions. Organ. Environ. 2015, 28, 374–393. [Google Scholar] [CrossRef]
- Sarkis, J.; Cordeiro, J.J. An Empirical Evaluation of Environmental Efficiencies and Firm Performance: Pollution Prevention versus End-of-pipe Practice. Eur. J. Oper. Res. 2001, 135, 102–113. [Google Scholar] [CrossRef]
- Trumpp, C.; Guenther, T. Too Little or Too Much? Exploring U-shaped Relationships between Corporate Environmental Performance and Corporate Financial Performance. Bus. Strategy Environ. 2017, 26, 49–68. [Google Scholar] [CrossRef]
- Clarkson, P.M.; Li, Y.; Richardson, G.D.; Vasvari, F.P. Does It Really Pay to Be Green? Determinants and Consequences of Proactive Environmental Strategies. J. Account. Public Policy 2011, 30, 122–144. [Google Scholar] [CrossRef]
- King, A.A.; Lenox, M.J. Does It Really Pay to Be Green? An Empirical Study of Firm Environmental and Financial Performance. J. Ind. Ecol. 2001, 5, 105–116. [Google Scholar] [CrossRef] [Green Version]
- Crundwell, F.K. Finance for Engineers: Evaluation and Funding of Capital Projects; Springer: London, UK, 2008. [Google Scholar]
- Fabozzi, F.J.; Peterson, P.P. Financial Management and Analysis; John Wiley and Sons: Hoboken, NJ, USA, 2003. [Google Scholar]
- Kulyniak, I.; Kinash, L. The evaluation of the economic effectiveness of the investment project with risk consideration. Studia Ekonomiczne. Zesz. Nauk. Uniw. Ekon. Katowicach 2020, 392, 139–156. Available online: https://www.ue.katowice.pl/fileadmin/user_upload/wydawnictwo/SE_Artyku%C5%82y_381_400/SE_392/10.pdf (accessed on 5 October 2021).
- Mazur, I.I.; Shapiro, V.D.; Olderogge, N.G. Project Management: Practical Allowance for Universities; Omega-L.: Moscow, Russia, 2014. [Google Scholar]
- Ministry of Climate and Environment. Available online: https://www.gov.pl/web/klimat/fundusze-srodowiskowe (accessed on 8 October 2021).
- National Fund for Environment Protection and Water Management. Available online: www.nfosigw.gov.pl (accessed on 4 October 2021).
- Environment Protection Bank. Available online: https://www.bosbank.pl/ (accessed on 6 October 2021).
- Economic Aspects of Environmental Protection. pp. 40–47. Available online: https://stat.gov.pl/en/topics/environment-energy/environment/economic-aspects-of-environmental-protection-2020,4,3.html (accessed on 7 October 2021).
- Informacja o Naborach Wniosków w Roku 2021-Narodowy Fundusz Ochrony Środowiska i Gospodarki Wodnej-Portal Gov.pl. Available online: www.gov.pl (accessed on 5 October 2021).
- Kożuch, M. Zmiany w finansowaniu przedsięwzięć ochrony środowiska przyrodniczego w Polsce. Zesz. Nauk. Uniw. Ekon. Krakowie 2018, 1, 61–78. Available online: https://r.uek.krakow.pl/bitstream/123456789/3095/1/171521733.pdf (accessed on 8 October 2021). [CrossRef]
- Decision of the Council of Ministers: Rozporządzenie Rady Ministrów dnia 27 kwietnia 2004 r. w Sprawie Szczegółowych Warunków Udzielania Pomocy Publicznej na Inwestycje Służące Ograniczeniu Emisji Lotnych Związków Organicznych, Dz.U. nr 98, poz. 993, z późn. zm. Available online: https://eli.gov.pl/eli/DU/2004/993/ogl (accessed on 8 October 2021).
- Ministry of Climate and Environment. Available online: https://www.gov.pl/web/klimat/fundusze-krajowe (accessed on 4 October 2021).
- Ministry of Climate and Environment. Available online: https://www.gov.pl/web/klimat/co-robimy-fundusze-europejskie (accessed on 6 October 2021).
- EKO Credit for Photovoltaics|ECO Loan “Our water” (Nasza Woda)|Bank Ochrony Środowiska. Available online: https://www.bosbank.pl (accessed on 11 October 2021).
- National Fund for Environment Protection and Water Management. Mój Prąd. Available online: http://nfosigw.gov.pl/moj-prad/ (accessed on 6 October 2021).
- Ostaszewski, J. Zarządzanie Finansami w Spółce Akcyjnej; Difin: Warszawa, Poland, 2003. [Google Scholar]
- Ministry of Energy: Wnioski z Analiz Prognostycznych dla Sektora Paliwowo-Energetycznego–Załącznik nr 2 do Polityki Energetycznej Polski do 2040 Roku; Ministerstwo Energii: Warszawa, Poland, 2019. Available online: https://www.gov.pl/ttachment/cff9e33d-426a-4673-a92b-eb4fb0bf4a04 (accessed on 10 October 2021).
- Bijańska, J.; Wodarski, K. Risk management in the planning of development projects in the industrial enterprises. Metalurgija 2014, 53, 276–278. [Google Scholar]
- Bijańska, J.; Wodarski, K. Ryzyko w Decyzjach Inwestycyjnych Przedsiębiorstw; Zeszyty Naukowe Politechniki Śląskiej, s. Organizacja i Zarządzanie; Wydawnictwo Politechniki Śląskiej: Gliwice, Poland, 2014; Volume 70. [Google Scholar]
- Mari, C. Stochastic NPV Based vs Stochastic LCOE Based Power Portfolio Selection Under Uncertainty. Energies 2020, 13, 3677. Available online: https://www.mdpi.com/1996-1073/13/14/3677/htm (accessed on 4 October 2021). [CrossRef]
- Kidell, D.S.; Moles, P.; Parrrino, R. Fundamentals of Corporate Finance. European Edition; John Wiley and Sons Ltd.: Chichester, UK, 2011. [Google Scholar]
- Rakow, K.C. The effect of management earning forecast characteristics on cost of equity capital. Adv. Account. 2010, 26, 37–46. [Google Scholar] [CrossRef]
- Durand, R.B.; Lim, D.; Zumwalt, J.K. Fear and the Fama-French Factors. Financ. Manag. 2011, 40, 409–426. [Google Scholar] [CrossRef]
- Famma, E.F.; French, K.R. The Capital Asset Princing Model: Theory and Evidence. J. Econ. Perspect. 2004, 18, 25–46. [Google Scholar] [CrossRef] [Green Version]
- Famma, E.F.; French, K.R. The Value Premium and the CAPM. J. Financ. 2006, 61, 2163–2185. [Google Scholar] [CrossRef]
- Huang, H.; Cheng, W. Tests of the CAPM under Structural Changes. Int. Econ. J. 2005, 19, 523–541. [Google Scholar] [CrossRef]
- Hung, D.C.; Shackleton, M.; Xu, X. CAPM, Higher Co-moment and Factor Models of UK Stock Returns. J. Bus. Financ. Account. 2004, 31, 87–112. [Google Scholar] [CrossRef]
Figure 1.
Sources of financing for pro-ecological projects in Poland, available depending on the entity, including its organizational and legal form. Source: Designed by authors using [66,67].

Figure 2.
Share of financing sources for pro-ecological projects in Poland in 2005–2020. Source: designed by authors using [51].
Figure 2.
Share of financing sources for pro-ecological projects in Poland in 2005–2020. Source: designed by authors using [51].

Figure 3.
Model of the analysis of the financing options for pro-ecological projects. Source: designed by authors. For each of the stages presented, activities (A) have been defined, the implementation of which should end with specific results (B).
Figure 3.
Model of the analysis of the financing options for pro-ecological projects. Source: designed by authors. For each of the stages presented, activities (A) have been defined, the implementation of which should end with specific results (B).


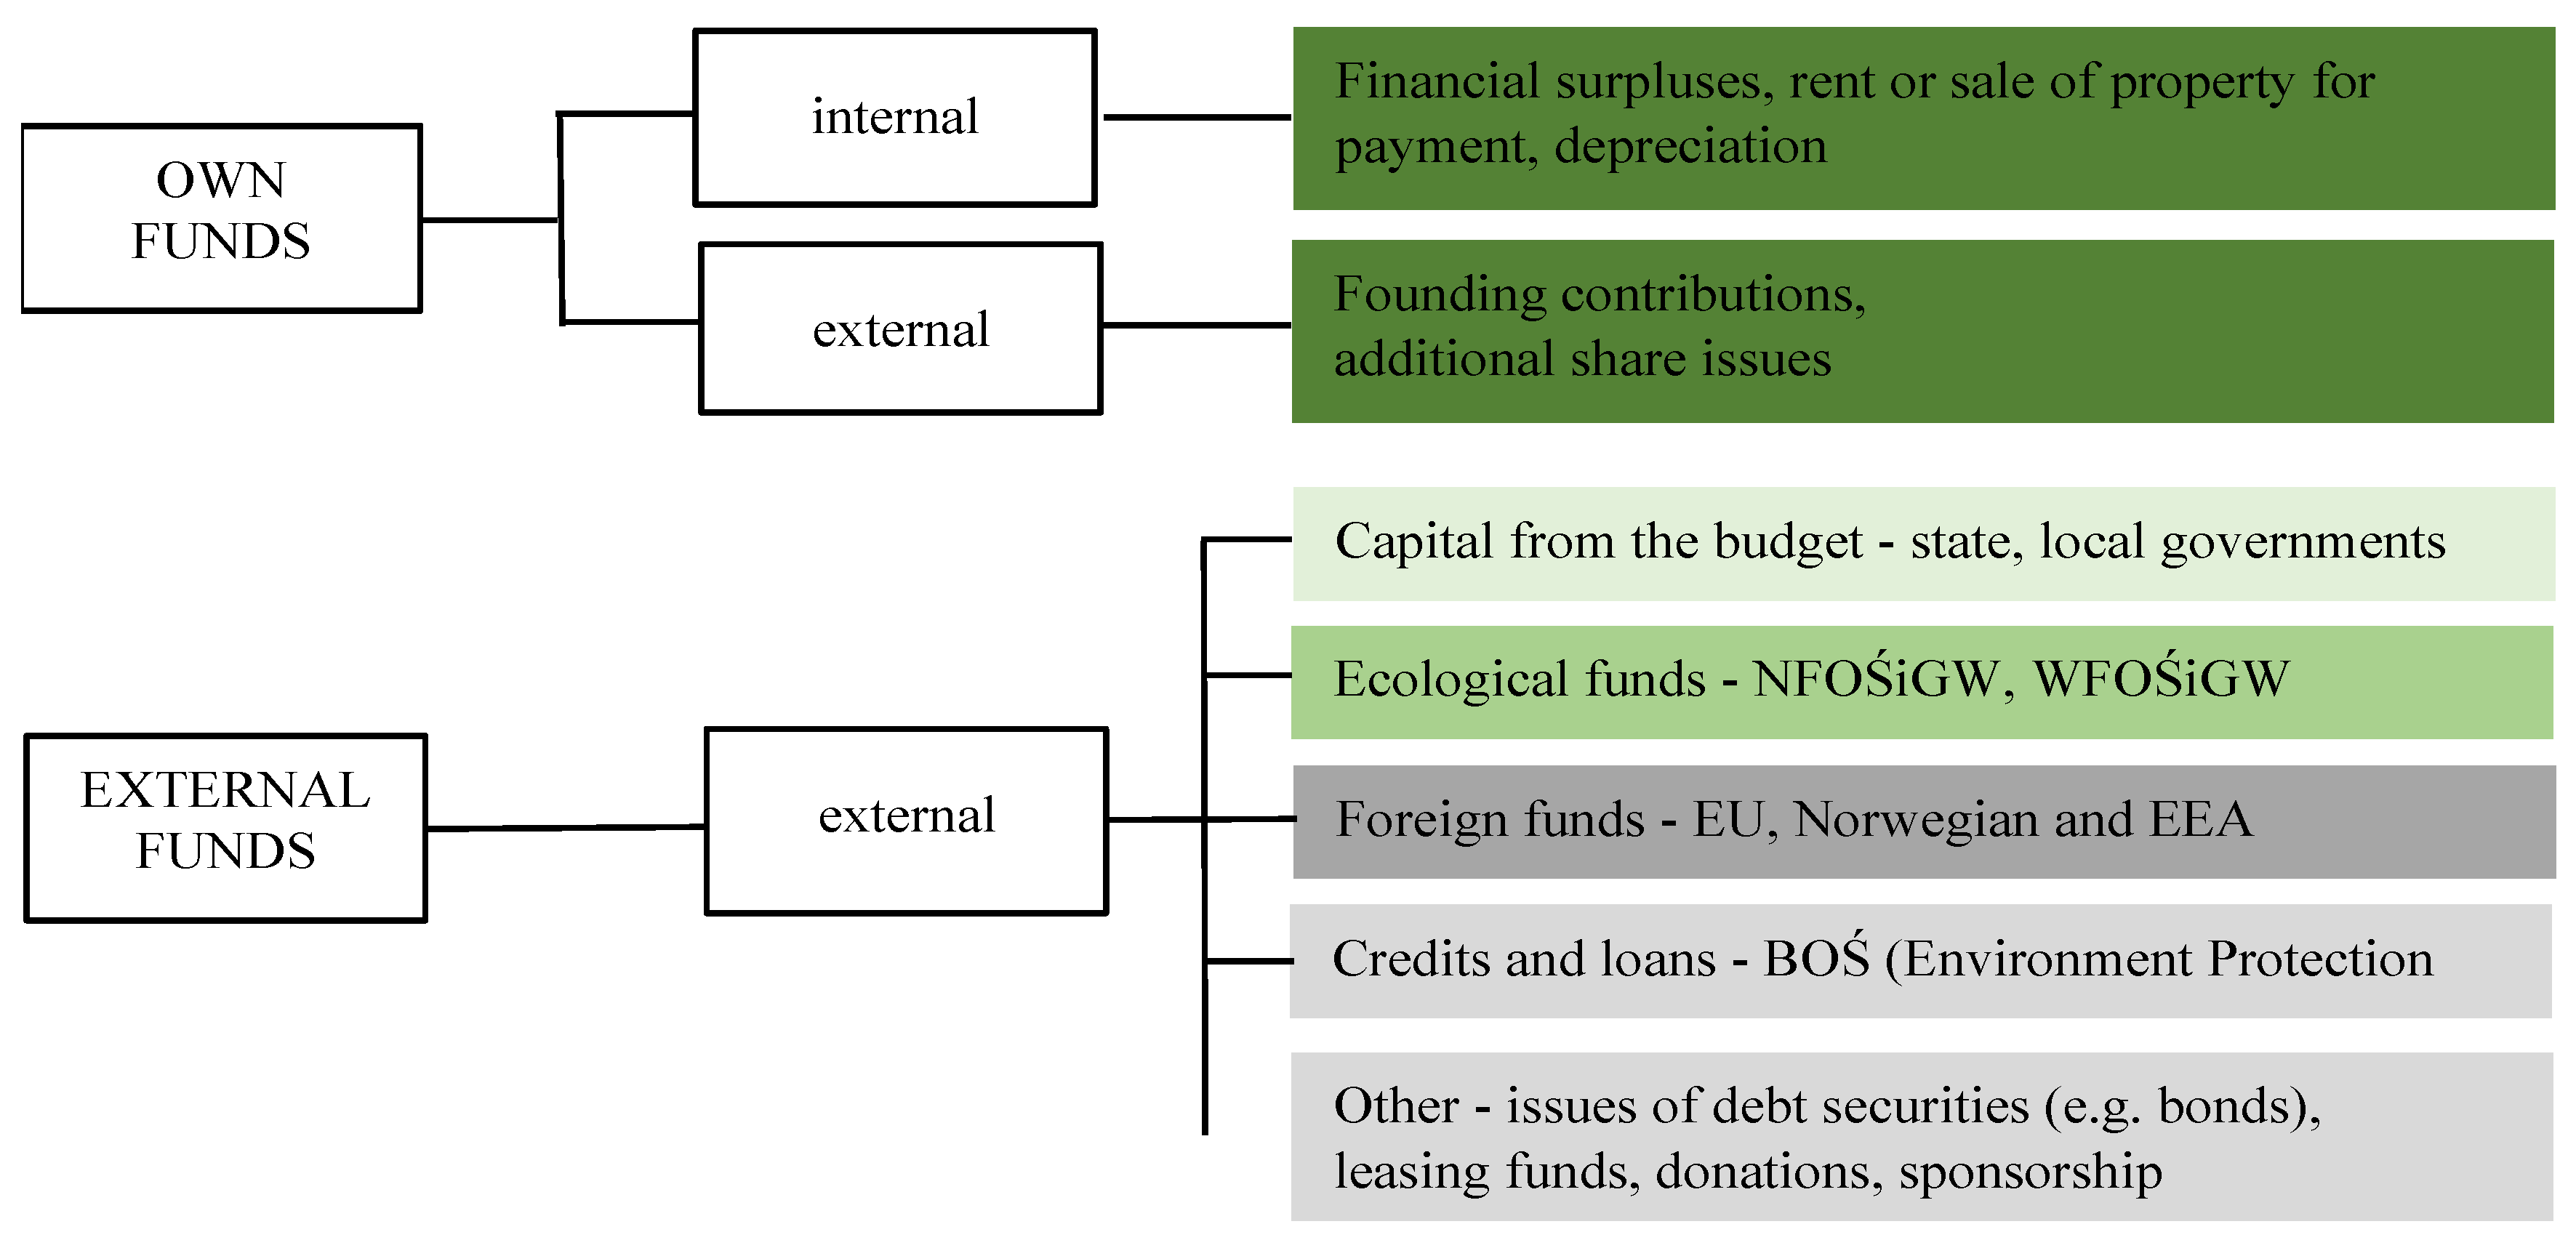
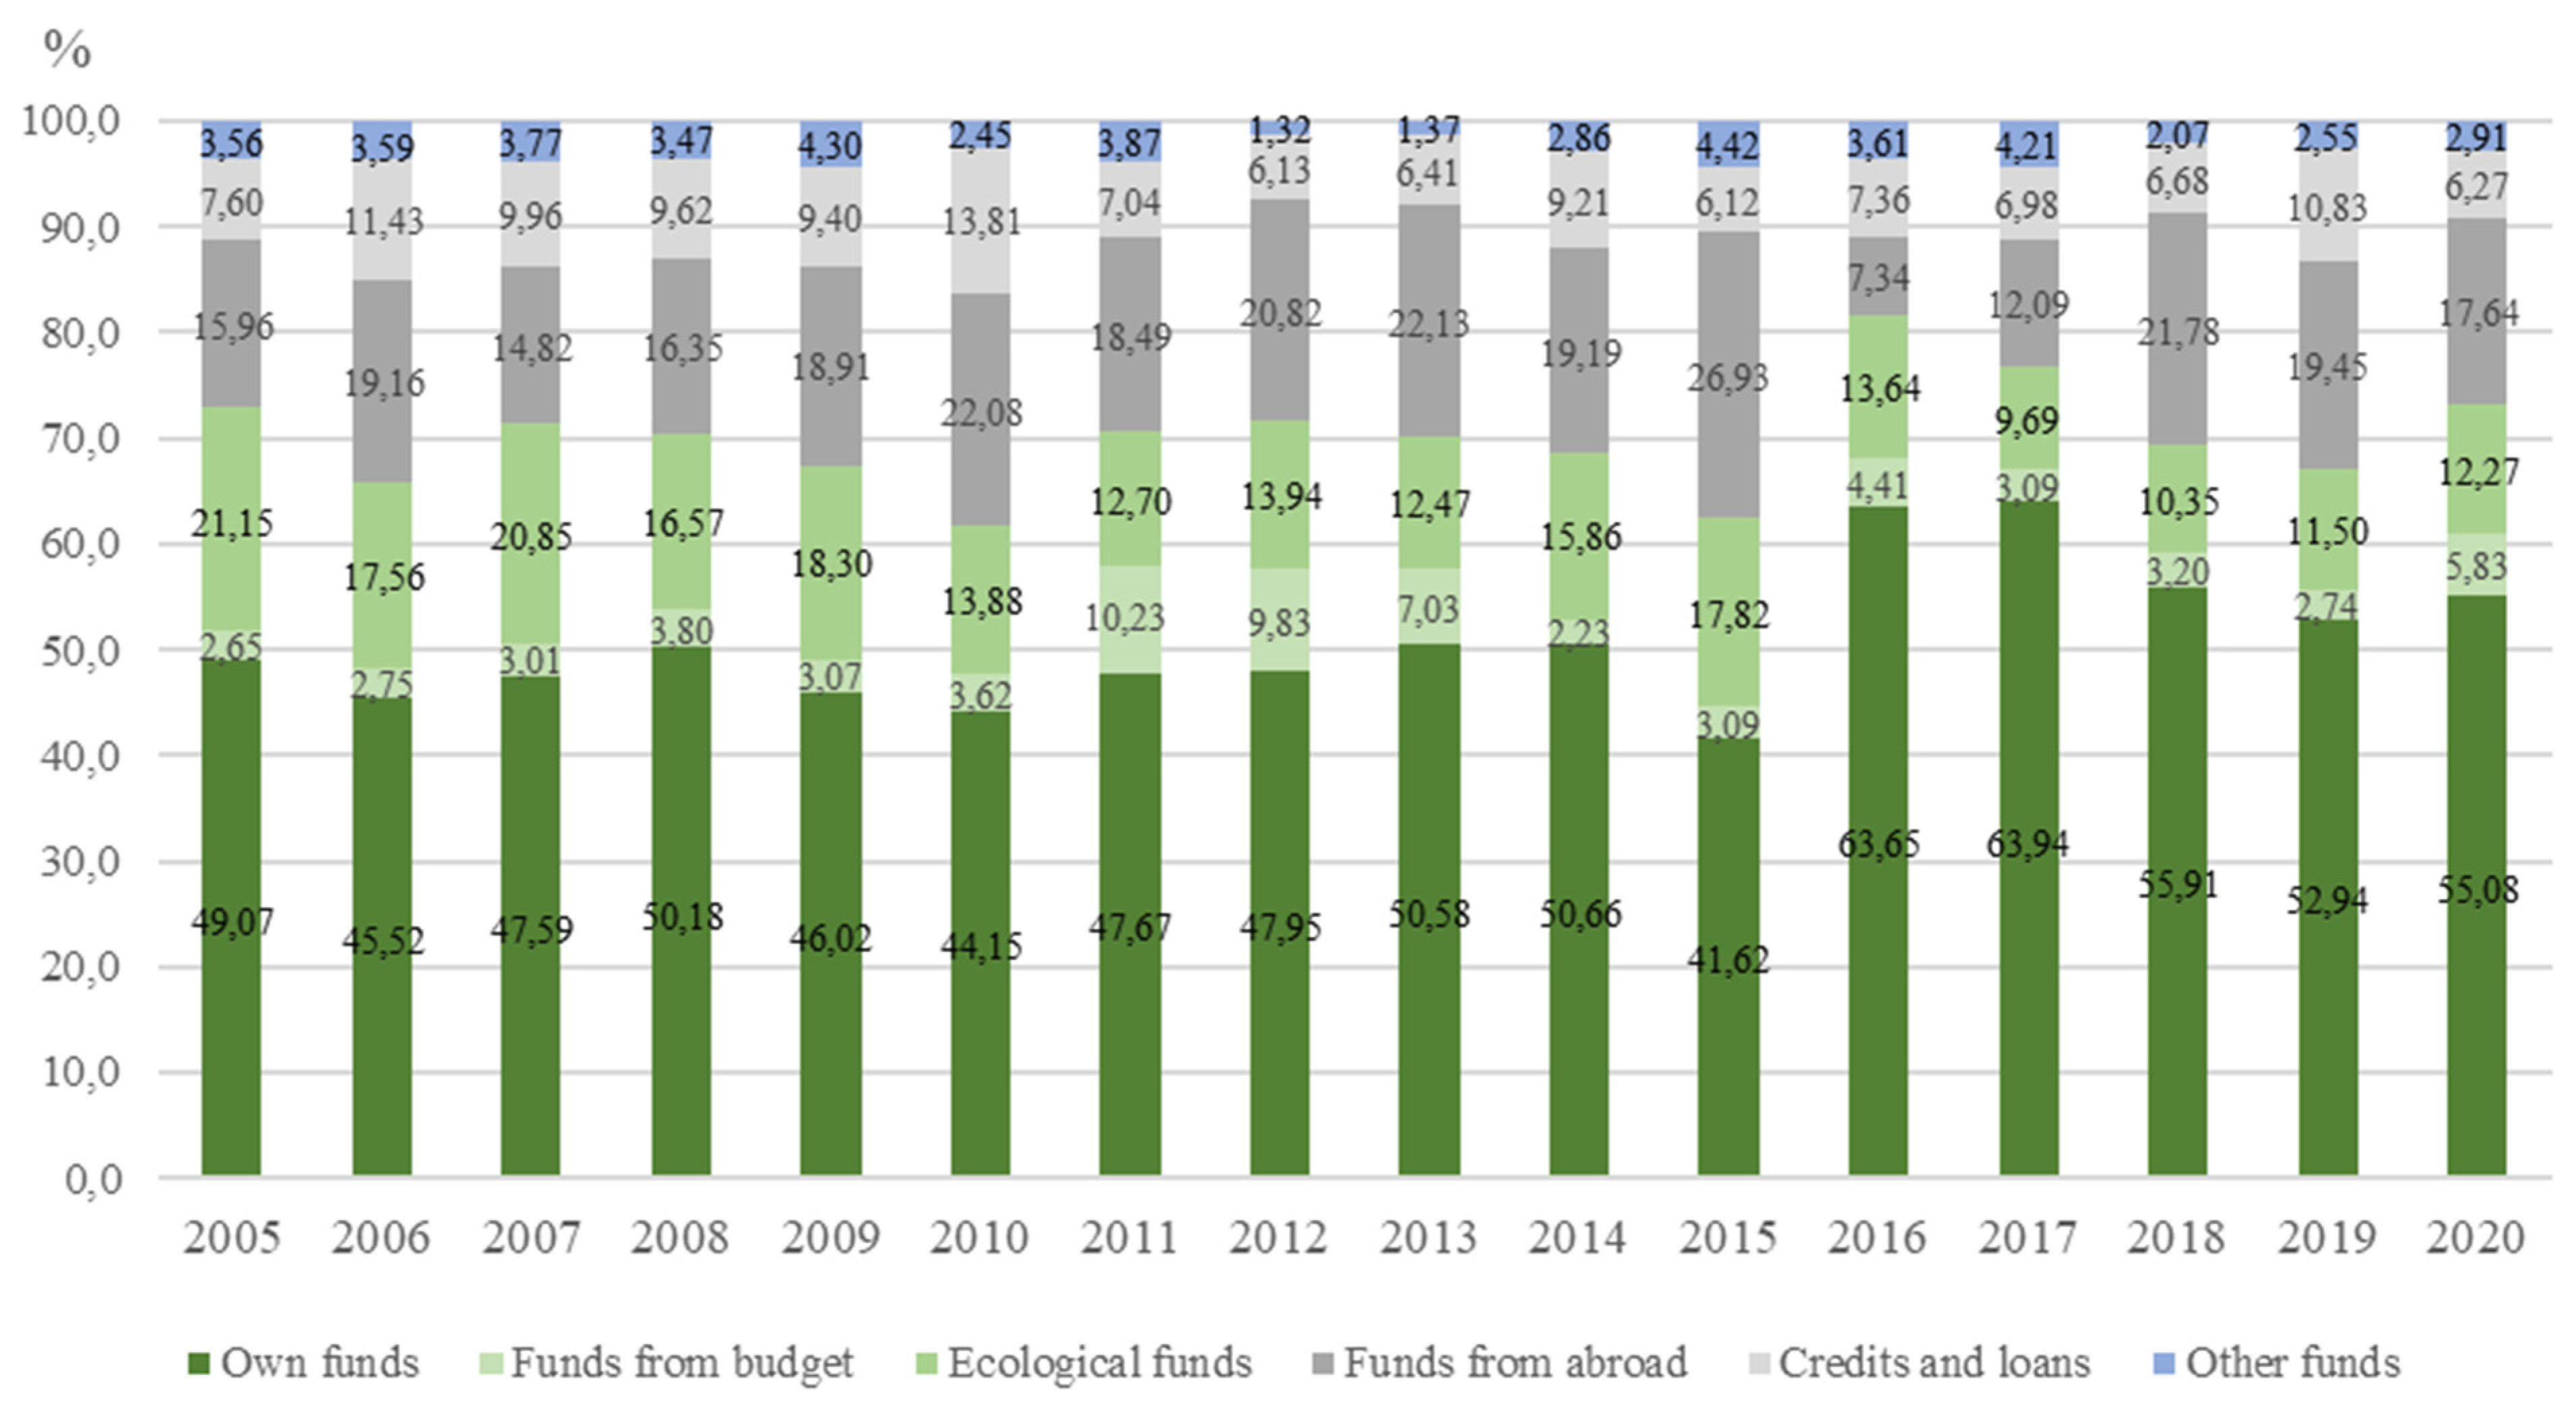
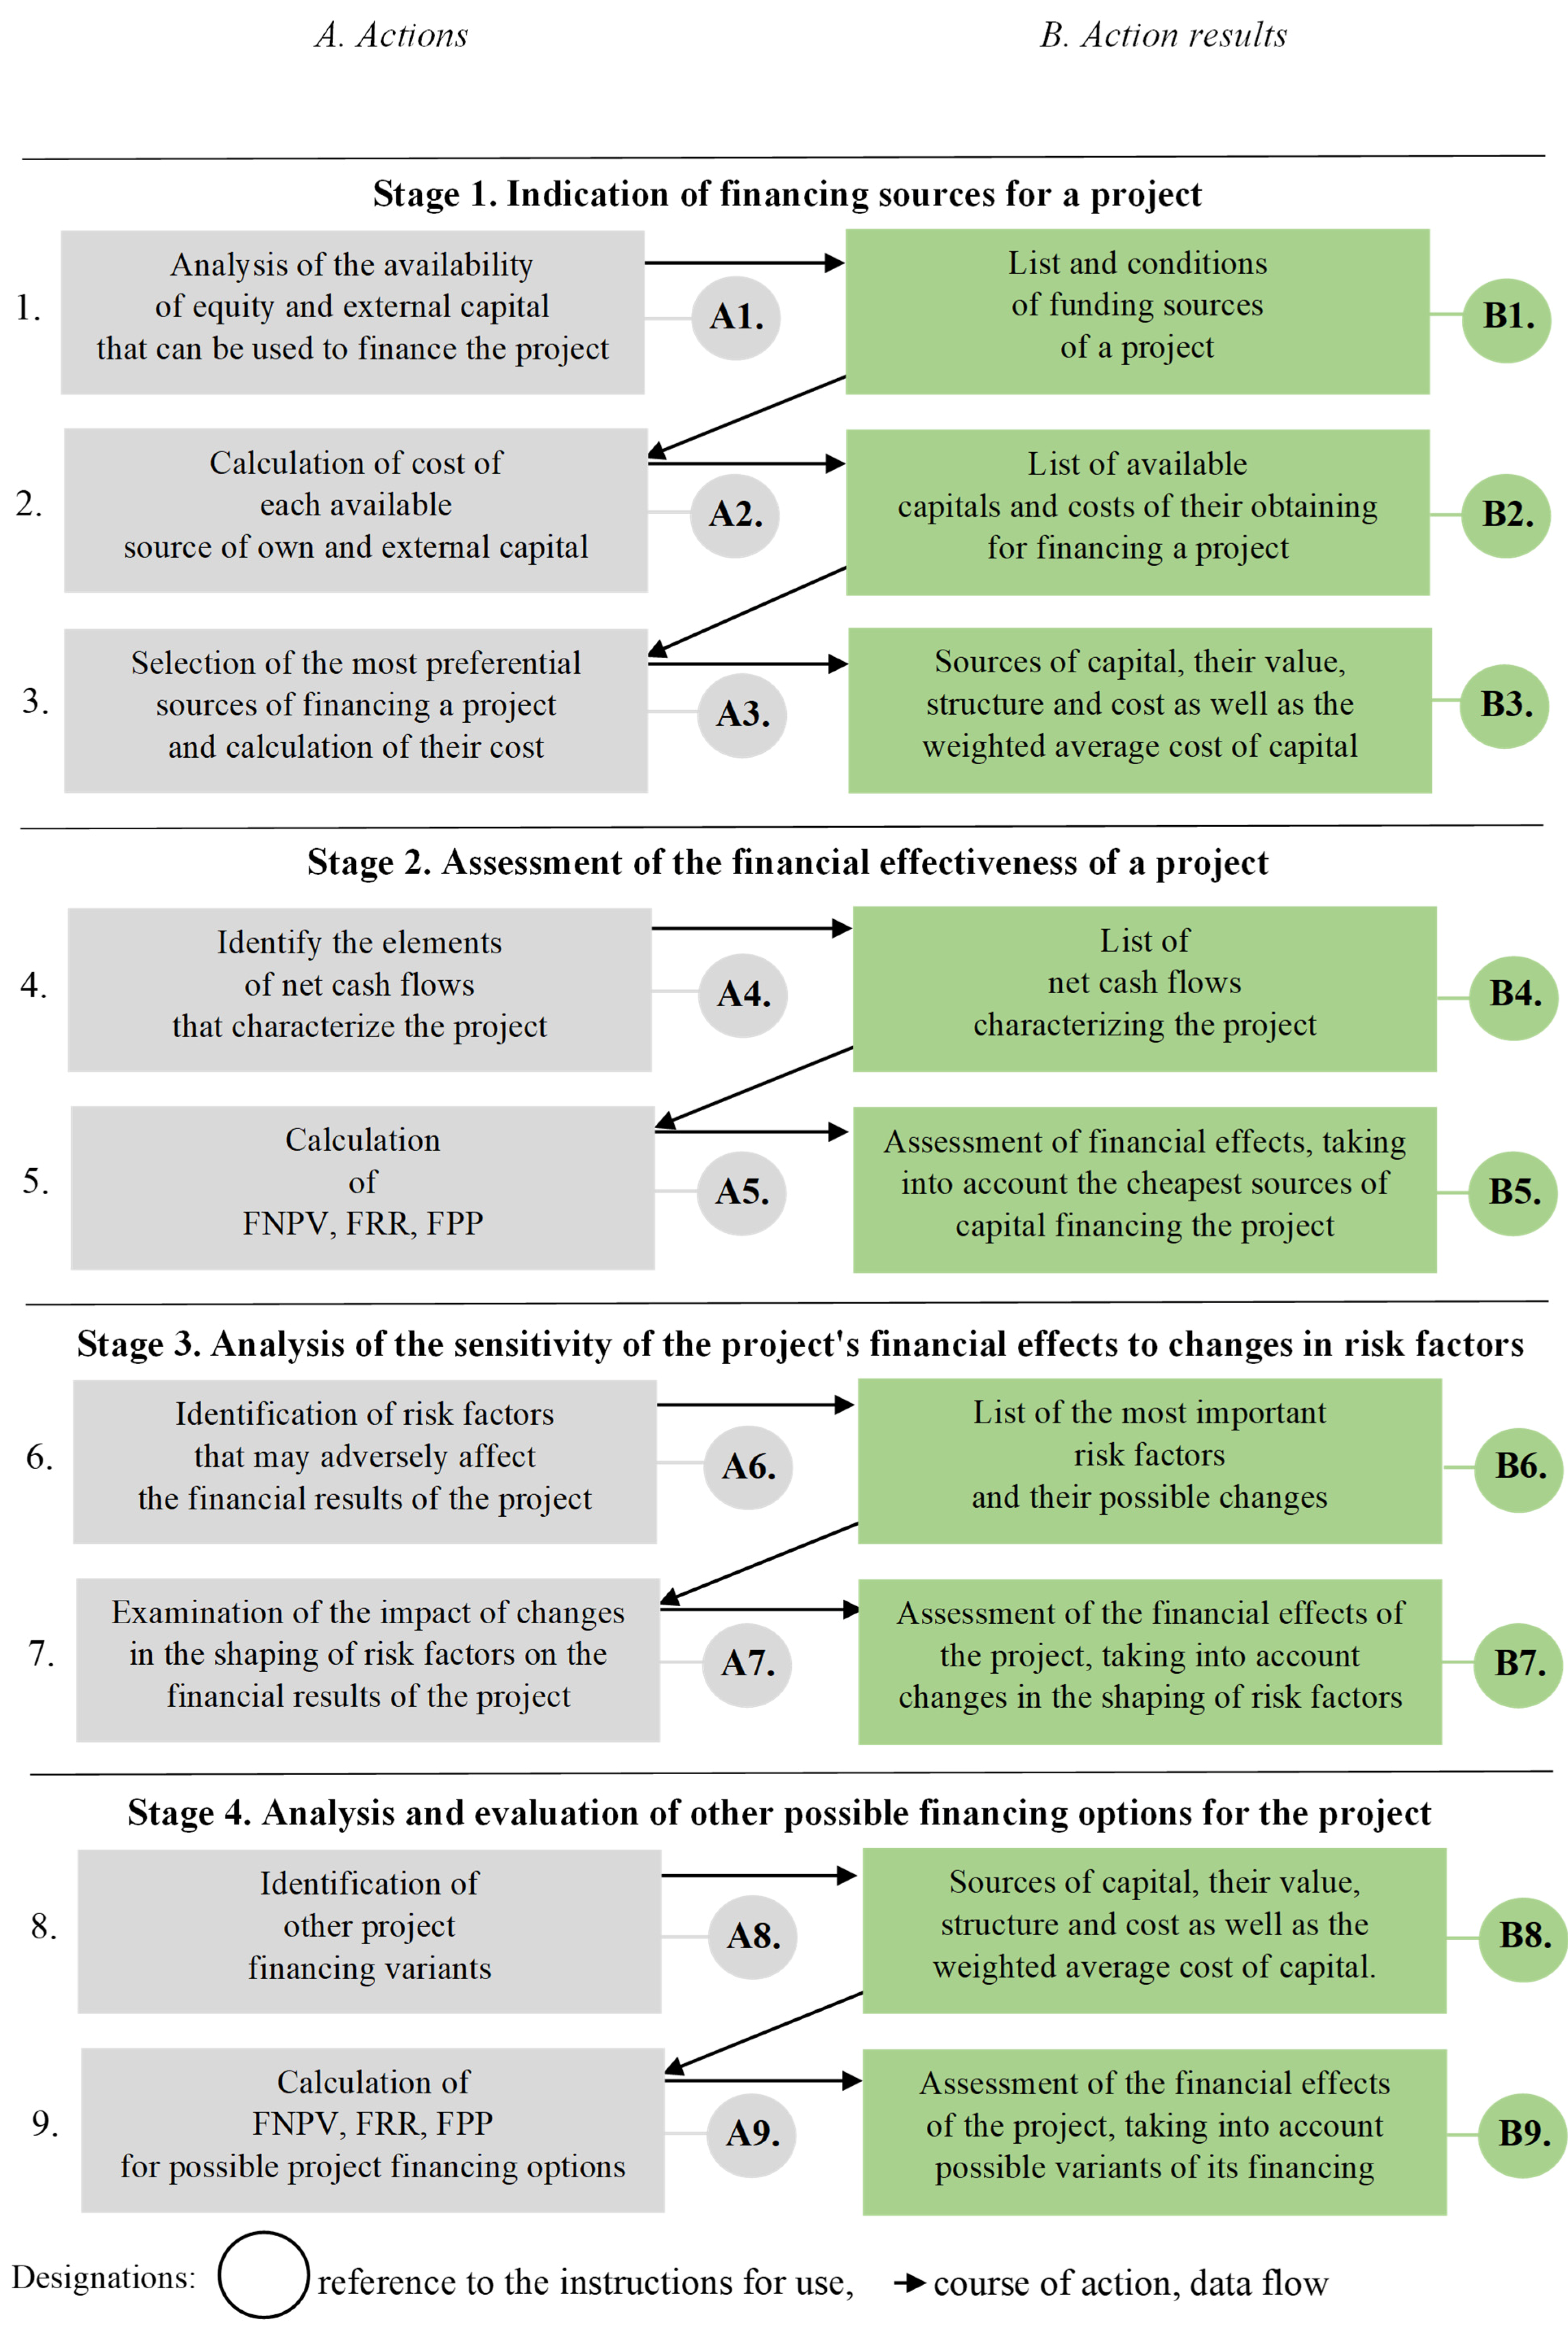
Table 1.
An example of financing conditions for pro-ecological projects depending on their specificity by BOŚ in Warsaw, Poland. Source: designed by authors using [72,73].
| Offer Name | ||
|---|---|---|
| ECO Credit “Energia ze Słońca” (Energy from the Sun) | ECO Loan “Nasza Woda” (Our Water) | |
| Purpose | ||
|
| |
| Amount | ||
| up to PLN 75,000.00 and up to 100% of the investment value | up to PLN 80,000.00 | |
| Loan Period | ||
| from 1 to 120 months | from 1 to 36 months | from 36 to 120 months |
| Type and Amount of Interest | ||
|
|
|
| Additional Benefits | ||
| ||
Table 2.
List and conditions for obtaining capital that can be used to finance a project. Source: designed by authors.
Table 2.
List and conditions for obtaining capital that can be used to finance a project. Source: designed by authors.
| Capital Source | Obtaining Conditions |
|---|---|
| i | |
| … | |
| n |
Table 3.
List of available capitals and costs of their obtaining for financing a project. Source: designed by authors.
Table 3.
List of available capitals and costs of their obtaining for financing a project. Source: designed by authors.
| Capital Source | Capital Value [e.g., PLN] | Capital Cost [%] |
|---|---|---|
| i | CCi | |
| … | ||
| n | CCn |
Table 4.
Sources of capital, their value, structure and cost as well as the weighted average cost of capital financing the project. Source: designed by authors.
Table 4.
Sources of capital, their value, structure and cost as well as the weighted average cost of capital financing the project. Source: designed by authors.
| Capital Source | Capital Value | Capital Share | Capital Cost | WACC |
|---|---|---|---|---|
| i | ||||
| … | ||||
| n | ||||
| In total | ∑ | 1.00 | ∑ |
Table 5.
List of NCFt identifying the project within the calculation period. Source: designed by authors.
Table 5.
List of NCFt identifying the project within the calculation period. Source: designed by authors.
| Elements of NCFt | Project Preparation | Project Operation | ||||
|---|---|---|---|---|---|---|
| 1 | … | m | m + 1 | … | n | |
| – revenues | ||||||
| – costs | ||||||
| – gross financial result | ||||||
| – tax | ||||||
| 1. Net financial result | ||||||
| 2. Savings | ||||||
| 3. Obtaining a loan, subsidy, donation etc. | ||||||
| 4. Adjustment for the cost of depreciation | ||||||
| 5. Investment expenditure | ||||||
| 6. Credit instalment | ||||||
| NCFt = CIFt − COFt | ||||||
Table 6.
Results of the evaluation of the financial effects of the project implementation. Source: designed by authors.
Table 6.
Results of the evaluation of the financial effects of the project implementation. Source: designed by authors.
| Details | Project Preparation | Project Operation | ||||
| 1 | ... | m | m + 1 | ... | n | |
| NCFt | ||||||
| at | ||||||
| NCFt · at | ||||||
| cNCFt · at | ||||||
| Assessment Indicator | Indicator Value | Assessment [Positive/Negative] | ||||
| FNPV | ||||||
| FRR | ||||||
| FPP | ||||||
Table 7.
Risk factors and the scope of their changes. Source: designed by authors.
| Risk Factor | Range of Possible Changes [%] |
|---|---|
Table 8.
Assessment of the financial effects of the project, taking into account changes in the shaping of risk factors. Source: designed by authors.
Table 8.
Assessment of the financial effects of the project, taking into account changes in the shaping of risk factors. Source: designed by authors.
| 1 Risk Factor | The Scope of Changes in Shaping of the Factor | |||||
| - …[%] | - …[%] | - …[%] | - …[%] | - …[%] | - …[%] | |
| FNPV | ||||||
| FRR | ||||||
| FPP | ||||||
| n-th Risk Factor | The Scope of Changes in Shaping of the Factor | |||||
| - …[%] | - …[%] | - …[%] | - …[%] | - …[%] | - …[%] | |
| FNPV | ||||||
| FRR | ||||||
| FPP | ||||||
Table 9.
Sources of capital, their value, structure, and cost, as well as the weighted average cost of capital in possible variants of project financing. Source: designed by authors.
Table 9.
Sources of capital, their value, structure, and cost, as well as the weighted average cost of capital in possible variants of project financing. Source: designed by authors.
| Capital Source | Capital Value | Capital Share | Capital Cost | WACC |
|---|---|---|---|---|
| Variant 1 | ||||
| i | ||||
| … | ||||
| n | ||||
| ∑ | 1.00 | ∑ | ||
| Variant n | ||||
| i | ||||
| … | ||||
| n | ||||
| ∑ | 1.00 | ∑ | ||
Table 10.
Results of the evaluation of the financial effects of the project implementation for various variants of its financing. Source: designed by authors.
Table 10.
Results of the evaluation of the financial effects of the project implementation for various variants of its financing. Source: designed by authors.
| Assessment Indicator | Indicator Value | Assessment [Positive/Negative] |
|---|---|---|
| Variant 1 | ||
| FNPV [PLN] | ||
| FRR [%] | ||
| FPP | ||
| Variant n | ||
| FNPV [PLN] | ||
| FRR [%] | ||
| FPP | ||
Table 11.
Investment expenditure in market offers for the purchase and assembly of a photovoltaic installation. Source: designed by authors using the information obtained from the enterprise.
Table 11.
Investment expenditure in market offers for the purchase and assembly of a photovoltaic installation. Source: designed by authors using the information obtained from the enterprise.
| Investment Expenditure | Offer I | Offer II | Offer III |
|---|---|---|---|
| Photovoltaic panels | 446,281.00 | 606,525.00 | 859,846.00 |
| Inverter | 12,013.00 | 11,948.00 | 172,349.00 |
| Cables, frames, other | 220,275.00 | 194,847.00 | 182,707.00 |
| Labor | 173,989.00 | 144,928.00 | 131,054.00 |
| In total | 852,558.00 | 958,248.00 | 1,345,956.00 |
Table 12.
Annual savings in electricity costs after the completion of the project. Source: designed by authors using the information obtained from the enterprise.
Table 12.
Annual savings in electricity costs after the completion of the project. Source: designed by authors using the information obtained from the enterprise.
| Price per kWh | Annual Electricity Costs | Costs after Installation | Savings |
|---|---|---|---|
| 0.49 PLN | 144,000.00 PLN | 217.00 PLN | 143,783.00 PLN |
Table 13.
Characteristics of offer I. Source: designed by authors using the information obtained from the enterprise.
Table 13.
Characteristics of offer I. Source: designed by authors using the information obtained from the enterprise.
| Details | Description |
|---|---|
| Panels type | polycrystalline |
| Number of panels | 928 pcs. |
| Guarantee | 10 years |
| Installation area | 1551.17 m2 |
| Installation weight | 17,632 kg |
| Total cost of panels | 446,281.0 PLN |
| Inverter | 12,013.0 PLN |
| Cables, frames, other | 220,275.0 PLN |
| Labor | 173,989.0 PLN |
| TOTAL | 852,558.0 PLN |
Table 14.
List and conditions for obtaining capital that can be used to finance a project. Source: designed by authors.
Table 14.
List and conditions for obtaining capital that can be used to finance a project. Source: designed by authors.
| Capital Source | Obtaining Conditions |
|---|---|
| Subsidy (Its granting is possible on the basis of Art. 38 of the EU Commission Regulation No. 651/2014 of 17 June 2014 declaring certain types of aid compatible with the internal market pursuant to Art. 107 and 108 of the Treaty). | Refinancing of 15% of all financed investment outlays, within a maximum of 6 months from submitting the application, provided that the available funds have not been exhausted |
| Preferential bank loan | Financing 50% of the total investment expenditure; Maximum repayment period: 10 years; Interest rate: WIBOR 6 M + margin 3.5% |
| Equity, internal | Additional cash contributions of partners |
Table 15.
List of available capitals and costs of their obtaining for financing a project. Source: designed by authors.
Table 15.
List of available capitals and costs of their obtaining for financing a project. Source: designed by authors.
| Capital Source | Capital Value [e.g., PLN] | Capital Cost [%] |
|---|---|---|
| Subsidy | 127,883.70 | 0.00 |
| Preferential bank loan | 426,279.00 | 3.24 |
| Equity, internal | 298,395.30 | 8.50 |
Table 16.
Sources of capital, their value, structure, and cost, as well as the weighted average cost of capital financing the project. Source: designed by authors.
Table 16.
Sources of capital, their value, structure, and cost, as well as the weighted average cost of capital financing the project. Source: designed by authors.
| Capital Source | Capital Value | Capital Share | Capital Cost | WACC |
|---|---|---|---|---|
| Subsidy | 127,883.70 | 0.15 | 0.00 | 0.0 |
| Preferential bank loan | 426,279.00 | 0.50 | 3.24 | 1.6 |
| Equity, internal | 298,395.30 | 0.35 | 8.50 | 3.0 |
| In total | 852,558.00 | 1.00 | x | 4.6 |
Table 17.
Projected costs resulting from the implementation of the project. Source: designed by authors.
Table 17.
Projected costs resulting from the implementation of the project. Source: designed by authors.
| Details | 2021 | 2022 | 2023 | 2024 | 2025 | 2026 | 2027 | 2028 | 2029 | 2030 | 2031 | 2032 | 2033 | 2034 | 2035 |
|---|---|---|---|---|---|---|---|---|---|---|---|---|---|---|---|
| Installation maintenance cost | 3000.00 | 3000.00 | 3000.00 | 3000.00 | 3000.00 | 3000.00 | 3000.00 | 3000.00 | 3000.00 | 3000.00 | 3000.00 | 3000.00 | 3000.00 | 3000.00 | 3000.00 |
| Loan interest cost | 16,127.56 | 14,422.44 | 12,717.32 | 11,012.21 | 9307.09 | 7601.98 | 5896.86 | 4191.74 | 2486.63 | 781.51 | |||||
| Depreciation cost | 59,679.06 | 59,679.06 | 59,679.06 | 59,679.06 | 59,679.06 | 59,679.06 | 59,679.06 | 60,519.97 | 60,519.97 | 60,519.97 | 60,519.97 | 60,519.97 | 60,519.97 | 60,519.97 | 60,519.97 |
Table 18.
Projected savings resulting from the implementation of the project [PLN]. Source: designed by authors.
Table 18.
Projected savings resulting from the implementation of the project [PLN]. Source: designed by authors.
| Details | 2021 | 2022 | 2023 | 2024 | 2025 | 2026 | 2027 | 2028 | 2029 | 2030 | 2031 | 2032 | 2033 | 2034 | 2035 |
|---|---|---|---|---|---|---|---|---|---|---|---|---|---|---|---|
| Price per kWh | 0.49 | 0.49 | 0.49 | 0.49 | 0.55 | 0.55 | 0.55 | 0.55 | 0.55 | 0.56 | 0.56 | 0.56 | 0.56 | 0.56 | 0.57 |
| Total energy cost (before project implementation) | 144,000.00 | 144,000.00 | 144,000.00 | 144,000.00 | 161,632.65 | 161,632.65 | 161,632.65 | 161,632.65 | 161,632.65 | 164,571.43 | 164,571.43 | 164,571.43 | 164,571.43 | 164,571.43 | 167,510.20 |
| Total energy cost (after project implementation) | 217.00 | 217.00 | 217.00 | 217.00 | 217.00 | 217.00 | 217.00 | 217.00 | 217.00 | 217.00 | 217.00 | 217.00 | 217.00 | 217.00 | 217.00 |
| Savings | 143,783.00 | 143,783.00 | 143,783.00 | 143,783.00 | 161,415.65 | 161,415.65 | 161,415.65 | 161,415.65 | 161,415.65 | 164,354.43 | 164,354.43 | 164,354.43 | 164,354.43 | 164,354.43 | 167,293.20 |
Table 19.
Projected values NCFt and indicators FNPV, FRR, FPP [PLN]. Source: designed by authors.
| Details | 2021 | 2022 | 2023 | 2024 | 2025 | 2026 | 2027 | 2028 | 2029 | 2030 | 2031 | 2032 | 2033 | 2034 | 2035 |
|---|---|---|---|---|---|---|---|---|---|---|---|---|---|---|---|
| – revenues | |||||||||||||||
| – costs | 78,806.62 | 77,101.50 | 75,396.38 | 73,691.27 | 71,986.15 | 70,281.04 | 68,575.92 | 67,711.71 | 66,006.60 | 64,301.48 | 63,519.97 | 63,519.97 | 63,519.97 | 63,519.97 | 63,519.97 |
| – gross financial result | |||||||||||||||
| – tax | |||||||||||||||
| 1. Net financial result | −78,806.62 | −77,101.50 | −75,396.38 | −73,691.27 | −71,986.15 | −70,281.04 | −68,575.92 | −67,711.71 | −66,006.60 | −64,301.48 | −63,519.97 | −63,519.97 | −63,519.97 | −63,519.97 | −63,519.97 |
| 2. Savings | 143,783.00 | 143,783.00 | 143,783.00 | 143,783.00 | 161,415.65 | 161,415.65 | 161,415.65 | 161,415.65 | 161,415.65 | 164,354.43 | 164,354.43 | 164,354.43 | 164,354.43 | 164,354.43 | 167,293.20 |
| 3. Obtaining the loan, subsidy | 554,162.70 | ||||||||||||||
| 4. Adjustment for the cost of depreciation | 59,679.06 | 59,679.06 | 59,679.06 | 59,679.06 | 59,679.06 | 59,679.06 | 59,679.06 | 60,519.97 | 60,519.97 | 60,519.97 | 60,519.97 | 60,519.97 | 60,519.97 | 60,519.97 | 60,519.97 |
| 5. Investment expenditure | 852,558.00 | 12,013.00 | |||||||||||||
| 6. Credit instalment | 42,627.90 | 42,627.90 | 42,627.90 | 42,627.90 | 42,627.90 | 42,627.90 | 42,627.90 | 42,627.90 | 42,627.90 | 42,627.90 | |||||
| NCFt = CIFt_ − COFt | −216,367.76 | 83,732.66 | 85,437.78 | 87,142.89 | 106,480.66 | 108,185.77 | 109,890.89 | 99,583.01 | 113,301.12 | 117,945.02 | 161,354.43 | 161,354.43 | 161,354.43 | 161,354.43 | 164,293.20 |
| at | 0.9561 | 0.9141 | 0.8739 | 0.8355 | 0.7988 | 0.7637 | 0.7302 | 0.6981 | 0.6674 | 0.6381 | 0.6101 | 0.5833 | 0.5576 | 0.5331 | 0.5097 |
| NCFt · at | −206,862.43 | 76,537.28 | 74,665.02 | 72,809.54 | 85,058.18 | 82,623.69 | 80,238.95 | 69,518.09 | 75,619.86 | 75,261.07 | 98,437.53 | 94,113.04 | 89,978.53 | 86,025.65 | 83,744.39 |
| cNCFt · at | −206,862.43 | −130,325.14 | −55,660.13 | 17,149.41 | 102,207.59 | 184,831.29 | 265,070.24 | 334,588.33 | 410,208.19 | 485,469.26 | 583,906.79 | 678,019.83 | 767,998.36 | 854,024.01 | 937,768.40 |
| FNPV | 937,768.40 | PLN. | |||||||||||||
| FRR | 43.37 | % | |||||||||||||
| FPP | 3 years and 279 days | ||||||||||||||
Table 20.
Assessment of the financial effects of the project, taking into account changes in the shaping of risk factors. Source: designed by authors.
Table 20.
Assessment of the financial effects of the project, taking into account changes in the shaping of risk factors. Source: designed by authors.
| Risk Factor | The Scope of Changes in Shaping of the Factor | ||||||||
|---|---|---|---|---|---|---|---|---|---|
| Energy Production | −20 [%] | −15 [%] | −10 [%] | −5 [%] | 0 [%] | +5 [%] | +10 [%] | +15 [%] | +20 [%] |
| FNPV [PLN] | 268,550.16 | 435,854.72 | 603,159.28 | 770,463.84 | 937,768.40 | 1,021,420.68 | 1,105,072.96 | 1,188,725.24 | 1,272,377.52 |
| FRR [%] | 14.37 | 20.70 | 27.49 | 34.97 | 43.37 | 47.99 | 52.62 | 57.24 | 61.86 |
| FPP | 9 years 357 days | 7 years 8 days | 5 years 168 days | 4 years 174 days | 3 years 279 days | 3 years 166 days | 3 years 69 days | 2 years 351 days | 2 years 280 days |
| Price of 1 kWh | −20 [%] | −15 [%] | −10 [%] | −5 [%] | 0 [%] | +5 [%] | +10 [%] | +15 [%] | +20 [%] |
| FNPV [PLN] | 603,159.28 | 686,811.56 | 770,463.84 | 854,116.12 | 937,768.40 | 1,021,420.68 | 1,105,072.96 | 1,188,725.24 | 1,272,377.52 |
| FRR [%] | 27.49 | 31.13 | 34.97 | 39.04 | 43.37 | 47.99 | 52.62 | 57.24 | 61.86 |
| FPP | 5 years 168 days | 4 years 334 days | 4 years 174 days | 4 years 40 days | 3 years 279 days | 3 years 166 days | 3 years 69 days | 2 years 351 days | 2 years 280 days |
| Loan interest rate | −20 [%] | −15 [%] | −10 [%] | −5 [%] | 0 [%] | +5 [%] | +10 [%] | +15 [%] | +20 [%] |
| FNPV [PLN] | 983,082.00 | 971,616.95 | 960,151.91 | 948,686.87 | 937,768.40 | 926,849.93 | 915,931.46 | 905,012.99 | 893,879.53 |
| FRR [%] | 44.90 | 44.51 | 44.12 | 43.73 | 43.37 | 43.01 | 42.64 | 42.28 | 41.92 |
| FPP | 3 years 228 days | 3 years 240 days | 3 years 253 days | 3 years 266 days | 3 years 279 days | 3 years 292 days | 3 years 306 days | 3 years 320 days | 3 years 334 days |
Table 21.
Sources of capital, their value, structure and cost as well as the weighted average cost of capital in possible variants of project financing. Source: designed by authors.
Table 21.
Sources of capital, their value, structure and cost as well as the weighted average cost of capital in possible variants of project financing. Source: designed by authors.
| Capital Source | Capital Value | Capital Share | Capital Cost | WACC |
|---|---|---|---|---|
| Variant 1 | ||||
| Preferential bank loan | 426,279.00 | 0.50 | 8.50 | 4.25 |
| Equity, internal | 426,279.00 | 0.50 | 3.24 | 1.62 |
| In total | 852,558.00 | 1.00 | 5.87 | |
| Variant 2 | ||||
| Equity, internal | 852,558.00 | 1.00 | 8.50 | 8.50 |
Table 22.
Results of the evaluation of the financial effects of the project implementation. Source: designed by authors.
Table 22.
Results of the evaluation of the financial effects of the project implementation. Source: designed by authors.
| Assessment Indicator | Indicator Value | Assessment [Positive/Negative] |
| Variant 1 | ||
| FNPV [PLN] | 705,914.38 | positive |
| FRR [%] | 28.13 | positive |
| FPP | 5 years 138 days | positive |
| Variant 2 | ||
| FNPV [PLN] | 193,330.71 | positive |
| FRR [%] | 12.60 | positive |
| FPP | 11 years 138 days | positive |
Table 23.
Assessment of the financial effects, taking into account changes in the shaping of risk factors for additional project financing variants. Source: designed by authors.
Table 23.
Assessment of the financial effects, taking into account changes in the shaping of risk factors for additional project financing variants. Source: designed by authors.
| Variant 1 | |||||||||
| Risk Factor | The Scope of Changes in Shaping of the Factor | ||||||||
| Energy Production | −20 [%] | −15 [%] | −10 [%] | −5 [%] | 0 [%] | +5 [%] | +10 [%] | +15 [%] | +20 [%] |
| FNPV [PLN] | 93,158.84 | 246,347.72 | 399,536.61 | 552,725.50 | 705,914.38 | 782,508.83 | 859,103.27 | 935,697.71 | 1,012,292.16 |
| FRR [%] | 8.74 | 13.41 | 18.13 | 22.85 | 28.13 | 30.89 | 33.65 | 36.41 | 39.46 |
| FPP | 12 years 323 days | 10 years 145 days | 8 years 37 days | 6 years 150 days | 5 years 38 days | 4 years 356 days | 4 years 234 days | 4 years 126 days | 4 years 31 days |
| Price of 1 kWh | −20 [%] | −15 [%] | −10 [%] | −5 [%] | 0 [%] | +5 [%] | +10 [%] | +15 [%] | +20 [%] |
| FNPV [PLN] | 399,536.61 | 476,131.05 | 552,725.50 | 629,319.94 | 705,914.38 | 782,508.83 | 859,103.27 | 935,697.71 | 1,012,292.16 |
| FRR [%] | 18.13 | 20.54 | 22.95 | 25.36 | 28.13 | 30,00 | 33.65 | 36.41 | 39.46 |
| FPP | 8 years 7 days | 7 years 40 days | 6 years 150 days | 5 years 309 days | 5 years 38 days | 4 years 356 days | 4 years 234 days | 4 years 126 days | 4 years 31 days |
| Loan interest rate | −20 [%] | −15 [%] | −10 [%] | −5 [%] | 0 [%] | +5 [%] | +10 [%] | +15 [%] | +20 [%] |
| FNPV [PLN] | 732,291.69 | 725,607.53 | 718,923.37 | 712,239.22 | 705,914.38 | 699,589.55 | 693,264.72 | 686,939.88 | 680,472.38 |
| FRR [%] | 28.13 | 28.13 | 28.13 | 28.13 | 28.13 | 28.13 | 28.13 | 28.13 | 28.13 |
| FPP | 5 years 125 days | 5 years 128 days | 5 years 131 days | 5 years 135 days | 5 years 138 days | 5 years 141 days | 5 years 144 days | 5 years 147 days | 5 years 150 days |
| Variant 2 | |||||||||
| Risk Factor | The Scope of Changes in Shaping of the Factor | ||||||||
| Energy Production | −20 [%] | −15 [%] | −10 [%] | −5 [%] | 0 [%] | +5 [%] | +10 [%] | +15 [%] | +20 [%] |
| FNPV [PLN] | −323,375.08 | −194,198.63 | −65,022.19 | 64,154.26 | 193,330.71 | 257,918.93 | 322,507.15 | 387,095.38 | 451,683.60 |
| FRR [%] | 1.15 | 4.20 | 7.25 | 9.87 | 12.60 | 13.91 | 15.21 | 16.65 | 18.00 |
| FPP | - | - | - | 13 years 238 days | 11 years 156 days | 10 years 215 days | 9 years 301 days | 9 years 9 days | 8 years 134 days |
| Price of 1 kWh | −20 [%] | −15 [%] | −10 [%] | −5 [%] | 0 [%] | +5 [%] | +10 [%] | +15 [%] | +20 [%] |
| FNPV [PLN] | −65,022.19 | −433.96 | 64,154.26 | 128,742.48 | 193,330.71 | 257,918.93 | 322,507.15 | 387,095.38 | 451,683.60 |
| FRR [%] | 7.09 | 8.49 | 9.89 | 11.30 | 12.60 | 13.91 | 15.21 | 16.65 | 18.00 |
| FPP | - | - | 13 years 239 days | 12 years 157 days | 11 years 156 days | 10 years 215 days | 9 years 301 days | 9 years 9 days | 8 years 134 days |
Publisher’s Note: MDPI stays neutral with regard to jurisdictional claims in published maps and institutional affiliations. |
© 2022 by the authors. Licensee MDPI, Basel, Switzerland. This article is an open access article distributed under the terms and conditions of the Creative Commons Attribution (CC BY) license (https://creativecommons.org/licenses/by/4.0/).
Share and Cite
MDPI and ACS Style
Bijańska, J.; Wodarski, K.; Aleksander, A. Analysis of the Financing Options for Pro-Ecological Projects. Energies 2022, 15, 2143. https://doi.org/10.3390/en15062143
AMA Style
Bijańska J, Wodarski K, Aleksander A. Analysis of the Financing Options for Pro-Ecological Projects. Energies. 2022; 15(6):2143. https://doi.org/10.3390/en15062143
Chicago/Turabian StyleBijańska, Jolanta, Krzysztof Wodarski, and Aneta Aleksander. 2022. "Analysis of the Financing Options for Pro-Ecological Projects" Energies 15, no. 6: 2143. https://doi.org/10.3390/en15062143
Note that from the first issue of 2016, this journal uses article numbers instead of page numbers. See further details here.