
Pro-Ecological Behavior: Empirical Analysis on the Example of Polish Consumers


1
Department of Applied Social Sciences, Faculty of Organization and Management, Silesian University of Technology, Roosevelta Str. 26-28, 41-800 Zabrze, Poland
2
Sewage and Water Supply Ltd., Pod Lasem 62, 44-210 Rybnik, Poland
*
Author to whom correspondence should be addressed.
Energies 2022, 15(5), 1690; https://doi.org/10.3390/en15051690
Submission received: 30 December 2021
/
Revised: 14 February 2022
/
Accepted: 22 February 2022
/
Published: 24 February 2022
(This article belongs to the Special Issue Analysis of Pro-ecological Behavior of Consumers)
Abstract
:Intense economic, social and environmental changes are creating new challenges for both consumers and businesses. Today’s consumer is becoming increasingly conscious of the importance of living in harmony with both ethical standards and the environment. Access to global resources, including utilities such as water, sewage collection, electricity or gas, is so ubiquitous that modern man cannot imagine functioning without them. The aim of this article is to show how the statistical Polish consumer has, or wants to have, an impact on improving the quality of the natural environment by using available resources and technological solutions. The novelty here is the use of the structural equation model (SEM) to build a model of pro-environmental behaviors in relation to the motivating and limiting factors for undertaking such behaviors in Poland. The hypothesis that the statistical Polish consumer undertakes pro-environmental behaviors because of their positive impact on the natural environment was accepted in the study. Due to the complexity of research aspects, a mixed research procedure was applied, in which a literature review was combined with a survey and statistical analysis. For the purpose of the survey, the author’s questionnaire, “Pro-ecological behavior in Poland”, was created. The results of the study confirmed the adopted hypothesis and allowed conclusions to be formulated in which the research questions were answered and factors motivating and limiting pro-ecological activities in Poland were indicated. The factors presented and the model developed can be a signpost for the government of Poland and other European Union countries towards maintaining the current and introducing new reliefs, incentives and education on pro-environmental activities.
1. Introduction
In 2015, the United Nations adopted the Sustainable Development Goals (SDGs), otherwise known as the Global Goals [1], which are recognized by the UN as a universal call to action to prevent poverty, protect the planet and ensure that all people live in peace and prosperity by 2030. There are seventeen goals and they are centered around five areas: people, planet, prosperity, peace and partnership. Ending poverty, hunger, the AIDS epidemic and discrimination against women and girls are considered the most important specific goals [2]. The concept of sustainable development first appeared in 1968. It became, in a short time, a way to organize societies so that they could exist in the long term. It meant taking into account issues such as environmental and natural resource conservation and social and economic equality [3]. It emerged as a response to, among other things, the Industrial Revolution, when Western societies began to discover that their economic and industrial activities had significant impacts on the environment and social balance. Several environmental and social crises in the world occurred along with issues of global warming, increasing air pollution, the ozone layer, and biodiversity loss, which have greatly increased the awareness that a more sustainable model of economic and social functioning is needed [3].
It is difficult to identify a clear definition of environmentally sustainable consumer behavior. Studies conducted so far [4] have mostly analyzed the inclinations and reasons that determine people’s involvement in environmental activities. Among other things, the combination of economic and social factors in relation to environmental concern was examined [5]. Some studies have indicated a relationship between age and concern [5], while others have indicated that age does not affect this type of behavior [6]. Instead, demographics and upbringing have become more important in a period of dynamic social and technological change and, consequently, the formation of an approach to the world mainly based on the Internet and various technological solutions. We are talking about Generation Z (people born after 1995), for whom ecological and environmental issues are quite distant and difficult to understand because they do not arise from the Internet and the highly technical world [5].
The aim of this article is to show how the statistical Polish consumer has, or wants to have, an influence on improving the quality of the natural environment by using available resources and technological solutions. The authors present current trends in Polish society, and the novelty is the use of the structural equation model (SEM) to build a model of pro-environmental behaviors in relation to the motivating and limiting factors of such behaviors in Poland.
Due to the significance of the existential problems of our planet, the conducted research is useful for the general public. The pro-ecological behaviors analyzed in the article can increase readers’ awareness of the importance of their adoption and can positively affect economic development in accordance with ecology. The creation of certain pro-ecological behaviors in society will allow development of certain kinds of habits and good practices of behavior to minimize the risk of environmental disaster in the long run. From the point of view of practice, the results of research and conclusions presented in the article are a kind of signpost for the Polish government, which can adapt to the expectations of consumers and try to minimize the barriers, as indicated by the respondents, to engaging in pro-ecological behavior. From the point of view of contribution to science, the research results can be used as material for comparative analysis with other countries.
The structure of the remaining part of the manuscript begins with a review of the literature on pro-environmental consumer behavior. Next, various environmental problems and threats are characterized, as well as opportunities for their mitigation. This is followed by a description of the research methods and the results of the statistical analysis and discussion. In the next part, a model and conclusions are presented which may serve as a signpost for the government of Poland and other European Union countries in the direction of maintaining the current and introducing new reliefs, incentives and education concerning pro-environmental activities. At the end, some limitations and possibilities for future research in this area are pointed out.
2. Literature Review
Environmental psychology literature often discusses environmentally sustainable behaviors, referring to them as pro-environmental behaviors [7]. This means the type of behavior that supports environmental sustainability. P. Halder [8] defines environmentally sustainable behavior as a specific behavior that is not harmful (and is even beneficial) to the environment. In the consumer behavior literature, environmentally sustainable behaviors are often described as green consumption actions [9]. These are all consumer behaviors that reduce negative impacts on the environment [10]. We can divide them according to the criterion of the level of involvement in pro-environmental activities. Two types can be distinguished here: those requiring high commitment and those requiring low effort [11]. Another division is between individual and collective behaviors [12]. It is also worth considering pro-environmental actions from the current perspective and their impact on future generations [13]. A variety of problems, e.g., greenhouse effect, pollution of air, water, soil, loss of many plant and animal species and depletion of natural resources, pose a serious threat to the environment and its sustainable development [14,15,16]. The problems are mainly related to irresponsible human behavior, from the environmental point of view [17]. Researchers agree that problematic issues can be addressed by correcting human behavior in an environmentally sustainable manner [10]. Changing the consumption behavior of individuals (approaching, buying and consuming products in a pro-environmental way) is considered to be particularly important and can be an essential factor in this balance [8].
The awareness of environmental responsibility varies greatly around the world. It depends on age, gender, level of education, level of environmental awareness in society and public education in this field. Research [18] carried out in China, among others, indicated that consumers are aware of their environmental responsibility.
This research [18] conducted in China, among others, indicated that consumers with a stronger sense of responsibility for the environment are more likely to purchase environmentally friendly products. Such behavior is also influenced by environmental concern, which plays a mediating and persuasive role. An element that encourages pro-environmental attitudes involves strengthening awareness and sensitivity to environmental issues. Product price is also very important in this respect. According to research [18], people who are very sensitive to price are less likely to make pro-environmental purchases. In contrast, consumers with lower levels of price sensitivity are more likely to be environmentally motivated and concerned, which ultimately promotes green consumption intention [18].
Other studies on consumer environmental behavior [19] confirm that consumers who are aware of the negative impact of their personal consumption on the environment and its continuous deterioration tend to act more responsibly in this regard and are interested in supporting companies that produce environmentally friendly products. Consumers then try to help maintain the good condition of the environment by popularizing eco-friendly purchases [20]. As shown by other studies [21], changing shopping behavior is more beneficial in the long run than reusing or recycling available products. Therefore, inducing sustainable consumer behavior has been a key topic of increasing interest in the consumer market and academic community over the past few decades [22]. Environmentally sustainable consumer behavior, of which environmentally responsible consumer behavior is an alternative term, is difficult to define. The term is widely used as a justification for the concept which emphasizes various actions by an individual to conserve natural resources (e.g., water and energy), reduce environmental damage (e.g., waste) and meet the ecological needs of society and improve the quality of life [7]. According to J. Krajhanzl [23], we talk about pro-environmental behavior when we specify a type of behavior that is generally (or according to environmental knowledge) evaluated in the context of the considered society as a protective form of ecological behavior or a tribute to a healthy environment. Other terms for pro-environmental actions are also environmentally responsible behavior [24] and sustainable behavior [25].
Environmentally sustainable consumer behavior is clearly an important aspect of pro-social consumption activities [26] that ultimately benefit the environment and society as a whole [27]. One of the steps towards sustainable consumption and sustainability is the gradual introduction of the principles of the circular economy, or what is otherwise known as the closed-loop economy [28]. In this type of economy, existing materials and products are used for the maximum length of time by reusing, sharing, borrowing, repairing, recycling and renewing them. The circular economy is the complete opposite of a linear economy, which is based on the principle of “take—produce—use—throw away” and planned consumption, which leads to an enormous increase in economic waste. Within the EU, the annual amount of waste is as much as 2.5 billion tons [29]. The European Commission, in March 2020, as part of the European Green Deal [29] and the new industrial strategy, created a roadmap to implement a closed-loop economy. The first industries to be included in the new plan are electronics, plastics and ICT. The European Union, under the European Parliament Directive 2008/98/EC of 19 November 2008 [30] on waste, set out the basic principles for handling waste and introduced the basis for creating a recycling society and the habit of recovering and reusing waste instead of landfilling and incinerating it [31].
In the trend of the circular economy, the idea of zero waste has emerged, which is based on rational reduction of consumption and minimalism, which both lead to a definite reduction in environmental pollution. This idea is based on five principles (5R): refuse, reduce, reuse, recycle, rot [32]. Gumtree [33] carried out research on the use of zero waste principles among Poles. The results show that only 50% have heard about this concept and only 29% put it into practice. Most of the practical application of this idea takes place in cities with over 500 thousand inhabitants (38%) and much less in villages—only 27%. These principles are more identified with ecology (65%) than with economy and savings (17%). As the greatest advantages of applying these principles, respondents indicated: reducing waste (52%) and reducing carbon emissions and environmental contamination (17%), and 12% of respondents indicated the importance of these principles in the context of protection against resource scarcity [33].
Sustainable consumption is also becoming a particular issue in tourism and hospitality [34], as more and more people in the market realize that much serious environmental damage originates from tourism activities [35]. Nowadays, customers in this sector increasingly demand green products (e.g., environmentally friendly hotels, restaurants, cruises, airlines, resorts or casinos) and often demonstrate a willingness to consume sustainably [36]. Due to this demand and environmentally conscious market environment, many tourism and hospitality companies are increasingly trending towards eco-friendly activities and developing green products [37]. At the same time, customers in the tourism and hospitality industry are learning about the necessity of environmentally sustainable behavior both in this field and in their daily lives [38]. The most studied products in the context of tourism and hospitality include green hotels [38], sustainable destinations [39], green restaurants [40], cruises [41], green cafes and museums [42]. These forms of green products partially or completely meet the growing needs of travelers and the market for a green approach [43].
Statistics on waste in Poland are as follows. In 2020, one resident collected an average of 342 kg of municipal waste. This was 10 kg more than in 2019. Earlier periods also presented an upward trend. From 263 kg in 2010 through 283 kg in 2015 to 342 kg in 2020, this number will increase to 370 kg by 2030 [44]. Compared to other European countries, Poland has not yet reached the maximum levels, which are in the range of about 500 kg of municipal waste per capita. The numbers obviously vary from region to region. For example, in Romania it is 280 kg per year and in Denmark as much as 844 kg [45]. Generally, the European Union generates approx. 12% of global municipal waste production.
In terms of energy consumption, the European Union sets levels for reducing the use of energy in particular years. By 2020, the goal was to reduce energy consumption by 20% and by 32.5% by 2030 [45]. Energy efficiency means to facilitate the sustainable supply of energy and diversify the sources of its production but, at the same time, reduce the emission of greenhouse gases, as well as reduce the costs of its supply while ensuring the security of its provision. This concept is currently a priority in the EU in the Action Strategy [45].
In September 2020, the European Commission, in the document “Ready for 55” [46], presented the plan COM(2020)562 [47], which assumes the reduction in greenhouse gas emissions in the EU by at least 55% by 2030 compared to 1990 levels. One of the solutions to reduce energy consumption is the use of renewable energy sources (RES), more popularly known as green energy. These are, among others: wind, solar, geothermal and nuclear energy, water currents, biomass and biogas.
Water is another parameter that should be saved. The European Environment Agency (EEA) prepared a study on “Pricing and non-pricing measures for managing water demand in Europe” [48], in which it addresses the issue of reducing water consumption while increasing the efficiency of its use. The research was carried out in Germany, Denmark, Spain, France, Italy, Romania, Sweden and Cyprus. The selected countries have different hydrological conditions and, thus, different needs in this area and employ different water resources management strategies. The analysis focused on the impact of pricing mechanisms on water consumption, modernization of infrastructure, education on limited water resources, leakage reduction, installation of water saving devices, modern management systems or various social campaigns. All these activities help to estimate that water consumption will be reduced by almost 50%, from 150 L per person per day to 80 L per person per day [48]. Other examples in Poland include numerous campaigns organized by PWiK Rybnik promoting water saving and other pro-ecological behaviors among the youngest citizens, consisting of workshops in the form of games and plays organized in kindergartens and elementary schools in the Rybnik district [49].
Another area that is discussed for environmental protection reasons is transport. A White Book was created entitled “The plan to create a Single European Transport Area—striving to achieve a competitive and resource-efficient transport system” [50] and assumes a reduction in Europe’s dependence on imported oil and greenhouse gas emissions from the transport industry by 2050, as well as the creation of a single European area transportation. The planned changes are to relate mainly to urban transport and assume the use of innovative technological and design solutions, as well as those powered by alternative energy sources [51].
Public education in the field of environmental awareness plays an enormous role in striving for sustainable development [52]. Expanding this awareness, political and social influence may lead to the development of a strong moral conviction in people [53,54], which will be an argument for caring for sustainable development, independent even of economic factors. On the basis of these considerations, the hypothesis was adopted in the paper that the statistical Polish consumer undertakes pro-ecological behavior due to their positive impact on the natural environment.
3. Materials and Methods
The aim of this article is to show how the statistical Polish consumer has, or wants to have, an influence on improving the quality of the natural environment by using available resources and technological solutions. The authors present current trends in the Polish society, and the novelty is in the use of the structural equation model (SEM) to build a model of pro-environmental behaviors in relation to the motivating and limiting factors of such behaviors in Poland. The following research questions were asked:
- What types of pro-environmental behaviors are most often undertaken in Poland?
- What most motivates Poles to undertake pro-environmental behaviors?
- What stands in the way of Poles taking up pro-environmental behaviors?
- Which pro-environmental behaviors are considered most important in Poland in terms of environmental protection?
In this study, the hypothesis was adopted that the statistical Polish consumer undertakes pro-environmental behavior because of its positive impact on the natural environment. The hypothesis was formulated on the basis of literature analysis, which shows that the statistical Polish consumer is a very conscious citizen and is aware of the importance of cleanliness of the environment and its impact on the global ecosystem of the planet [4,5].
Due to the complexity of research aspects, a mixed research procedure was applied, in which a literature review was combined with a survey and statistical analysis.
The empirical material was collected using the author’s survey questionnaire, consisting of 27 questions. The questionnaire was divided into two parts, i.e., “Pro-ecological behavior in Poland” (17 items) and “Demographics” (10 items). The first part was aimed at collecting information about the pro-environmental behaviors that were undertaken, the factors that motivated them and those that constituted obstacles (constraints) to doing so, as well as opinions about the impact of particular pro-environmental behaviors on the natural environment. (All questions in this part were answered on a five-point Likert scale, and in the case of questions about the frequency of pro-environmental behaviors, the answer “Not applicable” was included.)
The questions in the first part of the survey questionnaire addressed the following issues: harvesting rainwater and later using it in the household, garbage sorting, using public transport instead of a car, using an electric bicycle/scooter instead of a car, choosing products that have environmentally friendly packaging, using low-energy consumption household appliances, using a reusable bag when shopping, buying second-hand items, using naturally based detergents, saving water, saving electricity, saving gas, saving paper, using food rationally, factors that motivate people to undertake pro-ecological behavior, factors that are a barrier to undertaking pro-ecological behavior and behaviors that have a positive impact on the environment.
The second part, on the other hand, was designed to collect anonymous socio-demographic information (gender, age and education) and information on pro-environmental solutions owned. All survey questions were closed (three questions had a matrix character). To assess the reliability of the above-mentioned questionnaire, Cronbach’s alpha internal consistency coefficient was calculated, which was alpha = 0.76 (valid reliability).
The sample selection was random, nationwide. Questionnaires were collected electronically through the Interankiety.pl web platform between 26 July 2021 and 31 August 2021. The basic criteria for inclusion in the study were age of majority, Polish citizenship, permanent residence in Poland and voluntary consent to participate in the study. The respondents were informed about the aim of the study and about the anonymous and voluntary character of participation in the study.
The study involved 854 people, including 50.35% of men (n = 430) and 49.65% of women (n = 424). Table 1 presents groups of men and women by age and education, and an overall breakdown of all respondents by age and education.
The minimum sample size was estimated using the sample size formula for qualitative characteristics (with a finite sample) [55]. In calculating the minimum sample size, the size of the general population was assumed to be 32,386,700 [56]. The minimum sample size estimated above was 384. Thus, the achieved number of respondents (N = 854) more than doubled the minimum sample size, which allowed us to obtain reliable data in this study.
The results of the conducted survey were subjected to quantitative and descriptive analysis. The structure of the study sample was described using the number and percentage distribution of individuals characterized by a given characteristic. However, for the purposes of comparative and dependence analyses, data based on responses on a five-point Likert scale were recoded into a numerical scale of 1–5 ratings (eliminating from this study those individuals who were not affected by selected pro-environmental behaviors). The resulting measurable parameters were presented using descriptive statistics, and the normality of their distribution was tested using the Shapiro–Wilk test.
The following were used in the statistical calculations:
- Spearman’s rank order correlation, to examine the interdependence between two variables of a quantitative and/or ordinal nature [57].
- Multidimensional cluster analysis to extract homogeneous subsets of objects (i.e., factor subgroups) that are more similar to objects in a given cluster compared to objects in other clusters. As part of this analysis, objects (parameters) were clustered using the hierarchical agglomeration method. Euclidean distance was used as the distance function [57]. On the other hand, Ward’s method was adopted as the rule for binding clusters together [57].
- Structural Equation Model (SEM), to test elaborate theoretical models accounting for various cause–effect relationships among variables. The construction of a structural equation model consists of a model describing the relationships among latent variables, called the internal model, and a model measuring endogenous and exogenous unobservable variables, called the external model. The external model is a factor analysis representation that allows us to calculate the loadings of the individual factors that shape the latent variable [59].
The identifiable SEM model was estimated using the asymptotically distribution-free (ADF) method, made possible by the large sample size. In order to assess the quality of fit of the estimated model to the empirical data, and thus to test the goodness of fit of the model in relation to the data matrix testing it, the Joerskog GFI and the Joerskog AGFI fit indices were used [59].
The developed structural equation models were based on observable (manifest) variables, which were combined to form the so-called unobservable (latent) variables. The detailed specification of the above-mentioned variables is presented in Table 9. The operationalization of individual observable variables, used in the concept of unobservable variables, was based primarily on the knowledge of the researcher. This was due to the lack of analogous studies in the literature, which is acceptable in the case of the theoretical model building stage [60]. The author took into account the fact that the number of observable and unobservable variables in the models verified by means of structural equations increases with the number of parameters needs to be estimated: relationships between variables, variance of observable variables and measurement errors, which in turn determines the increase in model complexity and the need for large samples [61]. The model used a measurement scale of observable variables, i.e., five-point Likert scale for each such variable. The scales used were subjected to reliability and accuracy analysis [62]. Moreover, descriptive statistics were calculated for all variables in the measurement model and the normality of their distributions was assessed (Table 2). Since the normality of distribution conditions was not met, the asymptotically distribution insensitive method, i.e., ADF, requiring a sample of at least 200–500 observations, was used as a method of model estimation [61], which was fulfilled in the case of the analyzed data.
Statistical v.13.3 PL statistical package from Tulsa, OK, USA was used to perform the calculations.
4. Results and Discussion
4.1. The Pro-Ecological Solutions in Poland
The most popular pro-environmental solutions among respondents were a rainwater storage tank and a composter, owned by 55.39% and 49.41% of respondents, respectively. On the opposite side in terms of popularity were: solar water heating, heat pump and hybrid or electric car, which were owned by the fewest people (respectively: 11.36%, 11.94% and 3.28%) and, at the same time, the largest percentage of respondents did not own these solutions and did not have such plans for the future (respectively: 51.76%, 48.83% and 48.95%). Almost every third person (30.09%) had a non-returnable water meter and every fifth person (21.78%) had a photovoltaic micro installation, while the largest percentage of respondents in the case of the latter solution did not have and did not intend to have it installed in the future (35.01%) (Table 3).
4.2. Pro-Ecological Behavior Adopted in Poland
Respondents overwhelmingly always sorted garbage (96.02%). The vast majority of respondents also always used low-energy household appliances (78.10%) and reusable bags when shopping (73.07%). Moreover, more than half of the respondents always saved water (55.85%), electricity (54.10%) and paper (53.86%). Saving gas did not apply to a significant proportion of the respondents (40.98%), while the remaining respondents also mostly always saved gas (32.55%). In the case of rainwater harvesting behavior and its subsequent use in the household, the respondents were divided, with also the largest share of people always taking this action (36.89%).
Pro-environmental behaviors that had the highest percentage of having never been performed included using public transportation instead of a car (25.88%), using a bicycle or electric scooter instead of a car (22.60%) and buying second-hand items (18.50%). It should be noted, however, that the percentages of people who never undertake these behaviors were not the highest: in the case of using public transport instead of a car, most people indicated the frequency was rarely (42.27%), while in the case of using a bicycle or electric scooter instead of a car and buying second-hand items, the frequency was sometimes (24.36% and 30.56%, respectively).
The remaining pro-ecological behaviors were undertaken in a differentiated manner in terms of frequency, with the highest proportion of people undertaking these actions frequently. We are talking about pro-environmental behaviors such as: choosing products that have environmentally friendly packaging (39.93%), using natural detergents (35.01%) and rational use of food (49.30%) (Table 4).
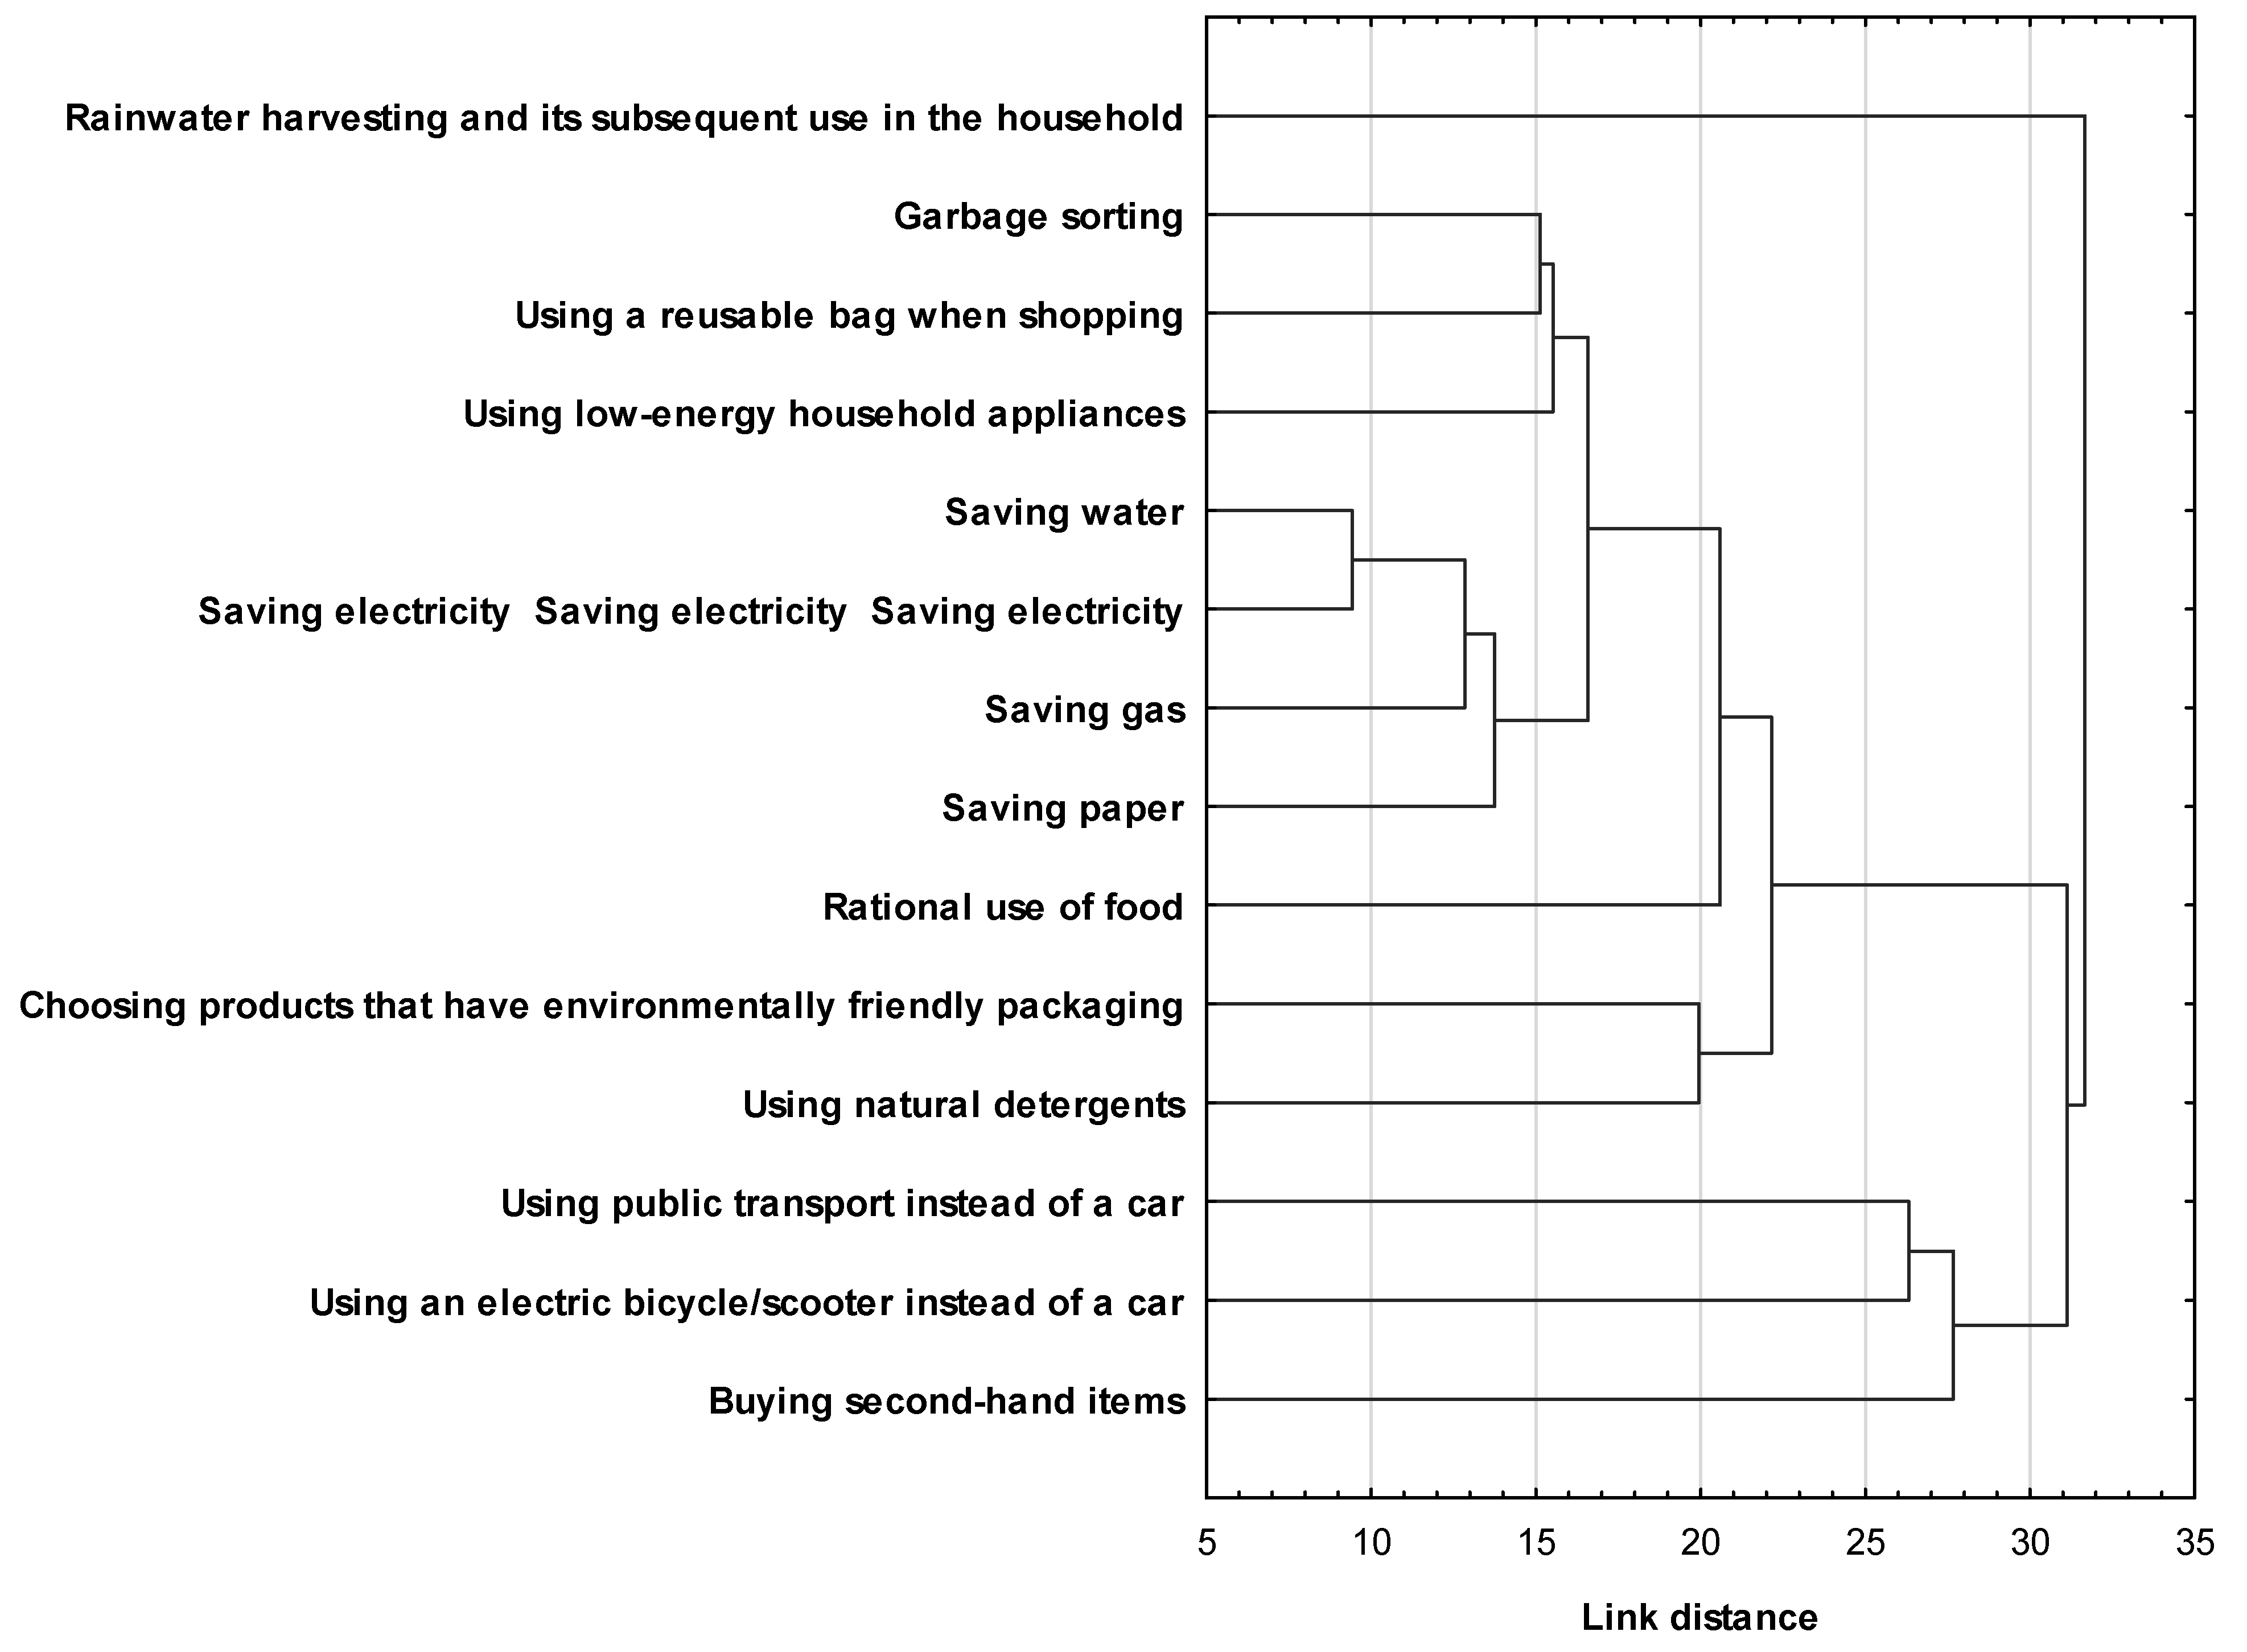
Cluster analysis (cases of individuals who were not affected by particular pro-ecological behaviors were not included) showed that there were three clusters of ecological behaviors in terms of the frequency with which they were undertaken. The first cluster involved one behavior in the form of rainwater harvesting and subsequent household use. The second cluster included 10 behaviors, i.e., garbage sorting; using a reusable bag when shopping; using low-energy household appliances; saving water, electricity, gas, and paper; using food rationally and choosing products that have environmentally friendly packaging and using natural detergents. In contrast, the third cluster included environmentally friendly behaviors such as using public transportation instead of a car, using a bicycle or electric scooter instead of a car and buying used items (Figure 1). The results clearly distinguish between the three clusters discussed above. The most numerous, the second cluster, is mainly related to activities of daily living in the household and saving utilities, while the third cluster is mainly related to transport.
4.3. Motivational Factors in Pro-Ecological Behavior
The respondents were most motivated to take pro-ecological behavior by factors such as: care for their own and their family’s health (79.98% of the ratings “5—very strongly motivating”), care for the natural environment (60.54%) and financial factors (64.99%). Very important motivating factors in pro-ecological behavior were also: the convenience of new solutions, legal requirements and tax reliefs and state subsidies (45.67%, 48.83% and 46.60%, respectively). In the case of the other two factors (i.e., the willingness to follow the trend and promoting ecology), their impact on taking pro-ecological behavior was smaller, although the highest percentage of respondents also indicated the highest score in their case (27.40% and 27.75%, respectively) (Table 5).
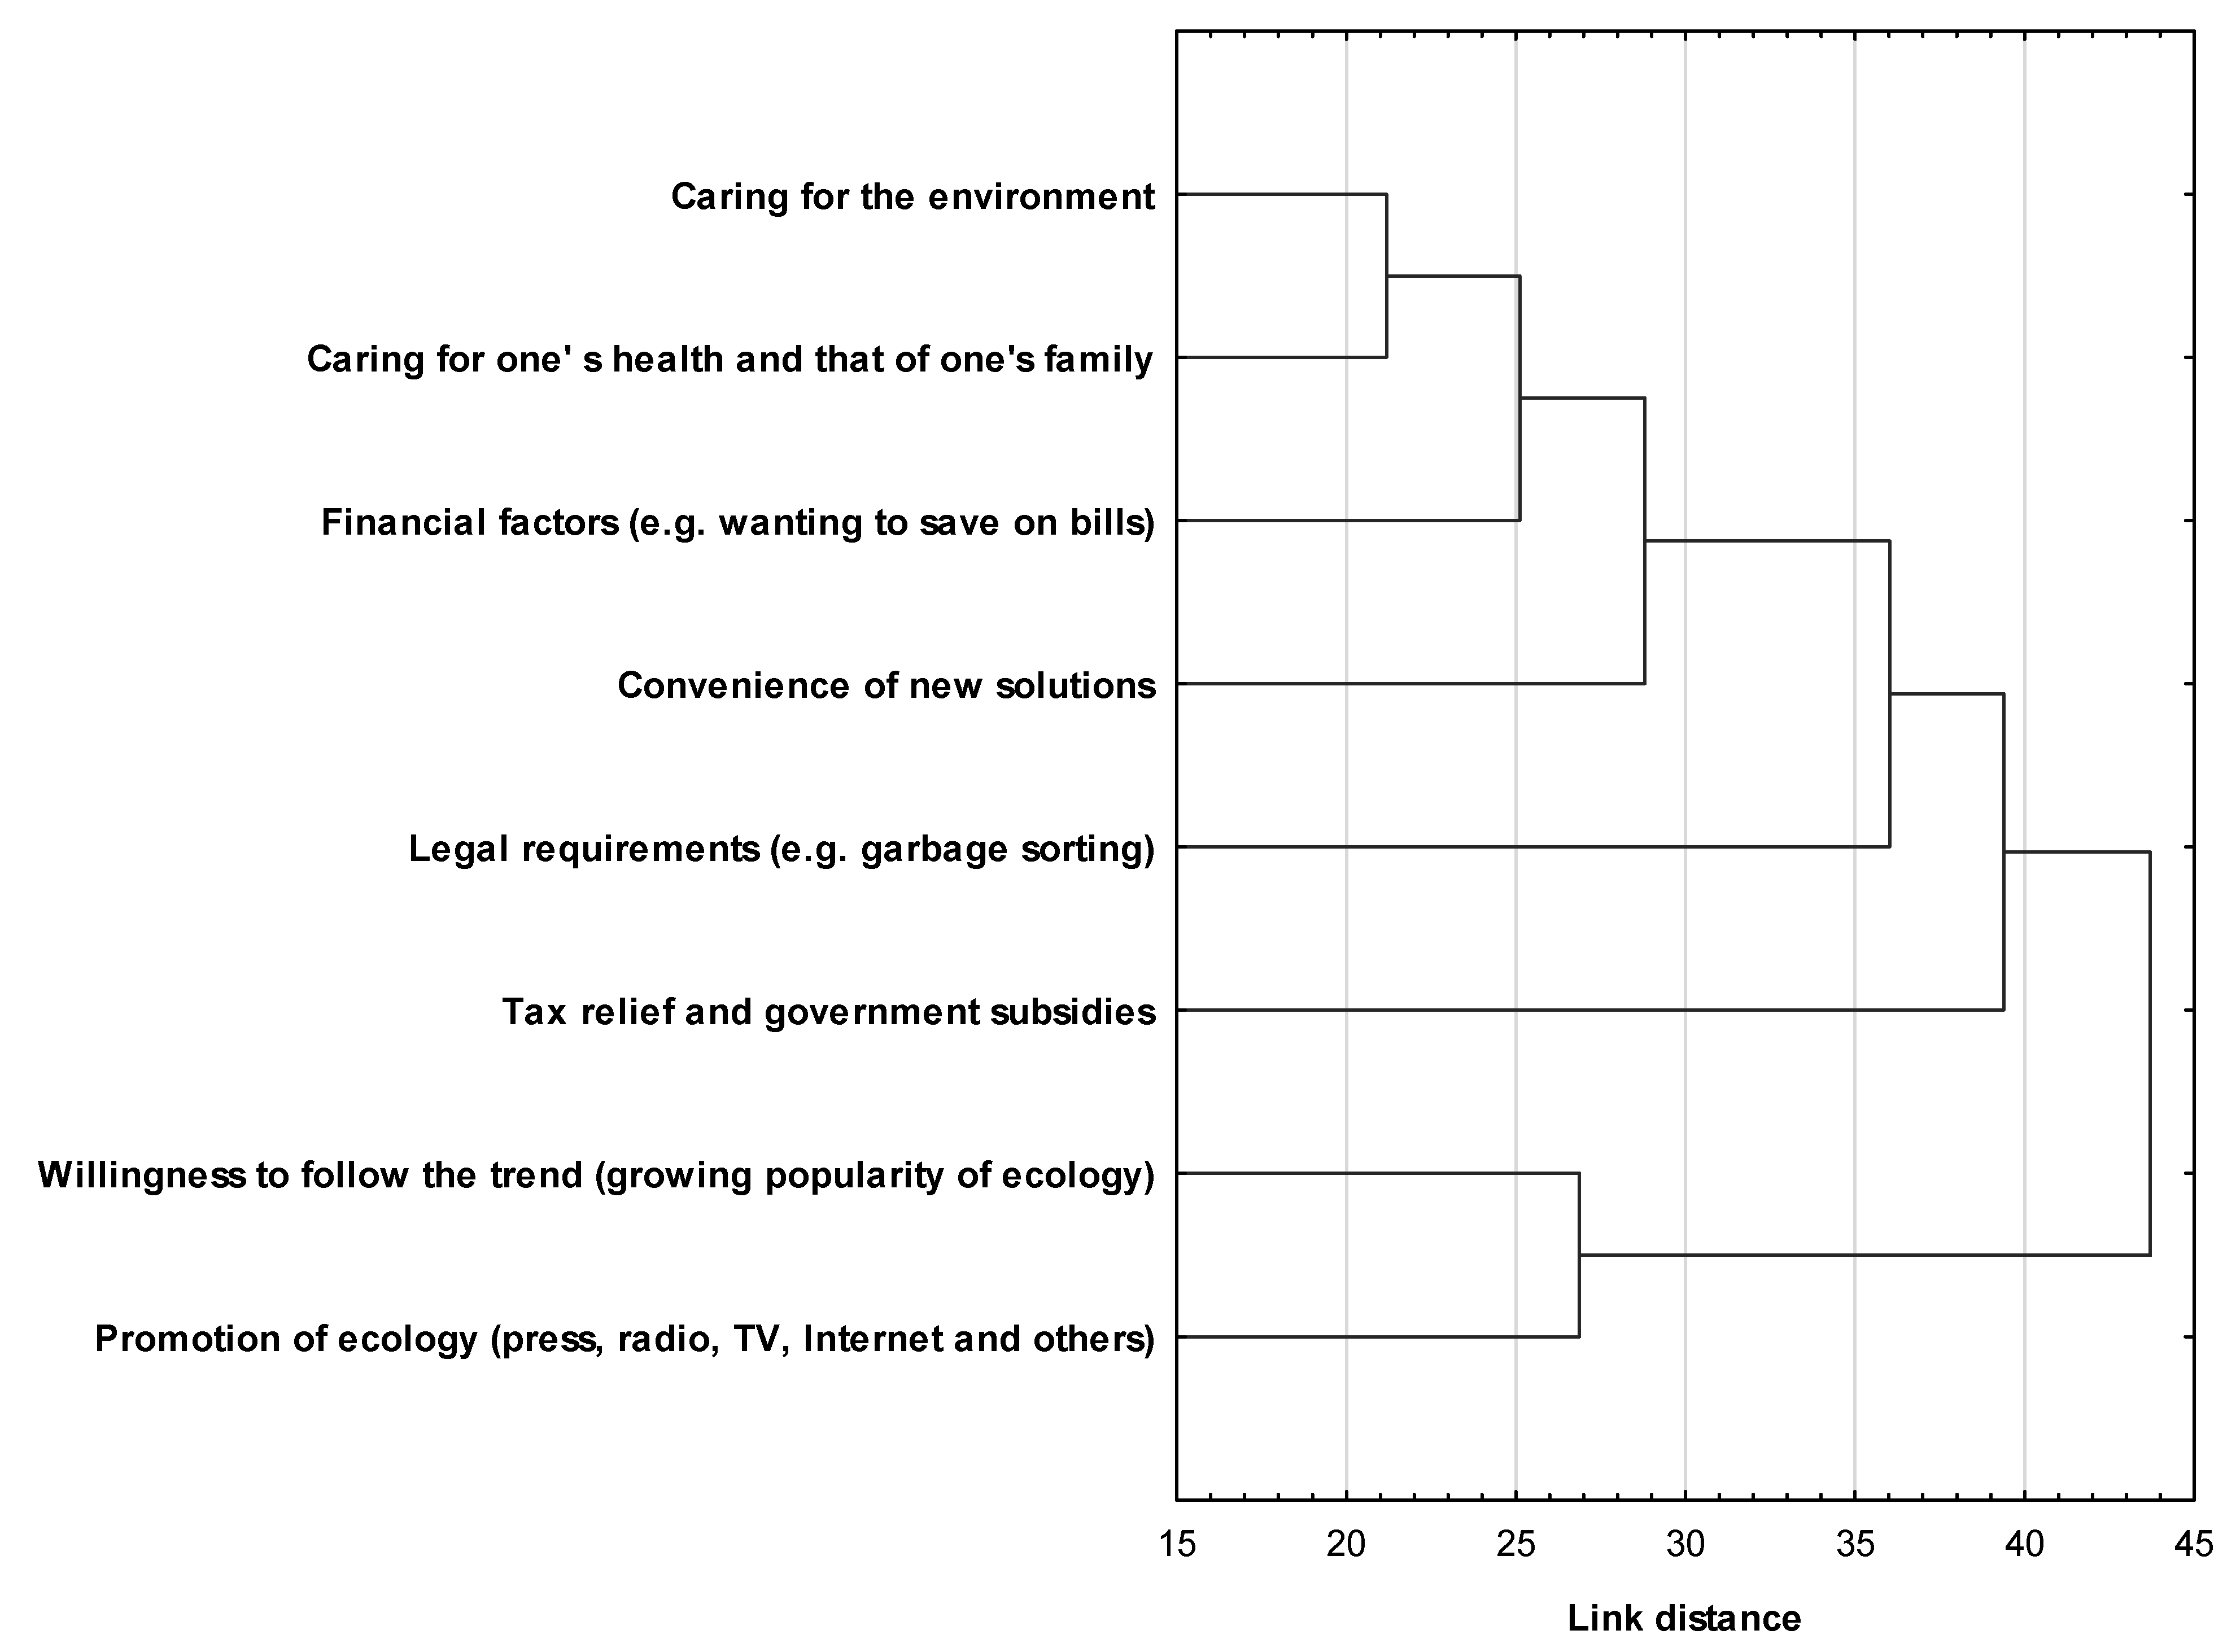
Based on the results of the cluster analysis, similarities were identified in terms of the degree of motivation of the respondents to undertake pro-ecological behaviors in the case of factors such as: care for the environment, caring for one’s health and that of one’s family, financial factors, convenience of new solutions, legal requirements and tax relief and state subsidies (one cluster). In addition, it was noted that the respondents were similarly influenced by the desire to follow the trend and the promotion of ecology in the media (second cluster) (Figure 2). Considering the percentage distribution regarding the degree to which respondents were motivated to undertake pro-environmental behaviors by individual factors, it can be concluded that factors falling into the first cluster were significantly more important. This implies that respondents were more likely to attribute a greater motivational role to factors from the first cluster compared to the second cluster.
4.4. Factors Limiting the Adoption of Pro-Ecological Behaviors
Respondents were divided in terms of the various factors limiting them in engaging in pro-ecological behaviors. The biggest barrier was insufficient financial resources (23.30% of responses, “5—A very big barrier”). The situation was not much better in the case of factors such as lack of or insufficient information regarding financial support for pro-environmental investments (19.32%) and difficulties in filling out applications for financing such investments (20.02%). On the other hand, the smallest barriers in taking up pro-ecological behavior by respondents were: the need to change existing habits and customs (4.92%) and the inconvenience of new ecological solutions (7.26%). In the case of the latter two factors, most people indicated a rating of “1—Not a barrier” (37.35% and 32.55%, respectively) (Table 6).
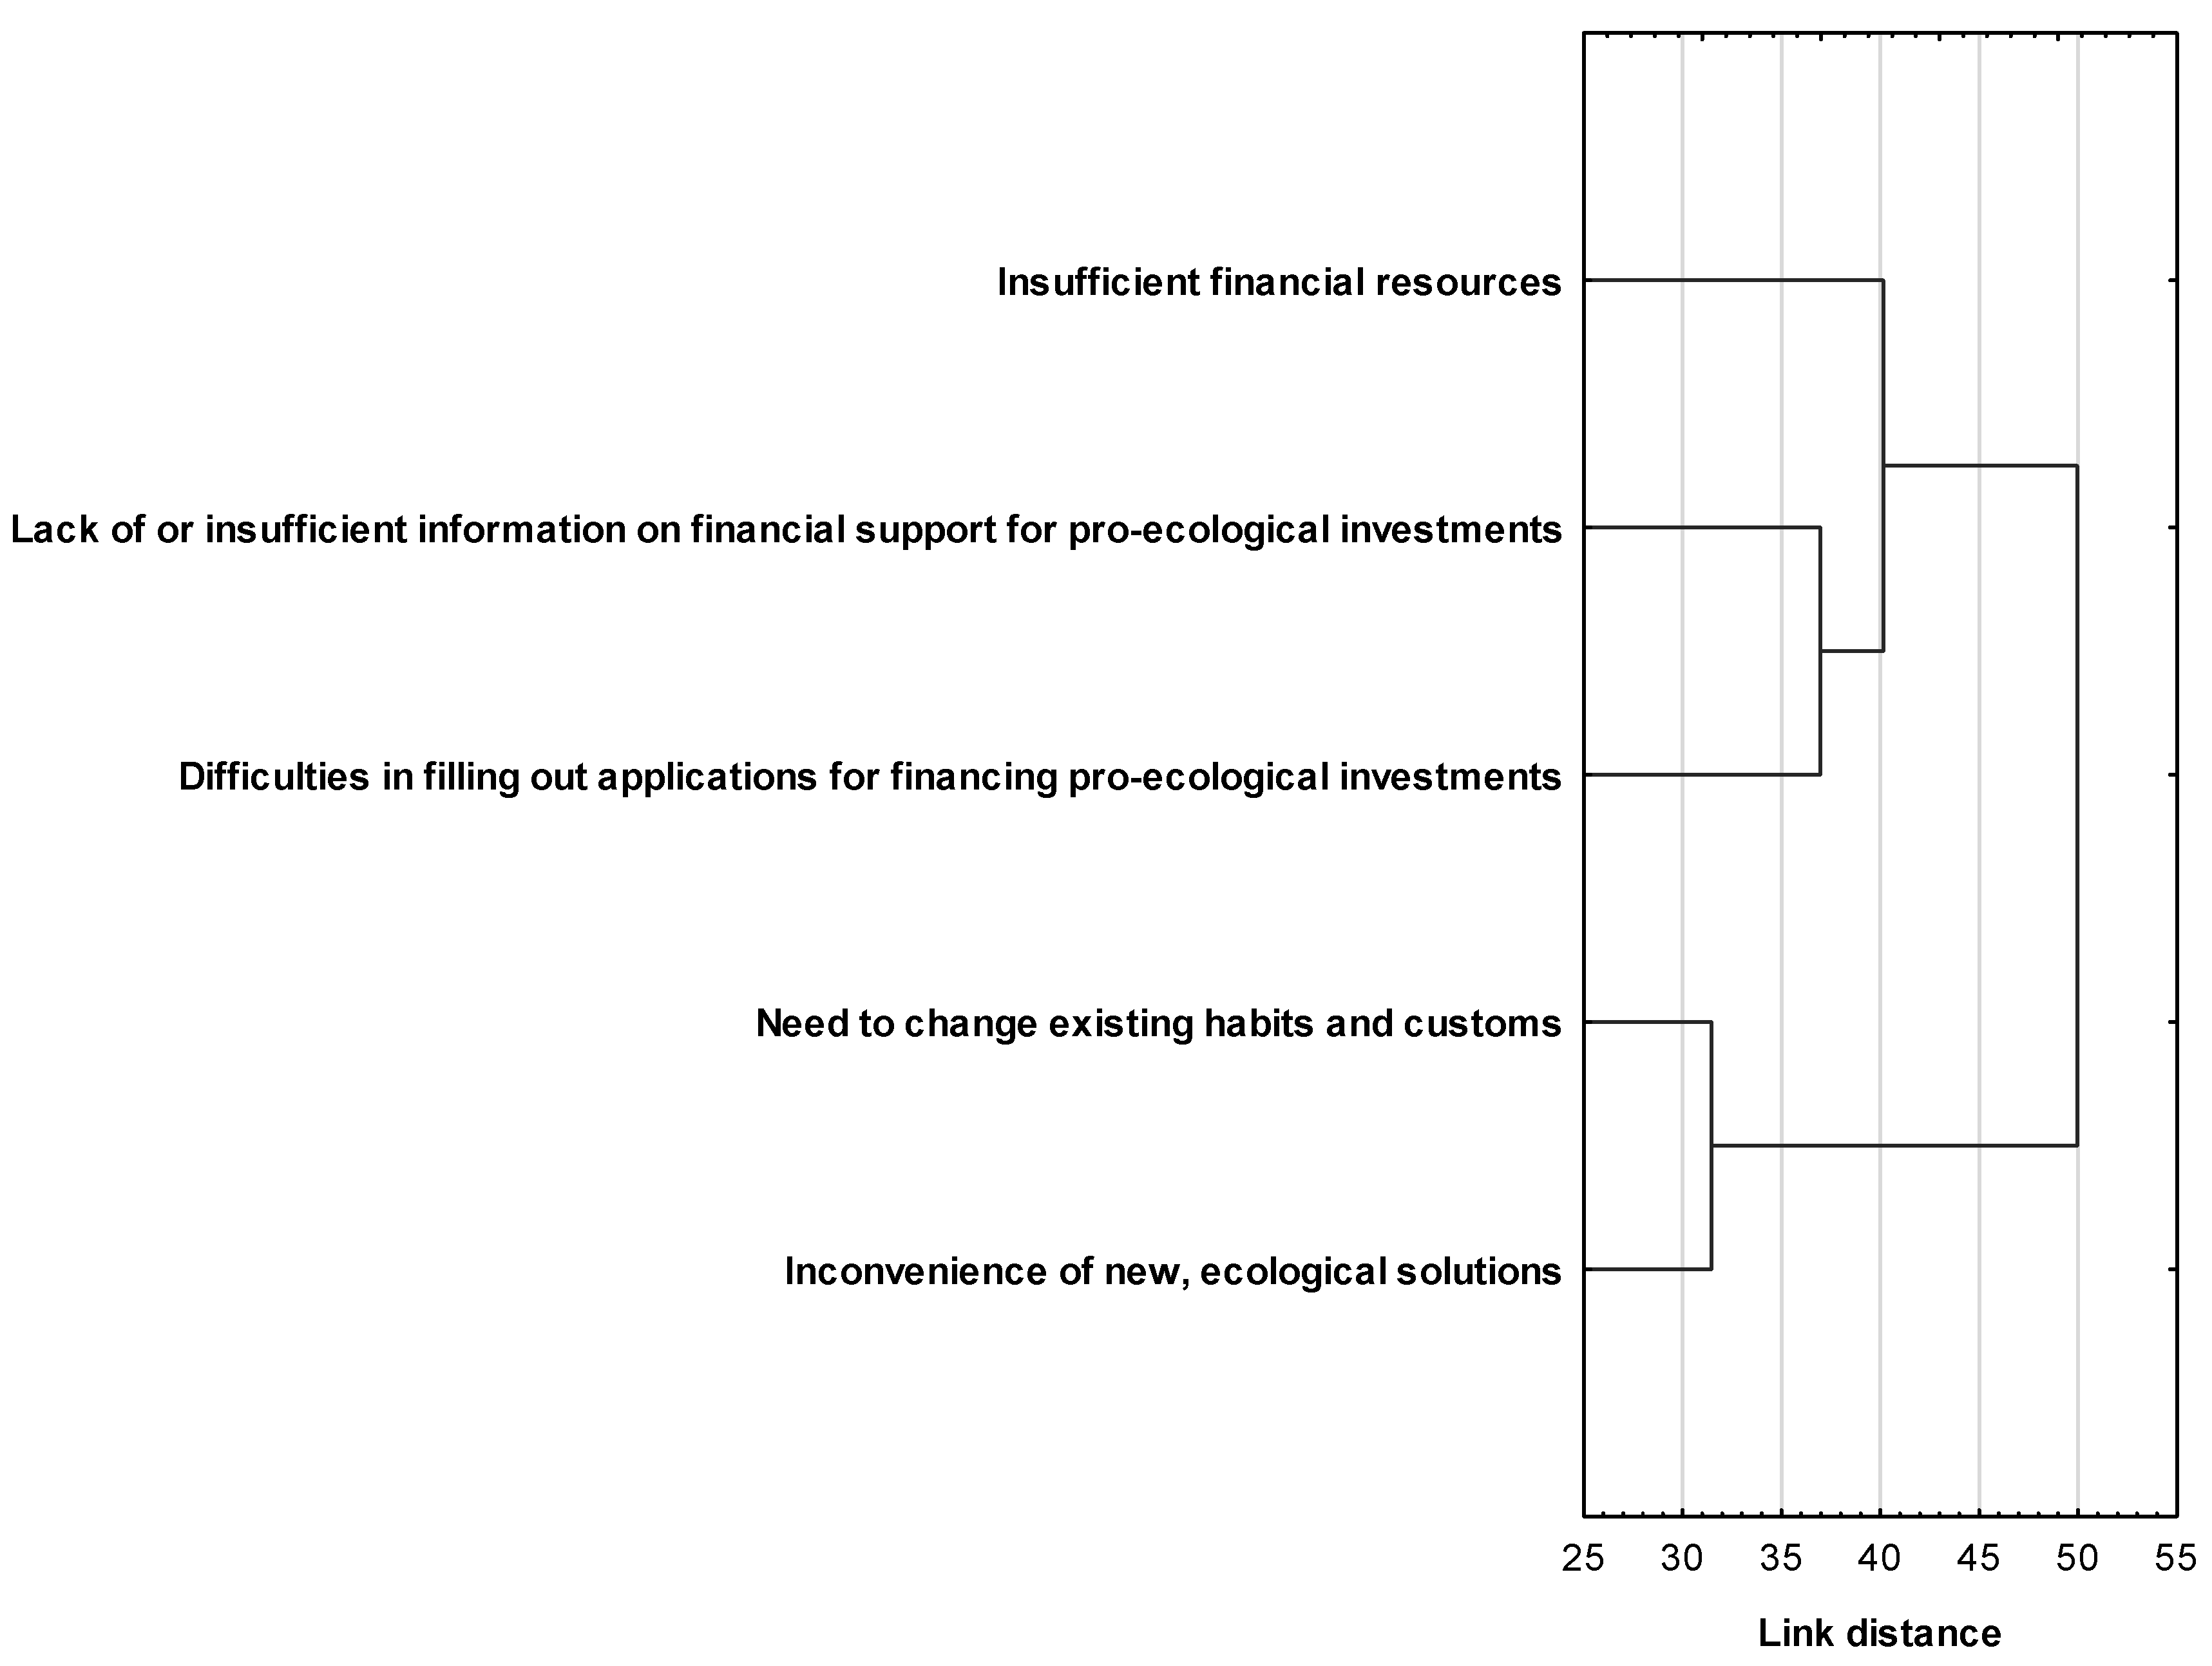
The cluster analysis identified similarities in terms of the degree of limitation of the researched undertaking of pro-ecological behaviors in the case of factors related to financial and formal issues, i.e., insufficient financial resources, lack of or insufficient information regarding financial support for pro-ecological investments and difficulties in filling out applications for funding of pro-ecological investments (one cluster). In addition, the analysis showed a similarity in the aforementioned limitations in the case of the need to change existing habits and customs and the inconvenience of new, ecological solutions (second cluster) (Figure 3). Taking into account the percentage distribution of ratings regarding the degree to which respondents were constrained in undertaking pro-ecological behaviors, it can be deduced that factors falling into the first cluster were a greater obstacle.
4.5. Opinions on the Degree of Positive Environmental Impact of Particular Pro-Ecological Behaviors
The respondents perceived a positive impact on the natural environment of most of the analyzed pro-health behaviors. When evaluating the degree of positive influence on the natural environment, most of the respondents indicated the highest rating (“5—very strong impact”) with respect to pro-environmental behaviors such as: harvesting rainwater and its subsequent use in the household (62.53%); garbage sorting (76.11%); using low-energy consuming appliances (61.01%); using reusable bags while shopping (72.95%); saving water (73.30%), electricity (72.83%), gas (67.56%) and paper (68.97%); and rational use of food (68.97%). Moreover, nearly half of the respondents (49.18%) rated very highly in this regard the behavior of choosing products that have environmentally friendly packaging.
Respondents were much more divided when it came to assessing the degree of positive impact on the environment of pro-ecological behaviors consisting of using public transportation and using a bicycle or electric scooter instead of a car and using natural detergents, with most people also rating the above behaviors highest (32.55%, 35.83% and 38.41% respectively). In contrast, respondents were most divided in their rating of buying second-hand items (ranging from 11.94% rating “1—poor impact” to 32.32% rating “3”) (Table 7).
4.6. Examining the Relationship between Opinions about the Degree of Positive Environmental Impact of Particular Pro-Ecological Behaviors and Engaging in Those Behaviors
The analysis using Spearman’s rank order correlation method showed that there were statistically significant and positive correlations between the opinions of the respondents about the degree of positive influence of particular pro-ecological behaviors on the natural environment and taking up these behaviors. This means that higher beliefs of the respondents about the positive influence of particular behaviors on the environment were accompanied by higher frequency of such actions. The strongest relationship in this regard was observed in the case of respondents’ buying second-hand items: R = 0.45; t(N − 2) = 14.67; p < 0.001. A slightly weaker relationship was observed for choosing products that have environmentally friendly packaging: R = 0.39; t(N − 2) = 12.25; p < 0.001; using a bicycle or electric scooter instead of a car: R = 0.38; t(N − 2) = 11.67; p < 0.001 and using natural detergents: R = 0.38; t(N − 2) = 11.99; p < 0.001. Next in terms of strength of association, environmentally friendly behaviors that significantly related to opinions about their positive environmental impact were the use of low-energy household appliances: R = 0.36; t(N − 2) = 11.15; p < 0.001; saving gas: R = 0.34; t(N − 2) = 8.18; p < 0.001; rainwater harvesting and its subsequent household use: R = 0.32; t(N − 2) = 9.21; p < 0.001; using public transport instead of car: R = 0.32; t(N − 2) = 9.58; p < 0.001; saving water: R = 0.31; t(N − 2) = 9.64; p < 0.001; using a reusable bag when shopping: R = 0.3; t(N − 2) = 9.29; p < 0.001 and saving electricity: R = 0.3; t(N − 2) = 9.16; p < 0.001. There was a slightly weaker association for the behaviors of saving paper: R = 0.24; t(N − 2) = 7.07; p < 0.001 and using food rationally: R = 0.24; t(N − 2) = 7.16; p < 0.001. In contrast, garbage sorting correlated most weakly with respondents’ beliefs about the environmental impact of this behavior: R = 0.12; t(N − 2) = 3.48; p < 0.001 (Table 8).
4.7. A Structural Model of Pro-Ecological Behavior in Relation to the Motivational and Limiting Factors for Undertaking Such Behavior
Finally, an attempt was made to build a structural model of pro-ecological behavior in relation to the motivational and limiting factors for engaging in this type of behavior. Various approaches to modeling human behavior can be found in the literature. One of them is Cumulative Prospect Theory (CPT), in which the assignment of weights is determined by value increments [63]. Some researchers combine this approach with Multi-Attribute Decision Making (MADM) theory, when CPT can be used to represent evaluations of different types of attributes and MADM can represent the process of making trade-offs between different conflicting criteria [64]. For the purpose of model building, this paper uses structural equations (SEM). Two models were developed as part of this analysis. Model I dealt with the influence of motivational factors on the frequency of undertaking particular pro-environmental behaviors, while Model II dealt with the limiting factors of undertaking pro-ecological behaviors, respectively. Both models had the same latent endogenous variables, defined by the same manifest (observable) variables. These latent endogenous variables were related to categories of pro-ecological behaviors based on shopping, saving, transport and management of resources activities. Table 9 shows the variables used in both models.
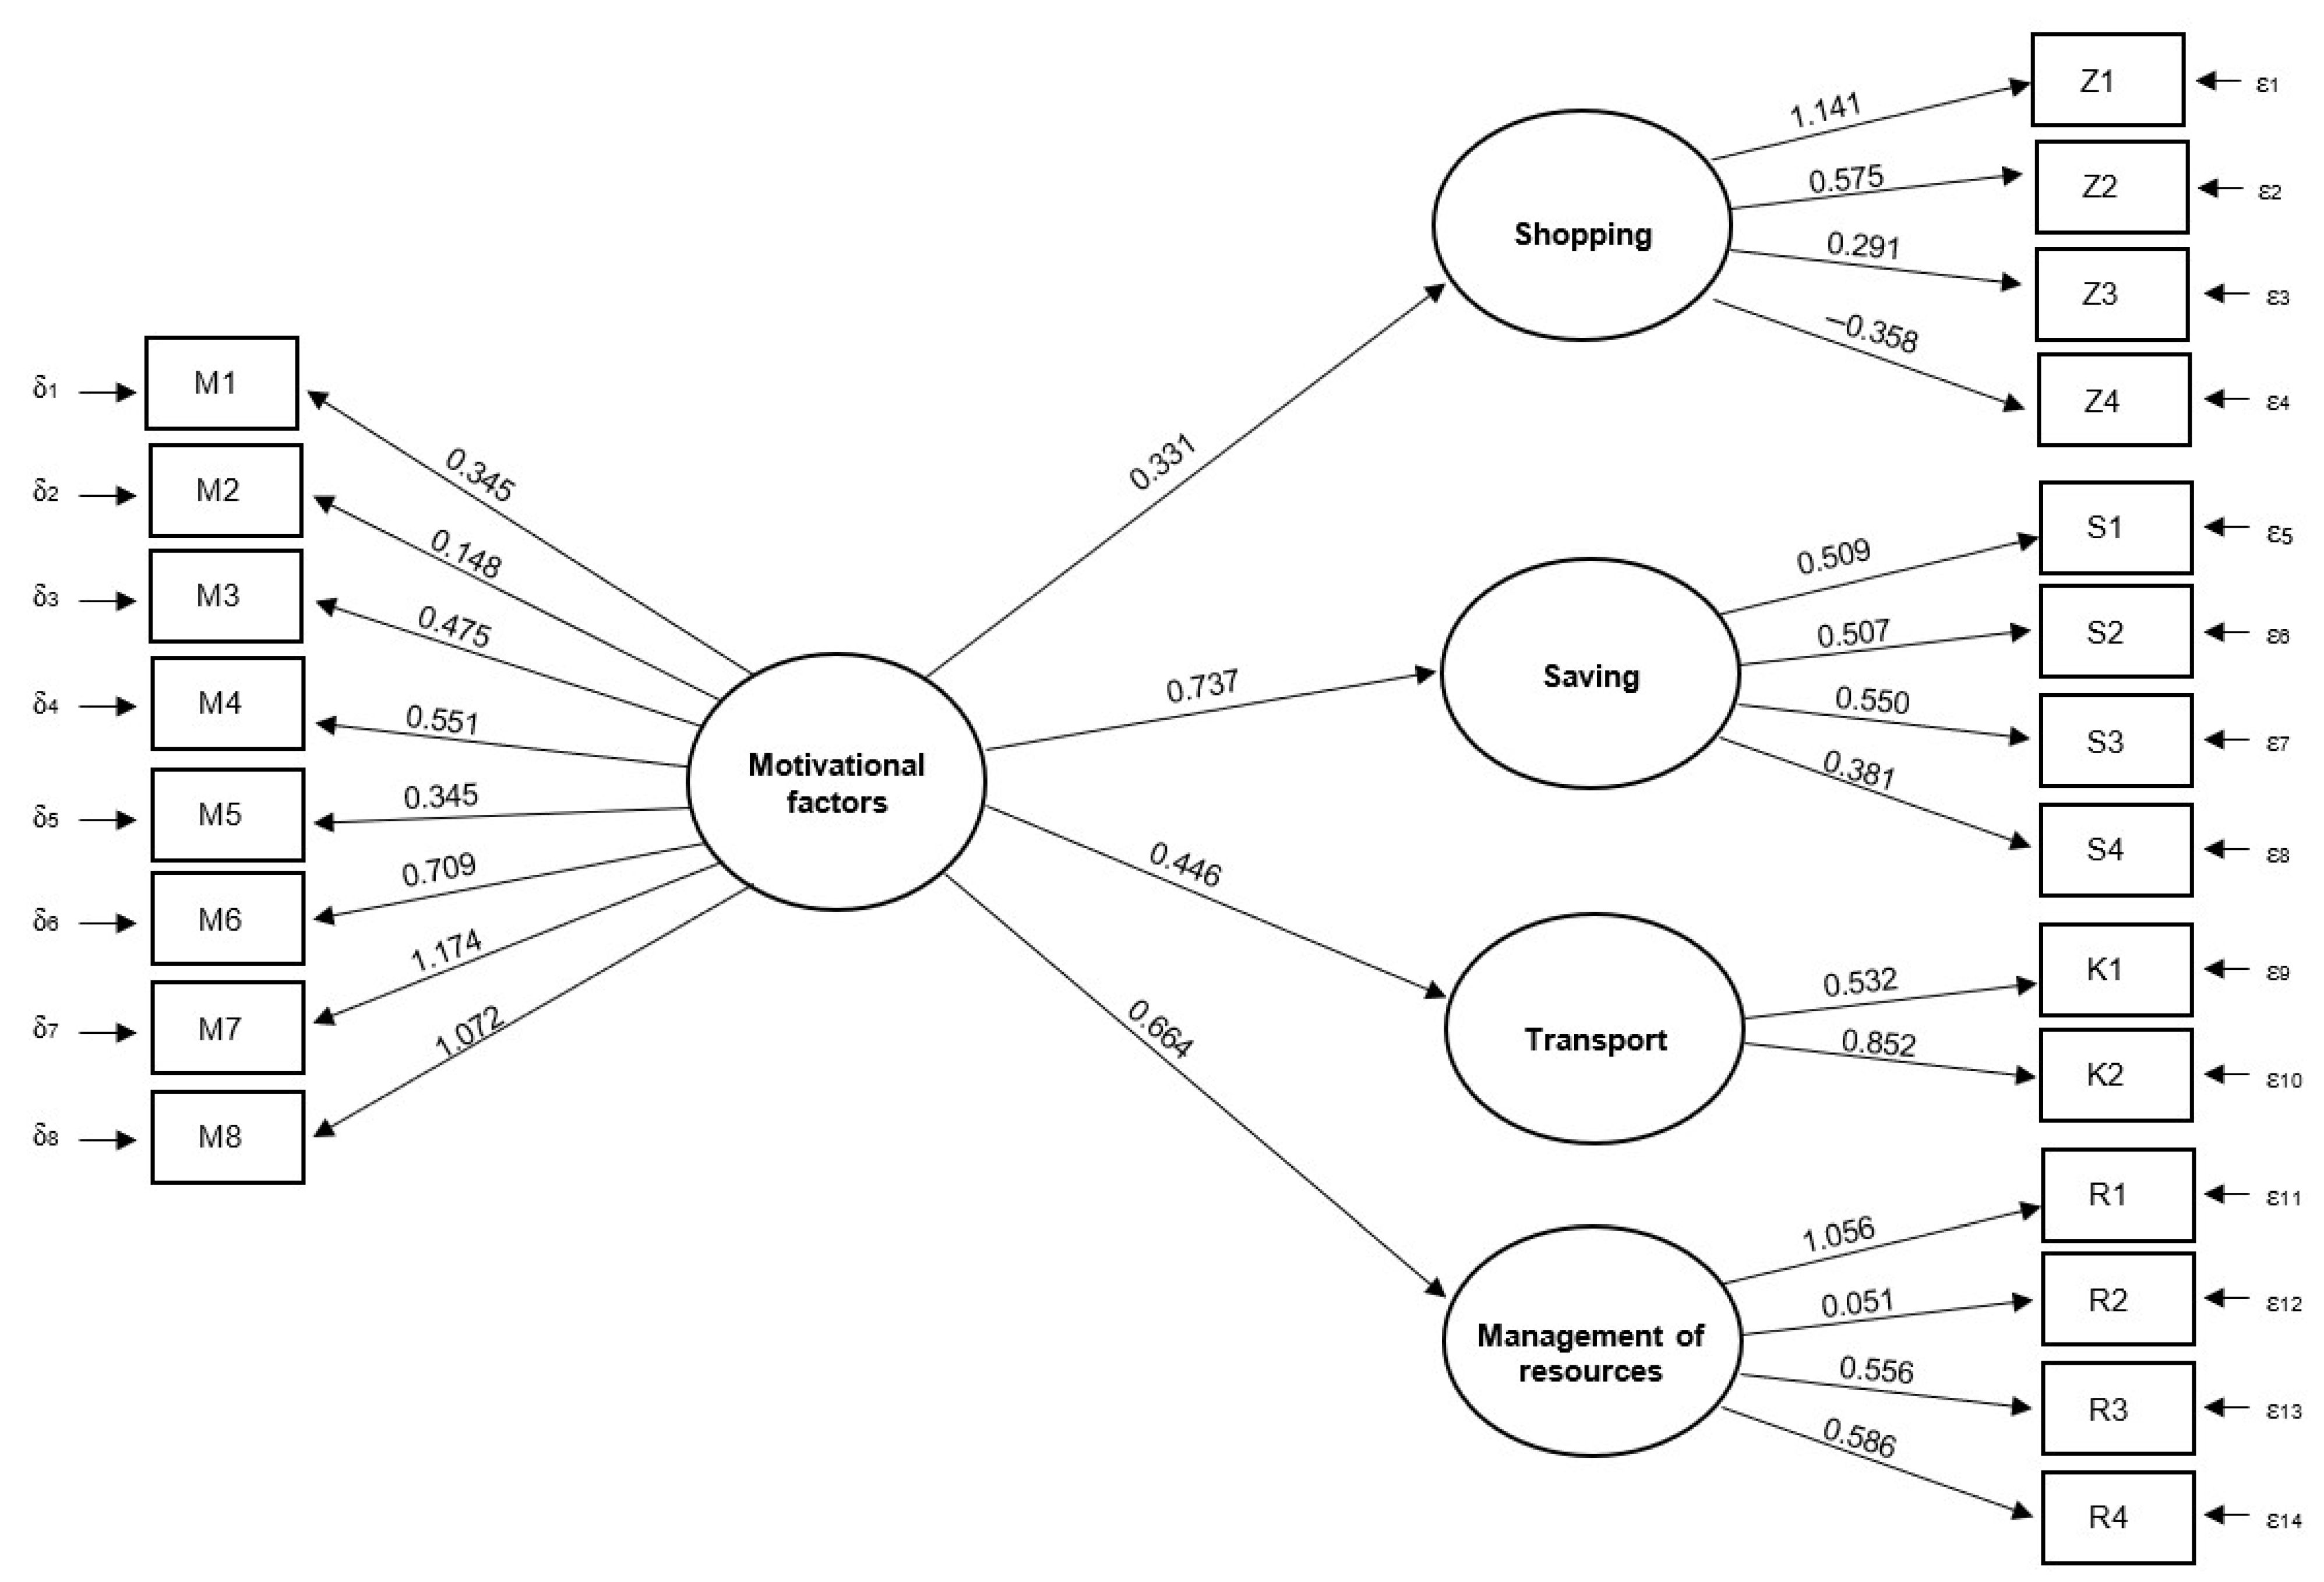
Model I revealed statistically significant relationships between the latent exogenous variable in the form of “Motivational Factors” and its indicator variables. Issues related to fashion and promotion of ecology were the most significant in describing the motivational factors, i.e., M7—desire to follow the trend (1.174) and M8—promotion of ecology (1.072). Opportunities to receive financial support also played a significant role in the motivational factors, i.e., M6—tax relief and government subsidies (0.709). Slightly less importance for motivational factors in pro-ecological behavior was recorded for indicator variables such as M4—legal requirements (0.551) and M3—convenience of new solutions (0.475). The next most significant variables in defining motivational factors were M1—care for the environment (0.345) and M5—financial factors (0.345). On the other hand, the variable M2—care for one’s health and that of one’s family (0.148) was the least important in describing motivational factors.
The measurement model of the endogenous variable in the form of “Shopping” was very strongly and statistically significantly defined by the indicator variable Z1—choosing products that have environmentally friendly packaging (1.141). The variable Z2—use of low-energy consuming household appliances (0.575) was less significant and Z3—use of reusable bag while shopping was the least significant, respectively. The variable Z4—buying second-hand items did not define, in a statistically significant way, pro-ecological behavior based on “Shopping”.
As for the endogenous variable “Saving”, it turned out to be most strongly and also statistically significantly defined by the manifest variables of saving gas—S3 (0.550) and electricity—S2 (0.507). A slightly smaller role in this respect was played by saving paper—S4 (0.381). On the other hand, saving water (S1) did not statistically significantly define the environmental behavior category “Saving”.
“Transport” as another category of pro-ecological behavior was defined only by using public transport instead of a car—K1 (0.532). This means that the respondents’ use of a bicycle or electric scooter instead of a car (K2) did not fit statistically significantly into the pro-ecological behavior of transport.
In contrast, “Management of resources” as the last category of pro-ecological behavior was statistically significantly and most strongly defined by R1—rainwater harvesting and subsequent household use (1.056). The above category of pro-ecological behavior was slightly less strongly defined by R3—use of natural detergents (0.556) and R4—rational use of food (0.586). The least significance in this respect was recorded for garbage sorting—R2 (0.051).
Analyzing the influence of the exogenous latent variable, i.e., “Motivational factors”, on the endogenous latent variables, i.e., individual categories of pro-ecological behavior, it should be concluded that motivation had the greatest influence on the “Saving” category (0.737). A slightly weaker influence of motivational factors was noted for the pro-ecological behaviors concerning “Transport” (0.446) and “Shopping” (0.331). In contrast, there was no statistically significant effect of motivational factors on the adoption of pro-ecological behaviors in the “Management of resources” category (Figure 4, Table 10 and Table 11). The analysis of the absolute values of the fit indices, i.e., GFI (0.91) and AGFI of Joreskog (0.89), showed an acceptable level of model fit.
In view of the above, it should be concluded that the motivation of the respondents (largely driven by fashion and trends) influenced them to undertake pro-ecological behaviors consisting primarily of making savings in their daily lives (i.e., electricity, gas and paper) and, to a lesser extent, activities related to shopping and transport. In contrast, the “Management of resources” category of pro-ecological behavior was unaffected by motivational factors.
The literature on behavioral economics includes studies that confirm that the choice of a certain human behavior is mainly dependent on time and potential financial results associated with the decision [65]. Another interesting example of human behavior can be the effect of psychological inertia, confirmed in the literature, which consists of choosing such a behavior that a person is already accustomed to [66]. However, referring to ecological behavior and the results of the present study, financial savings and habits alone are not indicated as the main reasons for the decisions made. At this point, it is worth referring to Prospect Theory, which is considered a better model for understanding decision making than traditional expected utility theory in many fields [67]. Viewed in this light, environmentally friendly behaviors [4,5,68,69], in the long run, can bring various value-added benefits (e.g., health, clean air, etc.) to the decision-making process.
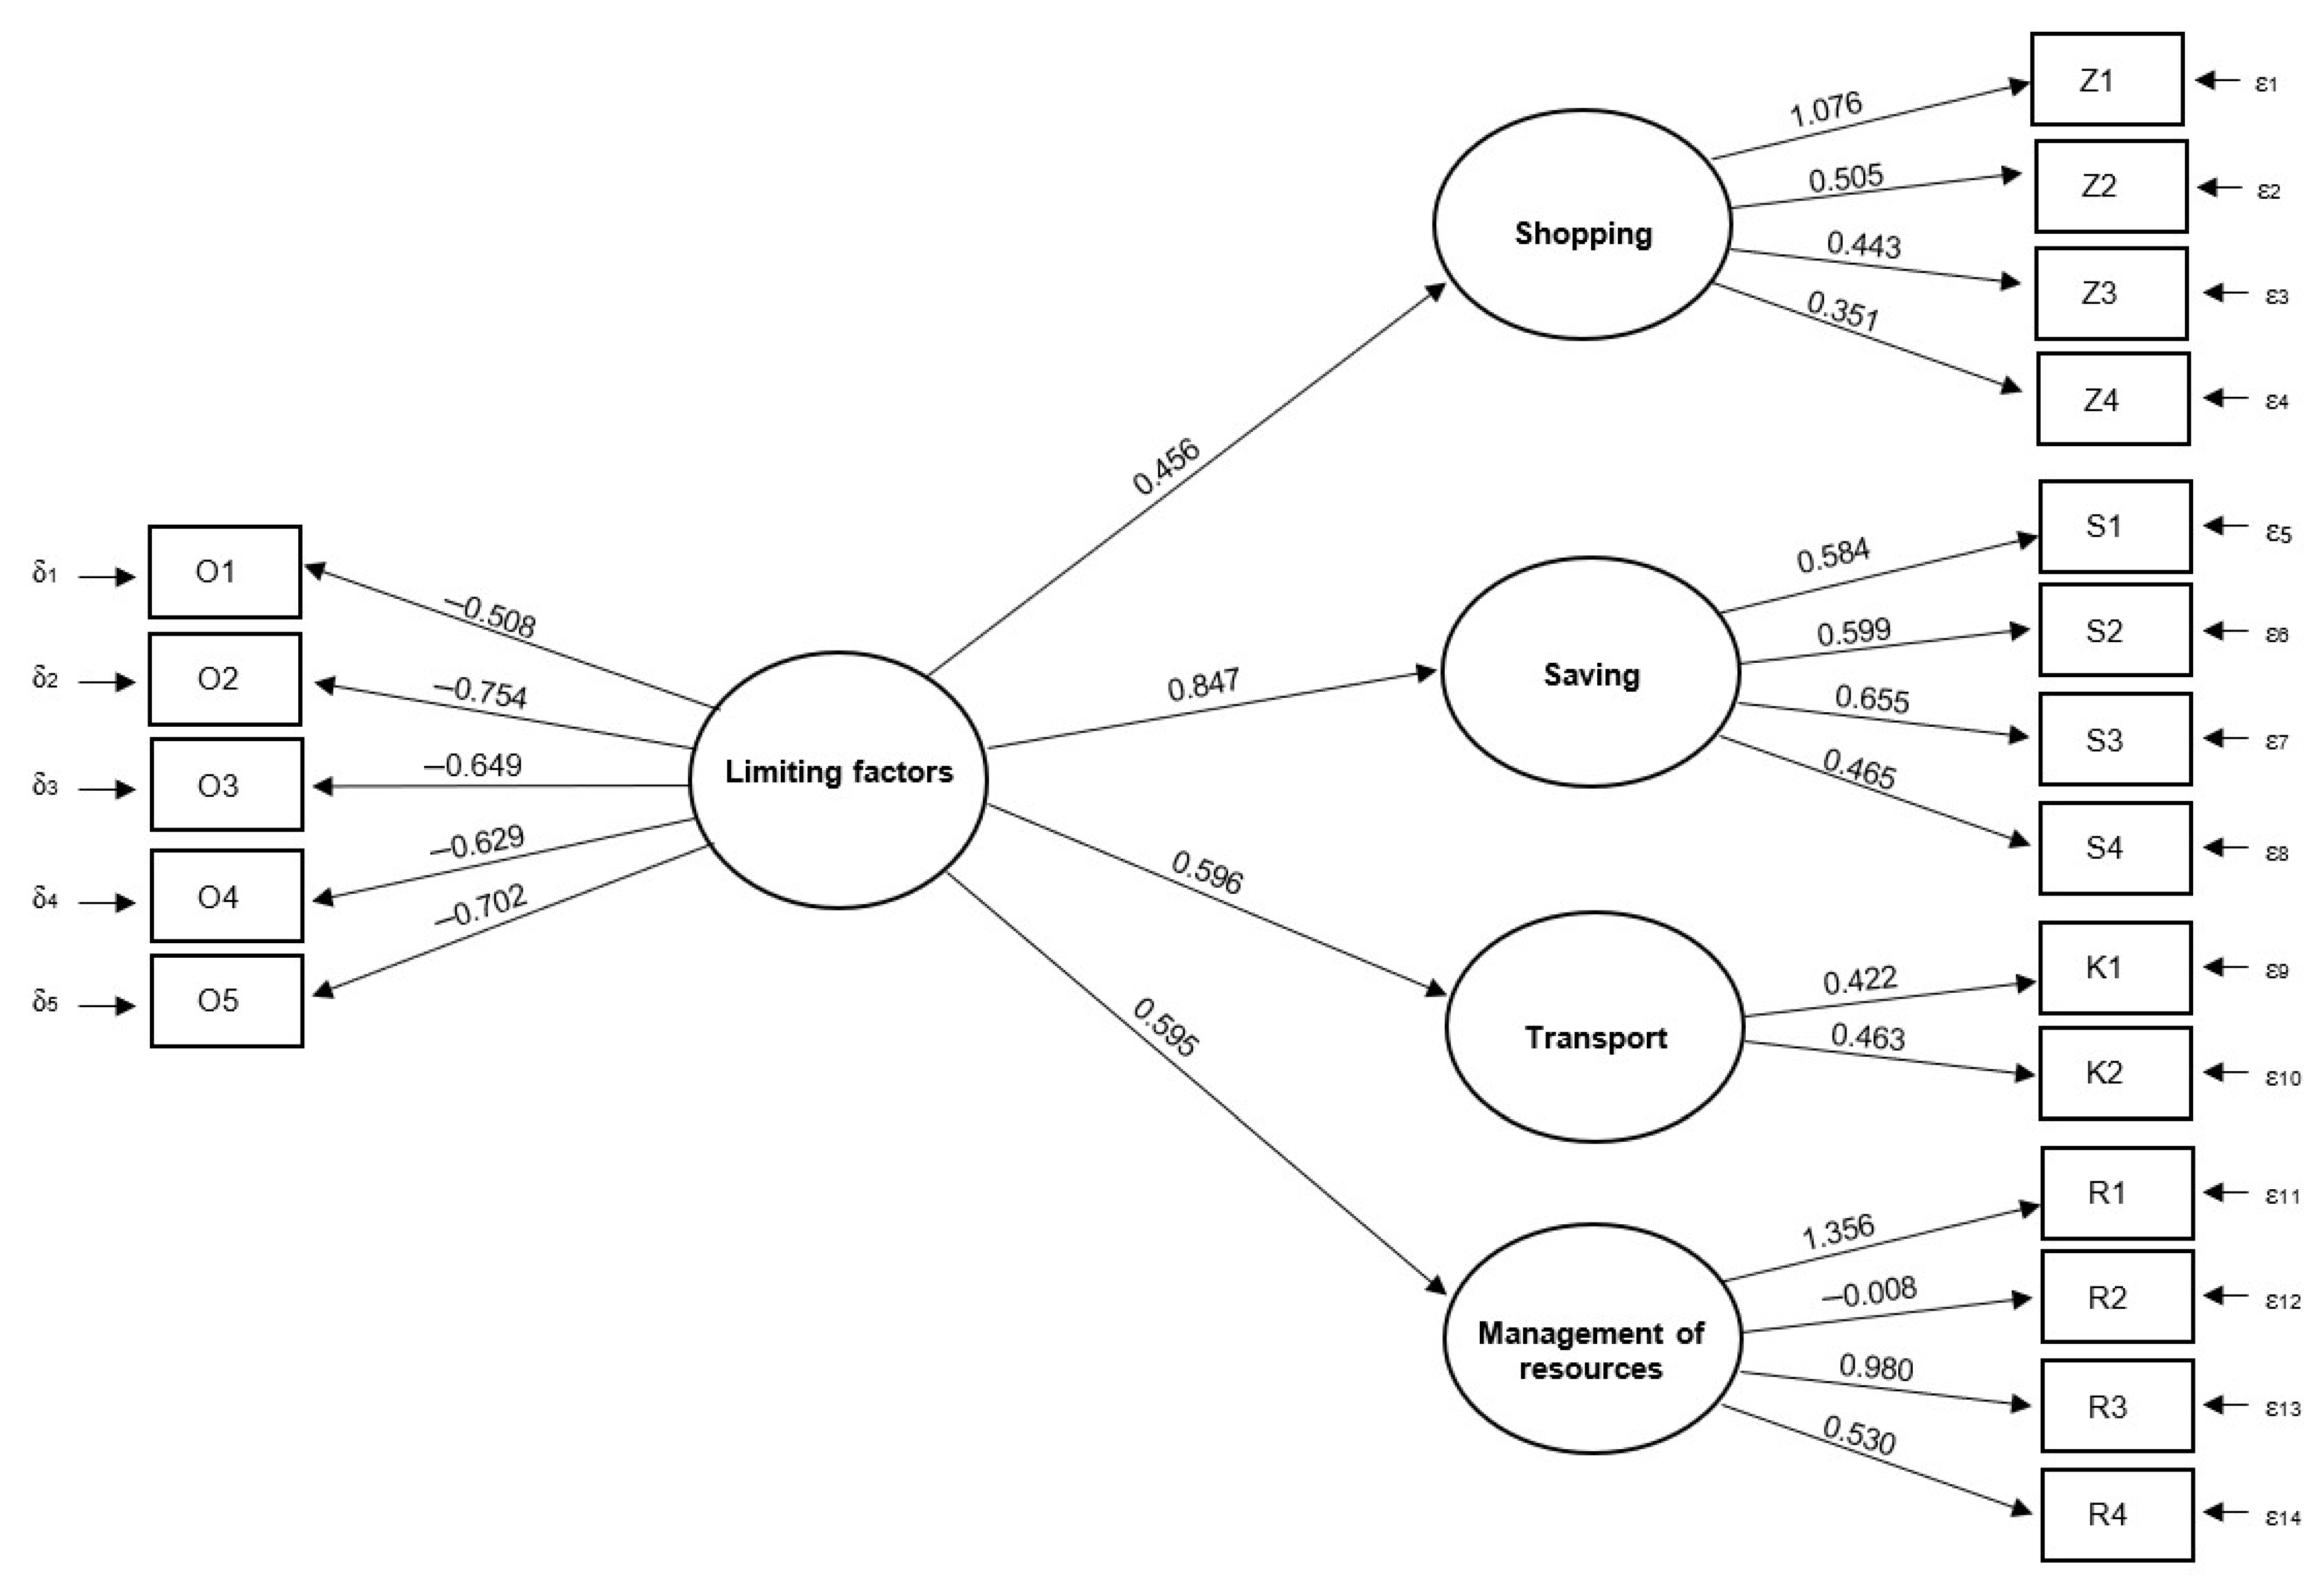
Model II analysis showed statistically significant relationships between the latent exogenous variables in the form of “Limiting Factors” and its index variables. The variables O2—lack or insufficient information on financial support for pro-ecological investments (−0.754) and O5—inconvenience of new, ecological solutions (−0.702) were of the greatest importance in defining the limitations in undertaking pro-ecological behaviors by the respondents. An important role in describing the limiting factors was also played by explicit variables in the form of difficulties in filling in applications for co-financing pro-ecological investments—O3 (−0.649) and the need to change existing habits—O4 (−0.629). On the other hand, the variable O1—insufficient financial resources (–0.508) was of the least importance for limiting pro-ecological behavior.
In the case of the latent endogenous variable related to “Shopping”, the greatest importance was noted for its definition (as in Model I) in the case of the Z1 variable—the selection of products that have environmentally friendly packaging (1.076). A minor role in describing the above-mentioned environmental behavior categories was assigned to the variables Z2—use of household appliances with low energy consumption (0.505) and Z3—use of a reusable bag while shopping (0.443). On the other hand, the least significance for determining “Shopping” occurred in the case of the variable Z4—buying second-hand items (0.351).
The category of pro-ecological behavior “Saving” was described primarily by the manifest variable S3—saving gas (0.655). The variable S2—saving electricity (0.599) was of slightly less importance. The least significant variable in this respect was S4—saving paper (0.465). On the other hand, no statistically significant significance of saving water—S1 was observed for defining the above-mentioned categories of pro-ecological behavior.
The latent endogenous variable “Transport” as a category of pro-ecological behavior was statistically significant and to a similar extent determined by both variables, i.e., K1—use of public transport instead of a car (0.422) and K2—use of a bicycle or an electric scooter instead of a car.
On the other hand, the category of “Management of resources” was strongly and statistically significantly defined by the observable variable R1—rainwater harvesting and subsequent use in the household (1.356). In the case of the variable R4—rational use of food, slightly less importance was noted in describing the above-mentioned health behavior categories (0.530). On the other hand, no statistically significant significance for “Management of resources” was found within the variables R2—garbage sorting and R3—the use of natural detergents.
From the analysis of the impact of the latent exogenous variable “Limiting factors” on latent endogenous variables, i.e., individual categories of pro-ecological behavior, it should be concluded that the limitations primarily affect environmental behavior related to the category “Saving” (0.847) and, slightly less, “Management of resources” (0.595). On the other hand, no statistically significant influence of limiting factors on undertaking pro-ecological behavior in the categories of “Shopping” and “Transport” was noted (Figure 5, Table 12 and Table 13). Model II was fitted at an acceptable level, which was found on the basis of the analysis of the absolute values of the fitting indices, i.e., GFI (0.86) and AGFI of Joreskog (0.83).
To sum up, the limitations (mainly in the form of problems with obtaining financial support for pro-ecological investments and the inability to introduce changes in everyday life, including the inconvenience of ecological solutions) affected primarily their pro-ecological behavior related to saving (i.e., electricity, gas and paper), and slightly less on resource management activities (i.e., rainwater harvesting and food rationality). Environmental behavior related to shopping and transport remained beyond the influence of limiting factors.
5. Conclusions
The model presented in the article is of theoretical and practical character. On the one hand, it allows us to get acquainted with the results of the survey conducted and to indicate which pro-ecological behaviors are carried out and considered important by the inhabitants of Poland. On the other hand, the indicated barriers in taking up pro-ecological behaviors are a kind of practical guidelines for the Polish government, which can use them, for more effective actions, to promote and facilitate taking up pro-ecological behaviors by Polish citizens. The statistical analysis and models developed allowed the following conclusions to be formulated.
In Poland, the most frequently undertaken pro-ecological behaviors are: garbage sorting, use of low-energy consuming household appliances and use of reusable bags while shopping. An important role is also played by saving water, electricity and paper. It is worth noting that pro-ecological attitudes should be shaped from an early age, so that they bring results when a given generation enters adult life. Good examples that shape such attitudes in Poland are, e.g., ecological campaigns conducted by large, well-known companies or organizing ecological workshops in the form of games for the youngest generation.
Pro-ecological behavior is motivated mainly by such factors as: taking care of one’s own and one’s family’s health, taking care of the natural environment and financial factors. This partially confirms the hypothesis of the study, because caring about health is slightly more important for the respondents than caring about the environment. Nevertheless, health and environment exist in a natural symbiosis with each other, because the cleaner the environment, the lower the rate of various diseases. Therefore, it can be concluded that care for the environment will be linked to the health of the whole society.
The main obstacle to Poles taking up pro-ecological behaviors is related to insufficient financial resources. Lack of adequate information on financial support for pro-ecological investments and difficulties in filling out applications for financing such investments are also important in this respect. Therefore, it is very important to organize stationary, Internet and telephone support points for people applying for co-financing of pro-ecological investments. Such points would help these people to apply for the funds by providing advice and assistance in filling in formal applications.
Almost all pro-ecological behaviors are considered important in Poland in terms of environmental protection, with the most prominent being garbage sorting, using reusable bags while shopping and saving water and electricity. The idea of a closed-loop economy and its benefits for environmental protection is playing an increasingly important role in the environmental awareness of Polish citizens. Any recovery of raw materials in a closed-loop process is an ecological benefit and does not require industrial activities that disrupt the environment and may harm human existence.
The beliefs of Polish women and men about the impact of particular pro-ecological behaviors on the environment go hand in hand with their actions in this regard. On this basis, it can be concluded that Polish society is interested in pro-ecological activities and their potential impact on the environment. Additionally, it is willing to take practical actions in this regard. Therefore, some industrial activities require public consultation so that the concerns raised at the approval level are already taken into account at the design stage.
The urge to follow the trend (growing popularity of ecology) and promotion of ecology in the media as motivational factors in pro-ecological behaviors are the most effective, especially in relation to behaviors consisting of saving electricity, gas and paper. Most of the ecological campaigns conducted in Poland involve making the public aware of how simple changes in habits and technical upgrades can affect the improvement of the environment. The authors propose to extend and produce more detailed pro-ecological campaigns, so that the trend of popularity of ecology is not associated mainly with saving electricity, gas and paper.
Problems with obtaining co-financing for pro-ecological investments, lack of skills or willingness to change existing habits and the inconvenience of ecological solutions as factors limiting the undertaking of pro-ecological behaviors constitute the greatest obstacle, in particular with regard to this type of behavior consisting in saving electricity, gas and paper (this applies to the management of resources by collecting rainwater for later use and rational use of food). Therefore, it is very important to promote and encourage pro-ecological activities that will continuously increase the awareness of nurturing the natural environment. The progressing climate change requires society to actively engage in initiatives that improve the condition of nature. Entities which, due to their activities, have pro-ecological statutory provisions, such as municipal waste collectors, recycling companies, water and sewage companies and others, have a significant role to play here.
6. Limitations and Future Research
The article has some limitations. Firstly, the research was conducted only on the territory of Poland. Secondly, it was carried out over a period of a high upward trend in the popularity of pro-ecological behavior in this country. The authors wanted to verify the effects of numerous pro-ecological campaigns and check whether the ecological trend is visible only in the media, or whether it translates in practice into the feelings and actions of the Poles. It is worth considering the possibility of conducting similar studies in other countries, not only in Europe, but also on other continents, in order to compare the determinants of pro-ecological behavior and concern for the future of our planet. The knowledge obtained in this way and the expectations of societies could be very useful for a better formulation of the assumptions of systematic activities in the field of environmental protection.
Author Contributions
Conceptualization, J.O. and J.K.; methodology, J.O. and J.K.; software, J.O.; validation, J.O. and J.K.; formal analysis, J.O. and J.K.; writing—original draft preparation, J.O. and J.K.; writing—review and editing, J.O. and J.K.; visualization, J.O. and J.K.; supervision, J.O. and J.K. All authors have read and agreed to the published version of the manuscript.
Funding
This research received no external funding.
Conflicts of Interest
The authors declare no conflict of interest.
References
- Cele Zrównoważonego Rozwoju. Available online: https://www.gov.pl/web/polskapomoc/cele-zrownowazonego-rozwoju (accessed on 18 November 2021).
- Co Się Udało Zmienić na Świecie w 15 Lat? Milenijne Cele Rozwoju. Available online: http://globalnepoludnie.pl/Co-sie-udalo-zmienic-na-swiecie-w (accessed on 15 November 2021).
- Youmatter. Sustainable Development—What Is It? Definition, History, Evolution, Importance and Examples. Available online: https://youmatter.world/en/definition/definitions-sustainable-development-sustainability/ (accessed on 16 November 2021).
- Balińska, A.; Jaska, E.; Werenowska, A. The Role of Eco-Apps in Encouraging Pro-Environmental Behavior of Young People Studying in Poland. Energies 2021, 14, 4946. [Google Scholar] [CrossRef]
- Parzonko, A.J.; Balińska, A.; Sieczko, A. Pro-Environmental Behaviors of Generation Z in the Context of the Concept of Homo Socio-Oeconomicus. Energies 2021, 14, 1597. [Google Scholar] [CrossRef]
- Sargisson, R.J.; De Groot, J.I.M.; Steg, L. The Relationship Between Sociodemographics and Environmental Values Across Seven European Countries. Front. Psychol. 2020, 11, 2253. [Google Scholar] [CrossRef]
- Bridges, C.M.; Wilhelm, W.B. Going Beyond Green: The “Why and How” of Integrating Sustainability Into the Marketing Curriculum. J. Mark. Educ. 2008, 30, 33–46. [Google Scholar] [CrossRef]
- Halder, P.; Hansen, E.N.; Kangas, J.; Laukkanen, T. How national culture and ethics matter in consumers’ green consumption values. J. Clean. Prod. 2020, 265, 121754. [Google Scholar] [CrossRef]
- Joshi, Y.; Rahman, Z. Factors Affecting Green Purchase Behaviour and Future Research Directions. Int. Strateg. Manag. Rev. 2015, 3, 128–143. [Google Scholar] [CrossRef] [Green Version]
- Han, H. Theory of green purchase behavior (TGPB): A new theory for sustainable consumption of green hotel and green restaurant products. Bus. Strategy Environ. 2020, 29, 2815–2828. [Google Scholar] [CrossRef]
- Ramkissoon, H.; Smith, L.D.G.; Weiler, B. Testing the dimensionality of place attachment and its relationships with place satisfaction and pro-environmental behaviours: A structural equation modelling approach. Tour. Manag. 2013, 36, 552–566. [Google Scholar] [CrossRef] [Green Version]
- Walker, I.; Leviston, Z.; Price, J.; Devine-Wright, P. Responses to a worsening environment: Relative deprivation mediates between place attachments and behaviour. Eur. J. Soc. Psychol. 2015, 45, 833–846. [Google Scholar] [CrossRef]
- Gu, D.; Jiang, J.; Zhang, Y.; Sun, Y.; Jiang, W.; Du, X. Concern for the future and saving the earth: When does ecological resource scarcity promote pro-environmental behavior? J. Environ. Psychol. 2020, 72, 101501. [Google Scholar] [CrossRef]
- Wang, S.; Wang, J.; Li, J.; Yang, F. Do motivations contribute to local residents’ engagement in pro-environmental behaviors? Resident-destination relationship and pro-environmental climate perspective. J. Sustain. Tour. 2020, 28, 834–852. [Google Scholar] [CrossRef]
- Chudziński, P.; Cyfert, S.; Dyduch, W.; Zastempowski, M. Key sur(VIR)val factors in water supply companies: Some lessons from Poland. J. Water Supply Res. Technol. Aqua 2021, 70, 89–98. [Google Scholar] [CrossRef]
- Brodny, J.; Tutak, M.; Michalak, M. A Data Warehouse as an Indispensable Tool to Determine the Effectiveness of the Use of the Longwall Shearer. In Beyond Databases, Architectures and Structures. Towards Efficient Solutions for Data Analysis and Knowledge Representation; Kozielski, S., Mrozek, D., Kasprowski, P., Małysiak-Mrozek, B., Kostrzewa, D., Eds.; Springer: Cham, Switzerland, 2017; pp. 453–465. [Google Scholar] [CrossRef]
- Hopkins, D. Sustainable mobility at the interface of transport and tourism. J. Sustain. Tour. 2020, 28, 129–143. [Google Scholar] [CrossRef]
- Yue, B.; Sheng, G.; She, S.; Xu, J. Impact of Consumer Environmental Responsibility on Green Consumption Behavior in China: The Role of Environmental Concern and Price Sensitivity. Sustainability 2020, 12, 2074. [Google Scholar] [CrossRef] [Green Version]
- Musova, Z.; Musa, H.; Matiova, V. Environmentally responsible behaviour of consumers: Evidence from Slovakia. Econ. Sociol. 2021, 14, 178–198. [Google Scholar] [CrossRef]
- Dagher, G.K.; Itani, O. Factors influencing green purchasing behaviour: Empirical evidence from the Lebanese consumers. J. Consum. Behav. 2014, 13, 188–195. [Google Scholar] [CrossRef] [Green Version]
- Steg, L.; Vlek, C. Encouraging pro-environmental behaviour: An integrative review and research agenda. J. Environ. Psychol. 2009, 29, 309–317. [Google Scholar] [CrossRef]
- Garvey, A.M.; Bolton, L.E. Eco-Product Choice Cuts Both Ways: How Proenvironmental Licensing versus Reinforcement is Contingent on Environmental Consciousness. J. Public Policy Mark. 2017, 36, 284–298. [Google Scholar] [CrossRef]
- Krajhanzl, J. Environmental and Proenvironmental Behavior. In Health Education: International Experiences; Řehulka, E., Ed.; Masarykova Univerzita, MSD: Brno, Czech Republic, 2010; pp. 251–274. [Google Scholar]
- Kaiser, F.G.; Wölfing, S.; Fuhrer, U. Environmental attitude and ecological behavior. J. Environ. Psychol. 1999, 19, 1–19. [Google Scholar] [CrossRef] [Green Version]
- Clayton, S.; Myers, G. Conservation Psychology: Understanding and Promoting Human Care for Nature; Wiley-Blackwell: New York, NY, USA, 2015. [Google Scholar]
- Black, I.R.; Cherrier, H. Anti-consumption as part of living a sustainable lifestyle: Daily practices, contextual motivations and subjective values. J. Consum. Behav. 2010, 9, 437–453. [Google Scholar] [CrossRef]
- Park, E.; Lee, S.; Lee, C.-K.; Kim, J.S.; Kim, N.-J. An integrated model of travelers’ pro-environmental decision-making process: The role of the New Environmental Paradigm. Asia Pac. J. Tour. Res. 2018, 23, 935–948. [Google Scholar] [CrossRef]
- Aktualności. Parlament Europejski. Gospodarka o Obiegu Zamkniętym: Definicja, Znaczenie i Korzyści (Wideo). Available online: https://www.europarl.europa.eu/news/pl/headlines/economy/20151201STO05603/gospodarka-o-obiegu-zamknietym-definicja-znaczenie-i-korzysci-wideo (accessed on 15 November 2021).
- Komisja Europejska. Europejski Zielony Ład. Available online: https://ec.europa.eu/info/strategy/priorities-2019-2024/european-green-deal_pl (accessed on 15 November 2021).
- Dyrektywa Europejska z Dnia 19 Listopada 2008. Opublikowano w Dzienniku Urzędowym Unii Europejskiej 22 listopada 2008. Available online: https://www.teraz-srodowisko.pl/prawo/dyrektywa-europejska-z-dnia-19-11-2008-l-312-3-163.html (accessed on 15 November 2021).
- Wojciechowski, T. Ku Gospodarce o Obiegu Zamkniętym. Available online: http://www.forum-dyrektorow.pl/zipy/mat,serock,2017/6,Ku,gospodarce,w,obiegu,zamknietym,tomasz-Wojciechowski.pdf (accessed on 15 November 2021).
- Nasze Śmieci. Zero Waste—Sztuka Samoograniczenia w Służbie Ochrony Środowiska. Available online: https://naszesmieci.mos.gov.pl/materialy/artykuly/134-zero-waste-sztuka-samoograniczania-w-sluzbie-ochrony-srodowiska (accessed on 15 November 2021).
- Zero Waste w Polsce—Popularność Idei Rośnie, Ale Powoli. Available online: https://sozosfera.pl/srodowisko-i-gospodarka/zero-waste-w-polsce-popularnosc-idei-rosnie-ale-powoli/ (accessed on 15 November 2021).
- Kiatkawsin, K.; Han, H. Young travelers’ intention to behave pro-environmentally: Merging the value-belief-norm theory and the expectancy theory. Tour. Manag. 2017, 59, 76–88. [Google Scholar] [CrossRef]
- Trang, H.L.T.; Lee, J.-S.; Han, H. How do green attributes elicit pro-environmental behaviors in guests? The case of green hotels in Vietnam. J. Travel Tour. Mark. 2019, 36, 14–28. [Google Scholar] [CrossRef]
- Ramkissoon, H.; Smith, L.D.G.; Weiler, B. Relationships between place attachment, place satisfaction and pro-environmental behaviour in an Australian national park. J. Sustain. Tour. 2013, 21, 434–457. [Google Scholar] [CrossRef]
- Afifah, N.; Asnan, A. The Impact of Corporate Social Responsibility, Service Experience and Intercultural Competence on Customer Company Identification, Customer Satisfaction and Customer Loyalty (Case Study: PDAM Tirta Khatulistiwa Pontianak West Kalimantan). Procedia Soc. Behav. Sci. 2015, 211, 277–284. [Google Scholar] [CrossRef] [Green Version]
- Choi, H.; Jang, J.; Kandampully, J. Application of the extended VBN theory to understand consumers’ decisions about green hotels. Int. J. Hosp. Manag. 2015, 51, 87–95. [Google Scholar] [CrossRef]
- Werner, K.; Griese, K.-M.; Bosse, C. The role of slow events for sustainable destination development: A conceptual and empirical review. J. Sustain. Tour. 2021, 29, 1913–1931. [Google Scholar] [CrossRef]
- Moon, S.-J. Investigating beliefs, attitudes, and intentions regarding green restaurant patronage: An application of the extended theory of planned behavior with moderating effects of gender and age. Int. J. Hosp. Manag. 2021, 92, 102727. [Google Scholar] [CrossRef]
- Paiano, A.; Crovella, T.; Lagioia, G. Managing sustainable practices in cruise tourism: The assessment of carbon footprint and waste of water and beverage packaging. Tour. Manag. 2020, 77, 104016. [Google Scholar] [CrossRef]
- Jeong, E.H.; Jang, S.; Day, J.; Ha, S. The impact of eco-friendly practices on green image and customer attitudes: An investigation in a café setting. Int. J. Hosp. Manag. 2014, 41, 10–20. [Google Scholar] [CrossRef]
- Untaru, E.-N.; Ispas, A.; Candrea, A.N.; Luca, M.; Epuran, G. Predictors of individuals’ intention to conserve water in a lodging context: The application of an extended Theory of Reasoned Action. Int. J. Hosp. Manag. 2016, 59, 50–59. [Google Scholar] [CrossRef]
- Polski Instytut Ekonomiczny. Unia Europejska Odpowiada za Ok. 12 Proc. Światowej Produkcji Odpadów Komunalnych. Available online: https://pie.net.pl/unia-europejska-odpowiada-za-ok-12-proc-swiatowej-produkcji-odpadow-komunalnych/ (accessed on 15 November 2021).
- Teraz Środowisko. Ile Odpadów Wytwarza Statystyczny Polak? Statystyka za 2020r. Available online: https://www.teraz-srodowisko.pl/aktualnosci/gus-ochrona-srodowiska-w-2020-odpady-komunalne-10550.html (accessed on 15 November 2021).
- Oficjalna strona internetowa Unii Europejskiej. Gotowi na 55. Available online: https://ec.europa.eu/poland/news/210714_egd_pl (accessed on 15 November 2021).
- EU Monitor. COM(2020)562—Communication Stepping up Europe’s 2030 Climate Ambition Investing in a Climate-Neutral Future for the Benefit of Our People. Available online: https://www.eumonitor.eu/9353000/1/j9vvik7m1c3gyxp/vlc5eg5ecoxn (accessed on 15 November 2021).
- NRC Freshwater. Water Management in Europe: Price and Non-Price Approaches to Water Conservation. Available online: https://forum.eionet.europa.eu/nrc-eionet-freshwater/library/other-reports-and-assessments/water-management-europe-price-and-non-price-approaches-water-conservation (accessed on 15 November 2021).
- PWiK Rybnik. Available online: https://pwik-rybnik.pl/aktualnosci/15 (accessed on 18 December 2021).
- Komisja Europejska. Biała Księga. Plan Utworzenia Jednolitego Europejskiego Obszaru Transportu—Dążenie do Osiągnięcia Konkurencyjnego i Zasobooszczędnego Systemu Transportu. Available online: https://www.ulc.gov.pl/_download/wiadomosci/04_2010/biala_ksiega_11.pdf (accessed on 15 November 2021).
- Pyza, D.; Gołaszewski, A.; Jacyna, M.; Gołębiowski, P. Proekologiczny system transportowy w aspekcie rozwoju infrastruktury paliw alternatywnych. Pr. Nauk. Politech. Warsz. Transp. 2017, 119, 355–366. [Google Scholar]
- Kiełczewski, D. Ekologia Społeczna; Ekonomia i Środowisko: Białystok, Poland, 2001. [Google Scholar]
- Kuzior, A. Polskie i niemieckie doświadczenia w projektowaniu i wdrażaniu zrównoważonego rozwoju. Polish and German Experiences in Planning and Implementation of Sustainable Development. Probl. Ekorozw. 2010, 5, 81–89. [Google Scholar]
- Jonek-Kowalska, I.; Wolniak, R. Economic opportunities for creating smart cities in Poland. Does wealth matter? Cities 2021, 114, 103222. [Google Scholar] [CrossRef]
- Mynarski, S. Praktyczne Metody Analizy Danych Rynkowych i Marketingowych; Kantor Wydawniczy Zakamycze: Cracow, Poland, 2000. [Google Scholar]
- Bank Danych Lokalnych Głównego Urzędu Statystycznego (Na Podstawie Danych Dotyczących Stanu Ludności w Wieku Produkcyjnym i Poprodukcyjnym, Dane za Rok 2020). Available online: https://bdl.stat.gov.pl/BDL/pomoc/stanzasilenia?active=2 (accessed on 10 July 2021).
- Stanisz, A. Przystępny Kurs Statystyki z Zastosowaniem STATISTICA PL na Przykładach z Medycyny. Tom 1. Statystyki Podstawowe; StatSoft Polska: Cracow, Poland, 2006. [Google Scholar]
- Panczyk, M. Prezentacja Podstawy Biostatystyki 9a. Miary Wielkości Efektu. Available online: https://www.authorstream.com/Presentation/panstudio-2620824-9a-miary-wielko-ci-efektu-dla-por-wna-dw-ch-grup/ (accessed on 3 July 2021).
- Pietrzak, M.B.; Żurek, M. Ład społeczny w powiatach—Analiza przy użyciu modelowania równań strukturalnych SEM. Warm. -Mazur. Kwart. Nauk. Nauk. Społeczne 2012, 4, 189–200. [Google Scholar]
- Sroka, W. The Use of Structural Equations Modeling for the Assessment of Human Capital Impact on Economic Success of Leading Carpathian Farms. Rocz. Nauk. Rolniczych. Ser. G Ekon. Rol. 2009, 4, 194–203. [Google Scholar]
- Staniec, I. Use of structural equation modeling in management research. Organ. Manag. 2018, 2, 65–77. [Google Scholar]
- Rakowska, A.; Mącik, R. Zaangażowanie pracownika a satysfakcja z pracy—Modelowanie zależności z wykorzystaniem PLS-SEM. Przegląd Organ. 2016, 5, 48–58. [Google Scholar] [CrossRef]
- Liu, J.; Dai, Q. Portfolio Optimization of Photovoltaic/Battery Energy Storage/Electric Vehicle Charging Stations with Sustainability Perspective Based on Cumulative Prospect Theory and MOPSO. Sustainability 2020, 12, 985. [Google Scholar] [CrossRef] [Green Version]
- Gao, K.; Sun, L.; Yang, Y.; Meng, F.; Qu, X. Cumulative prospect theory coupled with multi-attribute decision making for modeling travel behawior. Transp. Res. Part A Policy Pract. 2021, 148, 1–21. [Google Scholar] [CrossRef]
- Gao, K.; Yang, Y.; Qu, X. Diverging effects of subjective prospect values of uncertain time and money. Commun. Transp. Res. 2021, 1, 100007. [Google Scholar] [CrossRef]
- Gao, K.; Yang, Y.; Sun, L.; Qu, X. Revealing psychological inertia in mode shift behavior and its quantitative influences on commuting trips. Transp. Res. Part F Traffic Psychol. Behav. 2020, 71, 272–287. [Google Scholar] [CrossRef]
- Li, Z.; Hensher, D. Prospect Theoretic Contributions in Understanding Traveller Behaviour: A Review and Some Comments. Transp. Rev. 2011, 31, 97–115. [Google Scholar] [CrossRef]
- Jonek-Kowalska, I.; Wolniak, R. Sharing Economies’ Initiatives in Municipal Authorities’ Perspective: Research Evidence from Poland in the Context of Smart Cities’ Development. Sustainability 2022, 14, 2064. [Google Scholar] [CrossRef]
- De Dios Ortúzar, J. Future transportation: Sustainability, complexity and individualization of choices. Commun. Transp. Res. 2021, 1, 100010. [Google Scholar] [CrossRef]
Figure 1.
Dendrogram obtained for individual pro-ecological behaviors in terms of the frequency of their adoption by respondents (results of cluster analysis using agglomeration).
Figure 1.
Dendrogram obtained for individual pro-ecological behaviors in terms of the frequency of their adoption by respondents (results of cluster analysis using agglomeration).

Figure 2.
Dendrogram obtained for individual motivational factors in terms of the degree of motivation of the respondents to undertake pro-ecological behavior (results of cluster analysis using agglomeration).
Figure 2.
Dendrogram obtained for individual motivational factors in terms of the degree of motivation of the respondents to undertake pro-ecological behavior (results of cluster analysis using agglomeration).

Figure 3.
Dendrogram obtained for individual limiting factors in terms of the degree of limitation of the studied undertaking of pro-ecological behaviors (results of cluster analysis using agglomeration).
Figure 3.
Dendrogram obtained for individual limiting factors in terms of the degree of limitation of the studied undertaking of pro-ecological behaviors (results of cluster analysis using agglomeration).

Figure 4.
Estimated model of motivational factors for pro-ecological behavior (Model I).

Figure 5.
Estimated model of factors limiting pro-ecological behavior (Model II).


Table 1.
Respondents by gender, age and education.
| Gender | Total (N = 854) | ||||||
|---|---|---|---|---|---|---|---|
| Men (n = 430) | Women (n = 424) | ||||||
| n | % | n | % | n | % | ||
| Age | Up to 24 years | 6 | 1.40% | 5 | 1.18% | 11 | 1.29% |
| 25–34 | 37 | 8.60% | 41 | 9.67% | 78 | 9.13% | |
| 35–44 | 96 | 22.33% | 108 | 25.47% | 204 | 23.89% | |
| 45–54 | 126 | 29.30% | 121 | 28.54% | 247 | 28.92% | |
| 55 and over | 165 | 38.37% | 149 | 35.14% | 314 | 36.77% | |
| Education | Primary | 2 | 0.47% | 2 | 0.47% | 4 | 0.47% |
| Vocational | 43 | 10.00% | 30 | 7.08% | 73 | 8.55% | |
| Secondary | 133 | 30.93% | 134 | 31.60% | 267 | 31.26% | |
| Higher | 252 | 58.60% | 258 | 60.85% | 510 | 59.72% | |
Table 2.
Descriptive statistics of the distributions of the variables used and normality tests.
| Variable | Descriptive Statistics | Shapiro–Wilk Test | |||
|---|---|---|---|---|---|
| Mean ± Stand. Dev. | Skewness | Kurtosis | W | p | |
| Caring for the environment (M1) | 4.46 ± 0.8 | −1.70 | 3.31 | 0.688 | 0.000 |
| Caring for one’ s health and that of one’s family (M2) | 4.72 ± 0.64 | −3.04 | 11.24 | 0.481 | 0.000 |
| Convenience of new solutions (M3) | 4.17 ± 0.96 | −1.18 | 1.14 | 0.789 | 0.000 |
| Legal requirements (e.g., garbage sorting) (M4) | 3.99 ± 1.24 | –1.06 | 0.07 | 0.781 | 0.000 |
| Financial factors (e.g., wanting to save on bills) (M5) | 4.48 ± 0.85 | −1.90 | 3.72 | 0.651 | 0.000 |
| Tax relief and government subsidies (e.g., My Water, My Electricity program, replacement of stoves) (M6) | 3.91 ± 1.3 | −0.99 | −0.19 | 0.787 | 0.000 |
| Willingness to follow the trend (growing popularity of ecology) (M7) | 3.3 ± 1.42 | −0.31 | −1.19 | 0.875 | 0.000 |
| Promotion of ecology (press, radio, TV, Internet and others) (M8) | 3.35 ± 1.39 | −0.36 | −1.11 | 0.875 | 0.000 |
| Insufficient financial resources (O1) | 3.14 ± 1.41 | −0.15 | −1.20 | 0.884 | 0.000 |
| Lack of or insufficient information on financial support for pro-ecological investments (e.g., My Water, My Electricity, stove replacement) (O2) | 3.05 ± 1.39 | −0.10 | −1.22 | 0.891 | 0.000 |
| Difficulties in filling out applications for financing pro-ecological investments (O3) | 2.91 ± 1.47 | 0.05 | −1.37 | 0.873 | 0.000 |
| Need to change existing habits and customs (O4) | 2.26 ± 1.21 | 0.57 | −0.73 | 0.854 | 0.000 |
| Inconvenience of new ecological solutions (O5) | 2.39 ± 1.25 | 0.49 | −0.78 | 0.871 | 0.000 |
| Choosing products that have environmentally friendly packaging (Z1) | 3.52 ± 1 | −0.51 | −0.09 | 0.889 | 0.000 |
| Using low-energy household appliances (Z2) | 4.68 ± 0.71 | −2.67 | 7.47 | 0.534 | 0.000 |
| Using a reusable bag when shopping (Z3) | 4.66 ± 0.64 | −2.24 | 6.22 | 0.587 | 0.000 |
| Buying second-hand items (Z4) | 2.61 ± 1.08 | 0.01 | −0.96 | 0.844 | 0.000 |
| Saving water (S1) | 4.44 ± 0.73 | −1.31 | 1.84 | 0.745 | 0.000 |
| Saving electricity (S2) | 4.43 ± 0.73 | −1.38 | 2.45 | 0.744 | 0.000 |
| Saving gas (S3) | 4.36 ± 0.9 | −1.79 | 3.54 | 0.821 | 0.000 |
| Saving paper (S4) | 4.45 ± 0.7 | −1.38 | 2.69 | 0.783 | 0.000 |
| Using public transport instead of a car (K1) | 2.16 ± 1.01 | 0.86 | 0.40 | 0.706 | 0.000 |
| Using an electric bicycle/scooter instead of a car (K2) | 2.58 ± 1.23 | 0.30 | −0.90 | 0.858 | 0.000 |
| Rainwater harvesting and its subsequent use in the household (R1) | 3.54 ± 1.55 | −0.59 | −1.19 | 0.869 | 0.000 |
| Garbage sorting (R2) | 4.94 ± 0.36 | −7.86 | 71.25 | 0.171 | 0.000 |
| Using natural detergents (R3) | 3.36 ± 1.06 | −0.35 | −0.48 | 0.902 | 0.000 |
| Rational use of food (R4) | 3.81 ± 0.81 | −0.43 | 0.09 | 0.666 | 0.000 |
Table 3.
Pro-ecological solutions owned by the respondents.
| Yes | No, and I Have No Plans to Install in the Future | No, But I Plan to Install in the Future | N/A | |||||
|---|---|---|---|---|---|---|---|---|
| n | % | n | % | n | % | n | % | |
| Non-returnable water meter | 257 | 30.09% | 180 | 21.08% | 154 | 18.03% | 263 | 30.80% |
| Rainwater storage tank | 473 | 55.39% | 90 | 10.54% | 170 | 19.91% | 121 | 14.17% |
| Composter | 422 | 49.41% | 201 | 23.54% | 82 | 9.60% | 149 | 17.45% |
| Photovoltaic micro installation | 186 | 21.78% | 299 | 35.01% | 204 | 23.89% | 165 | 19.32% |
| Solar water heating | 97 | 11.36% | 442 | 51.76% | 122 | 14.29% | 193 | 22.60% |
| Heat pump | 102 | 11.94% | 417 | 48.83% | 140 | 16.39% | 195 | 22.83% |
| Hybrid or electric car | 28 | 3.28% | 418 | 48.95% | 240 | 28.10% | 168 | 19.67% |
Table 4.
Pro-ecological behavior taken up by respondents.
| Always | Often | Sometimes | Rarely | Never | N/A | |||||||
|---|---|---|---|---|---|---|---|---|---|---|---|---|
| n | % | n | % | n | % | n | % | n | % | n | % | |
| Rainwater harvesting and its subsequent use in the household | 315 | 36.89% | 141 | 16.51% | 99 | 11.59% | 62 | 7.26% | 149 | 17.45% | 88 | 10.30% |
| Garbage sorting | 820 | 96.02% | 24 | 2.81% | 3 | 0.35% | 3 | 0.35% | 3 | 0.35% | 1 | 0.12% |
| Using public transport instead of a car | 26 | 3.04% | 62 | 7.26% | 153 | 17.92% | 361 | 42.27% | 221 | 25.88% | 31 | 3.63% |
| Using an electric bicycle/scooter instead of a car | 59 | 6.91% | 130 | 15.22% | 208 | 24.36% | 196 | 22.95% | 193 | 22.60% | 68 | 7.96% |
| Choosing products that have environmentally friendly packaging | 128 | 14.99% | 341 | 39.93% | 253 | 29.63% | 92 | 10.77% | 33 | 3.86% | 7 | 0.82% |
| Using low-energy household appliances | 667 | 78.10% | 124 | 14.52% | 31 | 3.63% | 21 | 2.46% | 5 | 0.59% | 6 | 0.70% |
| Using a reusable bag when shopping | 624 | 73.07% | 181 | 21.19% | 39 | 4.57% | 6 | 0.70% | 4 | 0.47% | 0 | 0.00% |
| Buying second-hand items | 17 | 1.99% | 180 | 21.08% | 261 | 30.56% | 221 | 25.88% | 158 | 18.50% | 17 | 1.99% |
| Using natural detergents | 108 | 12.65% | 299 | 35.01% | 248 | 29.04% | 132 | 15.46% | 42 | 4.92% | 25 | 2.93% |
| Saving water | 477 | 55.85% | 287 | 33.61% | 72 | 8.43% | 11 | 1.29% | 3 | 0.35% | 4 | 0.47% |
| Saving electricity | 462 | 54.10% | 313 | 36.65% | 60 | 7.03% | 12 | 1.41% | 4 | 0.47% | 3 | 0.35% |
| Saving gas | 278 | 32.55% | 165 | 19.32% | 38 | 4.45% | 10 | 1.17% | 13 | 1.52% | 350 | 40.98% |
| Saving paper | 460 | 53.86% | 308 | 36.07% | 55 | 6.44% | 7 | 0.82% | 4 | 0.47% | 20 | 2.34% |
| Rational use of food | 157 | 18.38% | 421 | 49.30% | 219 | 25.64% | 43 | 5.04% | 4 | 0.47% | 10 | 1.17% |
Table 5.
Factors motivating the respondents to engage in pro-ecological behavior.
| 1—Not Motivating | 2 | 3 | 4 | 5—Very Motivating | ||||||
|---|---|---|---|---|---|---|---|---|---|---|
| n | % | n | % | n | % | n | % | n | % | |
| Caring for the environment | 10 | 1.17% | 10 | 1.17% | 77 | 9.02% | 240 | 28.10% | 517 | 60.54% |
| Caring for one’ s health and that of one’s family | 8 | 0.94% | 4 | 0.47% | 32 | 3.75% | 127 | 14.87% | 683 | 79.98% |
| Convenience of new solutions | 18 | 2.11% | 31 | 3.63% | 128 | 14.99% | 287 | 33.61% | 390 | 45.67% |
| Legal requirements (e.g., garbage sorting) | 58 | 6.79% | 56 | 6.56% | 139 | 16.28% | 184 | 21.55% | 417 | 48.83% |
| Financial factors (e.g., wanting to save on bills) | 13 | 1.52% | 19 | 2.22% | 68 | 7.96% | 199 | 23.30% | 555 | 64.99% |
| Tax relief and government subsidies (e.g., My Water, My Electricity program, replacement of stoves) | 75 | 8.78% | 64 | 7.49% | 123 | 14.40% | 194 | 22.72% | 398 | 46.60% |
| Willingness to follow the trend (growing popularity of ecology) | 138 | 16.16% | 118 | 13.82% | 179 | 20.96% | 185 | 21.66% | 234 | 27.40% |
| Promotion of ecology (press, radio, TV, Internet and others) | 127 | 14.87% | 112 | 13.11% | 185 | 21.66% | 193 | 22.60% | 237 | 27.75% |
Table 6.
Factors limiting respondents in undertaking pro-ecological behaviors.
| 1—Not a Barrier | 2 | 3 | 4 | 5—Very Big Barrier | ||||||
|---|---|---|---|---|---|---|---|---|---|---|
| n | % | n | % | n | % | n | % | n | % | |
| Insufficient financial resources | 163 | 19.09% | 109 | 12.76% | 229 | 26.81% | 154 | 18.03% | 199 | 23.30% |
| Lack of or insufficient information on financial support for pro-ecological investments (e.g., My Water, My Electricity, stove replacement) | 171 | 20.02% | 129 | 15.11% | 207 | 24.24% | 182 | 21.31% | 165 | 19.32% |
| Difficulties in filling out applications for financing pro-ecological investments | 221 | 25.88% | 133 | 15.57% | 176 | 20.61% | 153 | 17.92% | 171 | 20.02% |
| Need to change existing habits and customs | 319 | 37.35% | 184 | 21.55% | 207 | 24.24% | 102 | 11.94% | 42 | 4.92% |
| Inconvenience of new, ecological solutions | 278 | 32.55% | 193 | 22.60% | 217 | 25.41% | 104 | 12.18% | 62 | 7.26% |
Table 7.
Respondents’ opinions on the degree of positive impact of particular pro-ecological behaviors on the environment.
Table 7.
Respondents’ opinions on the degree of positive impact of particular pro-ecological behaviors on the environment.
| 1—Poor Impact | 2 | 3 | 4 | 5—Very Strong Impact | ||||||
|---|---|---|---|---|---|---|---|---|---|---|
| n | % | n | % | n | % | n | % | n | % | |
| Rainwater harvesting and its subsequent use in the household | 30 | 3.51% | 36 | 4.22% | 99 | 11.59% | 155 | 18.15% | 534 | 62.53% |
| Garbage sorting | 18 | 2.11% | 16 | 1.87% | 58 | 6.79% | 112 | 13.11% | 650 | 76.11% |
| Using public transport instead of a car | 53 | 6.21% | 73 | 8.55% | 258 | 30.21% | 192 | 22.48% | 278 | 32.55% |
| Using an electric bicycle/scooter instead of a car | 83 | 9.72% | 79 | 9.25% | 201 | 23.54% | 185 | 21.66% | 306 | 35.83% |
| Choosing products that have environmentally friendly packaging | 26 | 3.04% | 56 | 6.56% | 134 | 15.69% | 218 | 25.53% | 420 | 49.18% |
| Using low-energy household appliances | 15 | 1.76% | 26 | 3.04% | 92 | 10.77% | 200 | 23.42% | 521 | 61.01% |
| Using a reusable bag when shopping | 11 | 1.29% | 16 | 1.87% | 62 | 7.26% | 142 | 16.63% | 623 | 72.95% |
| Buying second-hand items | 102 | 11.94% | 107 | 12.53% | 276 | 32.32% | 183 | 21.43% | 186 | 21.78% |
| Using natural detergents | 24 | 2.81% | 68 | 7.96% | 215 | 25.18% | 219 | 25.64% | 328 | 38.41% |
| Saving water | 19 | 2.22% | 5 | 0.59% | 55 | 6.44% | 149 | 17.45% | 626 | 73.30% |
| Saving electricity | 16 | 1.87% | 7 | 0.82% | 64 | 7.49% | 145 | 16.98% | 622 | 72.83% |
| Saving gas | 40 | 4.68% | 17 | 1.99% | 72 | 8.43% | 148 | 17.33% | 577 | 67.56% |
| Saving paper | 15 | 1.76% | 12 | 1.41% | 77 | 9.02% | 161 | 18.85% | 589 | 68.97% |
| Rational use of food | 10 | 1.17% | 12 | 1.41% | 72 | 8.43% | 171 | 20.02% | 589 | 68.97% |
Table 8.
Relationship between respondents’ opinions on the degree of the positive impact of particular pro-ecological behaviors on the environment and their undertaking of these behaviors.
Table 8.
Relationship between respondents’ opinions on the degree of the positive impact of particular pro-ecological behaviors on the environment and their undertaking of these behaviors.
| Pro-Ecological Behavior | Opinions vs. Action in Practice | Descriptive Statistics | Spearman’s Rank Order Correlation | |||||
|---|---|---|---|---|---|---|---|---|
| Mean ± Stand. Dev. | Median (Q25–Q75) | Min.–Max. | Confidence Interval | Stand. Error | ||||
| −95.00% | +95.00% | |||||||
| Rainwater harvesting and subsequent household use (N = 766) | Opinion on impact (on a scale of 1–5) | 4.35 ± 1.03 | 5 (4–5) | 1–5 | 4.28 | 4.42 | 0.04 | R = 0.32; t(N − 2) = 9.21; p < 0.001 |
| Action frequency (on a scale of 1–5) | 3.54 ± 1.55 | 4 (2–5) | 1–5 | 3.43 | 3.65 | 0.06 | ||
| Garbage sorting (N = 853) | Opinion on impact (on a scale of 1–5) | 4.59 ± 0.86 | 5 (5–5) | 1–5 | 4.53 | 4.65 | 0.03 | R = 0.12; t(N − 2) = 3.48; p < 0.001 |
| Action frequency (on a scale of 1–5) | 4.94 ± 0.36 | 5 (5–5) | 1–5 | 4.92 | 4.96 | 0.01 | ||
| Using public transport instead of a car (N = 823) | Opinion on impact (on a scale of 1–5) | 3.66 ± 1.19 | 4 (3–5) | 1–5 | 3.58 | 3.74 | 0.04 | R = 0.32; t(N − 2) = 9.58; p < 0.001 |
| Action frequency (on a scale of 1–5) | 2.16 ± 1.01 | 2 (1–3) | 1–5 | 2.09 | 2.23 | 0.04 | ||
| Using an electric bicycle/scooter instead of a car (N = 786) | Opinion on impact (on a scale of 1–5) | 3.67 ± 1.29 | 4 (3–5) | 1–5 | 3.58 | 3.76 | 0.05 | R = 0.38; t(N − 2) = 11.67; p < 0.001 |
| Action frequency (on a scale of 1–5) | 2.58 ± 1.23 | 3 (2–3) | 1–5 | 2.49 | 2.66 | 0.04 | ||
| Choosing products that have environmentally friendly packaging (N = 847) | Opinion on impact (on a scale of 1–5) | 4.12 ± 1.08 | 4 (4–5) | 1–5 | 4.05 | 4.20 | 0.04 | R = 0.39; t(N − 2) = 12.25; p < 0.001 |
| Action frequency (on a scale of 1–5) | 3.52 ± 1 | 4 (3–4) | 1–5 | 3.45 | 3.59 | 0.03 | ||
| Using low energy consumption household appliances (N = 848) | Opinion on impact (on a scale of 1–5) | 4.39 ± 0.92 | 5 (4–5) | 1–5 | 4.33 | 4.45 | 0.03 | R = 0.36; t(N − 2) = 11.15; p < 0.001 |
| Action frequency (on a scale of 1–5) | 4.68 ± 0.71 | 5 (5–5) | 1–5 | 4.63 | 4.73 | 0.02 | ||
| Using a reusable bag when shopping (N = 854) | Opinion on impact (on a scale of 1–5) | 4.58 ± 0.81 | 5 (4–5) | 1–5 | 4.53 | 4.64 | 0.03 | R = 0.3; t(N − 2) = 9.29; p < 0.001 |
| Action frequency (on a scale of 1–5) | 4.66 ± 0.64 | 5 (4–5) | 1–5 | 4.61 | 4.70 | 0.02 | ||
| Buying second-hand items (N = 837) | Opinion on impact (on a scale of 1–5) | 3.29 ± 1.27 | 3 (3–4) | 1–5 | 3.20 | 3.37 | 0.04 | R = 0.45; t(N − 2) = 14.67; p < 0.001 |
| Action frequency (on a scale of 1–5) | 2.61 ± 1.08 | 3 (2–3) | 1–5 | 2.54 | 2.69 | 0.04 | ||
| Using natural detergents (N = 829) | Opinion on impact (on a scale of 1–5) | 3.89 ± 1.09 | 4 (3–5) | 1–5 | 3.81 | 3.96 | 0.04 | R = 0.38; t(N − 2) = 11.99; p < 0.001 |
| Action frequency (on a scale of 1–5) | 3.36 ± 1.06 | 3 (3–4) | 1–5 | 3.29 | 3.43 | 0.04 | ||
| Saving water (N = 850) | Opinion on impact (on a scale of 1–5) | 4.59 ± 0.82 | 5 (4–5) | 1–5 | 4.53 | 4.64 | 0.03 | R = 0.31; t(N − 2) = 9.64; p < 0.001 |
| Action frequency (on a scale of 1–5) | 4.44 ± 0.73 | 5 (4–5) | 1–5 | 4.39 | 4.49 | 0.03 | ||
| Saving electricity (N = 851) | Opinion on impact (on a scale of 1–5) | 4.58 ± 0.81 | 5 (4–5) | 1–5 | 4.53 | 4.64 | 0.03 | R = 0.3; t(N − 2) = 9.16; p < 0.001 |
| Action frequency (on a scale of 1–5) | 4.43 ± 0.73 | 5 (4–5) | 1–5 | 4.38 | 4.48 | 0.02 | ||
| Saving gas (N = 504) | Opinion on impact (on a scale of 1–5) | 4.51 ± 0.88 | 5 (4–5) | 1–5 | 4.44 | 4.59 | 0.04 | R = 0.34; t(N − 2) = 8.18; p < 0.001 |
| Action frequency (on a scale of 1–5) | 4.36 ± 0.9 | 5 (4–5) | 1–5 | 4.28 | 4.44 | 0.04 | ||
| Saving paper (N = 834) | Opinion on impact (on a scale of 1–5) | 4.53 ± 0.84 | 5 (4–5) | 1–5 | 4.47 | 4.58 | 0.03 | R = 0.24; t(N − 2) = 7.07; p < 0.001 |
| Action frequency (on a scale of 1–5) | 4.45 ± 0.7 | 5 (4–5) | 1–5 | 4.41 | 4.50 | 0.02 | ||
| Rational use of food (N = 844) | Opinion on impact (on a scale of 1–5) | 4.54 ± 0.79 | 5 (4–5) | 1–5 | 4.49 | 4.60 | 0.03 | R = 0.24; t(N − 2) = 7.16; p < 0.001 |
| Action frequency (on a scale of 1–5) | 3.81 ± 0.81 | 4 (3–4) | 1–5 | 3.76 | 3.87 | 0.03 | ||
Table 9.
Specification of latent and manifest variables in Model I and Model II.
| Latent (Unobservable) | Manifest (Observable) | |
|---|---|---|
| Exogenous variables | Motivational factors | M1—Care for the environment |
| M2—Care for one’ s own health and that of one’s family | ||
| M3—Convenience of new solutions | ||
| M4—Legal requirements (e.g., mandating garbage sorting) | ||
| M5—Financial factors (e.g., wanting to save on utility bills) | ||
| M6—Tax relief and government subsidies (e.g., My Water, My Electricity Program, stove replacement) | ||
| M7—Willingness to follow a trend (e.g., growing popularity of going green) | ||
| M8—Promotion of environmental issues (press, radio, television, Internet etc.) | ||
| Limiting factors | O1—Insufficient financial resources | |
| O2—Lack of or insufficient information on financial support for pro-ecological investments (e.g., My Water, My Electricity program, exchange of stoves) | ||
| O3—Difficulties in filling in applications for co-financing of pro-ecological investments | ||
| O4—Necessity to change current habits and customs | ||
| O5—Inconvenience caused by new, ecological solutions | ||
| Endogenous variables | Shopping | Z1—Choosing products with environmentally friendly packaging |
| Z2—Using low-energy consuming household appliances | ||
| Z3—Using a reusable bag when shopping | ||
| Z4—Buying second-hand items | ||
| Saving | S1—Saving water | |
| S2—Saving electricity | ||
| S3—Saving gas | ||
| S4—Saving paper | ||
| Transport | K1—Using public transport instead of a car | |
| K2—Using bicycle/electric scooter instead of car | ||
| Management of resources | R1—Rainwater harvesting and subsequent household use | |
| R2—Garbage sorting | ||
| R3—Use of natural detergents | ||
| R4—Rational use of food |
Table 10.
Estimated parameters of factor analysis (Model I).
| Relationship | Evaluation | Stand. Error | p |
|---|---|---|---|
| M1 <– Motivational factors | 0.345 | 0.018 | p < 0.001 |
| M2 <– Motivational factors | 0.148 | 0.012 | p < 0.001 |
| M3 <– Motivational factors | 0.475 | 0.018 | p < 0.001 |
| M4 <– Motivational factors | 0.551 | 0.025 | p < 0.001 |
| M5 <– Motivational factors | 0.345 | 0.015 | p < 0.001 |
| M6 <– Motivational factors | 0.709 | 0.026 | p < 0.001 |
| M7 <– Motivational factors | 1.174 | 0.022 | p < 0.001 |
| M8 <– Motivational factors | 1.072 | 0.026 | p < 0.001 |
| Z1 <– Shopping | 1.141 | 0.35 | p < 0.01 |
| Z2 <– Shopping | 0.575 | 0.181 | p < 0.01 |
| Z3 <– Shopping | 0.291 | 0.102 | p < 0.01 |
| Z4 <– Shopping | −0.358 | 0 | |
| S1 <– Saving | 0.509 | 0 | |
| S2 <– Saving | 0.507 | 0.013 | p < 0.001 |
| S3 <– Saving | 0.550 | 0.021 | p < 0.001 |
| S4 <– Saving | 0.381 | 0.022 | p < 0.001 |
| K1 <– Transport | 0.532 | 0.076 | p < 0.001 |
| K2 <– Transport | 0.852 | 0 | |
| R1 <– Management of resources | 1.056 | 0.065 | p < 0.001 |
| R2 <– Management of resources | 0.051 | 0.004 | p < 0.001 |
| R3 <– Management of resources | 0.556 | 0.046 | p < 0.001 |
| R4 <– Management of resources | 0.586 | 0.031 | p < 0.001 |
Table 11.
Estimated parameters of the recursive model (Model I).
| Relationship | Evaluation | Stand. Error | p |
|---|---|---|---|
| Shopping <– Motivational factors | 0.331 | 0.097 | p < 0.001 |
| Saving <– Motivational factors | 0.737 | 0.031 | p < 0.001 |
| Transport <– Motivational factors | 0.446 | 0.05 | p < 0.001 |
| Management of resources<– Motivational factors | 0.664 | 0 | p < 0.001 |
Table 12.
Estimated parameters of the factor analysis (Model II).
| Relationship | Evaluation | Stand. Error | p |
|---|---|---|---|
| O1 <– Limiting factors | −0.508 | 0.051 | p < 0.001 |
| O2 <– Limiting factors | −0.754 | 0.041 | p < 0.001 |
| O3 <– Limiting factors | −0.649 | 0.043 | p < 0.001 |
| O4 <– Limiting factors | −0.629 | 0.034 | p < 0.001 |
| O5 <– Limiting factors | −0.702 | 0.031 | p < 0.001 |
| S1 <– Saving | 0.584 | 0 | |
| S2 <– Saving | 0.599 | 0.015 | p < 0.001 |
| S3 <– Saving | 0.655 | 0.026 | p < 0.001 |
| S4 <– Saving | 0.465 | 0.023 | p < 0.001 |
| K1 <– Transport | 0.422 | 0.058 | p < 0.001 |
| K2 <– Transport | 0.463 | 0.073 | p < 0.001 |
| R1 <– Management of resources | 1.356 | 0.101 | p < 0.001 |
| R2 <– Management of resources | −0.008 | 0.006 | p = 0.155 |
| R3 <– Management of resources | 0.980 | 0 | |
| R4 <– Management of resources | 0.530 | 0.049 | p < 0.001 |
Table 13.
Estimated parameters of the recursive model (Model II).
| Relationship | Evaluation | Standard Error | p |
|---|---|---|---|
| Shopping <– Limiting factors | 0.456 | 0 | p < 0.001 |
| Saving <– Limiting factors | 0.847 | 0.032 | p < 0.001 |
| Transport <– Limiting factors | 0.596 | 0 | p < 0.001 |
| Management of resources <– Limiting factors | 0.595 | 0.037 | p < 0.001 |
Publisher’s Note: MDPI stays neutral with regard to jurisdictional claims in published maps and institutional affiliations. |
© 2022 by the authors. Licensee MDPI, Basel, Switzerland. This article is an open access article distributed under the terms and conditions of the Creative Commons Attribution (CC BY) license (https://creativecommons.org/licenses/by/4.0/).
Share and Cite
MDPI and ACS Style
Ober, J.; Karwot, J. Pro-Ecological Behavior: Empirical Analysis on the Example of Polish Consumers. Energies 2022, 15, 1690. https://doi.org/10.3390/en15051690
AMA Style
Ober J, Karwot J. Pro-Ecological Behavior: Empirical Analysis on the Example of Polish Consumers. Energies. 2022; 15(5):1690. https://doi.org/10.3390/en15051690
Chicago/Turabian StyleOber, Józef, and Janusz Karwot. 2022. "Pro-Ecological Behavior: Empirical Analysis on the Example of Polish Consumers" Energies 15, no. 5: 1690. https://doi.org/10.3390/en15051690
Note that from the first issue of 2016, this journal uses article numbers instead of page numbers. See further details here.