
Assessment of the Impact of the Human Coronavirus (COVID-19) Lockdown on the Energy Sector: A Case Study of Sharjah, UAE


1
Department of Biology, Chemistry and Environmental Sciences, College of Arts and Sciences, American University of Sharjah, Sharjah P.O. Box 26666, United Arab Emirates
2
Department of Mechanical Engineering, College of Engineering, American University of Sharjah, Sharjah P.O. Box 26666, United Arab Emirates
3
Research and Studies Department, Sharjah Electricity, Water, and Gas Authority (SEWA), Sharjah P.O. Box 135, United Arab Emirates
*
Author to whom correspondence should be addressed.
Energies 2022, 15(4), 1496; https://doi.org/10.3390/en15041496
Submission received: 24 January 2022
/
Revised: 13 February 2022
/
Accepted: 15 February 2022
/
Published: 17 February 2022
(This article belongs to the Special Issue Smart Energy Policies in a Post-COVID-19 World)
Abstract
:The recent coronavirus (COVID-19) pandemic has wreaked havoc on the global economy, causing major shifts in energy use and output patterns. For some countries, this has had a significant effect on energy demand and carbon emissions, at least in the short term. Since the United Arab Emirates is currently exerting many efforts towards sustainability, it is important to assess and understand the impacts of the pandemic and the lockdown measurements on the local energy sectors. Data for this analysis were gathered by the Sharjah Electricity Water & Gas Authority (SEWA) for Sharjah City which is the capital of the Emirate of Sharjah. The changes in electricity after the implementation of quarantine and lockdown-like measures were assessed, and the results indicate that the electric power demand in Sharjah City was reduced in the commercial, industrial, and agricultural sectors, whereas the residential and government sectors witnessed a higher power demand. The overall electricity consumption in the year 2020 was reduced by 1.04% in comparison with previous years including 2016 to 2019. The results of this study indicate that the changes in electricity consumption were minimal in Sharjah City as compared to other cities around the world. However, this paper highlights the importance of governmental response during and after a pandemic, and the possible impacts that lockdowns could potentially have in the energy industry worldwide.
Keywords:
COVID-19; lockdown; electricity demand; electricity supply; energy consumption; Sharjah; UAE1. Introduction
Since the emergence of the human coronavirus (COVID-19), abrupt changes have occurred worldwide. The COVID-19 virus was declared a pandemic on the 11 March 2020 (World Health Organization, 2020). Not only did the virus become a global health concern, but it has also resulted in changes to the ways business is conducted and to the daily lifestyles of individuals worldwide. In addition to impacts on health, the pandemic had implications for the economy, energy and water use, and CO2 emissions. Implemented lockdown programs and the suspension of civic and commercial activities around the world have consequently affected human behaviors. The unprecedented events of the pandemic and the exponentially unmatched circumstances have affected standard living needs and demands. As the majority of individuals were prompted to work remotely from home, water and energy demand levels were potentially inherently shifted. Social isolation and changes in electricity and energy patterns have been recorded and have been attributed to the shift to a remote setting. According to [1], there was a sharp decline in commercial and industrial electricity and energy consumption, which could be the result of set curfews, partial shifts, and region-wide closures. Moreover, intense consumption from institutions like schools and production plants shifted to intermediate consumption from supermarkets, homes, and hospitals.
Each state responded to the lockdown differently, leading to inevitable impacts on their general energy consumption. The International Energy Agency (IEA) published a comprehensive statistical report highlighting a sharp reduction in overall electricity consumption in Europe, India, China, and the US [2]. Bahmanyar et al. compared the severity of COVID-19 restrictions with its effects on electricity consumption in different European countries and the results indicated that countries with more severe restrictions (Spain, Italy, Belgium, and the UK) experienced a larger drop in electricity demand than countries with fewer or no restrictions, such as the Netherlands and Sweden [3]. At the beginning of the pandemic, the International Energy Agency reported an average decline of 25% in the energy demand per week in countries that applied a full lockdown and an 18% decline in countries that implemented partial lockdowns [2]. A lockdown is a restriction policy that calls for households to isolate themselves in addition to banning all kinds of activities that involve crowding such as parks, educational institutes, and dine-in restaurants. Many developed countries reported that electricity consumption during the pandemic drastically decreased at the earlier stages of the pandemic between February and April 2020. For instance, China’s electricity consumption dropped by 12% around February 2020 compared to February 2019 due to the complete lockdown [4]. However, once lockdown measures were reduced in China, electricity consumption increased by 5% around August 2020 compared to August 2019.
Due to the uncontrollable spread of the virus in Italy, the lockdown measures were severe, and they were expanded over a longer duration than in other countries. The Italian government implemented an immediate lockdown which has not only impacted commercial and industrial systems, but also the water and electricity consumption systems. The lockdown was mandatory on the population, non-essential firms, and nationwide airports, which blocked national and international flights, thus causing a major reduction in the overall energy consumption [5]. Even though the restrictions forced people to quarantine, it implied that electricity and water consumption were predicted to increase. Instead, these restrictions led to reduction of electricity consumption during both work hours and throughout the evening. As a result, the daily consumption pattern was changed in comparison with the pre-COVID period.
In addition to effects on the energy sector, it has been reported that global CO2 emissions are expected to decline by 8%, to the levels reported 10 years ago. A study showed that in April 2020 daily global CO2 emissions decreased by −17% (−11 to −25% for ±1σ) and concluded that government actions and economic incentives post-crisis might influence the global CO2 emissions path for decades [6]. Another study in China, comprehensively evaluating the dynamic impact of COVID-19 on the environment, revealed that air quality was improved in the short term, contributing significantly to global carbon emission reductions. However, the study predicts that after reducing the lockdown measures, energy use and greenhouse gas (GHG) emissions are likely to increase, exceeding pre-lockdown levels [7].
The United Arab Emirates (UAE) imposed its first lockdown due to COVID-19 on March 2020. After the implementation of the lockdown, the electricity sector evolved in various ways. The UAE’s main energy source is natural gas, a non-renewable energy source. In 2014, prior to the pandemic, the UAE was the top 5th CO2 emitter per capita worldwide with only 0.7% of its energy coming from low carbon sources [8]. During the pandemic, the UAE became a leading example by emphasizing the importance of protecting its population against the possible consequences of the pandemic. The UAE mandated many governmental and private sectors to work from home, which led to an increase in domestic electricity bills [9]. No official sources were found to describe the overall effect of COVID-19 on UAE electricity and water consumption, which is a gap that this research aims to address.
Since the UAE is currently exerting many efforts towards sustainability, it is important to assess and understand the impacts of the pandemic and the lockdown measures on local energy sectors. This is the first study to discuss the impacts of COVID-19 on the energy sector in the region. Therefore, this paper aims to assess the impact of COVID-19 on the electricity demand and consumption in Sharjah City, UAE as a case study. The objectives of this research include analyzing the results of electricity consumption in Sharjah City during 2020, comparing the results with the years 2016 to 2019, examining the hourly power supply, overall monthly demand, monthly demand per sector, and the difference in demand between 2020 and the previous years. Finally, the study focuses on comparing the results for Sharjah with other countries in terms of electricity consumption and reflects on the reported changes.
2. Materials and Methods
2.1. Study Area
The study focuses on the Emirate of Sharjah, which is the third largest among the seven Emirates of the UAE. According to the Department of Statistics and Community Development, the population of Sharjah Emirate is around 1.7 million, of which approximately 1.4 million live in the city of Sharjah [10]. Of the total inhabitants of Sharjah, about 90% of the population is made up of expats, making Sharjah very sensitive to global and regional changes. Sharjah City is located in the geographical coordinates of 25.3° N 55.5° E on the coast of the Arabian Gulf. It is considered to have severe climate conditions due to its location in a hot dry region and the very hot summer covers 6 months per year starting from May till October. Mean temperatures range between 18 and 34 °C, reaching high daily temperatures of 24–42 °C [11]. These climate conditions and the seasonal variation of temperature have severe impacts on electricity consumption, which varies more than 400% between peak and lowest demand, putting a severe burden on electricity generation, network, and distribution.
2.2. Data Collection and Analysis
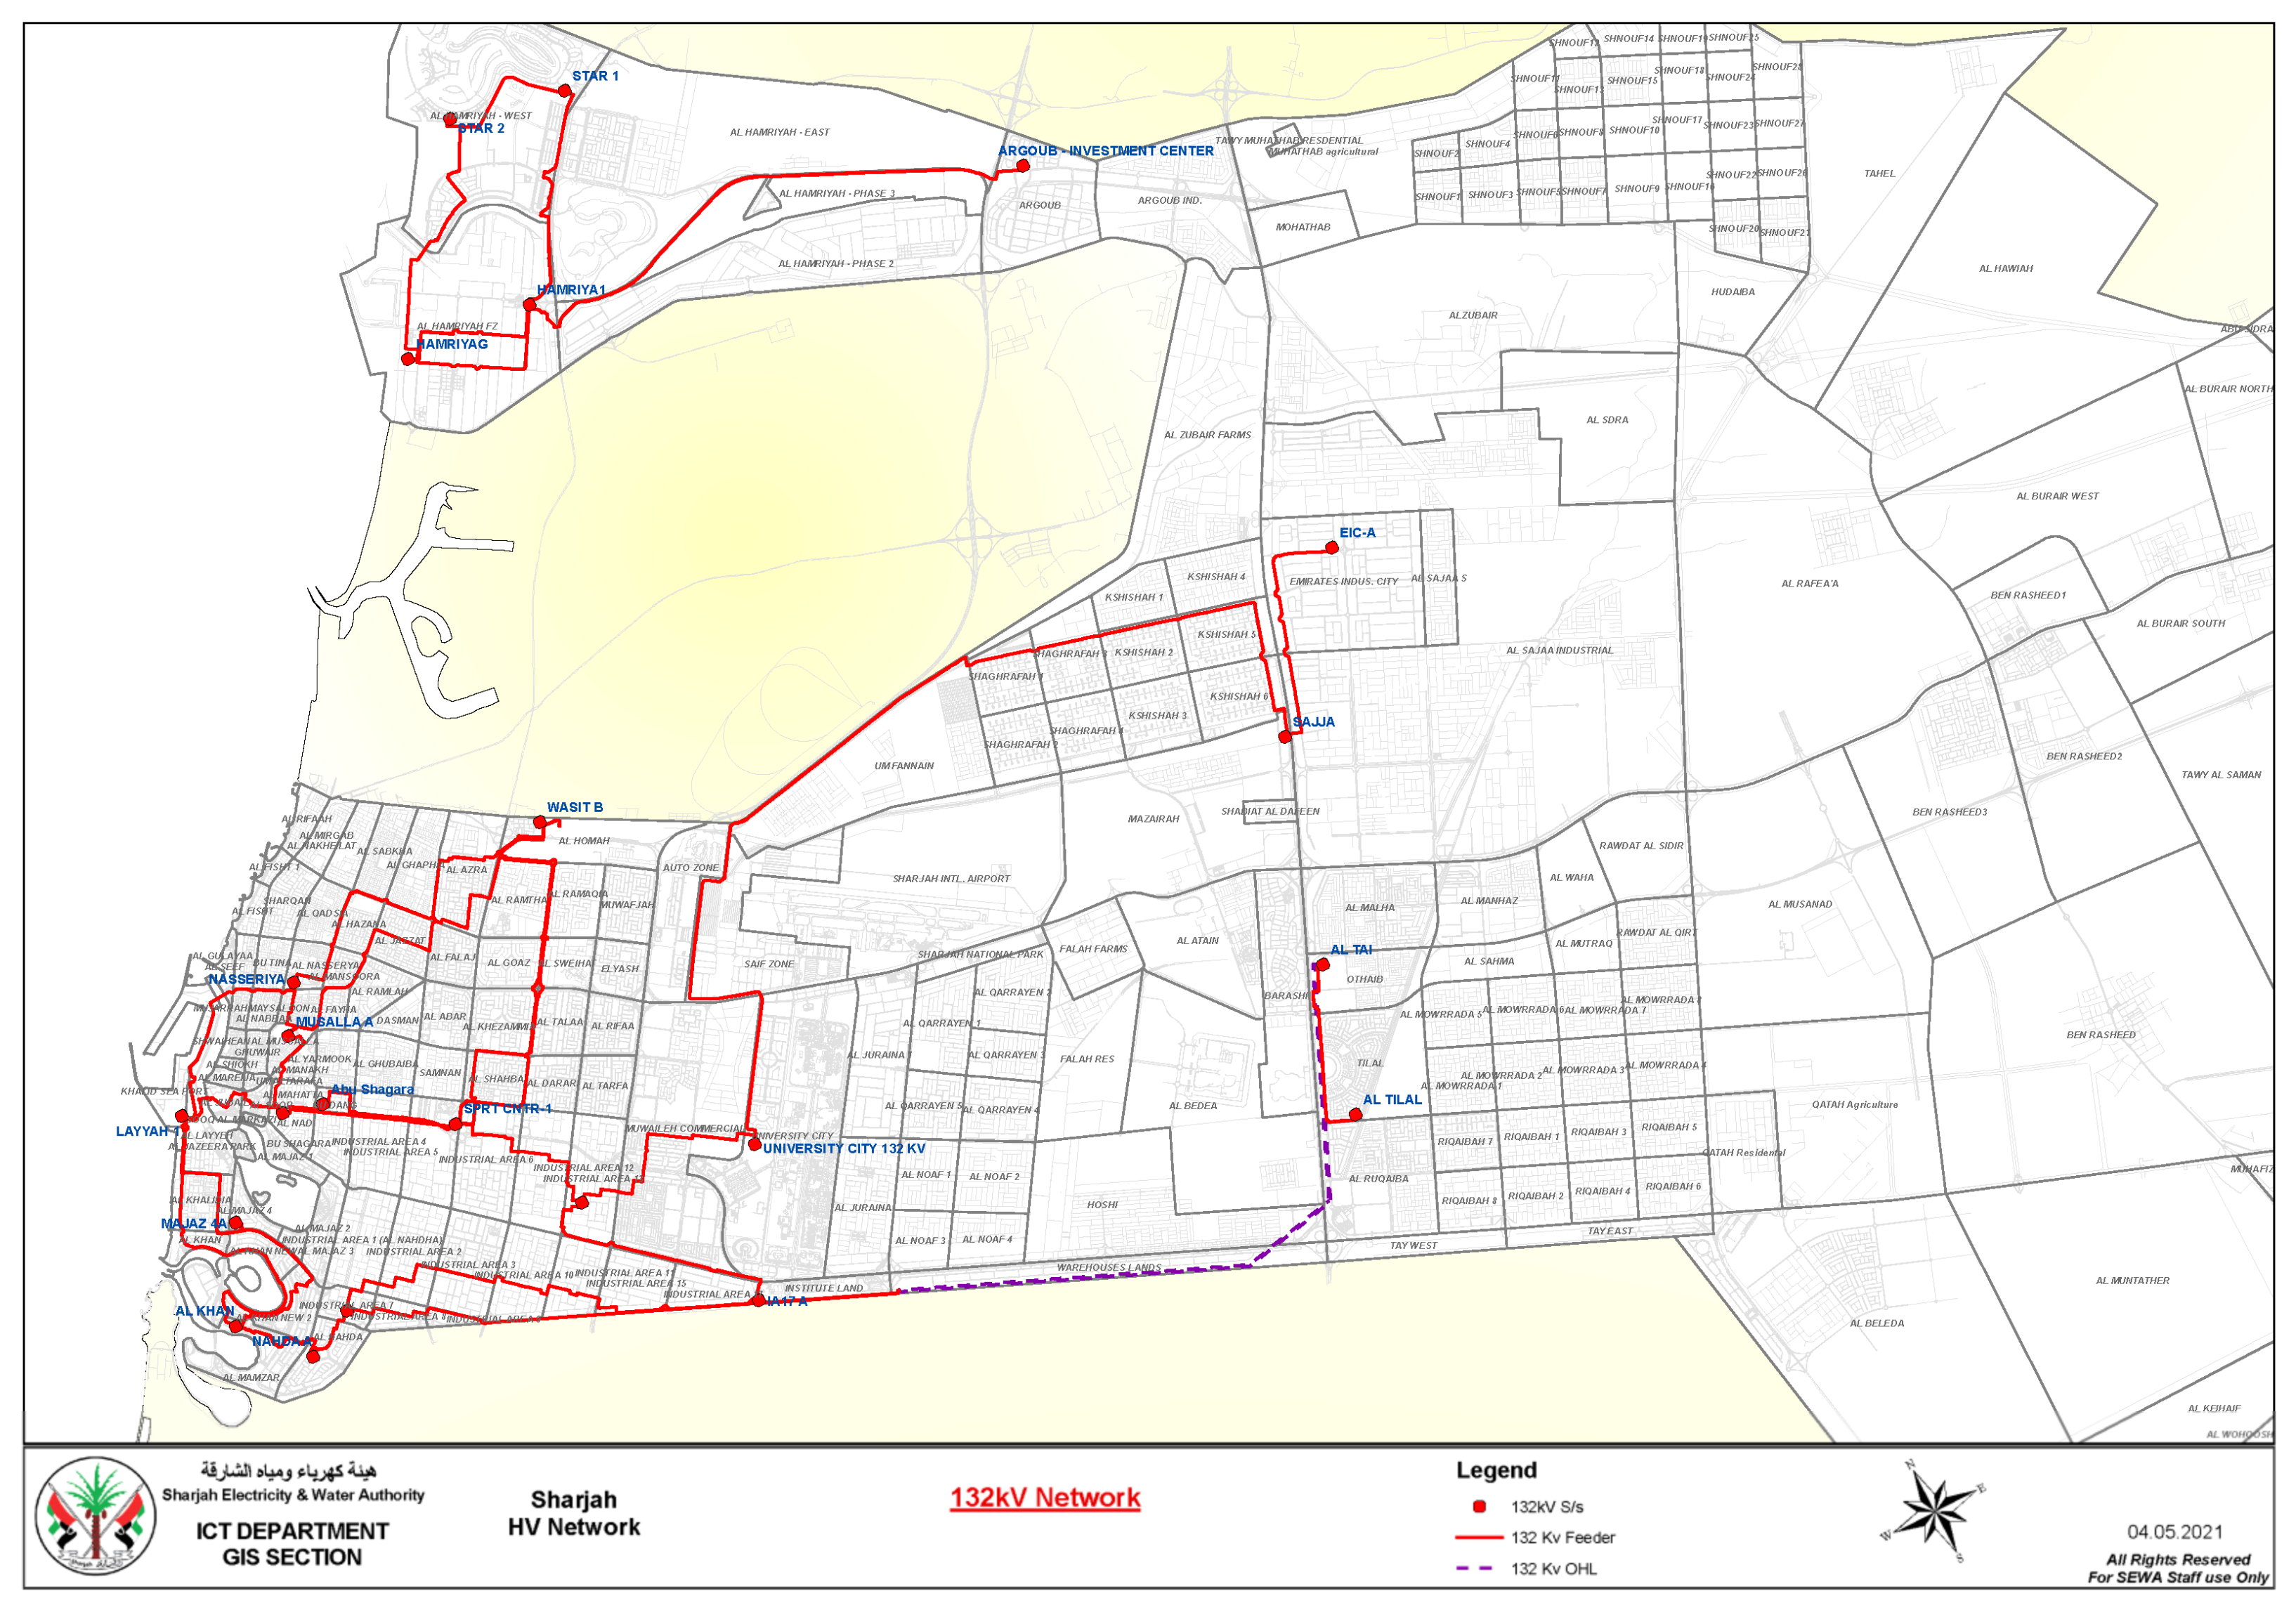
To understand the changes in electricity usage during the lockdown period, data on electricity usage were obtained. The Sharjah Electricity Water & Gas Authority (SEWA) is the entity in charge of distribution and generation of electricity, water, and (piped natural) gas to the residents of the Sharjah Emirate. Data for this analysis were gathered by SEWA, Sharjah, UAE. Sharjah City was chosen as the main area for our study (Figure 1), as the majority and most dense population of Sharjah is based in its capital, Sharjah City. In order to assess the changes in electricity generation after the implementation of quarantine and lockdown-like measures, the hourly electricity load was computed from 1 January 2020 to 31 December 2020, and then we analyzed its deviation from the average values observed in the same period between 2016 and 2019. The consumption data were collected from SEWA’s billing system customer care and billing service (CC&B) Oracle Utility. Data were collected per sector on a monthly basis. Data on agricultural, commercial, residential, governmental, and industrial sectors were collected and analyzed separately and together to assess differences in consumption per sectors. For electricity hourly data, SEWA uses the supervisory control and data acquisition (SCADA) software which increases the efficiency of process monitoring and operating control. Hence, electricity hourly data (load) were selected from the SEWA SCADA system including all the losses. The hourly load is generated through the Open Systems International (OSI) SCADA system, which acquires data from all power stations, tie-lines, and substations through the telecom network to the master station. The OSI system obtained data from remote terminal units (RTU), distributed control systems (DCS), and substation control and monitoring systems (SCMS), which are available to the corresponding substation/power station. The study examines the data collected for the area outlined in Figure 1, which includes Sharjah City from the coastal edge in the north-west, up to Sajja and Tilal in the south-east. The study area also includes Al Hamriya region in the north.
Data were assessed and plotted to establish trends and relationships observed throughout the years. Comparisons during lockdown, post-lockdown, and pre-lockdown were made. The power consumption on an hourly basis was presented using MATH LAB. All other plots were performed using Microsoft excel.
3. Results
This study aims to examine the impacts of the COVID-19 lockdown measures on the electricity consumption in Sharjah City during 2020 in comparison with the previous years from 2016 to 2019. To assess this comparison, an analysis of the overall hourly power supply, overall monthly demand, monthly demand per sector, and the difference in demand between 2020 and the previous years was included in this study.
3.1. Analysis of Overall Electricity Consumption in Sharjah City Compared to Previous Years
A comparison between the demand and supply of power in Sharjah City (Figure 2) indicates that both trends follow a similar pattern of fluctuating increases and decreases that are most noticeable during the lockdown months (March to May) and the period following the end of the lockdown (June to August). The beginning of 2020 and the end of 2020 have a relatively stable pattern that is similar to the average reported in the preceding years. Consequently, these results present a significant impact on power supply and demand in Sharjah City, showing a decrease during the lockdown measures and an increase during the period following the end of the lockdown.
3.1.1. Assessment of Power Supply
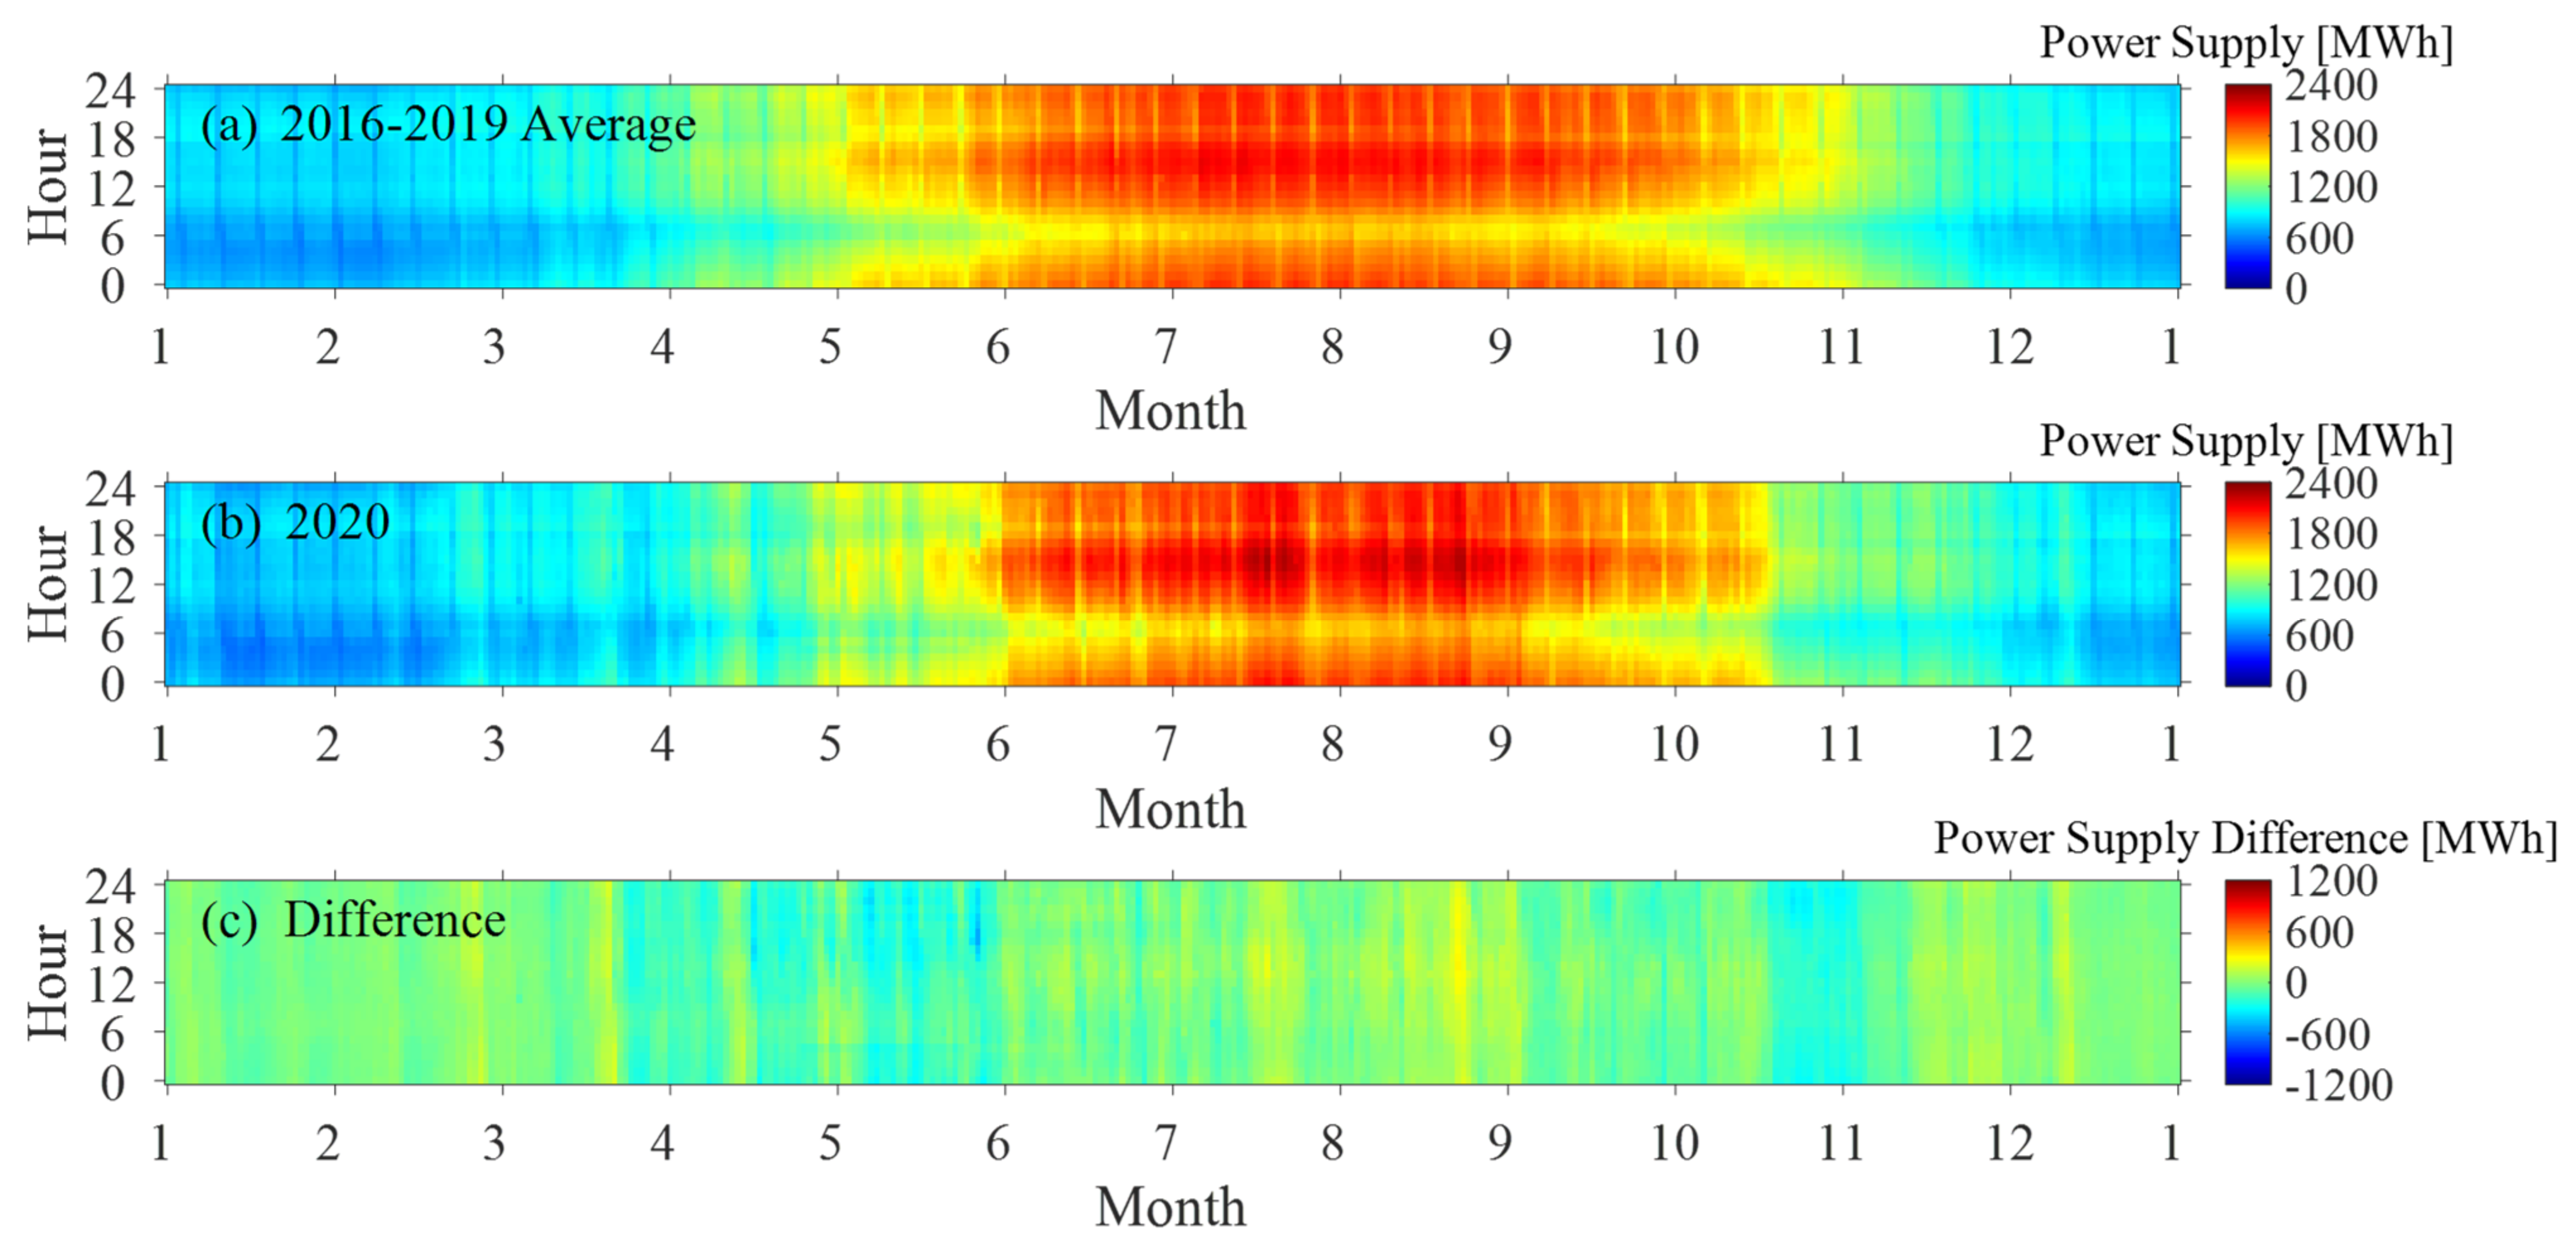
The overall power supply in Sharjah was examined on a daily and monthly basis as shown in Figure 2. The data presented were based on the first Sunday of a given year to allow for a week-to-week comparison and better average representation throughout the year. On average, the power supply decreased during the cooler months and increased during the warmer months. The hourly pattern changed between the day and night, as the supply reaches its peak between 12:00 and 18:00 h, and it was typically around 06:00 h that the major changes were observed. The observed pattern is predictable due to the ventilation and cooling requirements in Sharjah’s hot and humid environment, requiring high electricity consumption. Moreover, the observed sudden drops (vertical thin color strips) in power supply within a month occur over the weekends.
The electric power supply in Sharjah during 2020 was also examined for the hourly and monthly differences. In Figure 2c, the difference in the electric power supply in Sharjah City was compared between 2020 and the average of the preceding years (2016 to 2019). The difference indicates that the supply was relatively constant and only increased slightly during the first few months including January, February, and March. With the lockdown measures that started mid-March and lasted until the end of May, the power supply decreased significantly. During the summer months, June to August, the power supply showed a relative increase above the average of 2016–2019. The supply starts decreasing in September and October, and it increases again in November and December.
Overall, the results indicate that the most significant reduction in power supply occurred between April and May, reaching a reduction of around 600 MWh. It is noticeable that the difference in the hourly power supply between 2020 and the 2016–2019 average does not have a dominating increasing or decreasing pattern, except for a decrease between 12 and 24 h during the lockdown months (March to May). The remaining hourly data represent a consistent pattern throughout the day, with an increase in the summer months and a significant decrease during the lockdown period.
Considering the weather temperature influence on the electric supply, Figure 3 presents Sharjah City’s (a) average hourly temperature data between 2016 and 2019 as a reference, (b) hourly temperature data in 2020, and (c) the hourly temperature difference between 2020 and the average of previously reported years as acquired by Weather Underground [12]. In a close comparison between Figure 2a and Figure 3a, there is a strong correlation between the average hourly power supply and the weather average hourly temperature data along a given year. This mainly contributes to the relatively high temperature values in the Gulf Region which require the use of air conditioning systems for most of the year. The level of temperature difference between the hourly temperature in 2020 and the average hourly temperature between 2016 and 2019 presented in Figure 3c is approximately ±8 °C between days. In other words, some days are generally hotter or cooler than their average representation, which explains the variations presented between vertical temperature lines (days).
3.1.2. Assessment of Power Demand
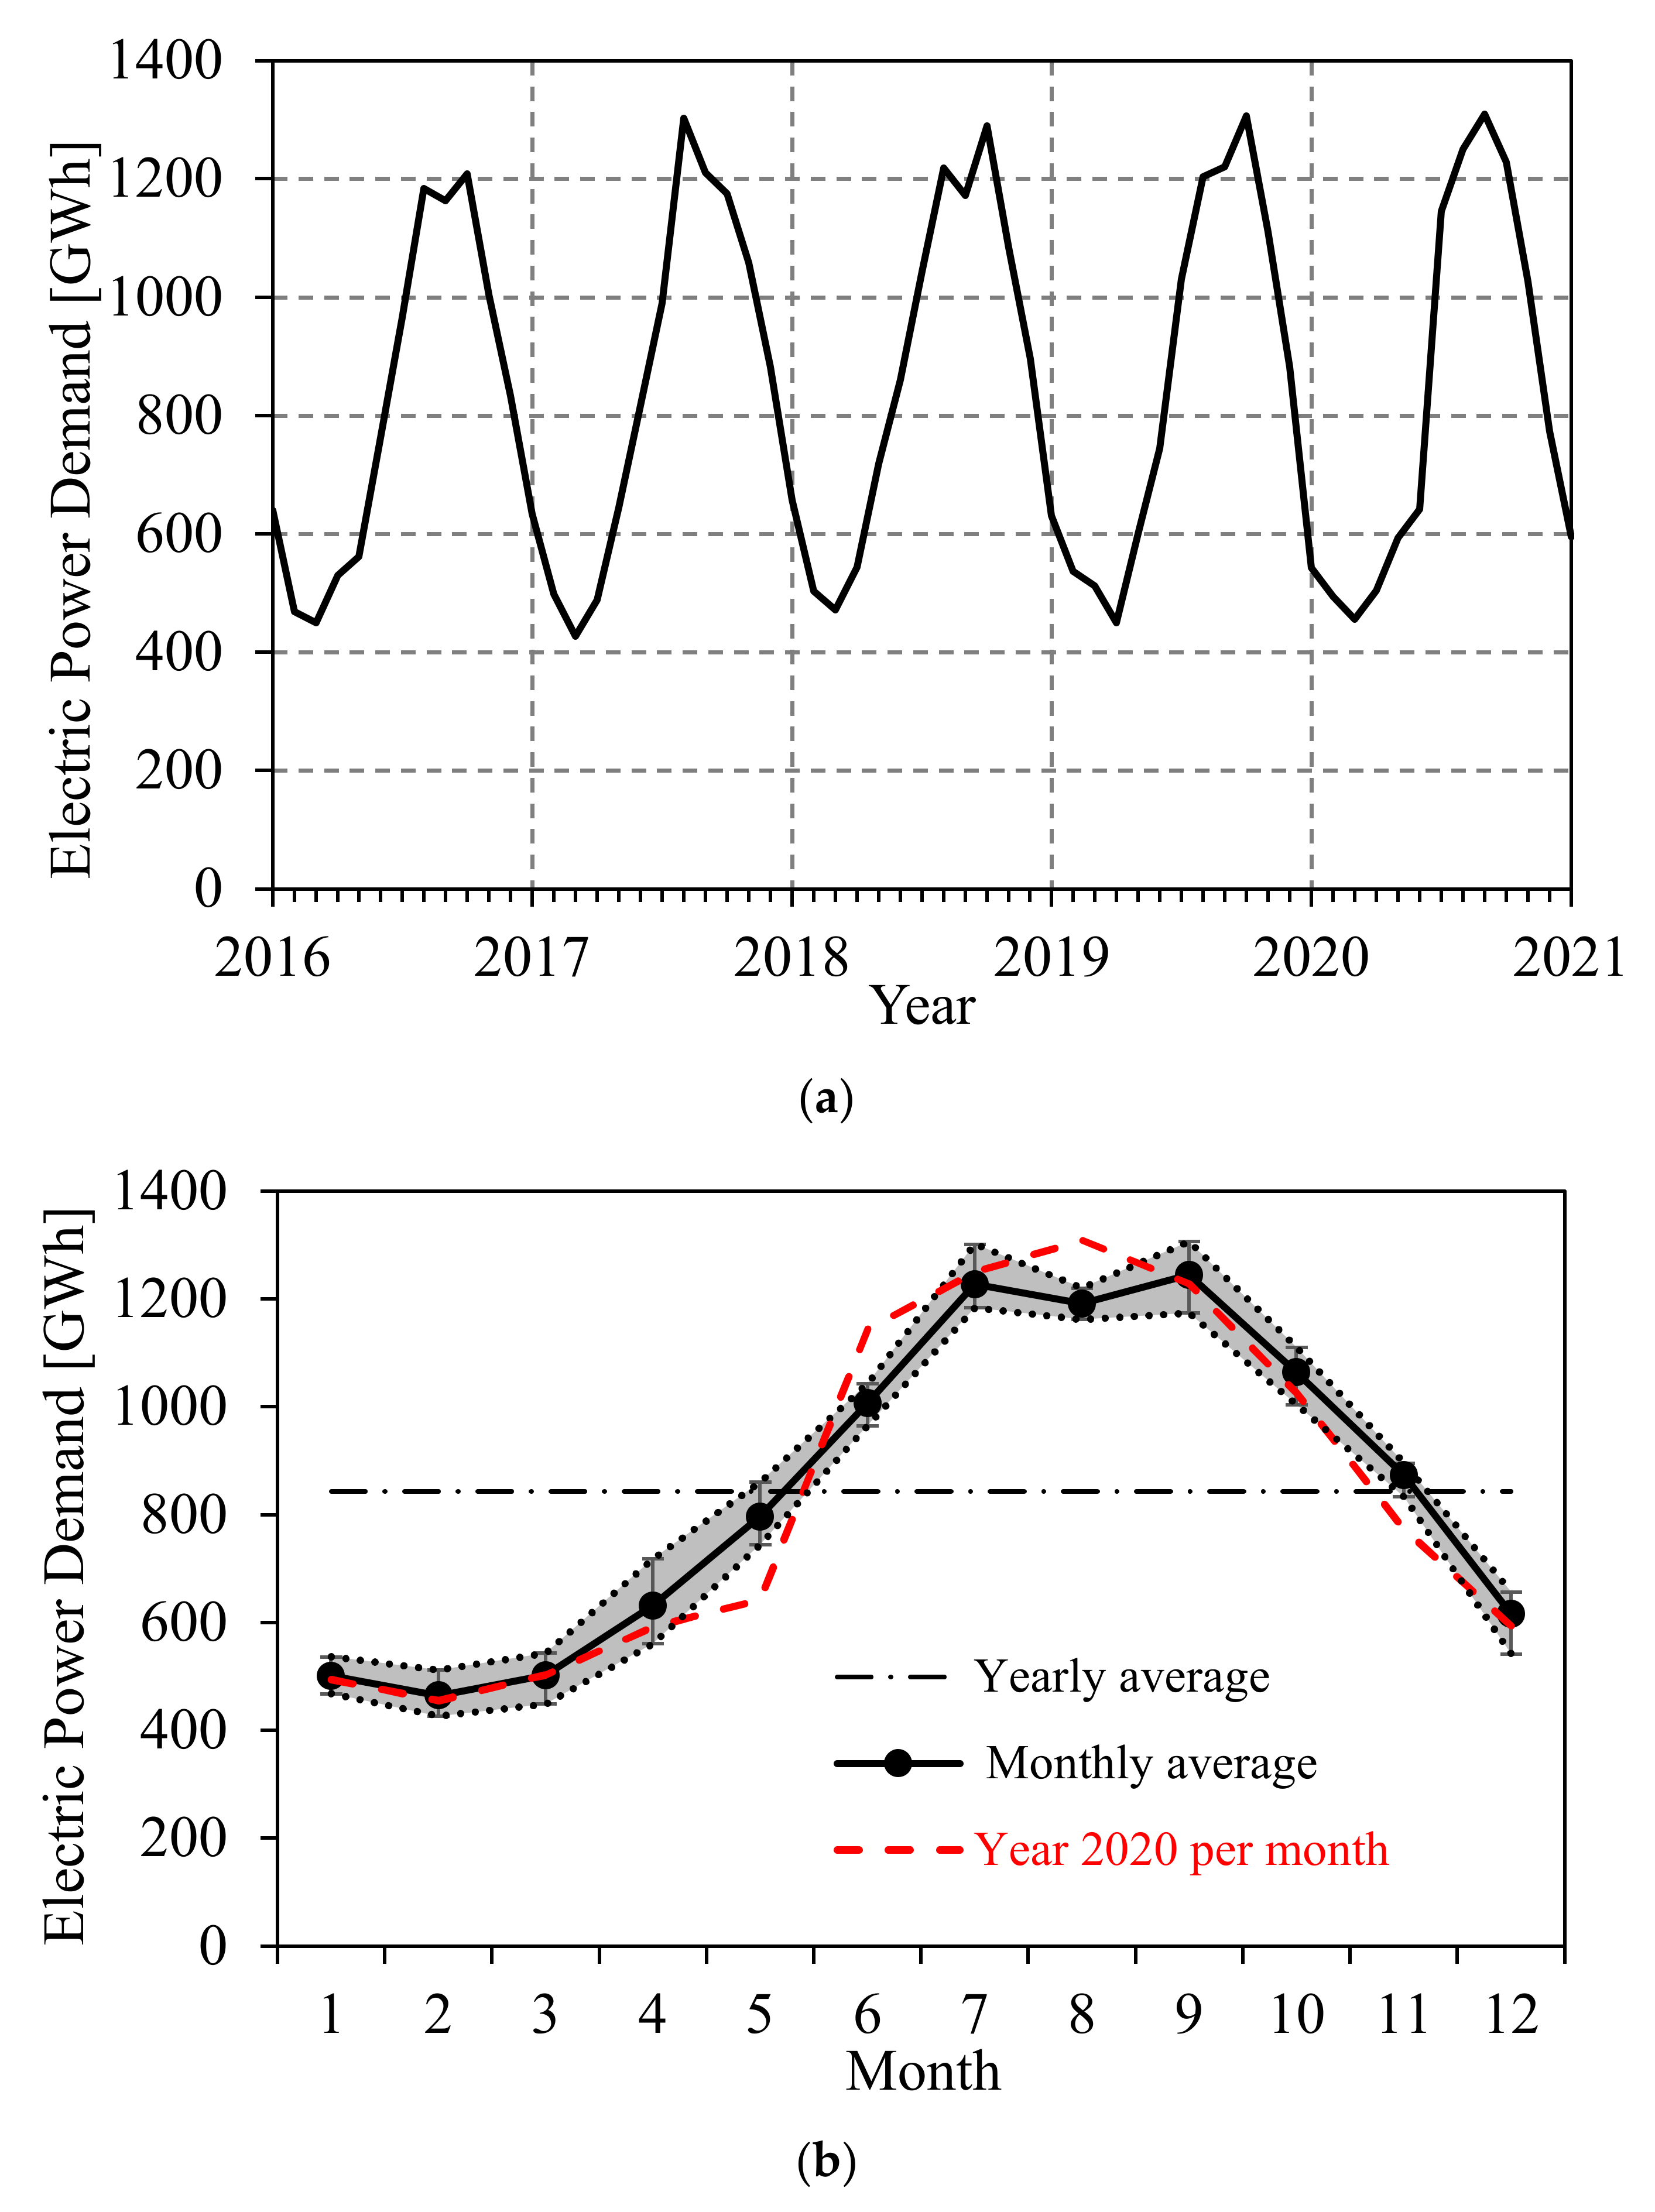
When assessing the power demand, Figure 4a shows that the power demand in 2020 is relatively similar to the years 2017 to 2019. It is noticeable that the demand in 2016 was lower in comparison with the continuing years, with its peak demand at 1209 GWh. However, the peak of the demand in the years 2017 to 2019 is relatively similar to 2020, which indicates that there is a stable level of peak demand. On the other hand, the increase in demand is steeper in 2020 when compared to the preceding years, especially around March to May. This is reflected by the wider area of low demand observed in the graph during the lockdown period, and an immediate rise to high demand upon the reduction of the lockdown measures (mid-2020 onwards). This is further clarified by Figure 4b, which shows a decrease in the demand between March and May 2020 when compared to the average between 2016 and 2019. However, there is an increase in demand between June and August 2020; then, the demand eventually becomes similar to the average from September onwards.
The results obtained are expected as there was a considerable reduction in commercial sector activities and eventually the power demand during the lockdown period, which consequently led to a reduction in the total demand across Sharjah City. However, this reduction is countered by an increase in the demand of the residential sector, which consequently affects the total demand. Therefore, it may be concluded that despite the significant reduction in commercial demand during the lockdown, the increase in the residential demand is significant enough to counteract this reduction in the overall power demand.
3.2. Assessment of Electric Power Demand per Sector
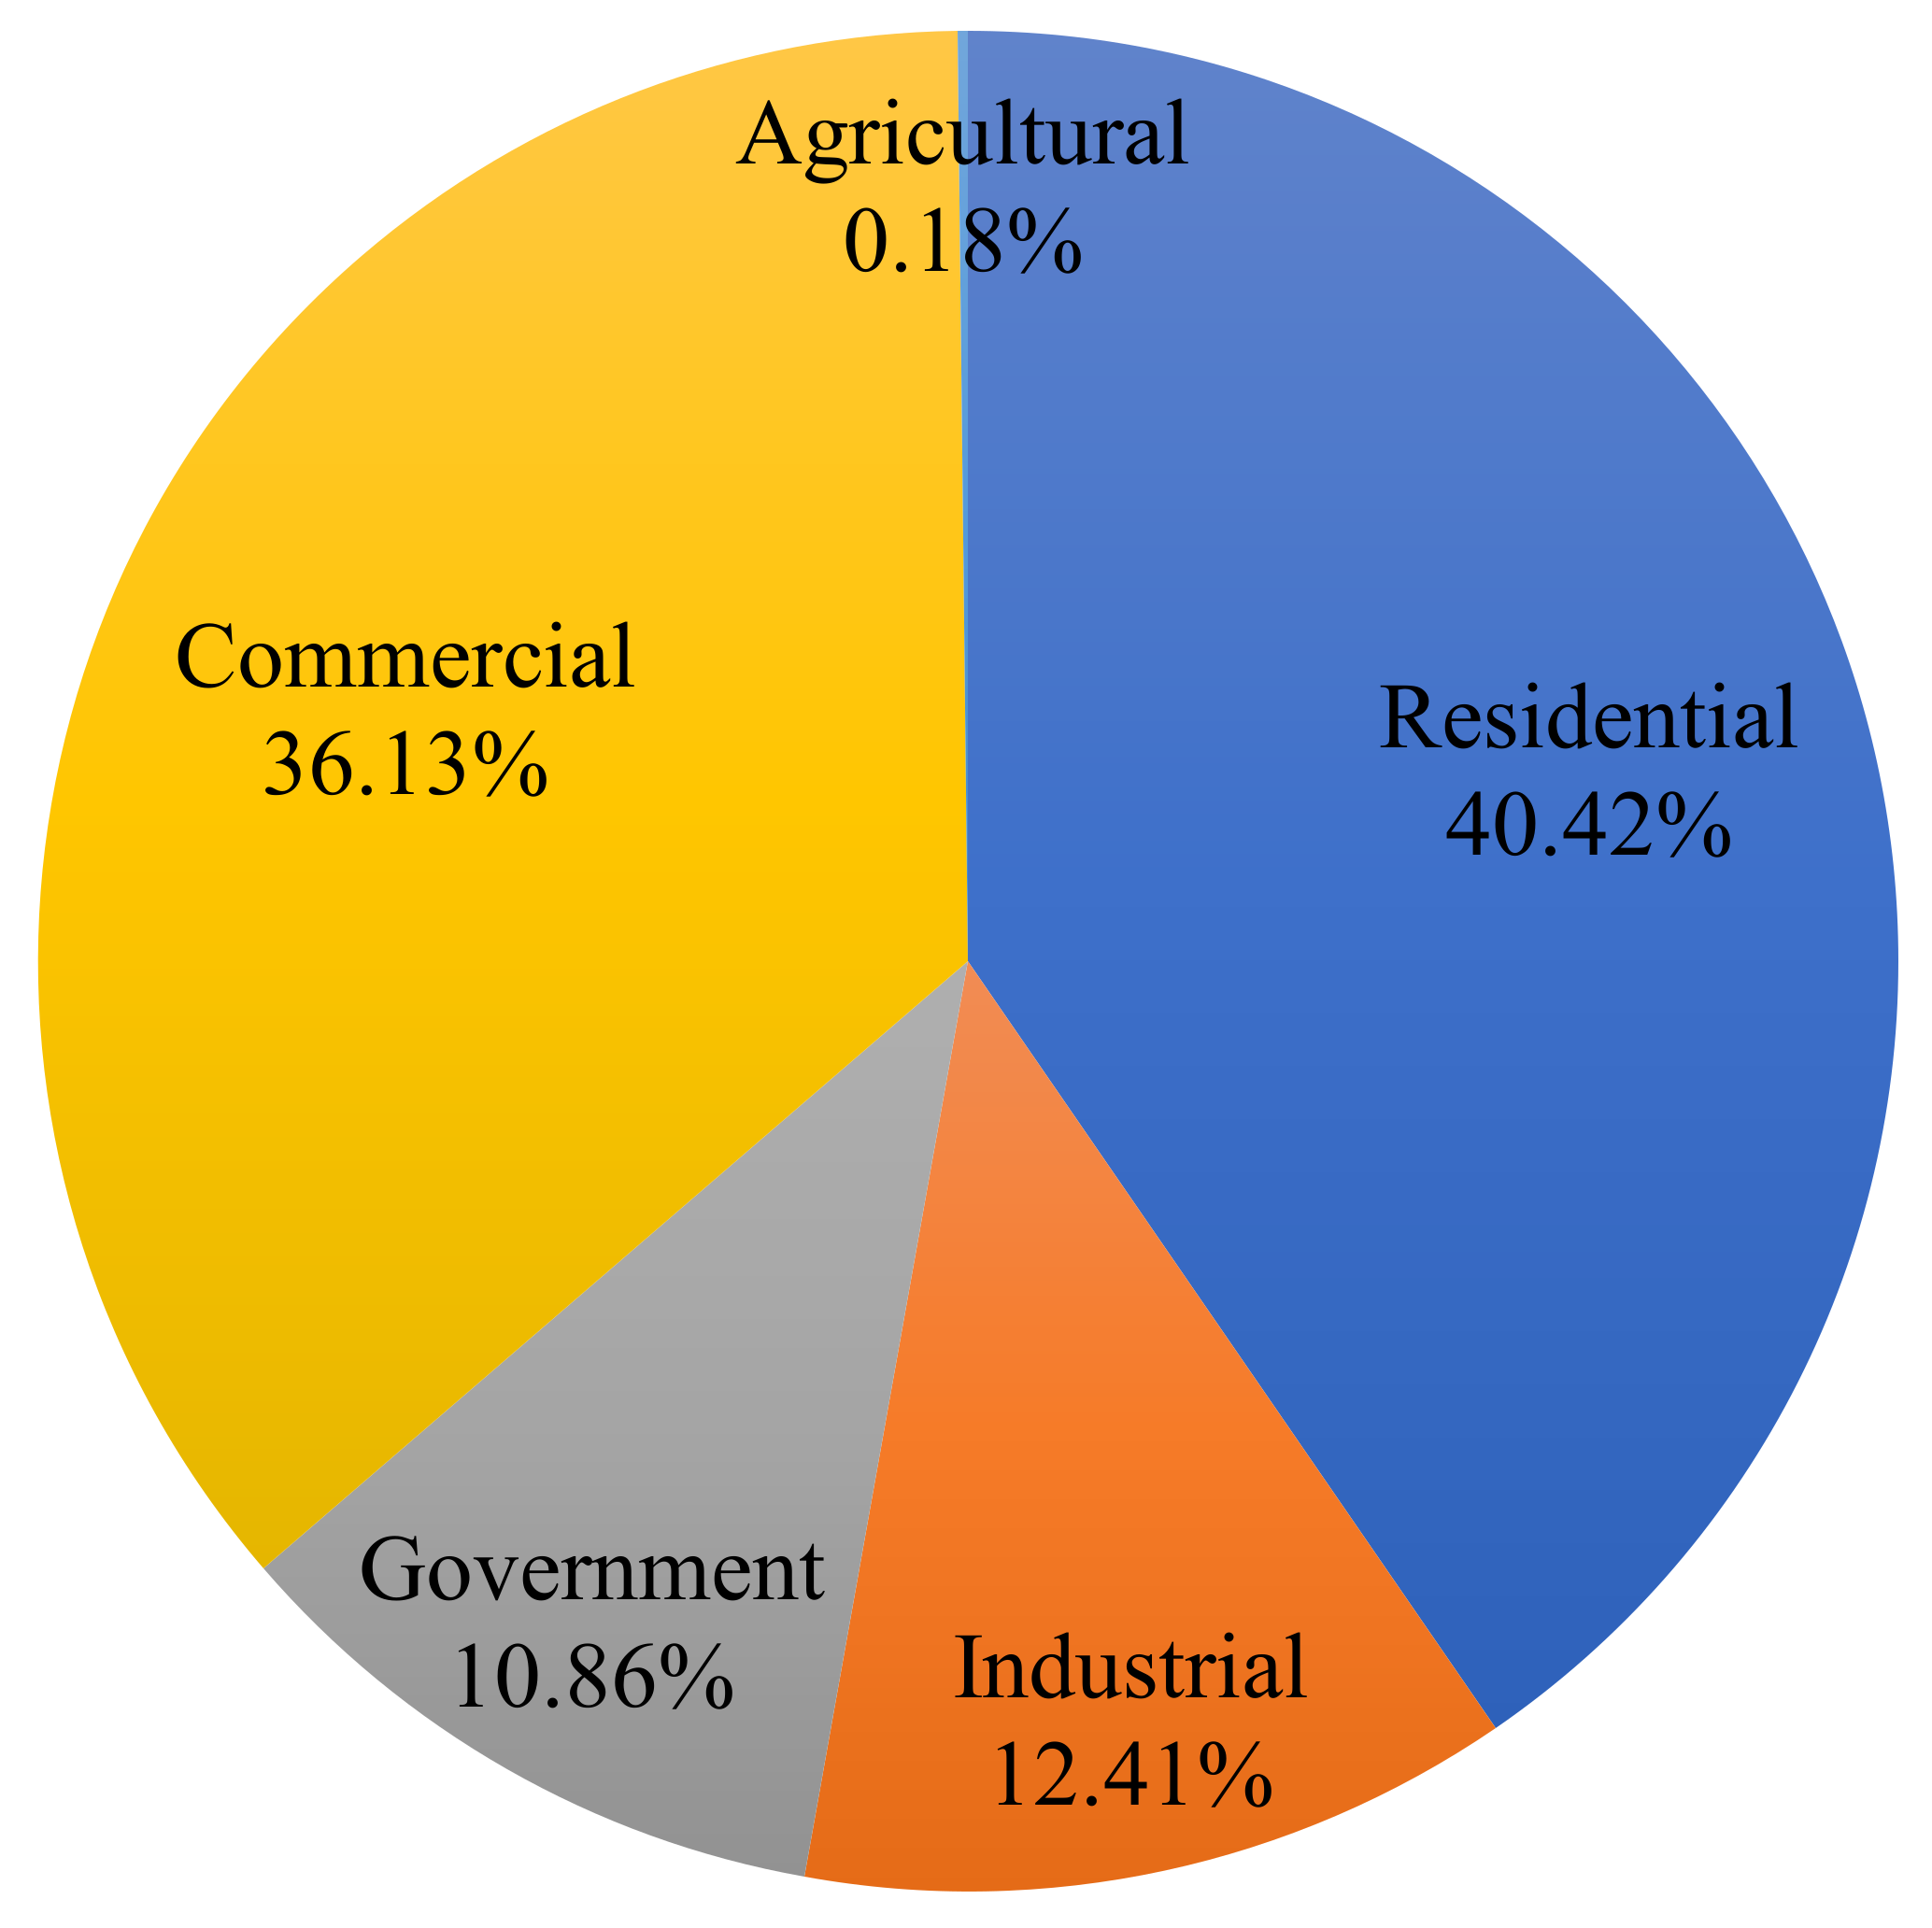
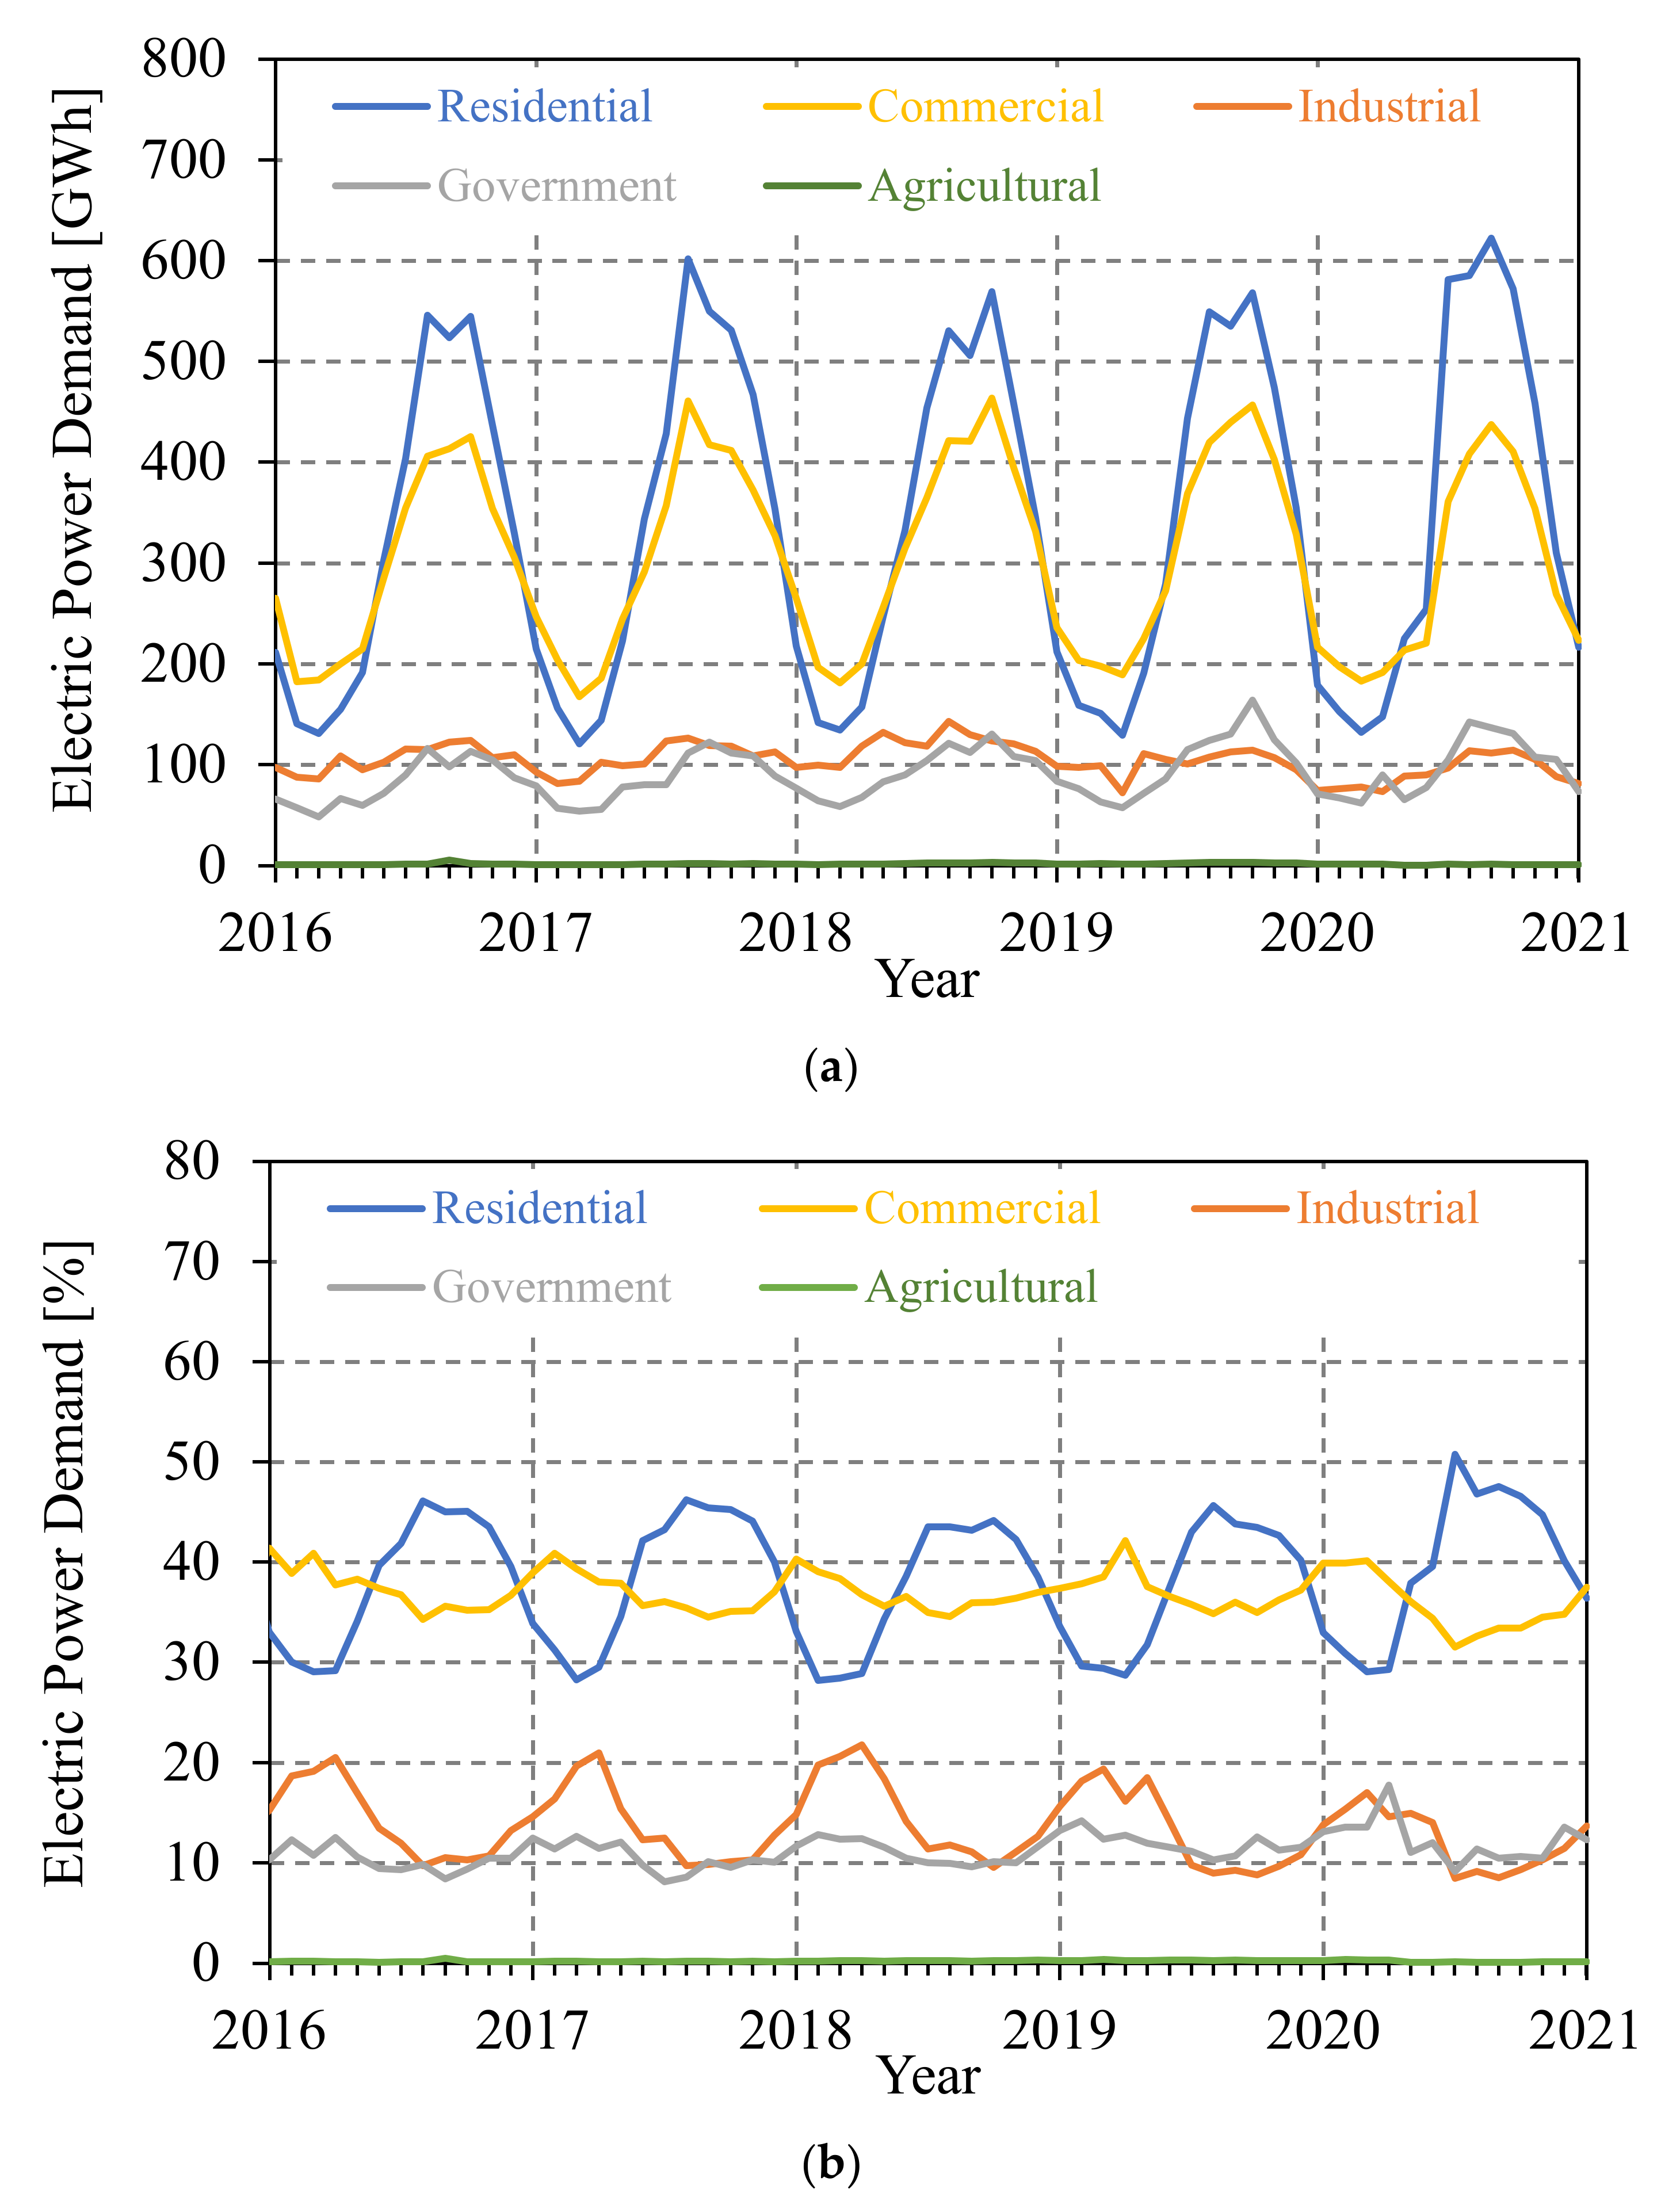
In order to further identify the potential sectors accounting for the increase or decrease in power demand, an analysis was conducted to examine the distribution of power across sectors. Figure 5 indicates that the residential sector accounts for the highest demand of power, with a share of ~ 40%, followed by the commercial sector accounting for ~ 36% of the total power demand. Both industrial and government sectors have a similar share of ~ 12% and 11%, respectively. The agricultural sector has the lowest demand of 0.18%. Therefore, any changes in the residential or commercial sectors had a significant impact on the overall power demand.
The monthly breakdown of the power demand in the five sectors (residential, commercial, industrial, government, and agricultural) was further analyzed over the years 2016 to 2020. By examining the results in Figure 6a,b, it is seen that the agricultural sector remained relatively consistent in its demand over the years. However, the residential and commercial sectors were clearly dominant, each accounting for between 30% and 50% of the total demand in a given month. The years 2016–2019 witnessed a smaller difference in demand between residential and commercial sectors; however, in 2020, a larger difference is evident due to the rise in residential demand and decline in commercial demand. Moreover, the industrial sector had a demand larger than the government sector until the beginning of the lockdown. By then, the industrial demand had reduced significantly, having a peak of ~18% in 2020, as opposed to ~20% share of the total demand in the preceding years. This eventually led to similar levels of demand between government and industrial sectors in 2020, with more fluctuating levels in the government sector. Overall, it is evident that the power demand of four out of the five sectors has been affected due to COVID-19 restrictions; it is distinguished by the increase in residential and government sectors’ power demand, and the decrease in the demand of commercial and industrial sectors. The apparent increase in demand between 2019 and 2020 in the government sector accounts for the government buildings that were not billed or even metered before. The UAE provided a rapid response to the pandemic and had to apply many changes in order to respond to the rise in cases. The increase in demand between 2019 and 2020 accounts for the establishment of the new polymerase chain reaction (PCR) testing and COVID-19 treatment facilities in response to the rise of the pandemic, which were not present in previous years.
3.2.1. Residential and Commercial Sectors
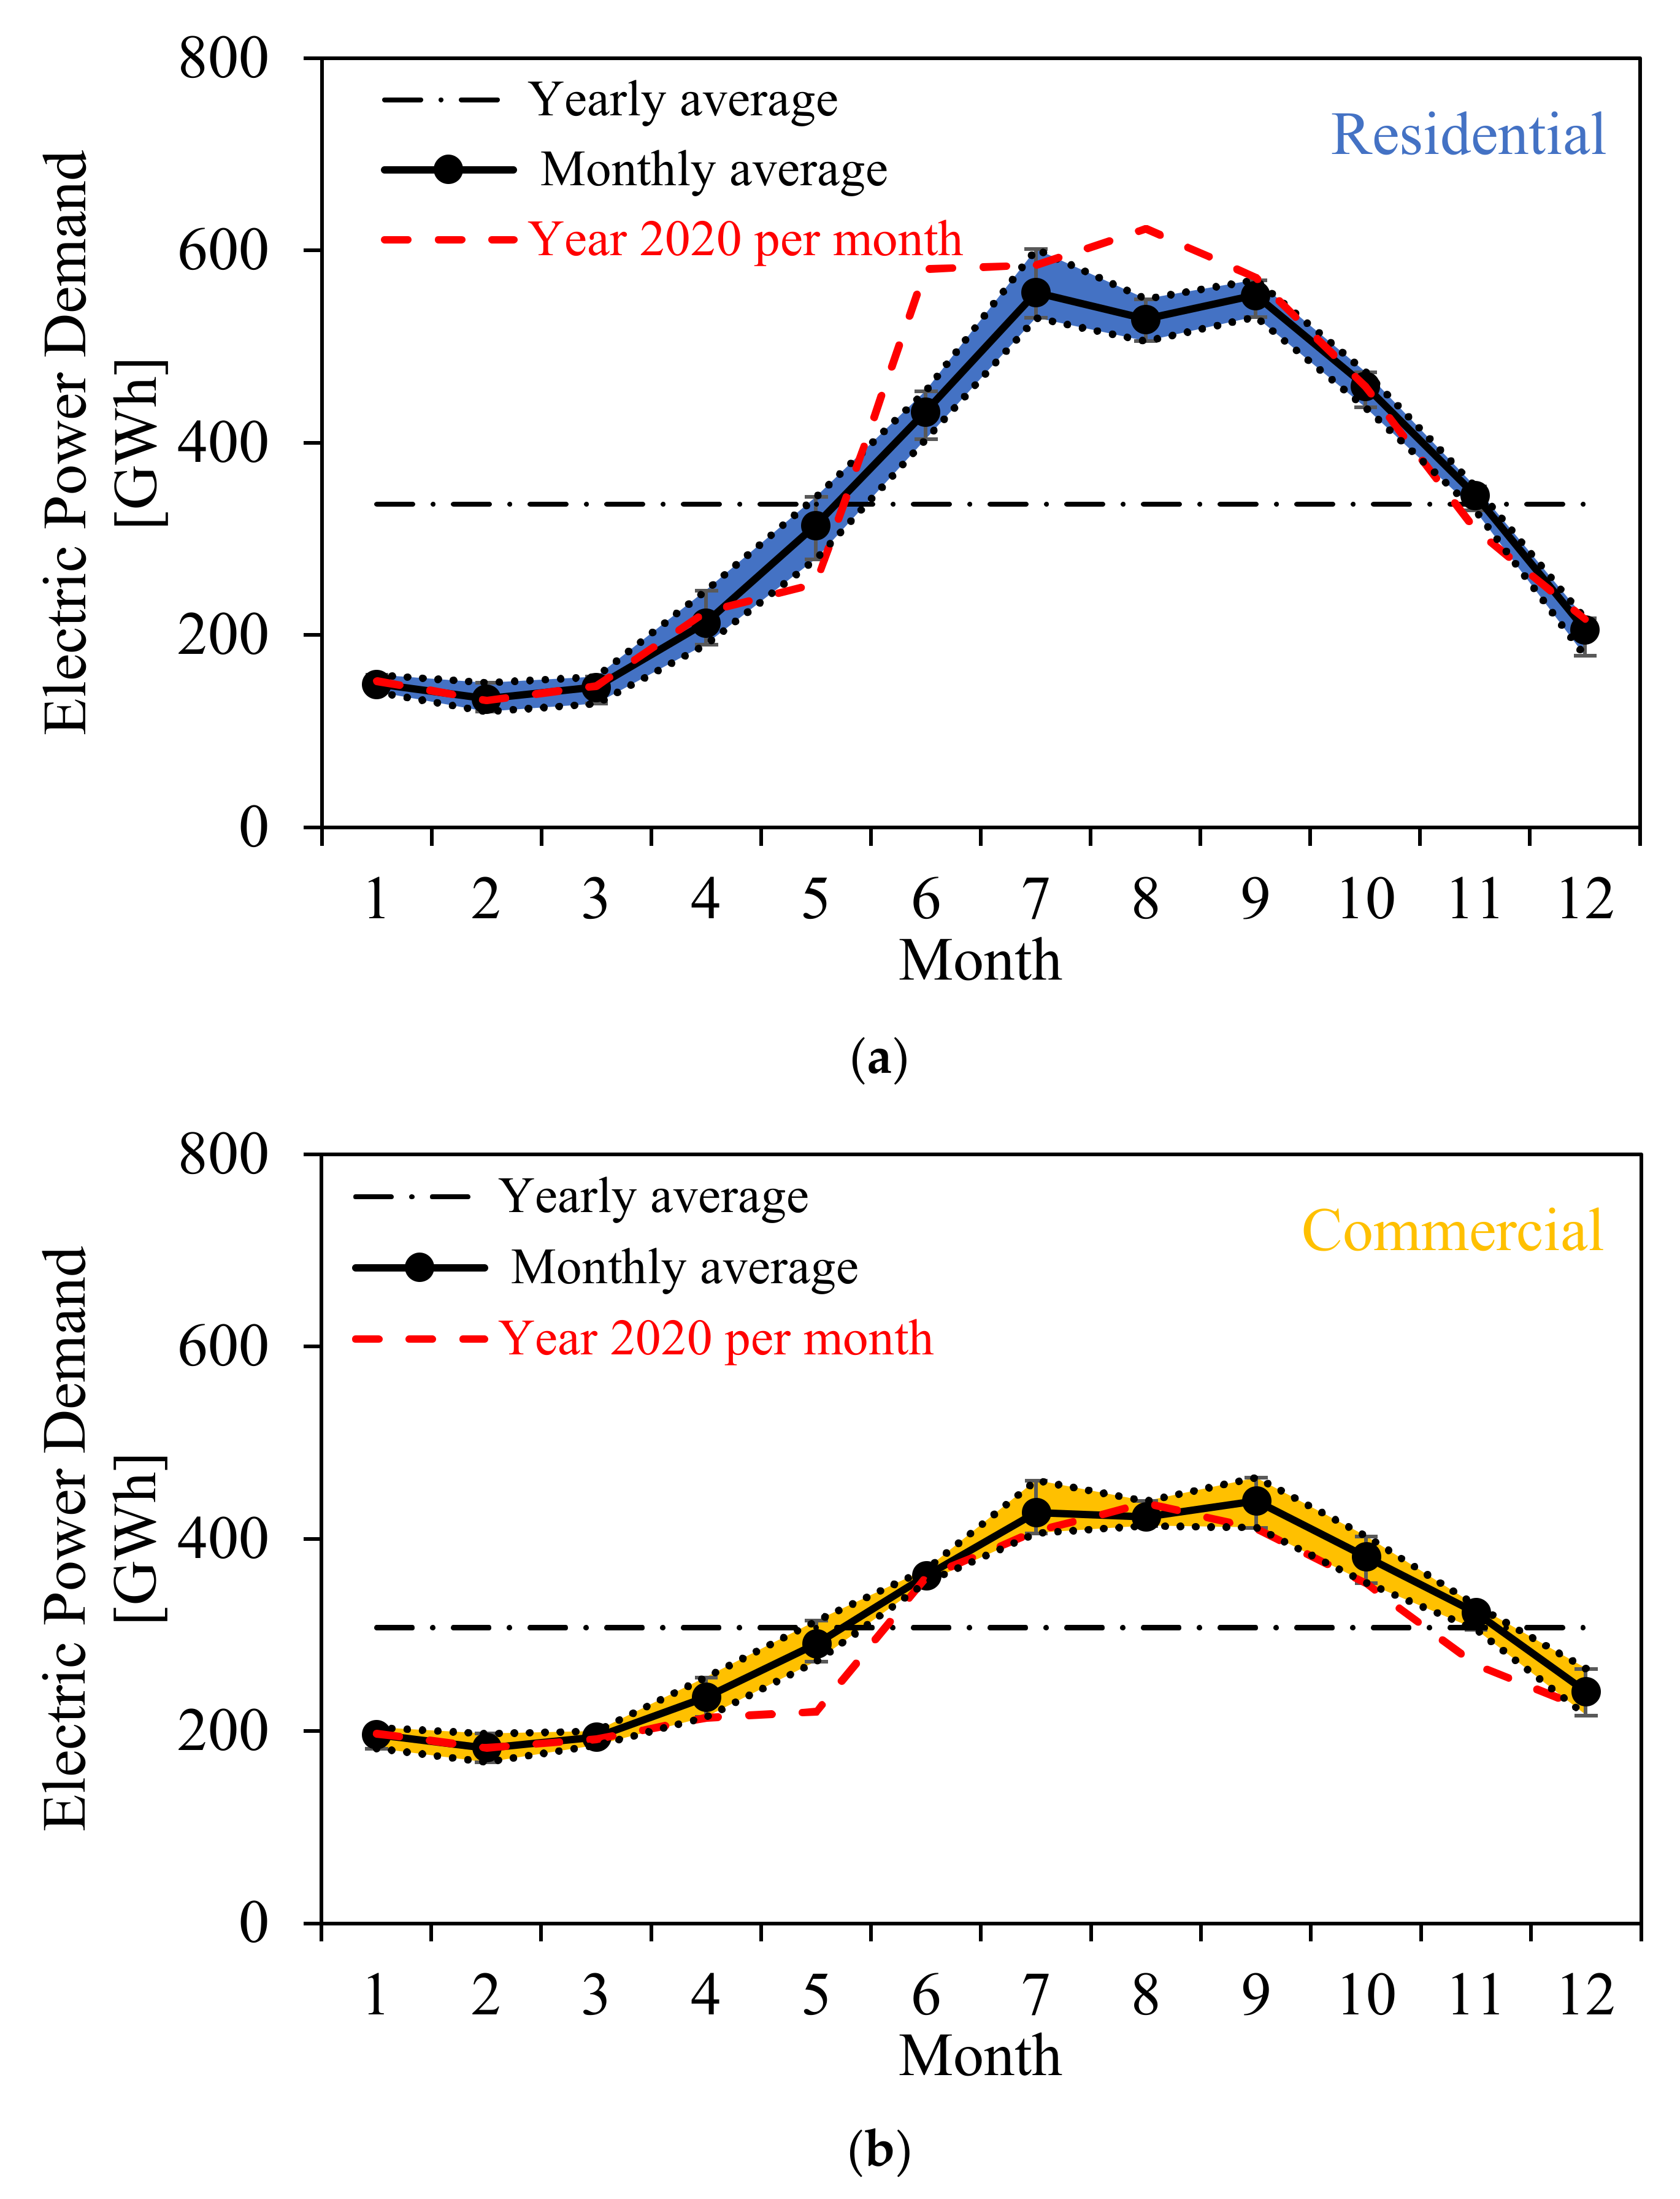
The monthly power demand per sector highlights the impact of the lockdown measures in 2020 in comparison to the average of the preceding years. Figure 7a represents the demand in the residential sector; as shown, the first quarter of 2020 and the fourth quarter were relatively equal to the yearly average. However, the apparent drop in demand during the month of May is mainly attributed to the availability of meter readers, who returned back to service delivering an apparent increase in demand for the month of June and reported higher demand in August and September of 2020 in comparison to previously reported years. On the contrary, the commercial sector witnessed consistent levels of demand in the first and third quarters of 2020, yet the lockdown period had a demand lower than the average, as evidenced in Figure 7b. From September 2020 onwards, the commercial demand decreased below the yearly average.
3.2.2. Industrial and Government Sectors
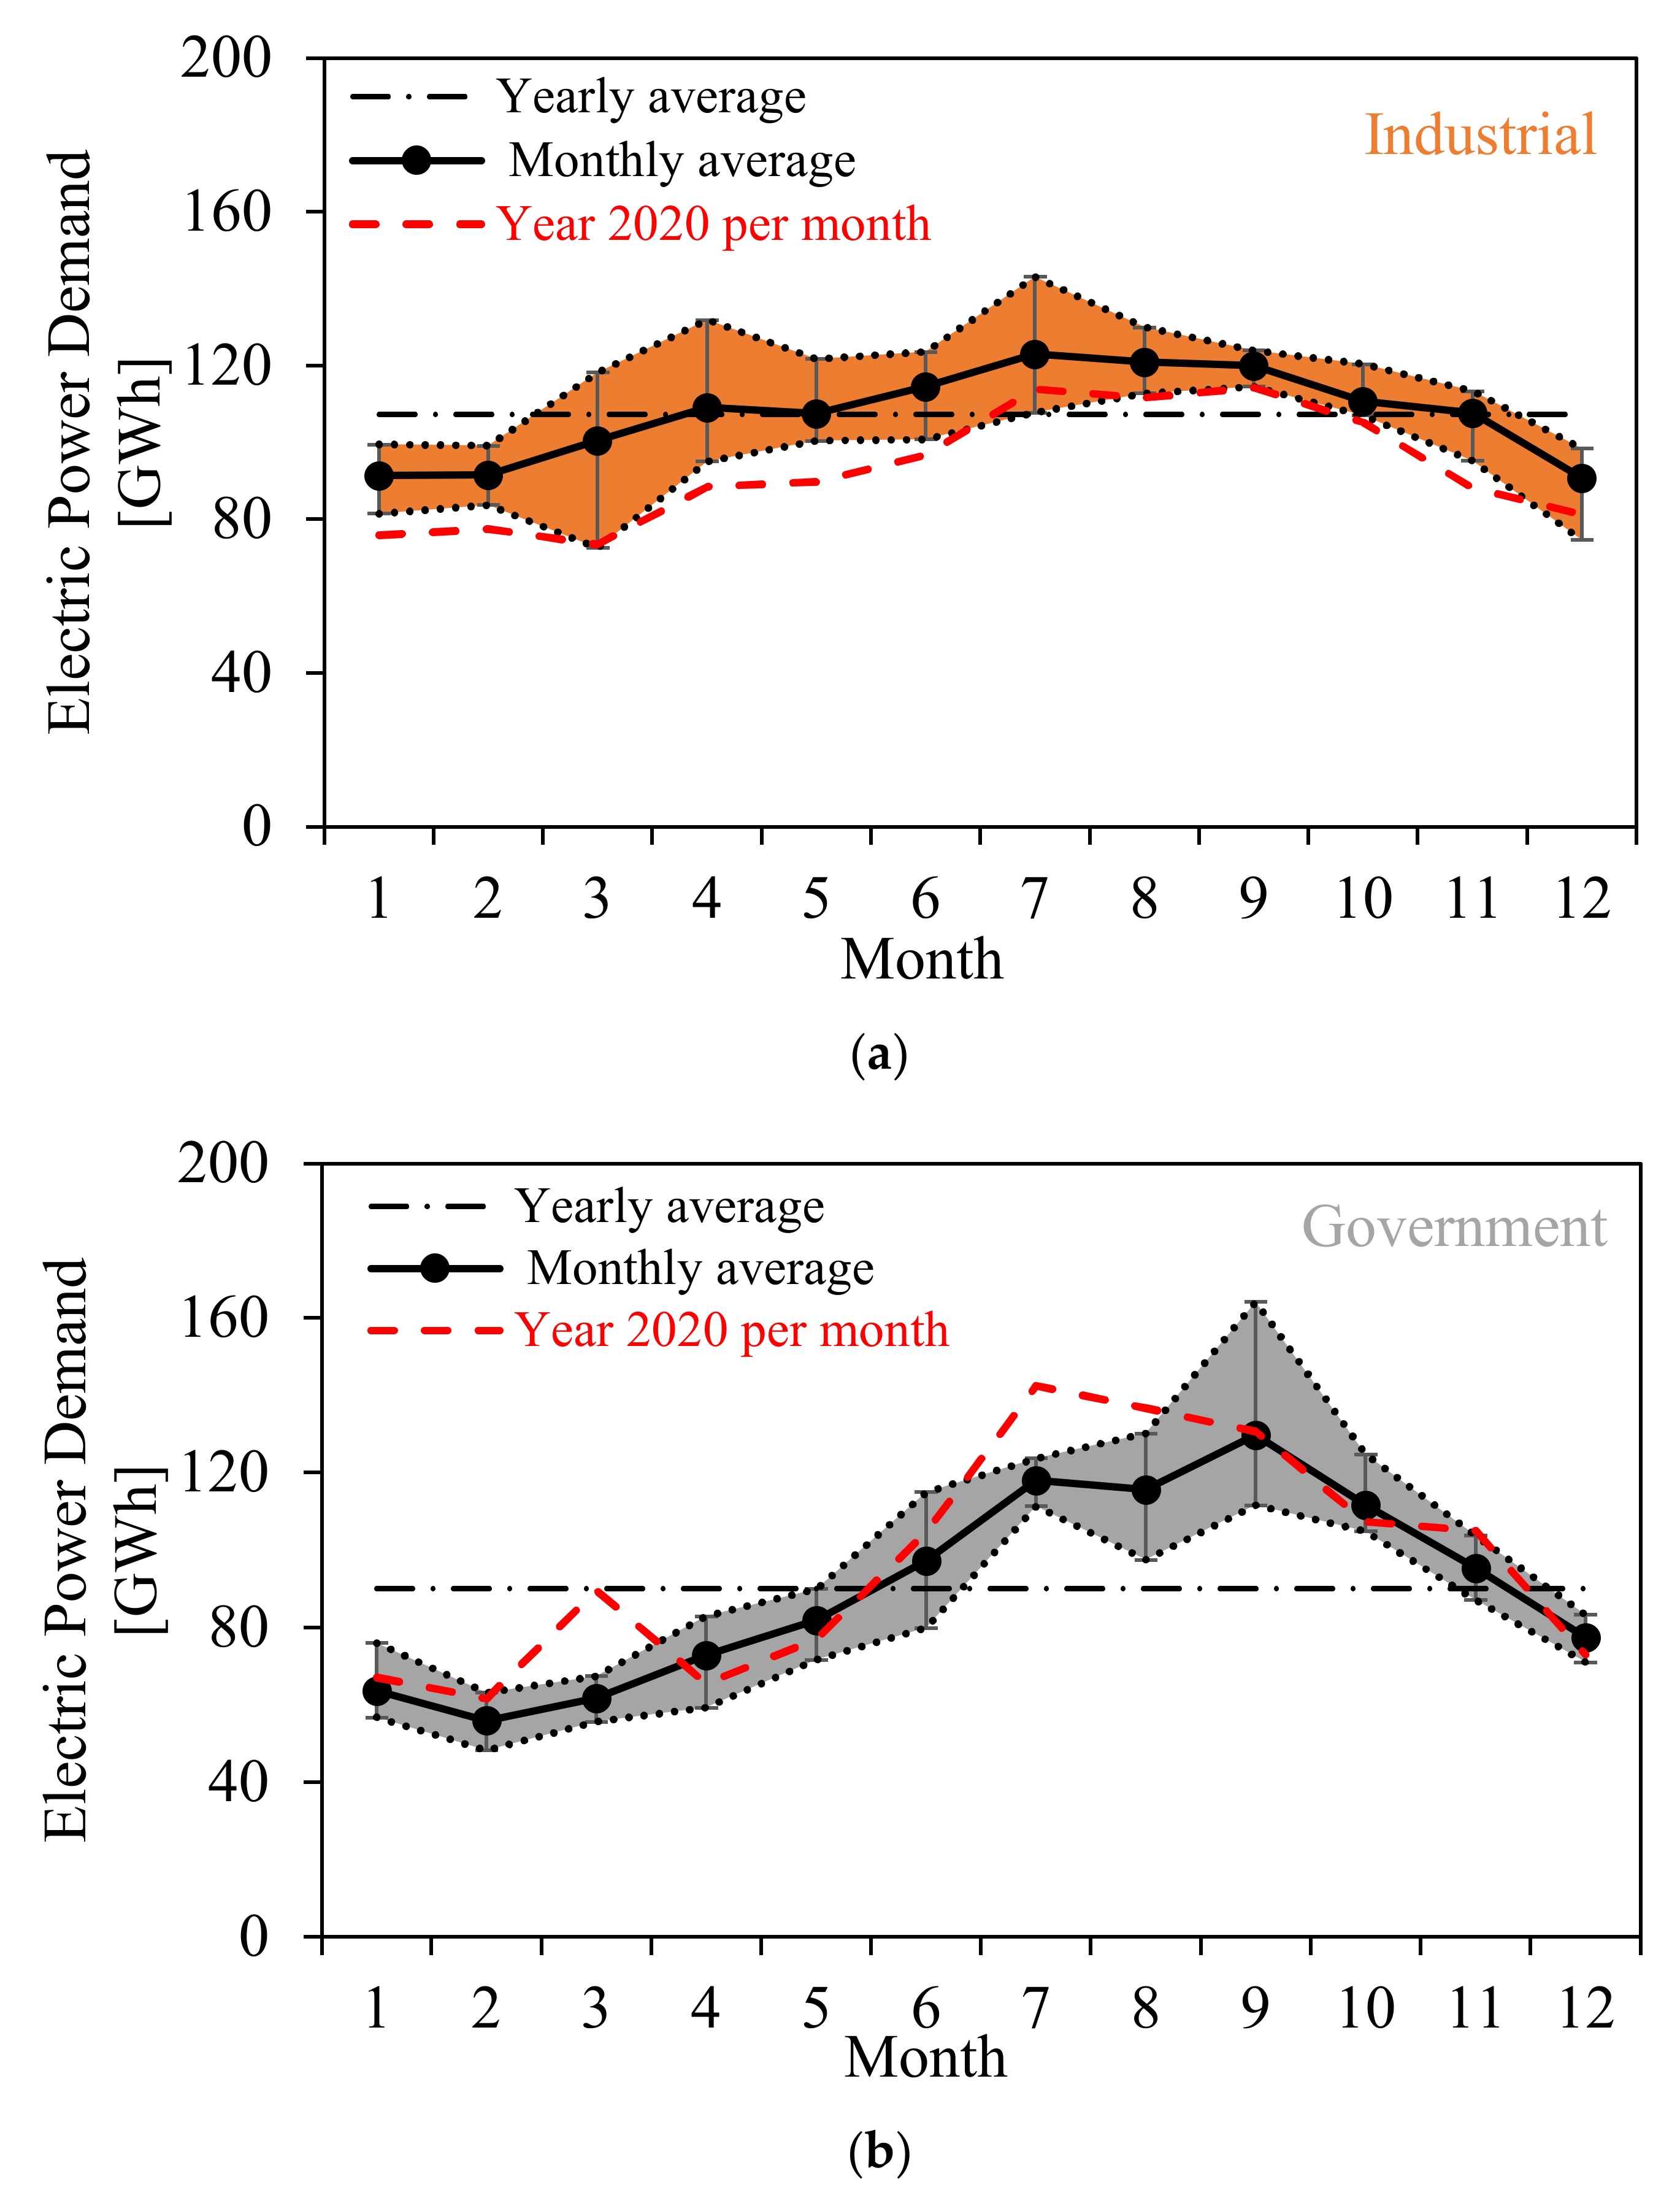
In the industrial sector, it is evident in Figure 8a that the power demand throughout 2020 is predominantly lower than the yearly average. The largest difference in the demand of 2020 and the yearly average is noticed during the lockdown period (March to May). Moreover, the government sector does not follow a similar pattern to the industrial sector. Instead, Figure 8b indicates that the government’s demand had a fluctuating pattern in 2020, with a sudden increase in March and July–August. The remaining months had a demand that is relatively similar to the yearly average. Hence, the impact of the lockdown period is evident in the reduction of the demand in the industrial sector and the temporary increase in the demand in the government sector.
3.2.3. Agricultural Sector
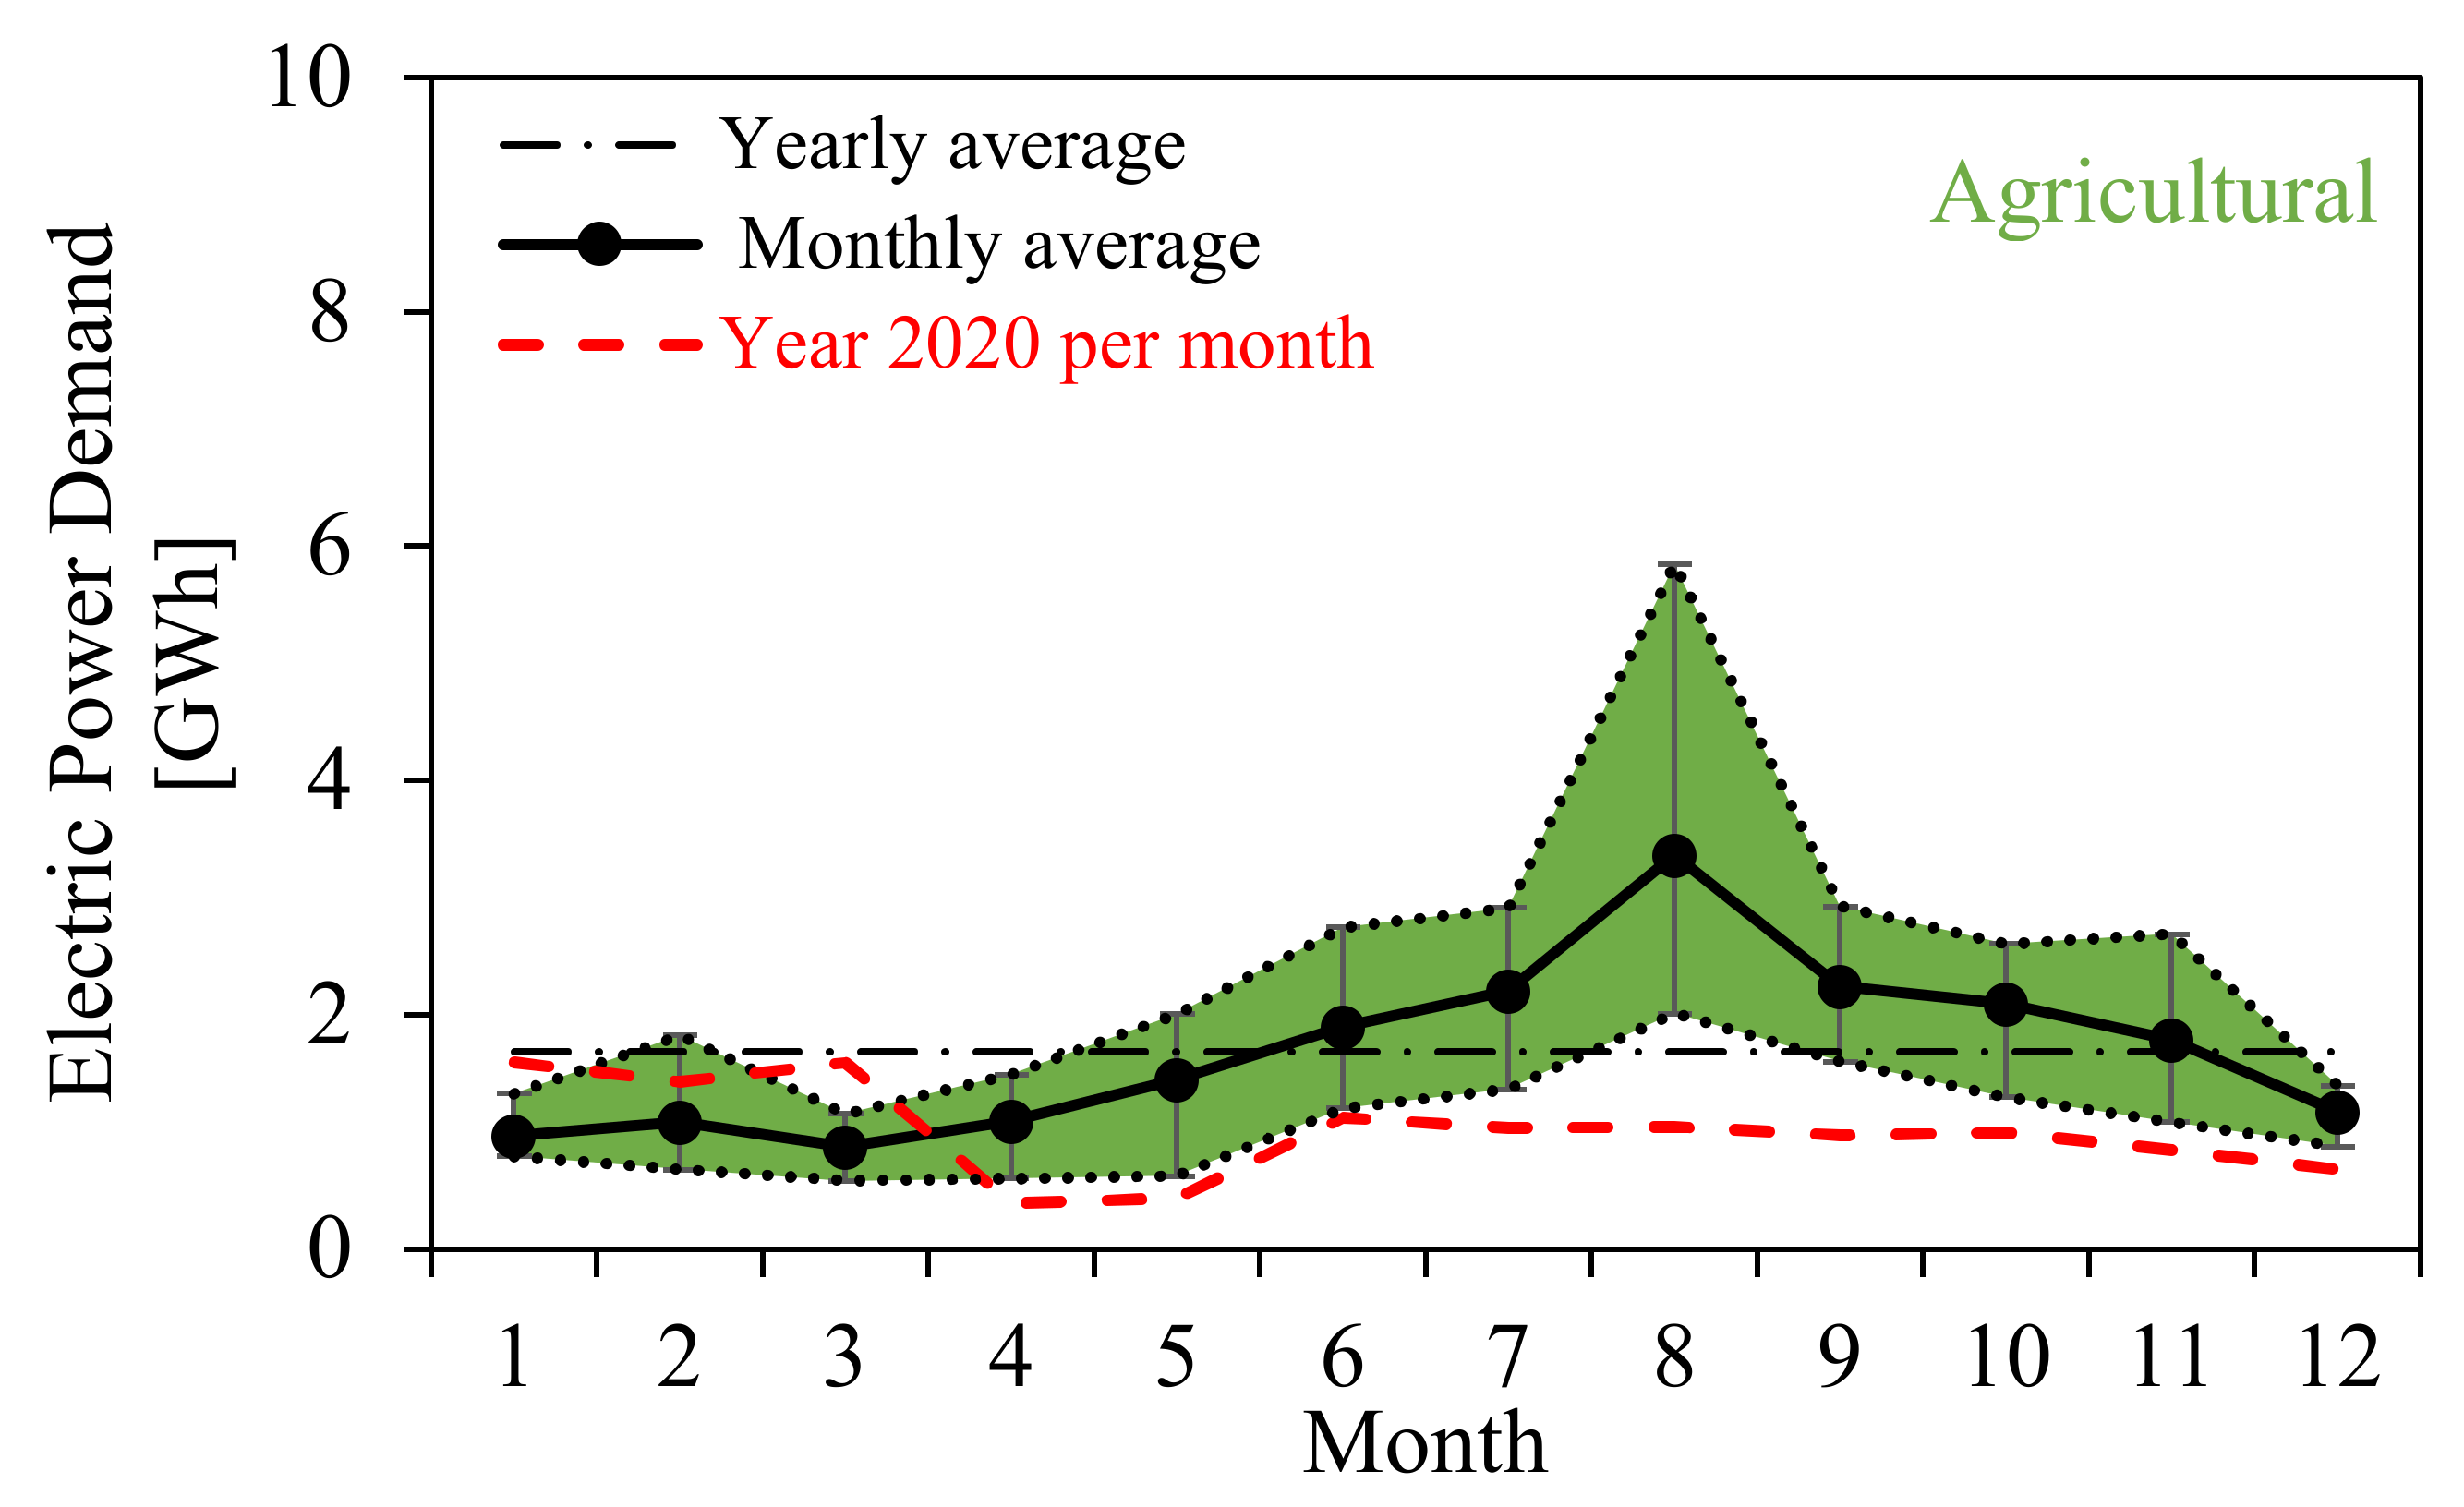
Although the agricultural sector demand is relatively low in comparison to the other sectors, it was also affected by the lockdown measures. The first quarter of 2020 witnessed an increase in the power demand in comparison to the yearly average, as shown in Figure 9. However, from the beginning of the lockdown onwards, the demand of the agricultural sector decreased significantly below the average. For the rest of the year, the agricultural demand remained below the average, implying that the sector had been affected over the long run, and not only temporarily during the lockdown period.
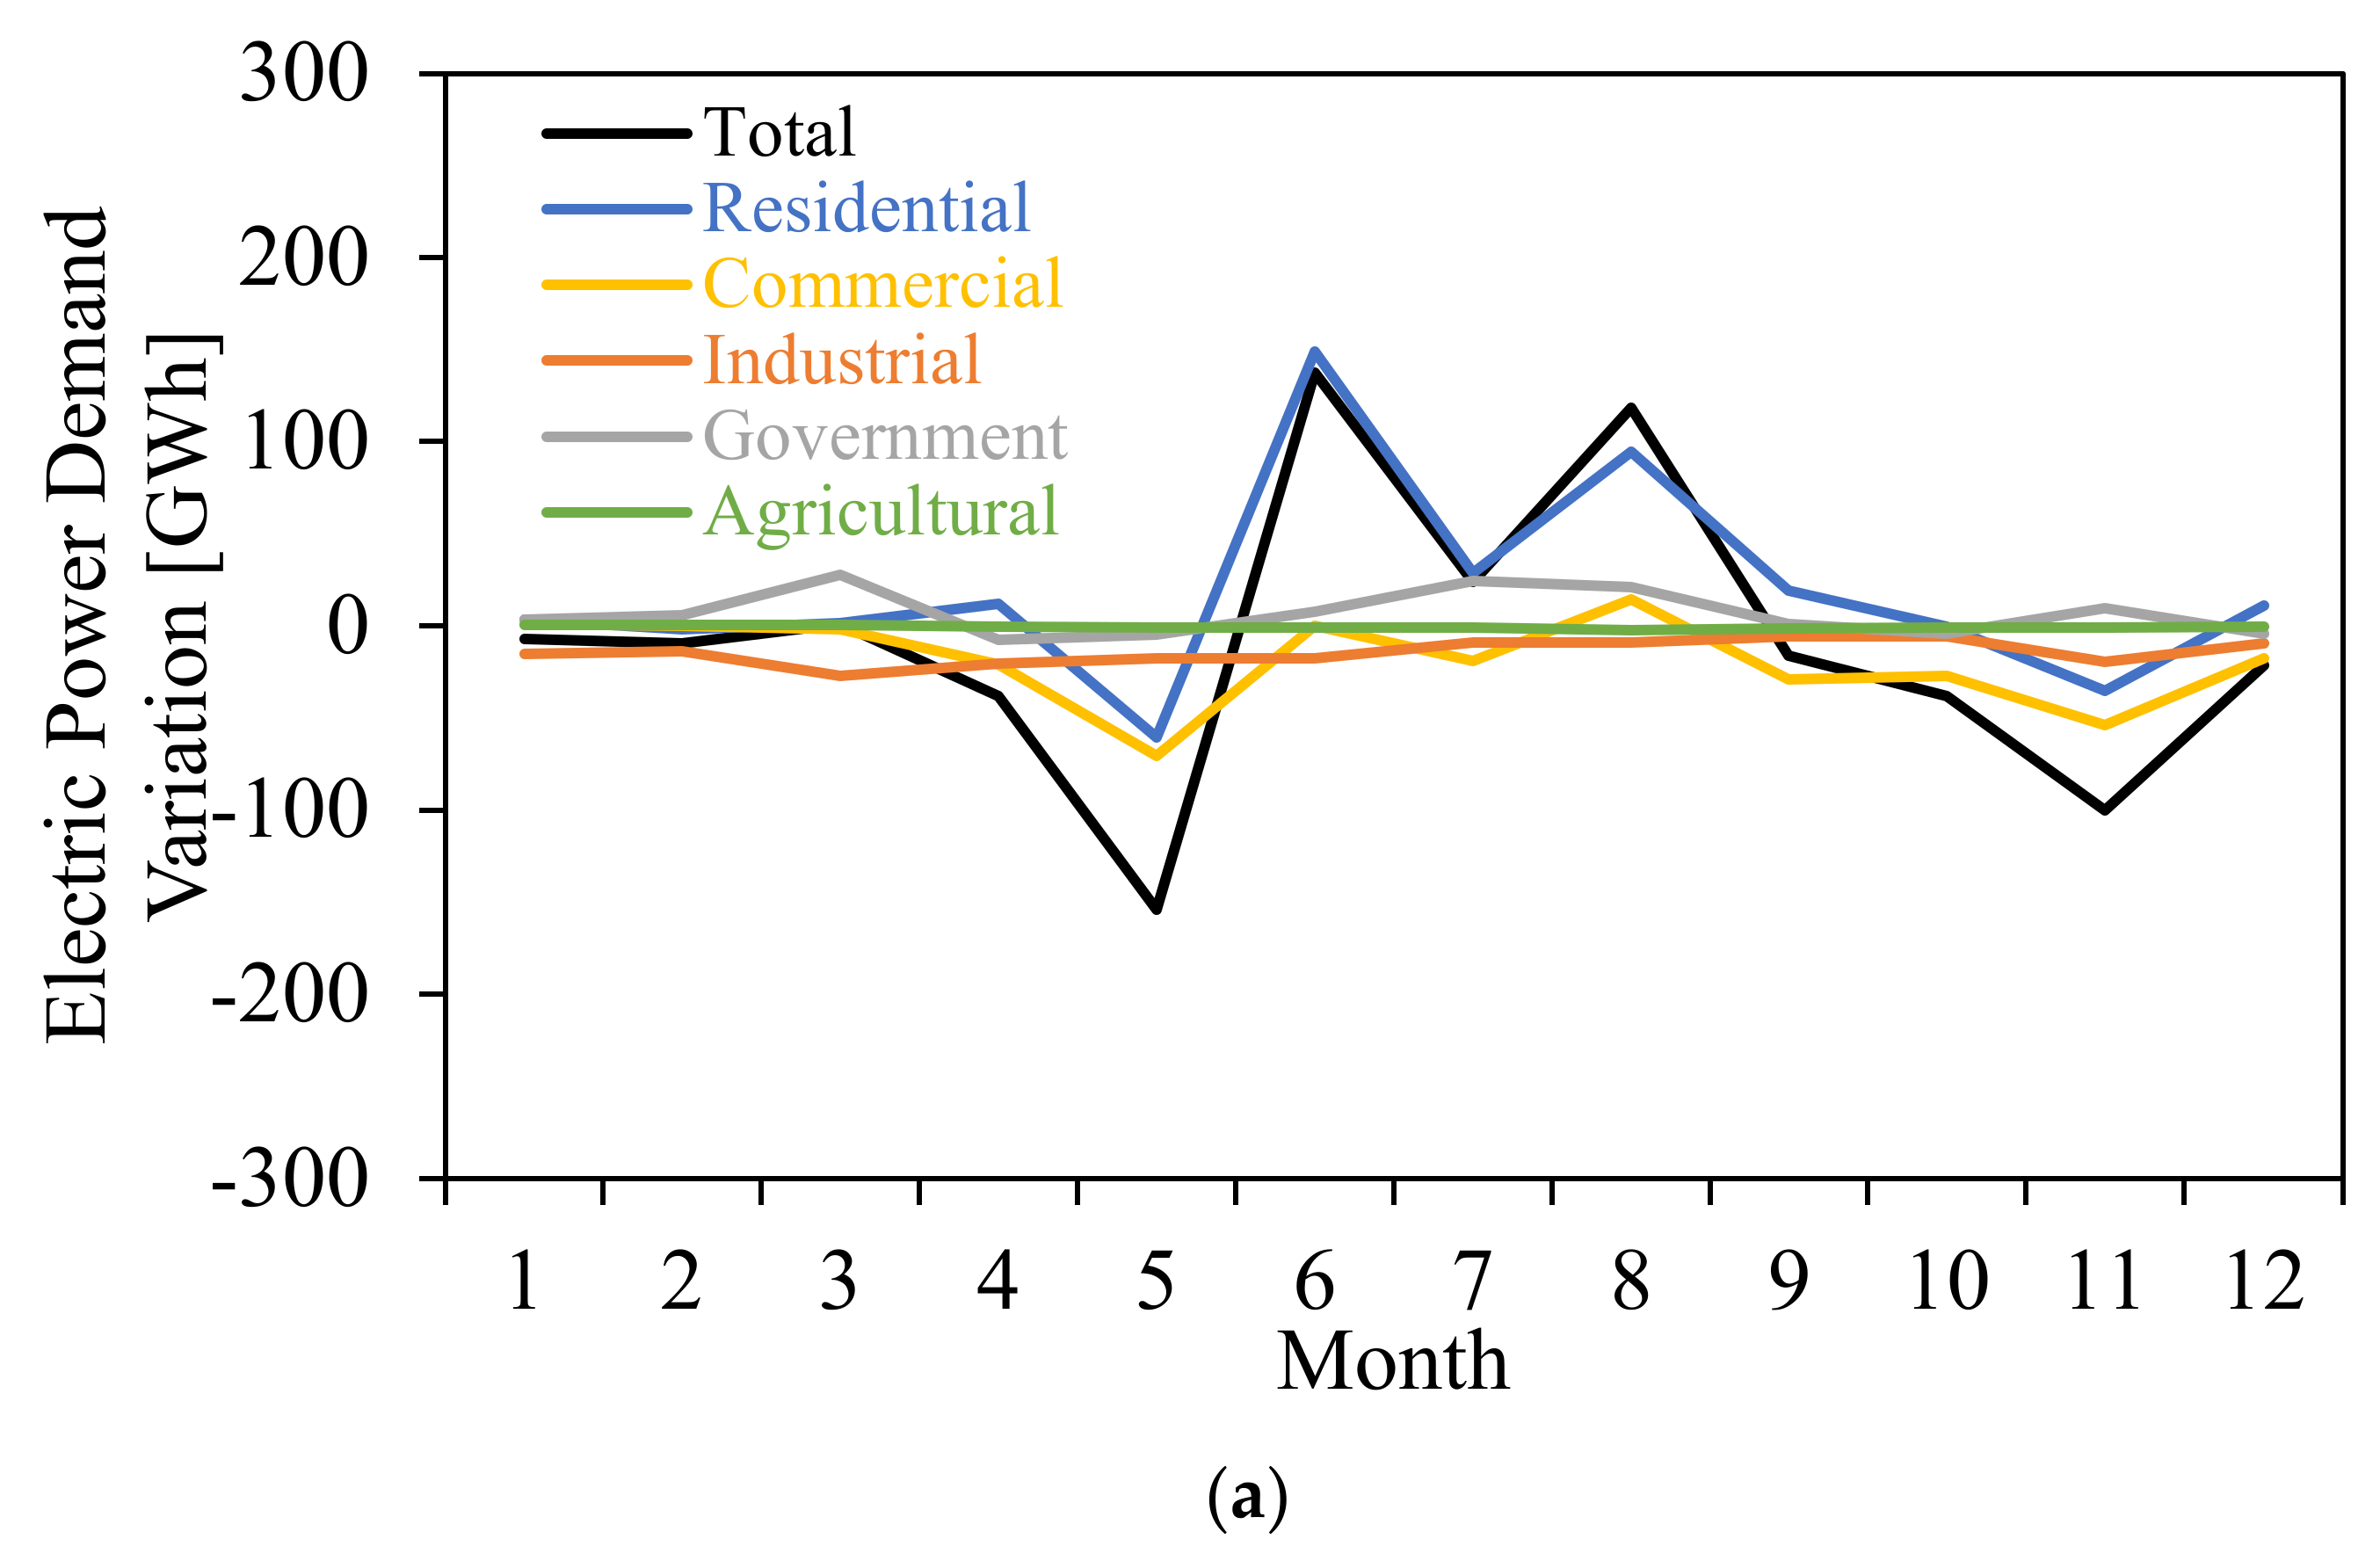
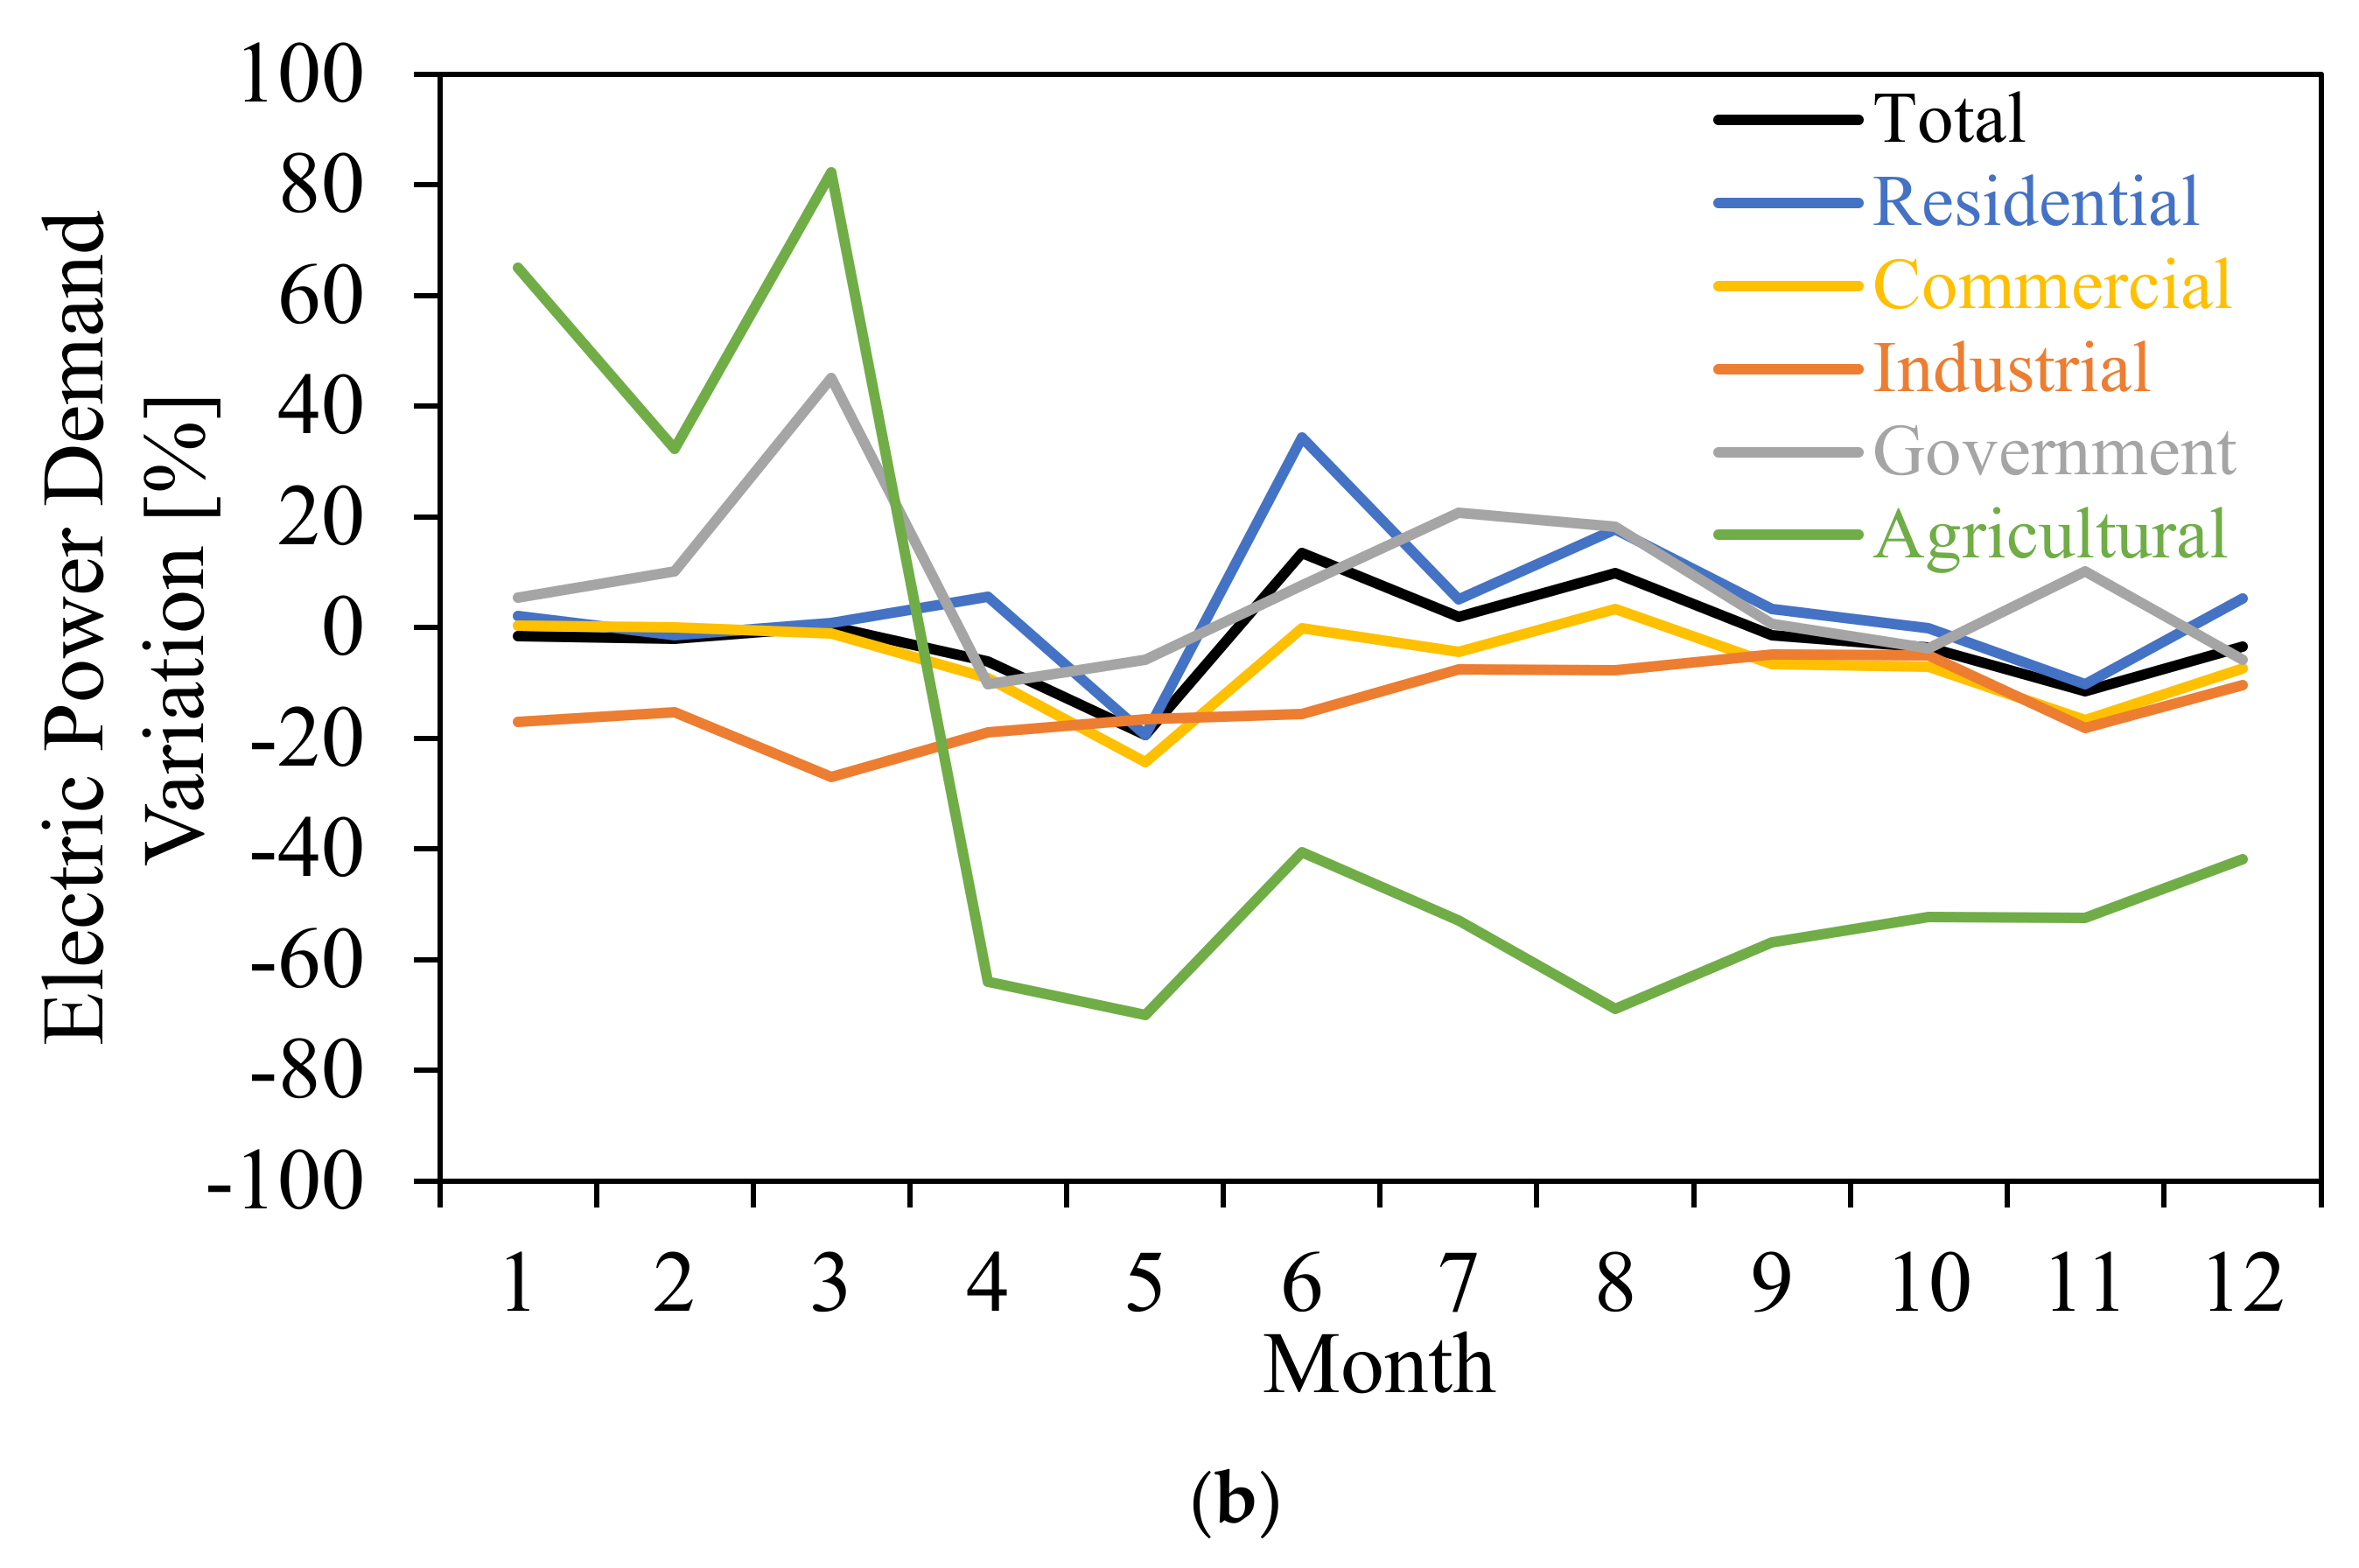
3.2.4. Overall Electric Power Demand Variation
In general, the lockdown measures in Sharjah City affected the power demand across all five sectors. In general, some sectors were affected temporarily for the duration of the lockdown measures, such as the residential, commercial, and government sectors. On the other hand, the industrial sector was affected from the beginning of the lockdown till the end of the year, having predominantly lower average power demand than the preceding years. In the case of the agricultural sector, there was an increase in comparison to the average of previous years, at the beginning of 2020, and a sudden decrease after March (Figure 9). The only notable increase in 2020′s power demand is noticeable in the residential sector during the summer months, in the government sector during the lockdown period and the summer months, and in the agricultural sector during the first quarter. The remaining months had an average or relatively lower than average demand across all five sectors, as seen in Figure 10a,b.
4. Discussion
The results of this study show that, in general, power demand in Sharjah City was only slightly affected due to the lockdown measures. The following sections briefly discuss some of the consequences of the lockdown for Sharjah City, as well as how they compare to the global trends. In addition, they touch upon the possible environmental challenges and discuss the perspectives of the energy authority in the Emirate of Sharjah.
4.1. Sharjah, UAE Lockdown Consequences
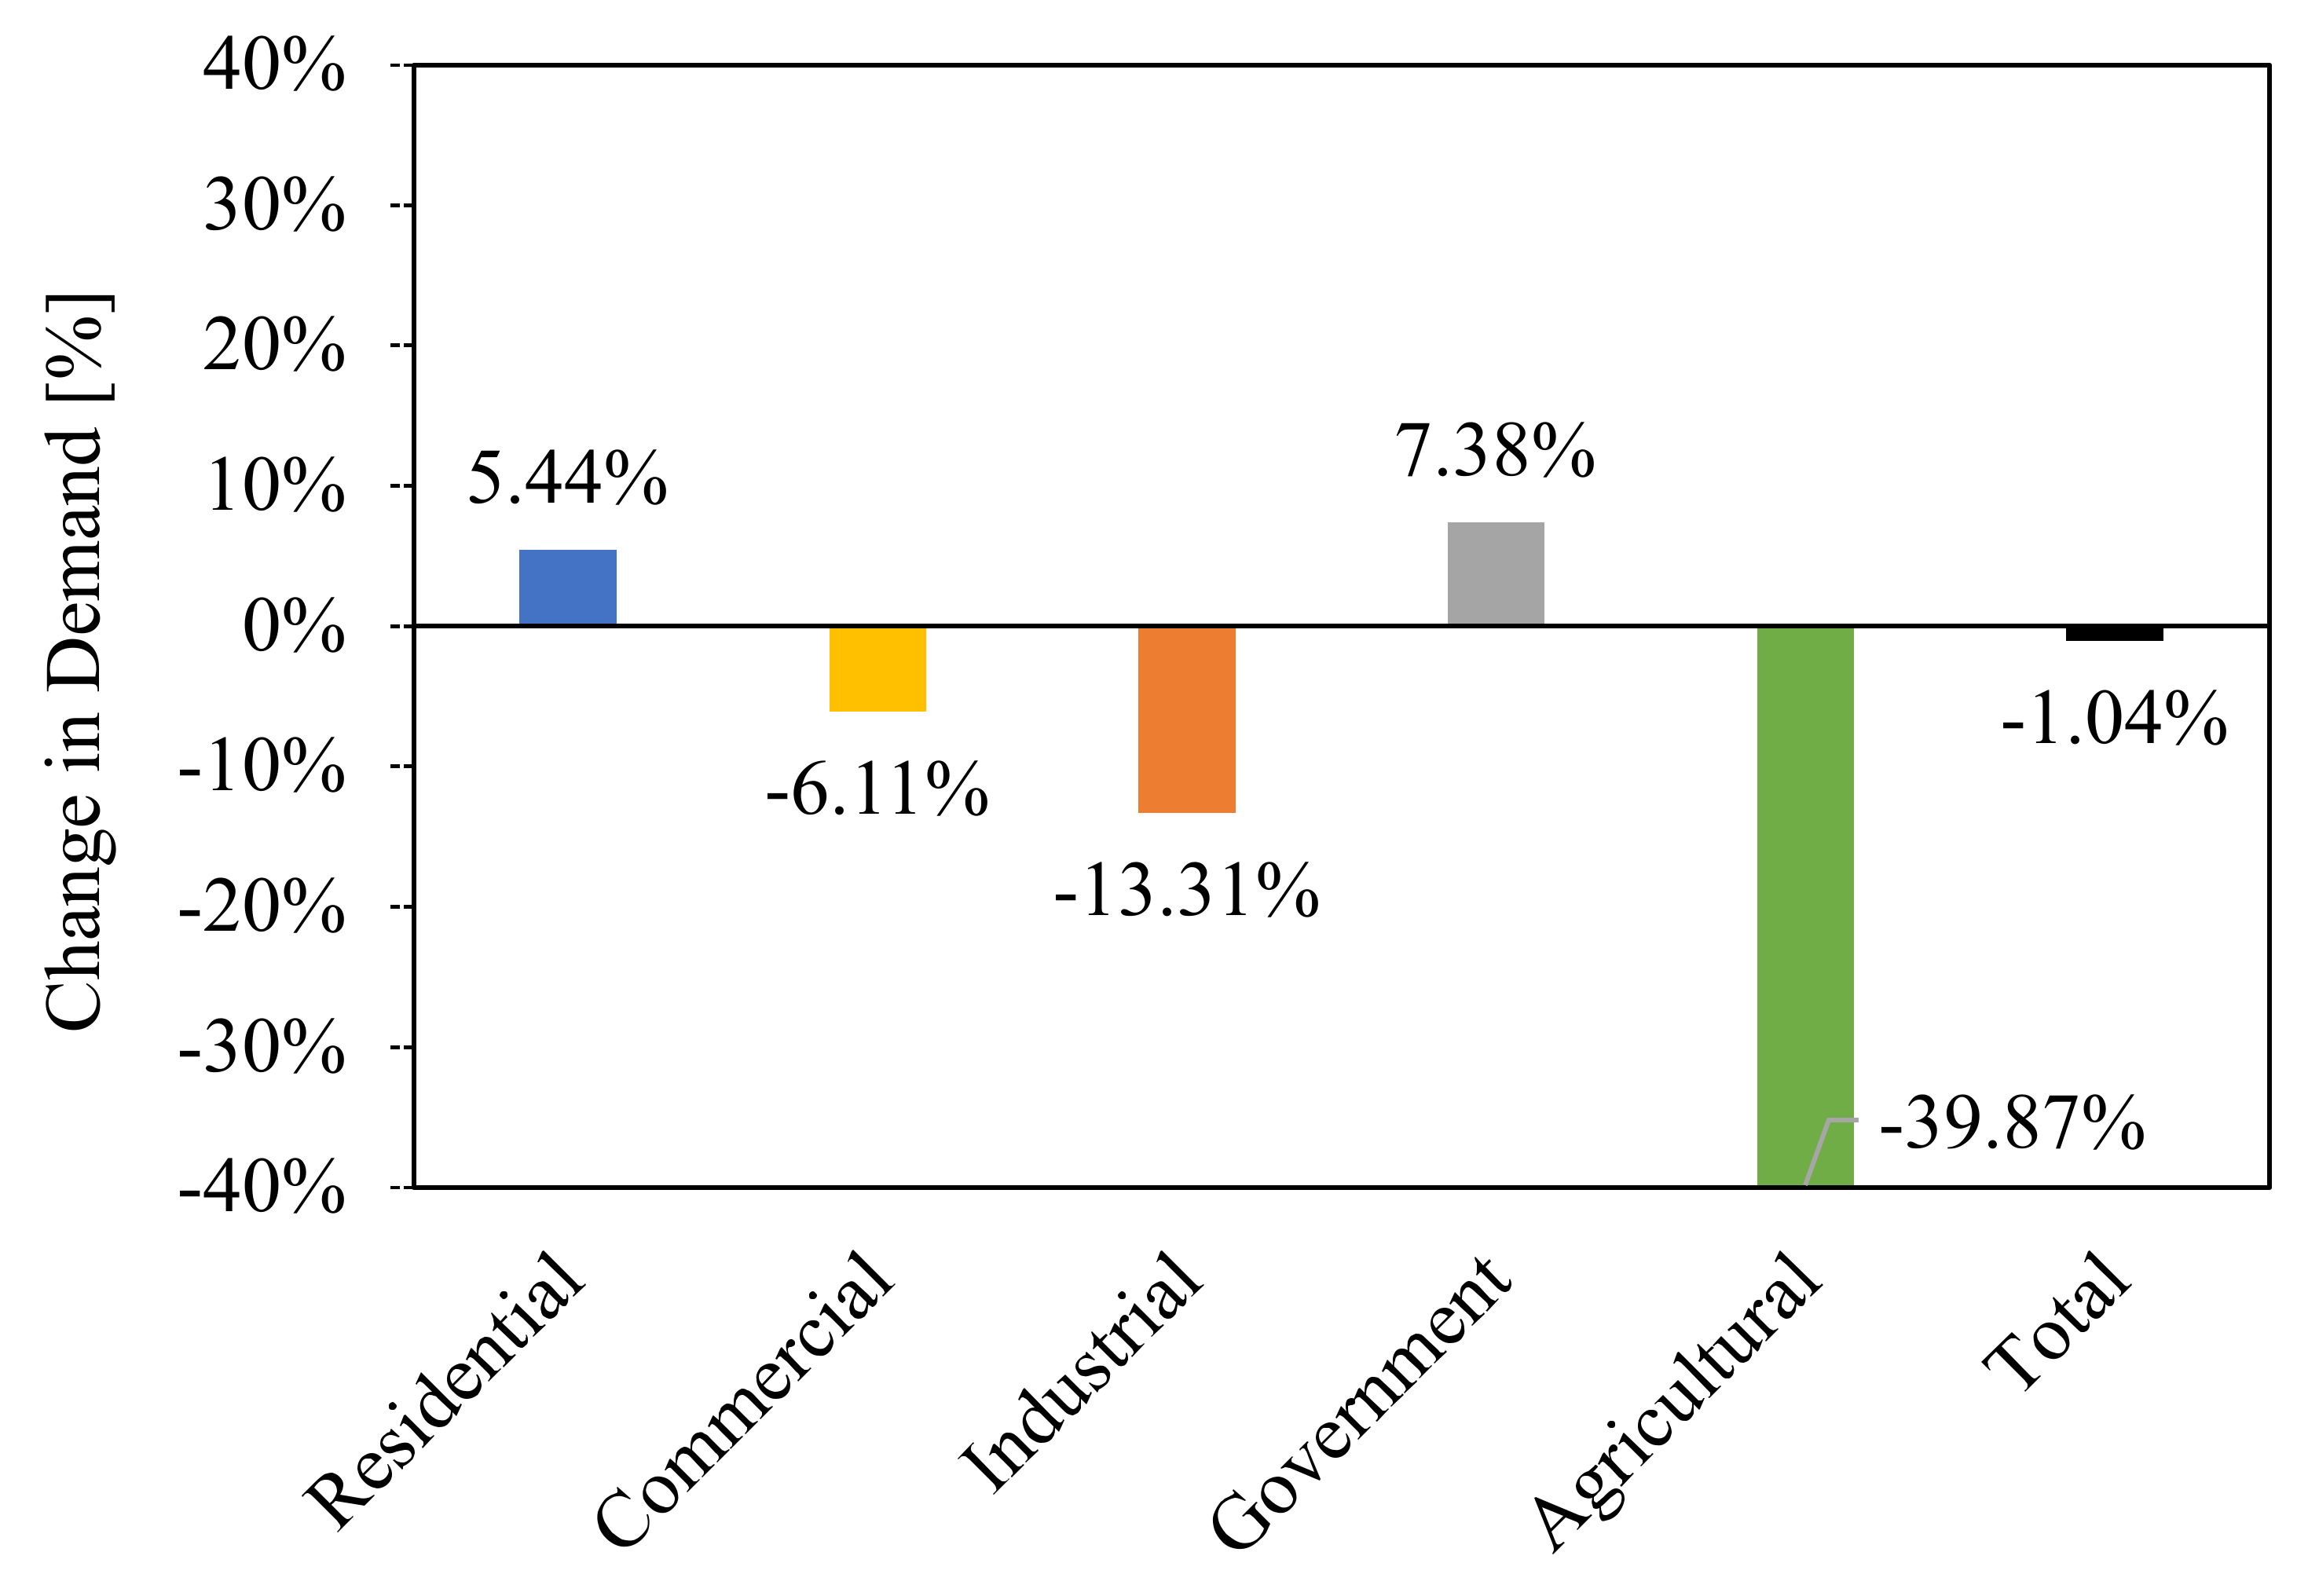
The impacts of COVID-19 and the lockdown measures on the electric power demand in the City of Sharjah are evident across all sectors. As indicated in Figure 11, some sectors were impacted more than others. The residential and government sectors witnessed an overall increase in demand, calculated at 5.44% and 7.38%, respectively. On the other hand, the commercial, industrial, and agricultural sectors witnessed an overall decrease in demand, calculated at 6.11%, 13.31%, and 39.87%, respectively. The total variation in the power demand in Sharjah was 1.04% lower than the average of the preceding years (2016 to 2019). Although the total variation is not primarily significant enough to conclude that the electric power demand in the city was affected by COVID-19, the impact on the independent sectors is surely significant.
In general, the obtained results imply that the electric power demand in Sharjah City decreased in the commercial, industrial, and agricultural sectors, which are directly related to production and the economy. By having a lower power demand, the output in these sectors is estimated to be lower as well, leading to potential declines in economic status. On the contrary, the residential and government sectors witnessed a higher power demand, justified by the lockdown policies that required remote working measures (residential) and increased use of service and medical facilities (government), such as the police, COVID initiatives, and hospitals. In comparison with global electricity consumption, Sharjah City is considered among the least impacted cities by COVID-19 and the lockdown measures, with a decrease of 1.04% throughout the year 2020. During the lockdown period alone between early March 2020 and the gradual reopening towards the end of May 2020, the overall power supply was reduced by 6.85% in comparison to the previous years between 2016 and 2019 over the same period. With the results obtained in this analysis, it can be argued that the short-term impact of COVID-19 measures in Sharjah City is minimal, leading to a reduction of 1.04% in overall electricity consumption. Although there were shifts in the consumer patterns, the same population performed the same functions from different places, such as working from home or studying at home.
This study highlights that the impact of COVID-19 measures on the electricity consumption in Sharjah City in comparison to other countries, in terms of energy consumption and environmental impact, could be considered acceptable.
4.2. Global Energy Demand Trends
At a global level, research reported changes in the patterns of energy consumption. In Italy, it was reported that during March and April, increasing lockdown measures led to a decrease in the national energy demand. The pandemic triggered up to a 25% decrease in consumption of electricity in comparison to the same period in 2019 [5]. In Turkey, the electricity consumption values between 2019 and 2020 reflected a reduction of 22% in April and 17% in May [13,14]. In Japan, electricity demand also reported a reduction to varying degrees for all studied areas due to the COVID-19 pandemic. When comparing the years 2019 to 2020, the cities in Japan had a demand reduction ranging between 2.5% and 7.5% [15]. In Ontario, Canada, monthly electricity demand reduced 14% and the largest decrease in regular energy demand was found on weekends, with 18% daily decline on average [16]. Spain observed a 13.49% decrease in electricity consumption compared to the five-year average of previous years [17]. Brazil’s electricity consumption was highly affected by mobility limitations and witnessed a decrease in multiple sectors such as the residential, manufacturing, and commercial sectors, and an overall decrease of 11% in consumption by May of 2020 [18]. Similarly, Kuwait witnessed a fall in the demand for electrical power of 17.6% compared with the expected demand, characterized by an increase in electricity consumption in the residential sector due to lockdown implementation and schools shifting online, as well as working from home, while other sectors such as governmental, industrial, and commercial sectors shut down, resulting in a large decrease in electricity consumption, more than the increase in the residential sector [19].
Similarly, a study based in India reported increased residential energy consumption levels due to home quarantines and home transformation factors in which people conducted changes (transformations) to their house environment to make it suitable for online work and education [20,21]. The International Energy Agency (IEA) reported similar increased residential use of electricity in India, France, Spain, and Great Britain [2].
A study by Madurai Elavarasan et al. summarized and assessed the international energy demand reduction and reported a decline in energy demand ranging from 4.9% to 7% in countries such as Germany, UK, Belgium, Portugal, Spain, USA, Australia, and Belgium. An 8% in energy demand reduction was observed for Singapore and China. The highest reported reductions in energy demand as reported in the study were in India (26%), followed by France (14%), and Italy (11%) [22]. Hence, many countries observed increased residential water and electricity consumption.
4.3. Factors Associated with the Changes in Energy Demand
To understand the reasons pertaining to the differences in lockdown per countries, it is important to understand the measures applied by each country during their respective lockdowns. In general, most countries experienced commercial and industrial loads reduction, whereas residential load increased due to the restrictions. For example, countries like Italy had a lockdown that extended for several months as opposed to the lockdown in Sharjah that was imposed for approximately 2 months. Hence, it is predictable that the impact on electricity in Italy is larger than that of Sharjah. Additionally, understanding the sectors and their electricity consumption plays a major role in understanding the patterns. In Sharjah, the industrial area consumes up to 20% of the power, whereas other countries may have larger industrial sectors with larger power demands. Given the lockdown measures, limitations on imports and exports, and travel restrictions, such industries might have been affected or halted temporarily, leading to the reduction of a larger percentage of electricity when compared to Sharjah City.
The impact of the travel restrictions on electricity consumption also contributes to the changes in consumption patterns. Typically, the summer season is considered a peak travel season for the UAE’s population in order to escape the heat. Another reason for the typical rise in travel during the summer months is the large proportion of expat population in the UAE, with children having their annual school vacations, hence families would travel “back home” in order to escape the heat and meet with their families. In the UAE, the expatriate population living in Sharjah is estimated to be more than 1.2 million [10]. Due to the travel restrictions in 2020, the population remained in their residences in the UAE throughout the year, which may have indirectly led to an increase in the residential sector’s consumption. Corpus-Mendoza et al. documented the change in average electricity demand by continent from March 2020 until June 2020 as compared to 2019. The results revealed a decrease in the average electricity consumption curve in Asia, the Americas, and most of Europe, except for Norway and Switzerland. The drop in electricity consumption in most continents was attributed to the closure of transport stations and marketing sectors, the decrease in industrial and commercial activity, and increased work from home. In the case of Norway and Switzerland, Corpus-Mendoza et al. suggested that the countries are more focused on tertiary sector activities that were not profoundly affected by the pandemic [23].
Additionally, the differences in infrastructure for regional and power generation in different regions played a major role in the load demand reduction. A study assessing the long-term impacts of COVID-19 on electricity consumption in the United States observed that commercial electrical consumption is more geographically uniform and is not affected by climate or population size, compared to the residential and industrial sectors [24].
4.4. Environmental Consequences of COVID-19 during Lockdown
Overall, the pandemic had a beneficial impact on the environment around the world for the lockdown period. Since the manufacturing industry is a significant contributor to CO2 emissions, countries with higher industrial economies saw more CO2 reductions than others. It is common for nonrenewable power plants to burn fossil fuels as a dependable source of energy and it is known that they emit a significant amount of pollution and GHGs during the manufacturing process [19]. As a result of factories closing and the decrease in burning fossil fuels for industries, there was a significant change in the environment, such as the decline in the level of air contaminants such as NO2 and global CO2 emissions [6]. Spain witnessed a 13.2% decrease in energy consumption which led to a reduction of 32.61% in CO2 emissions caused by electricity production [25]. In Brazil, the decrease in electricity consumption contributed to decreased CO2 levels and NO2 levels. Compared to previous years, the median NO2 and CO2 values were 24.1–32.9 and 37.0–43.6 percent lower, respectively, during COVID-19 [26]. The reduction was attributed to the reduced demand for energy production. However, the decline in nitrogen oxides (NOx) caused an increase in ozone concentrations in Brazil. Finally, Kuwait reported a reduction in CO2, NOx, and CO pollutant emissions emitted by power plants because of reduced fuel consumption [19]. In the case of Sharjah, the reduction of GHG emissions is minimal due to the low power reduction of 1.04%.
4.5. A Perspective from the Sharjah Electricity, Water, and Gas Authority (SEWA)
COVID-19 is solid proof of the critical importance of water and electricity infrastructure, and is a reminder for utility sectors to prioritize the resilience and sustainable management of water and electricity resources; adopt decision making based on data and information; provide unified and integrated platforms to enforce the workforce; and enable monitoring and controlling of the performance from remote locations. This pandemic outbreak has emphasized the importance of ensuring access to water and an uninterrupted supply of electricity. The lockdown that started in March 2020 in Sharjah-UAE changed the rates of consumption and caused the amount of supply to diverge to different sectors.
On March 24, His Highness Dr Sheikh Sultan bin Mohammed Al Qasimi, Member of the Supreme Council and Ruler of Sharjah, announced that residents in Sharjah will receive 10 per cent discounts on their utility bills issued by Sharjah Electricity, Water, and Gas Authority (SEWA). The discount was given for three months. Sharjah Ruler’s decision was in line with measures announced by him to ease the financial burden on citizens and residents during the coronavirus spread [27]. This announcement addressed the concerns reported in media about the expected higher utility bills for residential sectors during the lockdown. Although such actions can lead to general changes in demand, the announced 10% discount was directed towards the total bills which included all utility services (water, electricity, and gas), and was limited to residential sectors for the period starting in March until May 2020. The residential electricity and water consumption contributed to 38% and 64%, respectively, during this period. Therefore, the 10% discount had much less impact on electricity bills compared to water. Moreover, the population was advised to be cautious in their use of electricity to ensure that overuse and overconsumption did not become an added issue.
What impact did COVID-19 have on electricity demand and supply during the lockdown? Could the COVID-19 outbreak result in a sudden unexpected increase in demand? What is the utility company doing in terms of generation fluctuation and network resilience to satisfy the change in demand for different sectors? This study provides some answers to these questions by analyzing and assessing the electricity demand from billing data and load dispatch center for Sharjah City during 2020 compared to the average of 2016–2019.
Although the overall impact of the COVID-19 outbreak was minimal on electricity services during 2020, a business continuity plan helps utilities plan and prepare for any kind of interruption to operations, including disease outbreaks. An emergency plan that secures continuous operations with reduced employee levels and at the same time considers protection of employees during pandemic outbreaks is essential for future outbreaks.
4.6. Additional Remarks
COVID-19 and its implications have greatly impacted human society in numerous ways. In general, the demand for electricity decreased during lockdown, and then rebounded right after. This rebound makes it more important than ever for countries to continue to research and implement renewable electricity and energy sources. It is inevitable that modern society will continue to rely on electricity and technology for the foreseeable future, so it is a must that sustainable and reliable sources of energy and electricity are available. The pandemic reminds us of how indispensable electricity is and provides us with insights on where our future is heading. Therefore, COVID-19 should be taken as a learning experience for countries worldwide to ensure sustainable payback and reliability in the future. As reported by Jiang et al. 2021, the challenges of COVID-19 have developed and have had a great impact on many industries, but especially the energy industry. Some of these challenges include structure and pattern changes, demand fluctuation and uncertainties, energy recovery, and environmental impacts. On the other hand, it also led to some opportunities, including the stabilizing of energy demand by considering extra energy demands and the inclusion of sustainable waste management, improvements of lifestyles with lower energy usage, circular economy, and energy saving plans, amongst others [7]. Hence, this study sheds light on the need for improving both the sustainability and the resiliency of the global energy sector by determining factors that can regulate high energy consumption in different sectors and utilizing them in order to enhance and control the way energy is used and conserved. Therefore, this study will be useful for governments, policymakers, and stakeholders around the world to provide the basis for addressing scenarios similar to this pandemic in the near future.
5. Conclusions
COVID-19 has had inevitable effects on people’s health, economy, and social wellbeing and has affected several aspects of life, including the global and local energy sector. The lockdown measures impacted the operations of businesses, industries, and transportation, leading to a change in the patterns of electricity demand and supply. Globally, some countries witnessed significant reductions of power demand, while others witnessed less significant impacts. This study investigated the impacts of the COVID-19 pandemic on Sharjah City electricity consumption, and it led to the following results. Both the demand and supply follow a similar pattern of fluctuating increases and decreases that are most noticeable during the lockdown months (March to May) where the total demand dropped by ≈ 150% in May 2020 relative to the average total demand in May between 2016 and 2019. The period following the end of the lockdown (June to August) illustrates how quickly the demand increased by ≈ 150% in June 2020 relative to the average total demand in June between 2016 and 2019. The beginning of 2020 and the end of 2020 have a relatively stable pattern that is similar to the average of the preceding years. In general, the lockdown measures in Sharjah affected the power demand across all five sectors (residential, commercial, industrial, government, and agricultural). However, some sectors were impacted more than others. On the one hand, the residential and government sectors witnessed an overall increase in demand, calculated at 5.44% and 7.38%, respectively. On the other hand, the commercial, industrial, and agricultural sectors witnessed an overall decrease in demand, calculated at 6.11%, 13.31%, and 39.87%, respectively.
The total variation in the power demand in Sharjah was 1.04% lower than the average of the preceding years (2016 to 2019). Consequently, these results imply that the electric power demand in Sharjah decreased in the commercial, industrial, and agricultural sectors, which are directly related to production and the economy. On the contrary, the residential and government sectors witnessed a higher power demand, justified by the lockdown policies that required remote working measures with a higher demand for air conditioning systems (residential) and increased use of service and medical facilities (government), such as police, COVID initiatives, and hospitals. Finally, this study compared the results achieved in Sharjah City with results reported worldwide, where the 6.85% reduction observed in May 2020 in Sharjah was within the range of 5–7% observed for countries such as Germany, UK, Spain, USA, and others. The findings outline that there is a major decline of energy consumption recorded in Italy, Canada, Turkey, and Spain, while there are smaller reductions in electricity consumption in states like Brazil and Kuwait. Sharjah, out of all the countries examined in the study, appears to have the least reduction in electricity consumption.
Author Contributions
Conceptualization, F.S., B.A.A.-N. and M.A.B.; methodology, B.A.A.-N. and W.E.-D.; validation, B.A.A.-N., W.E.-D. and M.A.B.; formal analysis, B.A.A.-N. and W.E.-D.; resources, M.A.B.; data curation, B.A.A.-N., W.E.-D. and M.A.B.; writing—original draft preparation, F.S.; writing—review and editing, B.A.A.-N., W.E.-D. and M.A.B.; visualization, F.S.; project administration, F.S. and M.A.B. All authors have read and agreed to the published version of the manuscript.
Funding
This research received no external funding.
Data Availability Statement
Not applicable.
Acknowledgments
The authors of this paper would like to acknowledge the Sharjah Electricity, Water, and Gas Authority (SEWA) and the American University of Sharjah for their support and contribution in completing this work. Special thanks to Othman Suroor Al Mas, Manager of Control and Monitoring Department and Masud Islam, Head of Control & Network Analysis Section at the Load Dispatch Center. Additionally, we acknowledge the SEWA billing section and SEWA GIS section for providing all data necessary to complete this study. The work in this paper was supported, in part, by the Open Access Program from the American University of Sharjah. This paper represents the opinions of the author(s) and does not mean to represent the position or opinions of the American University of Sharjah.
Conflicts of Interest
The authors declare no conflict of interest.
References
- Bulut, M. Analysis of The Covid-19 Impact on Electricity Consumption and Production. Sak. Univ. J. Comput. Inf. Sci. 2020, 3, 283–295. [Google Scholar]
- International Energy Agency (IEA). Global Energy Review; IEA: Paris, France, 2021; Available online: https://www.iea.org/reports/global-energy-review-2021 (accessed on 9 November 2020).
- Bahmanyar, A.; Estebsari, A.; Ernst, D. The impact of different COVID-19 containment measures on electricity consumption in Europe. Energy Res. Soc. Sci. 2020, 68, 101683. [Google Scholar] [CrossRef] [PubMed]
- Norouzi, N.; de Rubens, G.Z.; Choubanpishehzafar, S.; Enevoldsen, P. When pandemics impact economies and climate change: Exploring the impacts of COVID-19 on oil and electricity demand in China. Energy Res. Soc. Sci. 2020, 68, 101654. [Google Scholar] [CrossRef] [PubMed]
- Ghiani, E.; Galici, M.; Mureddu, M.; Pilo, F. Impact on electricity consumption and market pricing of energy and ancillary services during pandemic of COVID-19 in Italy. Energies 2020, 13, 3357. [Google Scholar] [CrossRef]
- Le Quéré, C.; Jackson, R.B.; Jones, M.W.; Smith, A.; Abernethy, S.; Andrew, R.M.; De-Gol, A.J.; Willis, D.R.; Shan, Y.; Canadell, J.G.; et al. Temporary reduction in daily global CO2 emissions during the COVID-19 forced confinement. Nat. Clim. Change 2020, 10, 647–653. [Google Scholar] [CrossRef]
- Jiang, P.; Van Fan, Y.; Klemeš, J. Impacts of COVID-19 on energy demand and consumption: Challenges, lessons and emerging opportunities. Appl. Energy 2021, 285, 116441. [Google Scholar] [CrossRef]
- Roser, M.; Ritchie, H.; Ortiz-Ospina, E.; Hasell, J. Coronavirus disease (COVID-19)–Statistics and research. Our World Data 2020, 4. Available online: https://ourworldindata.org/coronavirus (accessed on 1 July 2020).
- Squire Patton Boggs. COVID-19 Business Issues in the UAE. 2020. Available online: https://www.squirepattonboggs.com/-/media/files/insights/publications/2020/04/covid-19business-issues-in-the-uae/covid-19-business-issues-in-the-uae.pdf (accessed on 1 July 2020).
- Sharjah Population. 2022 (Demographics, Maps, Graphs). Available online: https://worldpopulationreview.com/world-cities/sharjah-population (accessed on 13 February 2022).
- Gokhan Yilmaz, A.; Shabib, A.G. Rainfall and Air Temperature Projections for Sharjah City, United Arab Emirates. Int. J. Water 2019, 13, 60–79. [Google Scholar] [CrossRef]
- Sharjah, United Arab Emirates Weather History|Weather Underground. Available online: https://www.wunderground.com/history/daily/ae/sharjah/OMSJ (accessed on 13 February 2022).
- Bulut, M. Effects of New Normal Life on Electricity Consumption in Covid-19 Process. Bilim Teknol. Mühendislik Araştırmaları Derg. 2020, 1, 4–6. [Google Scholar]
- Ceylan, Z. The impact of COVID-19 on the electricity demand: A case study for Turkey. Int. J. Energy Res. 2021, 45, 13022–13039. [Google Scholar] [CrossRef]
- Xu, T.; Gao, W.; Li, Y.; Qian, F. Impact of the COVID-19 pandemic on the reduction of electricity demand and the integration of renewable energy into the power grid. J. Renew. Sustain. Energy 2021, 13, 026304. [Google Scholar] [CrossRef]
- Abu-Rayash, A.; Dincer, I. Analysis of the electricity demand trends amidst the COVID-19 coronavirus pandemic. Energy Res. Soc. Sci. 2020, 68, 101682. [Google Scholar] [CrossRef]
- Santiago, I.; Moreno-Munoz, A.; Quintero-Jiménez, P.; Garcia-Torres, F.; Gonzalez-Redondo, M. Electricity demand during pandemic times: The case of the COVID-19 in Spain. Energy Policy 2021, 148, 111964. [Google Scholar] [CrossRef] [PubMed]
- Carvalho, M.; de Mello Delgado, D.B.; de Lima, K.M.; de Camargo Cancela, M.; dos Siqueira, C.A.; de Souza, D.L.B. Effects of the COVID-19 pandemic on the Brazilian electricity consumption patterns. Int. J. Energy Res. 2021, 45, 3358–3364. [Google Scholar] [CrossRef]
- Alhajeri, H.M.; Almutairi, A.; Alenezi, A.; Alshammari, F. Energy demand in the state of Kuwait during the covid-19 pandemic: Technical, economic, and environmental perspectives. Energies 2020, 13, 4370. [Google Scholar] [CrossRef]
- Qarnain, S.S.; Sattanathan, M.; Sankaranarayanan, B.; Ali, S.M. Analyzing energy consumption factors during coronavirus (COVID-19) pandemic outbreak: A case study of residential society. Energy Sources Part A Recover. Util. Environ. Eff. 2020, 1–20. [Google Scholar] [CrossRef]
- Aruga, K.; Islam, M.; Jannat, A. Effects of COVID-19 on Indian energy consumption. Sustainability 2020, 12, 5616. [Google Scholar] [CrossRef]
- Madurai Elavarasan, R.; Shafiullah, G.M.; Raju, K.; Mudgal, V.; Arif, M.T.; Jamal, T.; Subramanian, S.; Sriraja Balaguru, V.S.; Reddy, K.S.; Subramaniam, U. COVID-19: Impact analysis and recommendations for power sector operation. Appl. Energy 2020, 279, 115739. [Google Scholar] [CrossRef]
- Corpus-Mendoza, A.N.; Ruiz-Segoviano, H.S.; Rodríguez-Contreras, S.F.; Yañez-Dávila, D.; Hernández-Granados, A. Decrease of mobility, electricity demand, and NO2 emissions on COVID-19 times and their feedback on prevention measures. Sci. Total Environ. 2021, 760, 143382. [Google Scholar] [CrossRef]
- Joseph, B. Assessing the Long-Term Impacts of COVID-19 on Electricity Consumption; Duke University: Durham, NC, USA, 2021. [Google Scholar]
- Monzón-Chavarrías, M.; Guillén-Lambea, S.; García-Pérez, S.; Montealegre-Gracia, A.L.; Sierra-Pérez, J. Heating Energy Consumption and Environmental Implications Due to the Change in Daily Habits in Residential Buildings Derived from COVID-19 Crisis: The Case of Barcelona, Spain. Sustainability 2021, 13, 918. [Google Scholar] [CrossRef]
- Siciliano, B.; Dantas, G.; da Silva, C.M.; Arbilla, G. Increased ozone levels during the COVID-19 lockdown: Analysis for the city of Rio de Janeiro, Brazil. Sci. Total Environ. 2020, 737, 139765. [Google Scholar] [CrossRef] [PubMed]
- Gulf News UAE, Coronavirus: Sharjah Announces 10 per Cent Discount on Utility Bills for Three Months. Available online: https://gulfnews.com/uae/government/coronavirus-sharjah-announces-10-per-cent-discount-on-utility-bills-for-three-months-1.1585053668784 (accessed on 1 May 2020).
Figure 1.
Map of Sharjah City and the power line feeder locations assessed in this study.

Figure 2.
Electric power supply to Sharjah City using (a) average hourly demand between 2016 and 2019, (b) hourly demand in 2020, and (c) the hourly difference between 2020 and the average of previously reported years.
Figure 2.
Electric power supply to Sharjah City using (a) average hourly demand between 2016 and 2019, (b) hourly demand in 2020, and (c) the hourly difference between 2020 and the average of previously reported years.

Figure 3.
Sharjah City hourly temperature data presented using (a) average hourly temperature between 2016 and 2019, (b) hourly temperature in 2020, and (c) the hourly temperature difference between 2020 and the average of previously reported years.
Figure 3.
Sharjah City hourly temperature data presented using (a) average hourly temperature between 2016 and 2019, (b) hourly temperature in 2020, and (c) the hourly temperature difference between 2020 and the average of previously reported years.

Figure 4.
Monthly electric power demand in Sharjah City (a) between 2016 and 2019 and (b) an analysis of the demand in 2020 in comparison to the previously reported years.
Figure 4.
Monthly electric power demand in Sharjah City (a) between 2016 and 2019 and (b) an analysis of the demand in 2020 in comparison to the previously reported years.

Figure 5.
Electric power demand per sector in Sharjah City for 5 consecutive years between 2016 and 2020.
Figure 5.
Electric power demand per sector in Sharjah City for 5 consecutive years between 2016 and 2020.

Figure 6.
Monthly breakdown of the electric power demand per sector for 5 consecutive years from (a) a billable and (b) a percentage analysis relative to the total demand at a given month.
Figure 6.
Monthly breakdown of the electric power demand per sector for 5 consecutive years from (a) a billable and (b) a percentage analysis relative to the total demand at a given month.

Figure 7.
Electric power demand between 2016 and 2019 and an analysis of the demand in 2020 in comparison to the previously reported years for (a) residential and (b) commercial sectors.
Figure 7.
Electric power demand between 2016 and 2019 and an analysis of the demand in 2020 in comparison to the previously reported years for (a) residential and (b) commercial sectors.

Figure 8.
Electric power demand between 2016 and 2019 and an analysis of the demand in 2020 in comparison to the previously reported years for (a) industrial and (b) government sectors.
Figure 8.
Electric power demand between 2016 and 2019 and an analysis of the demand in 2020 in comparison to the previously reported years for (a) industrial and (b) government sectors.

Figure 9.
Electric power demand between 2016 and 2019 and an analysis of the demand in 2020 in comparison to the previously reported years for the agricultural sector.
Figure 9.
Electric power demand between 2016 and 2019 and an analysis of the demand in 2020 in comparison to the previously reported years for the agricultural sector.

Figure 10.
Monthly change of the electric power demand in 2020 from (a) a billable and (b) a percentage analysis relative to the average demand at a given month.
Figure 10.
Monthly change of the electric power demand in 2020 from (a) a billable and (b) a percentage analysis relative to the average demand at a given month.


Figure 11.
The change in electric power demand per sector in 2020 in comparison to the average of previously reported demand.
Figure 11.
The change in electric power demand per sector in 2020 in comparison to the average of previously reported demand.

Publisher’s Note: MDPI stays neutral with regard to jurisdictional claims in published maps and institutional affiliations. |
© 2022 by the authors. Licensee MDPI, Basel, Switzerland. This article is an open access article distributed under the terms and conditions of the Creative Commons Attribution (CC BY) license (https://creativecommons.org/licenses/by/4.0/).
Share and Cite
MDPI and ACS Style
Samara, F.; Abu-Nabah, B.A.; El-Damaty, W.; Bardan, M.A. Assessment of the Impact of the Human Coronavirus (COVID-19) Lockdown on the Energy Sector: A Case Study of Sharjah, UAE. Energies 2022, 15, 1496. https://doi.org/10.3390/en15041496
AMA Style
Samara F, Abu-Nabah BA, El-Damaty W, Bardan MA. Assessment of the Impact of the Human Coronavirus (COVID-19) Lockdown on the Energy Sector: A Case Study of Sharjah, UAE. Energies. 2022; 15(4):1496. https://doi.org/10.3390/en15041496
Chicago/Turabian StyleSamara, Fatin, Bassam A. Abu-Nabah, Waleed El-Damaty, and Mayyada Al Bardan. 2022. "Assessment of the Impact of the Human Coronavirus (COVID-19) Lockdown on the Energy Sector: A Case Study of Sharjah, UAE" Energies 15, no. 4: 1496. https://doi.org/10.3390/en15041496
Note that from the first issue of 2016, this journal uses article numbers instead of page numbers. See further details here.